
Monitoring and Predicting the Surface Generation and Surface Roughness in Ultraprecision Machining: A Critical Review


1
CSIR—Central Scientific Instruments Organisation, Chandigarh 160030, India
2
Academy of Scientific & Innovative Research (AcSIR), Ghaziabad 201002, India
3
College of Engineering, Design and Physical Sciences, Brunel University London, Uxbridge UB8 3PH, UK
*
Author to whom correspondence should be addressed.
Machines 2021, 9(12), 369; https://doi.org/10.3390/machines9120369
Submission received: 3 November 2021
/
Revised: 6 December 2021
/
Accepted: 14 December 2021
/
Published: 19 December 2021
(This article belongs to the Special Issue Advances in Tool Life Prediction in Machining)
Abstract
:The aim of manufacturing can be described as achieving the predefined high quality product in a short delivery time and at a competitive cost. However, it is unfortunately quite challenging and often difficult to ensure that certain quality characteristics of the products are met following the contemporary manufacturing paradigm, such as surface roughness, surface texture, and topographical requirements. Ultraprecision machining (UPM) requirements are quite common and essential for products and components with optical finishing, including larger and highly accurate mirrors, infrared optics, laser devices, varifocal lenses, and other freeform optics that can satisfy the technical specifications of precision optical components and devices without further post-polishing. Ultraprecision machining can provide high precision, complex components and devices with a nanometric level of surface finishing. Nevertheless, the process requires an in-depth and comprehensive understanding of the machining system, such as diamond turning with various input parameters, tool features that are able to alter the machining efficiency, the machine working environment and conditions, and even workpiece and tooling materials. The non-linear and complex nature of the UPM process poses a major challenge for the prediction of surface generation and finishing. Recent advances in Industry 4.0 and machine learning are providing an effective means for the optimization of process parameters, particularly through in-process monitoring and prediction while avoiding the conventional trial-and-error approach. This paper attempts to provide a comprehensive and critical review on state-of-the-art in-surfaces monitoring and prediction in UPM processes, as well as a discussion and exploration on the future research in the field through Artificial Intelligence (AI) and digital solutions for harnessing the practical UPM issues in the process, particularly in real-time. In the paper, the implementation and application perspectives are also presented, particularly focusing on future industrial-scale applications with the aid of advanced in-process monitoring and prediction models, algorithms, and digital-enabling technologies.
1. Introduction
With the rapid development of the manufacturing industry, global manufacturing is now moving in a new direction to improve productivity, decrease production time, and cope with the increasing demands for high quality engineering products due to the sudden effects in digital manufacturing worldwide, including Artificial Intelligence (AI), Internet Of Things (IoT), continuous liquid interface production, super robots, Big Data analysis, Computer Vision, and others [1]. Due to its rapid development, AI is gaining human-level performance. It provides a better outcome in areas such as the health monitoring of machines using Machine Learning (ML) [2]. Recent research suggests that the application of machine learning improves prediction performance and provides a digital solution that can enable the manufacturing sector to implement current and future technologies for automation and digitization [3]. In the age of global competitiveness, reducing the machining cost and time, thereby increasing productivity, is essential to achieve the desired quality of the product [4].
With the growing need for semiconductors, optics and aviation, ultraprecision and microfabrication facilities are becoming very important [5]. The components fabricated from these facilities have minor features, high tolerances, consume less power, and occupy very little space. The increasing demand for precision machining was addressed in the early 1980s by Taniguchi, thus giving a road map for the smallest achievable accuracy with the so-called Taniguchi curve [6]. The exponential improvements in machining accuracy are shown in Figure 1.
Significant improvements in the performance of various components could be achieved by incorporating greater precision. Corbett and colleagues emphasize the need for precision manufacturing from an economic and scientific perspective [7]. The precision machining process is distinct from conventional techniques such as drilling, milling, and turning. The requirements of the precision machining industry concerning faster, better, and cheaper products is not outmoded. Prediction and monitoring systems are very helpful in the controlling and characterization in the early stages. Identification of specific corrective actions during the machining operation is quite tricky. The cost of quality loss is becoming prohibitive for any manufacturing industry. Sensor-based motoring techniques will help enable quick compensation. From an engineering perspective, advancements in machine learning can improve quality monitoring, along with fault localization in the manufacturing cycle [8].
With the advancements in the manufacturing science and instrumentation domain, the definition of precision machining is continuously being updated. Ultraprecision machining (UPM) is essential to obtain the highest form accuracy and surface quality, which typically does not need additional finishing [9,10]. UPM is also called diamond turning, where a single crystal diamond tool is employed, and by which a nanometric surface finish can be obtained; the key components of a diamond turning system are shown in Figure 2. Since the latter half of the 1990s [11], there has been a large amount of research on UPM, also called diamond turning is typically a single point turning process, which emerged as a promising technology used for optics manufacturing, including high value components such as aluminum mirrors, aspheric optics, head-up display devices, and ophthalmic freeform surfaces [12]. UPM is used for machining different kinds of materials that are difficult to machine using conventional techniques and materials such as silicon, germanium, chalcogenides, and others. The proper selection of machining parameters is essential to achieve the nanometric surface finish.
In diamond turning, the material-removal mechanism is characterized by complex tribomechanical phenomena. Material strengthening due to size effect, the effect of edge radius, and inherent inhomogeneity of the microstructure of the specimen are very significant and can degrade the performance of the system [13]. The industries are upgrading their manufacturing cycle, shifting from detect-diagnosis-mitigate anomalies to predict-prognosis-prevention in many fields beyond manufacturing, including the supply chain, infrastructure, and lifeline systems. Diamond turning is very sensitive and most likely to react to changes in close proximity to the machines. Spindle vibration, the balancing of the machine, and tool-workpiece vibration change the dynamics of the machined component [14]. Stringent quality requirements pose a difficult challenge. Traditional ways of monitoring surface roughness cannot be directly used for UPM [15]. Optical components are affected by minute sub variation, and machining errors in UPM can cause cascading faults [16]. The need for the evaluation of the sensors and their applicability for various manufacturing processes are likely to be addressed [17]. Performance investigation on the prediction of surface roughness in UPM still remains a bottleneck due to non-linear and dynamic underlying process behavior [18].
With the improvements in data science and AI, pertinent process monitoring is being assured by preventive control methods. Predictive analytics has emerged as a cornerstone for “big data” analytics. Most real-world problems are not pure manufacturing or data science; it is always the nexus. A deep understanding of data science and manufacturing will help to alleviate irrecoverable defects. In the age of digitalization, UPM is yet to fully meet future development needs [19]. Nevertheless, a comprehensive review of the various monitoring and prediction techniques in diamond turning is still lagging. The primary purpose of this paper is to explore the sensor-based monitoring techniques and summarize the predictive capabilities of ML methods for quality assurance in a UPM process.
The remainder of the paper is structured as follows: an overview of the factors that affect the surface roughness in UPM are discussed in Section 2. The basic steps in monitoring, such as various types of sensors, signal processing techniques, and machine learning algorithms, are discussed in Section 3. A review of the literature in the real-time monitoring of surface roughness in diamond turning is illustrated in Section 4. The data-driven approach for the prediction of surface roughness is detailed in Section 5. Future perspectives for the industry and concluding remarks are summarized in Section 6 and Section 7, respectively.
2. Overview of Factors Influencing Surface Roughness
In the past two decades, several advancements have occurred regarding the investigation of optimized parameters to get a better surface finish.
These parameters include:
- Geometric factors (tool signature);
- Material factors (anisotropy, swelling, and crystallographic orientation);
- Process factors (feed rate, spindle speed, and depth of cut);
- Tool workpiece interactions are paramount in UPM, as they directly influence the output functionality and cutting regime.
Surface roughness (Ra) is the microscopic observation of any surface and is a surface texture measure [20]. The better surface finish will assure better functionality, wear resistance, corrosion resistance, and fatigue resistance under dynamic conditions that attributes light reflectivity in optics and heat transmission [21].
2.1. Geometric Factors
In UPM, unlike traditional machining, the depth of the cut is of the same order of magnitude as the cutting-edge radius, and this directly affects the surface finish. As the uncut chip thickness is smaller than the edge radii while machining, the effective rake angle becomes negative, even though the nominal rake angle is positive. The point at which the material separation occurs is known as stagnation or neutral point (P); the schematic diagram of the tool–workpiece contact zone is shown in Figure 3. The material above the neutral point flows upwards with a shearing effect. The material below the neutral point flows beneath the edge, causing plowing effects. The effect of plowing is very significant at lower depths, and this effect will deteriorate the surface roughness. The stagnation or neutral point is influenced by friction, which influences the temperature between the tool and workpiece [22]. Zhou and colleagues suggested that the nose radius has a considerable effect on tool wear, which will influence the surface finish [23]. The earlier research by Yan and colleagues found that a tool with a bigger nose radius gives a better surface finish in comparison to a smaller radius [24], and stated that the effects of microchipping and tool wear are significant in UPM.
2.2. Material Factors
During machining, when the depth of the cut is very small, the material exhibits high strength. Though the size effect in UPM has been investigated before, the relevant mechanism is not explained clearly. Factors such as swelling, anisotropy, fracture toughness, molecular mobility, and transition temperature need to be taken into account, as these characteristics change UPM drastically [25,26]. Lee and colleagues used Taylor’s theory of plasticity to predict the variations in cutting forces, thereby finding its correlation with surface roughness [27]. He proposed that the crystallographic orientation of the workpiece material significantly affected the surface roughness in copper. Kong and colleagues presented a phenomenological model to explain the characteristics, noting that elastic recovery impacts surface roughness at lower depth of cuts [28]. Material properties, such as the degree of crystallization, tensile strength, and molecular weight, are also effective properties that may determine the machining process’ accuracy level.
2.3. Process Factors
2.3.1. Spindle Speed (SS)
During diamond turning, constant spindle speed is suggested to avoid the effect of inertial force on the machined surfaces. SS will enable the removal of material by providing a relative motion between the tool and workpiece. It helps to maintain productivity, and also helps to achieve the desired shape and surface finish. Increasing the spindle speed increases the tool wear significantly, affecting the surface finish [29,30].
There are a few controversies in the literature regarding the selection of spindle speed in UPM. Smith and colleagues stated that with an increase in cutting speed, better surface quality is expected due to thermal softening [15]. In contrast, Gubbels and colleagues argued that increasing the cutting speed generates heat during the machining. This heat transfer will degrade the surface finish, and thus, increasing the cutting speed is ineffective [31]. The optimal spindle speed needs to be determined, and this will define the material removal rate.
2.3.2. Feed Rate (f)
Feed rate is one of the most critical requirements of diamond turning to deliver the components with a nanometric surface finish. Surface roughness is defined as the square of the feed (f) to nose radius (r) for any single-point machining operation [32].
From Equation (1), it is clear that the feed rate is directly influenced by the surface finish. However, many researchers have modified this equation. The feed rate also affects factors such as tool wear, the magnitude of cutting forces, vibration, unit removal of material, cutting mechanism, and cycle time. As a result, proper caution is required while selecting the tool feed rate [33]. Thus, an adequate selection feed rate will define the surface quality.
2.3.3. Depth of Cut (DOC)
Unlike feed, the influence of the depth of cut on the surface finish is minimal. The proportion of the chip length corresponding to nano cutting will remains same and hence surface finish value remains unaffected. DOC influences material removal rate, and this can also cause cracks while machining brittle materials. This is due to the influence of cutting forces; these cracks can be eliminated by post-polishing [34].
Apart from these machining factors, there are other factors that influence the surface finish [35]. Researchers considered the factors such as tool shank overhang [36], clamping methods [37], and selection cutting fluid [38] that also need to be taken care of. The stiffness of the tool is affected by the tool shank overhang, which might harm the cutting edge. The clamping forces are responsible for undesirable strain on the workpiece and its removal. The coolant should be selected in such a way that it will take away maximum heat (if a lot of heat is transferred to the workpiece, it will likely cause thermal damage). The chips generated during the machining are low in weight (powder form in ductile materials), and it has a high propensity for sticking to finished surfaces. To meet the increasing demand for a better surface finish, it is essential to find the optimal parameters.
2.4. Tool Workpiece Interactions
2.4.1. Tool Wear
Tool wear analysis is a major problem in UPM because it has an impact on machining ability. Despite the fact that diamond is the hardest material, tool wear is inevitable during machining. Tool wear has a detrimental impact on product quality as well as the tool’s cost. Due to the increase in temperature during machining, the coefficient of friction can no longer be considered constant [39]. Diamond tool wear (DTW) is determined by the nature of the diamond tool and workpiece material. The detection of the tool deterioration during machining is quite difficult. The change in edge radius (due to tool wear) will lead to variations in the critical chip thickness ratio. The severity of the tool wear will determine the surface quality (unable to attain nanometric surface roughness with tool wear) [40,41]. DTW is classified into three types: mechanical wear, chemical wear, and physical wear. Various tool wear mechanisms in diamond turning are summarized in Table 1.
2.4.2. Vibration
Vibration has always been an element that has had an impact on the machining process. This is influenced by the type of machine, tool, and workpiece interactions. During machining, there are two types of vibrations that occur: force vibrations and self-excited vibrations. The misalignment of the machine and subsequent balance problems will cause forced vibration to develop, where the chip-removal process and machine tool structure cause self-excited vibrations [43,44]. In diamond turning, the material-induced vibrations, such as swelling and recovery, are responsible for the surface roughness variation [45]. In general, the surfaces in UPM are subjected to a combination of vibration. Figure 4, shows induced vibrations along the feed direction (tool feed), across the feed direction (infeed direction), and in a vertical direction (cutting direction).
When the tool comes into contact with the workpiece, it begins oscillating in the infeed direction, along with simultaneous movement in the feed direction. During the cutting process, the tool detaches from the workpiece for a minimal distance; this phenomenon is called “tool jumping”. This phenomenon results in certain uncut portions, which degrades the substrate [47,48]. Many studies have attempted to build correlations in order to discover complicated non-linear relationships for monitoring surface roughness [49].
2.4.3. Cutting Temperature
The temperature will determine the tool life and surface quality, as the rise in temperature may result in tool wear and ultimately change the deformation characteristics, influencing the surface finish [50]. The temperature in the deformation zone is a key factor influencing the friction. The practical regional temperature in UPM cannot be measured accurately. Earlier studies relied on platinum-based temperature sensing for monitoring.
As a result, comprehending insurmountable complexity, which is suggestive of non-linear chaotic dynamics, is difficult. Therefore, it is clear that UPM is exceedingly sensitive to minute instabilities. It is worth noting that little changes in process conditions can manifest in the output. Some of the insignificant factors, such as radiation from the human body of the operator, vibration from adjacent machinery, perturbation from the closing and opening of machine doors, show their ill effects on the surface. The nascent process drift produces irrevocable defects in UPM. Thus, monitoring these factors is incredibly important. If abnormalities are not discovered early on, the substrate will be wasted. Through numerous investigations, researchers attempted to address the quality and cutting performance concerns through in-process measurement and monitoring of the cutting temperature by using improved smart cutting tools [51,52]. Data fusion techniques from different signals extracted from the sensors, along with machine learning algorithms, have shown promising results for the future. Incipient anomaly detection emerged as a pertinent engineering problem that has been studied. Machine learning algorithms enable machines to learn, improve, and execute tasks without having to be explicitly programmed. These improvements in industrial analytics, which are enabled by machine learning, will aid in the reduction of operating expenses.
3. Overview of Techniques Used for the Monitoring of Surface Roughness
Several advances in surface roughness monitoring for the diamond turning process have occurred during the last decade. The primary purpose of this section is to address the critical issue of surface roughness monitoring in this process. Real-time monitoring in UPM offers significant problems in capturing the transient and non-linear dynamics. The following are the primary reasons behind UPM’s limited research:
- Accessibility of the signal source is difficult;
- Requirement of higher sampling frequency;
- Signal features are spread in a wide spectrum with weaker magnitude;
- The signal-to-noise ratio is low;
- The difficulty of proximity sensing.
As a result, experts suggested three fundamental processes for monitoring surface roughness: signal and data fusion, feature extraction using signal processing, and the creation of a decision-making system, as illustrated in Figure 5. To provide online diagnosis and increase the quality of the result, a systematic methodology should be created.
3.1. Sensor Signal Acquisition and Data Fusion
Sensors are basic monitoring systems in manufacturing. With the evolving markets, sensors have become an indispensable part of machine tools. Depending on the measurement type, sensors are classified into two types: direct and indirect. During machining, sensors such as ultrasonic, video cameras, and laser systems are employed for direct measurement.
All of these sensors are incompatible with functioning in harsh environments, which makes industrial deployment difficult. In the indirect type, recorded signals obtained from various sensors, such as acoustic emission, accelerometer, dynamometer, and so on, are analyzed. The relevant information hidden in these signals are used for understanding disruptions to the different types of sensors required as per the level of precision, as shown in Figure 6. Several attempts were made to correlate these variables with surface quality using data fusion techniques. Nonetheless, the main question is which type of sensor is best for industrial applications. These practical problems are investigated by various researchers. A quick explanation of the types of sensors utilized in UPM is covered in this section.
3.1.1. Acoustic Emission (AE)
Acoustic Emission (AE) is the most popular sensor equipped for surface roughness monitoring in diamond turning. AE signals are the transient elastic waves generated from the rapid release of energy from one or more sources within the material [53]. These elastic waves contain direct information from the cutting zones in machining. Therefore, acoustic emission can detect many phenomena, including friction between the tool and workpiece, residual stresses, plastic deformation, friction on the rake face, and chip breakage. The proximity of the source of acoustic emission can alter the signal, being that the closer it is, the greater the attenuation. In precision machining, AE sensors are ideally suited for applications where subtle changes occur, such as surface finish and subsurface damage.
Figure 6.
Sensor application vs level of precision [54].
Figure 6.
Sensor application vs level of precision [54].

3.1.2. Dynamometer
A specific amount of force is required by the tool to remove excess material. Despite the fact that the cutting force (0–1 N) in diamond turning is relatively small, it has a considerable impact on the machined surface [55]. Force signals serve as source of data for tracking a wide range of non-linearities that occur during machining [52]. Parameters such as surface finish, tool wear and breakage, thermal analysis, and others show good correlations with force signals. The dynamometer has a significant advantage over the piezoelectric transducer in that it can record both the static and dynamic force components.
3.1.3. Accelerometer
Vibration sensors are frequently used to monitor a wide range of mechanical components, such as bearings, motors, and turbines. Vibrations generated by the internal elements of the machine contain the direct information about the process [56]. These signals that have been obtained during machining bear dynamic information sensitive to the machined surfaces [57]. Wang and colleagues discovered a correlation between the workpiece surface and tool-tip vibrations, and their findings show that the tool-tip model reveals dominating variables in ultraprecision machining [58]. In UPM, there has been a lot of research done on the effects of infeed tool vibration on surface generation. In the case of monitoring the incipient surface roughness, only little literature is reported.
Nonetheless, a variety of microscale sensors were developed for monitoring. Micro-thermo sensors are the most popular, and can detect the temperature change near the cutting edge. All these investigations are carried out in order to determine the relationship between the output signal and surface abnormalities. UPM is affected by extraneous factors, so proper care should be taken in the case of noise; noise from any source can corrupt the output signal. Thus, the acquisition of the signal is critical to understand the incipient variations on surface finish. For comprehending the nascent variation, further plans are decided based on the confidence that a proper signal is acquired. One of the most viable means to achieve an optimal surface finish is by the integration of sensors through data fusion.
3.2. Signal Processing Methods Used in Monitoring
Signals captured during the machining process cannot be used immediately for further processing since they are lower in magnitude and require signal conditioning. Later, utilizing data acquisition equipment, the signals are converted from analog to digital. Analyzing these signals is vitally important; the selection of appropriate signal processing methods allows for the retrieval of most of the information [59]. The basic signal processing techniques are time domain, frequency domain, and time–frequency domain.
3.2.1. Time Domain Analysis
The time series analysis remains challenging, mainly due to the diverse combination of non-stationary, non-linear dynamic behavior. There are several advancements in time domain analysis for capturing transient events. The most widely used technique in time domain are Time direct analysis (TDA), and singular spectrum analysis (SSA). Time direct analysis is well known due to its simplicity and low computational cost. In time direct analysis (TDA), a signal is analyzed directly without any transformation or mathematical preprocessing. Statistical features (mean, variance, standard deviation, kurtosis, the entropy of Shannon, etc.,) and non-statistical features (energy contained in the signal, peak to peak amplitude, etc.,) are directly obtained from the original signal. Working with the temporal signal does not allow for the extraction of relevant information; often, the useful information is buried under strong background noise.
Singular spectrum analysis (SSA) is a non-parametric technique that transforms the original signal into an independent time series called principal components. Golyandina and colleagues mathematically describe the SSA technique by two main phases: signal decomposition and reconstruction [60]. First, the temporal signal is decomposed into a series of signals, and next, in the later stage, it is reconstructed into an additive time series. While employing SSA, window length became very important. If the window length is too long, more principal components are available for extensive examination, but this also makes identifying the trend more difficult. If the window length is small, principal components are small and produce poor decomposition. Once this stage is applied, the resultant trajectory matrix is decomposed into an elementary matrix using a singular value decomposition method based on eigenvalues and eigenvectors. The specific weights of eigenvalues are represented in decreasing order known as a singular spectrum. The higher the eigenvalue, the better the trend; however, it does not mean that lower eigenvalues provide no information. In the later phase of SSA, the reconstruction of elementary matrices is performed in groups with a meaningful interpretation.
3.2.2. Frequency Domain
For the signals encountered in real-time, the time domain analysis is not sufficient to extract the relevant information promptly. It is necessary to transform it to the frequency domain. Fourier transformations have been used extensively in conjunction with filtering techniques [61]. The time domain and frequency of vibration signals obtained from UPM are shown in Figure 7. The effectiveness of the Fourier transformation depends on the signal containing different frequency bands. If the feature components are spread over a wide spectrum, it is tricky to use Fourier transformation. Fourier transformation reveals the frequency components of time series by transforming the time domain signal to the frequency domain. However, this analysis does not reveal how the signal frequency content varies with time; in addition, this technique is not suitable for analyzing non-stationary signals.
Numerous studies have been published to date using an array of signal processing. Azourie and Guillot have monitored the surface finish using sensor fusion along with cutting parameters in the time domain [62]. The results suggested the optimal conditions coined the significance of the radial component of cutting force. Hessainia and colleagues analyzed the radial and tangential vibrations generated in the tool using the regression models, obtaining 99% correlations for Ra and 96.4% for Rt (total height of roughness profile) [63].
There are similar studies reported by Risbood and colleagues [64] and Kirby and Chen [65], with the use of vibrational signals in the time domain. Plaza and Lopnez have employed SSA to monitor surface finish in diamond turning [66], whereas Plaza and colleagues monitored the signals in the time domain and frequency domain, using predictive regression models with mean relative errors of 10% [67].
3.2.3. Time–Frequency Domain
Time–frequency techniques have been subjected to extensive research over the past decade for non-stationary signal analysis to understand the temporal location of the frequency component, which is otherwise impossible with the frequency domain. Typical representatives include the short-time Fourier transformation (STFT) and wavelet transformation (WT). Gabor developed STFT to address the drawback of the Fourier transformation ‘time localization’ problem. A siding window is implemented to the Fourier transformation so that local phenomena can be located. The problem with this transformation is once the window length is selected, it remains fixed [68].
To overcome this problem, WT has been developed for non-stationary signals. WT uses a short window at high frequency and a long window at low frequency. Thus, wavelet transformation measures the similarity between the signal being analyzed and the base wavelet. WT uses the variation in the scales and shift in extracting the hidden features, by detail and approximation coefficient. The original signal, along with detail and approximation coefficients (db4 wavelet) applied to the vibrational signal obtained from UPM, are shown in see Figure 8. The adaptive capabilities of the WT provide powerful mathematical tools for the analysis of non-stationary signals. The multiresolution and adaptive capacities of WT are an enabling tool for advancing the science base of signal processing in manufacturing [69].
Plaza and colleagues used wavelet packet transform (WPT) for monitoring surface roughness in CNC turning [70]. These initial data show promising results with the proper selection of the mother wavelet. Feature extraction is highly correlated, and only one sensor (cutting force) can detect the anomalies in the cutting process. The advancement in signal processing will bring more robustness and reliability for the real-time monitoring of surface roughness. The overview of signal processing methods used for surface roughness monitoring are presented in Table 2.
3.3. Decision-Making Support Systems and Paradigms
Manufacturing has seen a huge surge of data from a variety of formats with the advancements in AI and ML. Machine learning is defined as an algorithm or a program capable of learning with a minimum or small support data. They are classified into three main categories based on the type of input. The first, and most widely used, is supervised learning, in which the set of inputs and outputs are well known and where the training of the systems is done through the known outcomes. Secondly, in un-supervised learning, only the responses are known by which inferences are drawn from datasets consisting of input data with no labels using cluster analysis. Finally, reinforcement learning, the process of learning actions and their consequences with environment interactions.
There are different methods with the emergence of a new generation in machine learning paradigms [75]. These methods include Bayesian network, support vector machine (SVM), artificial neural networks (ANN) [76], decision trees (DT) [77], random forest (RF) [78], naïve bayes, K-nearest neighbors (K-NN) [71], and logistic regression [79]. All of these algorithms are readily available and their implementation is discussed in further sections. The basic problem-solving process utilizing machine learning with various steps is shown in Figure 9.
It is necessary to evaluate the data in order to get the approximate results on unseen data; without this, the model is of no use. In order to build and develop a generalized model, different metrics are required to optimize and fine-tune the performance to obtain better results. The accuracies of these models are analyzed using the following.
R-Squared (R2): R2, or the coefficient of determination, is a statistical measure which measures the proportion of variance in the target output that is predicted from input features. Usually, the determination coefficient (R2) values differ between 0 and 1. R2 values near to 0 indicate that the model is not capable of predicting the target, where values near to 1 indicate that the model predicted without error. This is computed using Equation (2).
Here, (N) is the number of samples, (m) and (o) are the target value and model value, respectively
Root Mean Square Error (RMSE)-eR: RSME is computed as the square root of the average of the squared difference between each predicted value and the true value. Similar to mean absolute percent error, this is also useful for data analysis. RSME is computed using Equation (3).
Mean Absolute Percent Error (MAPE)-eM: It is used to measure the average of the absolute difference between each true value and the prediction. MAPE corresponds to an absolute measure of fit and is computed using Equation (4).
In the process of deciding about the anomalies on surface roughness, it is important to separate the productive information; this requires predictive capabilities. Machine learning algorithms can capture the non-linear dynamics effectively. This will be helpful in high-level feature evaluation. In a broad vista, it is evident that sensor fusion, with efficient signal processing features along with machine learning, will be an effective tool for monitoring surface roughness.
4. Monitoring Surface Generation and Surface Roughness in Ultraprecision Machining
Real-time monitoring of surface roughness is required to capture the surface anomalies. However, given the complexity in ultraprecision machining, a universal strategy cannot be utilized for real-time monitoring; the setup for real-time monitoring is shown in Figure 10.
Earlier research from Dornfled and colleagues suggested that data from one sensor may not be sufficient for monitoring in complex non-linear processes like diamond turning [81]. Further, Rao and colleagues tried to elucidate incipient surface finish variation with sensor data. The time domain is used where the dynamics are captured from recurrent predictor neural networks (RPNN) [82]. This work has emerged as a new research domain with huge demand in the industry. In this direction, researchers have attempted various techniques for real-time monitoring, which are reviewed in Table 3.
These studies, where sensor data provided a clear understanding of the influencing parameters on surface finish, are also helpful for finding the process drifts during the machining. There are few drawbacks to this parametric data fusion. Few of these drawbacks is addressed using non-parametric Bayesian clusters by O. F. Beyca and colleagues using heterogeneous sensors with two-phase sensor data fusion techniques [90]. In the first phase (offline), clustering the sensor data using Bayesian non-parametric Dirichlet process (DP) modelling was done. The second phase (real-time), will give Gaussian mixture multimodal probability density functions (PDFs). Once PDFs are obtained, the process conditions are estimated based on which real-time decision is taken for newly arriving sensor data. Classification accuracy is around 90%. This process not only classifies the fault, but provides necessary corrective actions to the machine operator. This approach has addressed the monitoring problems and advances to the status quo in UPM.
The most important aspect of any monitoring is to detect the anomalies and provide the best solution for industries. The fusing of multiple sensors will not only increase the cost of monitoring, but also most likely provide conflicting information as the signals can provide redundant information. UPM aims to make products and devices on demand. There is a need for a simple way to monitor surface roughness, which will reduce defects and costs by quickly mastering the optimization. It is quite evident that complete automation for surface roughness assessment in the UPM process is characterized by high reliability, intelligence, and reconfigurability is possible by advancement in all basic monitoring steps.
5. Application of Machine Learning Methods for the Prediction of Surface Roughness
The recent advances in data-driven models of the physical processes have proven to be an alternative approach that has great potential for predicting machining parameters. This technique has emerged as a powerful tool for predicting with high precision and accuracy and increased robustness. The basic idea in the data-driven approach is to make the machines skillful enough to understand the pattern. With the help of machine learning, the direct adoption of sensor signal patterns through the prescribed model is possible. These approaches are highly motivated by understanding the correlations and relations among the crucial parameters that can predict the surface roughness, but it is always difficult to rely on such assumptions. Many advanced cutting tools and methods are developed, but deterministic machining is still in its infancy due to the assumptions made during machining. Keeping an eye on every single parameter in such a nascent process is quite challenging. It requires a great depth of knowledge and understanding of the behavior of the physical system; it is nearly next to impossible as UPM encounters chaotic dynamics. Researchers have developed a machine learning model to predict surface quality in diamond turning as a function of machining parameters and features from signals obtained. This will help to optimize the process in reducing the cost. This section focuses on different cases of predicting surface roughness using machine learning, examples of which are listed in Table 4.
This section will help you to understand how to apply ML techniques in UPM. It is worth noting that there is no visible advantage of using SVR or ANNs on fairly small data sets, and they will take a comparatively longer time than regression. With the increase in data size, ANNs are likely to dominate in relative accuracy. Decision trees (DT) have lower accuracy but, considering factors such as ease of implementation and computational time, this technique can be used. DT can be considered for future work in the field for predicting surface roughness by integrating with ANNs to obtain the best results in a minimum of time. SVM, due to its adaptability and diversity, is used in the detection of tool wear, tool/machine condition monitoring, and fault diagnosis. It has also emerged as a powerful tool for predicting surface roughness in manufacturing. All these machine learning techniques have their own advantages and disadvantages; it depends on the type of data generated. The applications owing to manufacturing can be resolved with the flexibility and versatility of ML algorithms.
Further, based on the preliminary research and early study data, it has been shown that feed direction vibration signals are highly correlated with surface roughness after federate, followed by depth of cut and spindle speed. Infeed direction vibrations are predominant in the beginning, and are reduced toward the center. Proper care should be taken in the case of vibration, and even if you use ideal parameters employed under the vibration conditions, the output created will change significantly. The vibration during machining should be kept as low as possible by controlling disturbances. Furthermore, this research has yielded several insights in prediction model development for UPM, and suggests improvements in the selection of turning process parameters for various materials. The incorporation of sensor data into surface classification will bring more robustness and improve the process’ reliability. Thus, the data collected is utilized to track anomalies and is most likely useful in determining the optimal process parameters.
6. Future Implementation and Application Perspectives
Several measures have been initiated in recent years to revamp the manufacturing sector so that it can handle massive data. However, it faces several difficulties, including the growth of multimodal data, the high dimensionality of feature space, and multi-collinearity among data measurements. AI-assisted, real-time monitoring in production will minimize rework and boost efficiency. Multinational corporations are now looking for an “in house Artificial Intelligence” strategy, where companies are developing and utilizing machine learning tools in manufacturing. A combination of multi-sensor, with a hybrid machining system and machine learning, will improve the customer trust by providing the high-level solutions to meet the customer’s application requirement. The usage of integrated sensors, AI techniques, smart machining, and digital twin will enhance reliability and robustness, and provide a convenient means of detecting potential troubles in a ‘continuous improvement’ manner [106], which is particularly important for future industrial scale ultraprecision production. However, the integration of these techniques with conventional machines is highly cumbersome. Furthermore, Lei and colleagues worked on the incorporation of digital-twin-based smart design in UPM [107], and also stressed the need for process monitoring, process controlling, and vibrational control. Some promising work by Gou and colleagues in aerostatic bearing slideways in UPM using digital twin.This will likely lead to continuous improvement in predictability, producibility, and productivity [108].
Although several advancements have taken place toward capturing non-linear, transient events using time series data, there are numerous studies that have used the techniques including time direct analysis (TDA), singular spectrum analysis (SSA), fast Fourier transformation (FFT), short-time Fourier Transformation (STFT), and wavelet transformation (WT), and all of these methods are used to obtain the features from the signals and make the decision in monitoring. Still, it is very hard to find an efficacious predictive technique for obtaining high-level precision.
For online surface roughness monitoring, the majority of investigations used the offline static and inaccurate machining parameters (spindle speed, feed rate, and depth of cut). All of these static features are incapable of detecting the abnormalities that arise during the machining. These imprecise features make the online decision-making process quite difficult. Initial work by Plaza and colleagues has shown some recent developments in the area of wavelet packet transformation, and obtained the best results for estimating the surface roughness [70,74]. Analysis of the sensor signal using the time–frequency domain requires the proper selection of a mother wavelet and appropriate level of decomposition. Manual analysis of the resulting decomposition is necessary to find out the informative wavelet packet. The selection of such features and the level of decomposition is a problem; such problems significantly hinder WT efficiency.
Deep learning (DL), recent advancements in the area of machine learning, has displayed outstanding performance in a variety of applications. DL enables the automated data processing that leads to the non-linear and complex abstraction of features through a cascade of multiple layers (network of layers). With automatic learning features and high-volume modelling skills, DL has proven its ability to be successful in the area of big data. This provides powerful analytics and significant potential. It provides decision-makers new possibilities to unlock unprecedented data into actionable and insightful information. DL, widely regarded as the future of modern-day manufacturing, addresses bottlenecks in areas such as intelligent fault diagnosis, tool condition monitoring, and bearing fault diagnosis. There are several types of DL architectures discussed by various researchers in the area of manufacturing [109]. The most widely used architectures in DL includes convolutional neural networks [110], auto encoder [111], and recurrent neural network [112]; all these DL techniques have the advantage of automatic feature learning. The performance of these models depends on input data. The recent work on ultraprecision for tool condition monitoring by Shi and colleagues focusses on the tool condition monitoring of UPM, and indicated that features derived from a signal in UPM might have the limitation of being scares, which do not fulfil the criteria [113]. They developed a new DL model with multiple features to address the problem in UPM that has tight cutting tolerance. They also implemented a ‘parallel training model’, with three kinds of feature spaces; time domain (TD), frequency domain (FD), and wavelet domain (WD). The features obtained from these signals are fused with the help of parallel learning. Parallel learning is illustrated in Figure 11.
With the aid of multiple sparse auto-encoders (SAEs), they built a stacked sparse auto-encoder network (SSAE).This encoder–decoder network can extract profound, and more implicit, features [114]. The basic idea behind the parallel training based on SSAEs is the distinct feature space, i.e., TD, FD, WD will have more implicit information than a single feature space. Parallel training was introduced in UPM [113] to learn the low-layer features where a fusion model was employed to learn deep features.
Further, Lin W.-J. and colleagues used specific deep learning techniques for surface roughness prediction [115]. Where the LSTM model shows superior performance at higher Ra value, the 1-D CNN shows better-extracting features in lower Ra ranges. Mohring and colleagues collected milling vibrational signals and used DL models such as CNN [116] to determine surface roughness. One of the most appealing features of DL is that it is vulnerable to minor changes in input data. The technique of incorporating excellence with enhancing sustainability development in UPM is just beginning [117]. Abu-mahfouz and colleagues have evaluated unsupervised clustering techniques to predict surface roughness using vibrational signals [118]. All the frameworks suggested in these papers are to enhance efficiency. The modification of these algorithms to the particular application is not a trivial task. Finally, proper care needs to be taken in case of external malicious attacks, such as hacking. All of these attacks can have the potential to disrupt the entire production process; therefore, defenses must be implemented based on a thorough study into cyber–physical systems.
7. Conclusions
This paper aims to provide a comprehensive critical review and exploration of studies on approaches to the quantitative assessment and prediction of surface roughness generation in ultraprecision machining with a focus on diamond turning and applications. The outcomes from the paper are as follows:
- Extending the state-of-art sensor-based monitoring by fusing powerful signal processing with machine learning. Most surface quality monitoring in UPM processes has been primarily pursued as post-process, which this compromises yield;
- UPM signals contain a significant amount of redundant information which is highly correlated. Feed direction vibration contributes most to surface roughness variations. Further, analyzing non-stationary and complex signal patterns of vibration sensors helps to reduce computation and monitoring cost;
- The surface characteristic detection using the neural networks approach can significantly outperform the conventional statistical change detection methods. In prediction, DeeperANNs can give overall good performance compared to other machine learning techniques;
- The amalgamation of sensor signal features obtained from advanced signal processing with the help of machine learning can be effectively used to identify process anomalies in a timely manner, and therefore minimize expensive yield losses.
Industry needs to adapt to operating with enormous volumes of data in the coming years in the context of Industry 4.0 and smart ultraprecision manufacturing. This review attempts to summarize predictive analysis on surface roughness generation in a forward-looking, ultraprecision production environment, particularly for ultraprecision diamond turning operations. The efficiency and productivity of precision manufacturing industries can be substantially enhanced with a shift towards digital manufacturing using machine learning processes, eventually achieving the manufacturing as a service. It is challenging to make a recommendation for the best monitoring approach for resolving real-time problems in precision engineering manufacturing environment. The ultimate goal should not be achieving the overall prediction accuracy; instead, other aspects such as computing speed, ease of implementation, dynamics of the machining system, and uncertainty-tolerant features, among others, should be investigated. Technological advances in signal processing and in-process sensoring designed with different kinds of feature spaces, including having parallel learning with deep learning abilities, can outperform all traditional ML models. DL techniques, such as encoder–decoder, RNN, and CNN, further combined with 5G communications, can extract the automatic features and provide additional details about the machined surface in real time. The hybrid techniques evolving in DL will replace and/or further enhance existing standard models, which can ultimately achieve self-optimization and adaptation for future ultraprecision machining and ultraprecision production on a truly industrial scale.
Author Contributions
K.M., S.T. and N.K. contributed equally to the conceptualization and methodology. K.M. wrote the original draft presentation; S.T. and N.K. made suggestions in drafting; K.C. provided writing review and editing. All authors have read and agreed to the published version of the manuscript.
Funding
This research received no external funding.
Institutional Review Board Statement
Not applicable.
Informed Consent Statement
Not applicable.
Data Availability Statement
Not applicable.
Acknowledgments
We acknowledge the Director of CSIR-CSIO for his support and encouragement. The authors would like to express their sincere thanks to Vinod Karar and Harry Garg for guidance and motivation.
Conflicts of Interest
The authors declare no conflict of interest.
References
- Lee, J.; Kao, H.-A.; Yang, S. Service Innovation and Smart Analytics for Industry 4.0 and Big Data Environment. Procedia CIRP 2014, 16, 3–8. [Google Scholar] [CrossRef] [Green Version]
- Khalil, R.A.; Saeed, N.; Masood, M.; Fard, Y.M.; Alouini, M.-S.; Al-Naffouri, T.Y. Deep Learning in the Industrial Internet of Things: Potentials, Challenges, and Emerging Applications. IEEE Internet Things J. 2021, 8, 11016–11040. [Google Scholar] [CrossRef]
- Mittal, S.; Khan, M.A.; Romero, D.; Wuest, T. Smart manufacturing: Characteristics, technologies and enabling factors. J. Proc. Inst. Mech. Eng. Part B J. Eng. Manuf. 2019, 233, 1342–1361. [Google Scholar] [CrossRef]
- Aggour, K.S.; Gupta, V.; Ruscitto, D.; Ajdelsztajn, L.; Bian, X.; Brosnan, K.H.; Kumar, N.C.; Dheeradhada, V.; Hanlon, T.; Iyer, N.; et al. Artificial intelligence/machine learning in manufacturing and inspection: A GE perspective. MRS Bull. 2019, 44, 545–558. [Google Scholar] [CrossRef]
- Huo, D.; Cheng, K. Micro Cutting Mechanics. In Micro-Cutting: Fundamentals and Applications; John Wiley & Sons: Hoboken, NJ, USA, 2013; pp. 19–44. [Google Scholar]
- Taniguchi, N. Current Status in, and Future Trends of, Ultraprecision Machining and Ultrafine Materials Processing. CIRP Ann. 1983, 32, 573–582. [Google Scholar] [CrossRef]
- Corbett, J.; McKeown, P.; Peggs, G.; Whatmore, R. Nanotechnology: International Developments and Emerging Products. CIRP Ann. 2000, 49, 523–545. [Google Scholar] [CrossRef]
- Khaghani, A.; Cheng, K. Investigation of a dynamics-oriented engineering approach to ultraprecision machining of freeform surfaces and its implementation perspectives. Nanotechnol. Precis. Eng. 2021, 4, 043002. [Google Scholar] [CrossRef]
- Ikawa, N.; Donaldson, R.; Komanduri, R.; König, W.; McKeown, P.; Moriwaki, T.; Stowers, I. Ultraprecision metal cutting—The past, the present and the future. CIRP Ann. 1991, 40, 587–594. [Google Scholar] [CrossRef]
- Stowers, I.F.; Komanduri, R.; Baird, E.D. Review of Precision Surface Generating Processes and Their Potential Application to the Fabrication of Large Optical Components. In Advances in Fabrication and Metrology for Optics and Large Optics, Proceedings of the 32nd Annual International Technical Symposium on Optical and Optoelectronic Applied Science and Engineering, San Diego, CA, USA, 15–18 August 1988; International Society for Optics and Photonics: Bellingham, WA, USA, 1988; Volume 966, pp. 62–73. [Google Scholar] [CrossRef]
- Yergök, Ç. Rough Cutting of Germanium with Polycrystalline Diamond Tools. Master’s Thesis, Mechanical Engineering Department, Middle East Technical University, Ankara, Turkey, 2010. [Google Scholar]
- Khaghani, A.; Cheng, K. Investigation on multi-body dynamics based approach to the toolpath generation for ultraprecision machining of freeform surfaces. Proc. Inst. Mech. Eng. Part B J. Eng. Manuf. 2019, 234, 571–583. [Google Scholar] [CrossRef]
- Shore, P.; Morantz, P. Ultra-precision: Enabling our future. Philos. Trans. R. Soc. A Math. Phys. Eng. Sci. 2012, 370, 3993–4014. [Google Scholar] [CrossRef] [PubMed]
- Benardos, P.; Vosniakos, G.-C. Predicting surface roughness in machining: A review. Int. J. Mach. Tools Manuf. 2003, 43, 833–844. [Google Scholar] [CrossRef]
- Smith, E.F. Single-Point Diamond Turning of Amorphous Thermoplastic Polymers. Master’s Thesis, North Carolina State University, Raleigh, NC, USA, 1989. [Google Scholar]
- Li, Y.; Zhang, Y.; Lin, J.; Yi, A.; Zhou, X. Effects of Machining Errors on Optical Performance of Optical Aspheric Components in Ultra-Precision Diamond Turning. Micromachines 2020, 11, 331. [Google Scholar] [CrossRef] [PubMed] [Green Version]
- Kuntoğlu, M.; Aslan, A.; Pimenov, D.Y.; Usca, Ü.A.; Salur, E.; Gupta, M.K.; Mikolajczyk, T.; Giasin, K.; Kapłonek, W.; Sharma, S. A Review of Indirect Tool Condition Monitoring Systems and Decision-Making Methods in Turning: Critical Analysis and Trends. Sensors 2021, 21, 108. [Google Scholar] [CrossRef]
- Wang, Z.; Bukkapatnam, S.T.; Kumara, S.R.; Kong, Z.; Katz, Z. Change detection in precision manufacturing processes under transient conditions. CIRP Ann. 2014, 63, 449–452. [Google Scholar] [CrossRef]
- Pan, Y.; Zhou, P.; Yan, Y.; Agrawal, A.; Wang, Y.; Guo, D.; Goel, S. New insights into the methods for predicting ground surface roughness in the age of digitalisation. Precis. Eng. 2020, 67, 393–418. [Google Scholar] [CrossRef]
- Ulutan, D.; Ozel, T. Machining induced surface integrity in titanium and nickel alloys: A review. Int. J. Mach. Tools Manuf. 2011, 51, 250–280. [Google Scholar] [CrossRef]
- Soltan, I.; Eltaib, M.; El-Zahry, R. Surface Roughness Prediction in End Milling using Multiple Regression and Adaptive Neuro-fuzzy Inference System. In Proceedings of the Fourth International Conference on Mechanical Engineering Advanced Technology for Industrial Production (MEATIP4), Assiut, Egypt, 12–14 December 2006; pp. 12–14. [Google Scholar]
- Woon, K.S.; Rahman, M. The effect of tool edge radius on the chip formation behavior of tool-based micromachining. Int. J. Adv. Manuf. Technol. 2010, 50, 961–977. [Google Scholar] [CrossRef]
- Zhou, M.; Zhang, H.J.; Huang, S.N.; Chen, S.J.; Cheng, K. Experimental study on the effects of feed rate and tool geometries on tool wear in diamond cutting of sinusoidal microstructured surfaces. Proc. Inst. Mech. Eng. Part B J. Eng. Manuf. 2011, 225, 172–183. [Google Scholar] [CrossRef]
- Yan, J.; Zhang, Z.; Kuriyagawa, T. Effect of Nanoparticle Lubrication in Diamond Turning of Reaction-Bonded SiC. Int. J. Autom. Technol. 2011, 5, 307–312. [Google Scholar] [CrossRef]
- Cheung, C.F. Modelling and Simulation of Nano-Surface Generation in Ultraprecision Machining. Ph.D. Thesis, Hong Kong Polytechnic University, Hong Kong, China, 2000. [Google Scholar]
- Jasinevicius, R.G.; Duduch, J.G.; Porto, A.J.V.; Purquerio, B. Critical aspects on the behavior of material from the mechanical tool-workpiece interaction in single point diamond turning. J. Braz. Soc. Mech. Sci. 1999, 21, 509–518. [Google Scholar] [CrossRef]
- Lee, W.B.; Cheung, C.; To, S. Characteristics of Microcutting Force Variation in Ultraprecision Diamond Turning. Mater. Manuf. Process. 2001, 16, 177–193. [Google Scholar] [CrossRef]
- Kong, M.; Lee, W.; Cheung, C.; To, S. A study of materials swelling and recovery in single-point diamond turning of ductile materials. J. Mater. Process. Technol. 2006, 180, 210–215. [Google Scholar] [CrossRef]
- Zong, W.; Huang, Y.; Zhang, Y.; Sun, T. Conservation law of surface roughness in single point diamond turning. Int. J. Mach. Tools Manuf. 2014, 84, 58–63. [Google Scholar] [CrossRef] [Green Version]
- Grzesik, W. A revised model for predicting surface roughness in turning. Wear 1996, 194, 143–148. [Google Scholar] [CrossRef]
- Gubbels, G. Diamond Turning of Glassy Polymers. Ph.D. Thesis, Technische Universiteit Eindhoven, Eindhoven, The Netherlands, 2006; pp. 35–39. [Google Scholar]
- Petropoulos, G.P.; Pandazaras, C.N.; Davim, J.P. Surface Texture Characterization and Evaluation Related to Machining. In Surface Integrity in Machining; Springer: Berlin/Heidelberg, Germany, 2010; pp. 37–66. [Google Scholar] [CrossRef]
- Khan, G.S.; Sarepaka, R.G.V.; Chattopadhyay, K.; Jain, P.; Narasimham, V. Effects of tool feed rate in single point diamond turning of aluminium-6061 alloy. Indian J. Eng. Mater. Sci. 2003, 10, 123–130. [Google Scholar]
- Rhorer, R.L.; Evans, C.J. Fabrication of Optics by Diamond Turning. In Handbook of Optics; McGraw-Hill Professional: New York, NY, USA, 1995; pp. 41–43. [Google Scholar]
- He, C.; Zong, W. Influencing Factors and Theoretical Models for the Surface Topography in Diamond Turning Process: A Review. Micromachines 2019, 10, 288. [Google Scholar] [CrossRef] [PubMed] [Green Version]
- Mishra, V.; Khan, G.S.; Chattopadhyay, K.; Nand, K.; Sarepaka, R.V. Effects of tool overhang on selection of machining parameters and surface finish during diamond turning. Measurement 2014, 55, 353–361. [Google Scholar] [CrossRef]
- Zhao, X.; Cui, X.; Hu, Z.; Zhang, Q.; Sun, T. Development of an End-Toothed Disc-Based Quick-Change Fixture for Ultra-Precision Diamond Cutting. Machines 2021, 9, 257. [Google Scholar] [CrossRef]
- Li, L.; Wong, H.C.; Bin Lee, R. Evaluation of a Novel Nanodroplet Cutting Fluid for Diamond Turning of Optical Polymers. Polymers 2020, 12, 2213. [Google Scholar] [CrossRef] [PubMed]
- Gubbels, G.; Van Der Beek, G.; Delbressine, F.; Schellekens, P. Electrostatic Tool Wear in Diamond Turning of Amorphous Polymers. In Proceedings of the 4th EUSPEN International Conference, Glasgow, UK, 31 May–2 June 2004. [Google Scholar]
- Wang, J.; Zhang, G.; Chen, N.; Zhou, M.; Chen, Y. A review of tool wear mechanism and suppression method in diamond turning of ferrous materials. Int. J. Adv. Manuf. Technol. 2021, 113, 3027–3055. [Google Scholar] [CrossRef]
- Sawangsri, W.; Cheng, K. An innovative approach to cutting force modelling in diamond turning and its correlation analysis with tool wear. Proc. Inst. Mech. Eng. Part B J. Eng. Manuf. 2014, 230, 405–415. [Google Scholar] [CrossRef]
- Zhang, S.; To, S.; Zhang, G. Diamond tool wear in ultra-precision machining. Int. J. Adv. Manuf. Technol. 2017, 88, 613–641. [Google Scholar] [CrossRef]
- Chen, C.-C.; Liu, N.-M.; Chiang, K.-T.; Chen, H.-L. Experimental investigation of tool vibration and surface roughness in the precision end-milling process using the singular spectrum analysis. Int. J. Adv. Manuf. Technol. 2012, 63, 797–815. [Google Scholar] [CrossRef]
- Thomas, M.; Beauchamp, Y.; Youssef, A.Y.; Masounave, J. Effect of tool vibrations on surface roughness during lathe dry turning process. Comput. Ind. Eng. 1996, 31, 637–644. [Google Scholar] [CrossRef]
- Tian, F.; Yin, Z.; Li, S. Theoretical and experimental investigation on modeling of surface topography influenced by the tool-workpiece vibration in the cutting direction and feeding direction in single-point diamond turning. Int. J. Adv. Manuf. Technol. 2016, 86, 2433–2439. [Google Scholar] [CrossRef]
- Zeqin, L.; Sujuan, W.; Xindu, C.; Suet, T.; Ziqiang, Y.; Junhui, L. Modeling and prediction of surface topography with three tool-work vibration components in single-point diamond turning. Int. J. Adv. Manuf. Technol. 2018, 98, 1627–1639. [Google Scholar] [CrossRef]
- Zhang, S.; To, S.; Zhang, G.; Zhu, Z. A review of machine-tool vibration and its influence upon surface generation in ultra-precision machining. Int. J. Mach. Tools Manuf. 2015, 91, 34–42. [Google Scholar] [CrossRef]
- Mahajan, K.A.; Pawade, R.S.; Mishra, V. Tool vibration effect on surface roughness of polymethylmethacrylate in diamond turning. Mater. Manuf. Process. 2021, 1–12. [Google Scholar] [CrossRef]
- Meyer, P.; Veldhuis, S.; Elbestawi, M. Predicting the effect of vibration on ultraprecision machining surface finish as described by surface finish lobes. Int. J. Mach. Tools Manuf. 2009, 49, 1165–1174. [Google Scholar] [CrossRef]
- Aydın, M.; Karakuzu, C.; Uçar, M.; Cengiz, A.; Çavuşlu, M.A. Prediction of surface roughness and cutting zone temperature in dry turning processes of AISI304 stainless steel using ANFIS with PSO learning. Int. J. Adv. Manuf. Technol. 2012, 67, 957–967. [Google Scholar] [CrossRef]
- Shu, S.; Cheng, K.; Ding, H.; Chen, S. An Innovative Method to Measure the Cutting Temperature in Process by Using an Internally Cooled Smart Cutting Tool. J. Manuf. Sci. Eng. 2013, 135, 061018. [Google Scholar] [CrossRef]
- Chen, X.; Cheng, K.; Wang, C. Design of a smart turning tool with application to in-process cutting force measurement in ultraprecision and micro cutting. Manuf. Lett. 2014, 2, 112–117. [Google Scholar] [CrossRef] [Green Version]
- Chen, X. Monitoring and Analysis of Ultra-Precision Machining Processes Using Acoustic Emission. Ph.D. Thesis, University of California, Berkeley, CA, USA, 1998. [Google Scholar]
- Lee, D.-E.; Hwang, I.; Valente, C.M.; Oliveira, J.; Dornfeld, D.A. Precision Manufacturing Process Monitoring with Acoustic Emission. In Condition Monitoring and Control for Intelligent Manufacturing; Springer: Berlin/Heidelberg, Germany, 2006; pp. 33–54. [Google Scholar]
- Yaldız, S.; Ünsaçar, F. A dynamometer design for measurement the cutting forces on turning. Measurement 2006, 39, 80–89. [Google Scholar] [CrossRef]
- Rao, P.K. Sensor-Based Monitoring and Inspection of Surface Morphology in Ultraprecision Manufacturing Processes. Ph.D. Thesis, Oklahoma State University, Stillwater, OK, USA, 2013. [Google Scholar]
- Liu, J.-J.B. Monitoring the Precision Machining Process: Sensors, Signal Processing and Information Analysis. Ph.D. Thesis, University of California, Berkeley, CA, USA, 1991. [Google Scholar]
- Wang, H.; To, S.; Chan, C.; Cheung, C.; Lee, W. A theoretical and experimental investigation of the tool-tip vibration and its influence upon surface generation in single-point diamond turning. Int. J. Mach. Tools Manuf. 2010, 50, 241–252. [Google Scholar] [CrossRef]
- Diniz, P.S.; Da Silva, E.A.; Netto, S.L. Digital Signal Processing: System Analysis and Design; Cambridge University Press: Cambridge, UK, 2010. [Google Scholar]
- Golyandina, N.; Nekrutkin, V.; Zhigljavsky, A.A. Analysis of Time Series Structure: SSA and Related Techniques; CRC Press: Boca Raton, FL, USA, 2001. [Google Scholar]
- Hsu, H.P. Signals and Systems. In Schaum’s Outlines; McGraw-Hill: New York, NY, USA, 2011. [Google Scholar]
- Azouzi, R.; Guillot, M. On-line prediction of surface finish and dimensional deviation in turning using neural network based sensor fusion. Int. J. Mach. Tools Manuf. 1997, 37, 1201–1217. [Google Scholar] [CrossRef]
- Hessainia, Z.; Belbah, A.; Yallese, M.A.; Mabrouki, T.; Rigal, J.-F. On the prediction of surface roughness in the hard turning based on cutting parameters and tool vibrations. Measurement 2013, 46, 1671–1681. [Google Scholar] [CrossRef]
- Risbood, K.; Dixit, U.; Sahasrabudhe, A. Prediction of surface roughness and dimensional deviation by measuring cutting forces and vibrations in turning process. J. Mater. Process. Technol. 2003, 132, 203–214. [Google Scholar] [CrossRef]
- Kirby, E.D.; Chen, J.C. Development of a fuzzy-nets-based surface roughness prediction system in turning operations. Comput. Ind. Eng. 2007, 53, 30–42. [Google Scholar] [CrossRef]
- Plaza, E.G.; López, P.J.N. Surface roughness monitoring by singular spectrum analysis of vibration signals. Mech. Syst. Signal Process. 2017, 84, 516–530. [Google Scholar] [CrossRef]
- García Plaza, E.; Núñez, P.J.; Rodríguez Salgado, D.; Cambero Rivero, I.; Herrera Olivenza, J.M.; Sanz-Calcedo, J.G. Contribution of surface finish monitoring signals in CNC taper turning. Mater. Sci. Forum 2014, 797, 41–46. [Google Scholar] [CrossRef]
- Gabor, D. Theory of communication. Part 1: The analysis of information. J. Inst. Electr. Eng. Part III Radio Commun. Eng. 1946, 93, 429–441. [Google Scholar] [CrossRef] [Green Version]
- Gao, R.X.; Yan, R. Wavelets: Theory and Applications for Manufacturing; Springer Science & Business Media: Berlin/Heidelberg, Germany, 2010. [Google Scholar]
- Plaza, E.G.; López, P.J.N. Analysis of cutting force signals by wavelet packet transform for surface roughness monitoring in CNC turning. Mech. Syst. Signal Process. 2018, 98, 634–651. [Google Scholar] [CrossRef]
- Zel, T.; Karpat, Y. Predictive modeling of surface roughness and tool wear in hard turning using regression and neural networks. Int. J. Mach. Tools Manuf. 2005, 45, 467–479. [Google Scholar]
- Upadhyay, V.; Jain, P.; Mehta, N. In-process prediction of surface roughness in turning of Ti–6Al–4V alloy using cutting parameters and vibration signals. Measurement 2013, 46, 154–160. [Google Scholar] [CrossRef]
- Yip, W.S.; To, S. Theoretical and Experimental Investigations of Tool Tip Vibration in Single Point Diamond Turning of Titanium Alloys. Micromachines 2019, 10, 231. [Google Scholar] [CrossRef] [PubMed] [Green Version]
- Plaza, E.G.; López, P.J.N. Application of the wavelet packet transform to vibration signals for surface roughness monitoring in CNC turning operations. Mech. Syst. Signal Process. 2018, 98, 902–919. [Google Scholar] [CrossRef]
- Kotsiantis, S.B.; Zaharakis, I.; Pintelas, P. Supervised machine learning: A review of classification techniques. Emerg. Artif. Intell. Appl. Comput. Eng. 2007, 160, 3–24. [Google Scholar]
- Ghuman, S.S. A review of data mining techniques. Ind. Manag. Data Syst. 2014, 3, 1401–1406. [Google Scholar]
- Li, X.; Iynkaran, K.; Nee, A. A hybrid machining simulator based on predictive machining theory and neural network modelling. J. Mater. Process. Technol. 1999, 89–90, 224–230. [Google Scholar] [CrossRef]
- Mekid, S.; Pruschek, P.; Hernandez, J. Beyond intelligent manufacturing: A new generation of flexible intelligent NC machines. Mech. Mach. Theory 2009, 44, 466–476. [Google Scholar] [CrossRef]
- Newsom, I. Data Analysis II: Logistic Regression. Available online: http://web.pdx.edu/~newsomj/cdaclass/ho_logistic.pdf (accessed on 12 October 2021).
- Cheng, C.; Wang, Z.; Hung, W.; Bukkapatnam, S.T.; Komanduri, R. Ultra-precision Machining Process Dynamics and Surface Quality Monitoring. Procedia Manuf. 2015, 1, 607–618. [Google Scholar] [CrossRef] [Green Version]
- Dornfeld, D.; Lee, Y.; Chang, A. Monitoring of ultraprecision machining processes. Int. J. Adv. Manuf. Technol. 2003, 21, 571–578. [Google Scholar] [CrossRef]
- Rao, P.K.; Bhushan, B.; Bukkapatnam, S.T.S.; Kong, Z.; Byalal, S.; Beyca, O.F.; Fields, A.; Komanduri, R. Process-Machine Interaction (PMI) Modeling and Monitoring of Chemical Mechanical Planarization (CMP) Process Using Wireless Vibration Sensors. IEEE Trans. Semicond. Manuf. 2013, 27, 1–15. [Google Scholar] [CrossRef]
- Yoshioka, H.; Shinn, H.; Hashizume, H. In-process microsensor for ultraprecision machining. IEE Proc. Sci. Meas. Technol. 2004, 151, 121–125. [Google Scholar] [CrossRef]
- Shinno, H.; Hashizume, H.; Sato, H. In-Process Monitoring Method for Machining Environment Based on Simultaneous Multiphenomena Sensing. CIRP Ann. 1997, 46, 53–56. [Google Scholar] [CrossRef]
- Lee, Y.; Chang, A.K.; Dornfeld, D.A. Acoustic emission monitoring for the diamond machining of oxygen-free high-conductivity copper. J. Mater. Process. Technol. 2002, 127, 199–205. [Google Scholar] [CrossRef]
- Hayashi, M.; Yoshioka, H.; Shinno, H. An Adaptive Control of Ultraprecision Machining with an In-Process Micro-Sensor. J. Adv. Mech. Des. Syst. Manuf. 2008, 2, 322–331. [Google Scholar] [CrossRef] [Green Version]
- Yoshioka, H.; Hayashi, M.; Shinno, H. Status Monitoring of Ultraprecision Machining Using Micro Thermo Sensor and AE Sensor. Int. J. Autom. Technol. 2009, 3, 422–427. [Google Scholar] [CrossRef]
- Rao, P.; Bukkapatnam, S.; Beyca, O.; Kong, Z.; Komanduri, R. Real-Time Identification of Incipient Surface Morphology Variations in Ultraprecision Machining Process. J. Manuf. Sci. Eng. 2014, 136, 021008. [Google Scholar] [CrossRef]
- Wang, C.; Cheng, K.; Nelson, N.; Sawangsri, W.; Rakowski, R. Cutting force—Based analysis and correlative observations on the tool wear in diamond turning of single-crystal silicon. Proc. Inst. Mech. Eng. Part B J. Eng. Manuf. 2014, 229, 1867–1873. [Google Scholar] [CrossRef]
- Beyca, O.F.; Rao, P.; Kong, Z.; Bukkapatnam, S.T.S.; Komanduri, R. Heterogeneous Sensor Data Fusion Approach for Real-time Monitoring in Ultraprecision Machining (UPM) Process Using Non-Parametric Bayesian Clustering and Evidence Theory. IEEE Trans. Autom. Sci. Eng. 2015, 13, 1033–1044. [Google Scholar] [CrossRef]
- Elangovan, M.; Sakthivel, N.; Saravanamurugan, S.; Nair, B.; Sugumaran, V. Machine Learning Approach to the Prediction of Surface Roughness Using Statistical Features of Vibration Signal Acquired in Turning. Procedia Comput. Sci. 2015, 50, 282–288. [Google Scholar] [CrossRef] [Green Version]
- Yang, C.; Zheng, Q.; Hu, Y. The Prediction Model of Surface Roughness Based on Experiments of Turning Titanium Alloy. In Proceedings of the 2016 IEEE International Conference on Mechatronics and Automation, Harbin, China, 7–10 August 2016; pp. 1776–1780. [Google Scholar] [CrossRef]
- Liman, M.M.; Abou-El-Hossein, K.; Odedeyi, P.B. Modeling and Prediction of Surface Roughness in Ultra-High Precision Diamond Turning of Contact Lens Polymer Using RSM and ANN Methods. Mater. Sci. Forum 2018, 928, 139–143. [Google Scholar] [CrossRef]
- Kohli, A.; Dixit, U. A neural-network-based methodology for the prediction of surface roughness in a turning process. Int. J. Adv. Manuf. Technol. 2004, 25, 118–129. [Google Scholar] [CrossRef]
- Adesta, E.Y.T.; Al Hazza, M.H.; Suprianto, M.; Riza, M. Predicting Surface Roughness with Respect to Process Parameters Using Regression Analysis Models in End Milling. Adv. Mater. Res. 2012, 576, 99–102. [Google Scholar] [CrossRef]
- Sangwan, K.S.; Saxena, S.; Kant, G. Optimization of Machining Parameters to Minimize Surface Roughness using Integrated ANN-GA Approach. Procedia CIRP 2015, 29, 305–310. [Google Scholar] [CrossRef]
- Beatrice, B.A.; Kirubakaran, E.; Thangaiah, P.R.J.; Wins, K.L.D. Surface Roughness Prediction using Artificial Neural Network in Hard Turning of AISI H13 Steel with Minimal Cutting Fluid Application. Procedia Eng. 2014, 97, 205–211. [Google Scholar] [CrossRef] [Green Version]
- Wang, X.; Kang, M.; Fu, X.; Li, C. Predictive modeling of surface roughness in lenses precision turning using regression and support vector machines. Int. J. Adv. Manuf. Technol. 2013, 87, 1273–1281. [Google Scholar] [CrossRef]
- Salgado, D.R.; Alonso, F.J.; Cambero, I.; Marcelo, A.; Alonso, J. In-process surface roughness prediction system using cutting vibrations in turning. Int. J. Adv. Manuf. Technol. 2008, 43, 40–51. [Google Scholar] [CrossRef]
- Zhang, D.; Bi, G.; Sun, Z.; Guo, Y. Online monitoring of precision optics grinding using acoustic emission based on support vector machine. Int. J. Adv. Manuf. Technol. 2015, 80, 761–774. [Google Scholar] [CrossRef]
- Lela, B.; Bajić, D.; Jozić, S. Regression analysis, support vector machines, and Bayesian neural network approaches to modeling surface roughness in face milling. Int. J. Adv. Manuf. Technol. 2008, 42, 1082–1088. [Google Scholar] [CrossRef]
- Jurkovic, Z.; Cukor, G.; Brezocnik, M.; Brajkovic, T. A comparison of machine learning methods for cutting parameters prediction in high speed turning process. J. Intell. Manuf. 2016, 29, 1683–1693. [Google Scholar] [CrossRef]
- Sizemore, N.E.; Nogueira, M.L.; Greis, N.P.; Davies, M.A. Application of Machine Learning to the Prediction of Surface Roughness in Diamond Machining. Procedia Manuf. 2020, 48, 1029–1040. [Google Scholar] [CrossRef]
- Abu-Mahfouz, I.; El Ariss, O.; Esfakur Rahman, A.H.M.; Banerjee, A. Surface roughness prediction as a classification problem using support vector machine. Int. J. Adv. Manuf. Technol. 2017, 92, 803–815. [Google Scholar] [CrossRef]
- Ahmad, N.; Janahiraman, T.V.; Tarlochan, F. Modeling of Surface Roughness in Turning Operation Using Extreme Learning Machine. Arab. J. Sci. Eng. 2014, 40, 595–602. [Google Scholar] [CrossRef]
- Khaghani, A.; Cheng, K. Investigation on an innovative approach for clamping contact lens mould inserts in ultraprecision machining using an adaptive precision chuck and its application perspectives. Int. J. Adv. Manuf. Technol. 2020, 111, 1–12. [Google Scholar] [CrossRef]
- Wu, L.; Leng, J.; Ju, B. Digital Twins-Based Smart Design and Control of Ultra-Precision Machining: A Review. Symmetry 2021, 13, 1717. [Google Scholar] [CrossRef]
- Gou, N.; Cheng, K.; Huo, D. Multiscale Modelling and Analysis for Design and Development of a High-Precision Aerostatic Bearing Slideway and Its Digital Twin. Machines 2021, 9, 85. [Google Scholar] [CrossRef]
- Huang, P.-M.; Lee, C.-H. Estimation of Tool Wear and Surface Roughness Development Using Deep Learning and Sensors Fusion. Sensors 2021, 21, 5338. [Google Scholar] [CrossRef] [PubMed]
- Dai, W.; Liang, K.; Wang, B. State Monitoring Method for Tool Wear in Aerospace Manufacturing Processes Based on a Convolutional Neural Network (CNN). Aerospace 2021, 8, 335. [Google Scholar] [CrossRef]
- Nguyen, V.; Nguyen, V.; Pham, V. Deep Stacked Auto-Encoder Network Based Tool Wear Monitoring in the Face Milling Process. Stroj. Vestn. J. Mech. Eng. 2020, 66, 227–235. [Google Scholar] [CrossRef] [Green Version]
- Lee, W.; Abdullah, M.; Ong, P.; Abdullah, H.; Teo, W. Prediction of flank wear and surface roughness by recurrent neural network in turning process. J. Adv. Manuf. Technol. (JAMT) 2021, 15, 55–56. [Google Scholar]
- Shi, C.; Panoutsos, G.; Luo, B.; Liu, H.; Li, B.; Lin, X. Using Multiple-Feature-Spaces-Based Deep Learning for Tool Condition Monitoring in Ultraprecision Manufacturing. IEEE Trans. Ind. Electron. 2018, 66, 3794–3803. [Google Scholar] [CrossRef] [Green Version]
- Chih, H.-Y.; Fan, Y.-C.; Peng, W.-C.; Kuo, H.-Y. Product Quality Prediction with Convolutional Encoder-Decoder Architecture and Transfer Learning. In Proceedings of the 29th ACM International Conference on Information & Knowledge Management, Online, 19–23 October 2020; pp. 195–204. [Google Scholar]
- Lin, W.-J.; Lo, S.-H.; Young, H.-T.; Hung, C.-L. Evaluation of Deep Learning Neural Networks for Surface Roughness Prediction Using Vibration Signal Analysis. Appl. Sci. 2019, 9, 1462. [Google Scholar] [CrossRef] [Green Version]
- Möhring, H.-C.; Eschelbacher, S.; Georgi, P. Machine learning approaches for real-time monitoring and evaluation of surface roughness using a sensory milling tool. Procedia CIRP 2021, 102, 264–269. [Google Scholar] [CrossRef]
- Yip, W.S.; To, S.; Zhou, H. Current status, challenges and opportunities of sustainable ultra-precision manufacturing. J. Intell. Manuf. 2021, 1–13. [Google Scholar] [CrossRef]
- Abu-Mahfouz, I.; Banerjee, A.; Rahman, E. Evaluation of Clustering Techniques to Predict Surface Roughness during Turning of Stainless-Steel Using Vibration Signals. Materials 2021, 14, 5050. [Google Scholar] [CrossRef] [PubMed]
Figure 1.
Taniguchi curve predicting the exponential improvement in machining accuracy [6].
Figure 1.
Taniguchi curve predicting the exponential improvement in machining accuracy [6].

Figure 2.
Key components of a diamond turning machine/machining system and their features [8].
Figure 2.
Key components of a diamond turning machine/machining system and their features [8].

Figure 3.
Schematic diagram of the tool–workpiece interface in UPM.

Figure 4.
Types of vibration in a diamond turning machine [46].
Figure 4.
Types of vibration in a diamond turning machine [46].

Figure 5.
Summary of the approach used in the monitoring of surface roughness in ultraprecision machining.
Figure 5.
Summary of the approach used in the monitoring of surface roughness in ultraprecision machining.

Figure 7.
Complex dynamics evident in (a) time domain, (b) frequency domain signals from a representative accelerometer sensor signal acquired during UPM.
Figure 7.
Complex dynamics evident in (a) time domain, (b) frequency domain signals from a representative accelerometer sensor signal acquired during UPM.

Figure 8.
Time–frequency domain with Daubechies wavelet (db4) applied to vibration signal in UPM.

Figure 9.
Problem solving process using machine learning.

Figure 10.
Real-time monitoring setup used for UPM [80].
Figure 10.
Real-time monitoring setup used for UPM [80].

Figure 11.
Feature learning process of the parallel training model.


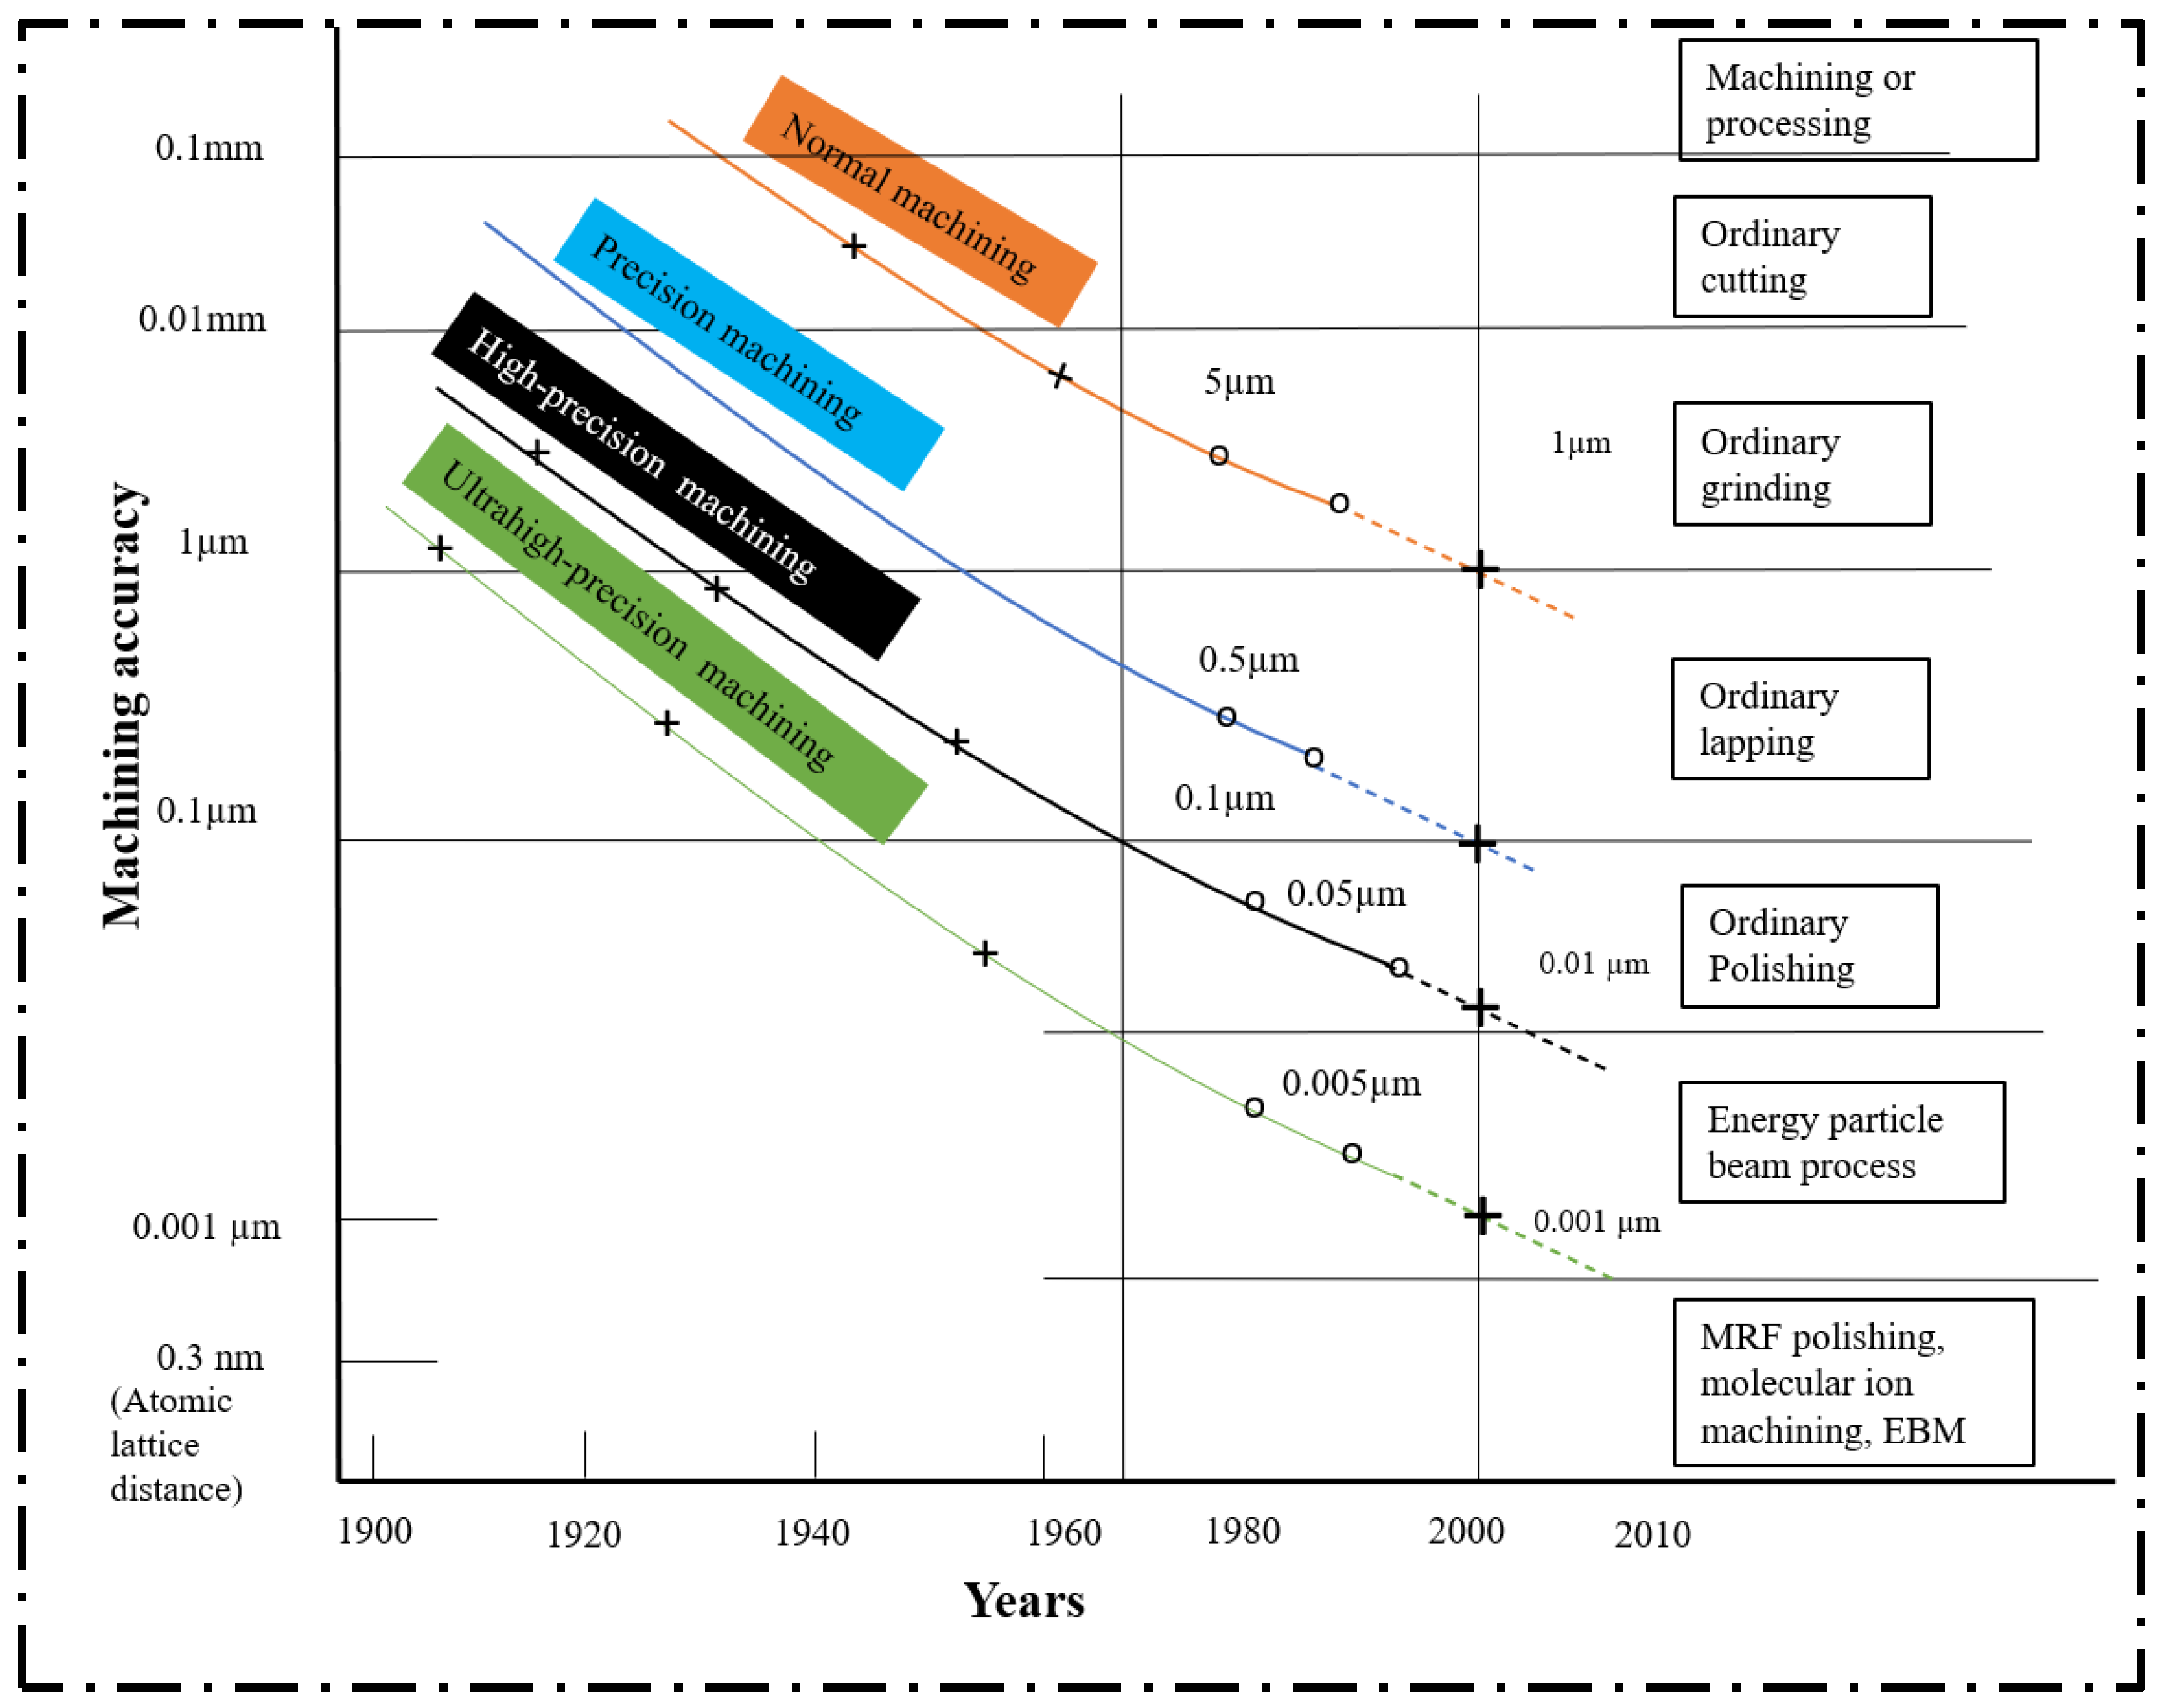
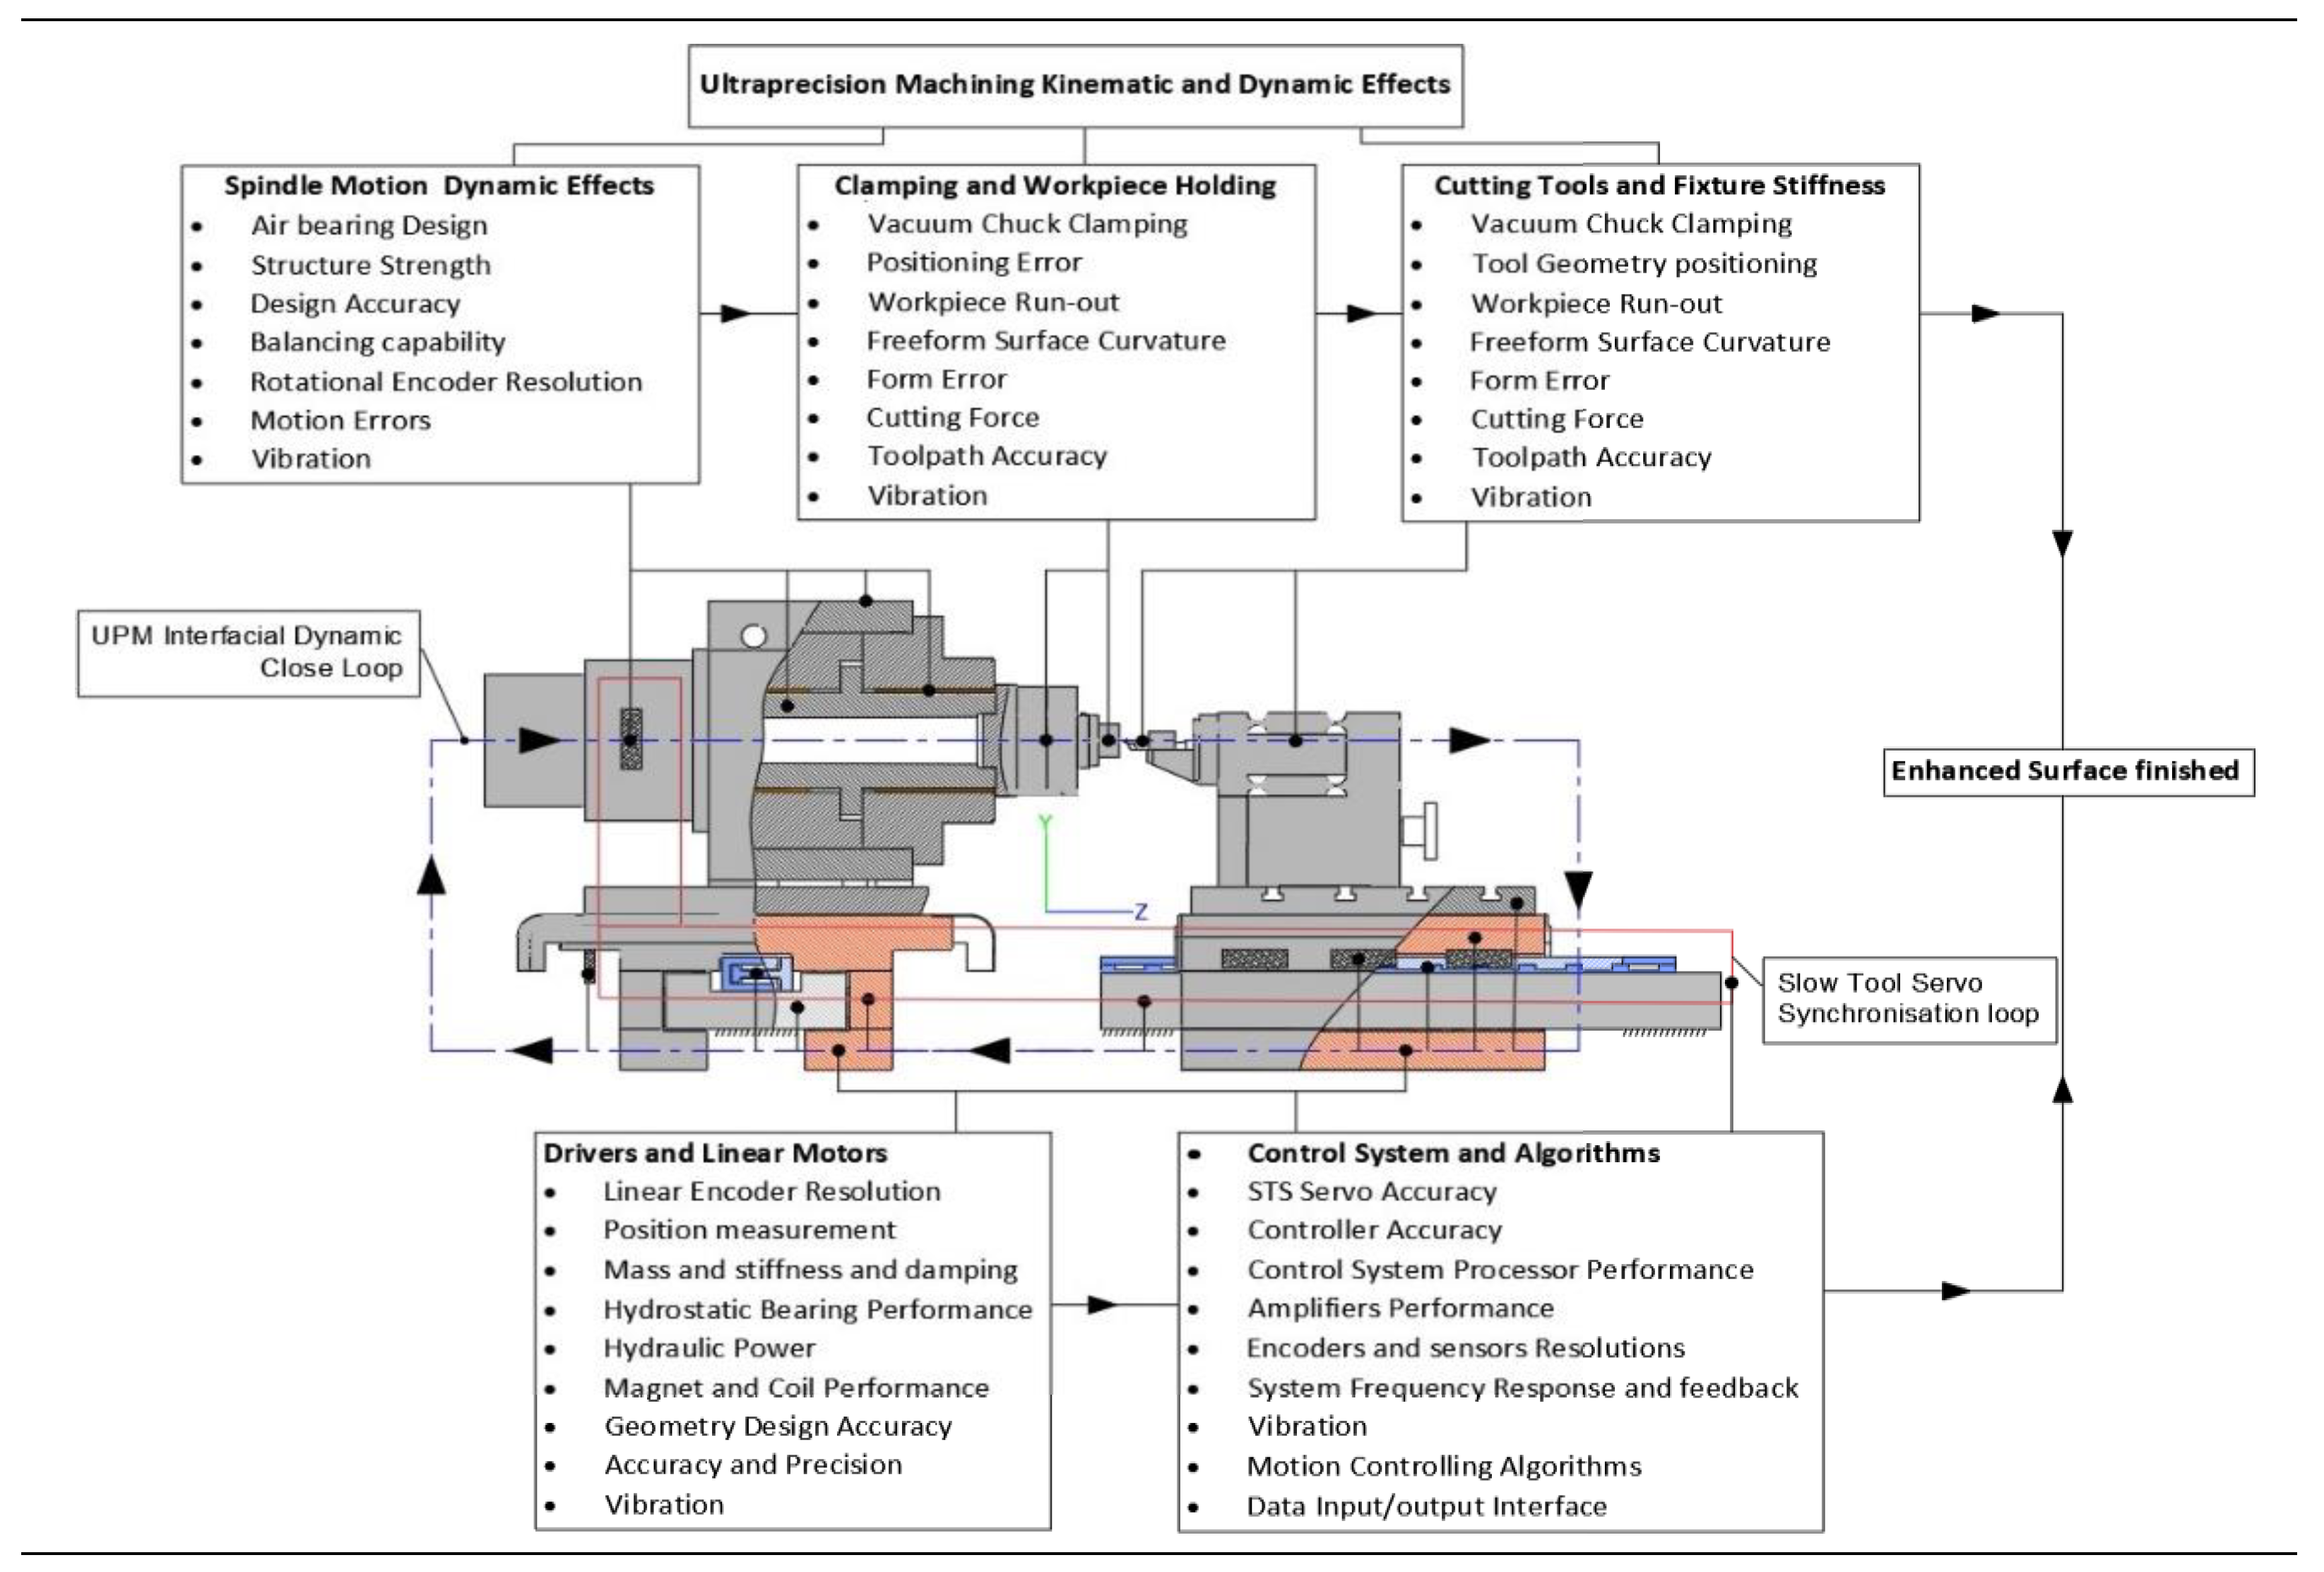
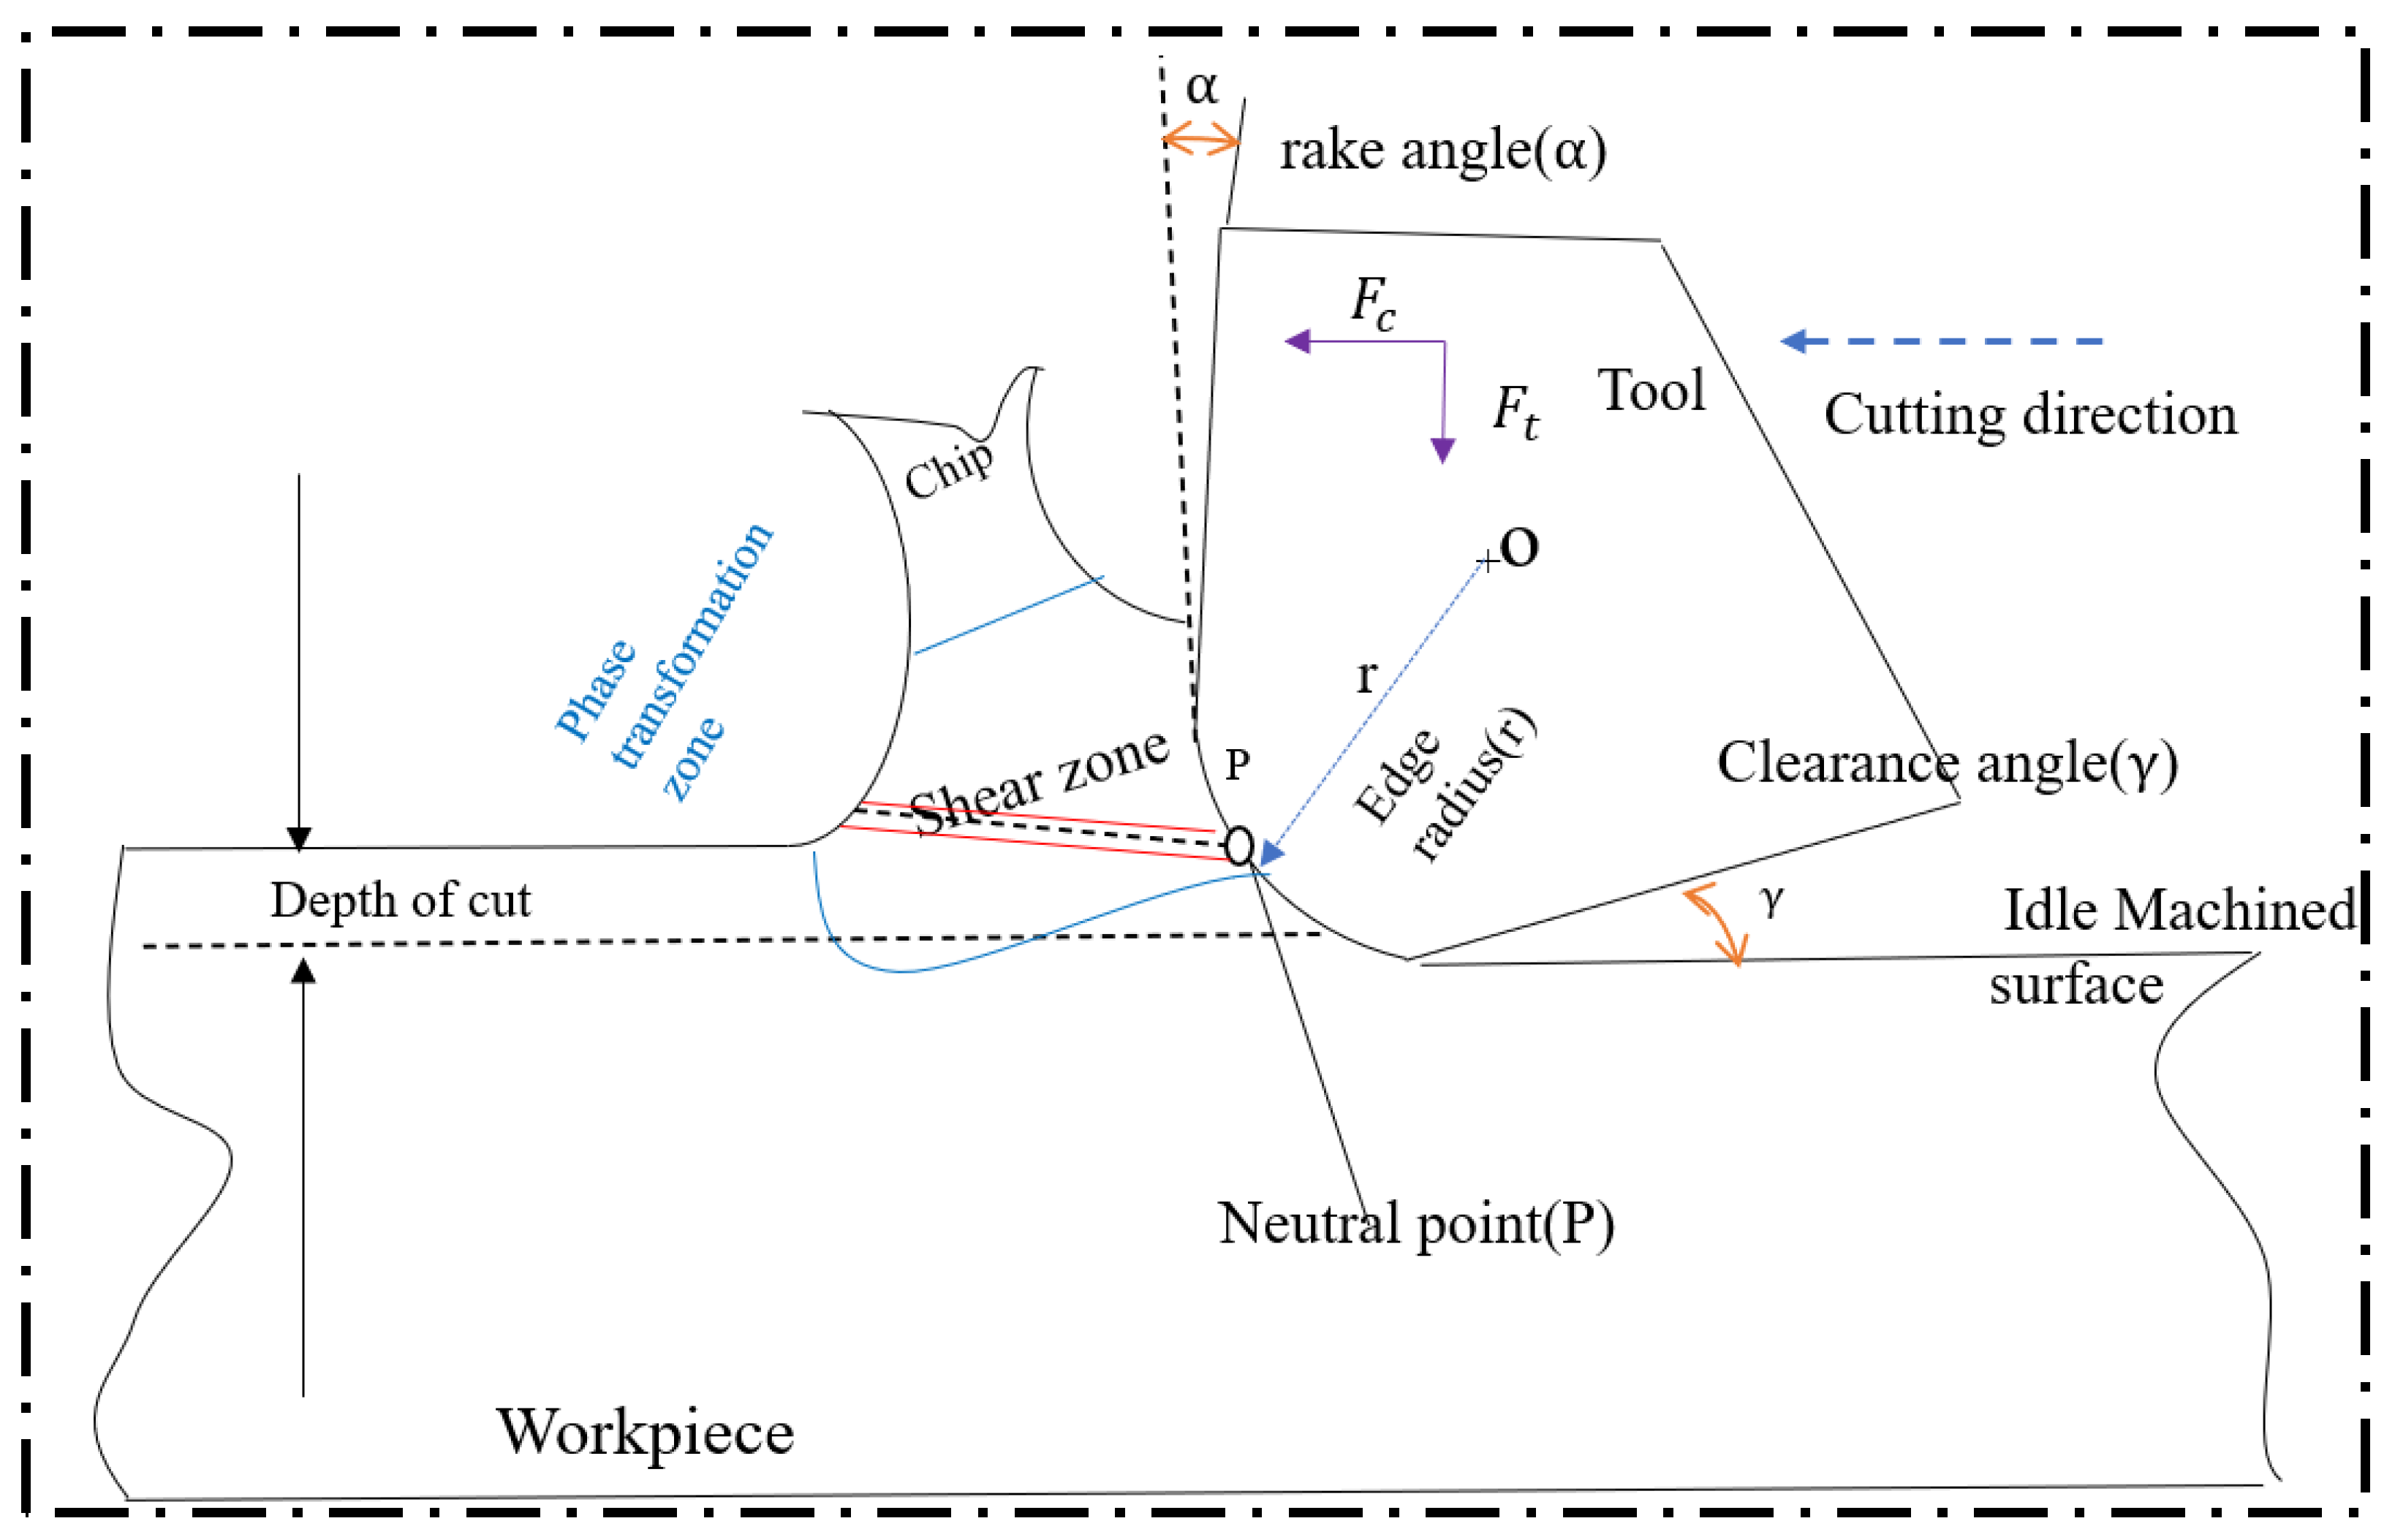
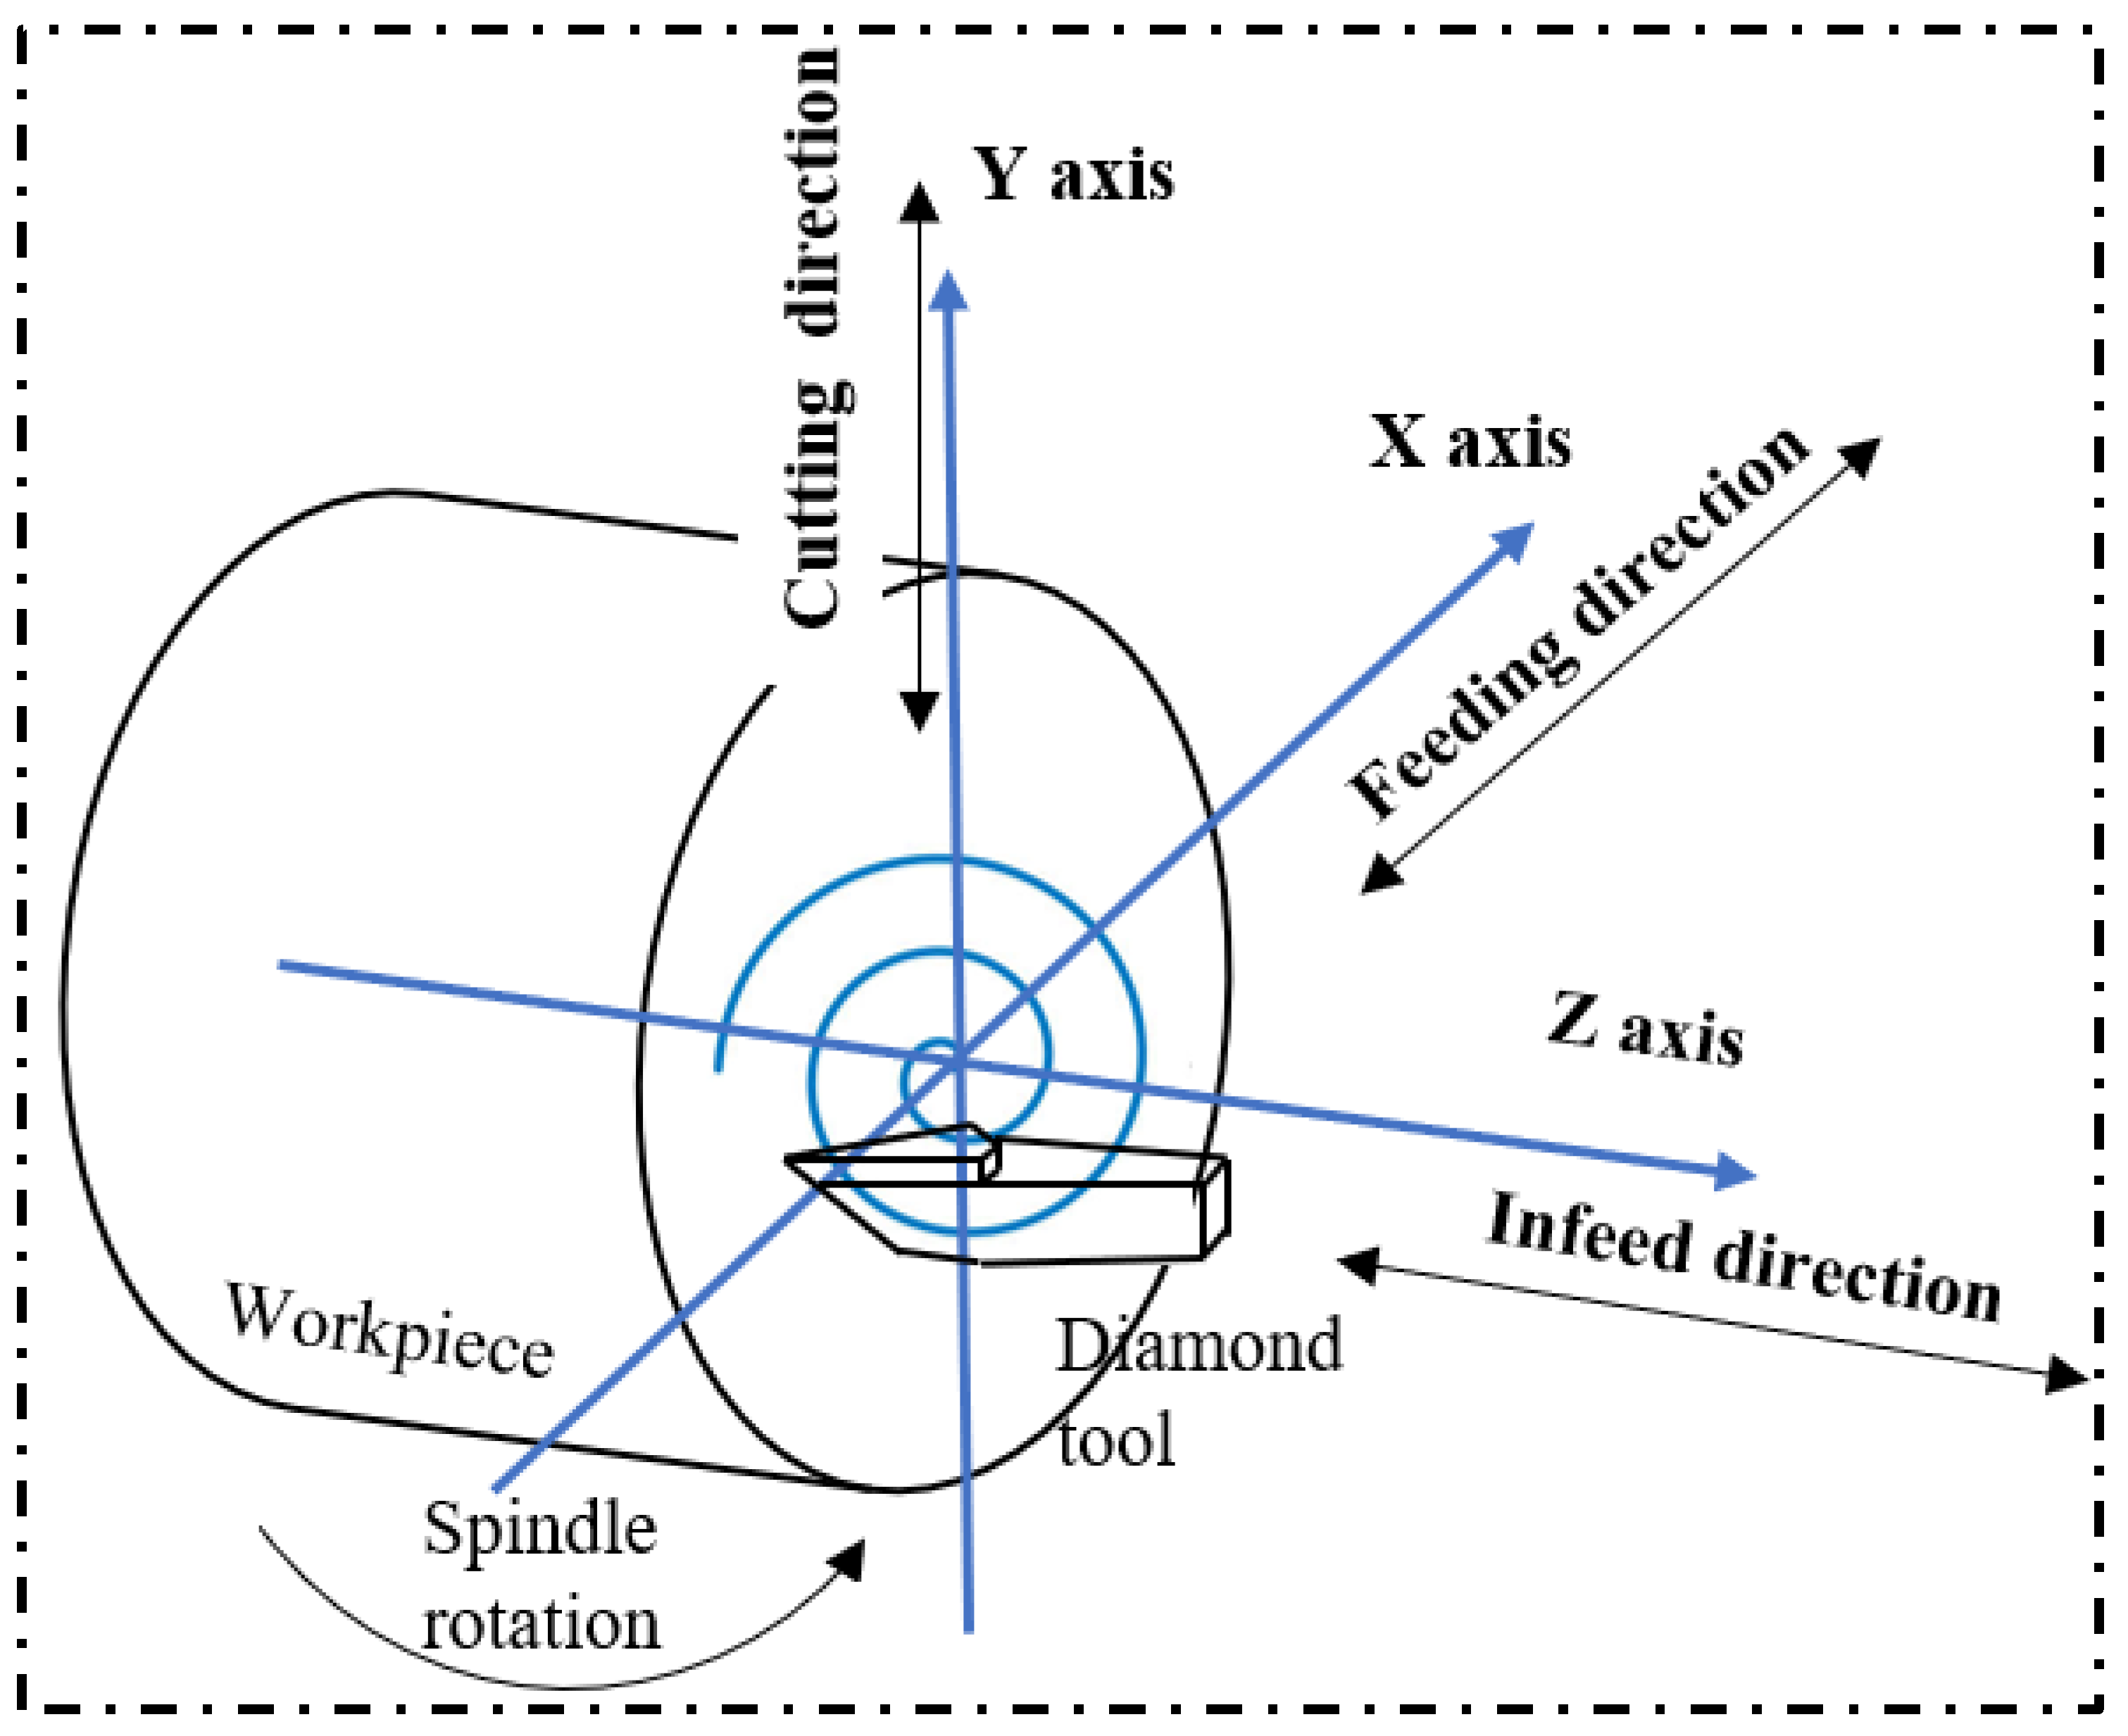
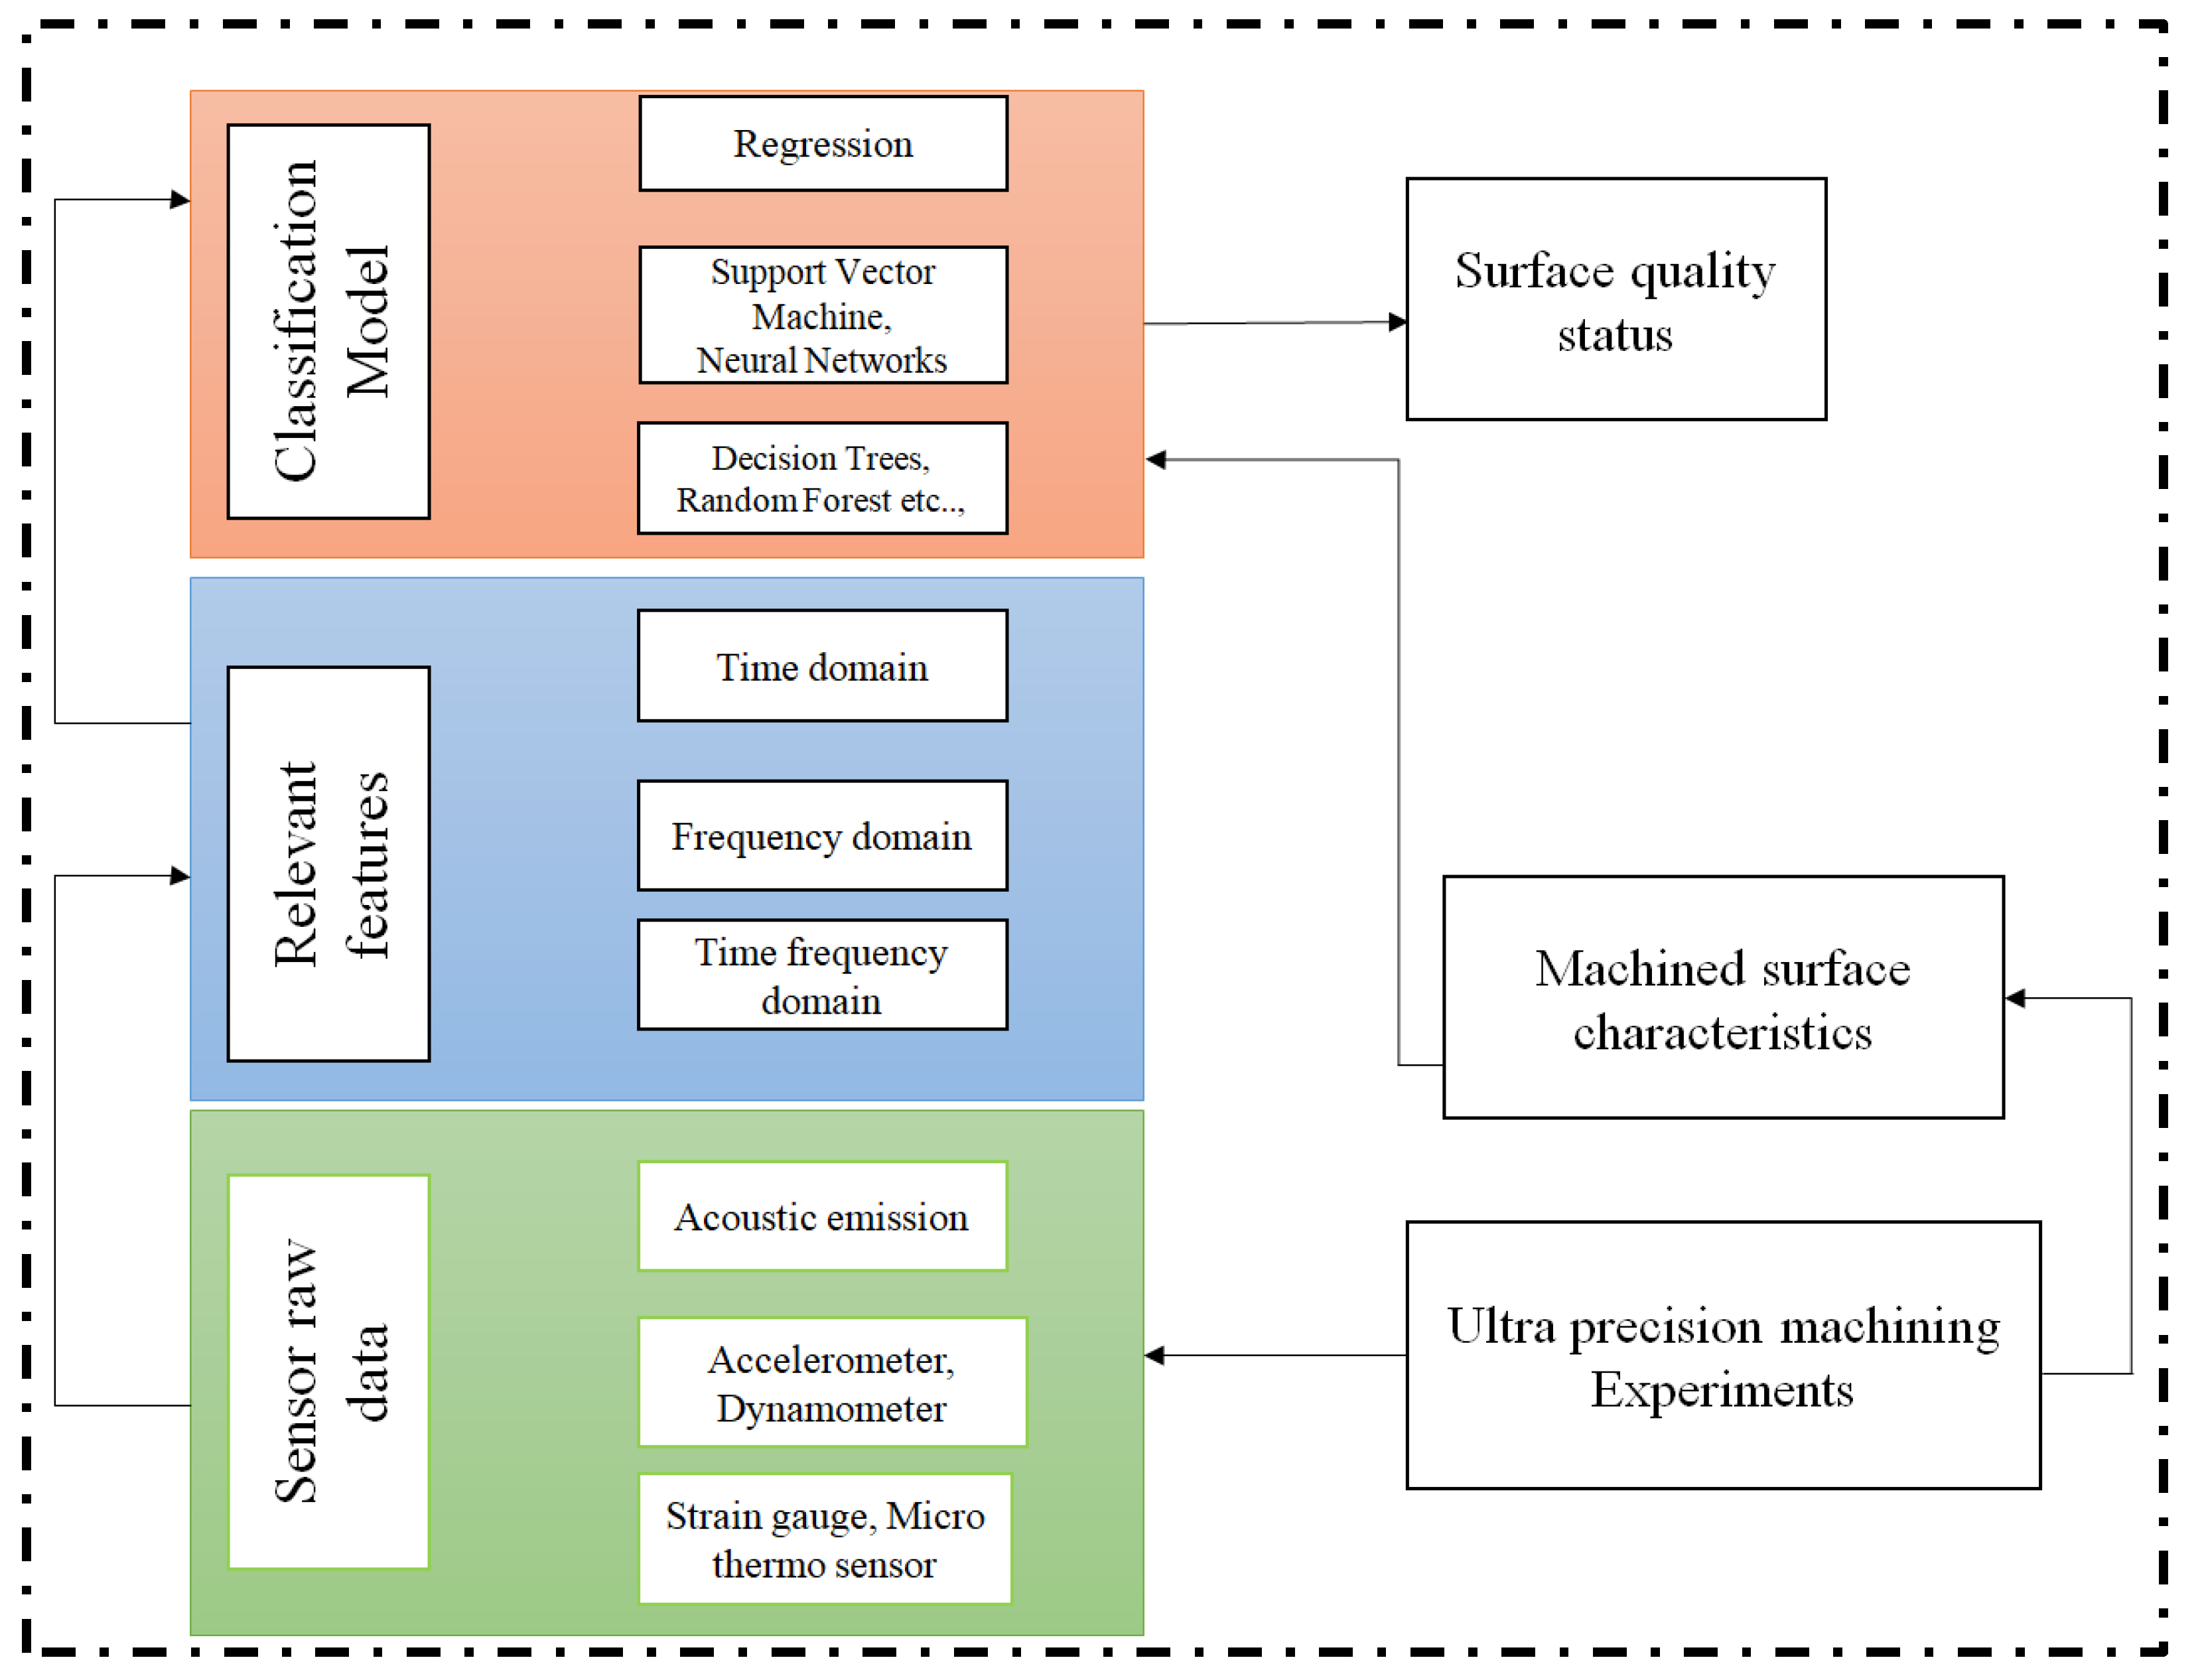
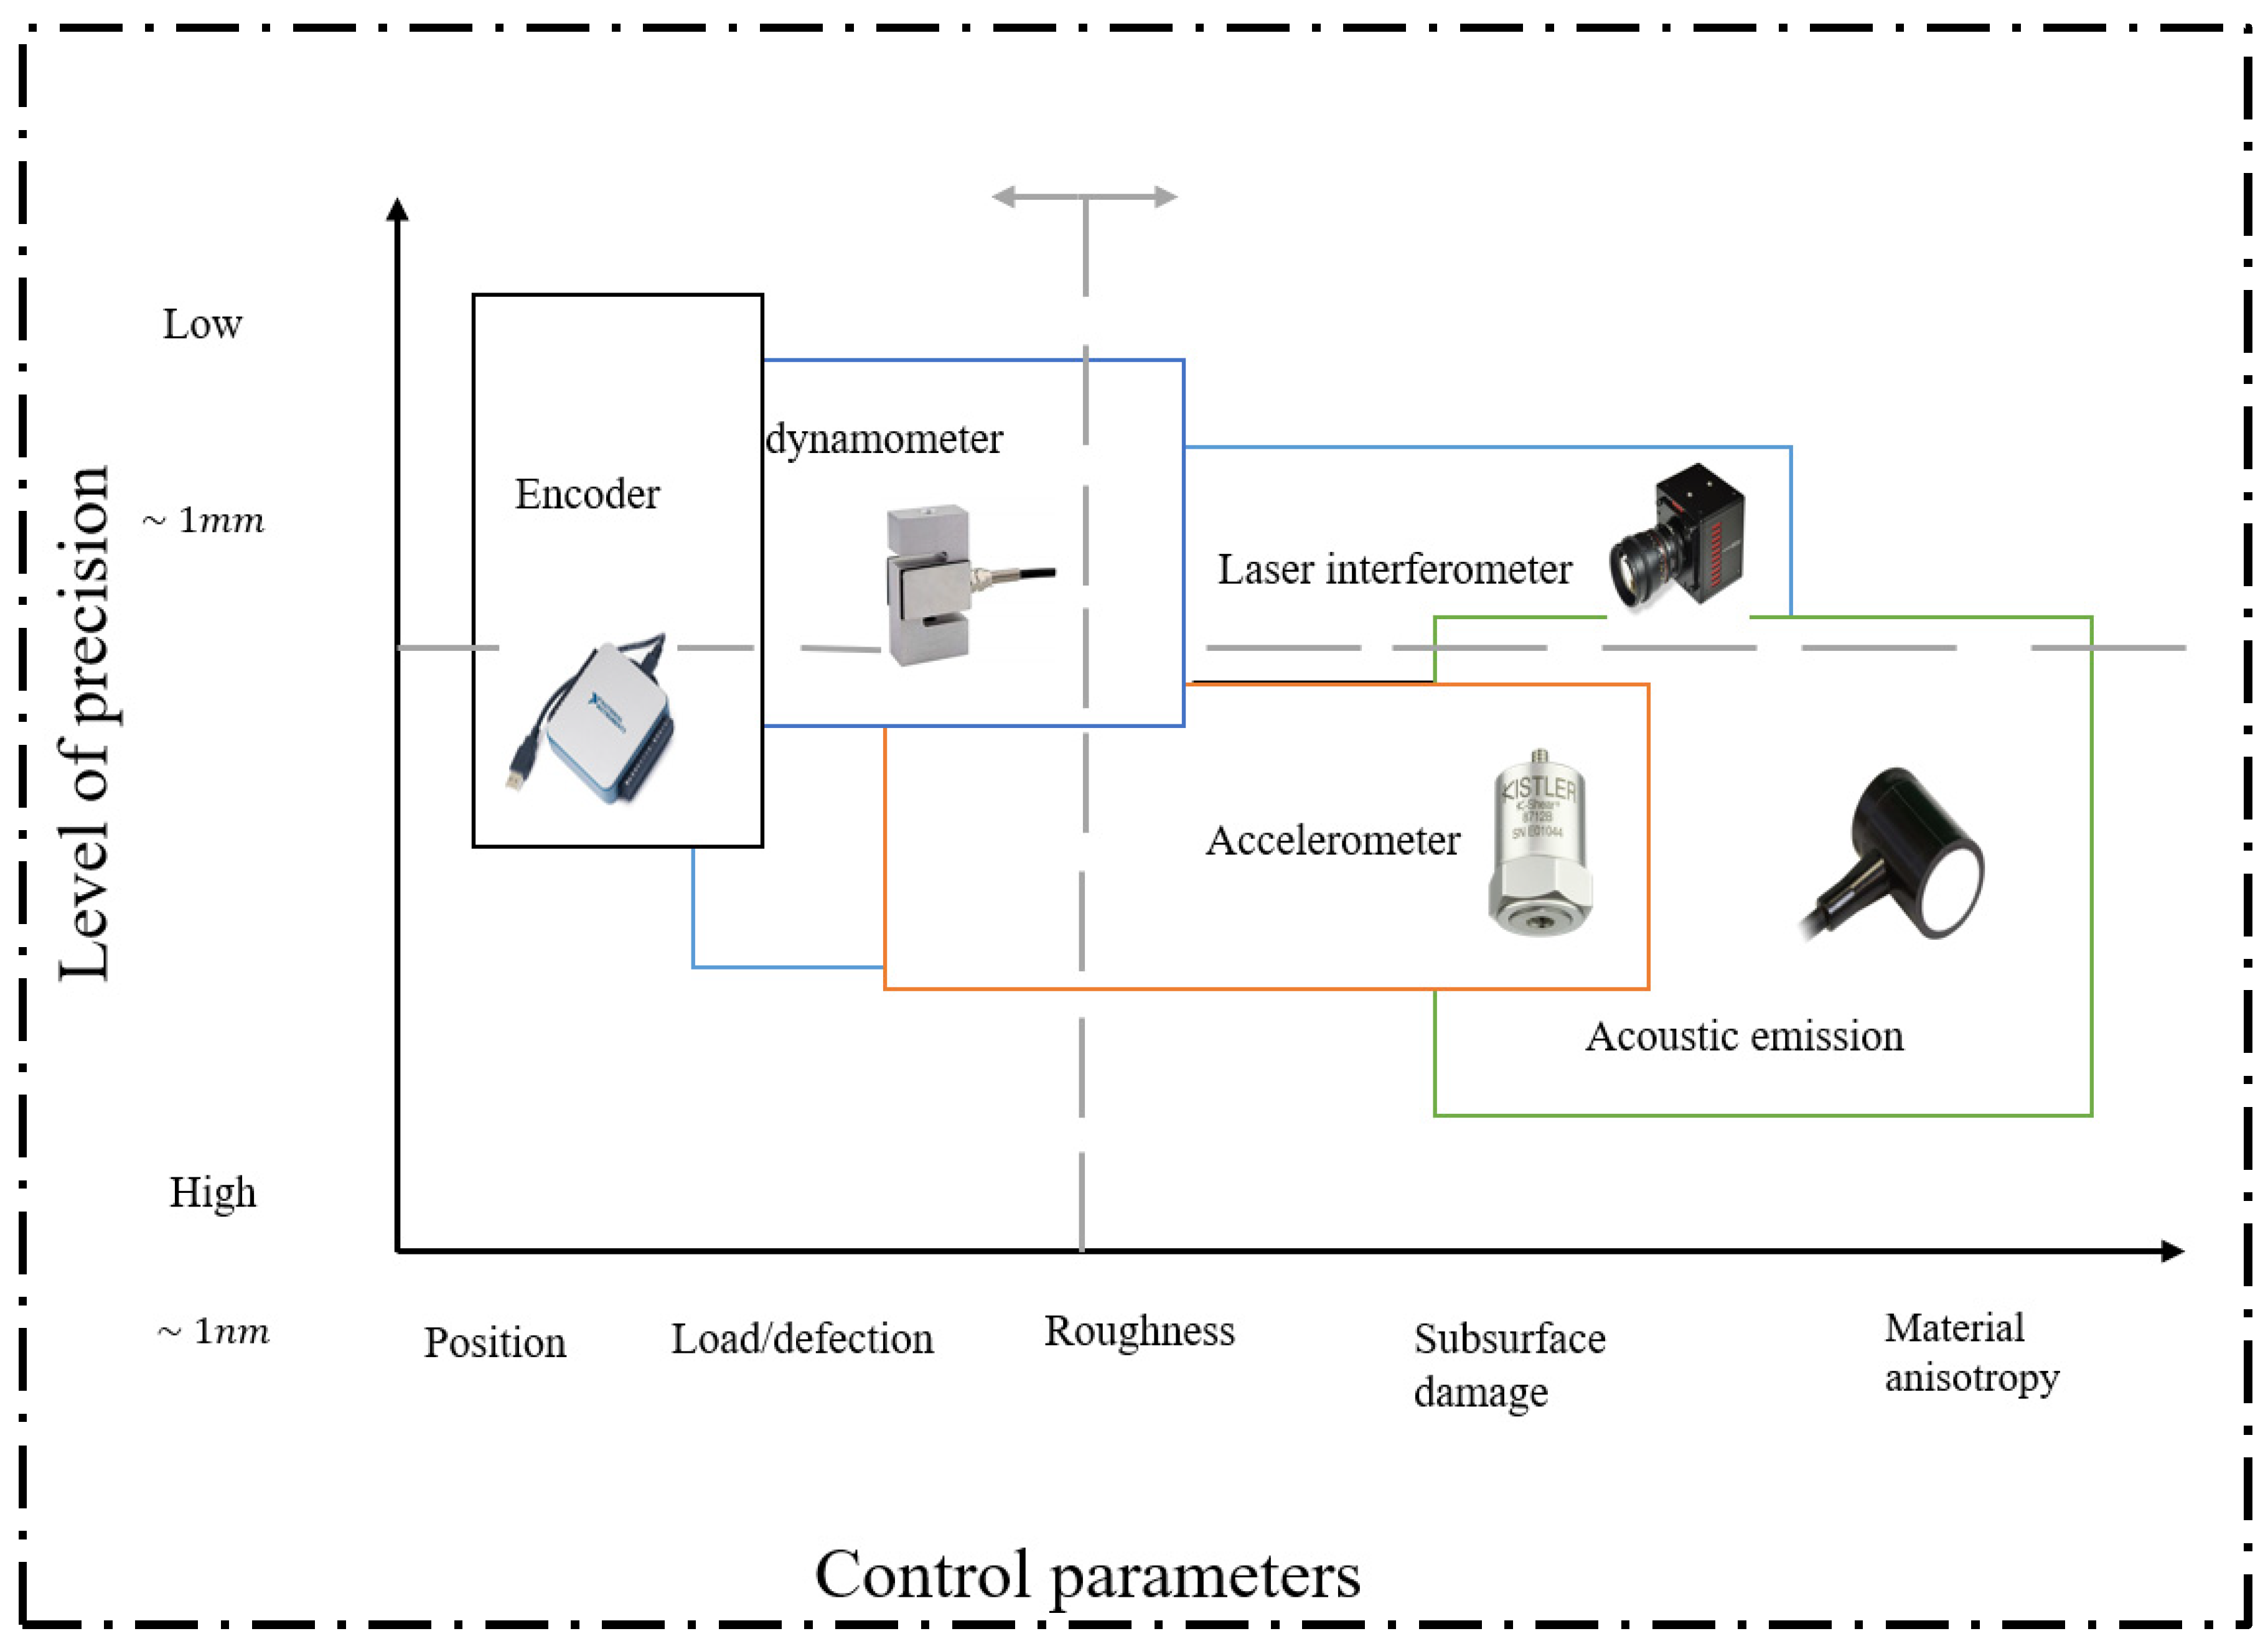
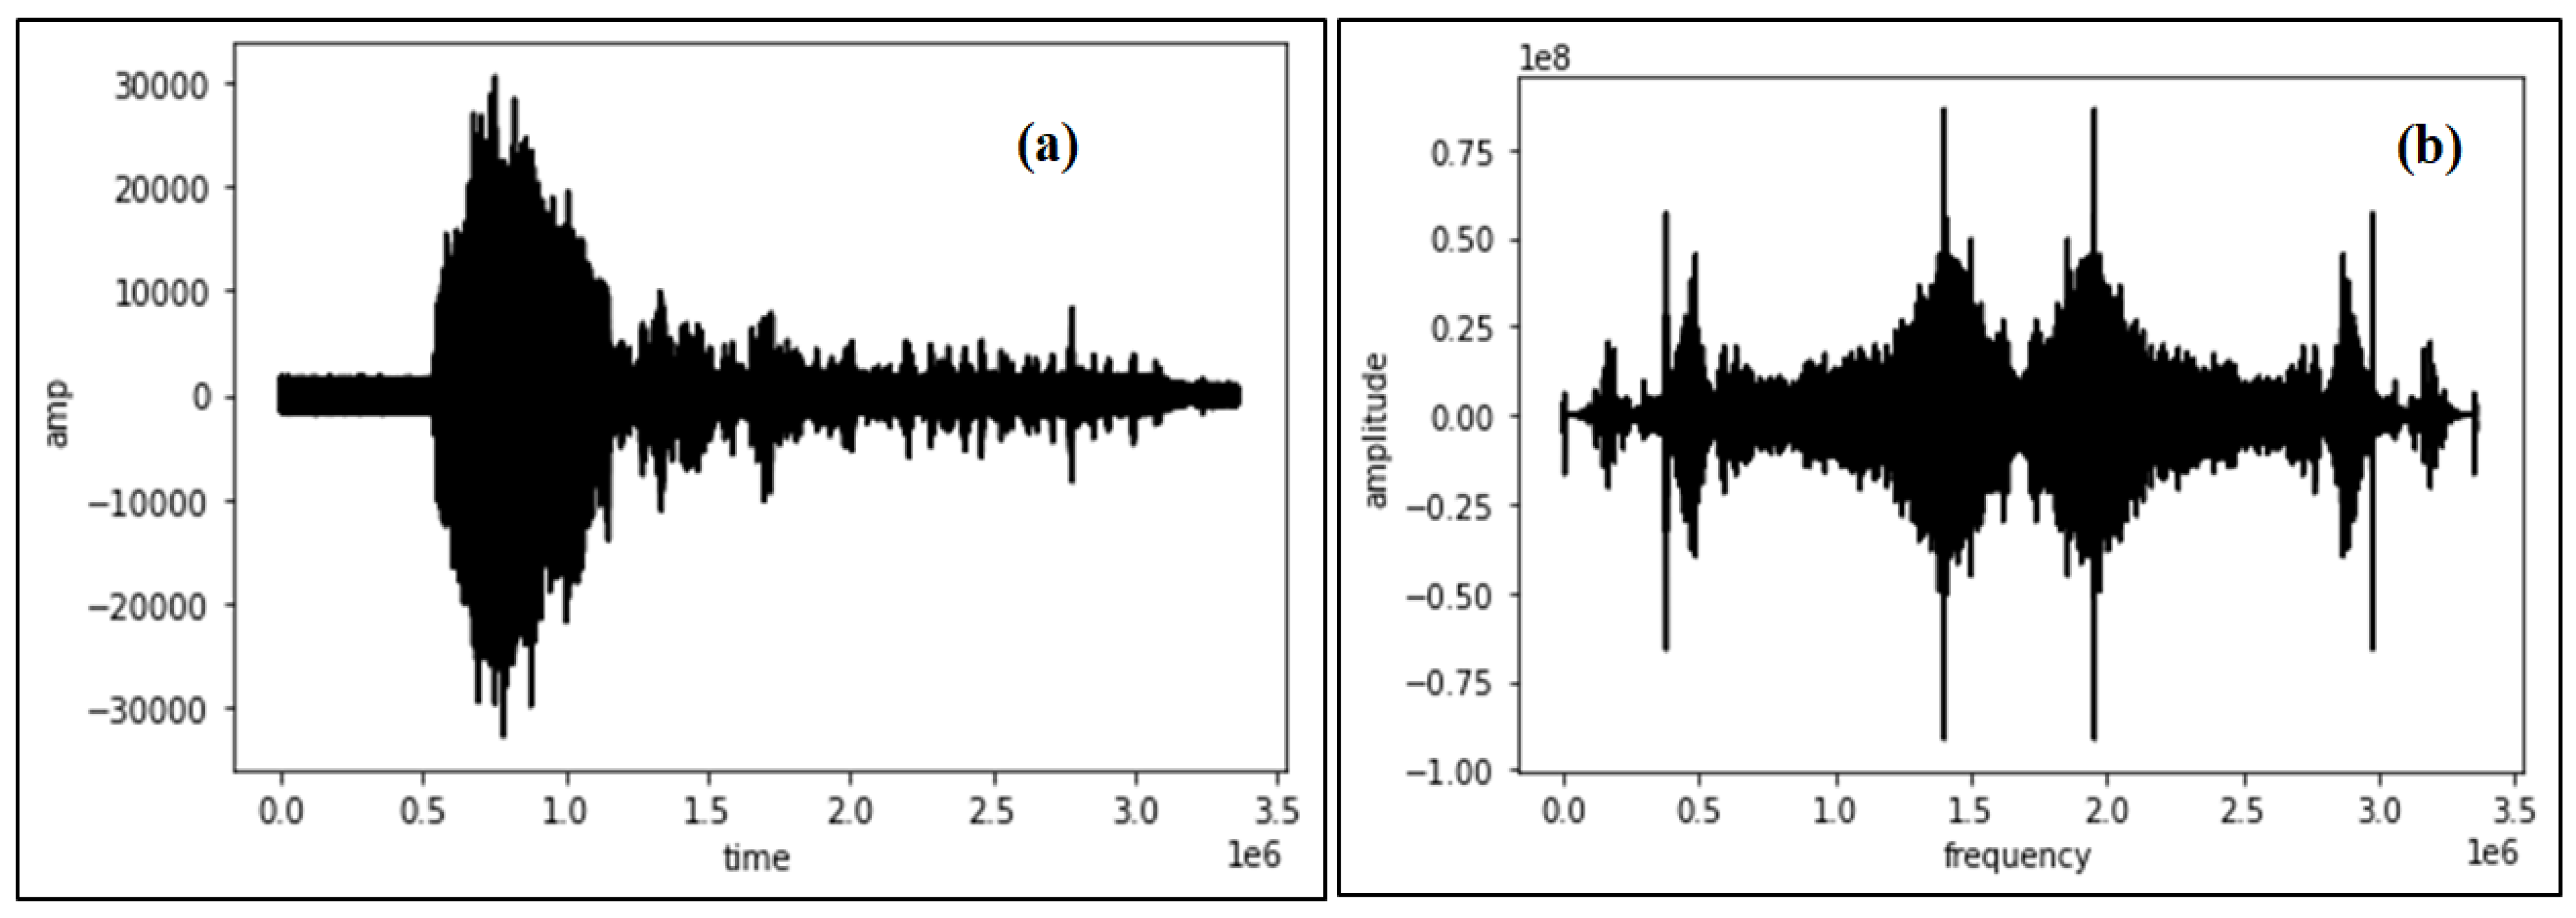
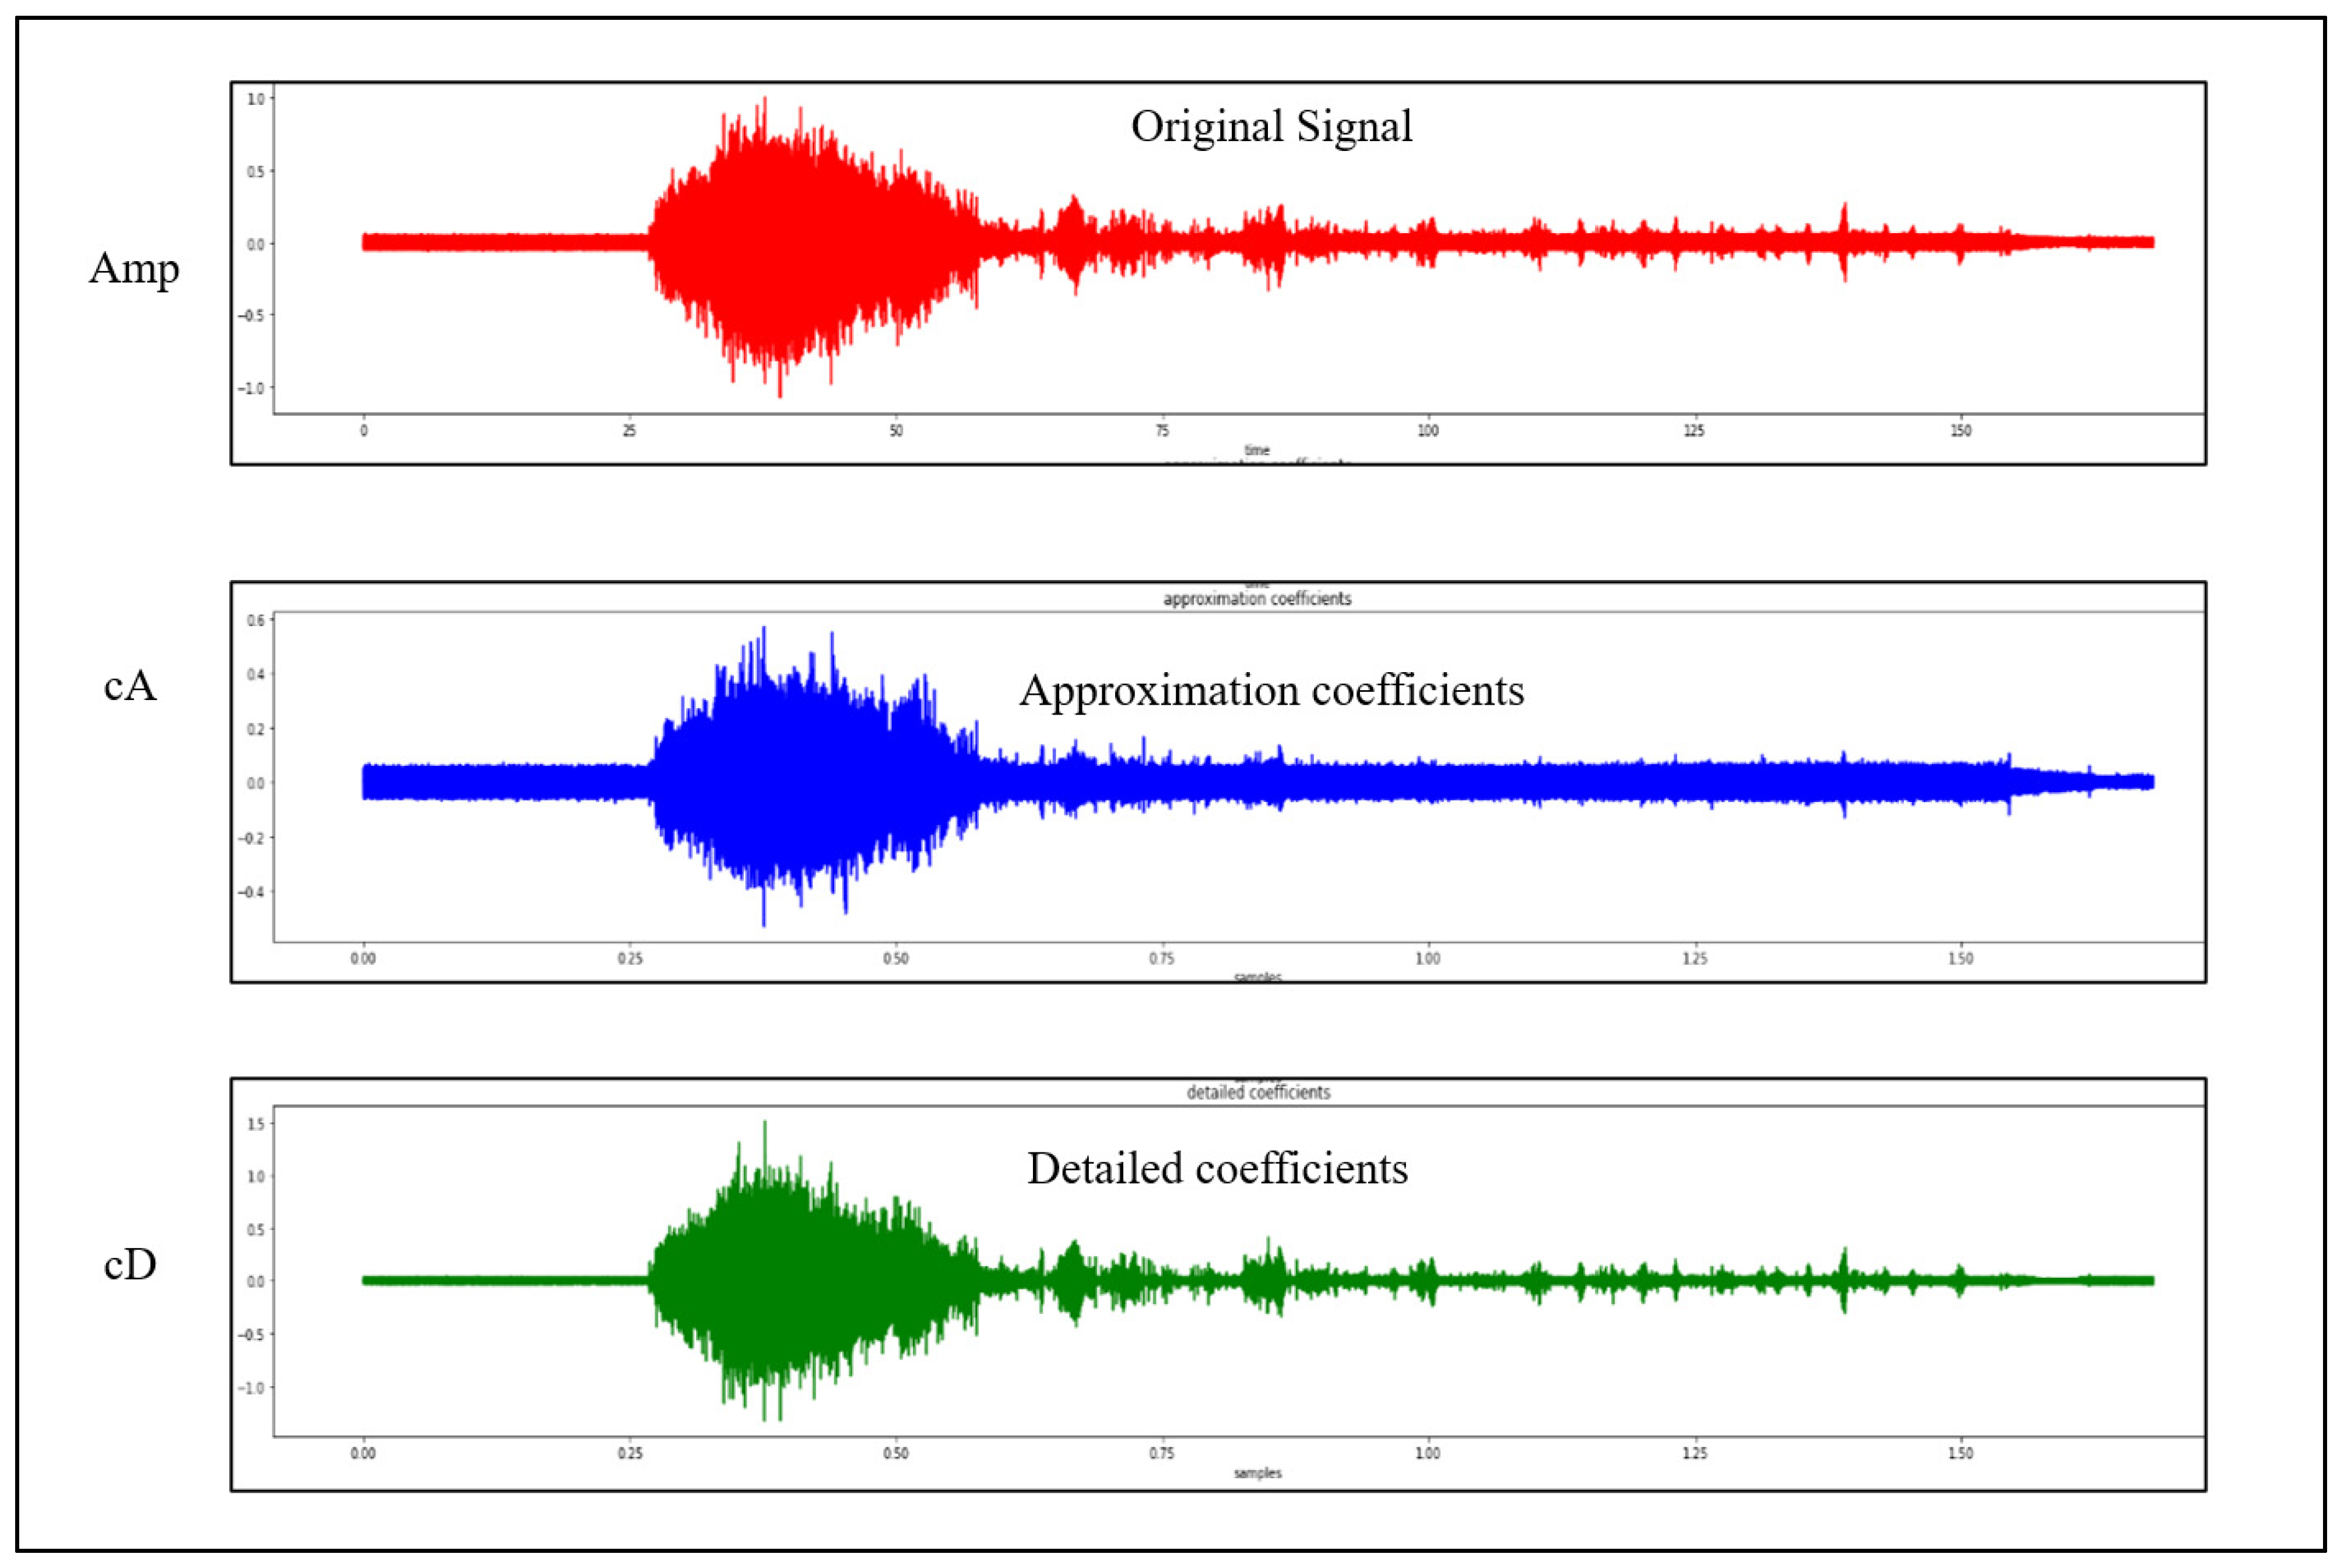
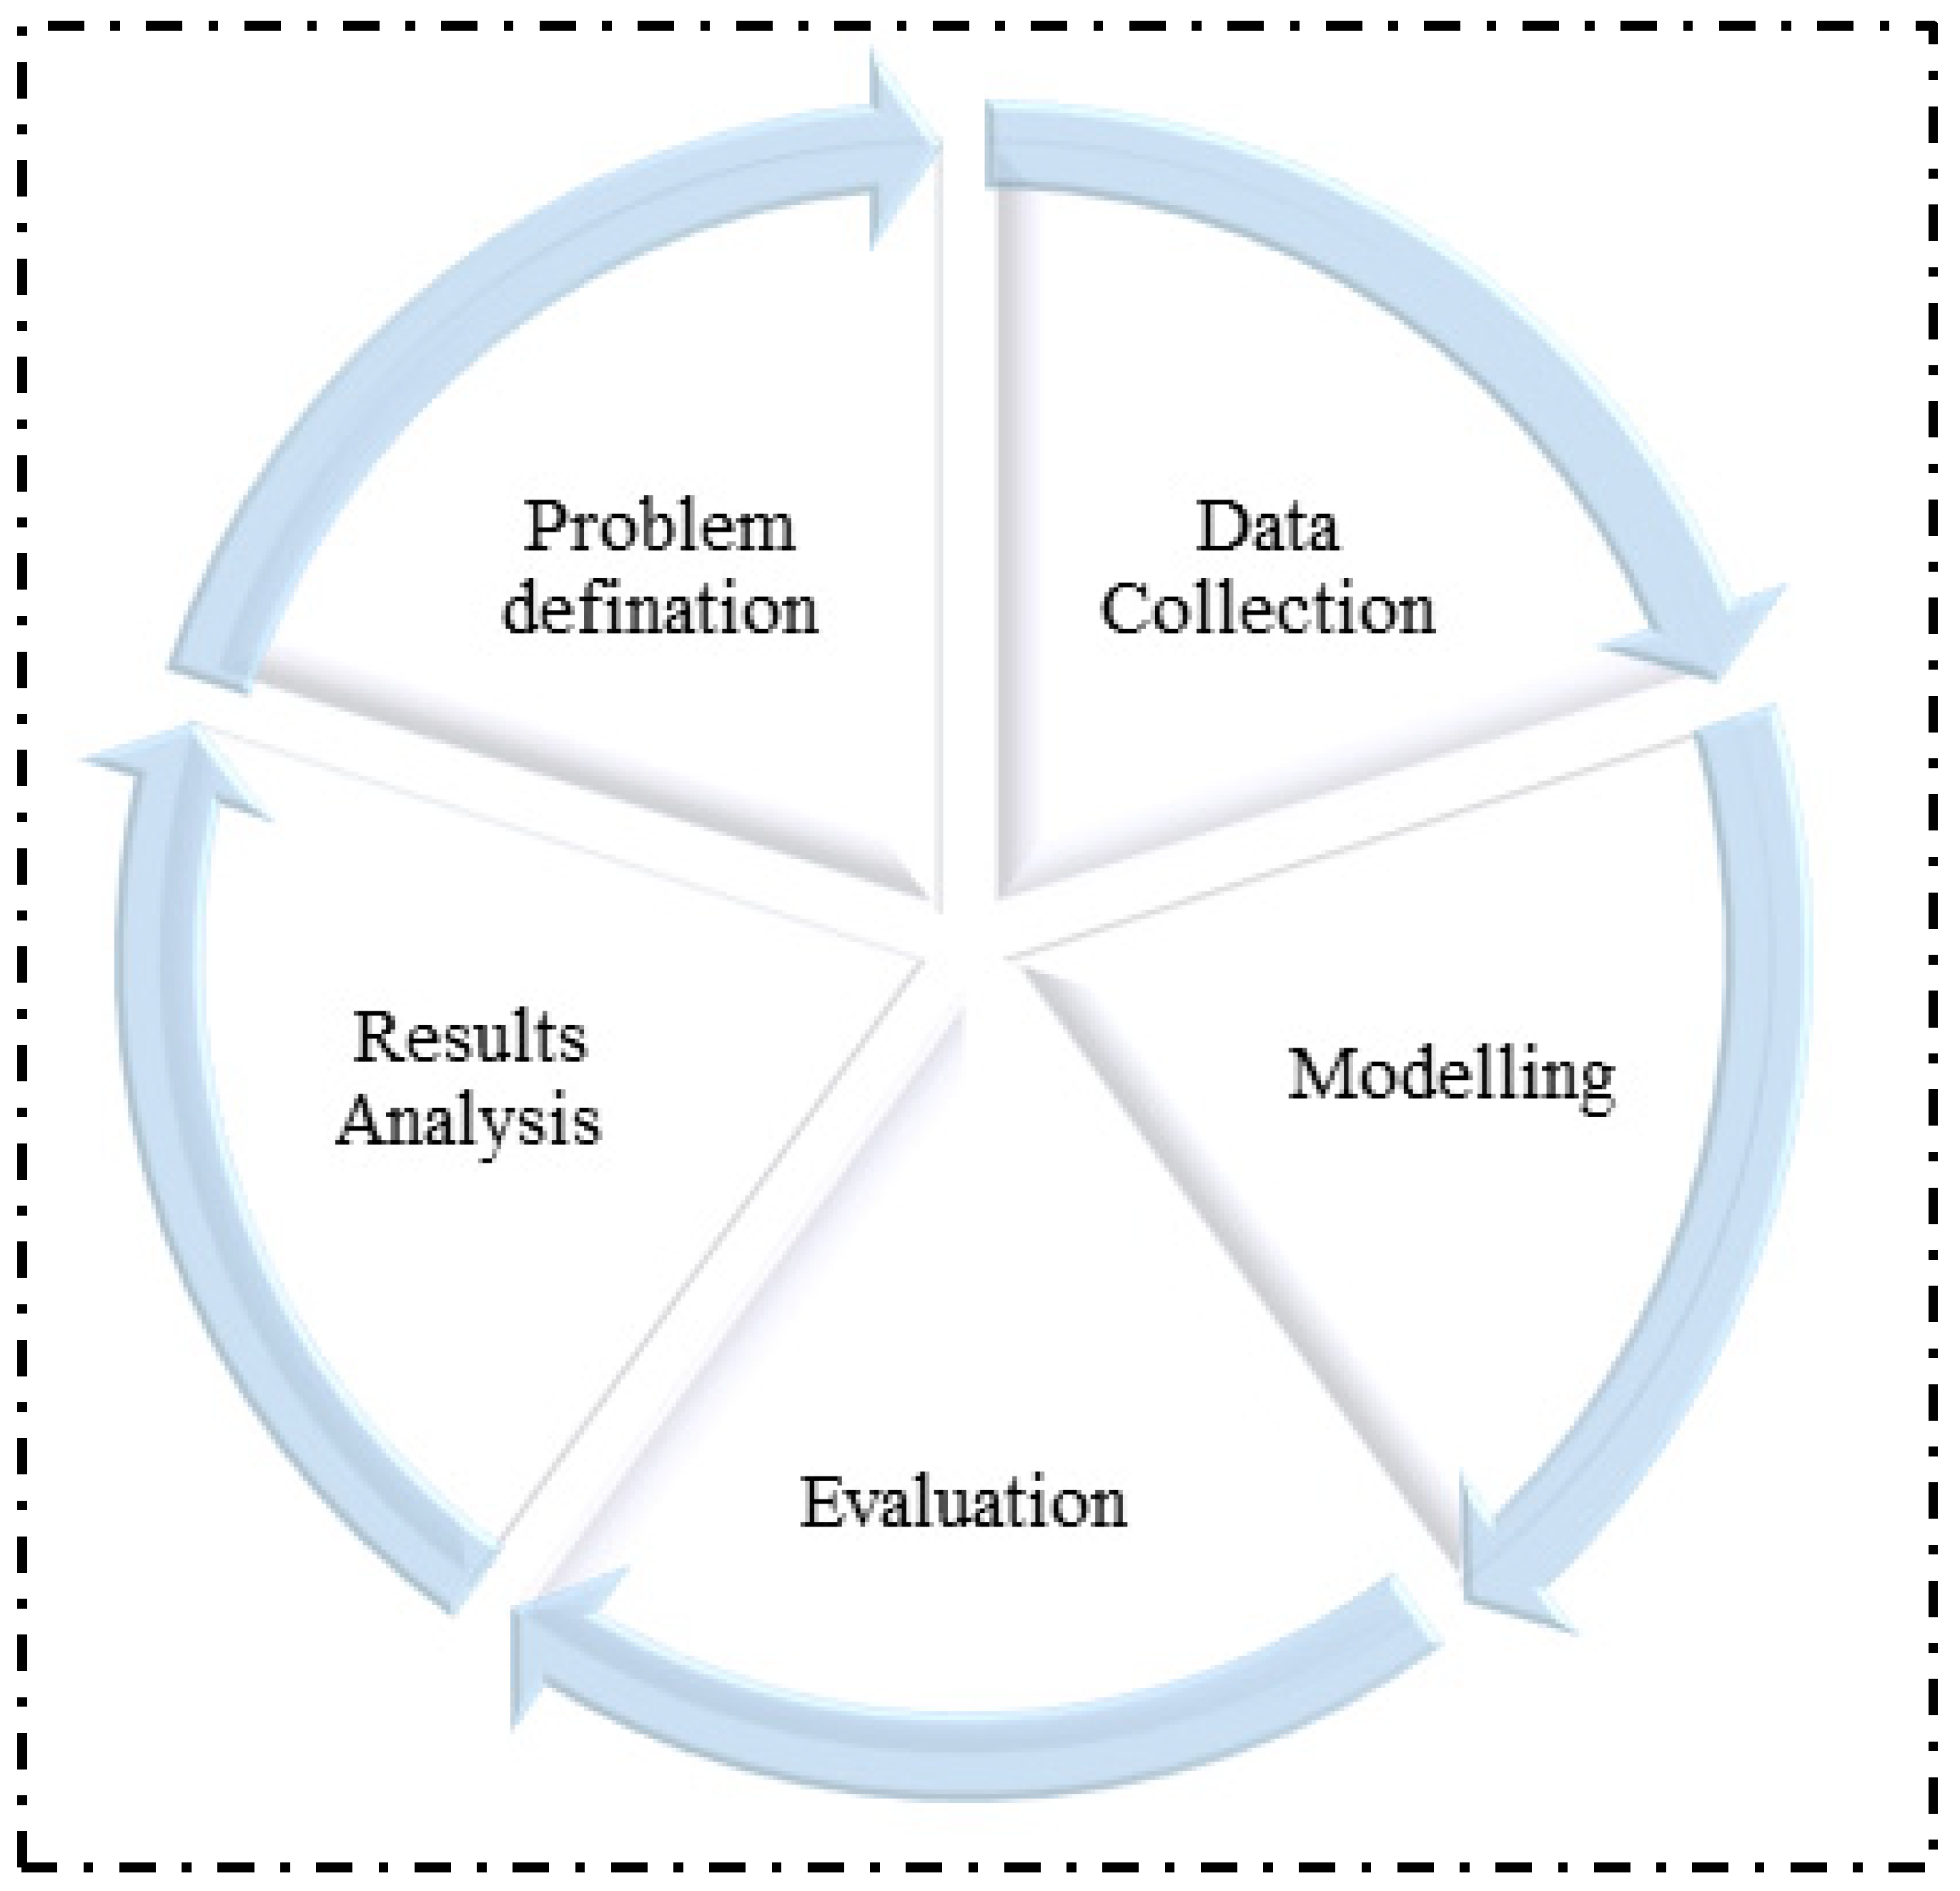
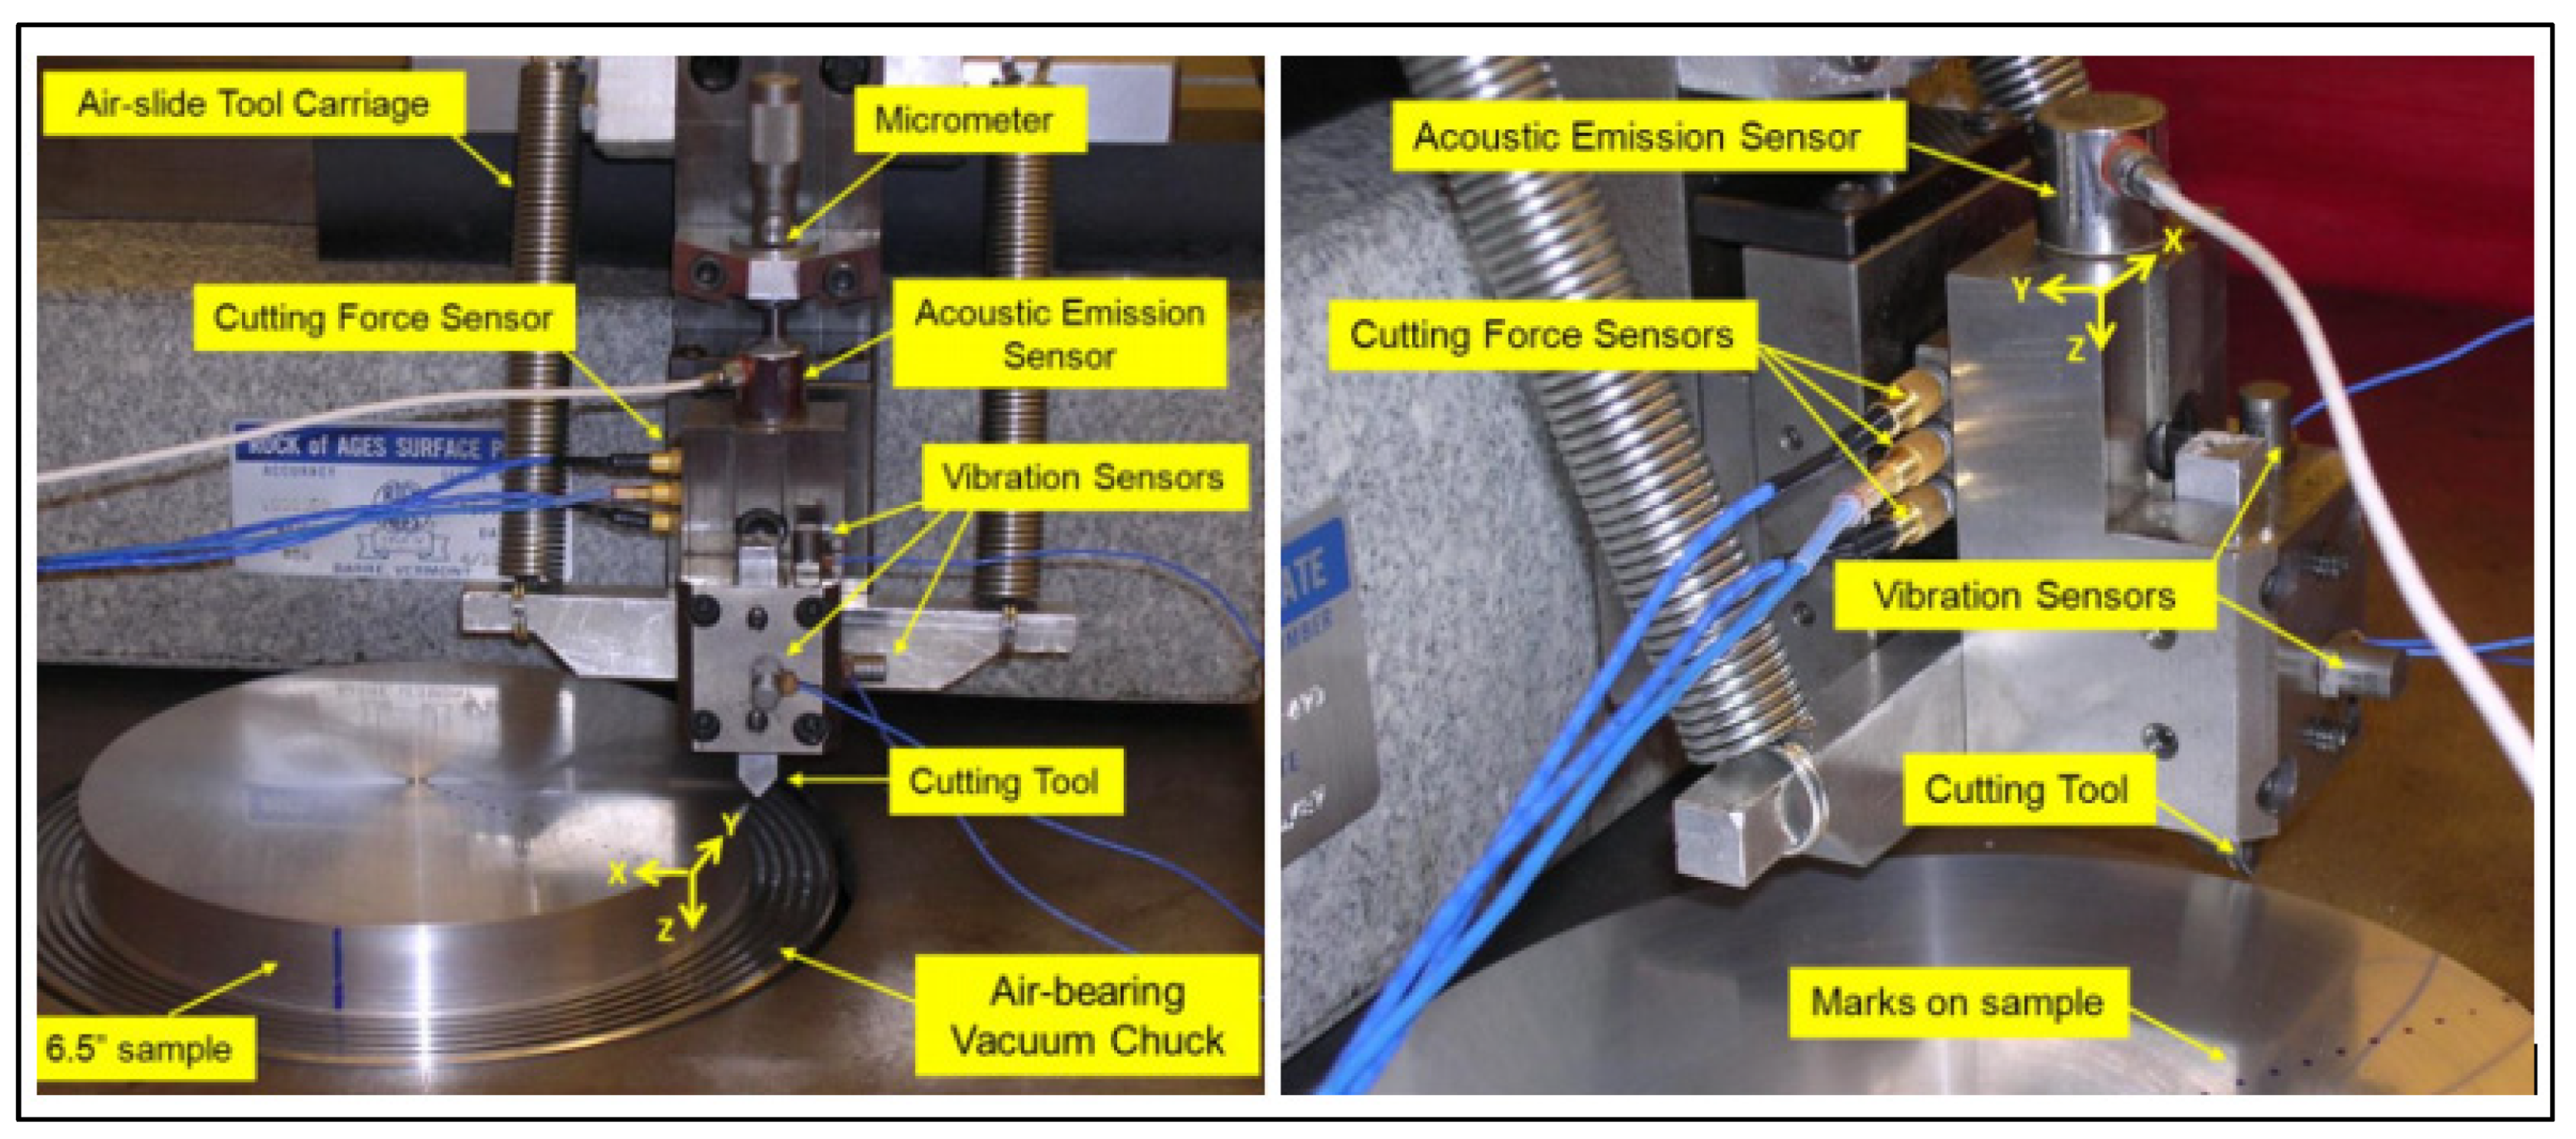
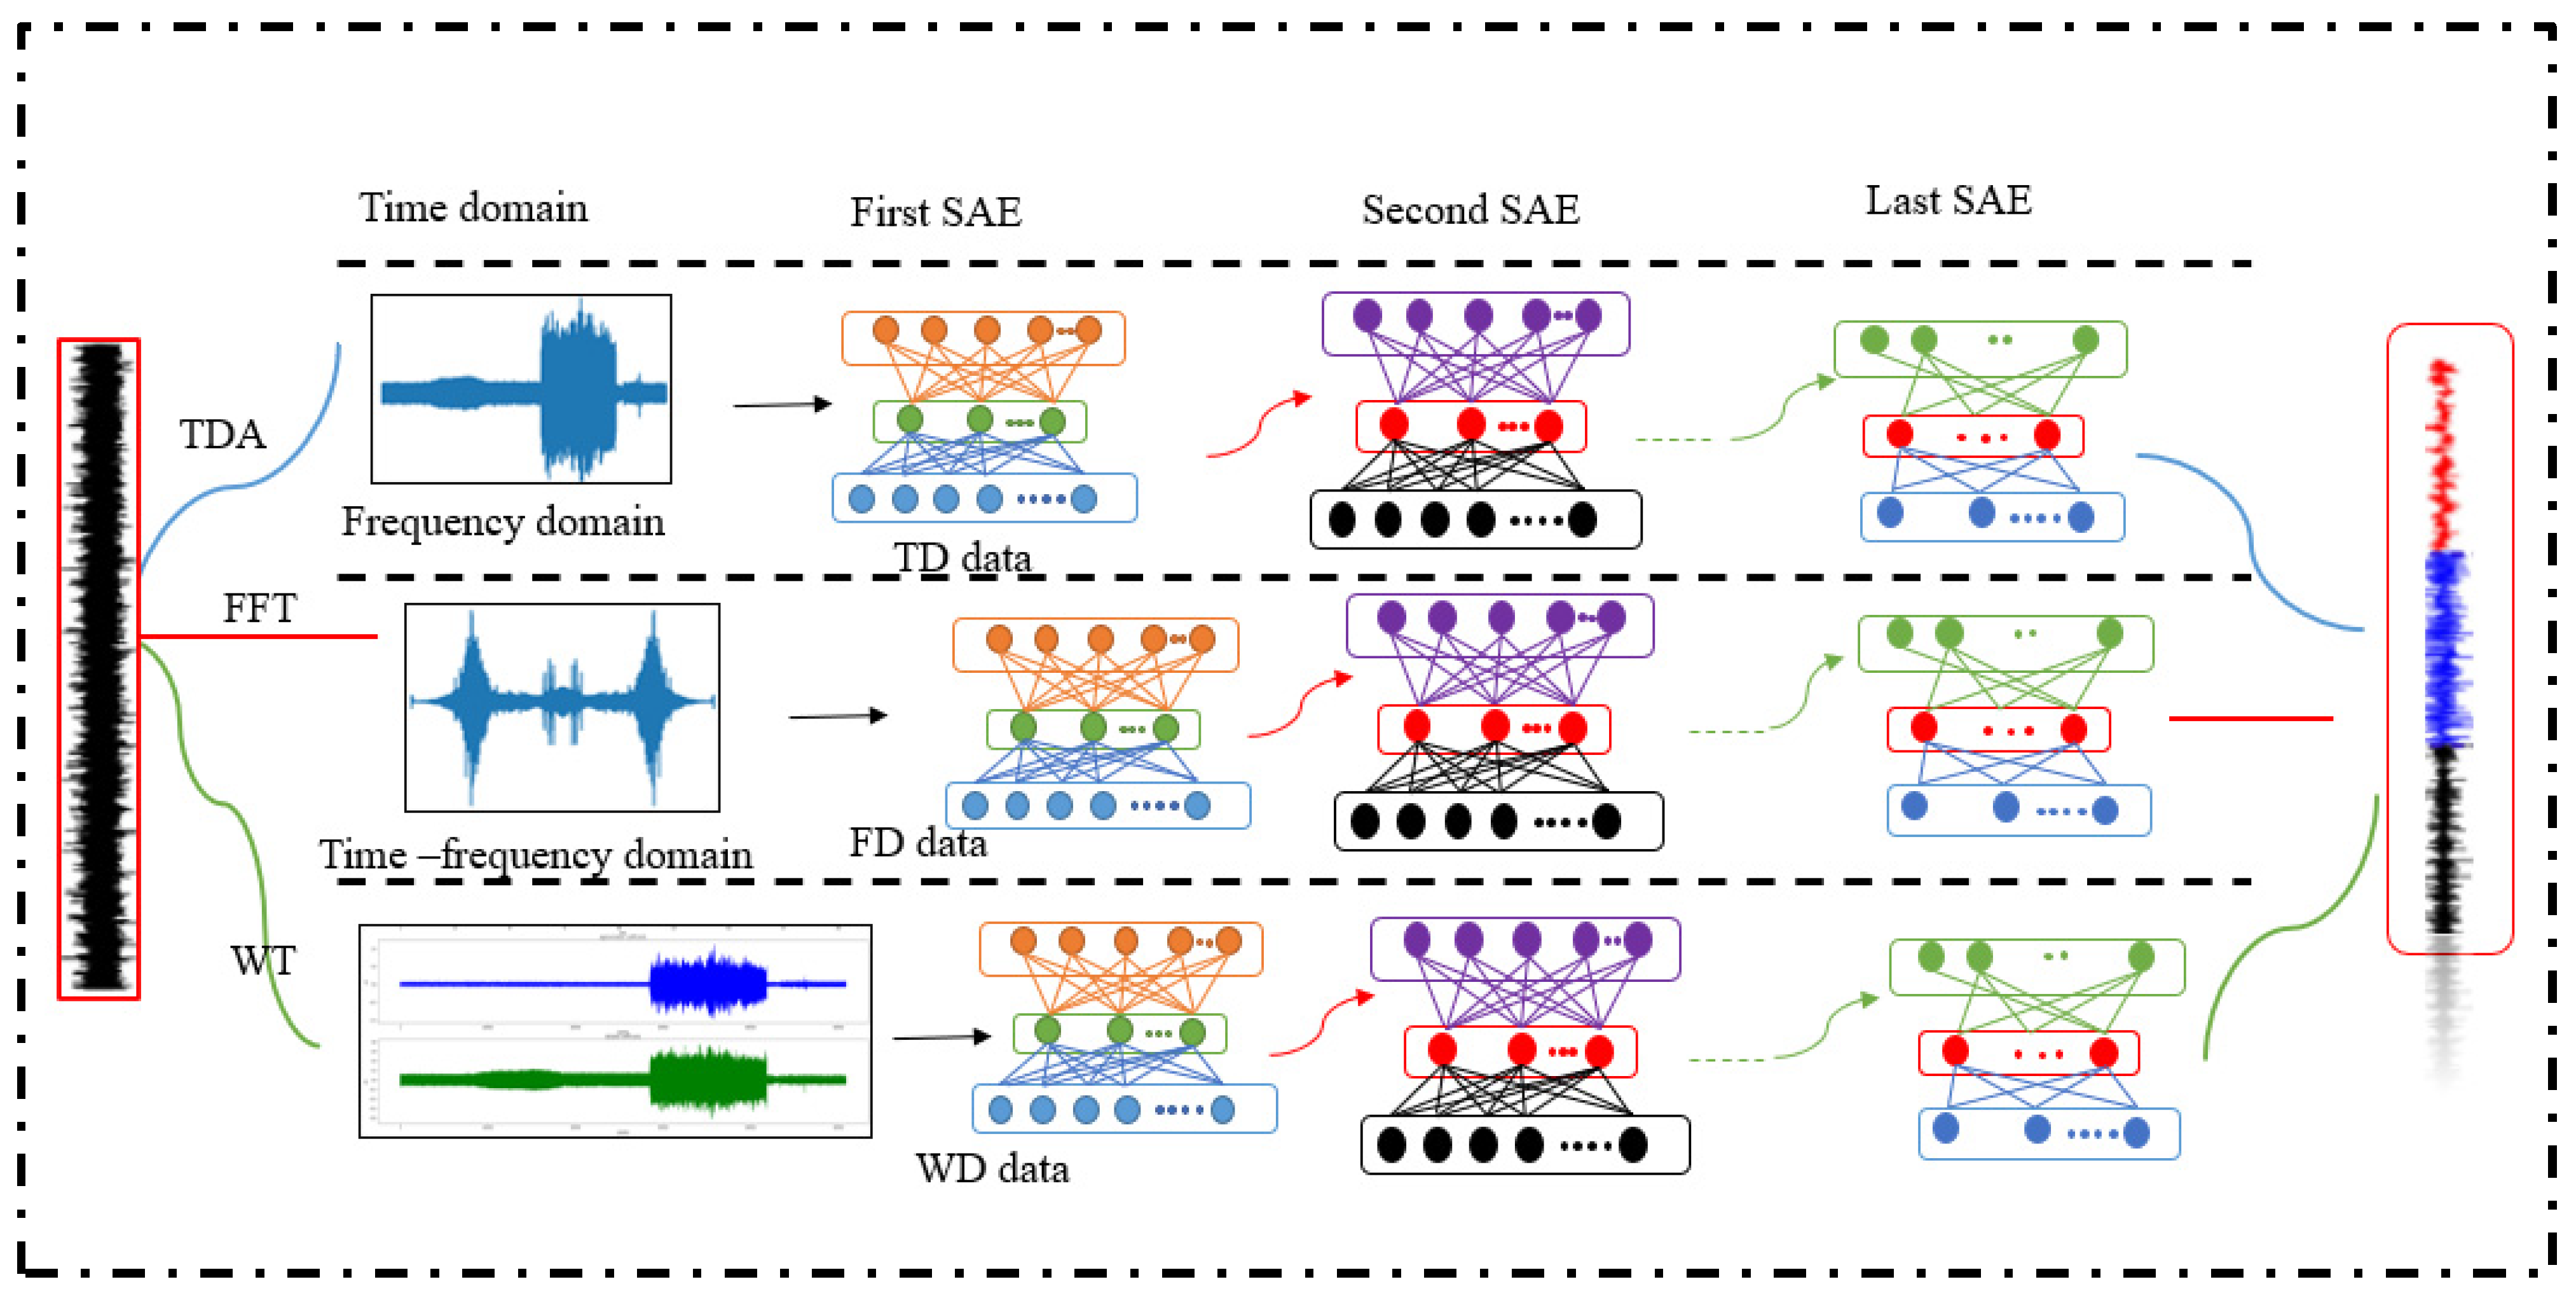
Table 1.
Different mechanisms of tool wear in diamond turning [42].
Table 1.
Different mechanisms of tool wear in diamond turning [42].
| Nature | Mechanism | Feature |
|---|---|---|
| Mechanical wear | Friction Fatigue Adhesion | Abrasive wear Tribo-chemical wear Chipping, cracking, fracture Adhesive wear |
| Chemical wear | Chemical reactivity Graphitization Amorphization Diffusionation | Complex, like SiC sp3, sp2, sp Diamond-like particles |
| Physical wear | Thermal properties Electricity Crystal orientation Defects | Thermo-chemical wear Tribo-electric wear Anisotropy Impurity |
Table 2.
Overview of signal processing techniques used for surface roughness monitoring.
| Signal Processing Method | Sources | Key Findings | Reference |
|---|---|---|---|
| Time domain analysis | Fx, Fy, Fz ax, ay, az AE, v, f, d | Average prediction relative error of 6 µm was obtained for real deviation of −20 to + 20 µm, maximum mean relative error is 25%. | Azouzi and Guillot [62] |
| Fx, Fy, Fz V, f P, Ks, t | Shear forces are characterized by their mean using regression and Neural networks with RSEM around 2.1–5.9% | Ozel et al. [71] | |
| ax, ay, az v, f, d | R2 value of 93.2% and average percentage error in prediction is only 4.27%, and maximum error is 6.05% | Upadhyay et al. [72] | |
| Ax v, f, d | The maximum error observed was is 22.93% along that they specified that the accelerometer sensor could be sufficient for surface finish prediction. | Risbood et al. [64] | |
| ax, az v, f, d | Estimated surface roughness parameters Ra and Rt with a correlation of 99.9% for Ra and 96.4% for Rt | Hessainia et al. [63] | |
| az, v, f | Average precision of 95% was obtained using predictive models based on fuzzy logic. | Kibry and Chen [65] | |
| Frequency domain | ax, ay, az AE, | R2 value of 96.8% and average percentage error in prediction is 8.36% | Plaza et al. [67] |
| Fx, Fy, Fz | Titanium causes the different levels of material swelling, and there is occurs of twin peaks, which causes secondary swelling. A new damping model for surface roughness prediction was developed. | Yip and Suet [73] | |
| Time-Frequency domain | Fx, Fy, Fz (Fx + Fy + Fz) | Daubechies 06 mother wavelet obtained the best results. Fx, Fz provides the most information in real-time monitoring of surface finish with reliability of 88.67% and a response time of 24 ms. | Plaza et al. [70] |
| ax, ay, az (ax + ay + az) | Biorthogonal 4.4. exhibiting the best behavior mother wavelet. Fusion of the three orthogonal vibration components (ax + ay + az) provided the best results for predicting the parameter Ra with reliability of 93.33%. | Plaza et al. [74] |
Table 3.
Monitoring of surface roughness in UPM.
| Sensors Used | Technique | Key Findings | Reference |
|---|---|---|---|
| Thermometry-type in process sensor | Temperature change detection | Minimizing the thermal deformation in aerostatic bearings of UPM machine by temperature monitoring adaptively adjusting the output temperature. | Yoshioka et al. [83] |
| Strain gauge sensor | Wheatstone bridge formation for detection of anomalies. | The recorded heat flux pattern has been recorded from the machine under chatter vibrations, confirming the possibility of monitoring of machining status. | Shinno et al. [84] |
| Acoustic emission (AE) | Surface topography detection | Investigated material anisotropy ahead of tool indicated material irregularities causes significant deterioration of surface roughness. | Lee et al. [85] |
| Acoustic Emission (AE) | Acoustic emission change | AE is best suitable for applications with suited for applications where subtle changes, such as surface roughness at nanoscale. | Dornfeld et al. [81] |
| Piezoelectric transducer | Taylors theory of plasticity | Crystallographic orientation will greatly affect the cutting forces (Cutting forces and Thrust forces), surface roughness at lower depth of cuts. | Lee et al. [54] |
| Accelerometer | Correlations of frequency spectrum | Surface finish lobes were developed, and they have demonstrated the waviness patterns are distinct from feed patterns. Waviness errors that occurred from tool, and workpiece vibration are found to be a significant cause of surface inaccuracies. | Meyer et al. [49] |
| Miniature platinum resistance thermometry sensor | Electrode coupled with integrated PID feed back | Micro sensor mounted on back of rake face will minimize the excessive temperature around the tool-tip by adjusting the cutting speed. | Hayashi et al. [86] |
| Micro thermo sensor and AE | Status monitoring systems | Developed monitoring systems that recognize status based on correlation coefficients. Suggested that thermal and acoustic sensors, due to mutual compensation of characteristics, provide a wide range of machining statuses. | Yoshioka et al. [87] |
| Vibration (Vx, Vy, Vz) Force (Fx, Fy, Fz) AE | Recurrent Predictor Neural Networks -Bayesian particle filter (RPNN-PF) | Among all feed vibration sensor was found to be most sensitive to surface roughness, change process dynamics are detected within 15 ms with an uncertainty of ±2.5%. | Rao et al. [88] |
| Force signal and vibration signal | Gaussian process regression | Features extracted from both signals have estimation accuracy of 80% success in real-time monitoring of surface roughness. | Cheng et al. [80] |
| Cutting Forces and Radial Forces | Standard deviation of magnitude on decomposed force signals | Cutting and radial forces are analyzed using db3 wavelet, standard deviation found correlation with flank wear. No crater wear was observed at tool rake region until 9 kms cutting distance. | Wang et al. [89] |
Table 4.
Surface roughness prediction using machine learning.
| Algorithm | Input Parameters | Key Findings | Reference |
|---|---|---|---|
| Regression | Cutting Parameters (Speed, Feed, Doc, Tool wear) statistical features of vibrational signals | RSME of roughness is 0.354069, R2 value of 74.9% | Elangovan et al. [91] |
| Varying machining parameters (cutting speed, feed, depth of cut) | Influence of various factors on surface roughness is as follows feed rate cutting depth, and the cutting speed has the minimum effect on the surface roughness. | Yang et al. [92] | |
| Artificial neural network (ANN) | Varying machining parameters (cutting speed, feed, depth of cut) | ANN has shown a less error in the prediction of surface roughness for contact lens is 18.28%. whereas the response surface error rate has been 23.29% | Liman et al. [93] |
| Vibrations Signals Surface roughness prediction in turning | The R2 for the predicted surface roughness values, is found to be 65.12%. | Kohli et al. [94] | |
| Varying cutting parameters finished end milling | The error in the models are 6.1%, 6.87%, 9.66%, and 8.55% for Ra, Rt, Rz (avgerage maximum height of profile)and Rq (root mean square roughness), respectively. | Adesta et al. [95] | |
| ANN-GA | Varying the machining parameters while machining Ti-6Al-4V alloy | The network model with 3-4-1 is suited a lot better with MAPE in the predictive model is around 4.13%. | Sangwan et al. [96] |
| Experiments based on less cutting fluid application AISI H13 tool steel. | MSE is very less which is 0.008 R2 be 0.95962 having a standard error of 0.0950 With ANNs error percentage of <7% is possible. | Beatrice et al. [97] | |
| LS-SVM | Varying these parameters (tool nose radius, feed rate, depth of cut, C-axis speed, and discretization angle) | R2, eR, and eM of LS-SVM model are 0.99887, 10.68%, and 8.96%, respectively. | Wang et al. [98] |
| Vibration Signals based on Singular spectrum analysis | Mean error of lowest cutting speed was 6.52%, whereas for higher, the mean error is around 4.77%. The interesting observation made are Computing time for this process is 0.97 s. | Salgado et al. [99] | |
| IFSVR | Acoustic emission Grinding force Vibration | Accuracy for surface roughness is 75.93%. Online monitoring was much better when the Ra had reverse variation. | Zhang et al. [100] |
| Regression SVM BNN | Varying the machining parameters in finish milling | In case of NN, the error is below 8%.Where the superior performance is shown by the BNN model with the error of 6.1% only. | Lela et al. [101] |
| SVR ANN | Varying machining parameters (Cutting speed, depth of cut, feed rate) | SVR showed best performance in finding the Tool life 93.63%, 93.15% (tool life with ANNs). | Jurkovic et al. [102] |
| SVR DT, RF, AdaBoost ANN | Varying the machining parameters (Nose radius, feed, velocity of cut, doc) | ANN model has shown very good results where Ra predictions using ANN are RMSE of 0.525, 2.664 and R2 of 0.981, 0.998 for Ge and Cu. | Sizemore et al. [103] |
| SVM k-NN, DT, RF | Mapping features in vibration signals | SVM classifier is compared with the best configuration this has an accuracy of 81.25%, whereas for k-NN, DT, RF, it is 68.75% and 71.875% and 71.875%, respectively. | Abu-Mahfouz et al. [104] |
| Extreme Learning | RSM-generated experiment design | Taking the time complexity, the ANN for this model took 8 s to learn the model, whereas ELM requires 0.008 s which is computationally very less. | Ahmad et al. [105] |
Publisher’s Note: MDPI stays neutral with regard to jurisdictional claims in published maps and institutional affiliations. |
© 2021 by the authors. Licensee MDPI, Basel, Switzerland. This article is an open access article distributed under the terms and conditions of the Creative Commons Attribution (CC BY) license (https://creativecommons.org/licenses/by/4.0/).
Share and Cite
MDPI and ACS Style
Manjunath, K.; Tewary, S.; Khatri, N.; Cheng, K. Monitoring and Predicting the Surface Generation and Surface Roughness in Ultraprecision Machining: A Critical Review. Machines 2021, 9, 369. https://doi.org/10.3390/machines9120369
AMA Style
Manjunath K, Tewary S, Khatri N, Cheng K. Monitoring and Predicting the Surface Generation and Surface Roughness in Ultraprecision Machining: A Critical Review. Machines. 2021; 9(12):369. https://doi.org/10.3390/machines9120369
Chicago/Turabian StyleManjunath, K, Suman Tewary, Neha Khatri, and Kai Cheng. 2021. "Monitoring and Predicting the Surface Generation and Surface Roughness in Ultraprecision Machining: A Critical Review" Machines 9, no. 12: 369. https://doi.org/10.3390/machines9120369
Note that from the first issue of 2016, this journal uses article numbers instead of page numbers. See further details here.