

Analysis of E-Scooter Vibrations from Health Perspective: A Case Study
by
 , and
, and
Juan David Cano-Moreno
1,
José María Cabanellas Becerra
2,
José Manuel Arenas Reina
1,* and
Manuel Enrique Islán Marcos
1 1
Escuela Técnica Superior de Ingeniería y Diseño Industrial, Universidad Politécnica de Madrid, 28012 Madrid, Spain
2
Escuela Técnica Superior de Ingenieros Industriales, Universidad Politécnica de Madrid, 28006 Madrid, Spain
*
Author to whom correspondence should be addressed.
Machines 2023, 11(7), 761; https://doi.org/10.3390/machines11070761
Submission received: 25 June 2023
/
Revised: 13 July 2023
/
Accepted: 19 July 2023
/
Published: 21 July 2023
(This article belongs to the Special Issue Modeling, Estimation, Control, and Decision for Human-Vehicle Systems)
Abstract
:The impact of vibrations on health in occupational environments has been extensively studied. Although the effects of vehicle vibrations on driving comfort has been investigated, the literature on the impact of vehicle vibrations on health is scarce. Accordingly, this study aimed to investigate the influence of e-scooter vibrations on driver health by considering both whole-body vibrations (WBVs) and hand–arm vibrations (HAVs). From the perspective of health, vibration zones were defined based on the UNE-2631 and UNE-5349 standards, as well as the European Vibration Directive. Real measurements obtained from an e-scooter acceleration database were used. The results of the study on WBVs show that, on average, 87.54% and 95.47% of non-desirable vibrations are caused by driving an e-scooter on pavers and asphalt, respectively. This shows that ‘potentially non-healthy’ and ‘non-healthy’ vibrations are 25.69% and 61.85%, respectively, when driving on pavers and 85.52% and 12.96%, respectively, when driving on asphalt. Therefore, the WBV levels reached by driving an e-scooter on any pavement could potentially harm health. However, the influence of HAV on the incidence of Raynaud’s syndrome is low. The study results on WBV suggest that future e-scooter designs must be based on a more damped road–driver interface.
1. Introduction
The impact of vibrations on health in occupational environments has been extensively studied. The progress of vibration-induced health conditions is gradual, typically starting with pain. As vibration exposure continues, pain can develop into an injury or illness. Pain is the first health condition to be resolved to prevent injuries. Savage et al. [1] reviewed whole-body vibrations (WBVs) and their effects on occupational physical performance. Krajnak [2] studied the influence of WBVs and hand–arm vibrations (HAVs) resulting from occupational exposure on health. In 2002, the European Union adopted a vibration directive [3] to define the minimum health and safety requirements for workers exposed to vibrations. Based on existing standards, this directive introduced exposure action and limit values for HAVs [4] and WBVs [5]. The UNE-5349 standard’s definition of HAV has been used in several studies [6,7,8,9]. Deboli et al. [6] analysed the vibrational impact of three handheld olive beaters and obtained values similar to those of industrial tools. Nilsson et al. [7] conducted a systematic review of HAVs with regard to Raynaud’s syndrome. The UNE-2631 standard’s definition of WBVs has been used to analyse the impact of vibration on riding comfort and health. Riding comfort has been analysed in vehicles such as cars [10], trucks [11], motorcycles [12], bicycles [13], and, in recent years, e-scooters as well [14,15,16]. However, published reports on the impact of vehicle vibrations on health are extremely scarce.
Human–machine interactions (HMIs) are becoming increasingly prevalent in daily life. Although the pain and injuries resulting from vibrations have been related to occupational health, the increase in HMIs also increases the exposure to vibrations.
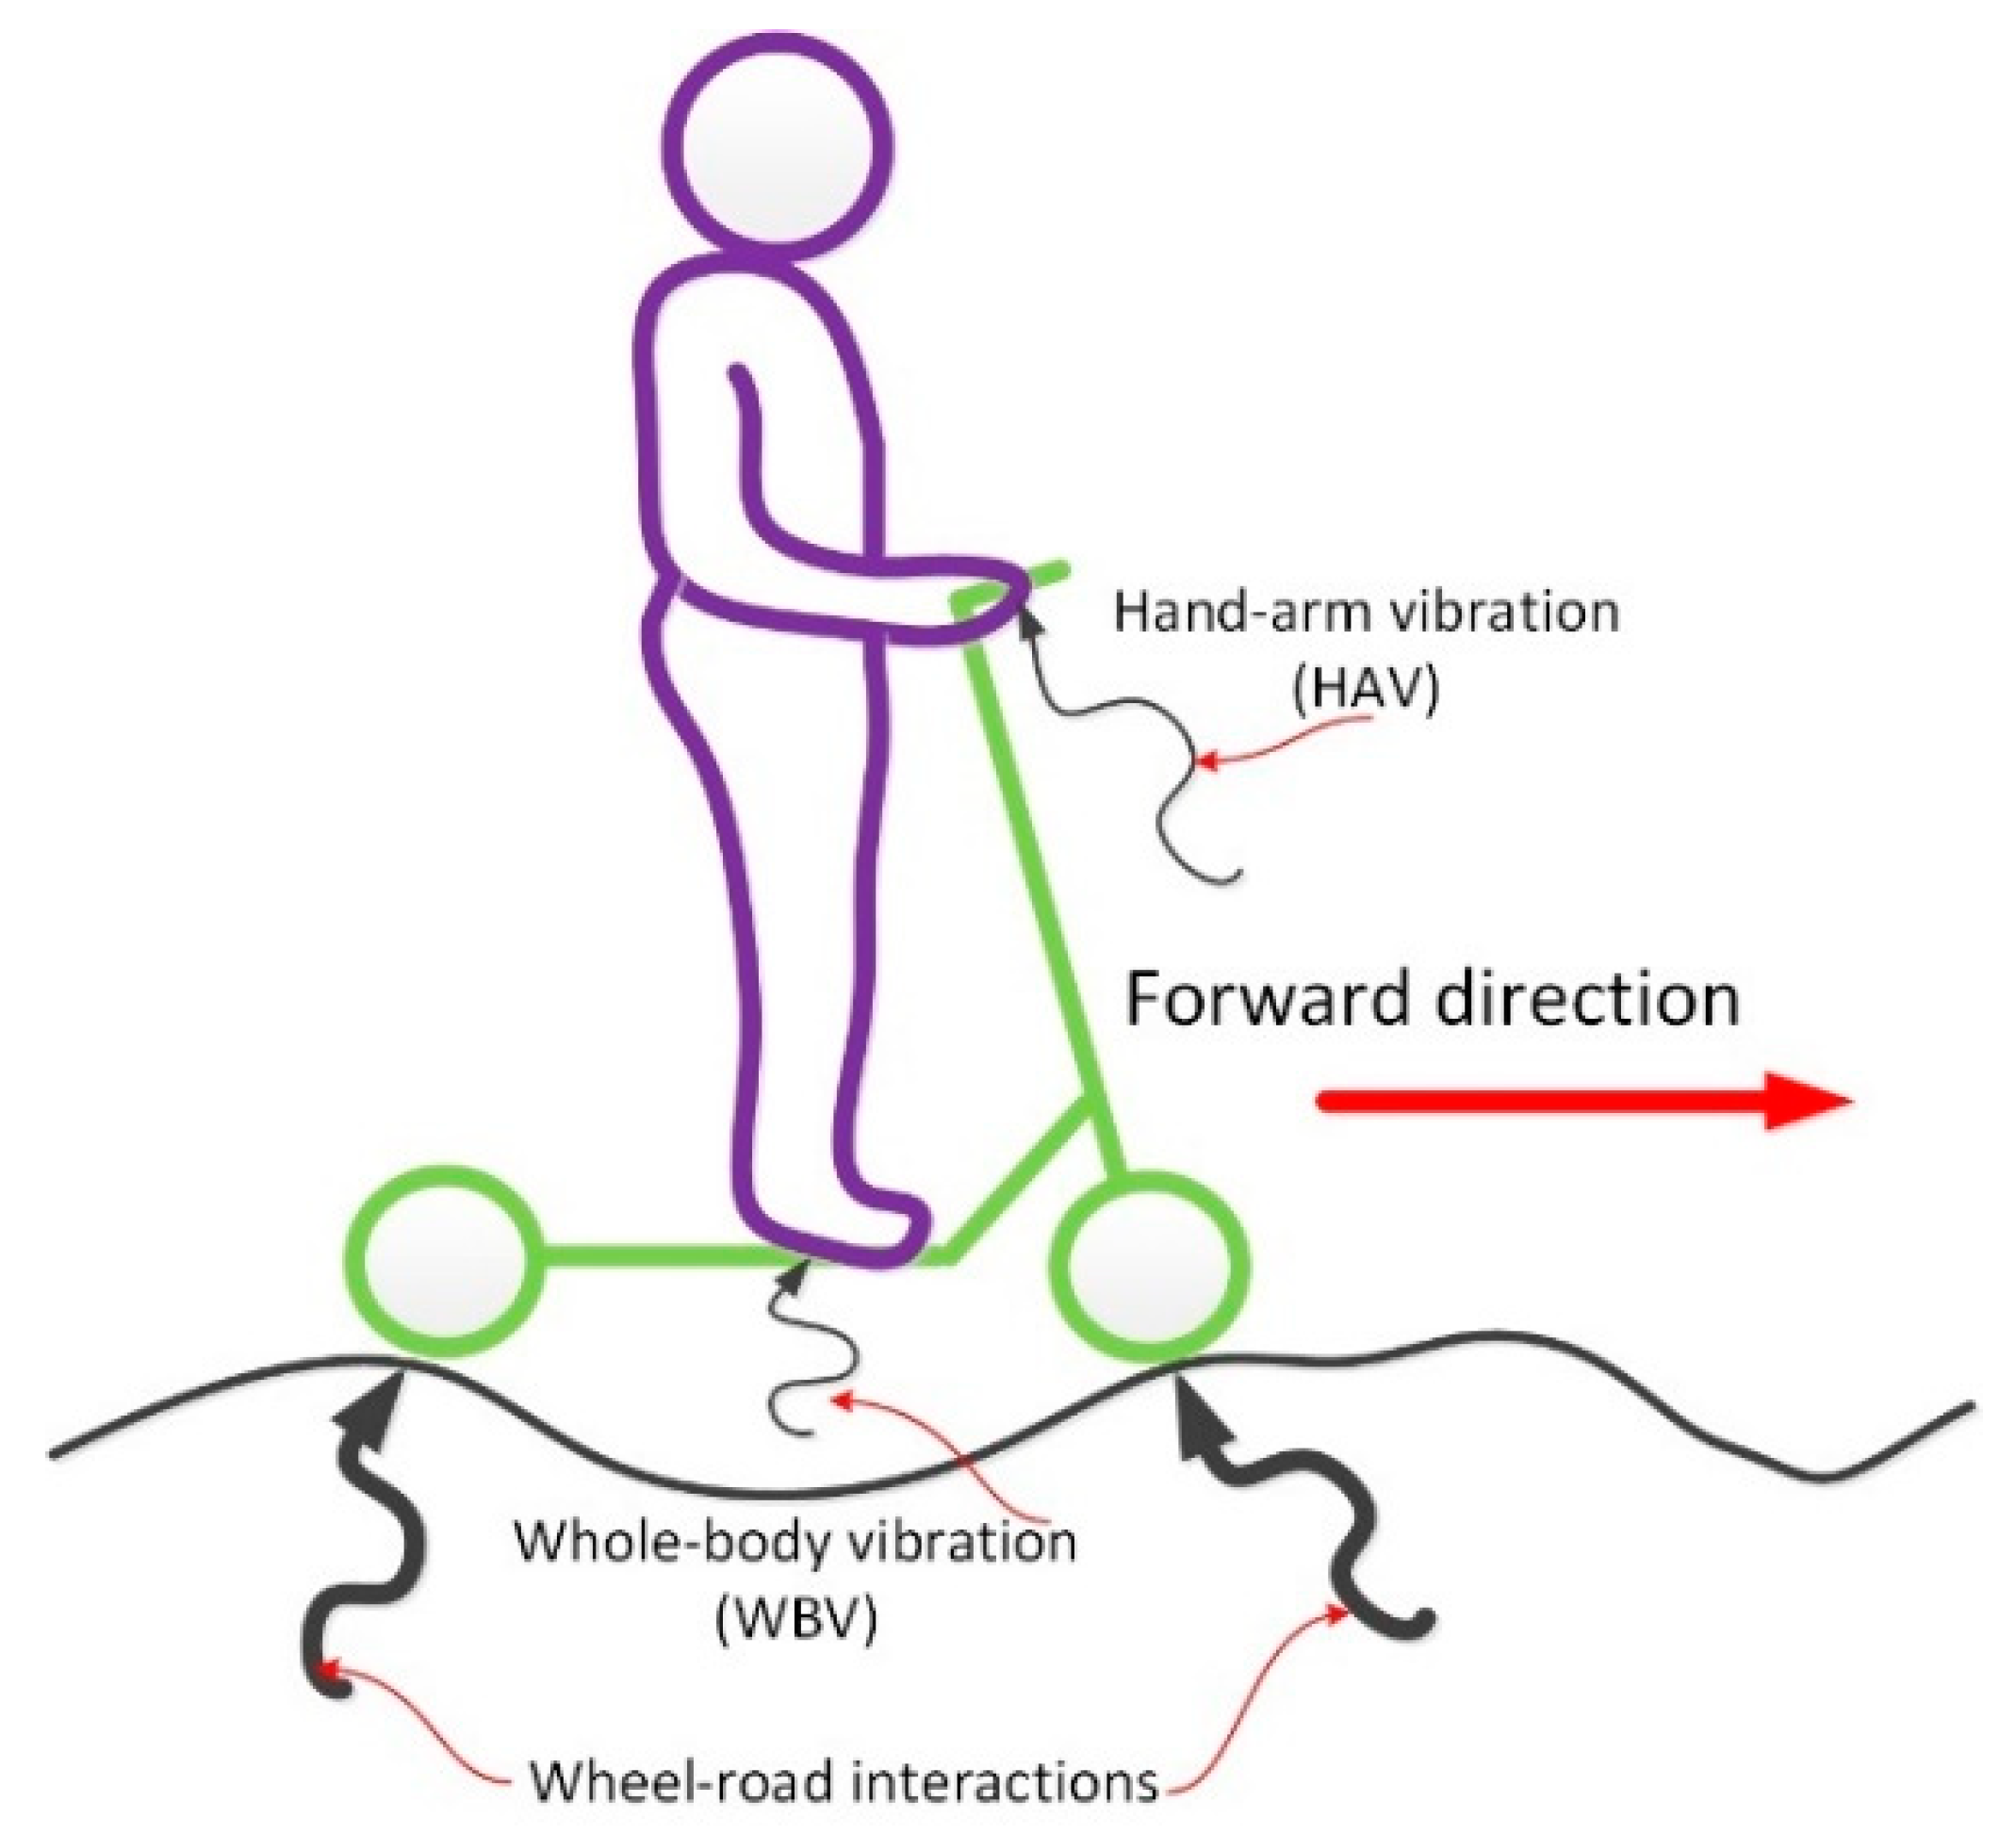
In this regard, an HMI that has continued to increase remarkably in recent years is e-scooter usage. Currently, it is a common means of transport in the quotidian life of millions of people worldwide. As shown in Figure 1, e-scooters have two main entry vibration points for riders: feet and hands.
These aspects have already been considered in occupational health. However, the reason for not applying these standards and limits to other HMIs has not been discussed.
In 2019, Cano-Moreno et al. [17] proposed and subsequently applied a methodology for studying the influence of WBVs on the riding comfort and health of e-scooter drivers. Results showed that for an AB road (very good–good), velocities of 16 and 23 km/h were the limits for comfort and health, respectively. The measured vibrations in e-scooters as reported by different authors [14,15,16] confirmed that e-scooters introduced high levels of vibrations to riders. Most studies analyse vibrations from the point of view of riding comfort. However, studies on the influence of these vibrations on health, considering their transmission through feet and hands, are lacking.
Therefore, a new line of research, in which the aim is to assess the impact of e-scooter vibrations on driver health, is developing. This work analyses the effect of accelerating WBVs and HAVs based on an existing database (https://zenodo.org/record/6977206#.ZJCz4nZByUl, accessed on 10 October 2022) containing real measurements from a widely used e-scooter model.
E-Scooter Trip Duration
To define vibration thresholds, defining vibration exposure time is necessary. In this regard, data reported in literature are used. Hao Li et al. [18] studied dockless e-scooter trips in Washington, D.C. They calculated that the e-scooter usage for two different sharing companies, in the range of 10.4–13.3 min per trip, reaching a maximum trip distance of approximately 1 km. Cornelius and Klaus [19] analysed the traffic behaviour in Germany and found an average trip distance of 10.6 km, varying from 6.4 to 19.5 km. Caspi et al. [20] found a median trip distance and duration of 0.971 km and 6.6 min, respectively, for a study focused near the University of Texas in Austin (Austin, TX, USA). Based on e-scooter trips in Chicago, Mathew et al. [21] calculated a mean duration and distance per trip of 13.86 min and 1.8 km, respectively, and an average speed of 8.78 km/h. Foissaud et al. [22] studied spatial–temporal usage in four European cities (Paris, Malaga, Bordeaux, and Hamburg) and found that the ranges of trip time and distance were 10–14 min and 2–4 km, respectively. Recently, Li et al. [23] presented a study of 30 European cities in relation to shared e-scooter usage. They found that the trip distance values were 0.91 km (Zug) and 1.79 km (Paris), and the median trip duration values were 5.67 min (Zug) and 13.77 min (Paris). Table 1 summarises these studies and their mean values of trip time and distance calculated from the available minimum and maximum values. For the study in Germany [19], the mean time was not available; however, considering that it has the longest mean distance of e-scooter usage per trip, we suppose the mean time to be higher than that reported in the rest of the studies and estimated this value by considering a longitudinal speed of 15 km/h.
2. Materials and Methods
The acceleration database of e-scooters used and the experiment conducted in this study are presented in this section. The criteria and thresholds associated with the regulations for evaluating the effects of vibrations on human health are defined. The standards used were as follows.
- The WBVs transmitted through the feet are defined according to UNE-2631 [5].
- The HAVs imparted through the hands are defined according to UNE-5349 [4].
For both studies, the root mean square (RMS) value of the frequency-weighted acceleration ( was first calculated by filtering the original accelerations [5]:
where
- is the weighted acceleration in the time domain (), and
- is the exposure duration (s).
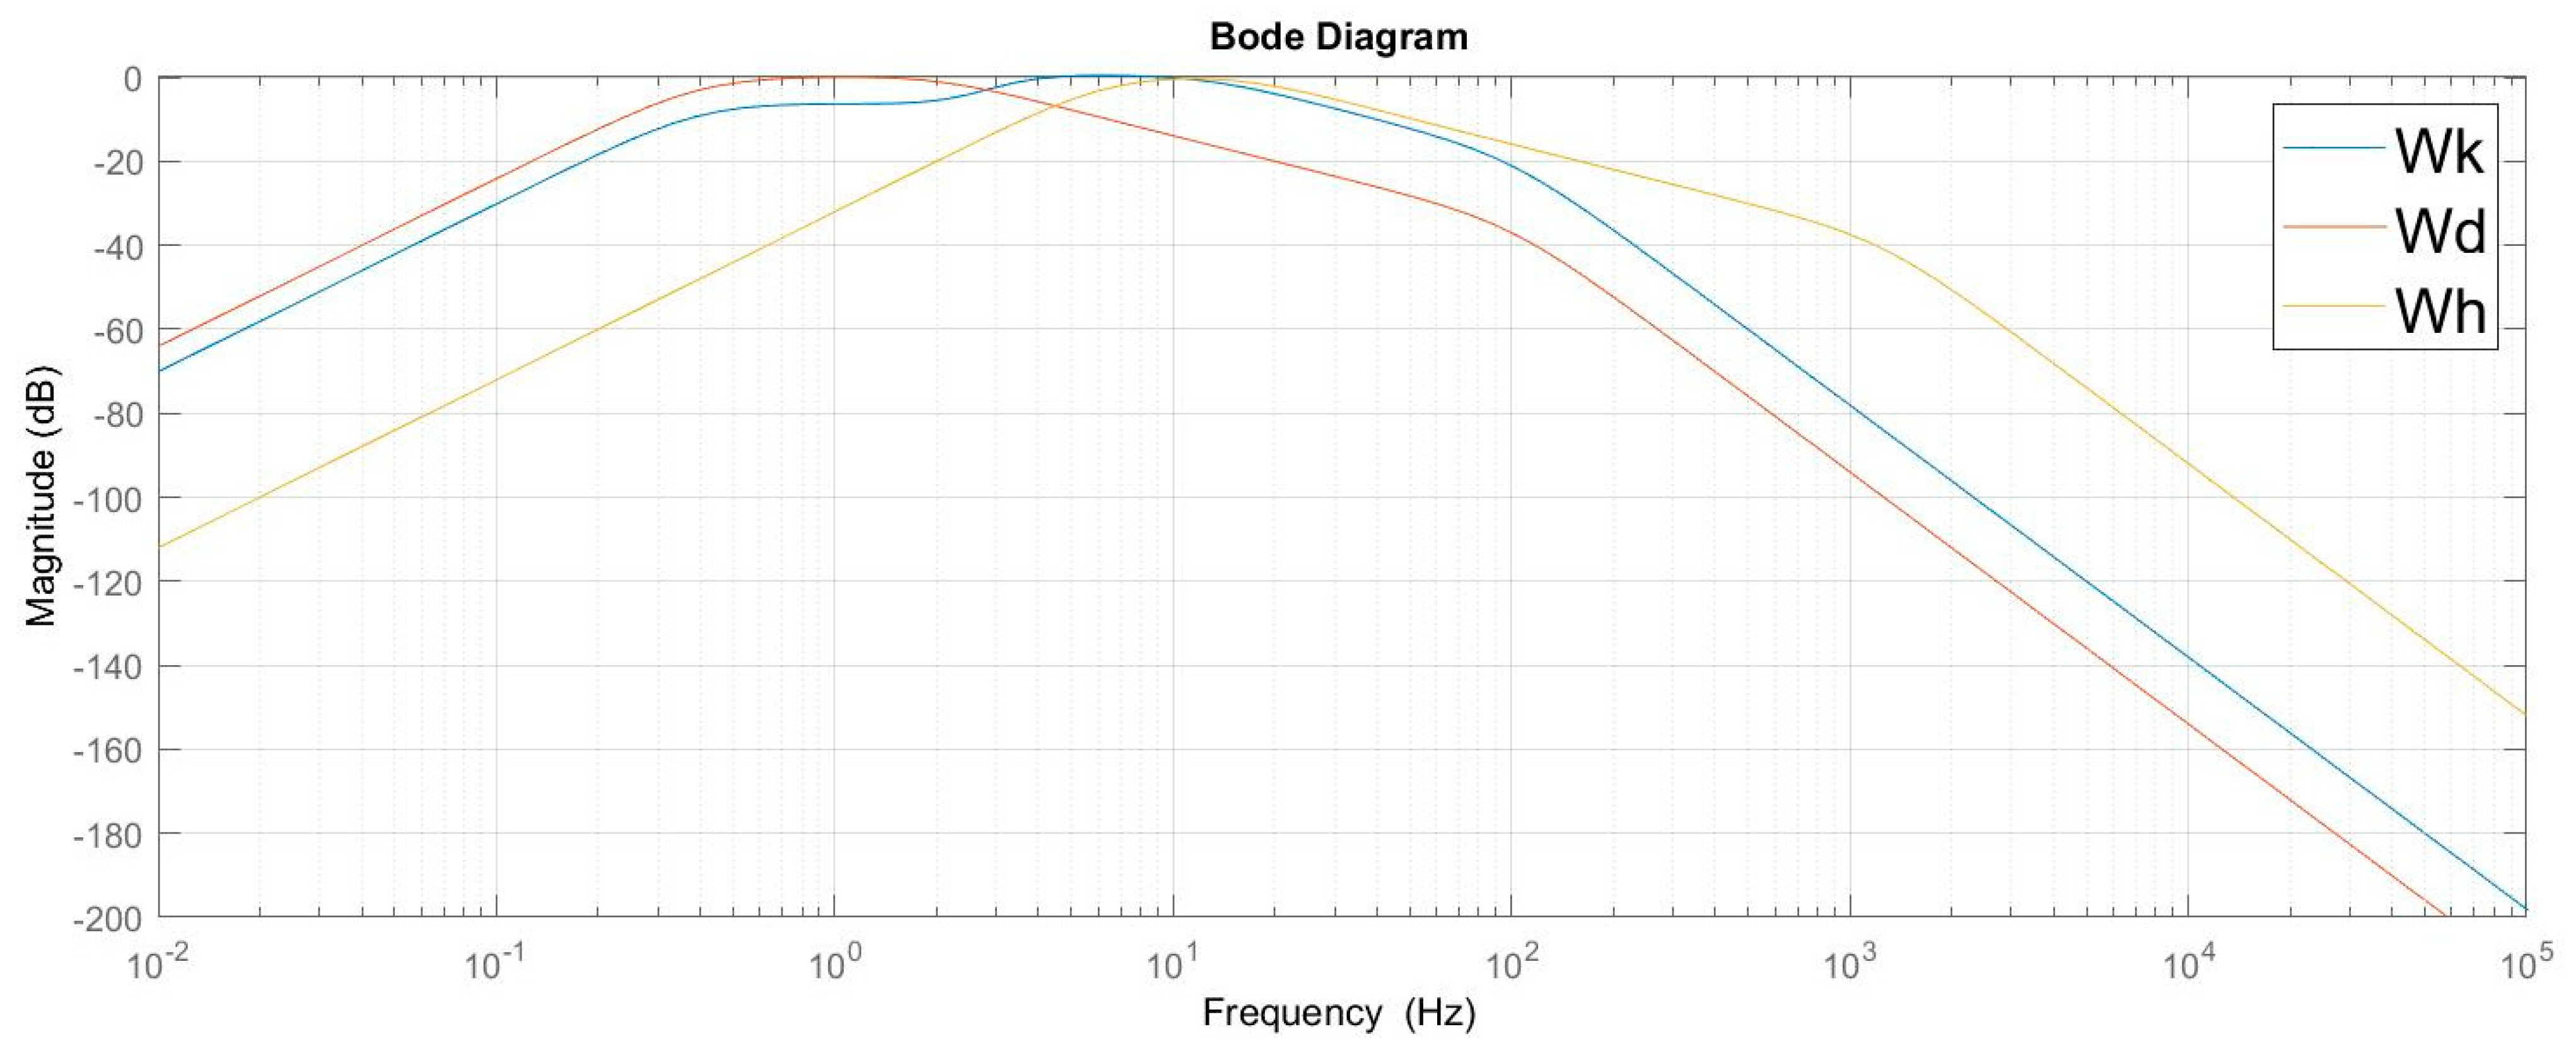
For WBVs, the use of two filters for the longitudinal direction (or movement direction ()) and vertical direction () was necessary. Their transference functions are defined in UNE-2631 [5]. In the case of HAV, the filter indicated in UNE-5349 [4] was applied to the total acceleration received by the hand (). The similarities of the three filters are listed in Table 3 of UNE-8041 [24]. Figure 2 shows a Bode diagram for each filter.
For WBVs, the total vibration values were calculated using Equation (2) based on UNE-2631. In this equation, the weighted accelerations in each direction ((longitudinal (awx), lateral (awy), and vertical (awz)) were also weighted to obtain the total value, :
Meanwhile, the total HAV acceleration, , was calculated as a vector module of weighted acceleration, , in the three directions, (Equation (3)). These directions correspond to the longitudinal (), lateral (), and vertical () directions:
The steps for obtaining vibrations values were as follows:
- Raw time-domain acceleration data were collected from real measurements.
- Equation (1) was used to obtain frequency-weighted acceleration values for each direction for both WBV and HAV.
- Equations (2) and (3) were used to weight the acceleration values in three directions for WBV and HAV, respectively.
2.1. Design of Experiment (DoE)
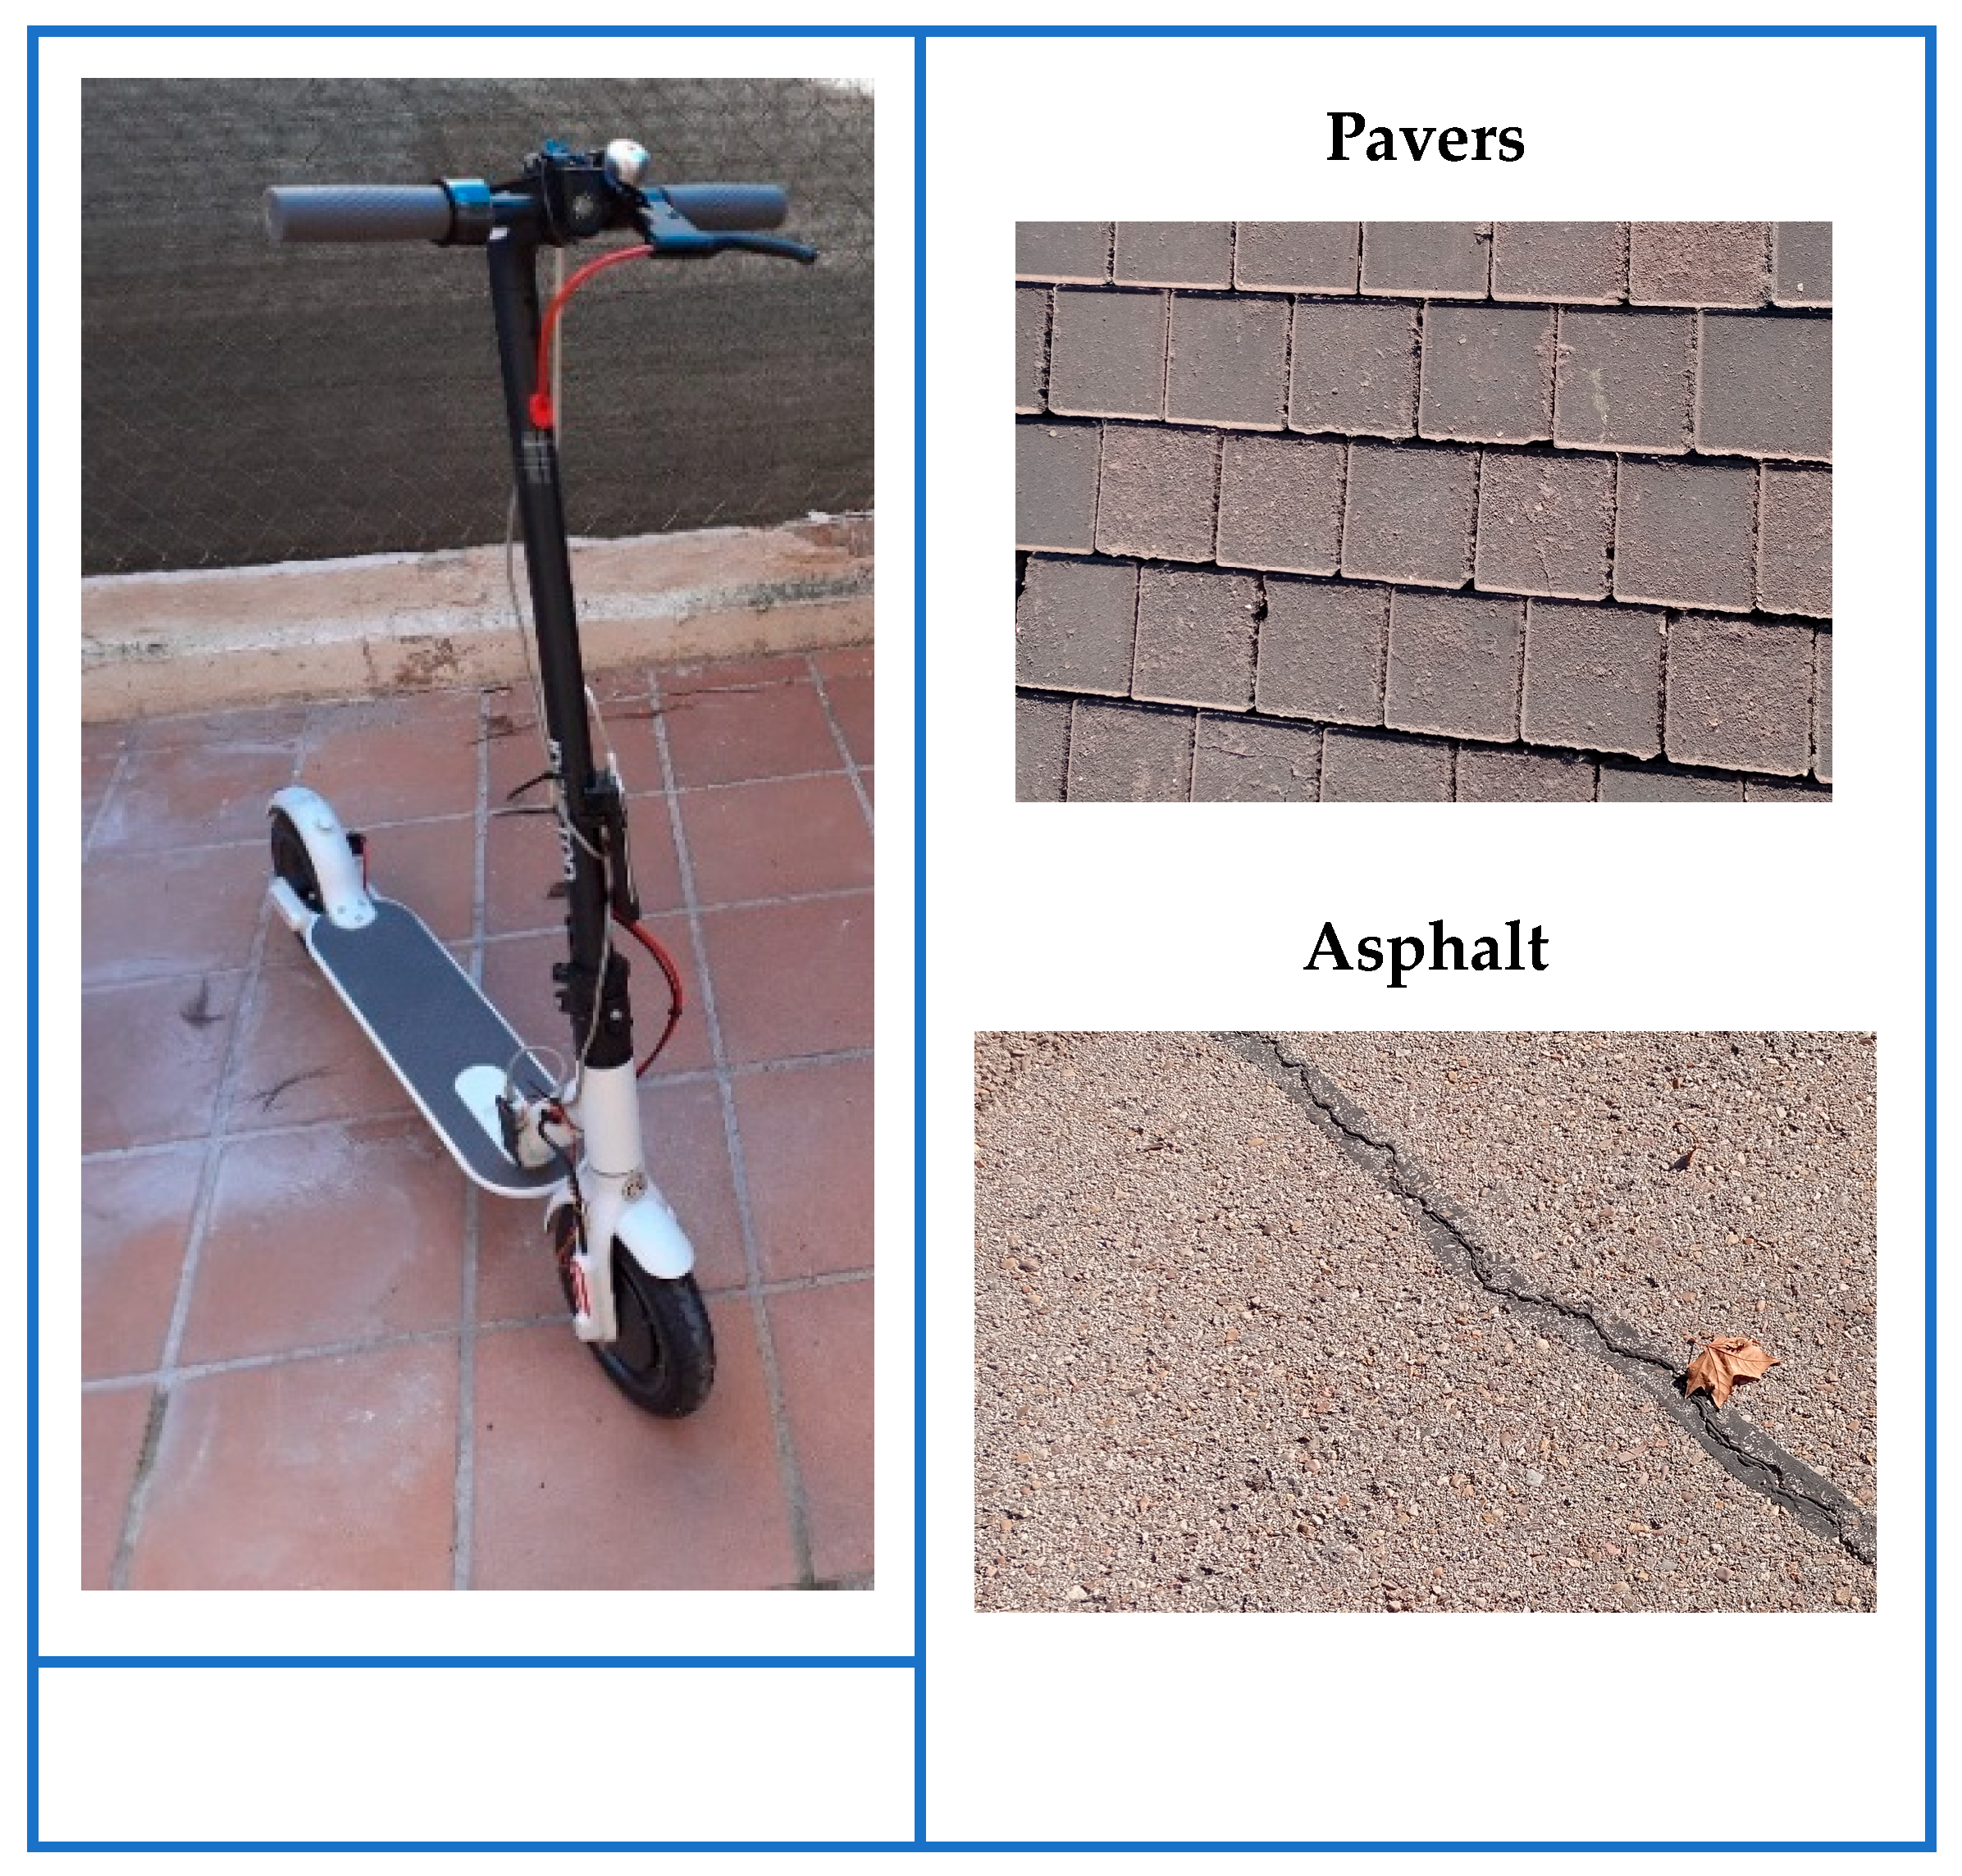
The present study is based on the measured accelerations and longitudinal speeds of an e-scooter. Measurements were obtained by conducting experiments in a real environment. The e-scooter (CityCross model, Infiniton Electronics brand) [25] used is shown in Figure 3.
The e-scooter has 8.5 in inflatable wheels and a 15–20 km range [14]. It can support a maximum weight of 120 kg. The e-scooter was acquired in June of 2021, and the experimental data were collected between November and December of this year. The e-scooter was not used for other purposes except for a little trip to adjust and test the recording equipment beforehand. The data used in this study were collected from a public database indicated hereinbefore. The DoE included three main variables:
- Two drivers;
- Two types of pavements, square pavers of 12 cm and asphalt with slight defects (Figure 3);
- Two speed modes: ECO and MAX.
Each combination was run three times; thus, the database contained 24 datasets for accelerations in the three axes and longitudinal speeds.
2.2. Vibration Thresholds for Health
To evaluate the impact of vibration on health, determining the vibration exposure time was necessary. For this research, each e-scooter user was assumed to have at least two trips per ‘active’ day (‘come and go’). Thus, based on Table 1 (mean time per trip: approximately 16 min), a travel time of 30 min (0.5 h) per e-scooter user was assumed. This assumption is consistent with the number of trips per user (between 1.6 and 3.3) reported by Foissaud et al. [22]. With the vibration exposure time, vibration thresholds were able to be established based on this assumption.
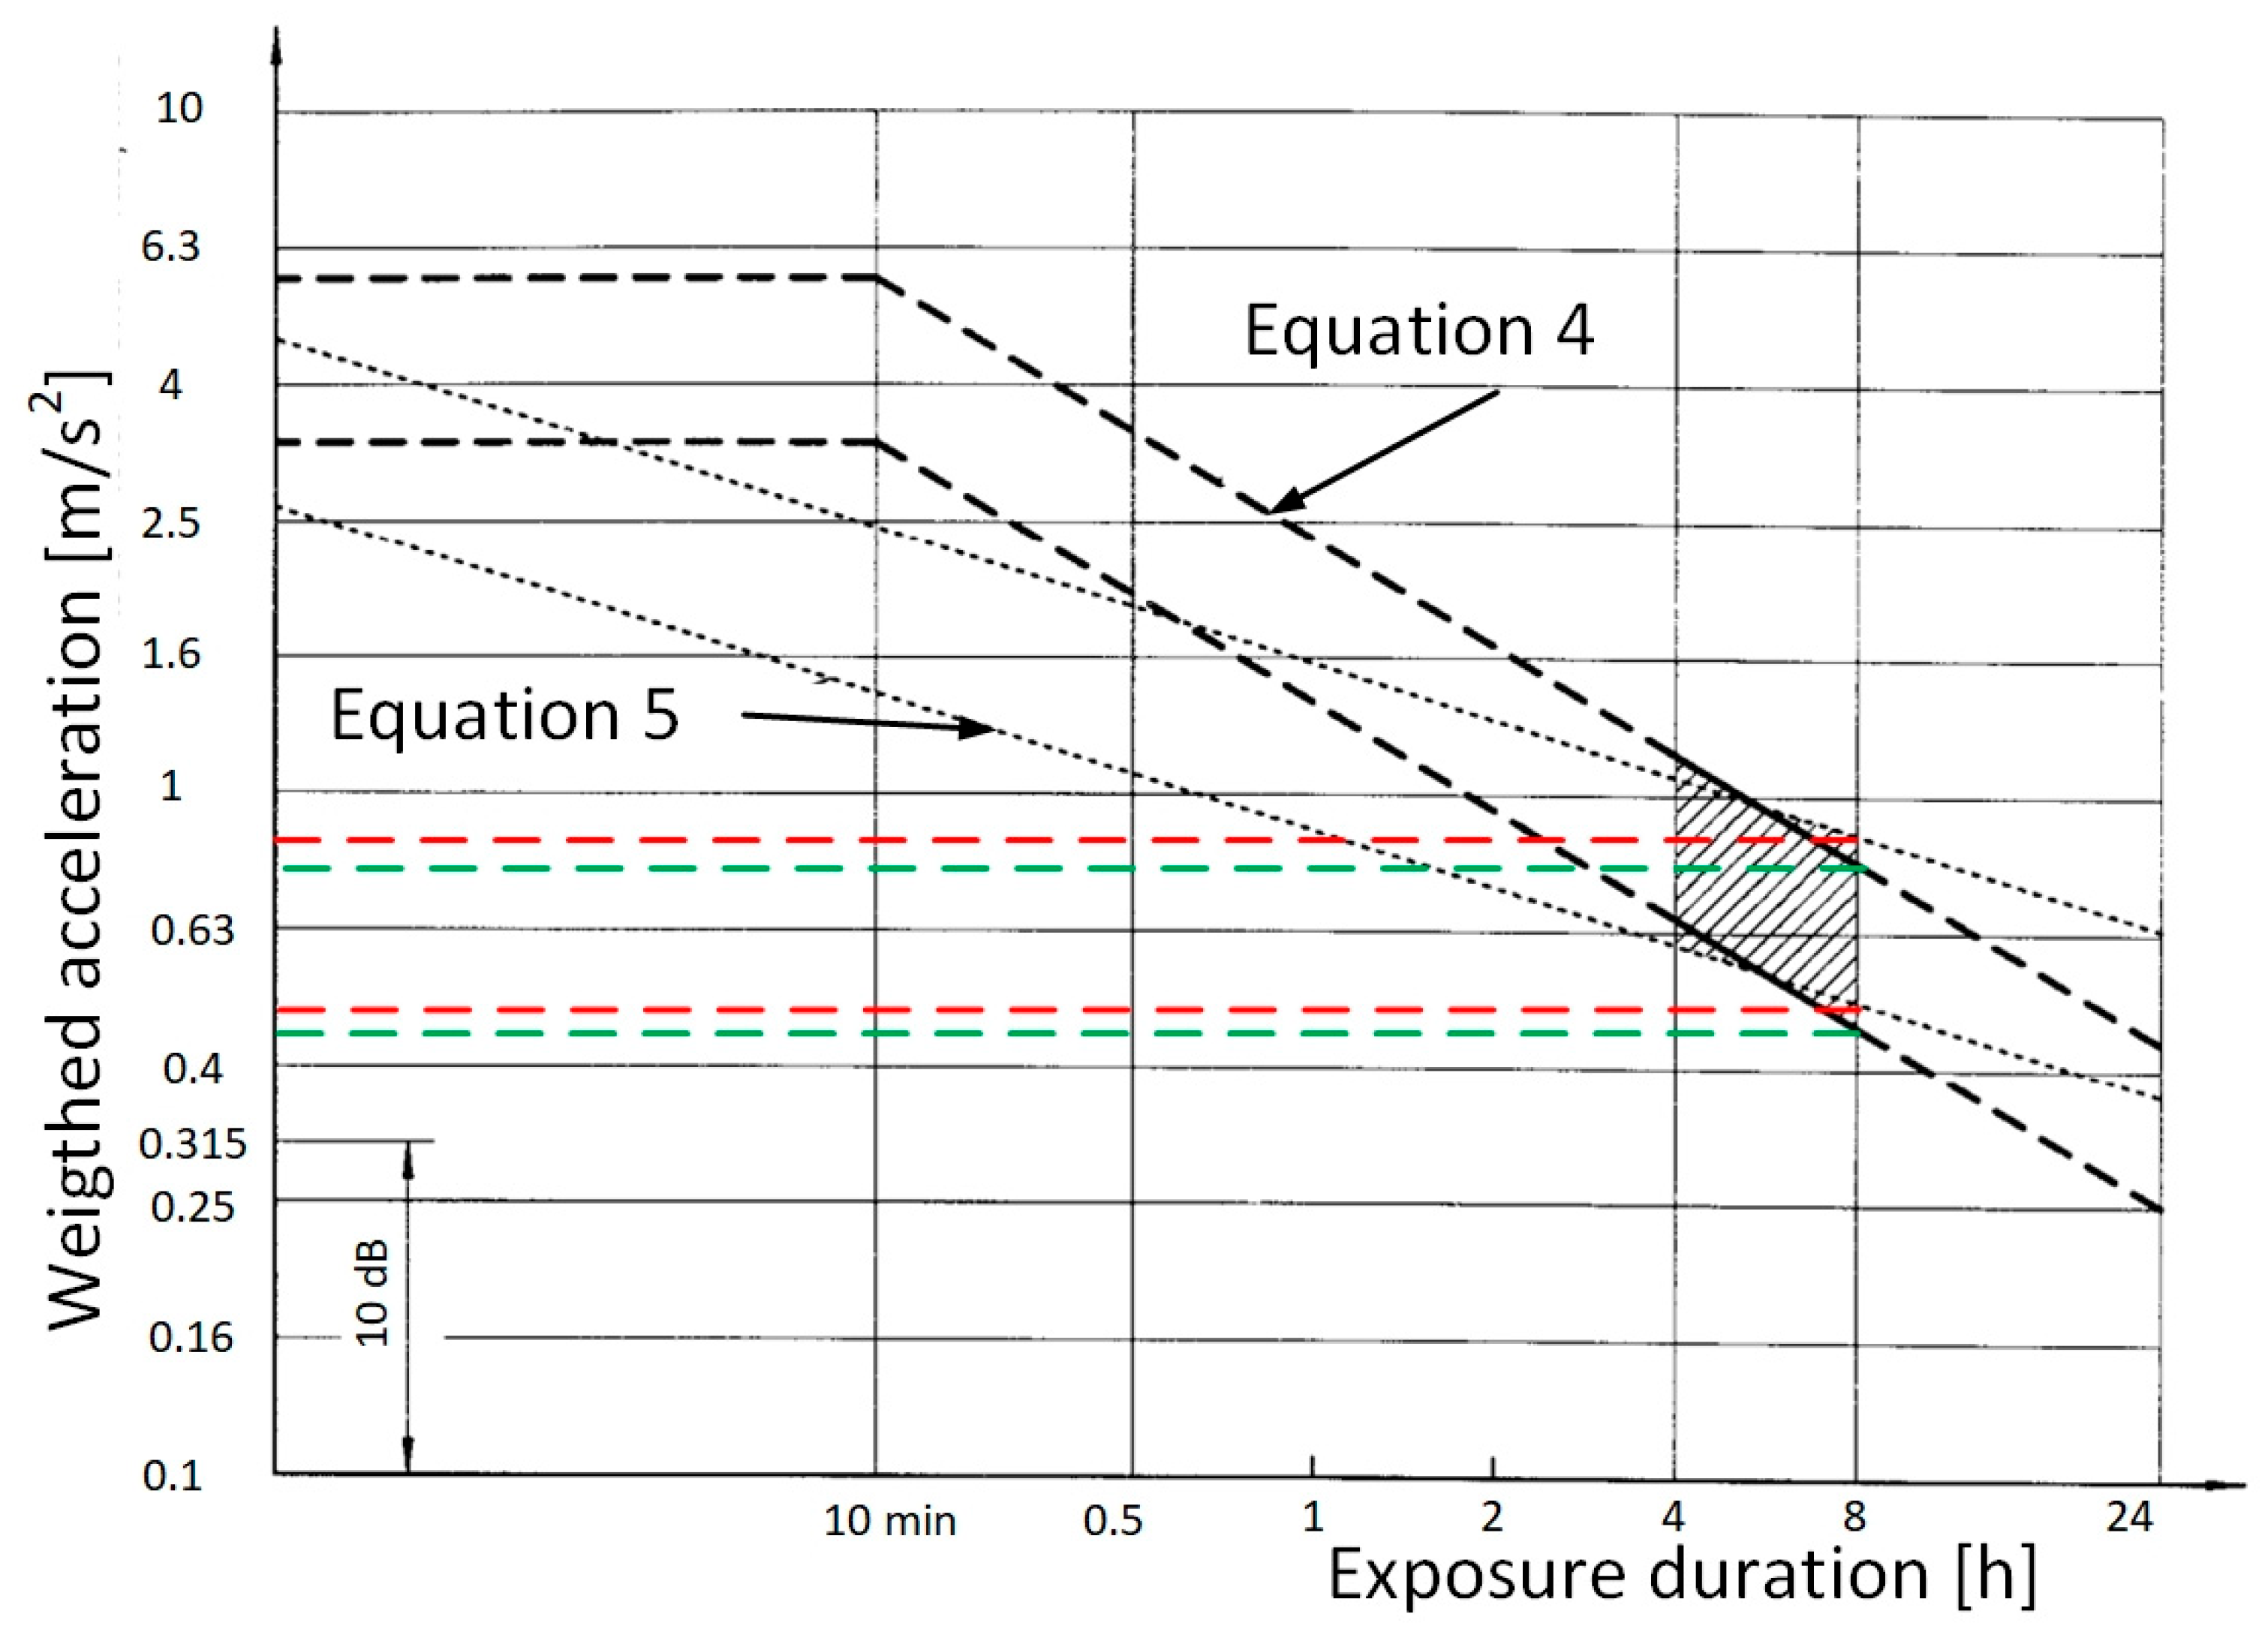
The UNE-2631 standard [5] does not define limits that are similar to the European Directive’s ‘action and limit’. However, it specifies vibration values that must not be exceeded to have no detrimental effect on health; the values are normally associated with a vibration exposure time of 8 h. To compare the vibration limits of different exposure times, two equations proposed in the UNE-2631 standard can be used:
where and are the weighted RMS acceleration values for the first and second exposures, respectively, and and are the durations of the first and second exposures, respectively.
Thus, once the acceleration limit, , is known, the corresponding exposure time, , and the vibration limits associated with the e-scooter acceleration, , can be obtained based on the time of daily use of the scooters (). The following equations yield the vibration exposure limits equivalent to the e-scooter exposure time:
From Figure 4, the approximate values corresponding to 8 h of exposure are 0.45 and 0.8 m/s2 (green lines) for Equation (4) and 0.5 and 0.9 m/s2 (red lines) for Equation (5). However, the standards indicate that caution must be observed in the zone between 4 and 8 h because most of the occupational observation values in this range of exposure coincide. Thus, if the lowest values (those corresponding to 8 h of exposure) were selected and applied to 4 h of exposure, , the resulting limit values would be more conservative. Given that the European directive is less conservative, the limits of UNE-2631 on WBV were used in this study. However, the limits of the European directive were applied to HAV. Given that the UNE-5349 standard for HAV uses Equation (2) for the equivalence, this equation was also used to calculate the HAV limit. Table 2 summarises the limits used in this study based on the UNE-2631 standard and the European Directive.
Thus, the resulting thresholds were as follows.
- Acceleration and WBV in the range 0.9–3.6 m/s2 were considered as ‘potentially non-healthy’ WBVs (pn-h zone); when the acceleration exceeded 3.6 m/s2, the WBVs were considered to be in the ‘non-healthy’ (n-h) zone.
- Acceleration and HAV in the range 10–20 m/s2 were considered as HAVs in the ‘caution’ zone; when the acceleration exceeded 20 m/s2, the HAVs were considered to be in the ‘harmful’ zone.
The foregoing limits were used to define three zones in each study: A, B, and C. Zone A covered the first established limit (0.9 and 10 m/s2 for WBV and HAV, respectively). Zone B included the two selected limits. Zone C referred to vibration values exceeding the highest established limit.
Based on the graphs for each of the 24 records, the points within each zone were added to the two drivers and three repetitions (i.e., six measurements). Then, they were divided by the total number of points of the six measurements to obtain an average percentage of the points that fell in each zone for each speed mode. If was the number of points in zone for each driver and replica , the following was formulated:
Thus, the percentage of the number of points in each zone could be calculated using
where,
- is the number of drivers ();
- is the number of replicas ();
- denotes the zones ();
- is the initial boundary of zone ; and
- is the final boundary of zone k.
The vibration level causing 10% of the subjects to exhibit ‘white finger’ or Raynaud’s syndrome after 10 years was considered as another vibration limit.
where
- A(8) is the daily exposure equivalent to 8 h of receiving hand vibrations via a contact surface, and
- is the mean duration of total (lifetime) exposure (years).
For example, considering a timeframe of 10 years, the following was obtained:
For a vibration exposure time of 30 min, from Equation (4), the level of exposure to vibrations that could cause white fingers in 10% of the population studied after 10 years of exposure was approximately 12 m/s2. In this study, the mean vibration value of HAV was calculated for each type of pavement and speed mode, including three replicates of each of the two drivers. Accordingly, the average vibration value, , was calculated based on the sum of all the obtained values. The graphs for the six cases of each type of pavement and speed mode divided by the sum of the number of points () for all drivers () and the three replicates of are given in Appendix A. Mathematically, is defined as follows:
3. Results and Discussions
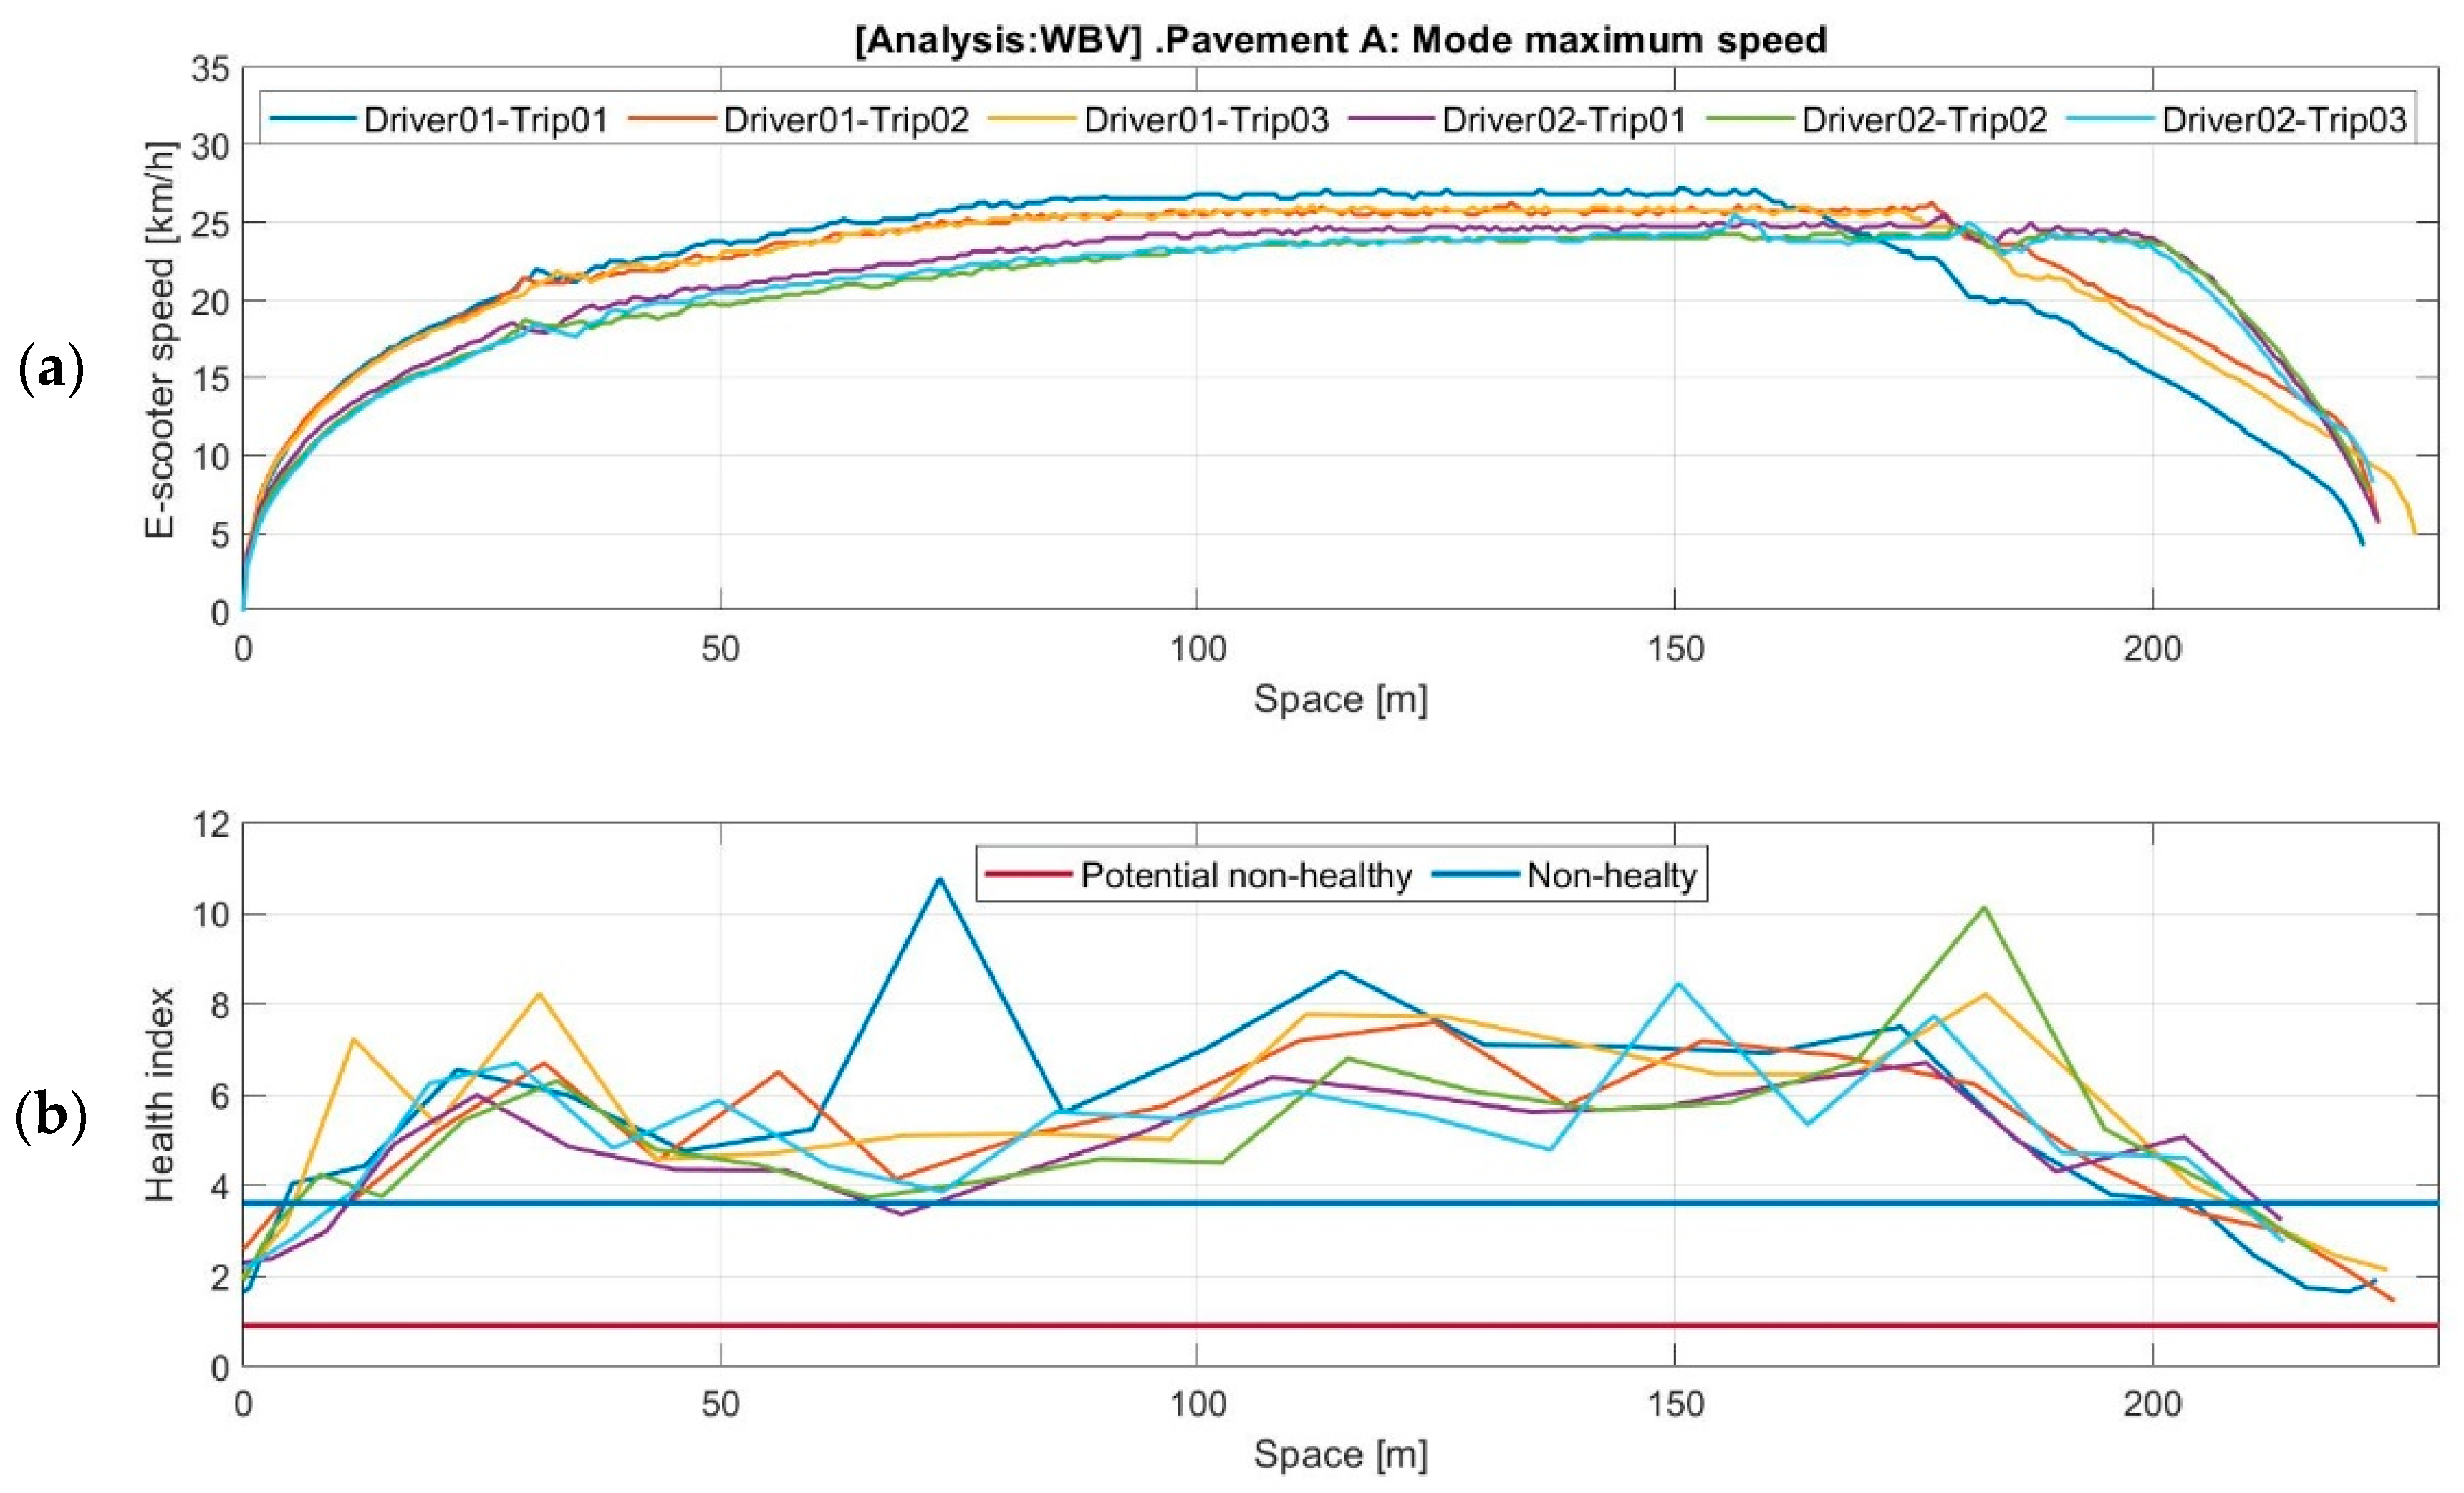
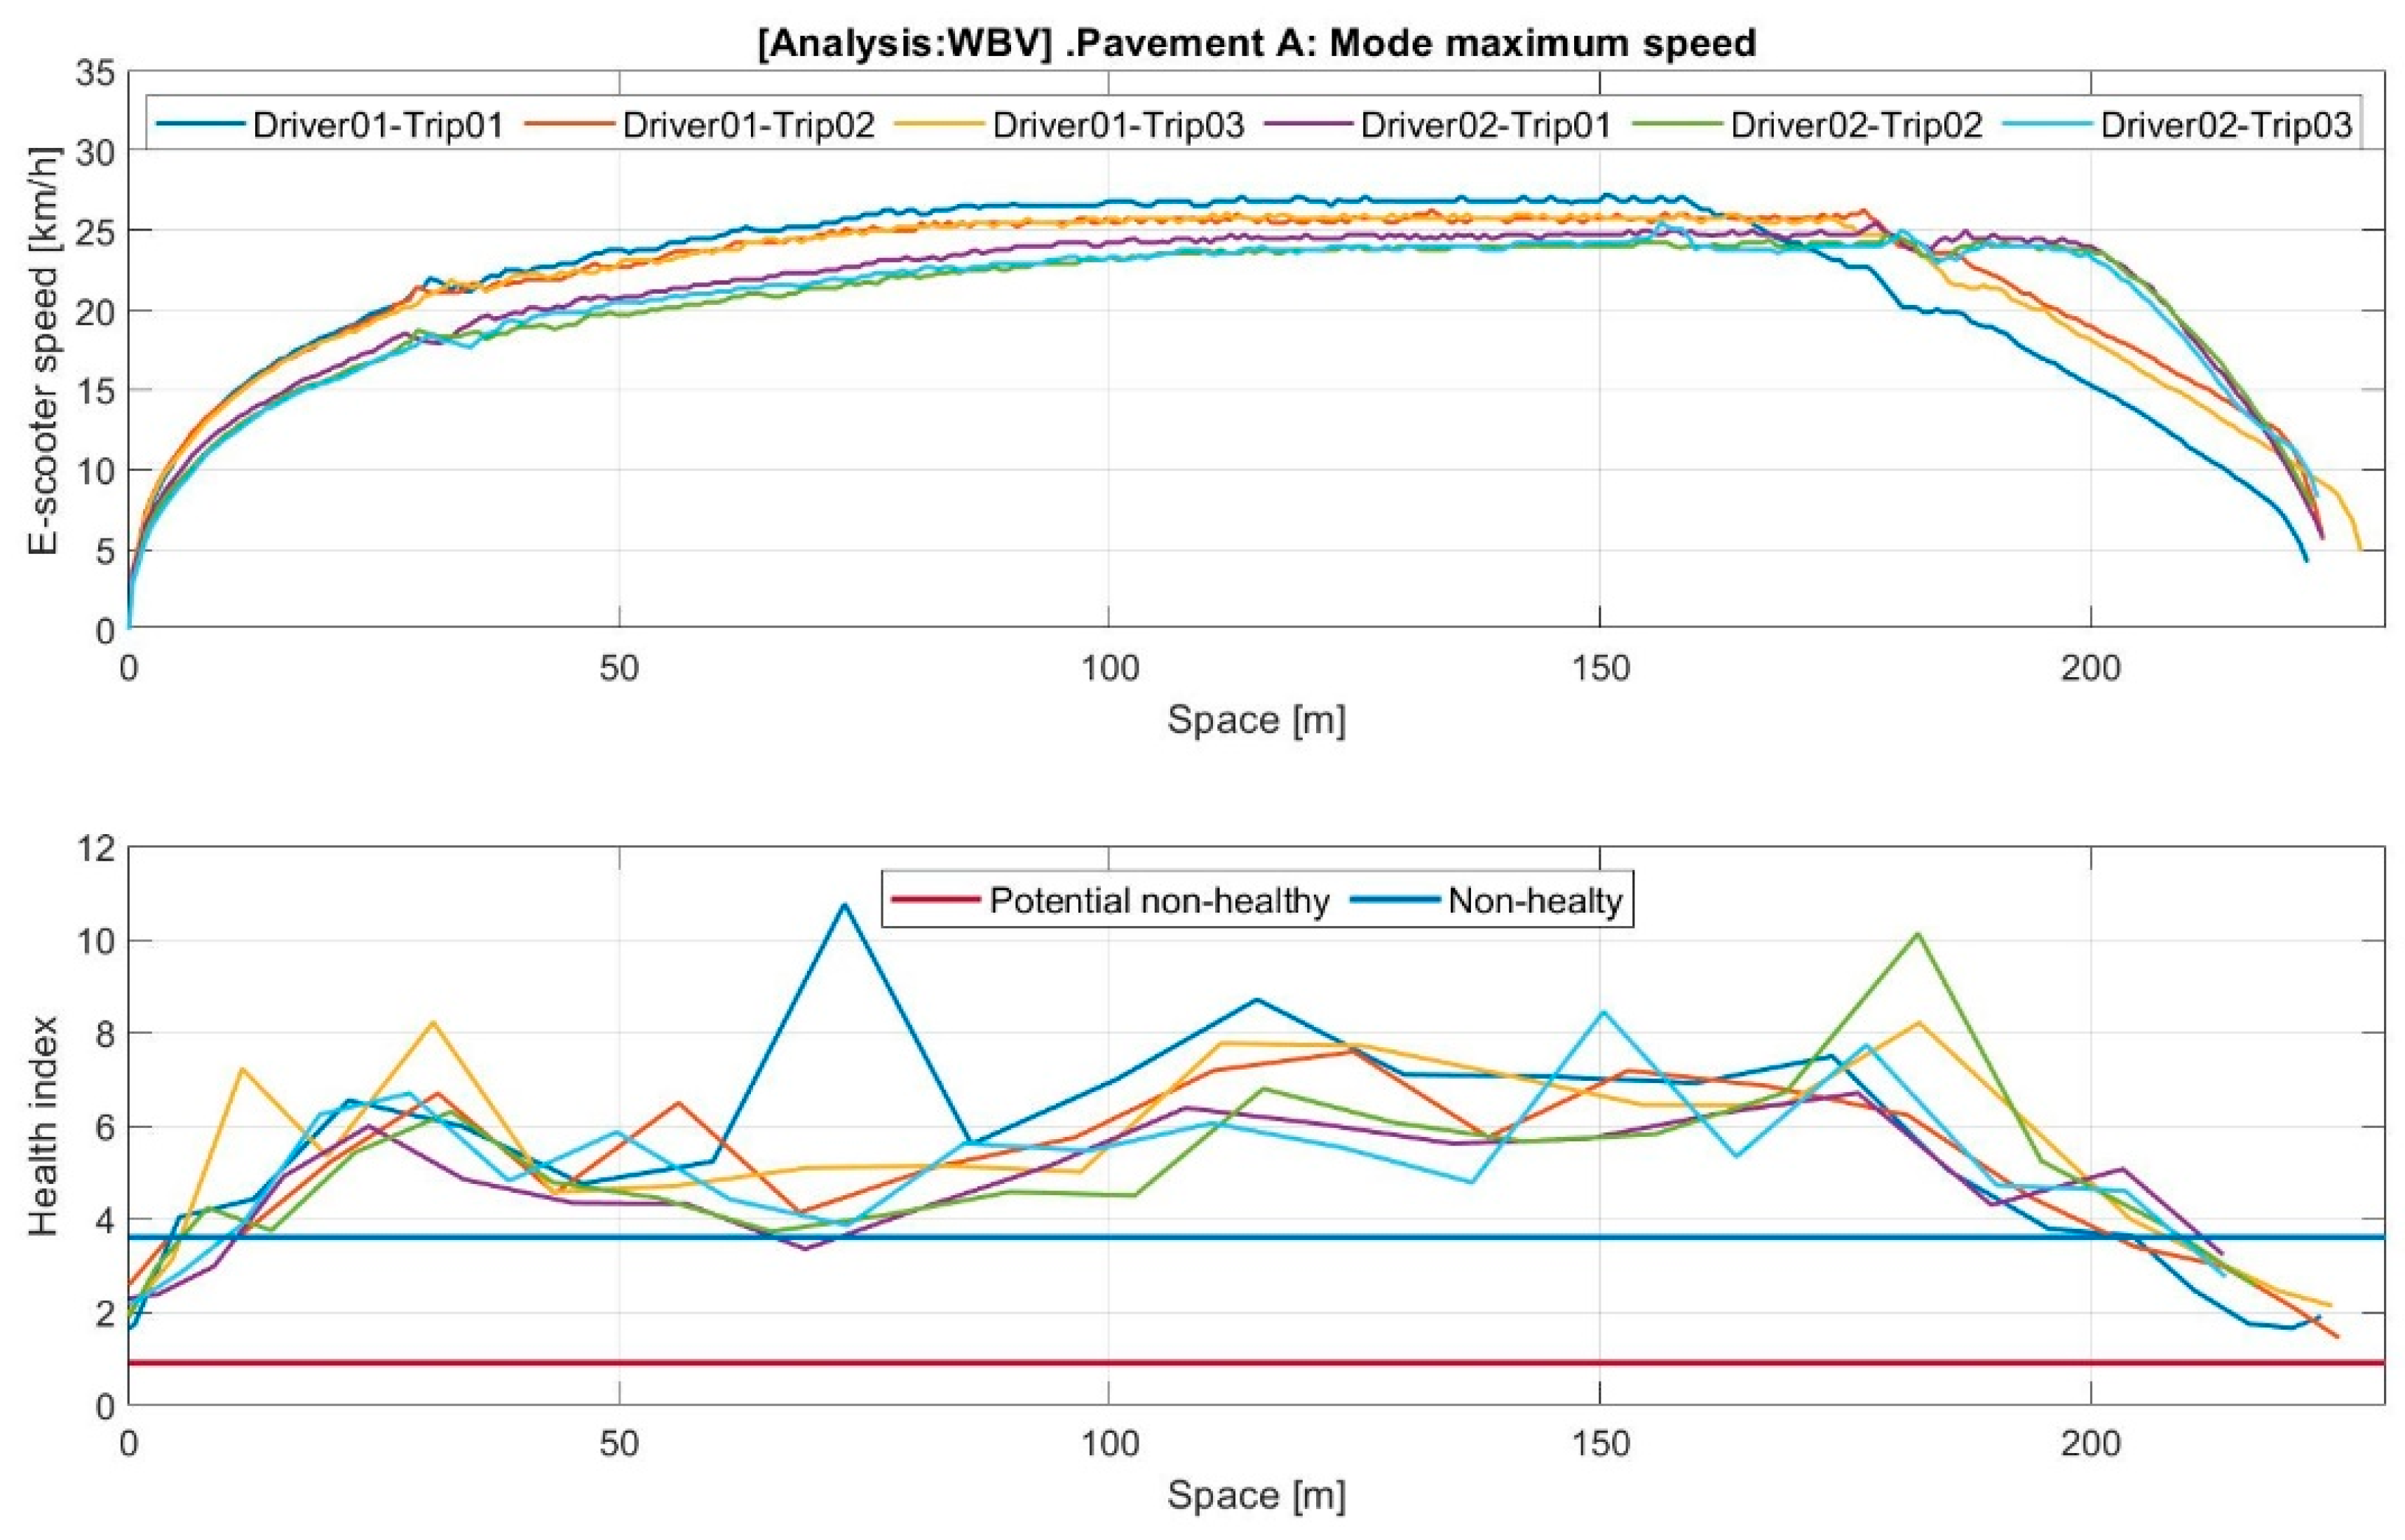
This section presents the main post-processed results using tables and representative values from raw data described in the DoE; the data were processed using MATLAB 2018b. The main graphical results for each of the 24 records for the WBV and HAV filters are presented in Appendix A. The obtained vibration levels are plotted in the space and frequency domains. As an example of the graphical results, Figure 5 shows two main plots. Figure 5a shows the six longitudinal speed profiles for each driver and trip (three replicates per driver). Figure 5b collects the acceleration () considered for WBV evaluations from the perspective of health and the limits for the pn-h and n-h zones.
3.1. Whole-Body Vibrations (WBVs)
The results related to WBVs were calculated using Equation (9) and are listed in Table 3. The mean value for each type of pavement in each zone and the mean value in each zone considering all both speed factors were also computed.
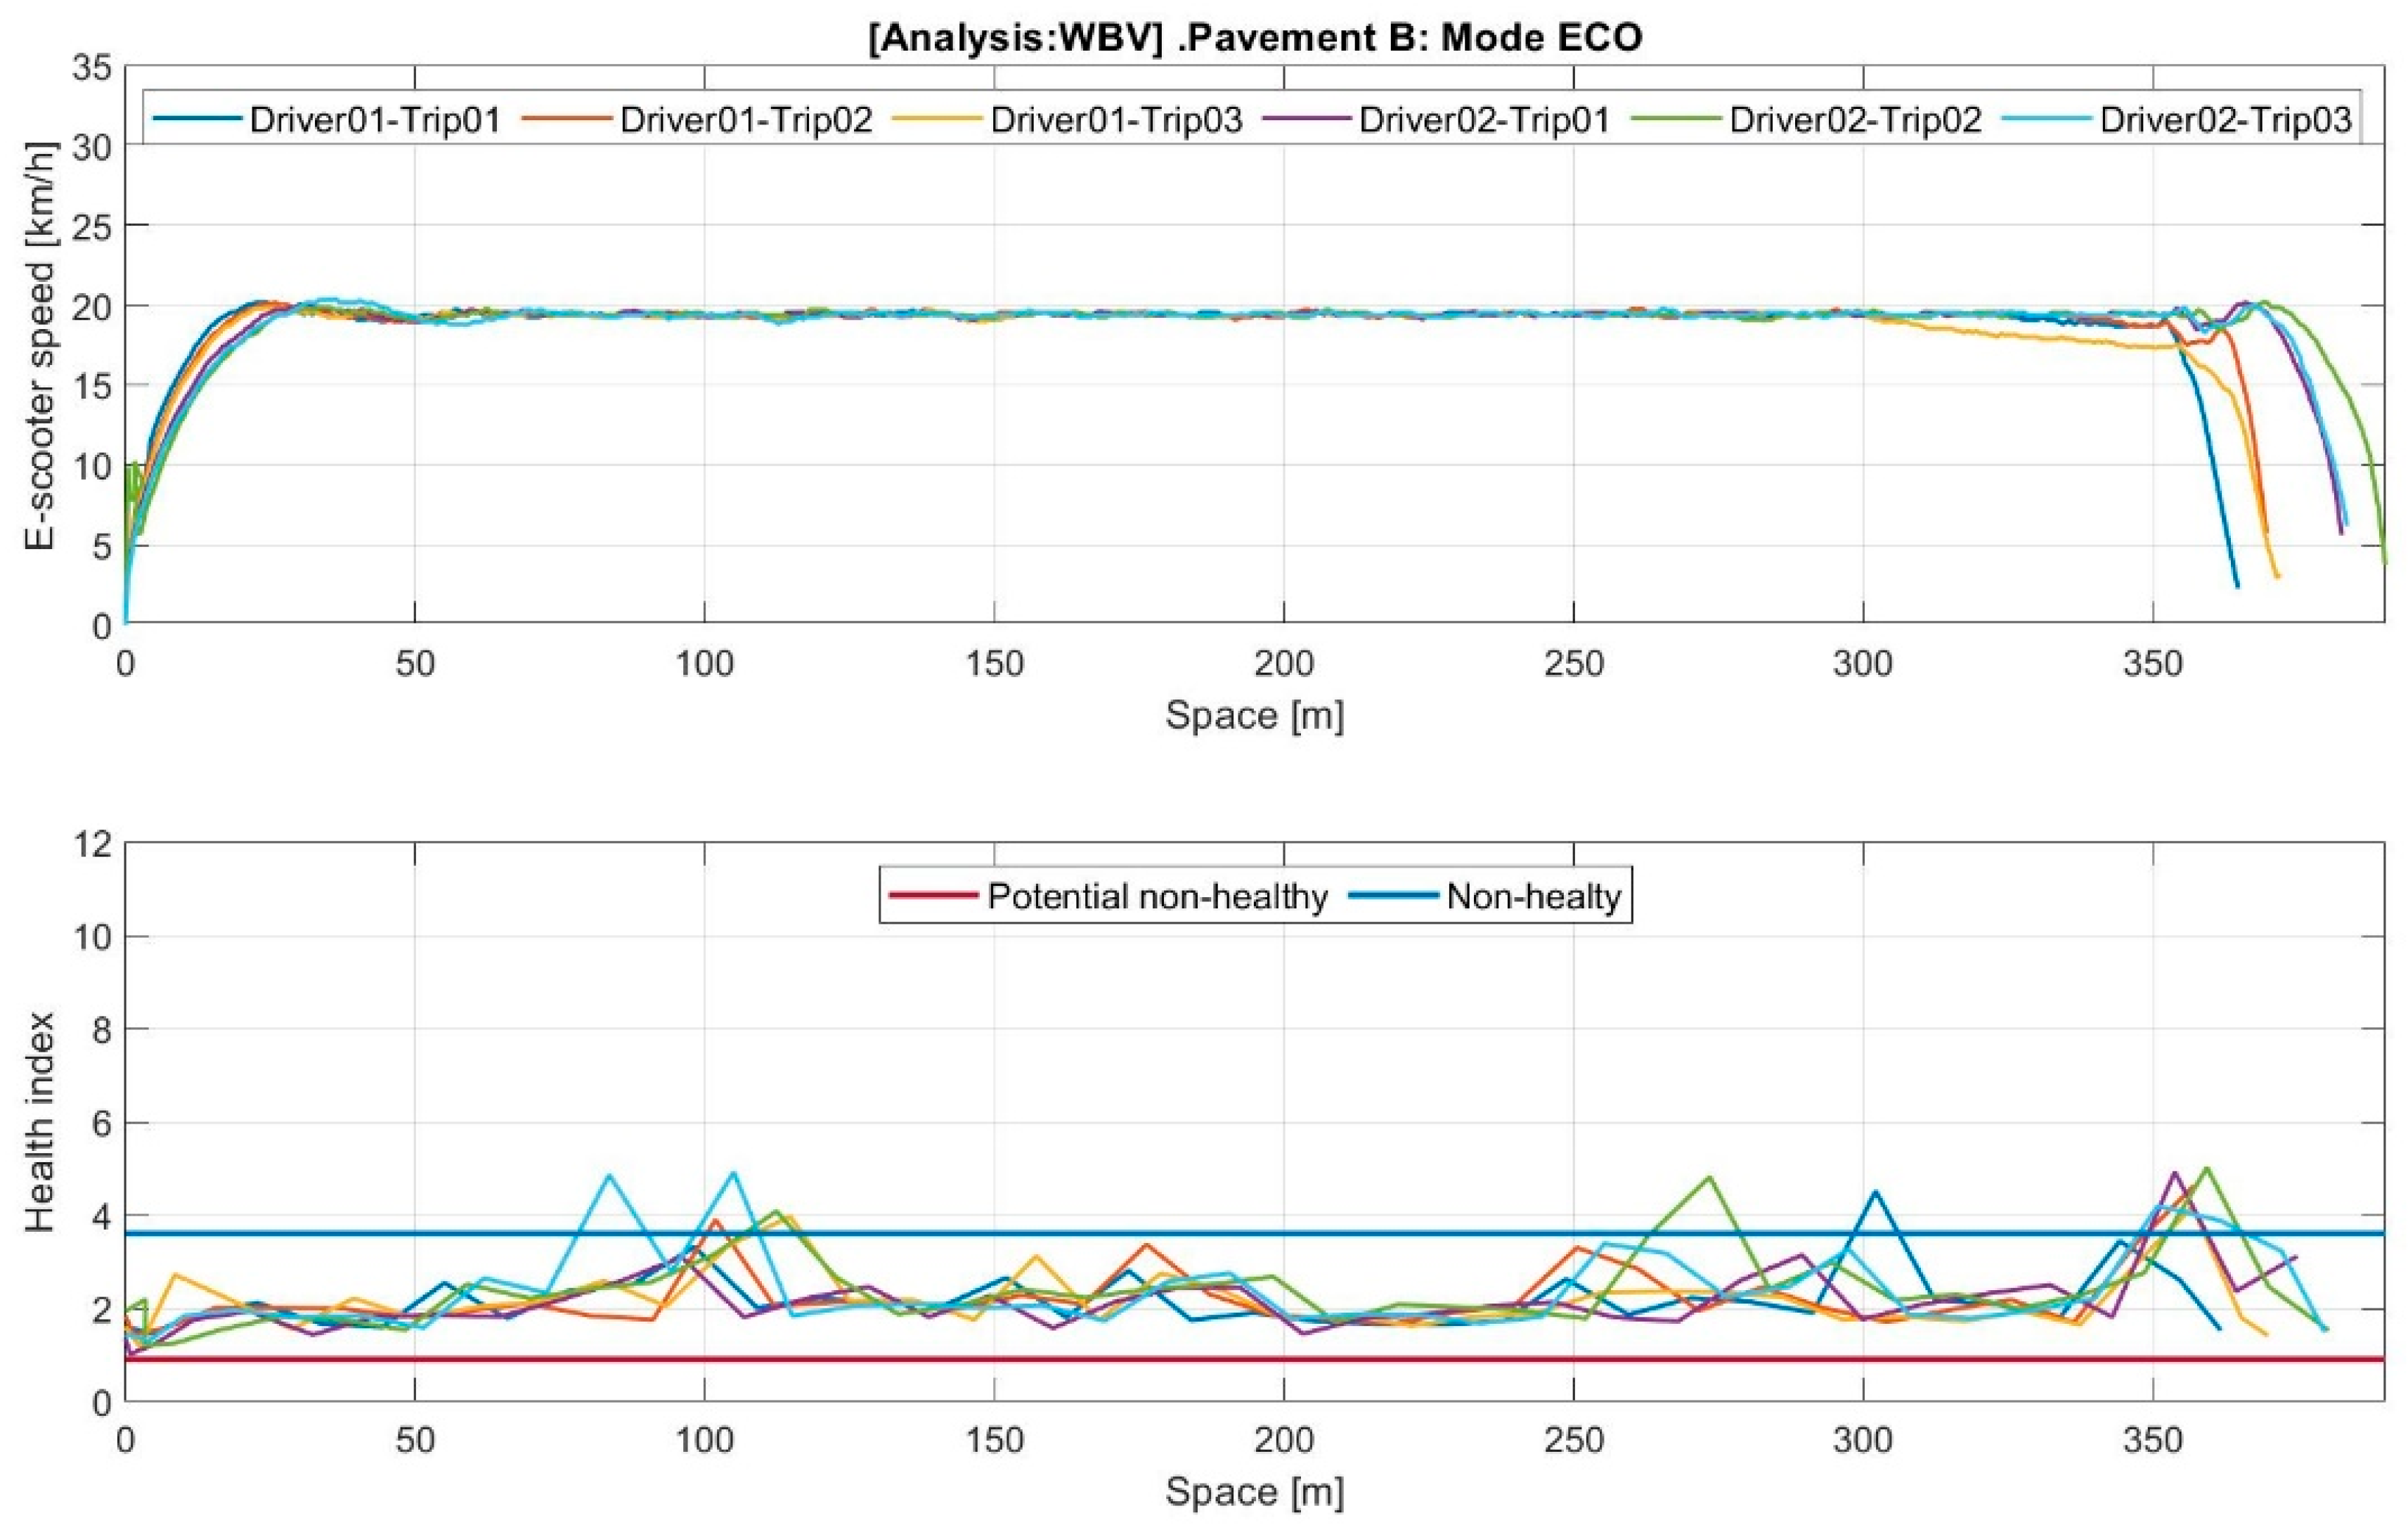
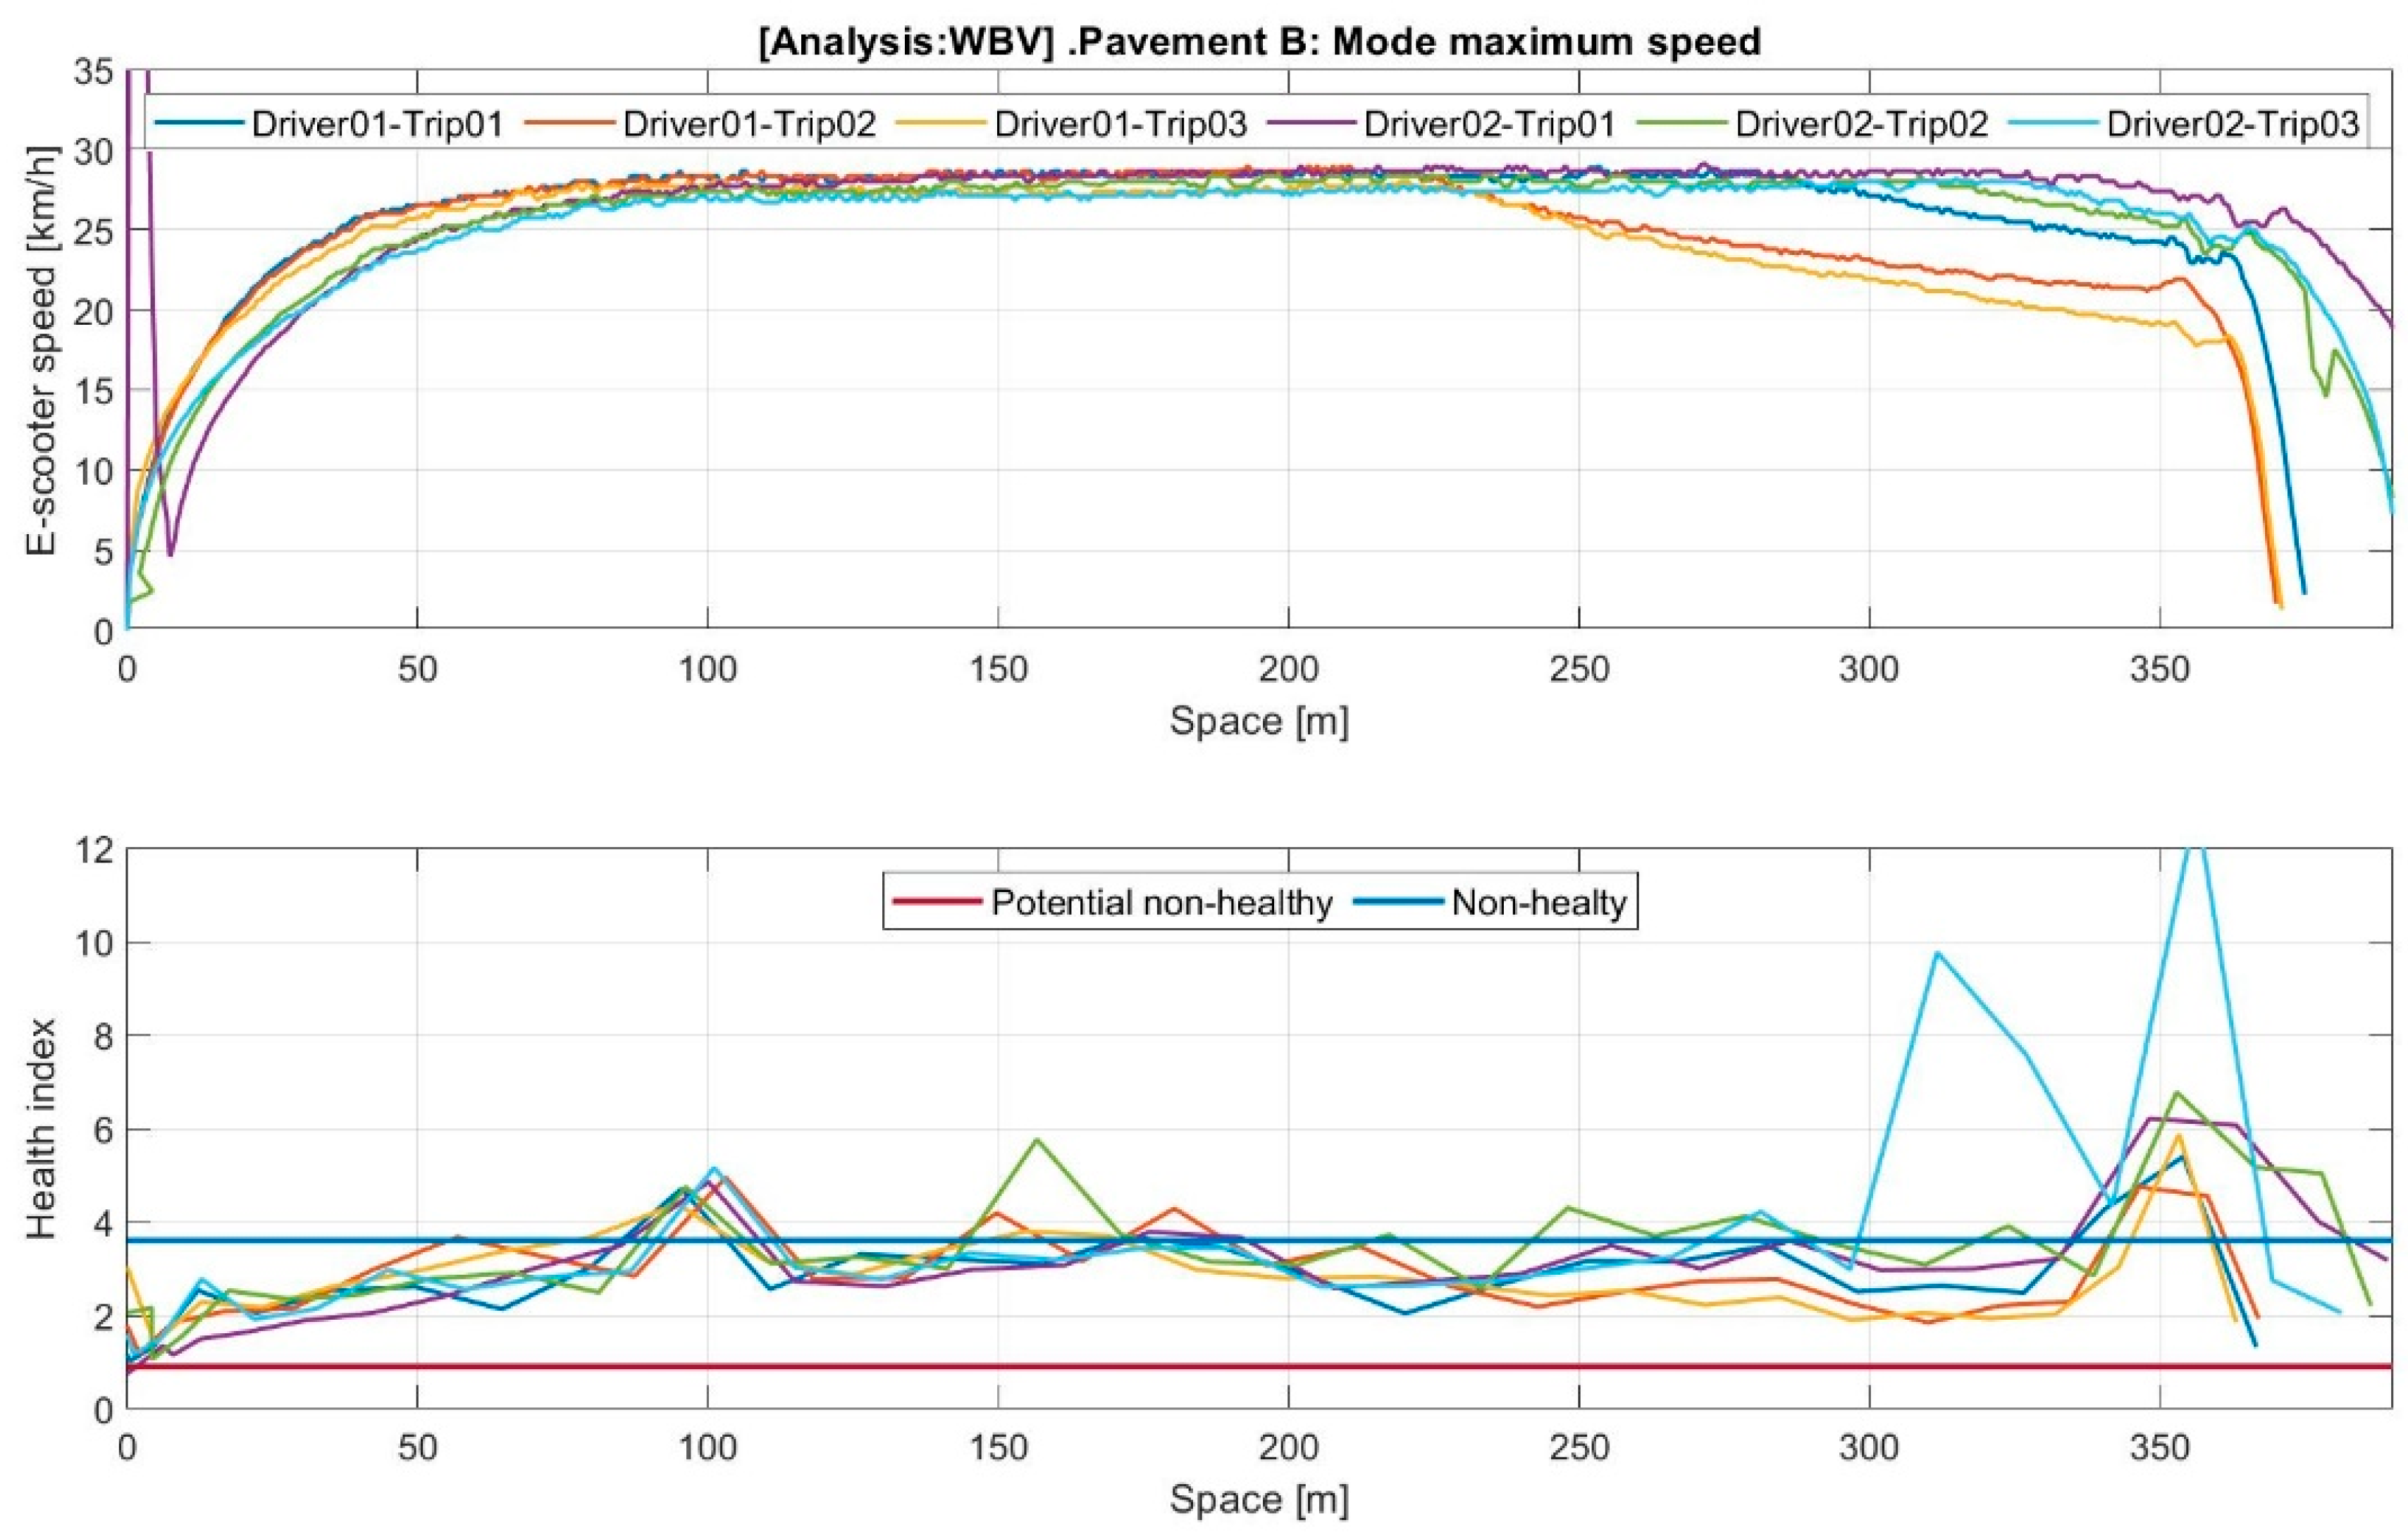
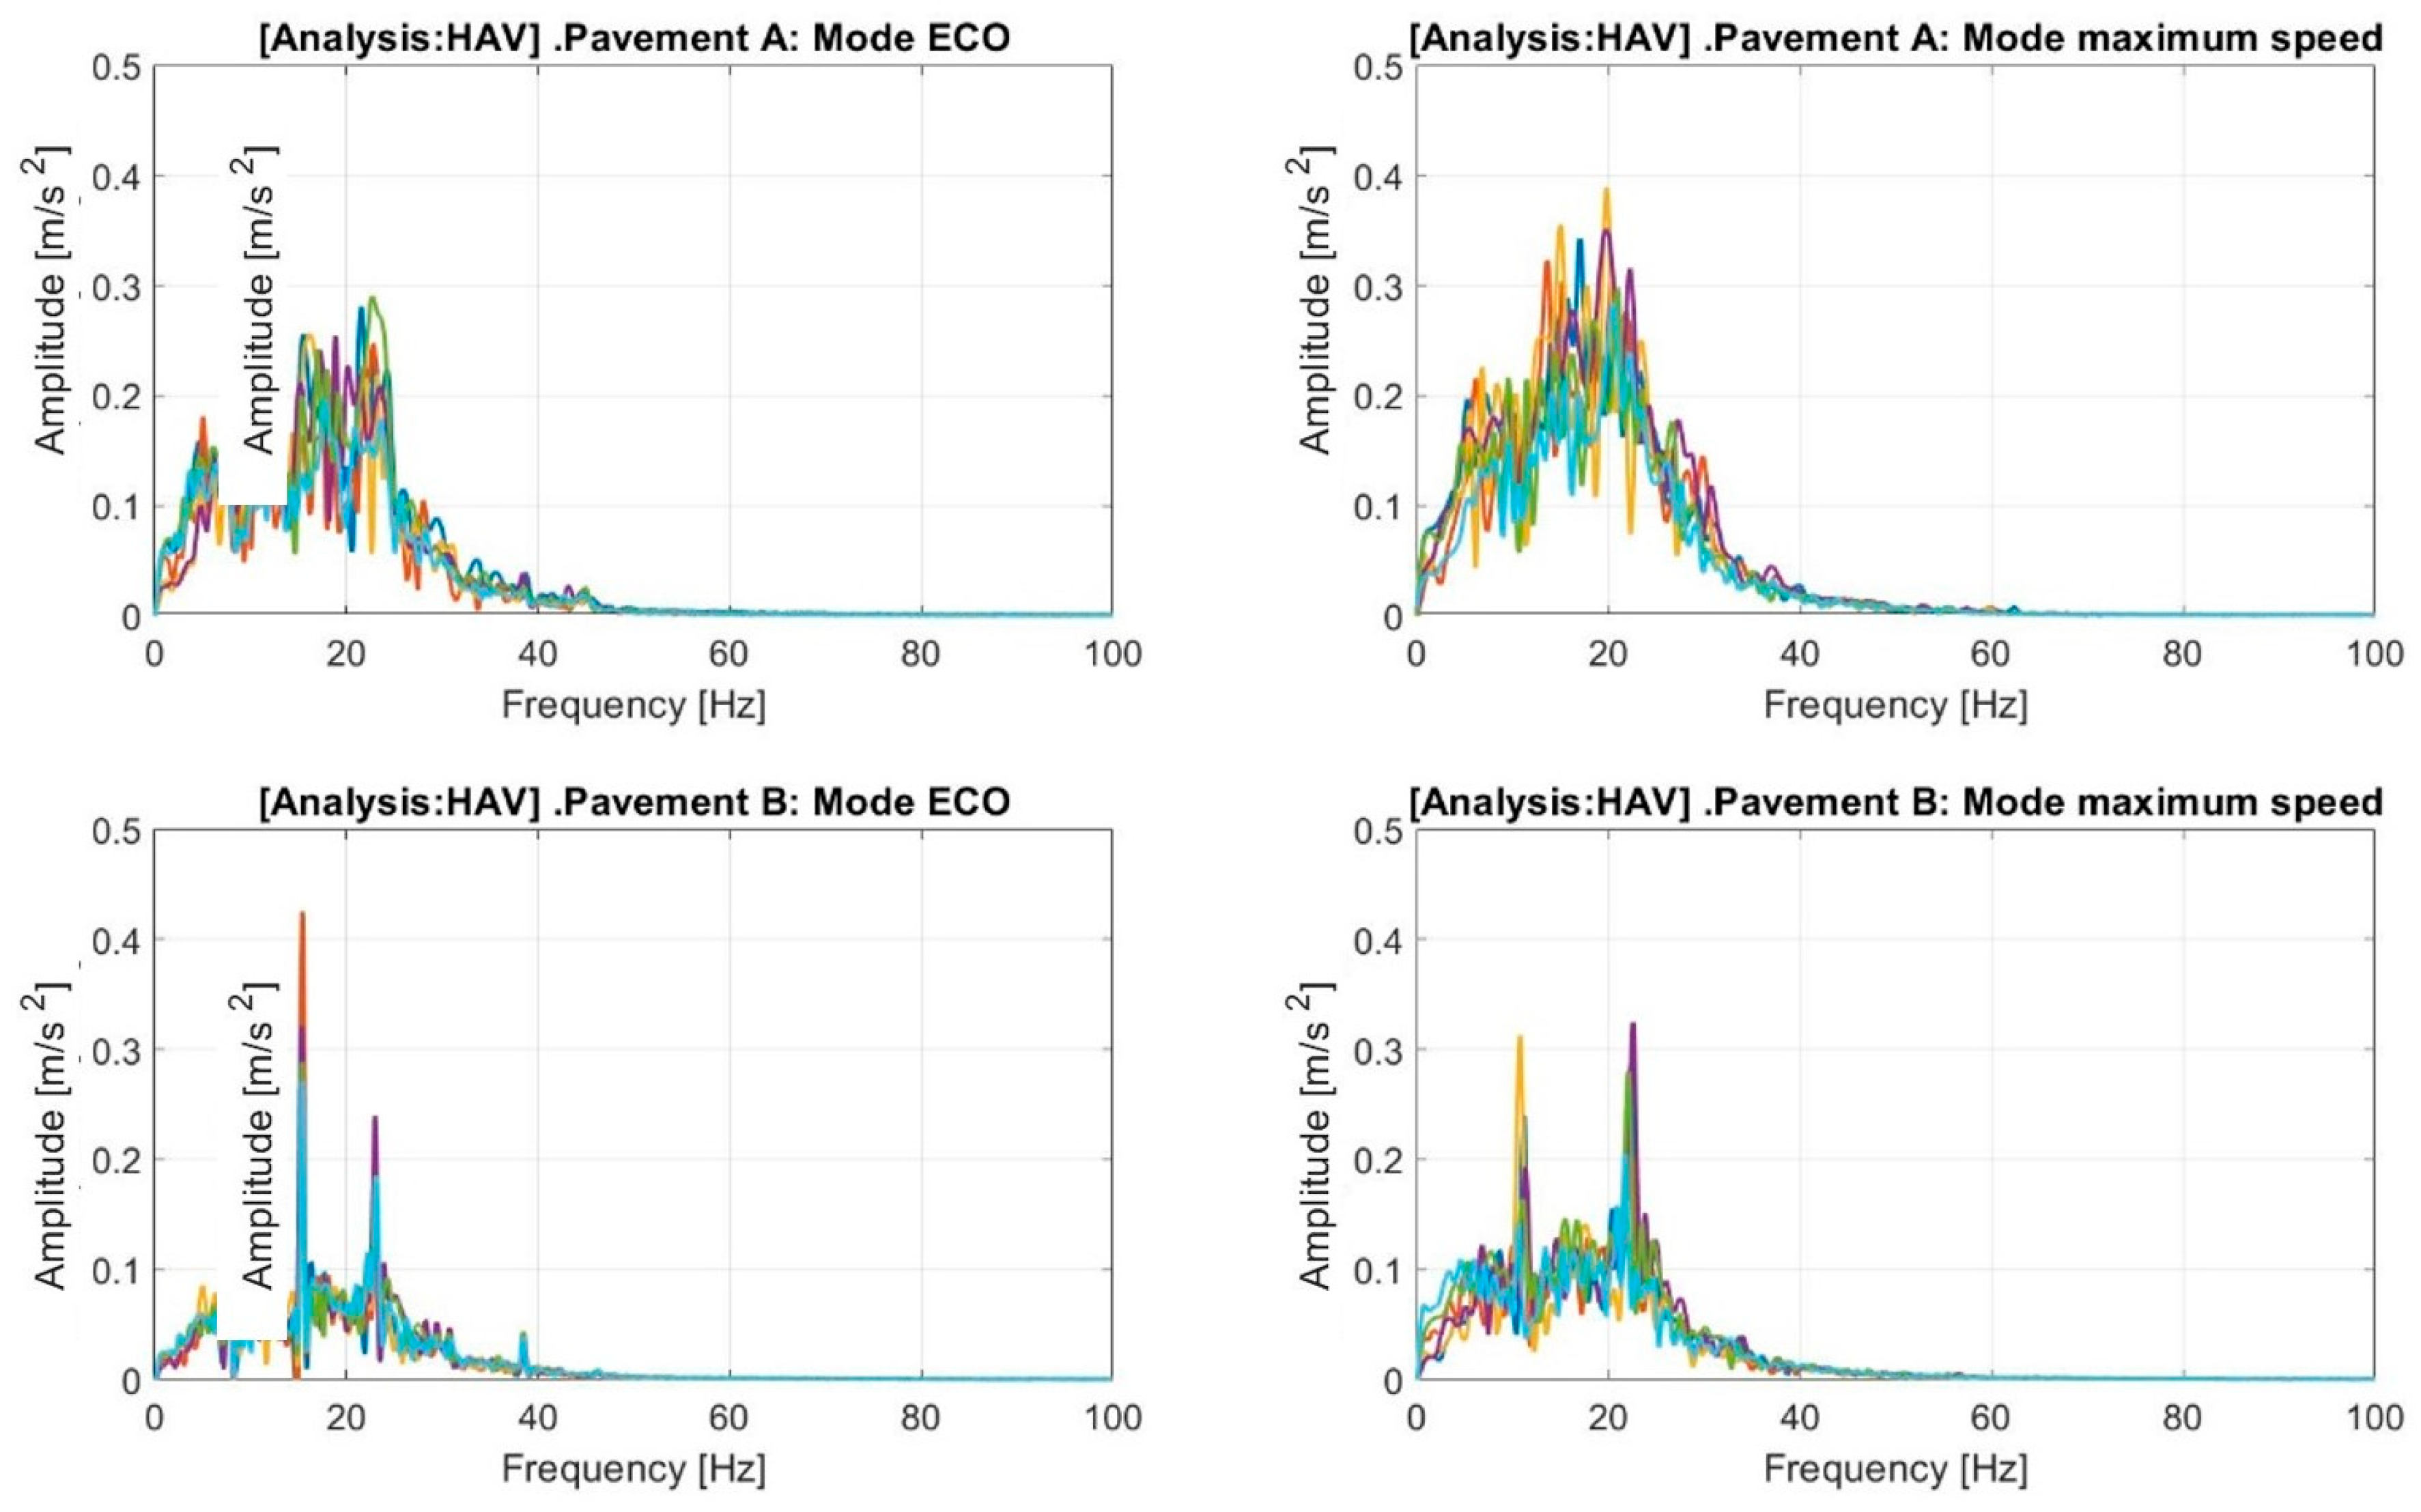
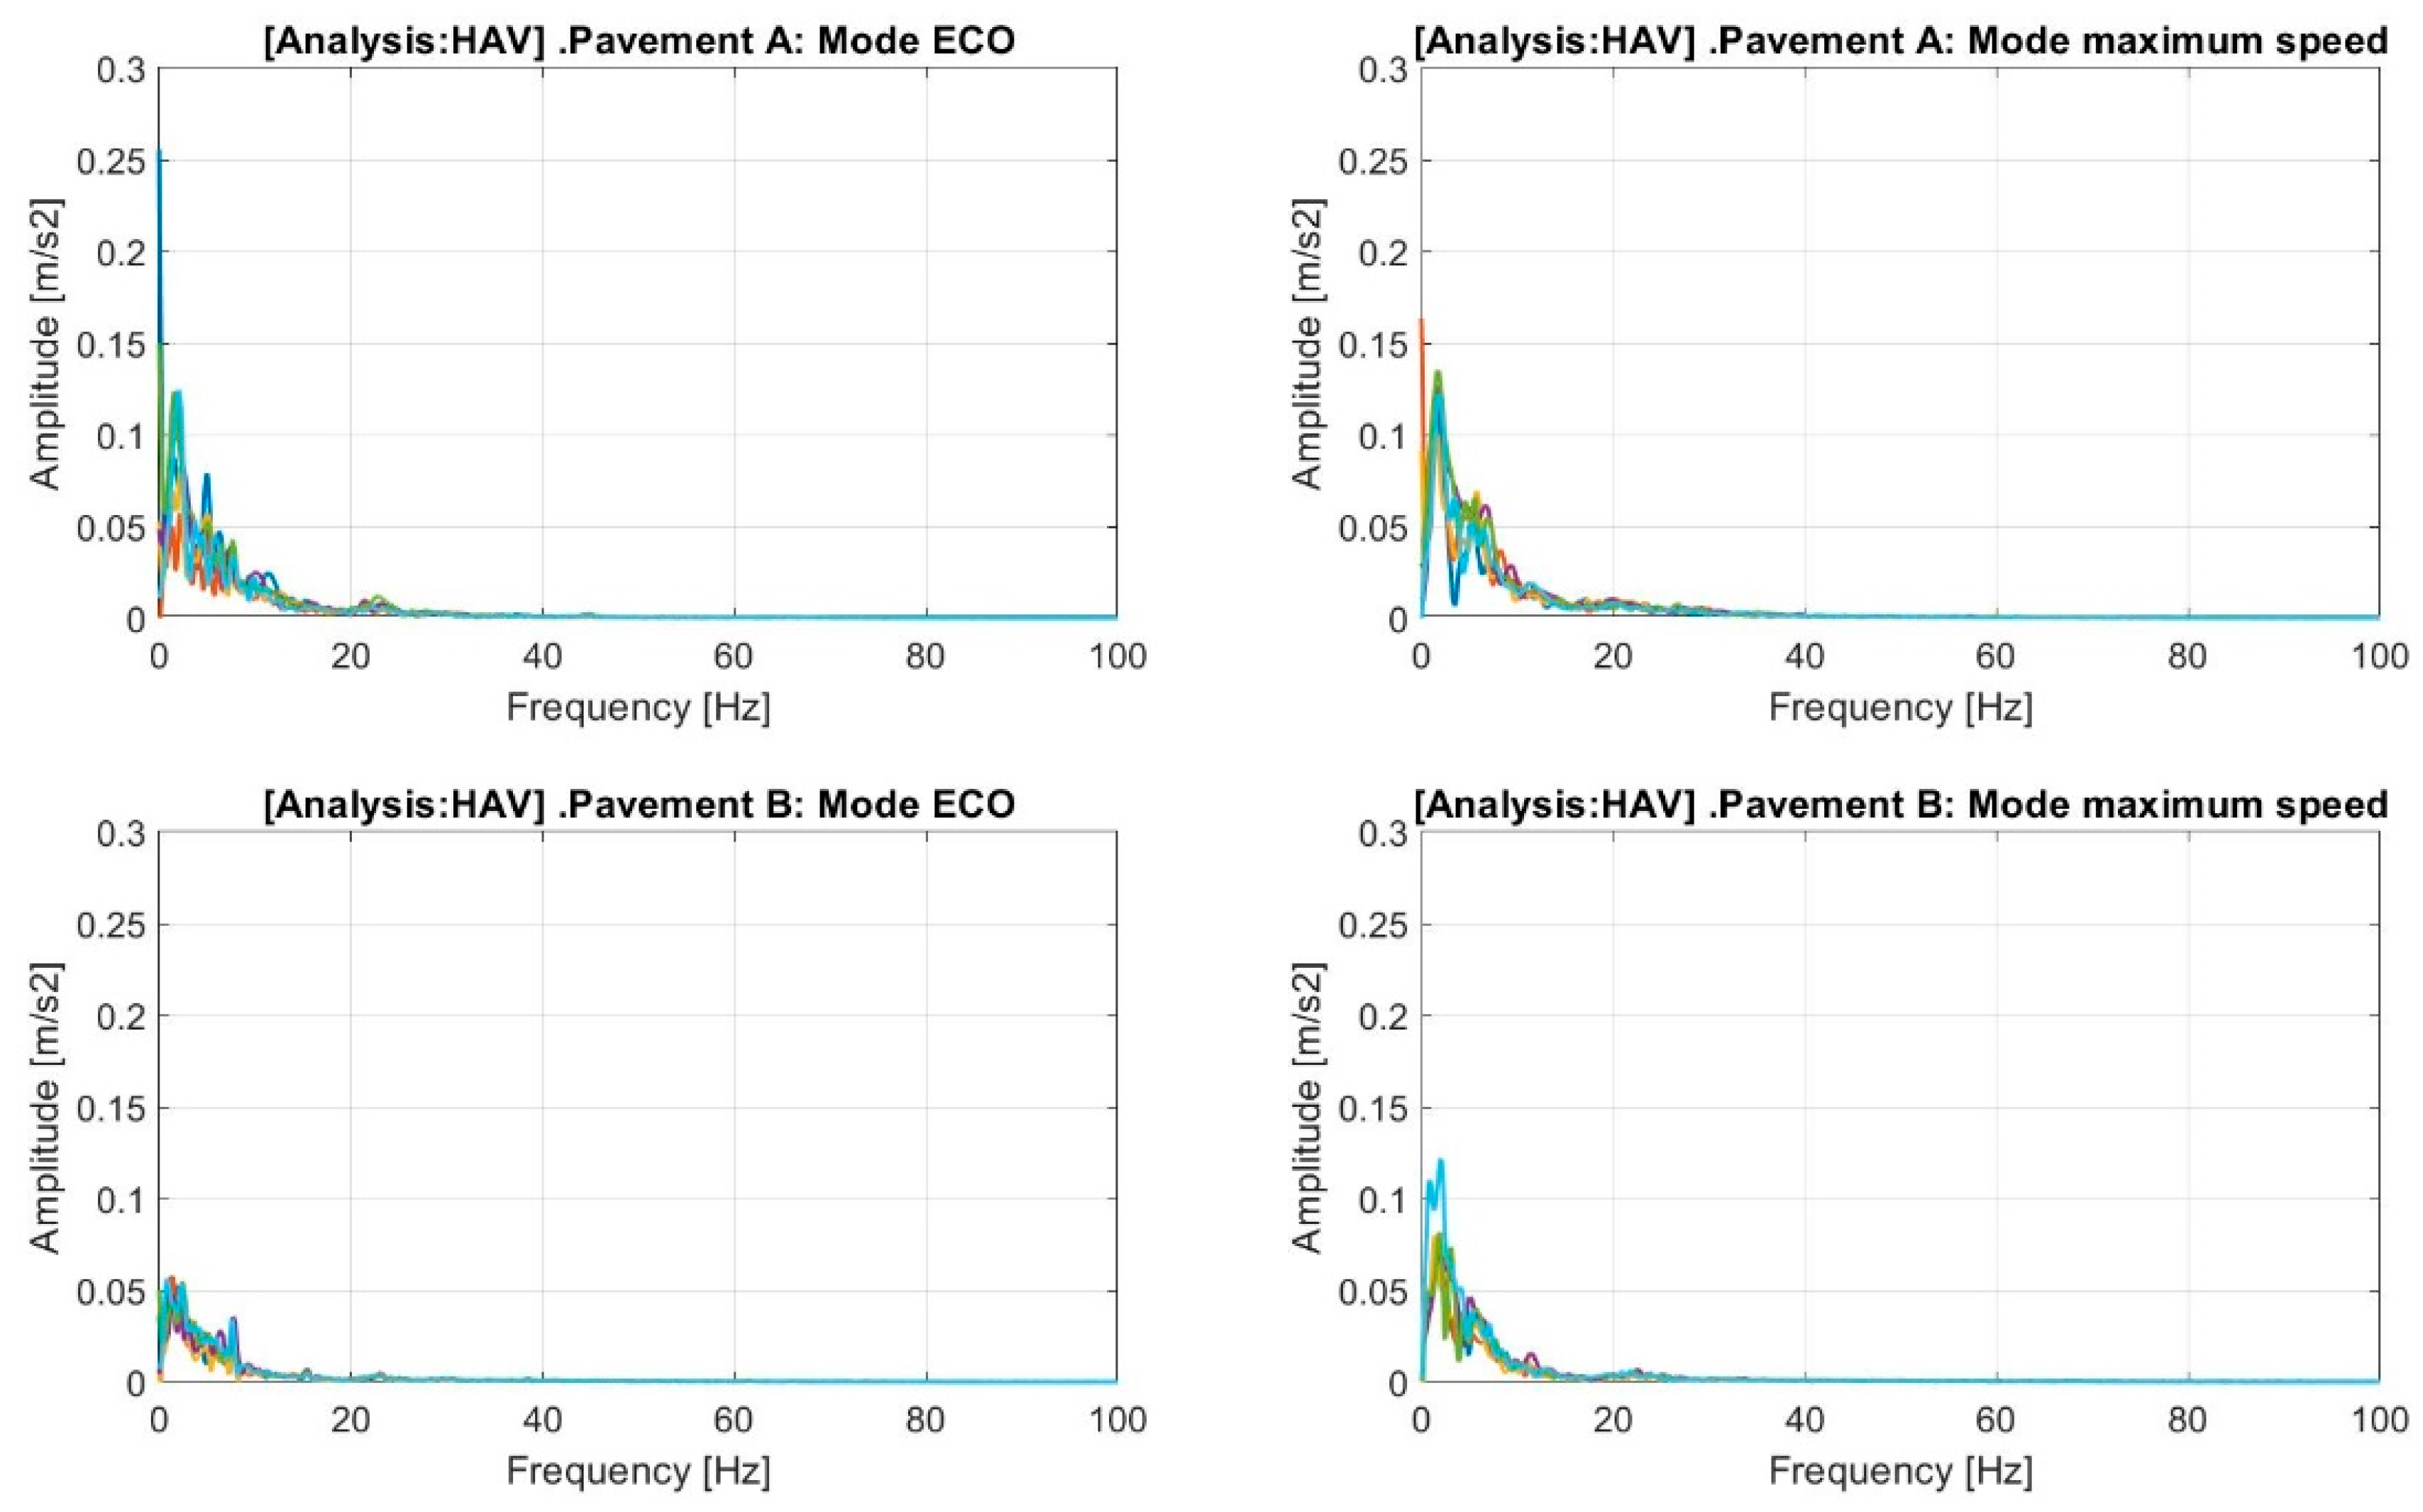
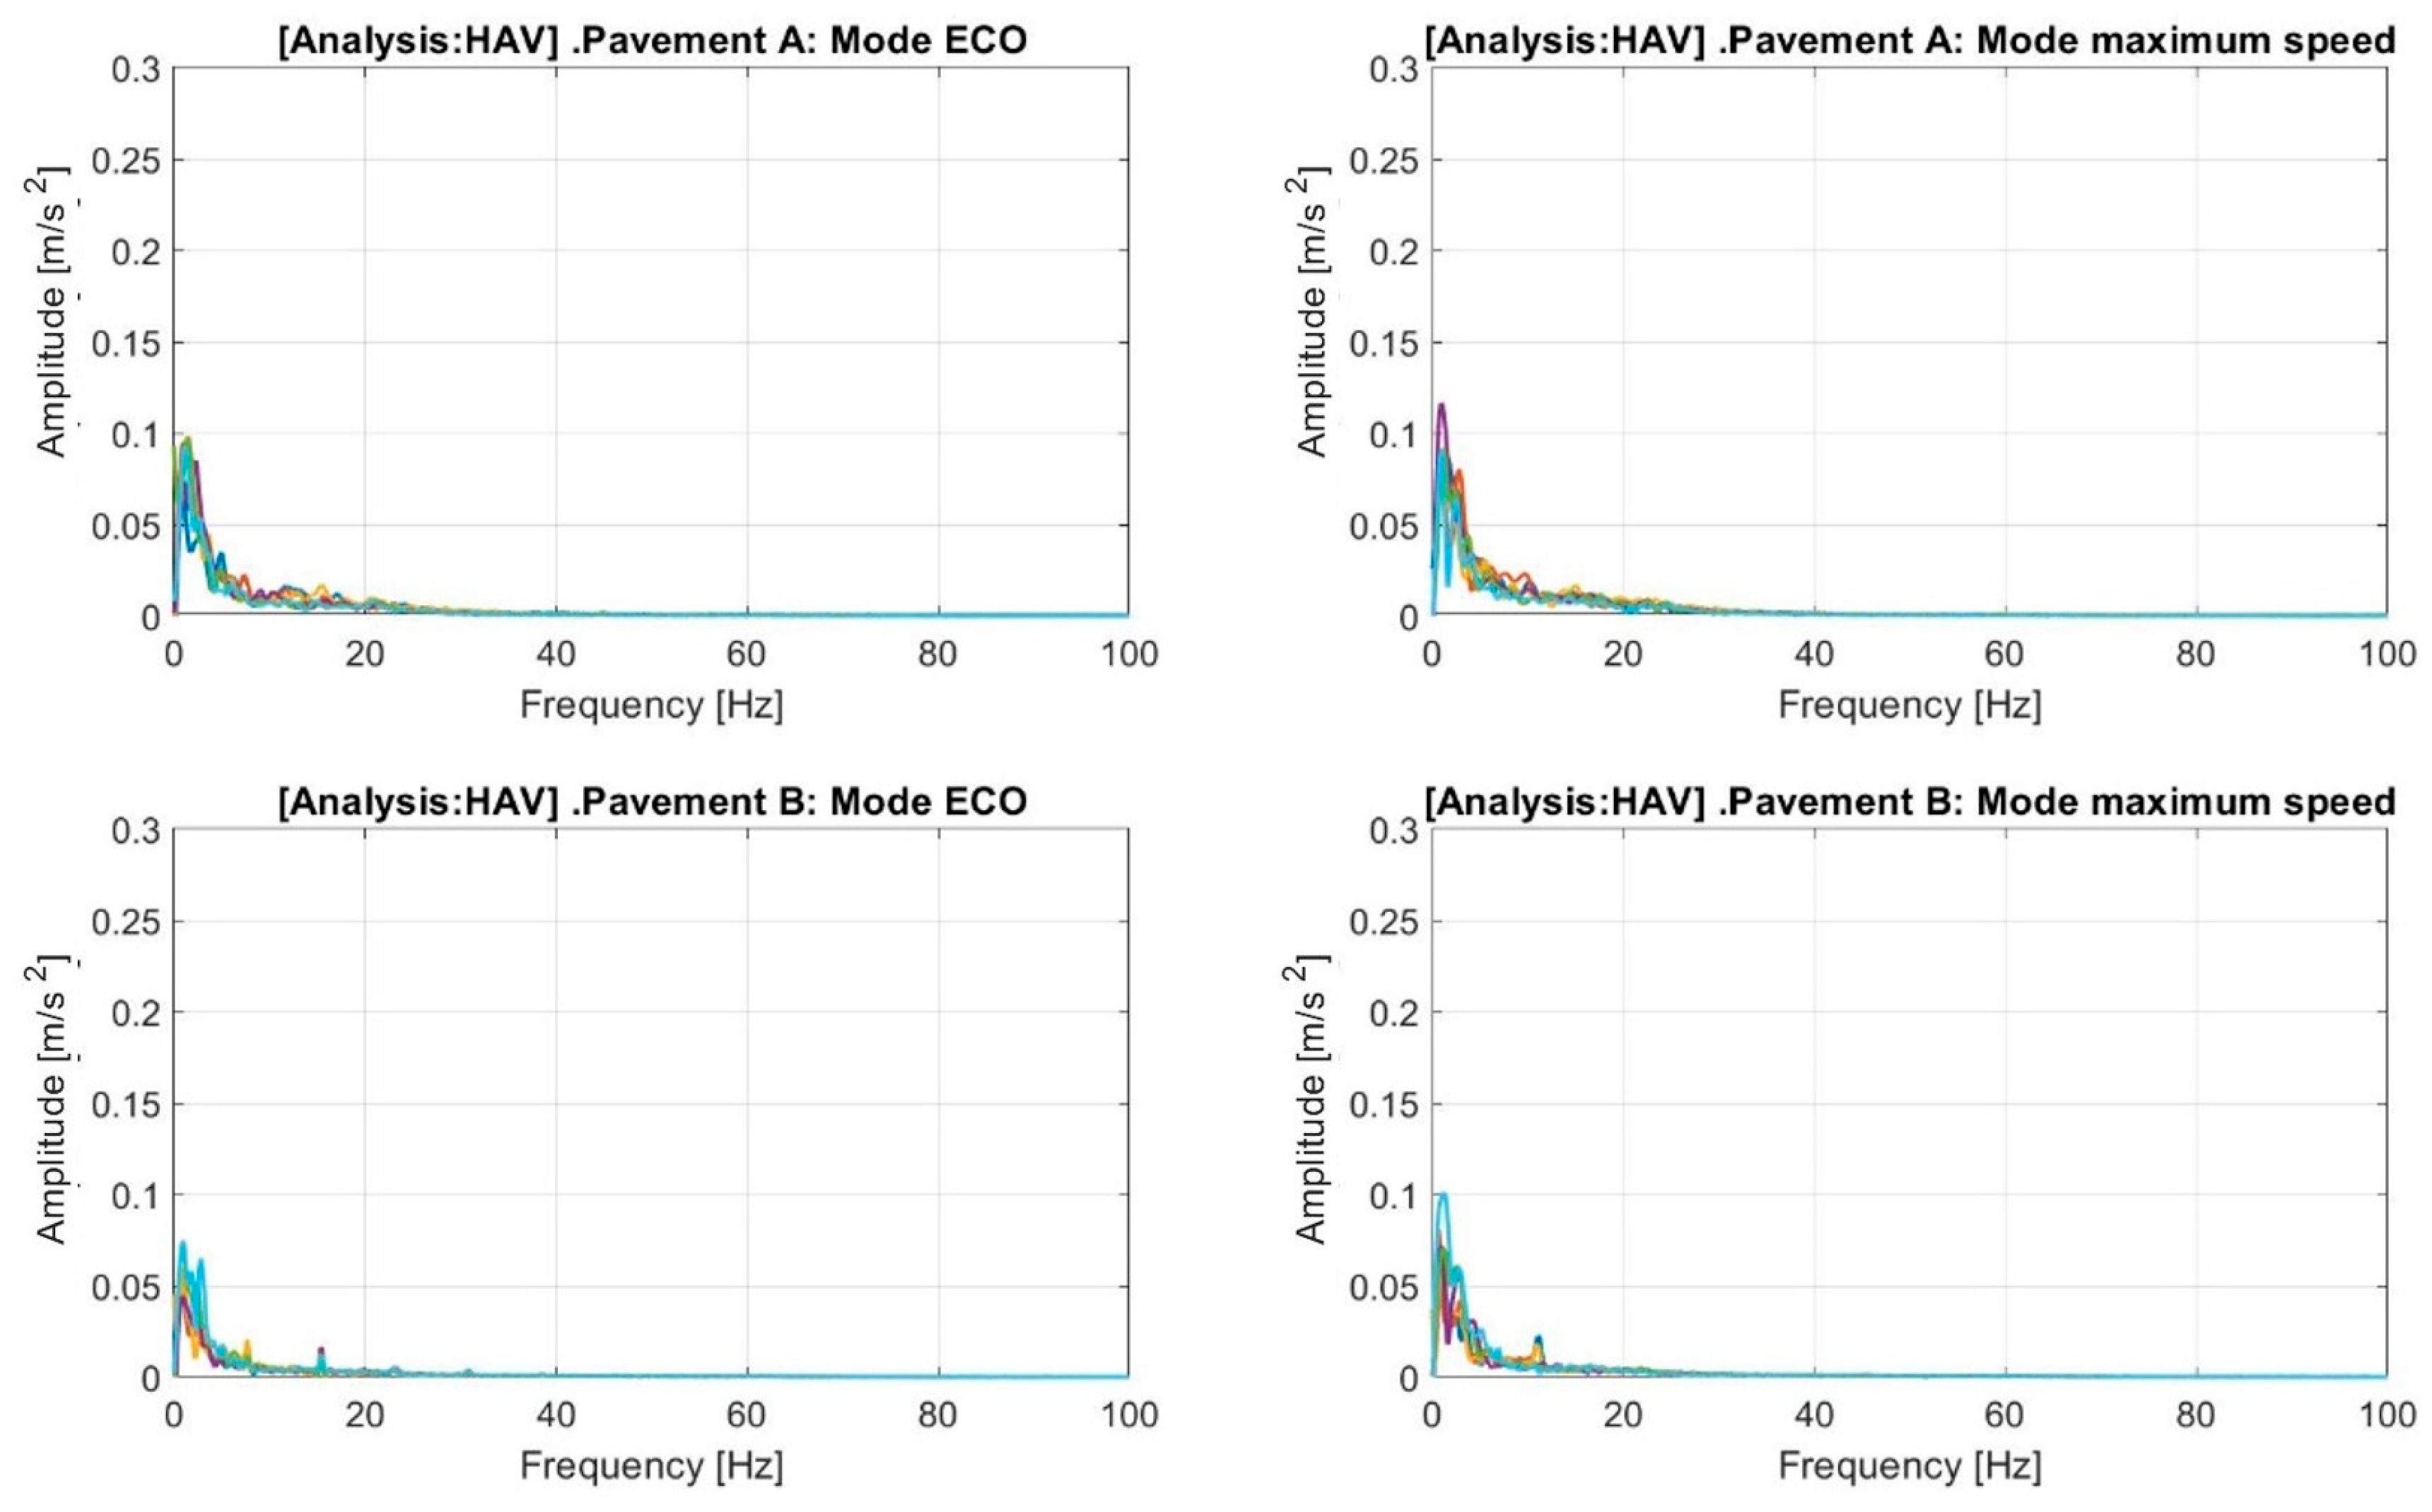
The overall results show clear WBV levels that are potentially harmful or harmful to health. The mean results show that more than 50% of the HAV levels in Zone B and 37% in Zone C are detrimental. This supposes that e-scooter vibration levels are not adequate from a health point of view. The results show clear differences in the vibrations generated by different pavements. They indicate that driving an e-scooter on pavers is more detrimental to health than driving the e-scooter on asphalt. The mean value of harmful vibration levels increases up to five times on pavers compared to that on asphalt pavements. An analysis of the frequency domain indicates that the main frequencies for the measured accelerations are less than 40 Hz (Figure A9, Figure A10 and Figure A11 in Appendix A). This characterises the vibration frequency spectra and the minimum sample frequency required (i.e., 80 Hz) considering the Nyquist criterion.
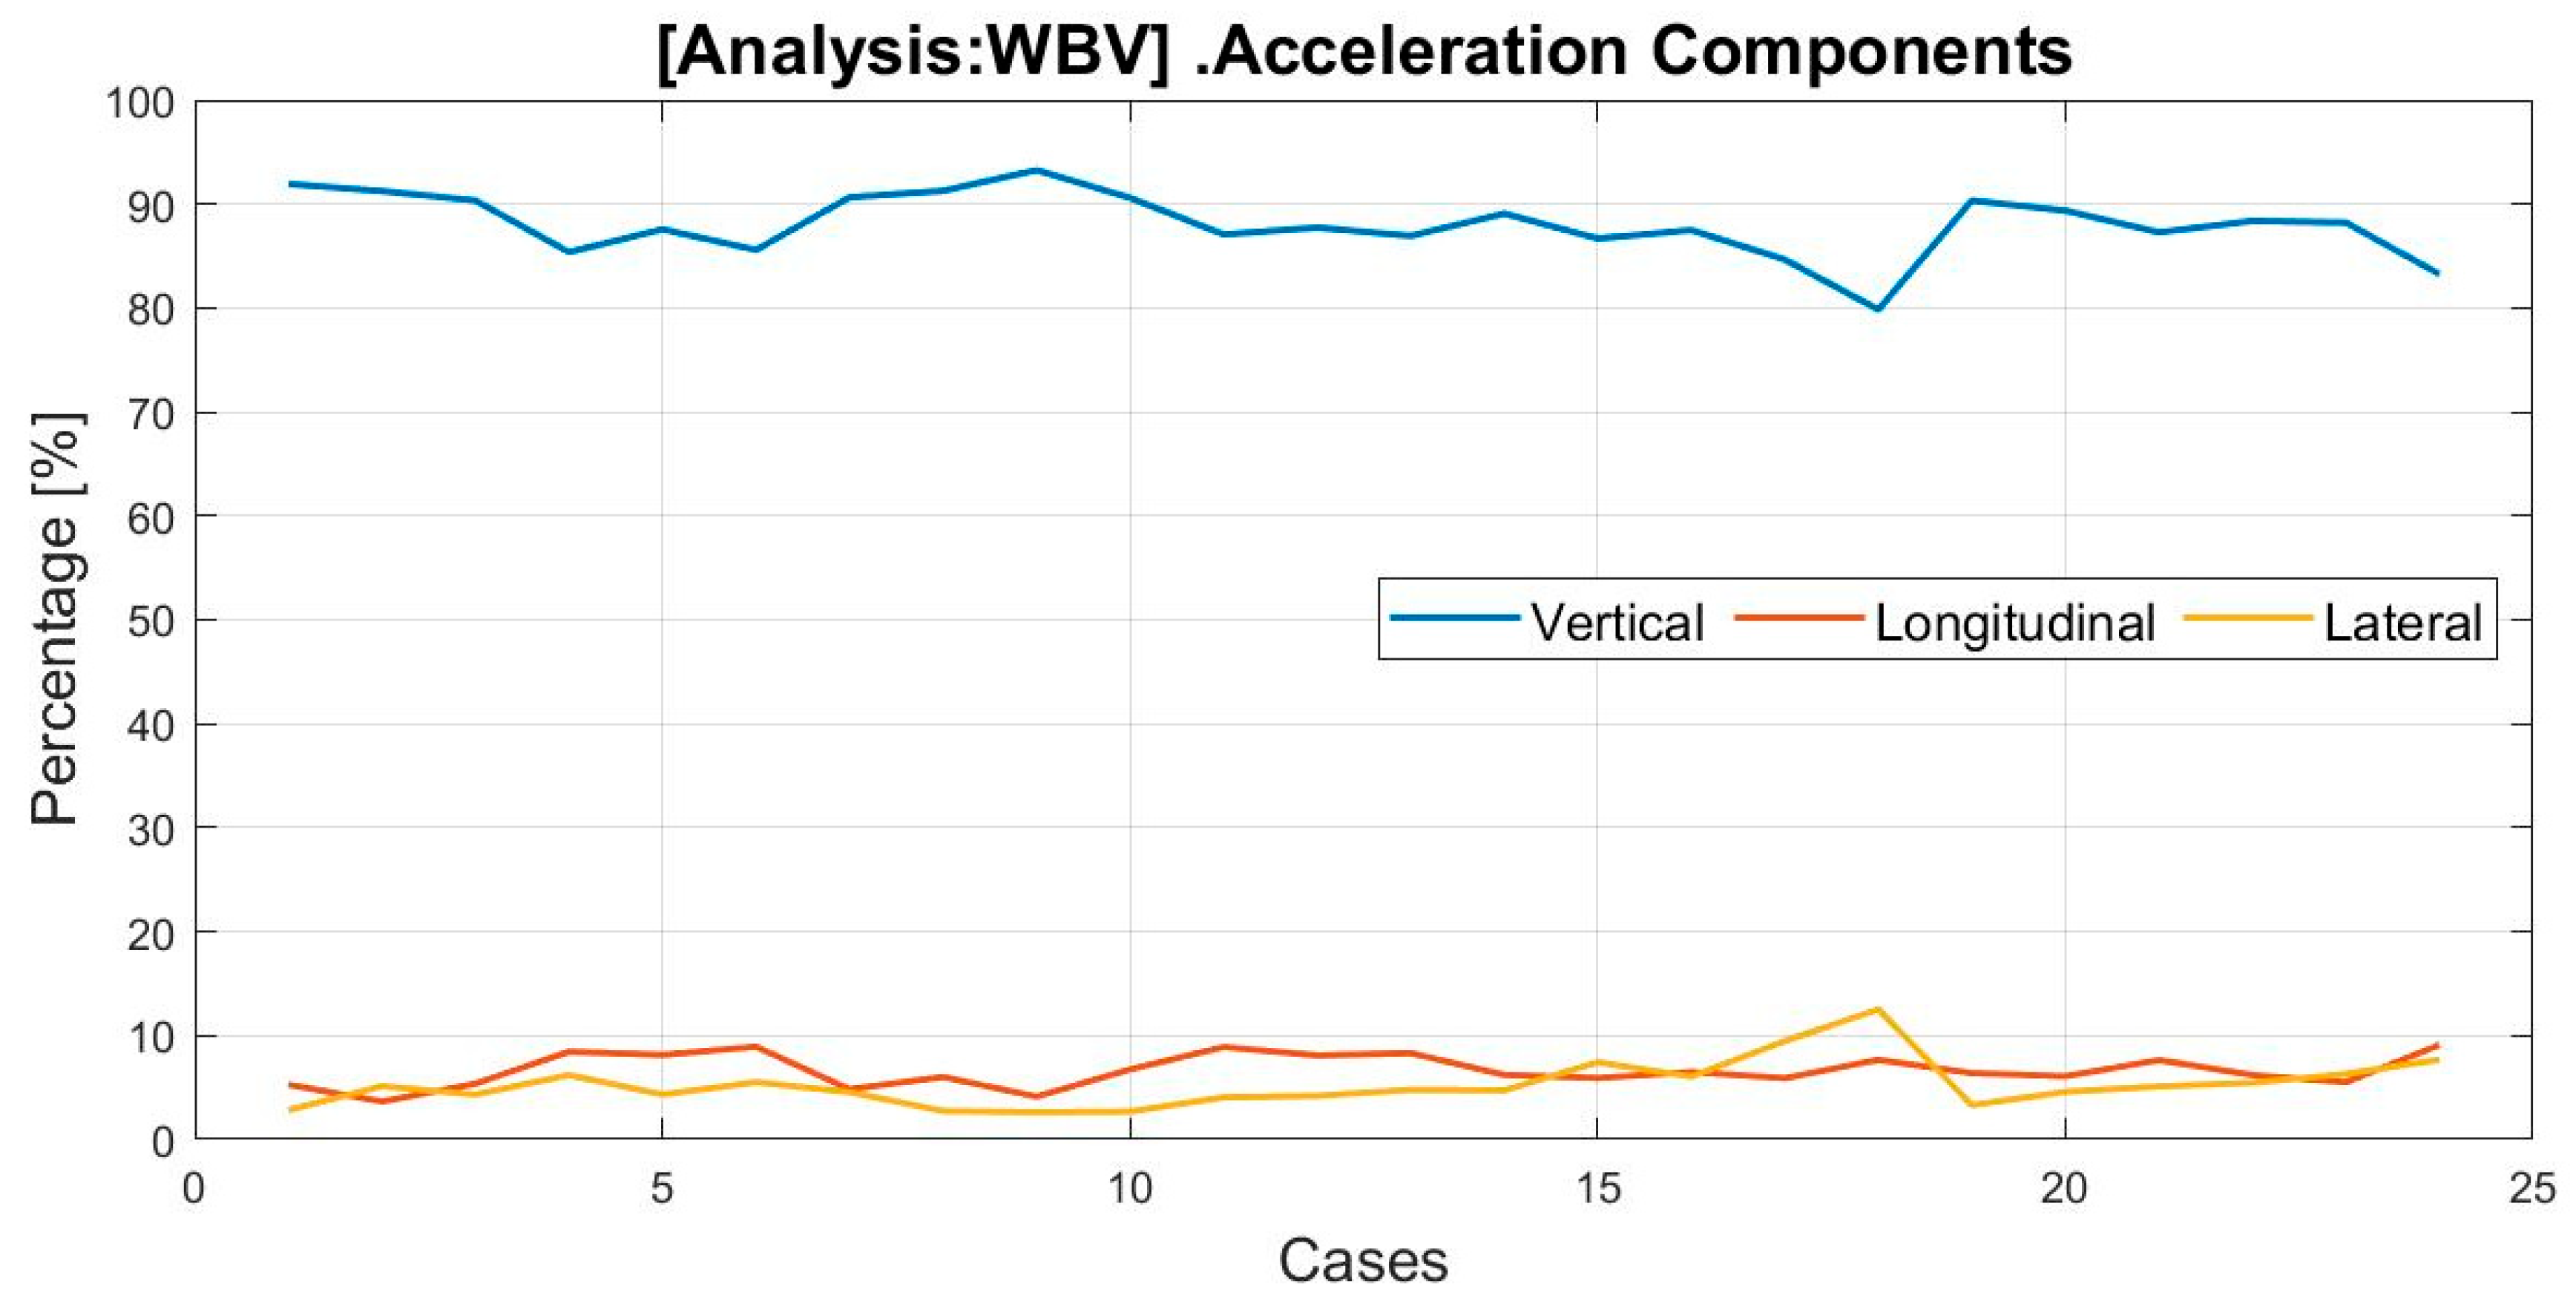
Figure 6 shows the contribution of each acceleration component to the acceleration considered for the WBV for each of the 24 cases defined in the DoE. Based on Equation (2), vertical accelerations cause 88.10% of vibrations impacting health. In contrast, the longitudinal and lateral accelerations only cause 6.65% and 5.25% of vibrations affecting health, respectively.
3.2. Hand–Arm Vibrations (HAVs)
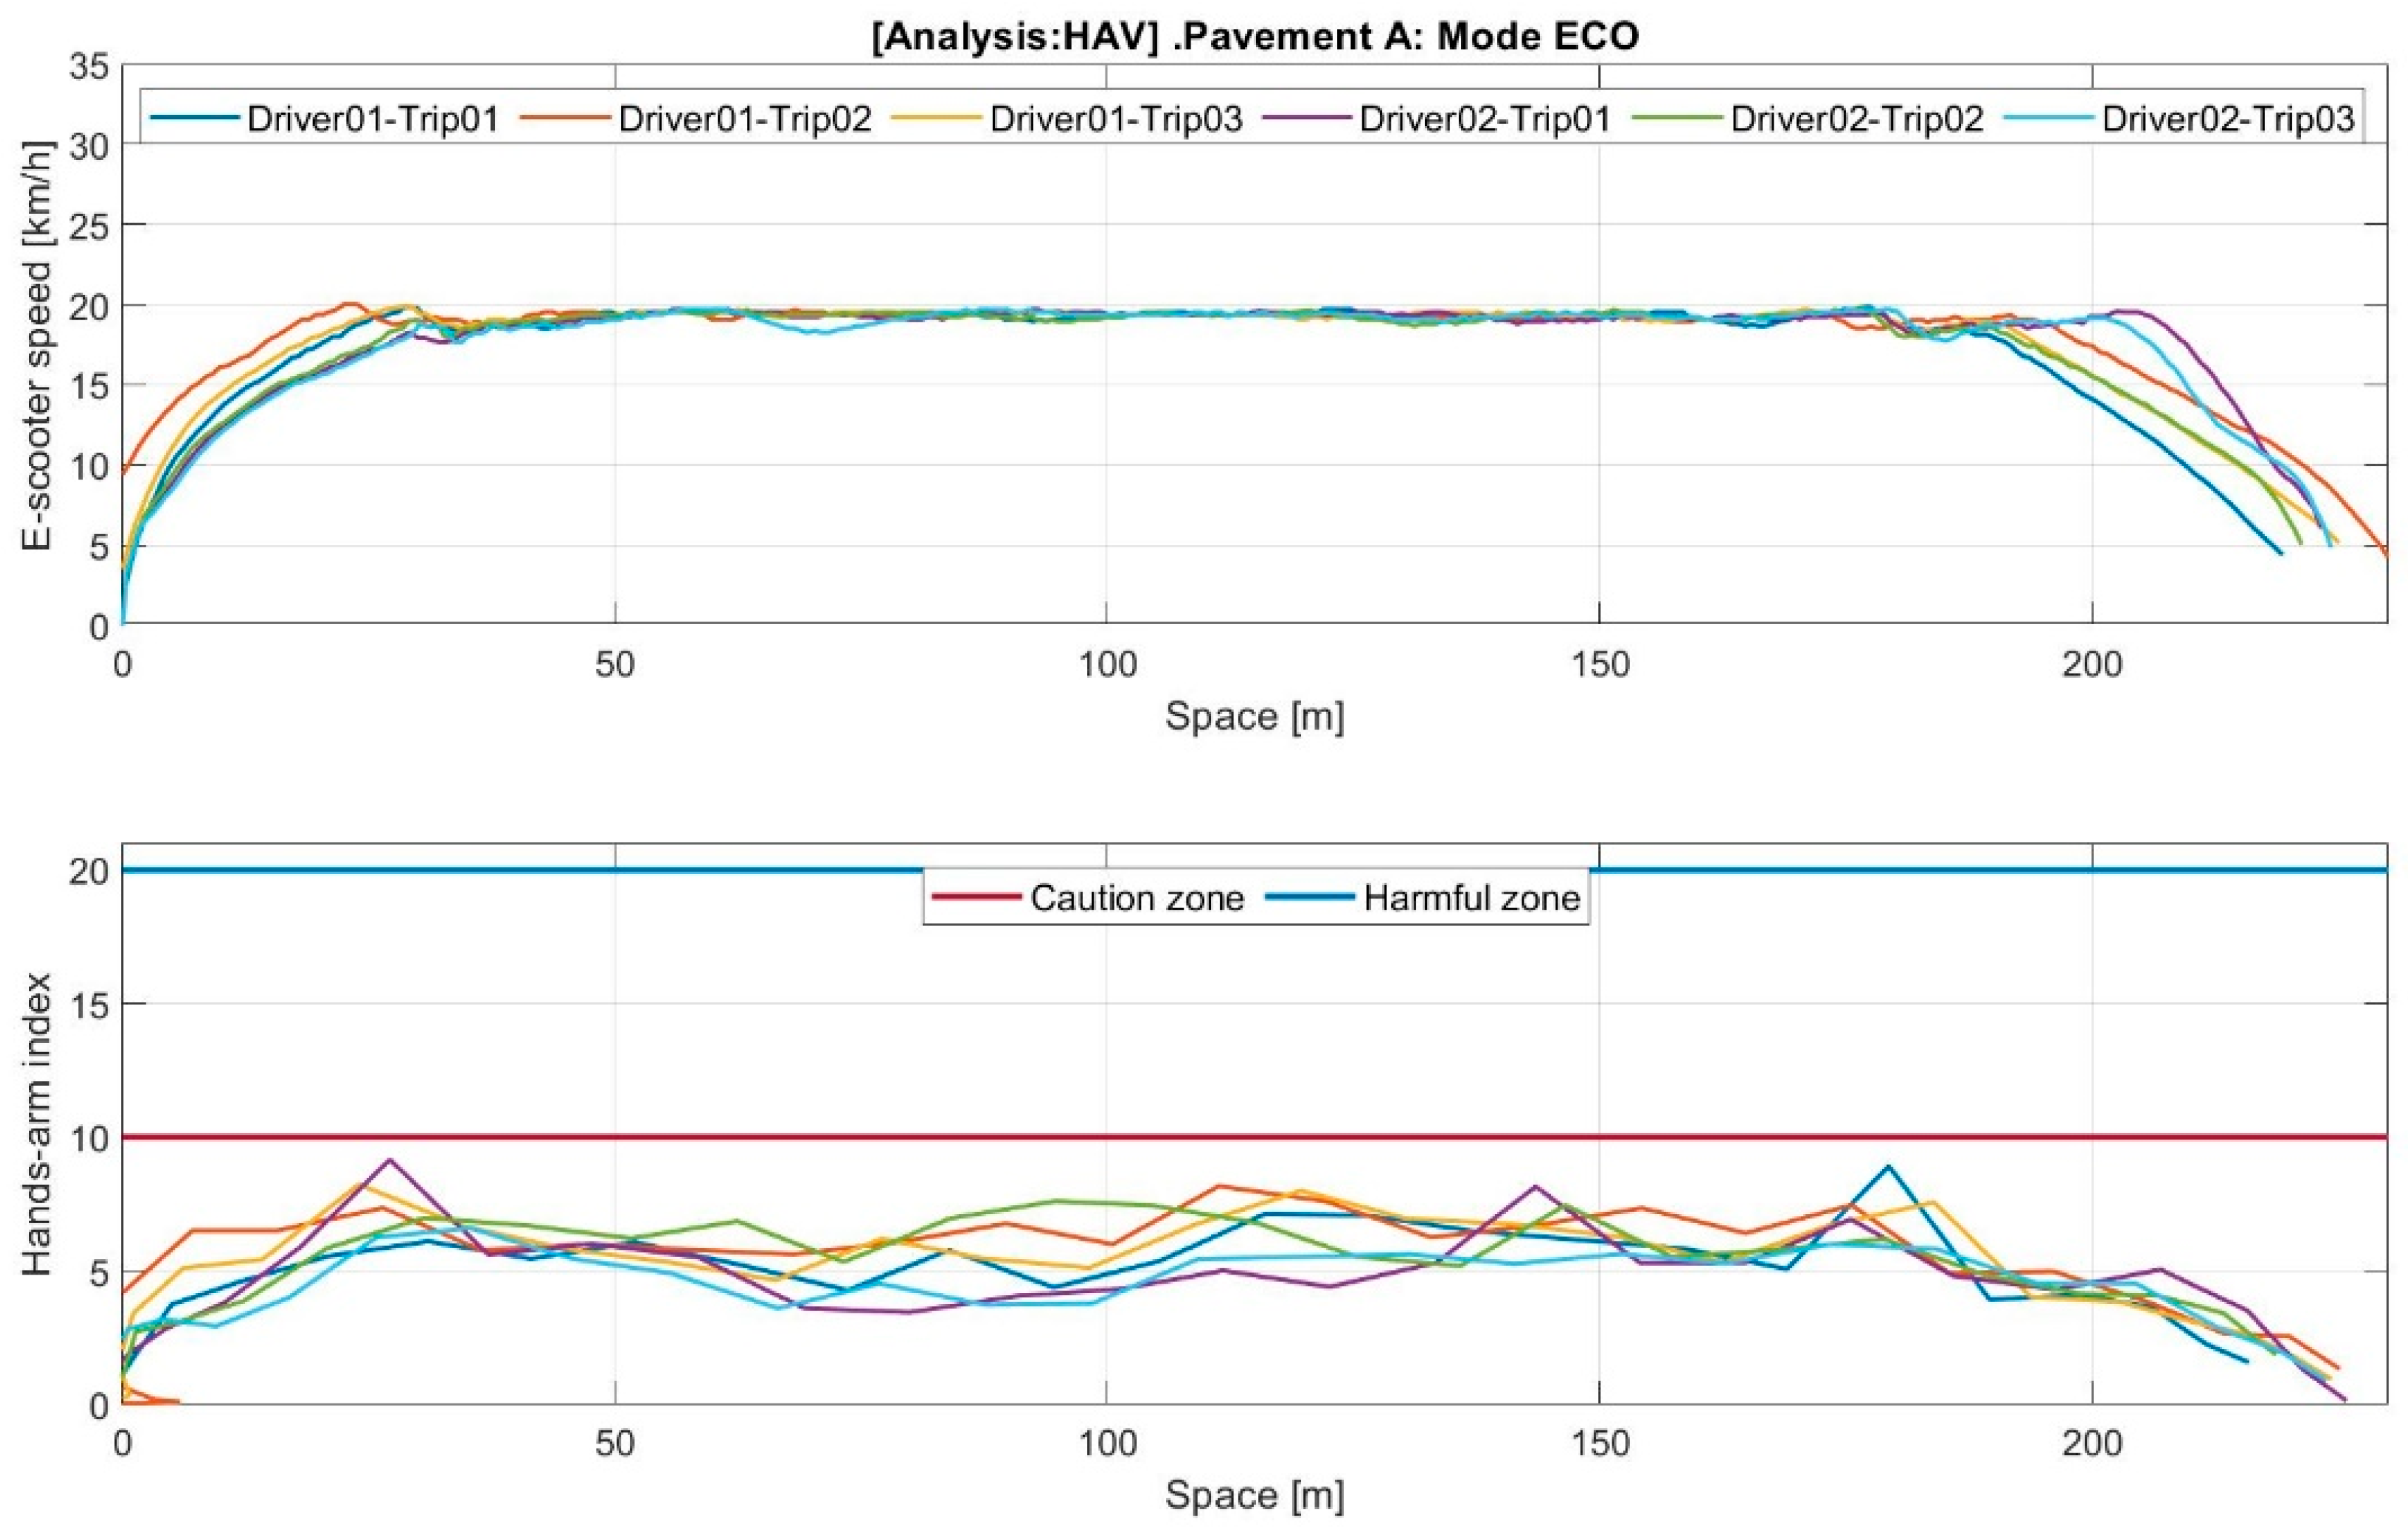
The results related to HAVs were calculated using Equation (12) and are listed in Table 4. Similarly, the mean values for each type of pavement in each zone and the mean value in each zone considering both speed modes were calculated.
The results in Table 4 clearly indicate the tendencies of HAV levels. The levels fall within Zone A (outside the caution or action zones), following the threshold recommendations of the European Directive and adapting them to the e-scooter mean exposure time considered (30 min). These results suggest that e-scooter vibrations are not harmful to health from the HAV perspective.
This study has the following limitations: (1) The vibration accelerations in the e-scooter frame are assumed to be the same as those in the handlebar (assuming negligible damping at the handlebar). (2) The frequency of the selected database was 200 Hz; however, UNE-5349 recommends a higher sample frequency. The first limitation is resolved by assuming that even at locations with low vibration levels, the handlebars can damp accelerations by approximately 20% [26]. The second limitation is related to the study of Reynolds et al. [27], who investigated the influence of vibrations at low and high frequencies. They concluded that vibrations exceeding 100 Hz were isolated by hands and fingers. This result is consistent with the values shown in Figure A9 and Figure A10 considering the accelerations investigated in the frequency domain; that is, the amplitude remarkably decreases starting from 40 Hz. Considering both limitations, the result establishes the first reasonable analysis of the influence of e-scooter on HAVs.
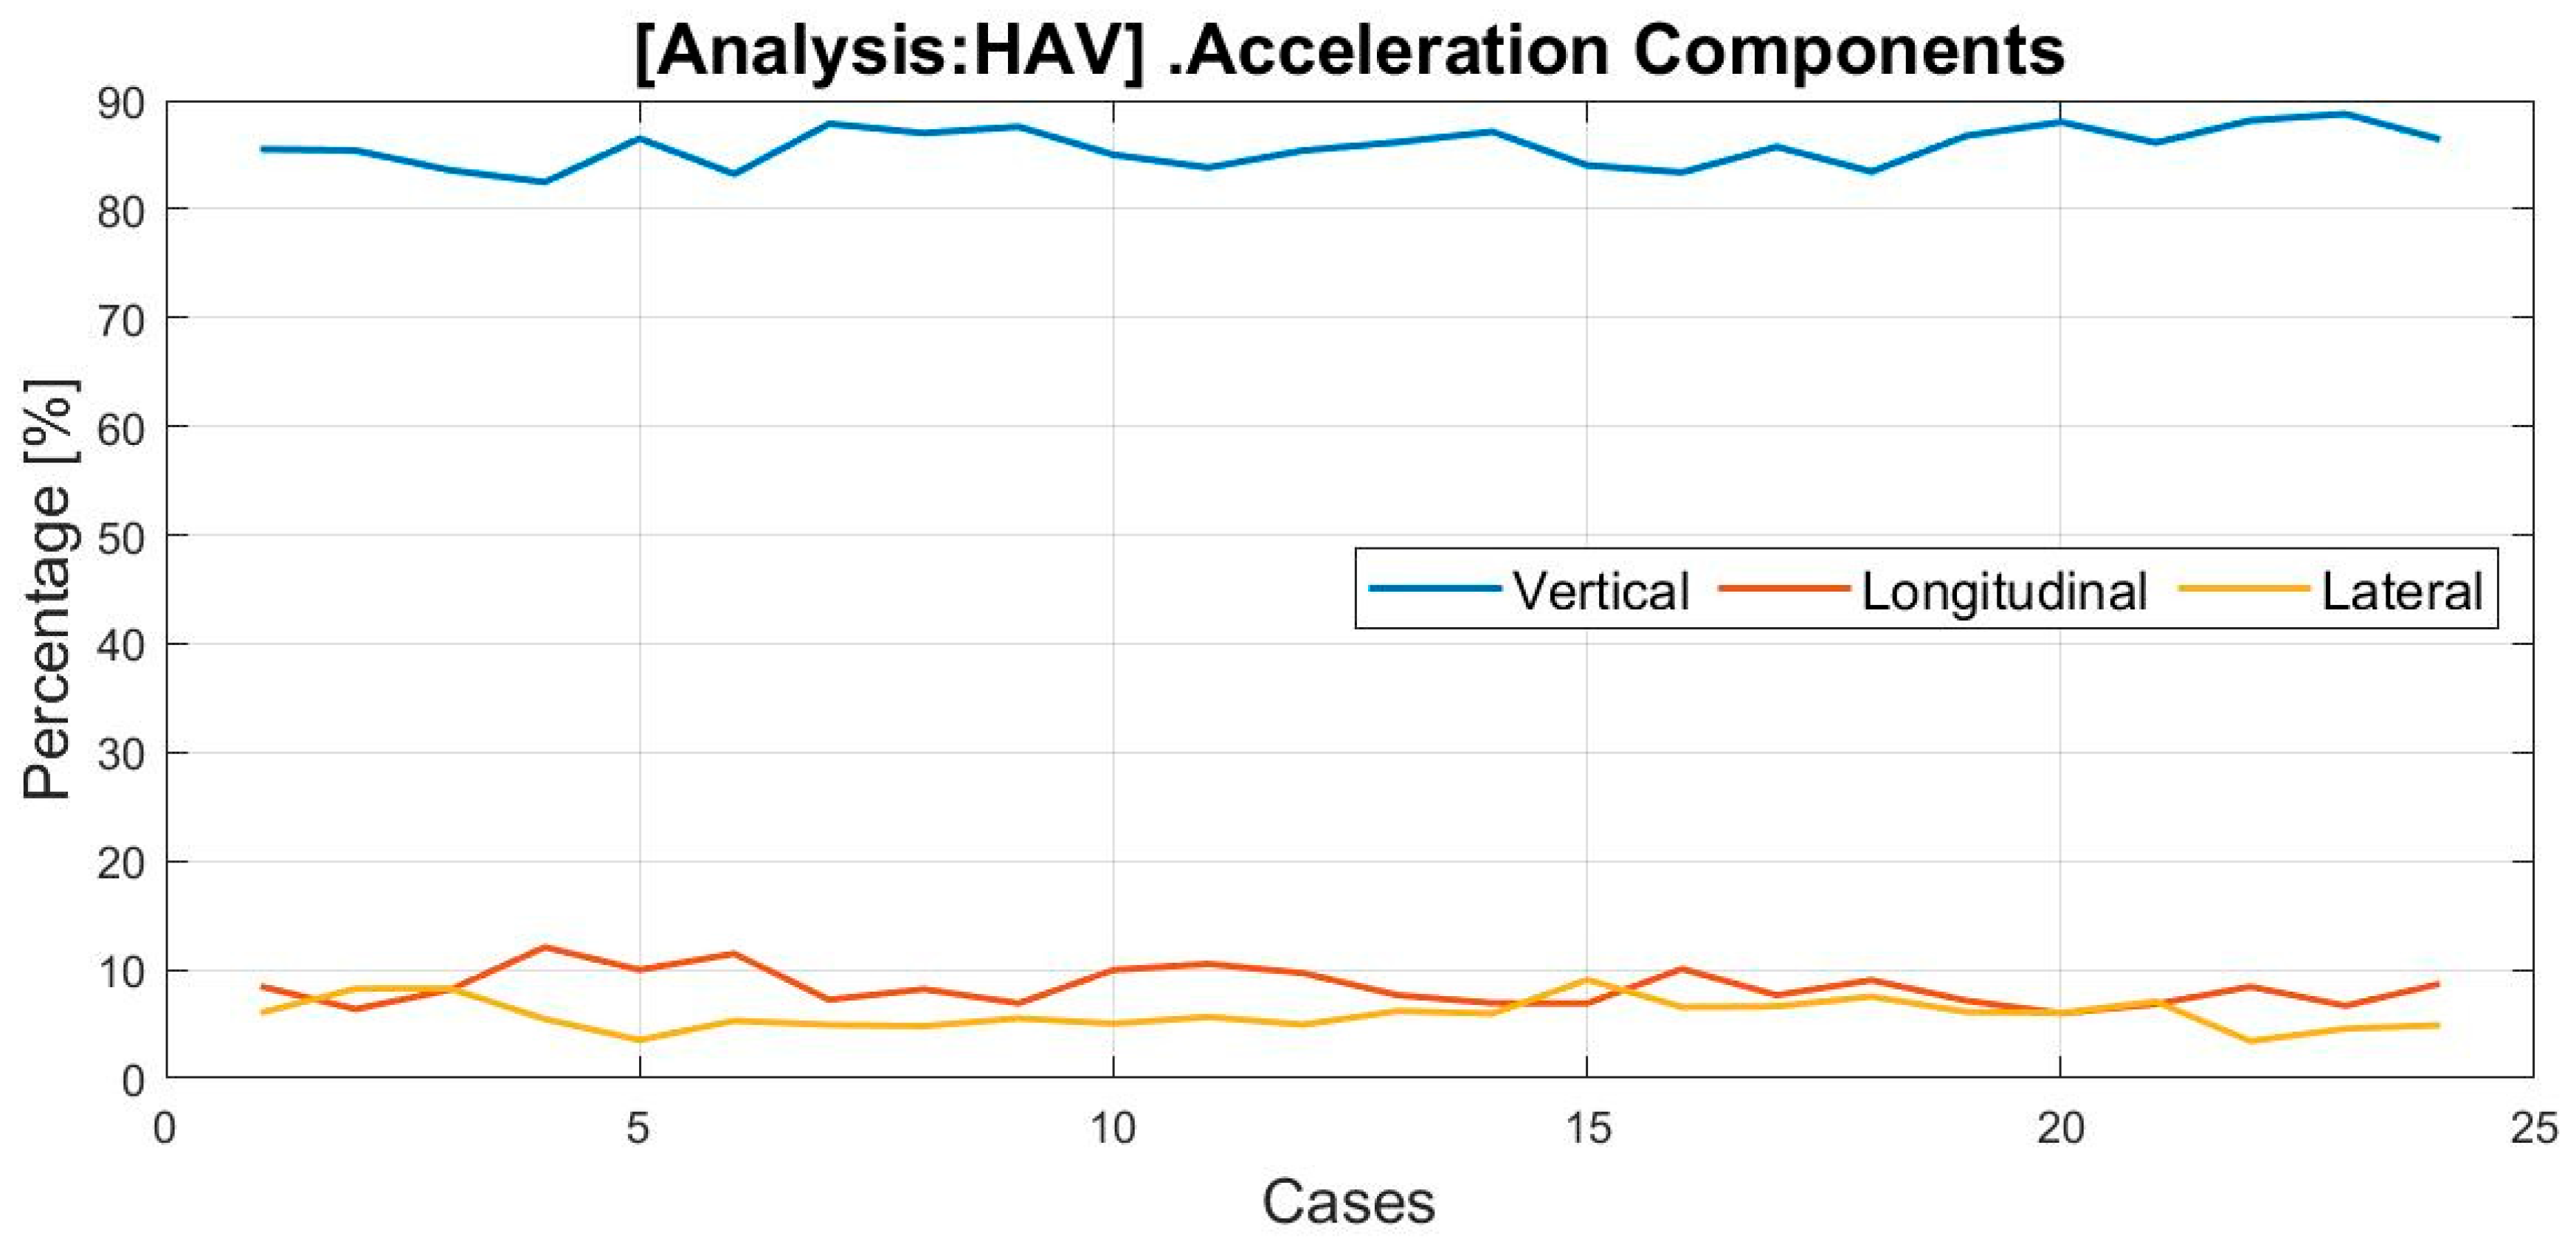
Figure 7 aids in understanding how each acceleration component contributes to the acceleration considered in the HAV (i.e., ) given by Equation (3). Here, vertical acceleration is the main component (85.72%). However, accelerations in the longitudinal and lateral directions (8.38% and 5.9%, respectively) are more relevant.
Raynaud Syndrome
Chronic exposure of hands to vibration can cause Raynaud’s syndrome [28], also called HAV syndrome. It affects the blood vessels, nerves, muscles, and joints of the hands, wrists, and arms. Its well-known effect is vibration-induced white finger, a term introduced in the United Kingdom by the Industrial Injury Advisory Council in 1970 [29]. Injury can occur at frequencies in the range 5–2000 Hz; however, the fingers are at a greater risk when the vibration frequency is 50–250 Hz [30]. As mentioned earlier, some authors [27] have concluded that hands and fingers isolate vibrations at frequencies exceeding 100 Hz.
Table 5 summarises the number of years that must pass before Raynaud’s syndrome can be observed in 10% of the studied population considering an exposure time of 30 min/d and mean HAV levels.
The foregoing results indicate that for the selected hand vibration exposure time of 30 min, the use of e-scooters is not a relevant cause of Raynaud’s syndrome as at least 25.9 years of e-scooter riding at maximum speed through a paver pavement must pass before the syndrome can occur. These values also have the same limitations in terms of sampling frequency and handlebar considerations. If handlebar damping is considered, the imparted vibration can further decrease. Evidently, this type of vibration has an insignificant effect on the health of hands and arms.
4. Conclusions
The impact of e-scooter vibrations on driver health was investigated based on real measurements of the acceleration and longitudinal speed of an e-scooter model. The study focused on the impacts of WBV and HAV based on the European Vibration Directive criteria.
Based on the UNE-2631 and UNE-5349 standards, as well as the European Vibration Directive, vibration zones were defined from a health perspective. The thresholds of these zones are based on statistics and research in which the daily vibration exposure time of a driver of a common e-scooter is 30 min.
With regard to WBV, the study results show mean percentages of 87.54% and 95.47% of non-desirable vibrations for e-scooter riders driving on pavers and asphalt, respectively. This shows that ‘potentially non-healthy’ and ‘non-healthy’ vibrations are 25.69% and 61.85%, respectively, when driving on pavers and 85.52% and 12.96%, respectively, when driving on asphalt. This leads to the conclusion that the WBV levels reached when riding an e-scooter on any type of pavement are potentially harmful to health and invariably harmful when driven on pavers.
The study of vibration impact on the hands considered HAV and the incidence of Raynaud’s syndrome. In both cases, the threshold and vibration levels obtained suggest that e-scooter vibrations do not cause significant health problems in the hands and arms.
The results indicate that the mechanical design (mainly wheels and damping systems) of e-scooters must be improved to mitigate the impact of WBVs on health. From a health perspective, damping is mainly required in the vertical direction because the contribution of acceleration in this direction for WBV and HAV is approximately 90%. Improvements could also be guided by formulating appropriate policies and requirements for e-scooter models.
As a limitation, the accelerations for the hands must be measured only when handlebar damping is considered. This reinforces the conclusion that e-scooter vibrations have an extremely low impact on hand health. We will examine this aspect and increase the sample size in future studies. Other planned future work is related with studying the influence of real roughness on e-scooter vibrations, in line with other studies [31]. In addition, we are going to study the sensibility of different mechanical and dynamical properties on e-scooter vibrations and measuring vibrations in new e-scooter models.
Author Contributions
Conceptualization, J.D.C.-M. and J.M.C.B.; methodology, J.D.C.-M.; software, J.M.C.B.; formal analysis, J.D.C.-M.; investigation, all authors; data curation, J.D.C.-M.; writing—original draft preparation, J.D.C.-M. and J.M.C.B.; writing—review and editing, J.M.A.R. and M.E.I.M. All authors have read and agreed to the published version of the manuscript.
Funding
This research received no external funding.
Data Availability Statement
Dataset analysed can be found at https://zenodo.org/record/6977206#.ZJCz4nZByUl, accesed on 10 October 2022.
Conflicts of Interest
The authors declare no conflict of interest.
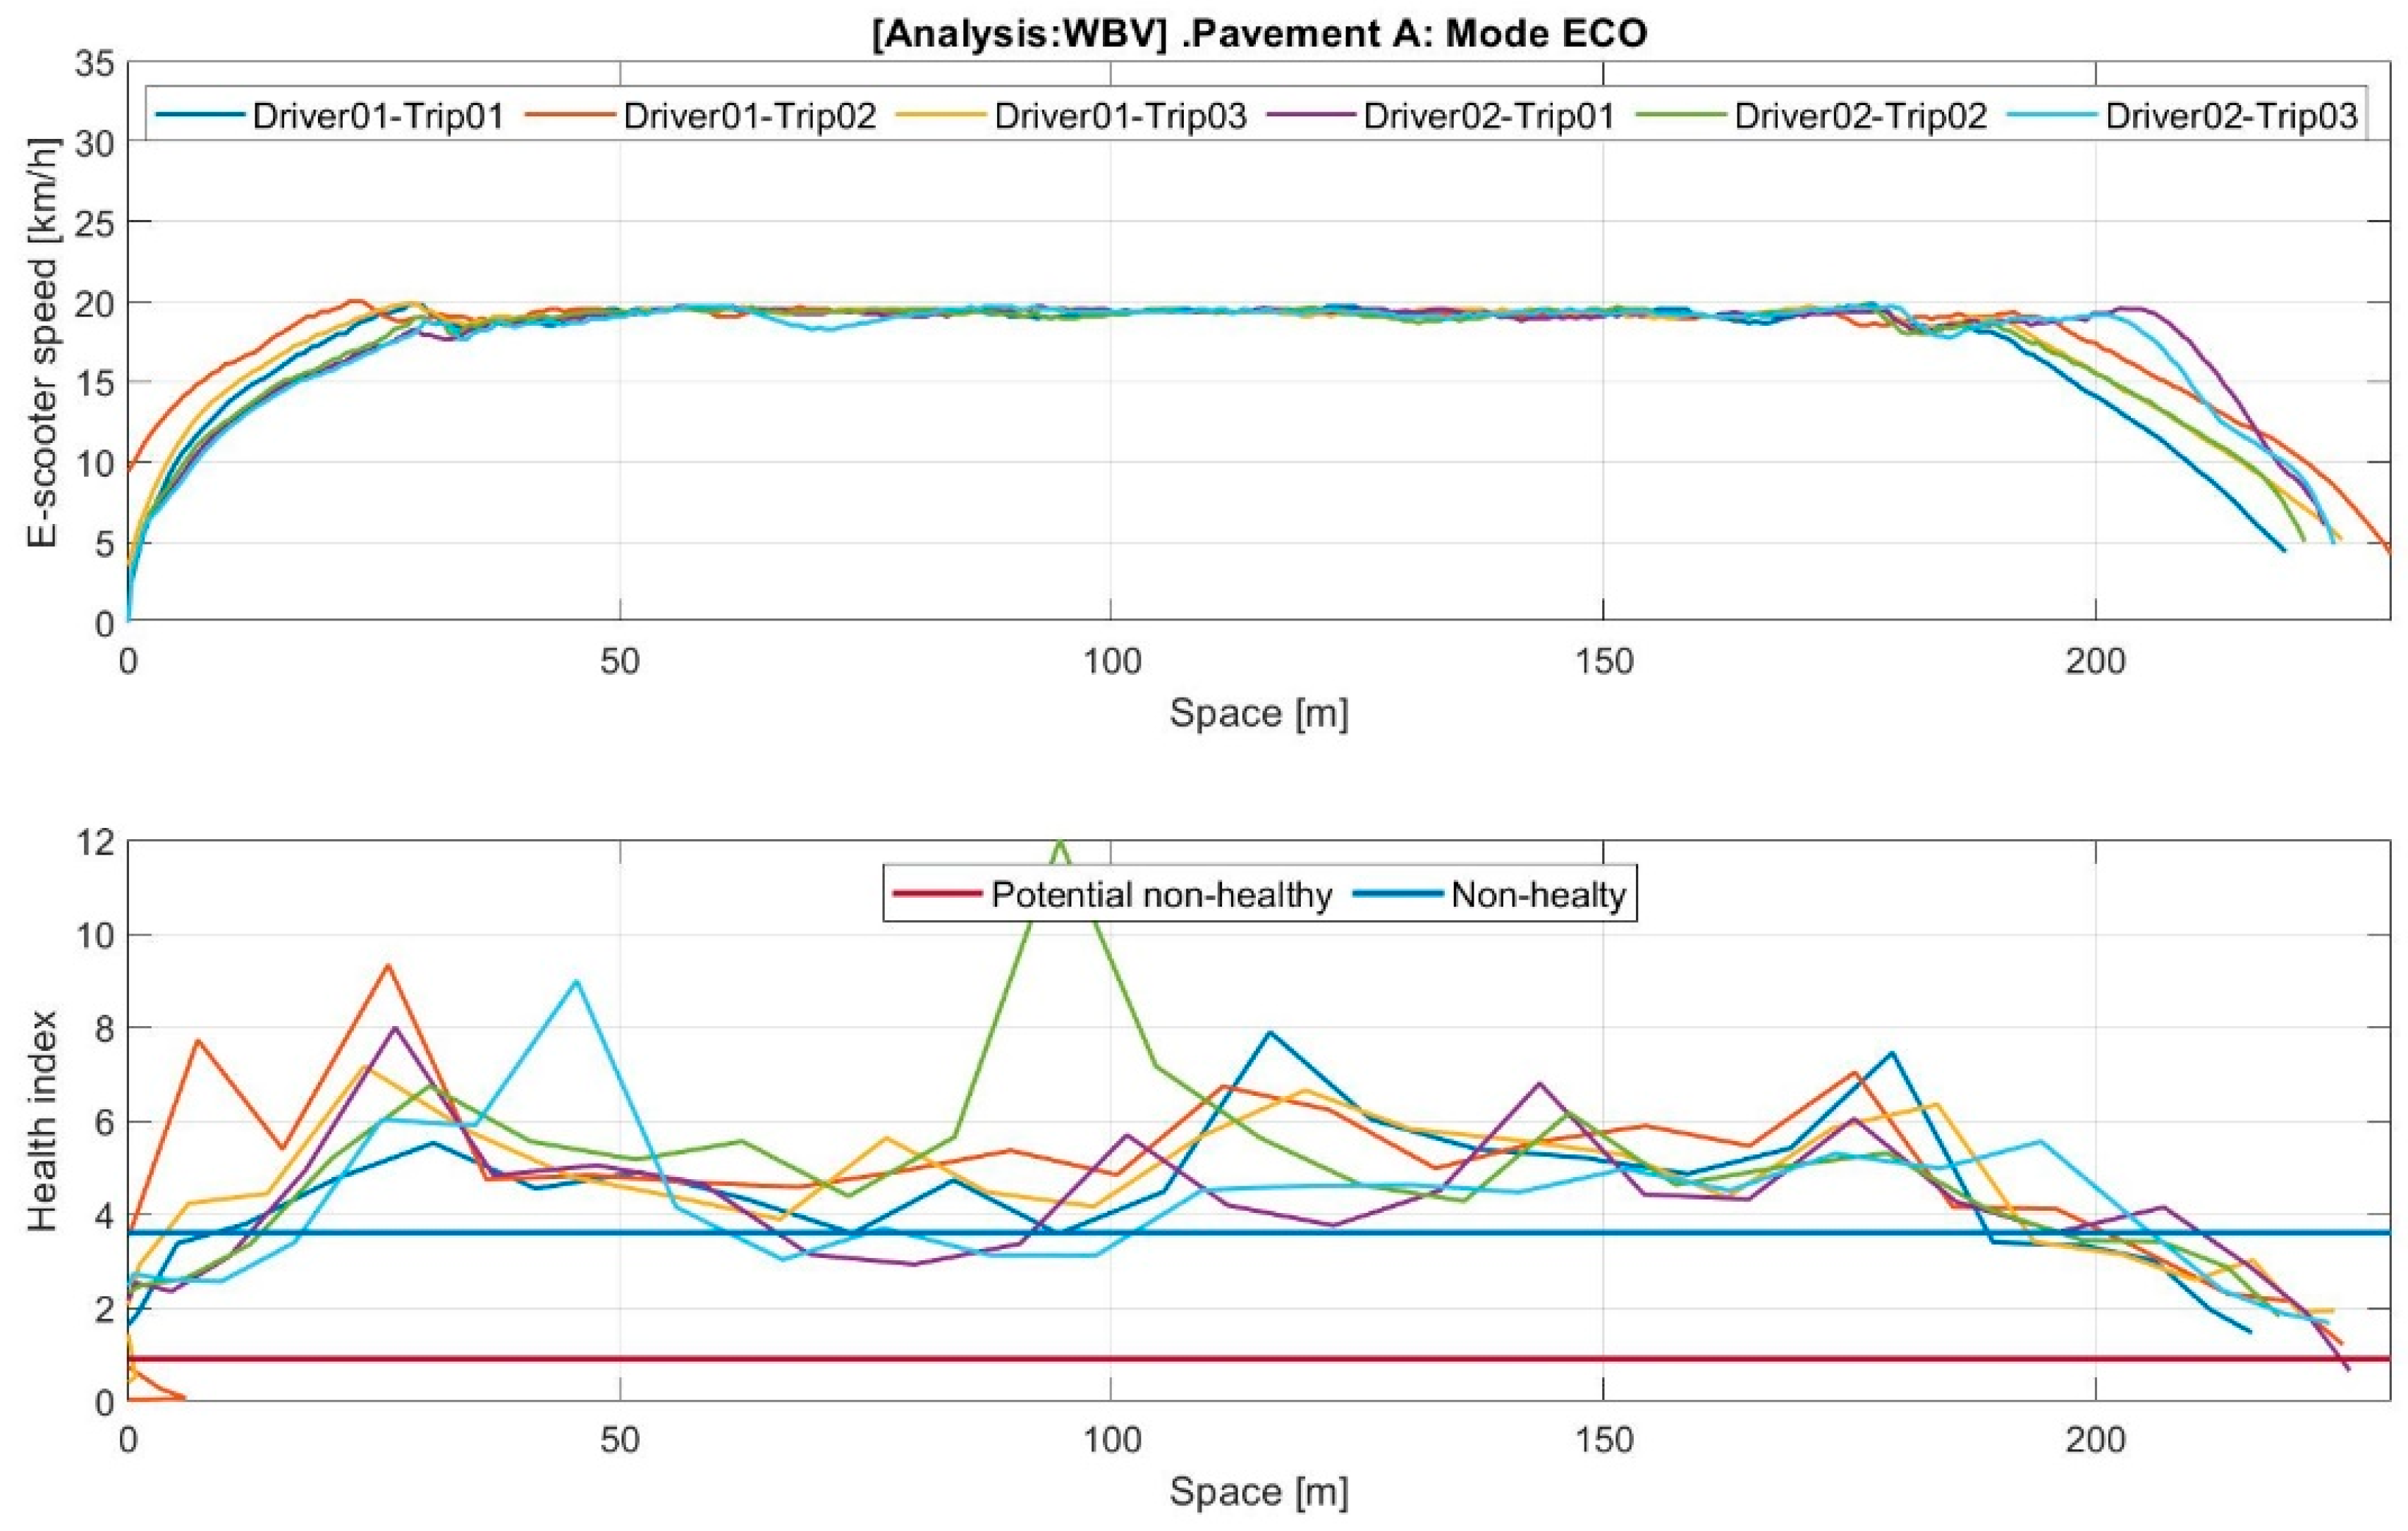
Appendix A
Appendix A.1. Whole-Body Vibrations on Time Domain
Figure A1.
Speed profile (I) and WBV vibrations for 2 s RMS, pavement A, and mode ECO.

Figure A2.
Speed profile (I) and WBV vibrations for 2 s RMS, pavement A, and mode MAX.

Figure A3.
Speed profile (I) and WBV vibrations for 2 s RMS, pavement B, and mode ECO.

Figure A4.
Speed profile (I) and WBV vibrations for 2 s RMS, pavement B, and mode MAX.

Appendix A.2. Hand–Arm Vibrations
Figure A5.
Speed profile (I) and HAV vibrations for 2 s RMS, pavement A, and mode ECO.

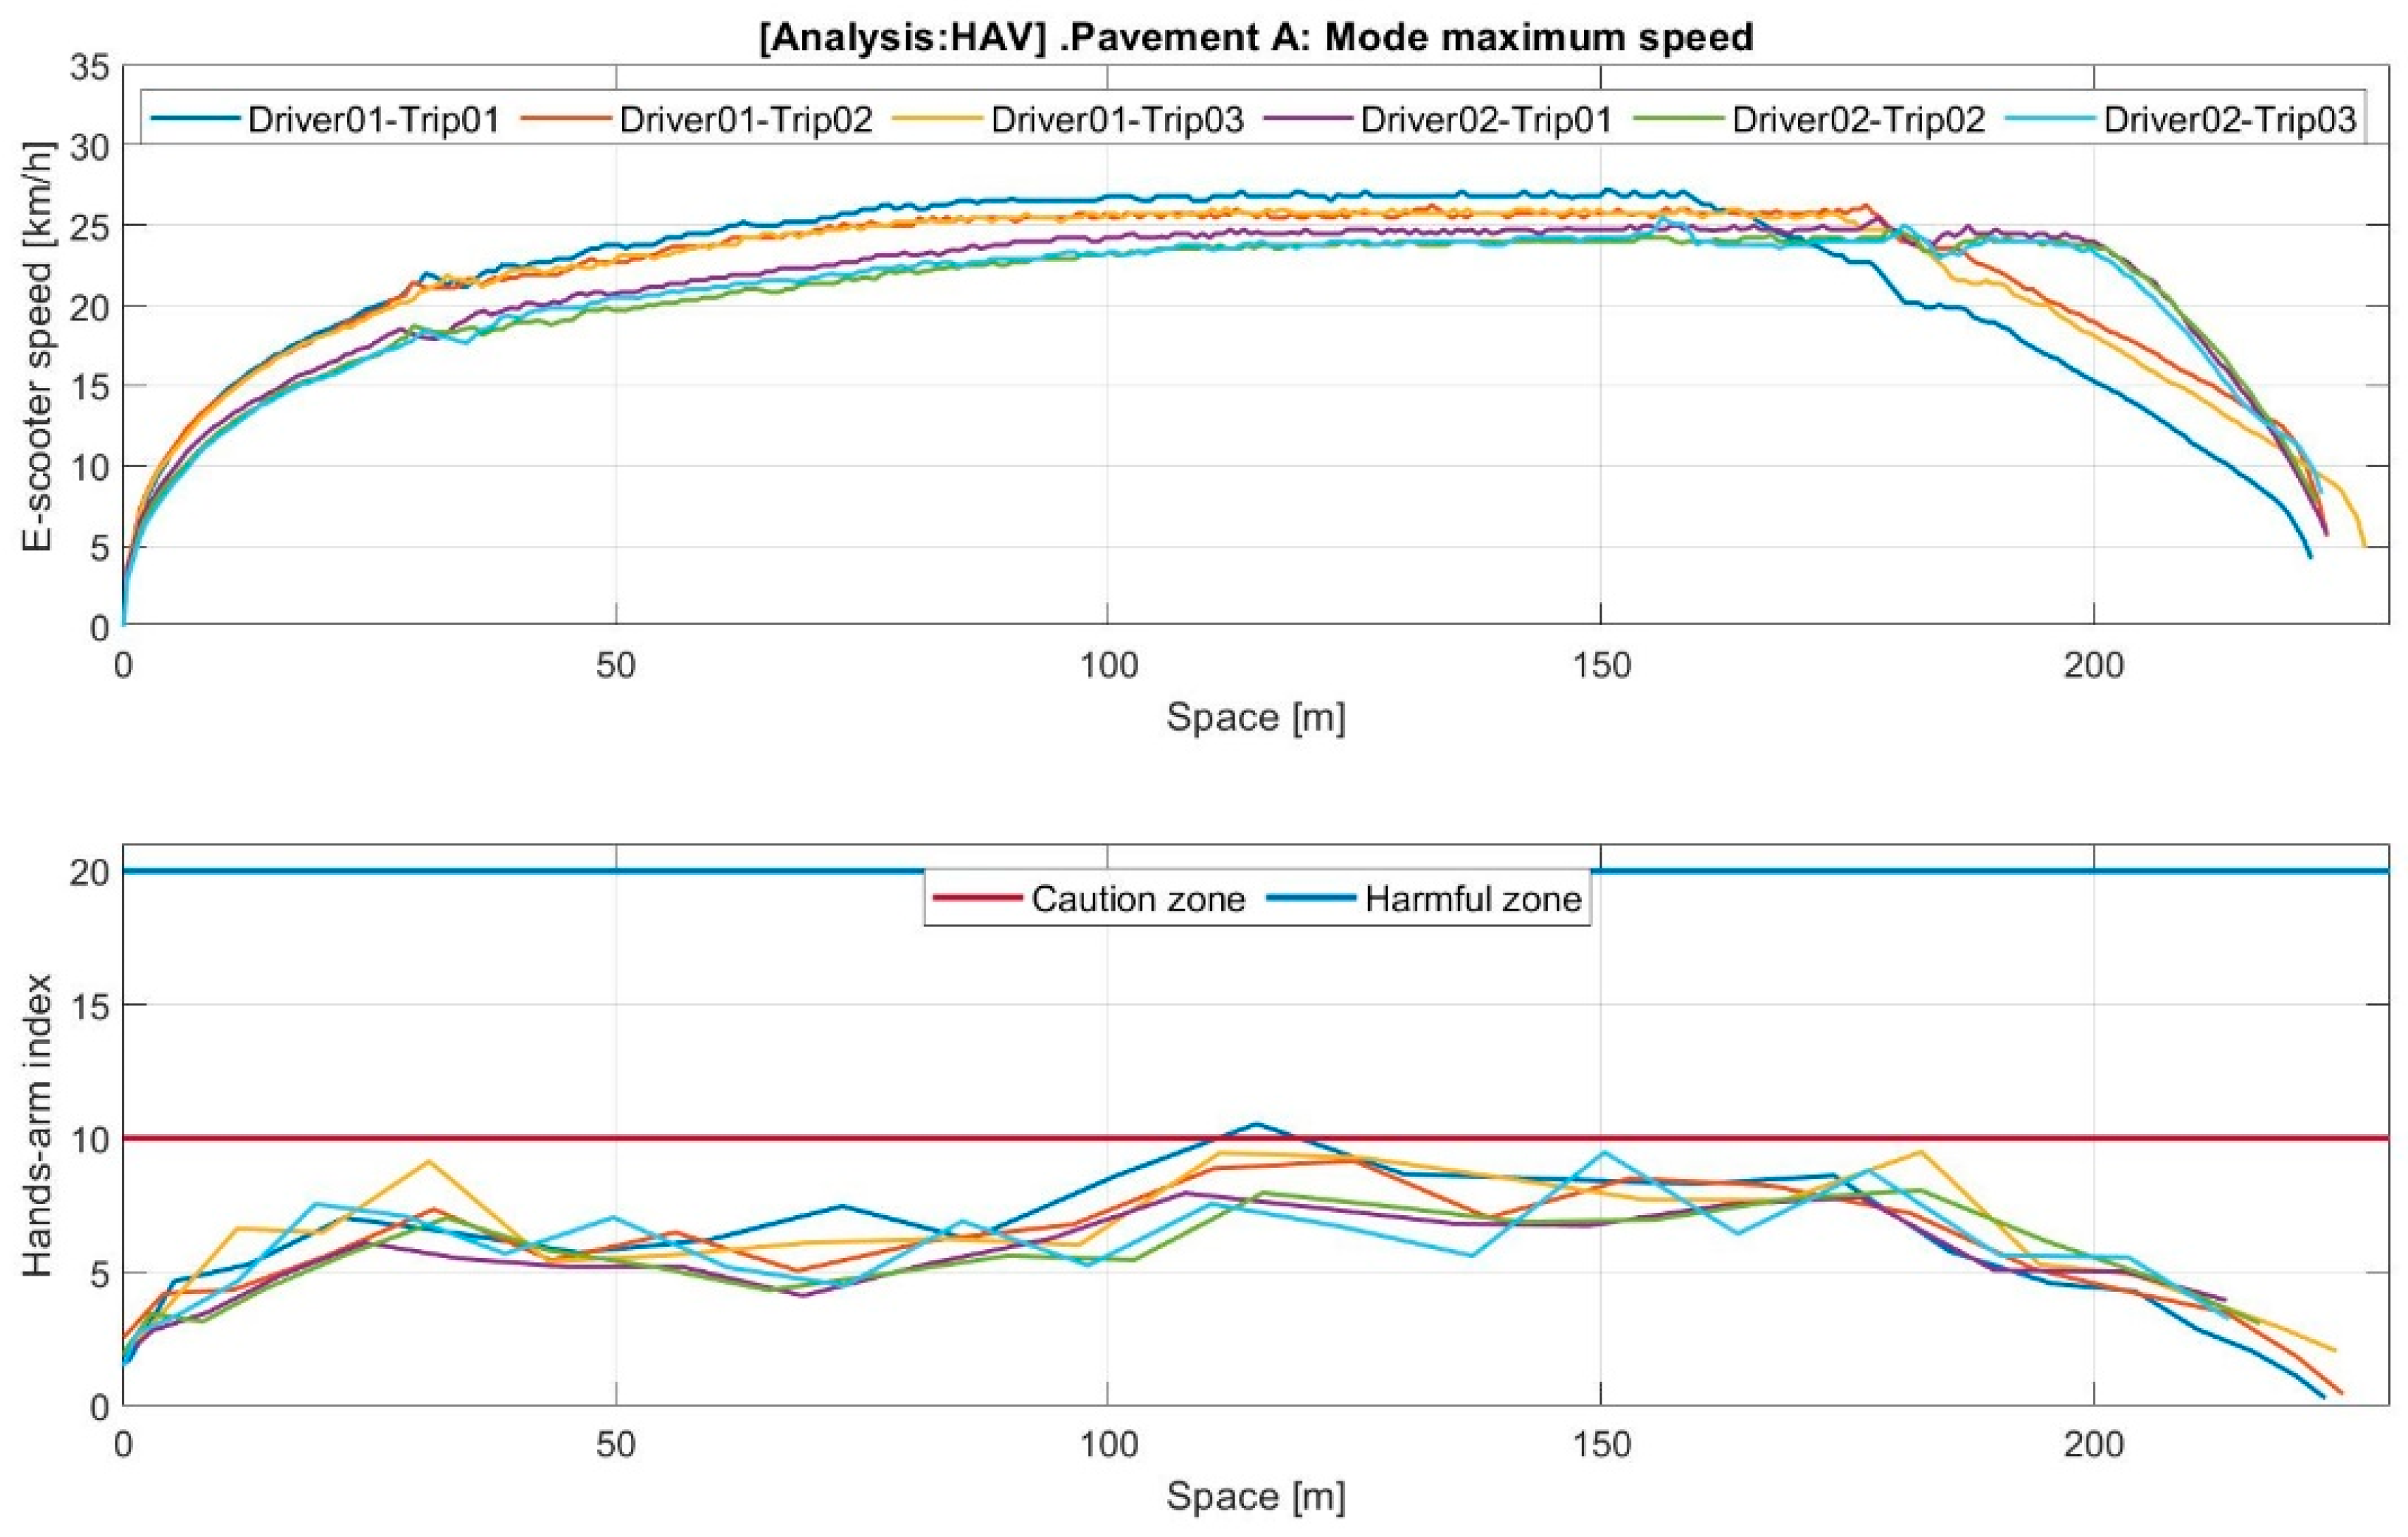
Figure A6.
Speed profile (I) and HAV vibrations for 2 s RMS, pavement A, and mode MAX.

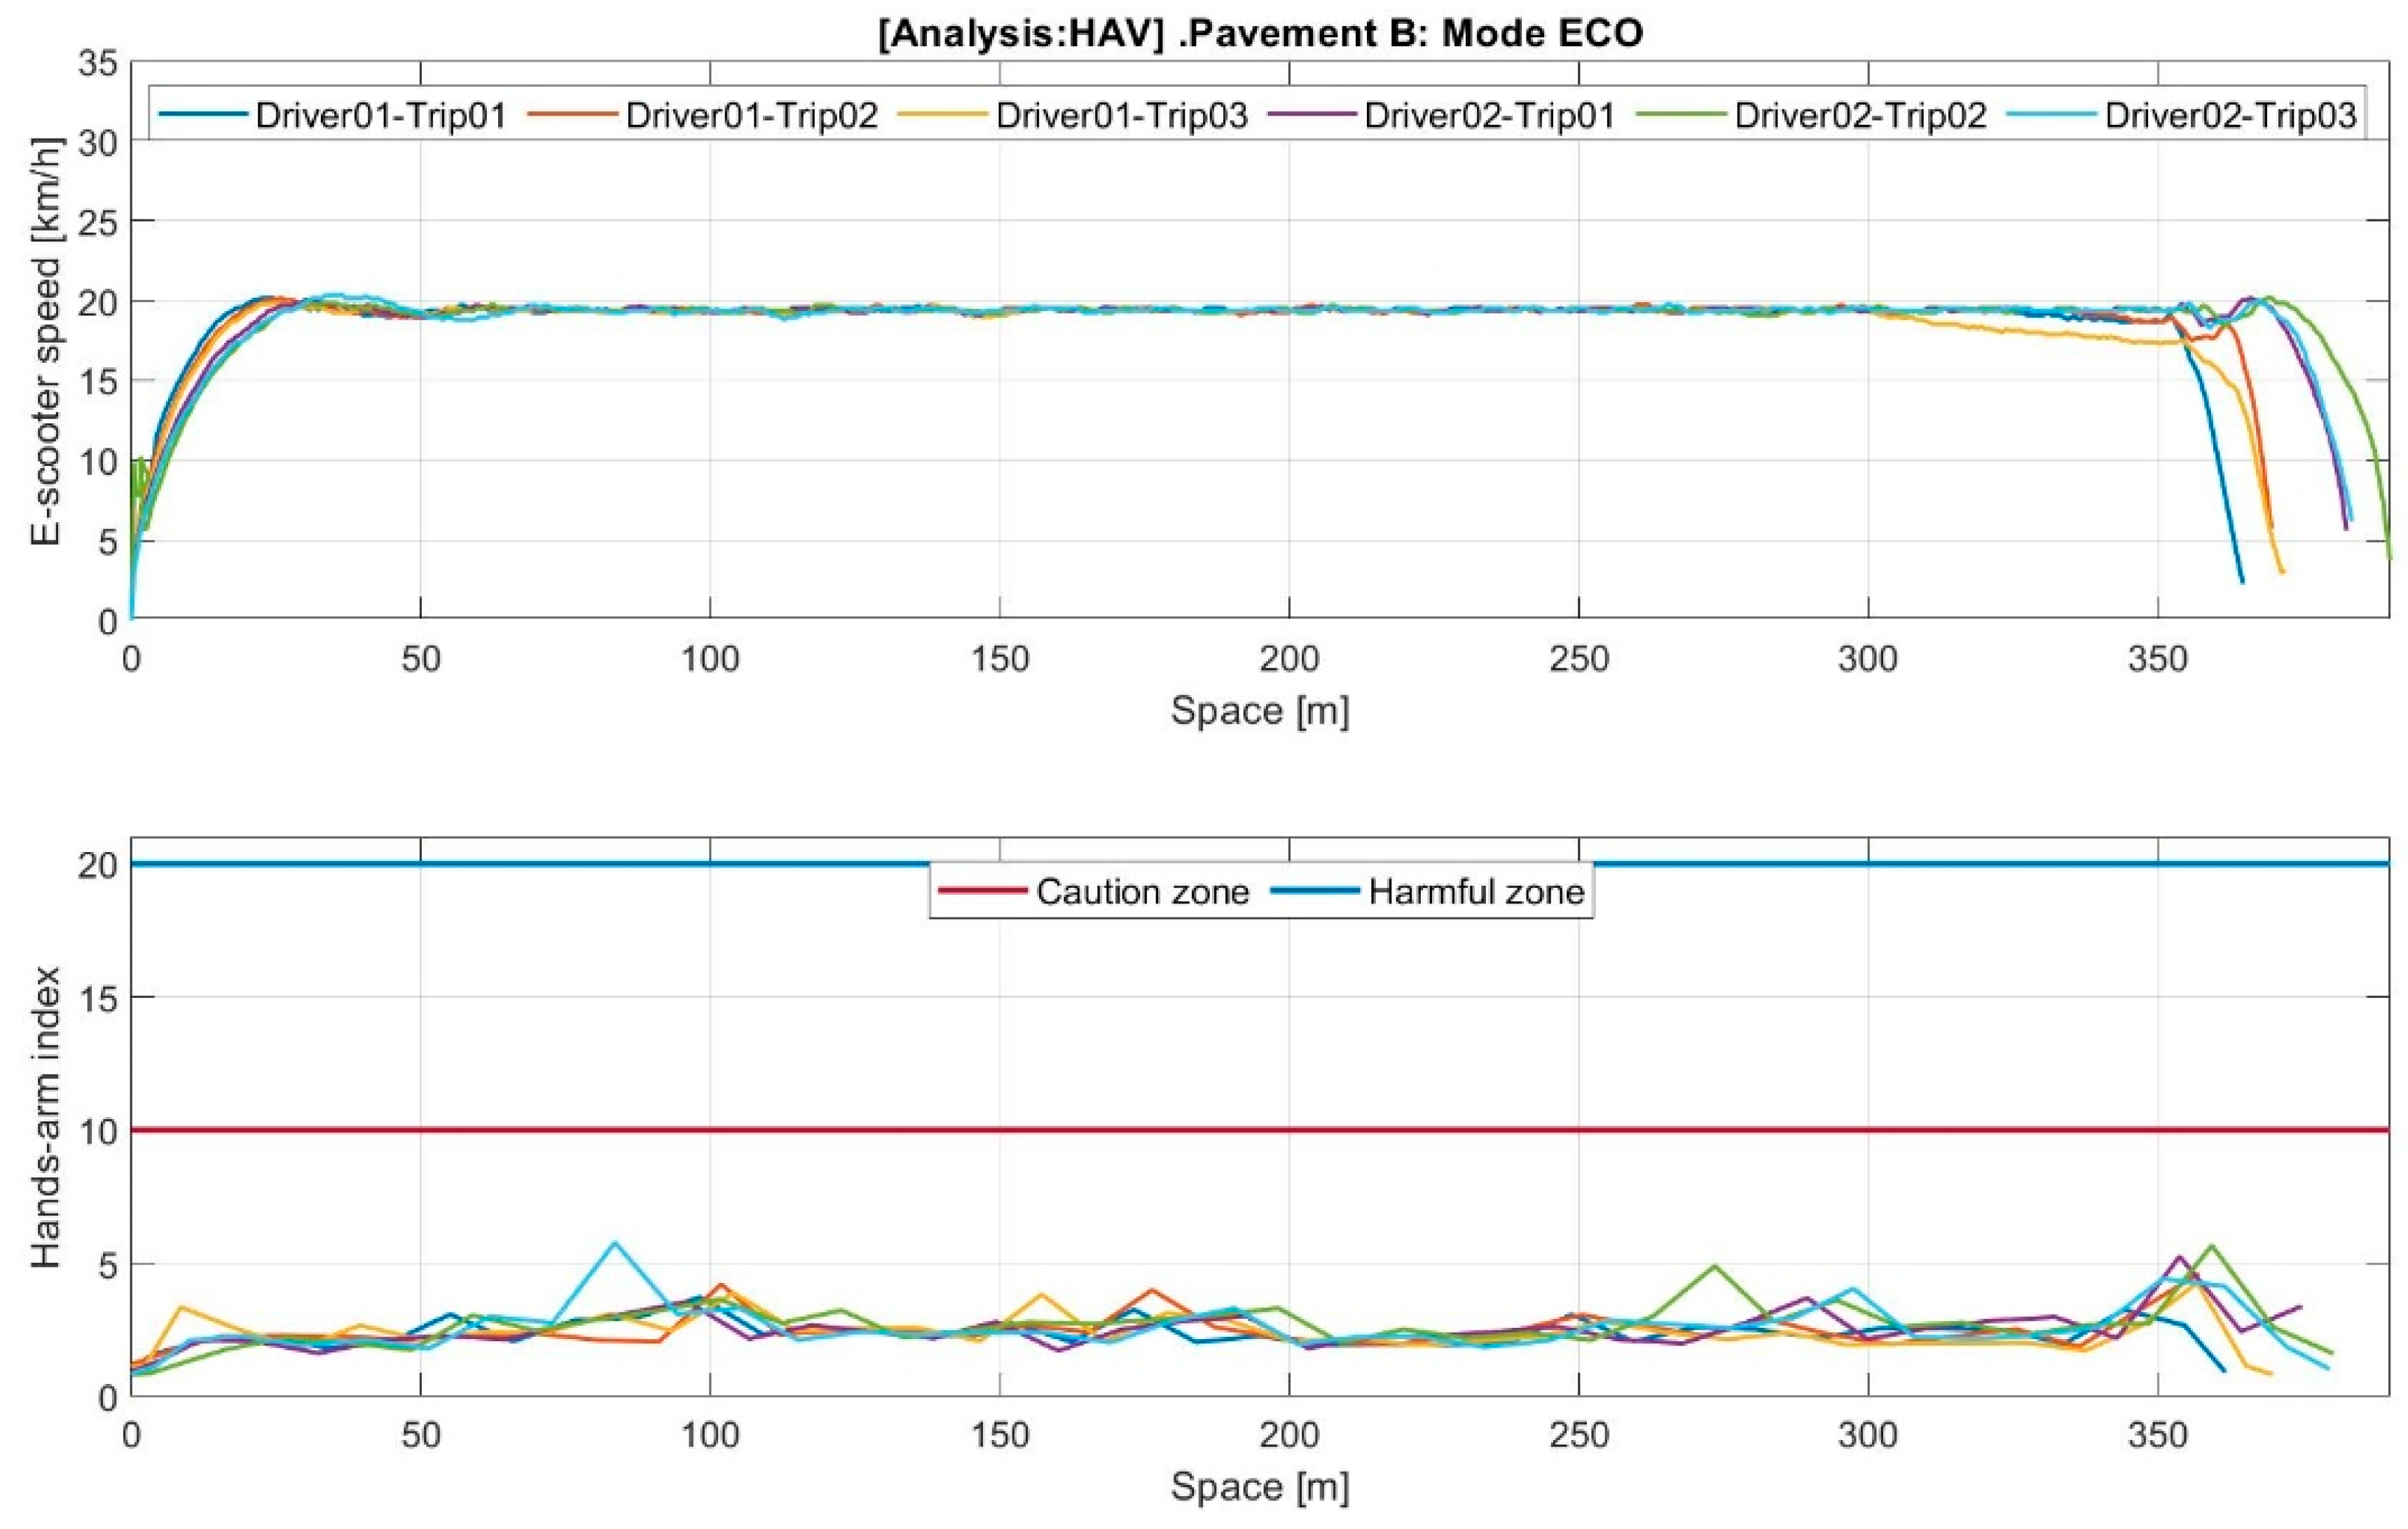
Figure A7.
Speed profile (I) and HAV vibrations for 2 s RMS, pavement B, and mode ECO.

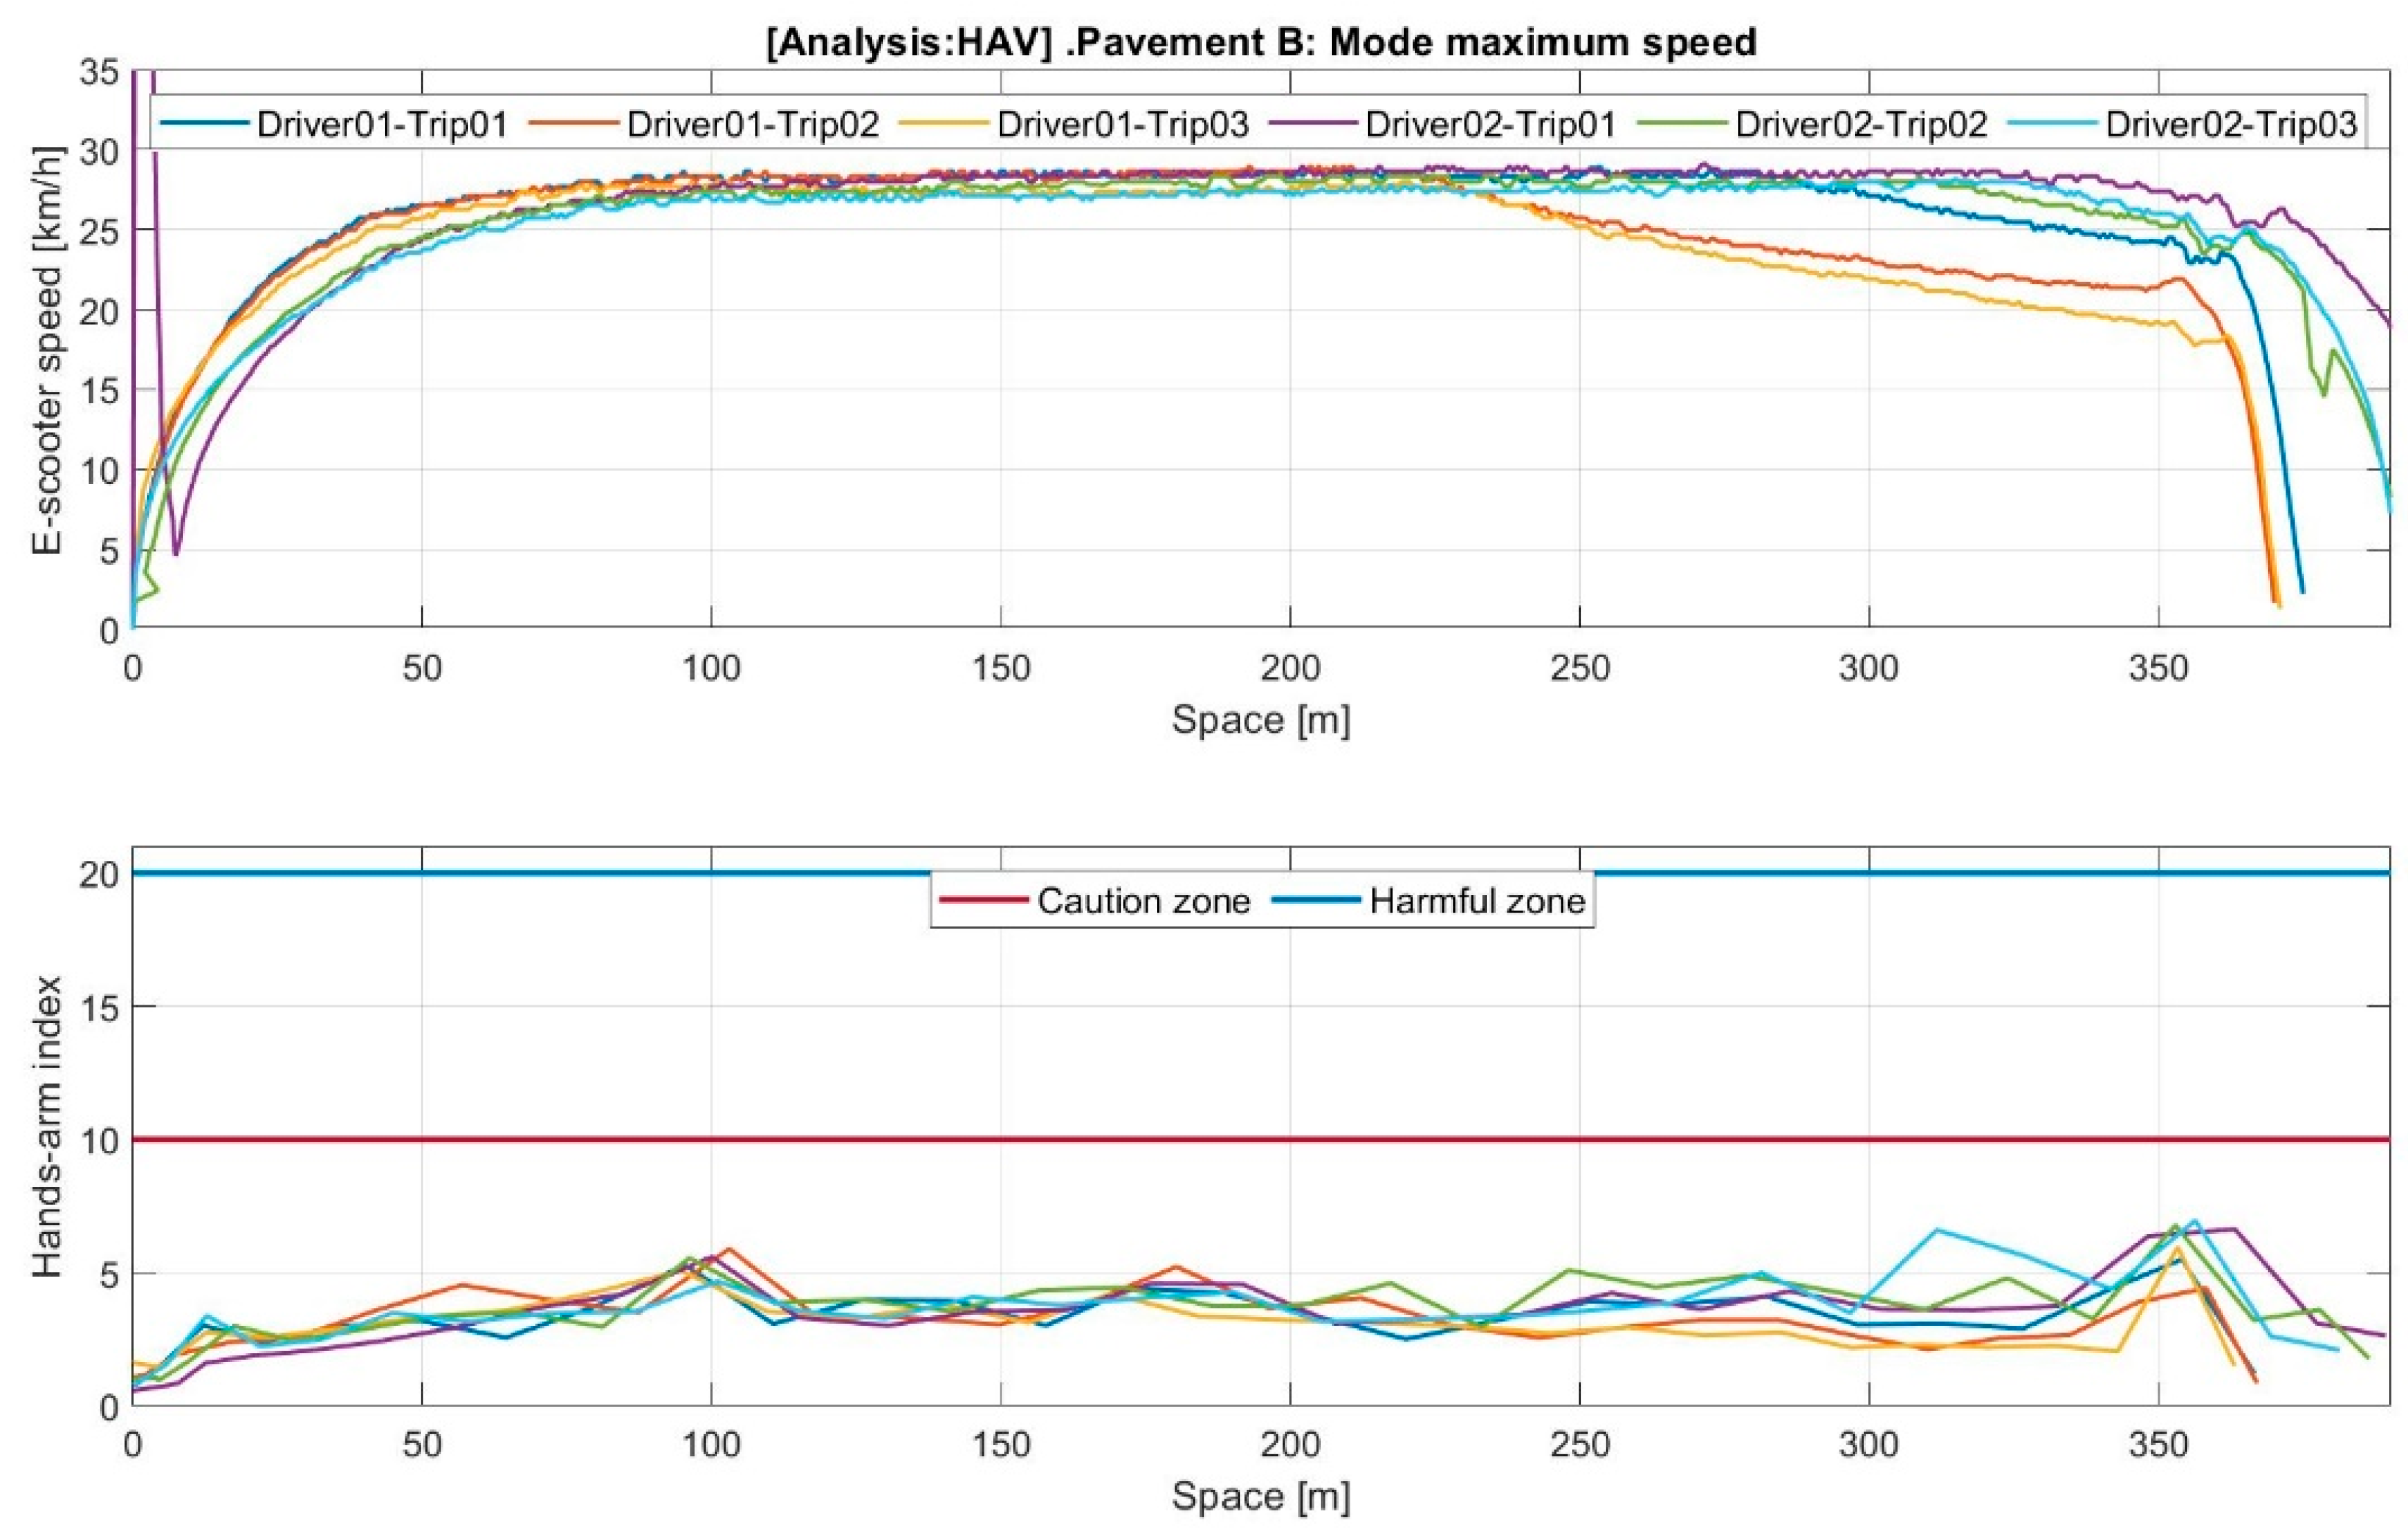
Figure A8.
Speed profile (I) and HAV vibrations for 2 s RMS, pavement B, and mode MAX.

Appendix A.3. E-Scooter Accelerations on Frequency Domain
Figure A9.
Vertical accelerations in the frequency domain [16].
Figure A9.
Vertical accelerations in the frequency domain [16].

Figure A10.
Longitudinal accelerations in the frequency domain [16].
Figure A10.
Longitudinal accelerations in the frequency domain [16].

Figure A11.
Lateral accelerations in the frequency domain.

References
- Savage, R.; Billing, D.; Furnell, A.; Netto, K.; Aisbett, B. Whole-Body Vibration and Occupational Physical Performance: A Review. Int. Arch. Occup. Environ. Health 2016, 89, 181–197. [Google Scholar] [CrossRef]
- Krajnak, K. Health Effects Associated with Occupational Exposure to Hand-Arm or Whole Body Vibration. J. Toxicol. Environ. Health-Part B-Crit. Rev. 2018, 21, 320–334. [Google Scholar] [CrossRef]
- Nelson, C.M.; Brereton, P.F. The European Vibration Directive. Ind. Health 2005, 43, 472–479. [Google Scholar] [CrossRef] [Green Version]
- Standar UNE-EN ISO 5349-2:2002; Mechanical Vibration—Measurement and Evaluation of Human Exposure to Hand- Transmitted Vibration—Part 1: General Requirements. International Organization for Standardization: Geneva, Switzerland, 2001.
- Standar UNE-ISO 2631-1:2008; Mechanical Vibration and Shock. Evaluation of Human Exposure to Whole-Body Vibration. Part 1: General Requirements. International Organization for Standardization: Geneva, Switzerland, 2001.
- Deboli, R.; Calvo, A.; Preti, C. Vibration and Impulsivity Analysis of Hand Held Olive Beaters. Appl. Ergon. 2016, 55, 258–267. [Google Scholar] [CrossRef]
- Nilsson, T.; Wahlström, J.; Burström, L. Hand-Arm Vibration and the Risk of Vascular and Neurological Diseases—A Systematic Review and Meta-Analysis. PLoS ONE 2017, 12, e0180795. [Google Scholar] [CrossRef] [Green Version]
- Scholz, M.; Brammer, A.; Marburg, S. Exposure–Response Relation for Vibration-Induced White Finger: Inferences from a Published Meta-Analysis of Population Groups. Int. Arch. Occup. Environ. Health 2023, 96, 757–770. [Google Scholar] [CrossRef]
- Santos, J.; Garcia, J.; Miguel-Dávila, J. Hand-Arm Vibration Risk Assessment. Dyna 2008, 83, 214–220. [Google Scholar]
- Jayachandran, R.; Krishnapillai, S. Modeling and Optimization of Passive and Semi-Active Suspension Systems for Passenger Cars to Improve Ride Comfort and Isolate Engine Vibration. J. Vib. Control 2013, 19, 1471–1479. [Google Scholar] [CrossRef]
- Jiang, X.; Yan, F.; Chen, W.; Wang, H. Improving Ride Comfort of a Heavy Truck; SAE International: Warrendale, PA, USA, 2018. [Google Scholar]
- Cossalter, V.; Doria, A.; Garbin, S.; Lot, R. Frequency-Domain Method for Evaluating the Ride Comfort of a Motorcycle. Veh. Syst. Dyn. 2006, 44, 339–355. [Google Scholar] [CrossRef]
- Zhu, S.; Zhu, F. Cycling Comfort Evaluation with Instrumented Probe Bicycle. Transp. Res. Part A Policy Pract. 2019, 129, 217–231. [Google Scholar] [CrossRef]
- Ventura, R.; Ghirardi, A.; Vetturi, D.; Maternini, G.; Barabino, B. A Framework for Comparing the Vibrational Behaviour of E-Kick Scooters and E-Bikes. Evidence from Italy. SSRN Electron. J. 2022. [Google Scholar] [CrossRef]
- Michelangelo-Gulino, S.; Vichi, G.; Zonfrillo, G.; Vangi, D. Comfort Assessment for Electric Kick Scooter Decks. IOP Conf. Ser. Mater. Sci. Eng. 2022, 1214, 12043. [Google Scholar] [CrossRef]
- Cano-Moreno, J.D.; Cabanellas Becerra, J.M.; Arenas Reina, J.M.; Islán Marcos, M.E. Analysis of E-Scooter Vibrations Risks for Riding Comfort Based on Real Measurements. Machines 2022, 10, 688. [Google Scholar] [CrossRef]
- Cano-Moreno, J.D.; Islán, M.; Blaya, F.; D’Amato, R.; Juanes, J.; Soriano, E. Methodology for the Study of the Influence of E-Scooter Vibrations on Human Health and Comfort. In Seventh International Conference on Technological Ecosystems for Enhancing Multiculturality (TEEM’19); ACM: León, Spain, 2019; pp. 445–451. ISBN 978-1-4503-7191-9. [Google Scholar]
- Li, H.; Yuan, Z.; Novack, T.; Huang, W.; Zipf, A. Understanding Spatiotemporal Trip Purposes of Urban Micro-Mobility from the Lens of Dockless e-Scooter Sharing. Comput. Environ. Urban Syst. 2022, 96, 101848. [Google Scholar] [CrossRef]
- Hardt, C.; Bogenberger, K. Usage of E-Scooters in Urban Environments. Transp. Res. Procedia 2019, 37, 155–162. [Google Scholar] [CrossRef]
- Caspi, O.; Smart, M.J.; Noland, R.B. Spatial Associations of Dockless Shared E-Scooter Usage. Transp. Res. Part D Transp. Environ. 2020, 86, 102396. [Google Scholar] [CrossRef]
- Mathew, J.K.; Liu, M.; Seeder, S.; Li, H.; Bullock, D.M. Analysis of E-Scooter Trips and Their Temporal Usage Patterns. Inst. Transp. Eng. ITE J. Wash. 2019, 89, 44–49. [Google Scholar]
- Foissaud, N.; Gioldasis, C.; Tamura, S.; Christoforou, Z.; Farhi, N. Free-Floating e-Scooter Usage in Urban Areas: A Spatiotemporal Analysis. J. Transp. Geogr. 2022, 100, 103335. [Google Scholar] [CrossRef]
- Li, A.; Zhao, P.; Liu, X.; Mansourian, A.; Axhausen, K.W.; Qu, X. Comprehensive Comparison of E-Scooter Sharing Mobility: Evidence from 30 European Cities. Transp. Res. Part D Transp. Environ. 2022, 105, 103229. [Google Scholar] [CrossRef]
- UNE-EN ISO 8041-1:2018; Human Response to Vibration—Measuring Instrumentation—Part 1: General Purpose Vibration Meters. ISO: Geneva, Switzerland, 2017.
- Monopatín Eléctrico INFINITON EASYWAY Citycross-Blanco, 28 km/h, Autonomía Hasta 20 km. Available online: https://infiniton.es/movilidad/563-easyway-citycross-blanco.html (accessed on 7 February 2022).
- Ivorra Zaragoza, B.; Nuere Menéndez-Pidal, S.; Gomez Martin, S.; Cano-Moreno, J.D.; Bezal Rubio, M.B. Design and Vibrations in the Rotary Hammer. Dyna 2022, 97, 126–130. [Google Scholar] [CrossRef]
- Reynolds, D.D.; Angevine, E.N. Hand-Arm Vibration, Part II: Vibration Transmission Characteristics of the Hand and Arm. J. Sound Vib. 1977, 51, 255–265. [Google Scholar] [CrossRef]
- Noël, B. Raynaud’s Phenomenon in Workers Exposed to Vibration. Occup. Environ. Med. 2001, 58, 279–280. [Google Scholar] [CrossRef] [Green Version]
- Banister, P.A.; Smith, F.V. Vibration-Induced White Fingers and Manipulative Dexterity. Br. J. Ind. Med. 1972, 29, 264–267. [Google Scholar] [CrossRef] [PubMed] [Green Version]
- Gayraud, M. Raynaud’s Phenomenon. Jt. Bone Spine 2007, 74, e1–e8. [Google Scholar] [CrossRef] [PubMed]
- Liu, X.; Al-Qadi, I.L. Mechanistic Excess Fuel Consumption of a 3D Passenger Vehicle on Rough Pavements. J. Transp. Eng. Part B Pavements 2023, 149, 4022065. [Google Scholar] [CrossRef]
Figure 1.
E-scooter vibration scheme.

Figure 2.
Frequency filters for WBV ( and ) and HAV ().

Figure 3.
Selected e-scooter model and pavements used.

Figure 4.
Health limits curves defined in UNE-2631 [5].
Figure 4.
Health limits curves defined in UNE-2631 [5].

Figure 5.
(a) Speed profile (I) and (b) WBVs (RMS: 2 s; pavement type: A; mode: MAX).

Figure 6.
Acceleration components distribution in WBV.

Figure 7.
Distribution of HAV acceleration components.


Table 1.
E-scooter mean time and distance per trip.
| Reference | Location | Mean Time (min) | Mean Distance (km) |
|---|---|---|---|
| Hao Li et al. [18] | Washington D.C. | 11.7 * | 1.0 |
| Cornelius et Klaus [19] | Germany | 42.4 * | 10.6 |
| Caspi et al. [20] | Texas | 6.6 | 1.0 |
| Mathew et al. [21] | Chicago | 13.8 | 1.8 * |
| Foissaud et al. [22] | Europe | 12 * | 2.5 * |
| Li et al. [23] | Europe | 9.7 * | 1.4 * |
* Calculated values.
Table 2.
E-scooter vibration thresholds from health perspective.
| Criteria (Equation) | Mathematical Expressions | ||||||
|---|---|---|---|---|---|---|---|
| WBV | UNE-2631 (Equation (6)) | 4 | 0.45 | 0.8 | 0.9 | 1.6 | |
| UNE-2631 (Equation (7)) | 4 | 0.5 | 0.9 | 2 | 3.6 | ||
| HAV | European Directive (Equation (7)) | 8 | 2.5 | 5 | 10 | 20 |
Table 3.
Average WBV levels per WBV zone.
| Pavement | Speed Mode | Zone A (0–0.9 m/s2) | Zone B (pn-h) (0.9–3.6 m/s2) | Zone C (n-h) (3.6–∞ m/s2) |
|---|---|---|---|---|
| Type A: Pavers | ECO | 13.89% | 30.00% | 56.11% |
| MAX | 11.03% | 21.38% | 67.59% | |
| Mean value (A) | 12.46% | 25.69% | 61.85% | |
| Type B: Asphalt | ECO | 4.22% | 90.30% | 5.49% |
| MAX | 4.84% | 74.73% | 20.43% | |
| Mean value (B) | 4.53% | 82.52% | 12.96% | |
| Mean value (A and B) | 8.50% | 54.10% | 37.41% |
Table 4.
Average HAV levels per HAV zone.
| Pavement | Speed Mode | Zone A (0–10 m/s2) | Zone B (Caution) (10–20 m/s2) | Zone C (Harmful) (20–∞ m/s2) |
|---|---|---|---|---|
| Type A: Pavers | ECO | 100% | 0% | 0% |
| MAX | 99.31% | 0% | 0% | |
| Mean value (A) | 99.66% | 0% | 0% | |
| Type B: Asphalt | ECO | 100% | 0% | 0% |
| MAX | 100% | 0.54% | 0% | |
| Mean value (B) | 100% | 0.27% | 0% | |
| Mean value (A and B) | 99.83% | 0.62% | 0% |
Table 5.
Average WBV levels for evaluating Raynaud’s syndrome.
| Pavement | Speed Mode | HAV Mean Value (m/s2) | A(8) (m/s2) | Dy (Years) |
|---|---|---|---|---|
| Type A: Pavers | ECO | 4.2514 | 1.06 | 30.0 |
| MAX | 4.9765 | 1.24 | 25.9 | |
| Mean value (A) | 4.61 | 1.15 | 27.8 | |
| Type B: Asphalt | ECO | 2.3436 | 0.59 | 52.7 |
| MAX | 3.1539 | 0.79 | 39.8 | |
| Mean value (B) | 2.75 | 0.69 | 45.3 | |
| Mean value (A and B) | 3.68 | 0.92 | 43.93 |
Disclaimer/Publisher’s Note: The statements, opinions and data contained in all publications are solely those of the individual author(s) and contributor(s) and not of MDPI and/or the editor(s). MDPI and/or the editor(s) disclaim responsibility for any injury to people or property resulting from any ideas, methods, instructions or products referred to in the content. |
© 2023 by the authors. Licensee MDPI, Basel, Switzerland. This article is an open access article distributed under the terms and conditions of the Creative Commons Attribution (CC BY) license (https://creativecommons.org/licenses/by/4.0/).
Share and Cite
MDPI and ACS Style
Cano-Moreno, J.D.; Cabanellas Becerra, J.M.; Arenas Reina, J.M.; Islán Marcos, M.E. Analysis of E-Scooter Vibrations from Health Perspective: A Case Study. Machines 2023, 11, 761. https://doi.org/10.3390/machines11070761
AMA Style
Cano-Moreno JD, Cabanellas Becerra JM, Arenas Reina JM, Islán Marcos ME. Analysis of E-Scooter Vibrations from Health Perspective: A Case Study. Machines. 2023; 11(7):761. https://doi.org/10.3390/machines11070761
Chicago/Turabian StyleCano-Moreno, Juan David, José María Cabanellas Becerra, José Manuel Arenas Reina, and Manuel Enrique Islán Marcos. 2023. "Analysis of E-Scooter Vibrations from Health Perspective: A Case Study" Machines 11, no. 7: 761. https://doi.org/10.3390/machines11070761
Note that from the first issue of 2016, this journal uses article numbers instead of page numbers. See further details here.