
Predictive Speed Control of a DC Universal Motor Applied to Monitor Electric Vehicle Batteries


1
Department of Mathematics, Universitat Politècnica de Catalunya-BarcelonaTech (EEBE), 08019 Barcelona, Spain
2
Department of Mathematics, Universitat Politècnica de Catalunya-BarcelonaTech (ESEIAAT), 08222 Terrassa, Spain
*
Author to whom correspondence should be addressed.
Machines 2023, 11(7), 740; https://doi.org/10.3390/machines11070740
Submission received: 26 May 2023
/
Revised: 8 July 2023
/
Accepted: 11 July 2023
/
Published: 14 July 2023
(This article belongs to the Section Electrical Machines and Drives)
Abstract
:This article deals with the design of a simple predictive control algorithm applied to a bidirectional DC-DC power converter for the angular speed control of a DC motor. We used the dynamics of a DC motor but mathematically reduced them to arrive at a simple model that is ideal for our purpose, not only to meet the control objective but also to generate reliable data for further analysis. This predictive control approach is based on the discrete time mathematical model of a DC motor. A huge capacitor to emulate an electric vehicle battery was then successfully connected to our experimental platform. Due to the robustness of the proposed control algorithm, the same predictive control scheme provided sufficient information to monitor the battery’s state. On this basis, and due to the system’s efficiency, it was possible to configure a fault detection scheme in our electric car battery emulator using only classical statistical tools. A PIC18F252 microcontroller was used in our experimental platform to implement our predictive control algorithm. It was then appropriately coupled to the power electronics required by the DC-DC converter to drive the DC motor. Our experimental results proved the excellent performance of the control method and also of the health monitoring system. On the other hand, the main difficulty in achieving our main goal was the realization of discrete control, which had to be as simple as possible while maintaining the control objective and while also being capable of generating reliable data for the health monitoring stage. Thus, the primary contribution of this work was the development of the predictive control of the speed of a universal motor, followed by the modification of the experimental design to simulate an electric car battery and the introduction of a novel statistical method for fault detection.
1. Introduction
In many engineering applications, using DC (Direct Current) motors under speed control configuration is a common requirement [1,2] because DC motors can provide a high starting torque and are suitable for speed control. Many speed control strategies have been developed for these motors, for example, a modified PI (Proportional-Integral) speed controller was developed in [3], and a comparison between a fuzzy logic and a PID (Proportional-Integral-Derivative) controller for a universal DC motor was reported in [4]. The latter report concluded that fuzzy logic performs better than PID controllers, but they require several fuzzy algorithm rules, which are not easy to conceive. There have been many other control strategies for the speed control of DC motors, for example, the well-known sliding mode control theory was used in [5], the H-robust control was invoked in [6], the adaptive control point of view was conceived in [7], and machine learning techniques were used in [8]. Whatever the strategy, the implementation of nonlinear controllers requires the programming of complex mathematical formulas. Therefore, designing controllers that are as simple as possible is attractive, as long as the control objective is met. Predictive control theory can help in this regard because predictive control relies on modeling for prediction, which can be as simple as possible [9]. The development of an experimental platform for controlling DC and AC motors was described in [10]. This experimental platform was realized by using an Arduino Uno board and Matlab. An experimental platform for controlling a DC motor using the dSPACE DS1104 system was also reported in [11]. In contrast, some recent works used numerical simulations to study speed control strategies, as in [12], where a PI controller was designed using the dominant pole compensation method. However, this approach introduced a certain delay in the control implementation, which undermined the system’s behavior. Our experimental platform uses a PIC microcontroller unit due to its low cost and reliability [13].
From a power electronics point of view, the bidirectional DC-DC converter is a common power converter used in many applications, such as fuel cell hybrid power systems, battery chargers, and uninterruptible power suppliers [14,15]. Therefore, the correct handling of a bidirectional DC-DC converter is essential to ensure the efficiency of the whole system [16,17]. Moreover, an essential property of bidirectional DC-DC converters is their ability to transfer electrical energy between two DC sources, such as batteries and capacitors [18]. Within the various control technologies, predictive control, or model predictive control, has its own advantages and disadvantages, but its efficiency in developing control algorithms is well accepted [9,19]. The essence of predictive control is based on three elements: (a) a predictive model; (b) time window optimization; and (c) feedback correction. The key to this method is to work on a moving time interval, especially when dealing with complex systems with dynamic changes and uncertainties, as in such cases, there is no reason to judge the optimization performance over the full time range [20,21]. As an example of how simple predictive control can be, see [22]. This control method can also be used for fault detection in a controlled system [9,23,24]. In addition, there are many control strategies in the literature. However, in order to generate data for health monitoring, the control method needs to be carefully programmed. Firstly, the control strategy must meet its control objective. Secondly, the control must be fault tolerant in order to generate the data needed for a health diagnosis (see, for example, [25]). In this article, a simple discrete control is proposed to generate feasible data for fault diagnoses in wind turbines. In our approach, we propose a simple predictive control for the health monitoring stage, which is simpler than the previous one and is also easy to implement.
Given the above, the main objective of this article is four-fold: to design an experimental platform for the speed control of a DC motor (Target 1) by using a simple predictive control (Target 2), and to emulate an electric vehicle battery on the road (Target 3) for health monitoring using only classical statistical tools (Target 4), such as histograms and Pareto distribution charts. To do this, we modified a DC-DC converter to emulate a faulty car battery system. We also set up two stages to achieve our goal. First, using the predictive control framework, we used the bidirectional DC-DC converter to realize the speed control of a DC motor. However, the bidirectional DC-DC converter was used to power a resistive load, and the motor was located on the inductive power management side. The predictive control algorithm was implemented by using a PIC18F252 microcontroller.
Moreover, the DC motor used had a nominal power of 220/240 V at 50/60 Hz and a nominal angular speed of 1000 rpm. After the first stage, we modified the experimental platform to emulate an electric car battery on the road and applied the control strategy to obtain a statistical diagnostic system to detect faulty battery behavior. Our approach can be summarized as follows:
- Design a predictive controller to regulate the angular speed of a bidirectional DC-DC converter. This control strategy must be robust against system faults.
- Design a fault emulator for an electric car battery emulator by modifying the DC-DC experimental platform by adding an external capacitor. This modification captures damage to the charge capacity of an electric battery.
- Propose a statistical fault detection algorithm to capture the failure behavior of the battery.
- From the point of view of electronics, we designed an experimental platform capable of emulating the energy management between a battery and an ultra-capacitor.
- From the point of view of statistical data analyses, our approach can discriminate between healthy and faulty cases of the ultra-capacitor model on our experimental platform.
The novelty of this work is the conception of a new experimental implementation capable of capturing the behavior of a car battery. Our proposal presents an easy-to-implement battery car emulator, ahead of the usual expensive car battery experiments. Most of the existing literature uses numerical simulations (see [15] and the references therein). In addition, we conducted a new statistical analysis to determine whether failure affects the battery performance. Nevertheless, we designed a predictive controller to regulate the speed of the DC-DC motor as a car battery emulator.
Furthermore, our experimental platform provides us with experimental data for further analysis. Due to the observed data being similar between the different experimental realizations, it was a data processing challenge for our algorithm to discriminate between the healthy and unhealthy behaviors of our system. For comparison, in [26], the authors proposed a boxplot and a Gini fault diagnosis method using data from two cars involved in a fire ignition fault for their diagnostic approach. In [27], the authors proposed a residual system based on a disturbance system to tune the fault diagnosis of electric car batteries. This tuning process requires some threshold selection based on expertise. In other cases, Shannon entropy is used, which requires long-term data storage [28,29]. Our approach is complementary to the previous ones, with the advantages of simplicity and ease of reproduction. From the point of view of experimental realization, our approach has some advantages. For instance, our design is low cost relative to the one in [30]. We use a DC motor for the car actuator, which is not used, for example, in [31,32]. Finally, our control motor algorithm is simple. For reference, see, for example, [33,34].
The rest of the article is structured as follows. Section 2 introduces the bidirectional DC-DC converter and the proposed configuration for speed control of a DC motor. Section 3 presents the mathematical model of a DC motor. A simplified model only is also shown for the control layout. A predictive control scheme is also designed. Section 4 presents the developed experimental platform, including some practical results, and Section 5 presents some remarks on its performance. Then, Section 6 details the observed modification of the platform to emulate a car battery with healthy and faulty behavior, respectively. The statistical study of fault detection is explained in Section 7. Finally, the concluding remarks are given in Section 8.
2. The Bidirectional DC-DC Converter Configuration
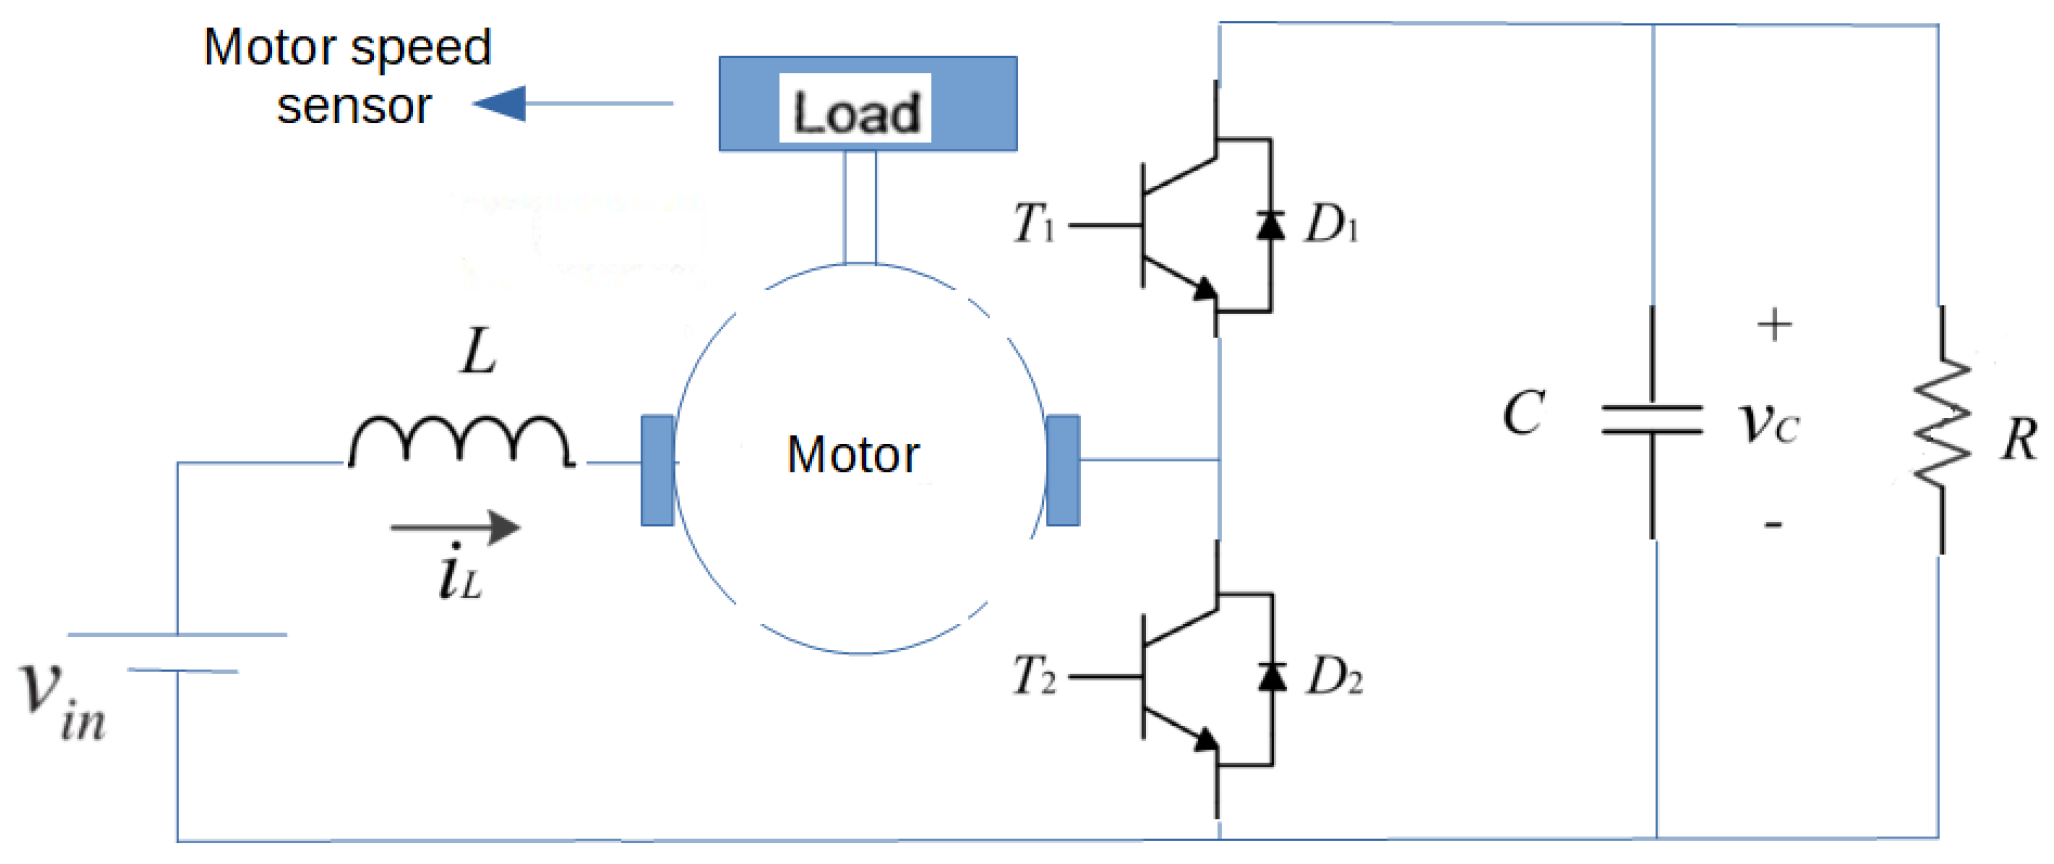
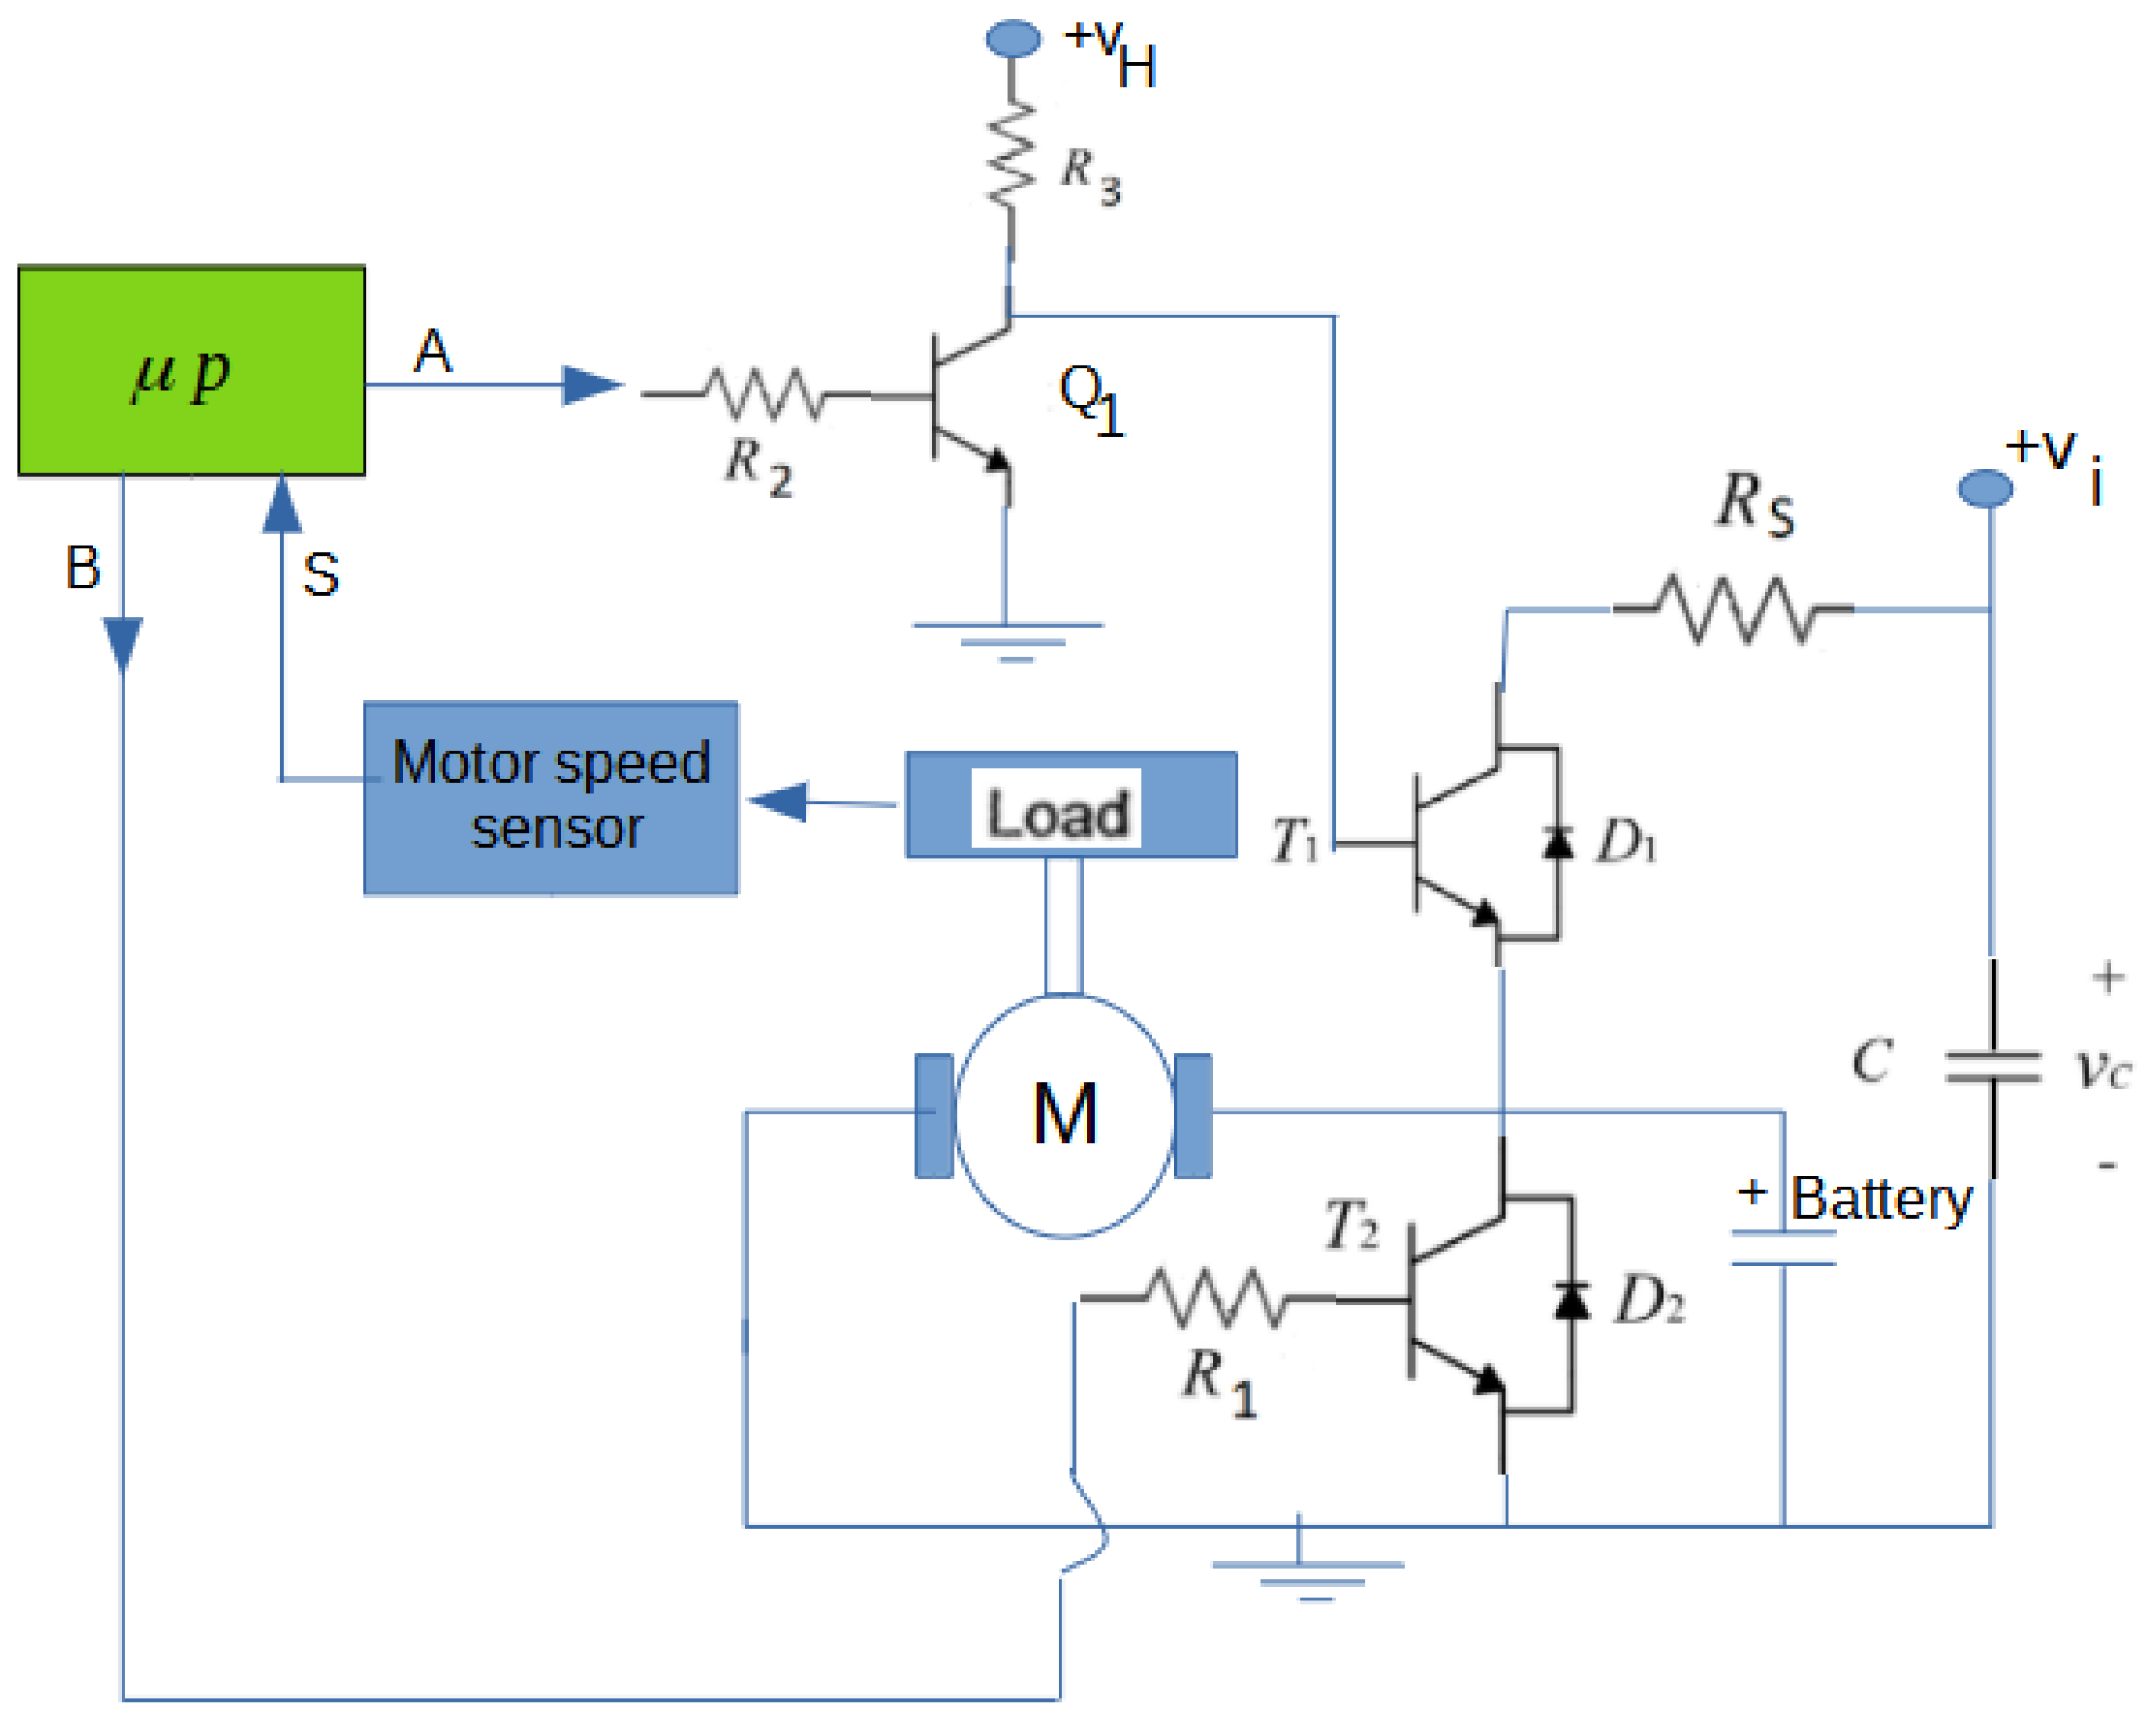
The bidirectional DC-DC converter diagram is shown in Figure 1. This circuit has two standard operating modes [18]:
- Mode 1: transistor is turned on and is turned off. The current increases almost linearly. Then, the capacitor is discharged through the electrical load R.
- Mode 2: transistor is turned off and is turned on. The current decreases almost linearly. In this mode, the capacitor is charged. The electrical load R also receives electrical energy.
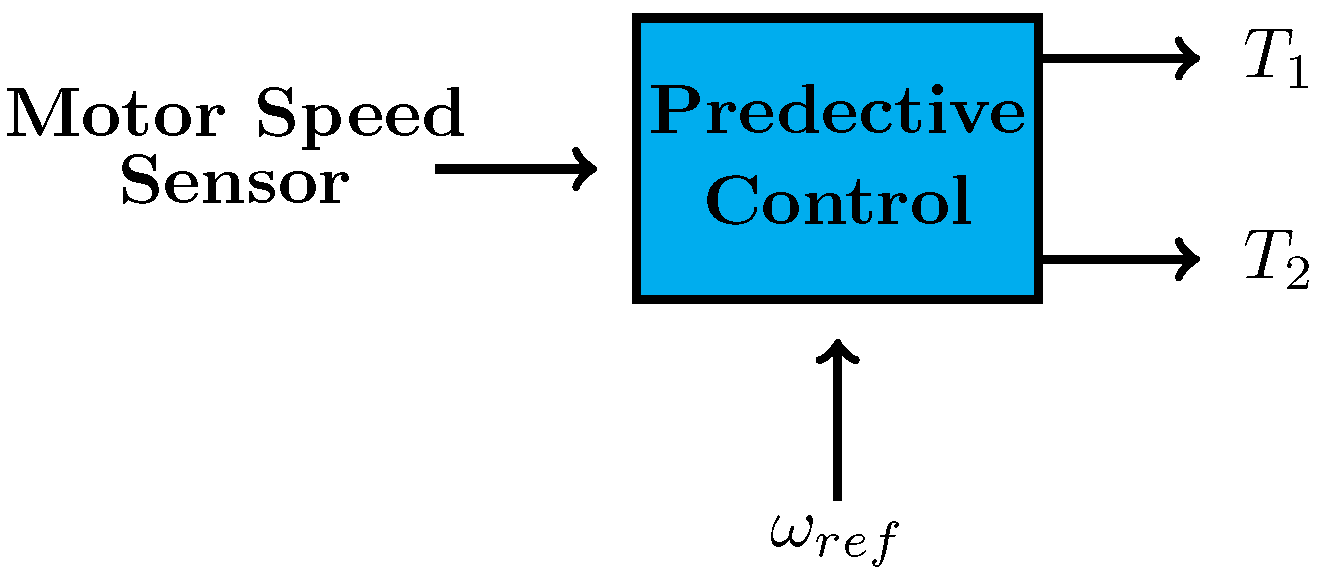
An alternative mode could be when both transistors are turned off [16]. In this option, the circuit can be in Boost or Buck mode. In our predictive control strategy, we will call it the transition mode from Mode 1 to Mode 2 and vice versa. The location of the DC motor is shown in Figure 1. To highlight, can be replaced by a short circuit or by another electrical element. Normally, in other applications, the DC motor is located on the electrical side of the load R. Therefore, to achieve the control objective, the predictive control must generate the triggering signals to the aforementioned transistors. Figure 2 shows the control block.
3. Mathematical Model of a DC Motor
For control realization, we use a DC motor in a series-excited connection given by [35]:
where is the load torque, B is the viscous friction constant, J is the shaft inertia of the motor, and is the motor rotational speed (the controlled variable). The electromagnetic torque generated by the DC motor is:
The above torque depends on the motor constant and the current through the motor , which is given by:
where and L are the winding resistance and inductance of the DC motor, respectively, and is a magnetic flux function that depends mainly on the current, the saturation, and the hysteresis effects of the motor’s electromagnetic components. For control design, a simple model of the DC motor is possible by assuming and zero viscous friction, resulting in [36]:
An option for the predictive control design is to further simplify the above model. Note that the system is stationary when . So, using a coordinate change , we obtain:
For simplicity, we rename . This gives us a simplified model for the control design:
Finally, we need to analyze the above equation in the discrete time domain:
where h is the Euler parameter. The above equation predicts that is . Therefore, can be considered as the desired control signal. This is the one-step-ahead prediction similar to that reported in [9,37]. Hence, the optimization phase is not necessary. From Equation (7), we obtain:
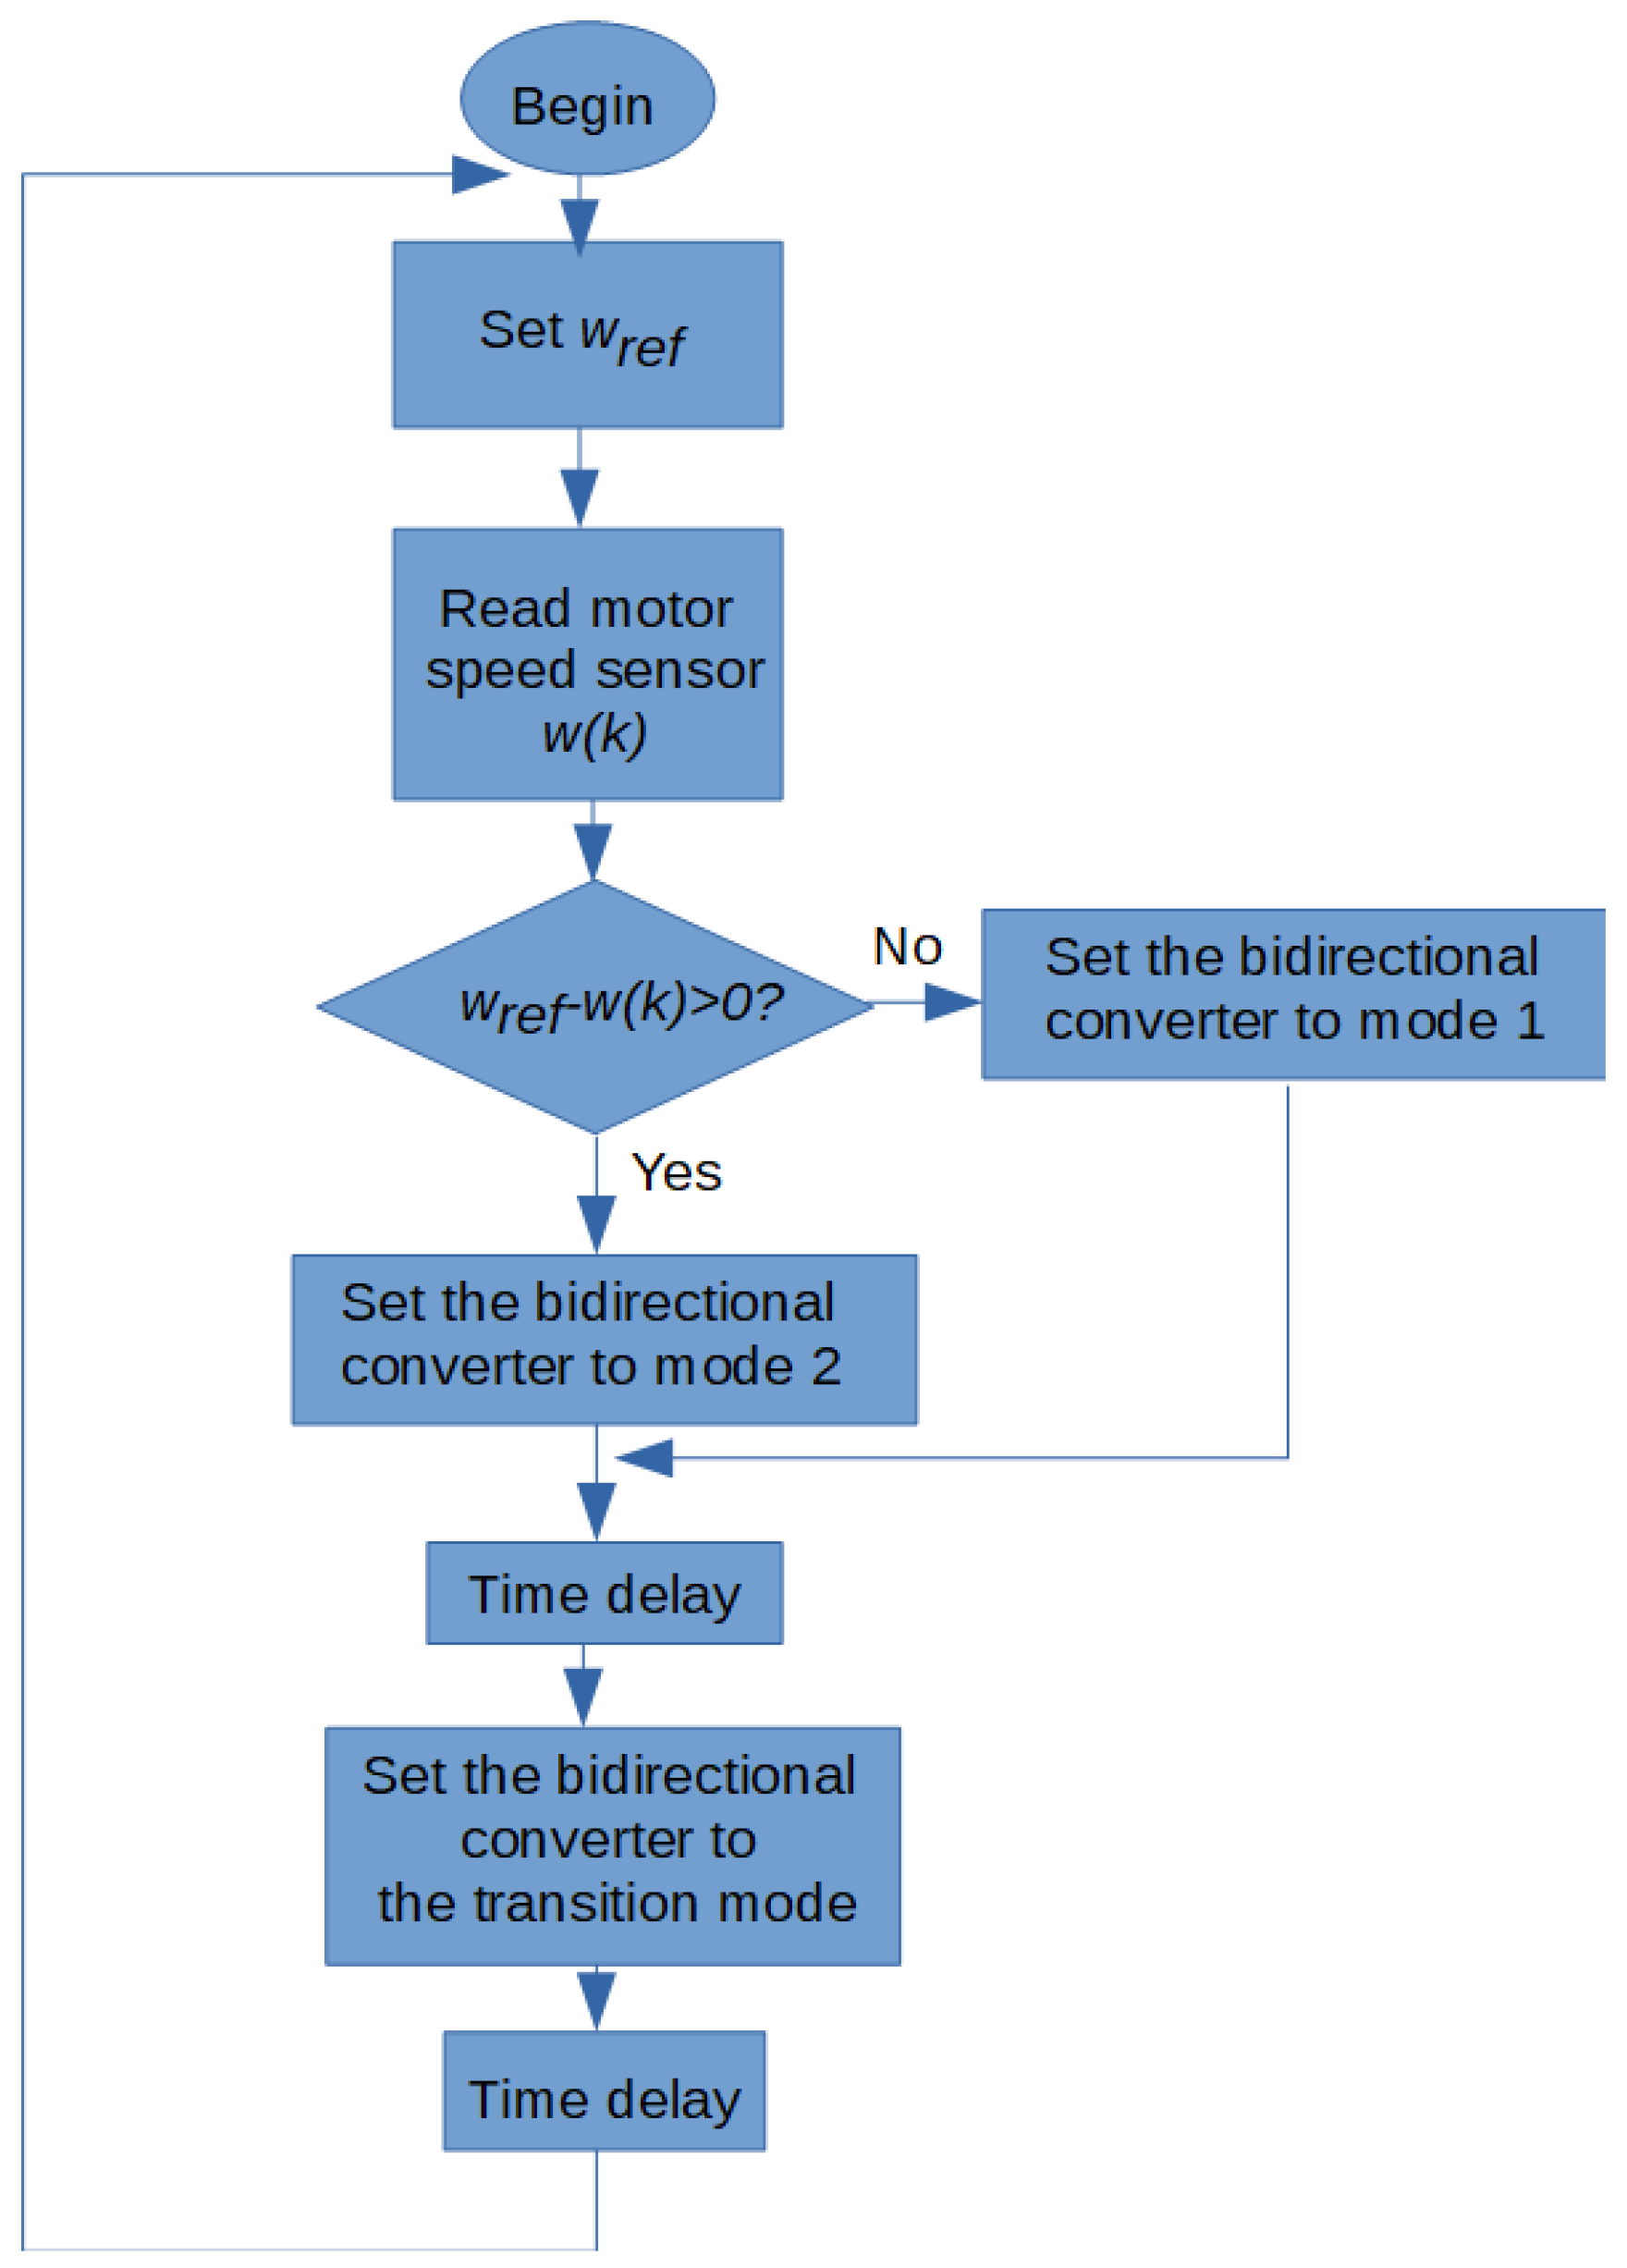
In our declaration, the h parameter must be set to a possible small number. Finally, from Equation (8), we arrive at the predictive control scheme which is described in Figure 3. This algorithm will increase or decrease the current supplied to the motor so that it will run at the desired speed in a zigzag manner around this value.
Note. According to [38] (chapter 6), if the prediction is fulfilled, then the closed-loop system can be assumed to be stable. However, if the experiment has robustness problems, then there is a way to improve the controller performance by adding some constraints [38] (chapter 8). In our experimental platform, it was not necessary to do that since the experiment showed an acceptable performance.
4. Experimental Platform Design: The Short Circuit Battery Set-Up
Here, we will show the results of the experimental platform shown in Figure 4 but configured for the battery case, called the short circuit () battery stage. Therefore, the main objective of this experiment is to test the performance of the main parts of our electronics, including the motor speed sensor circuit.
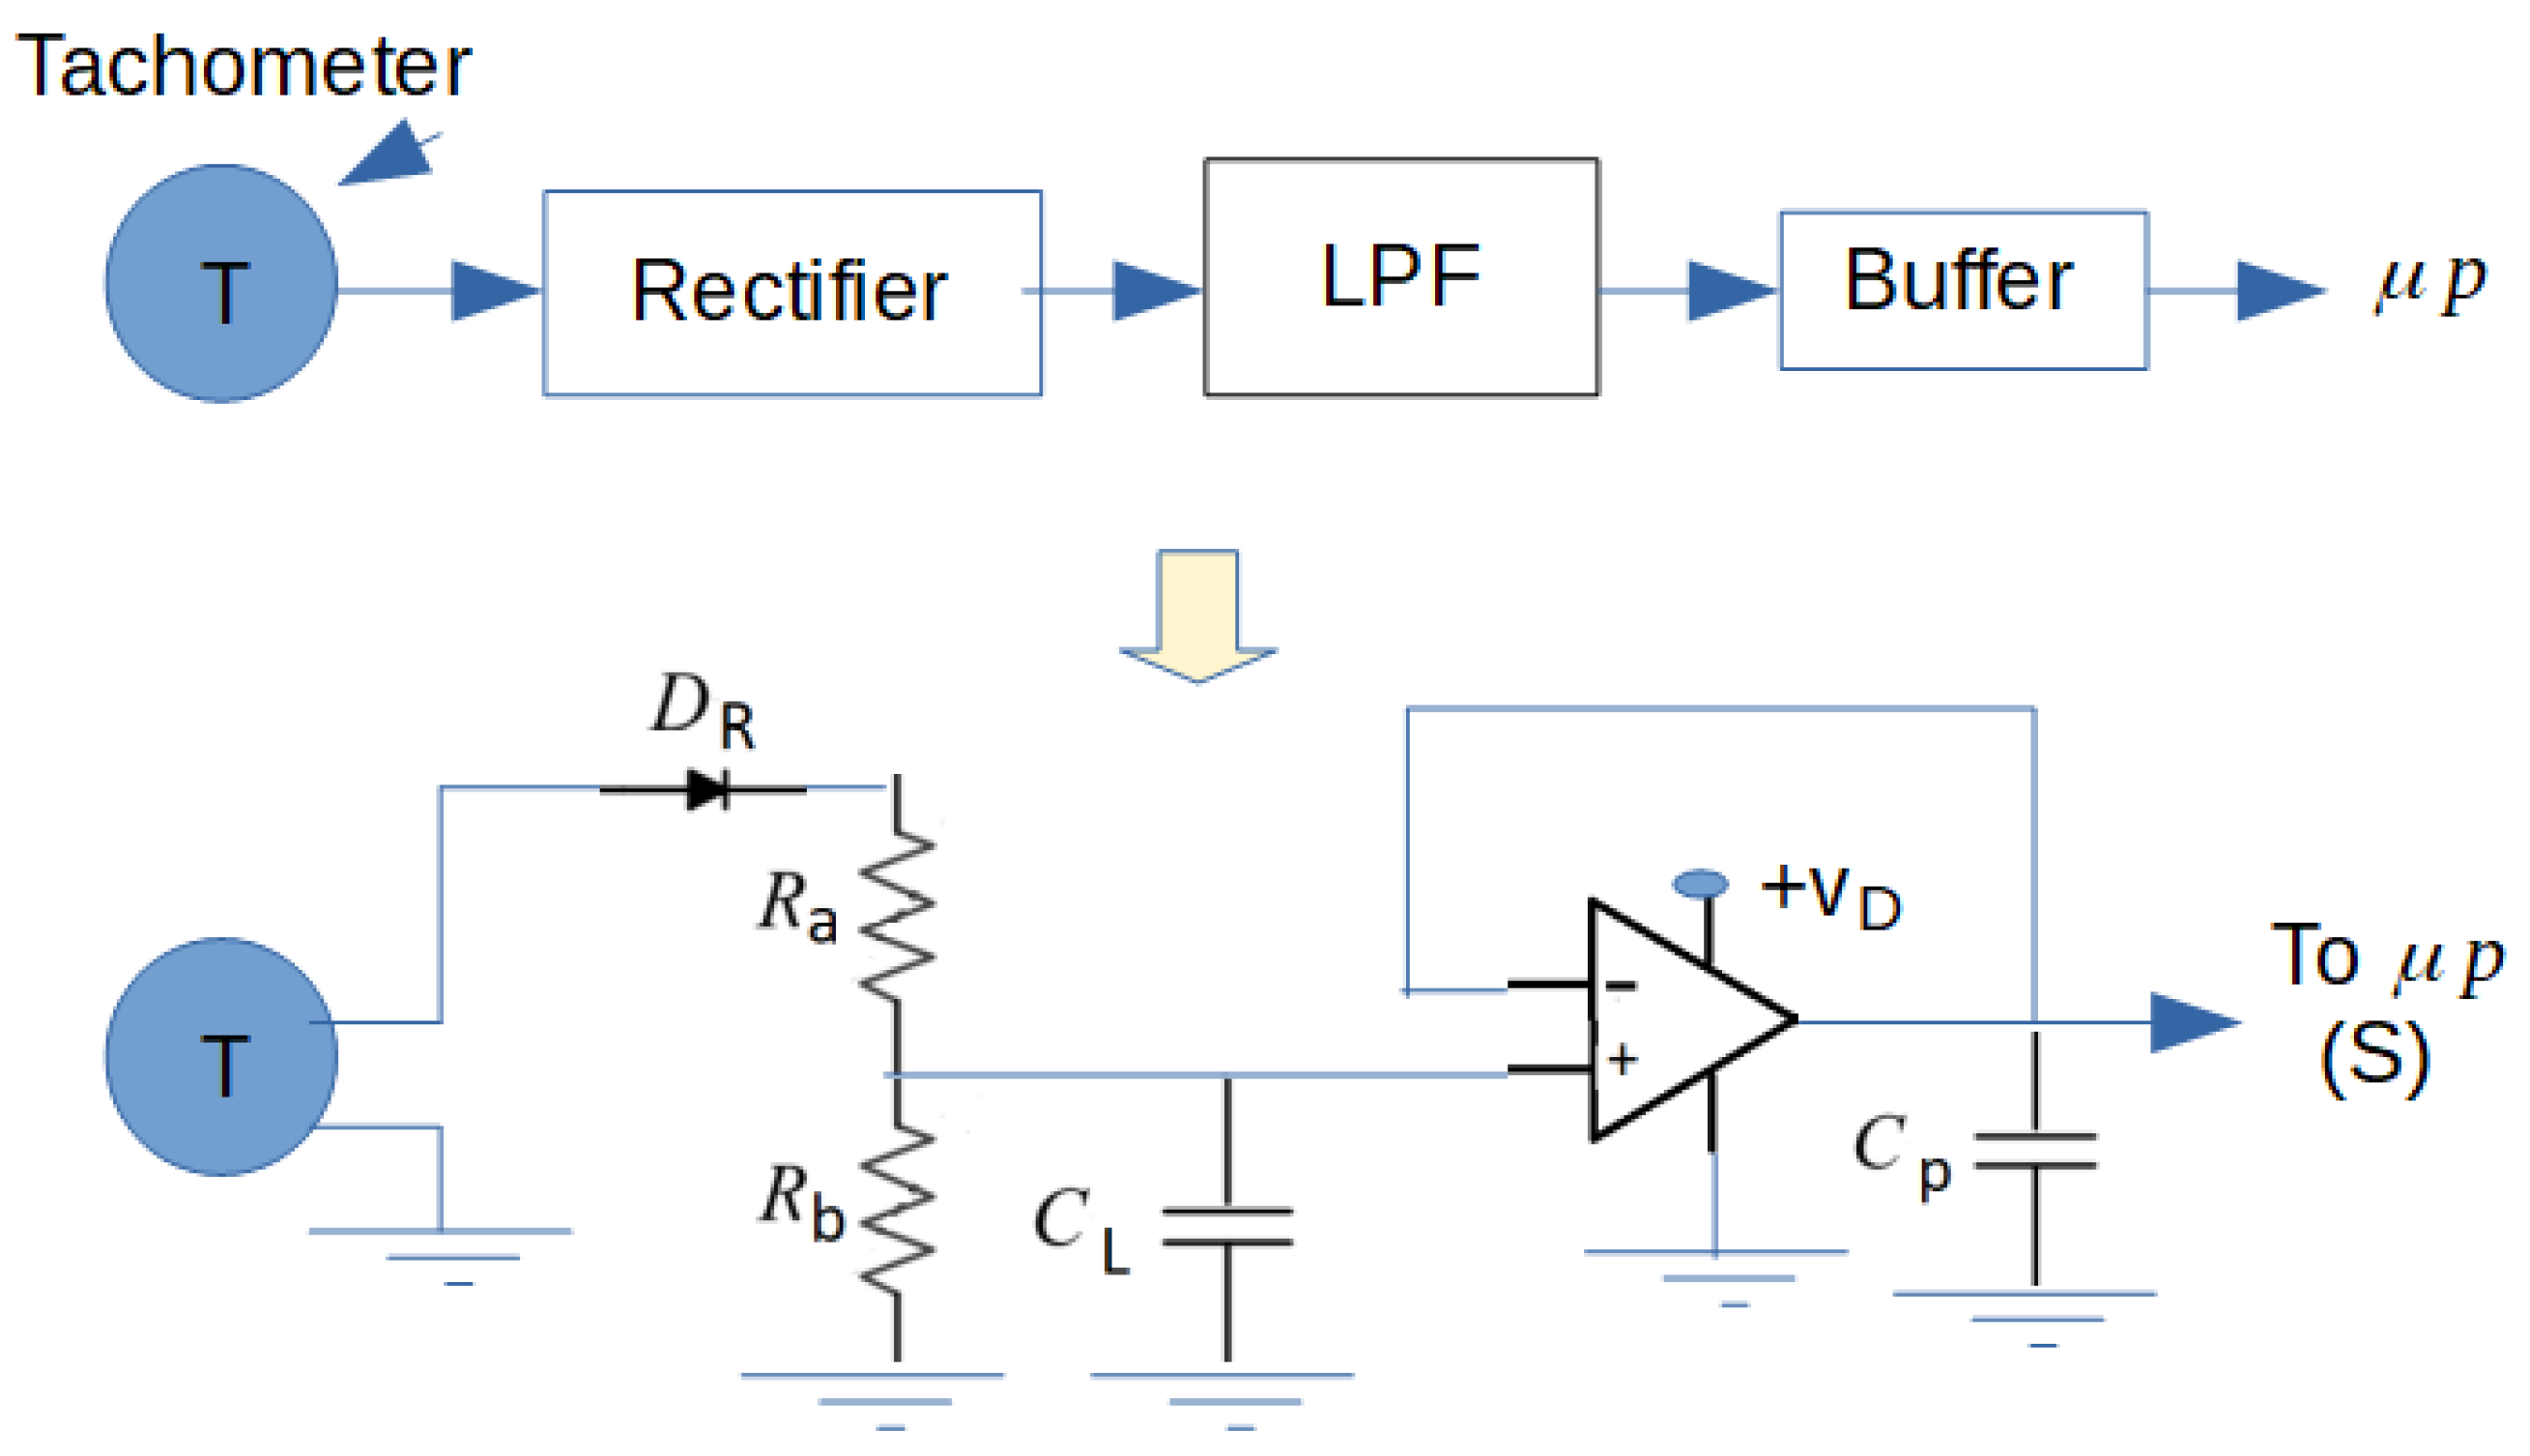
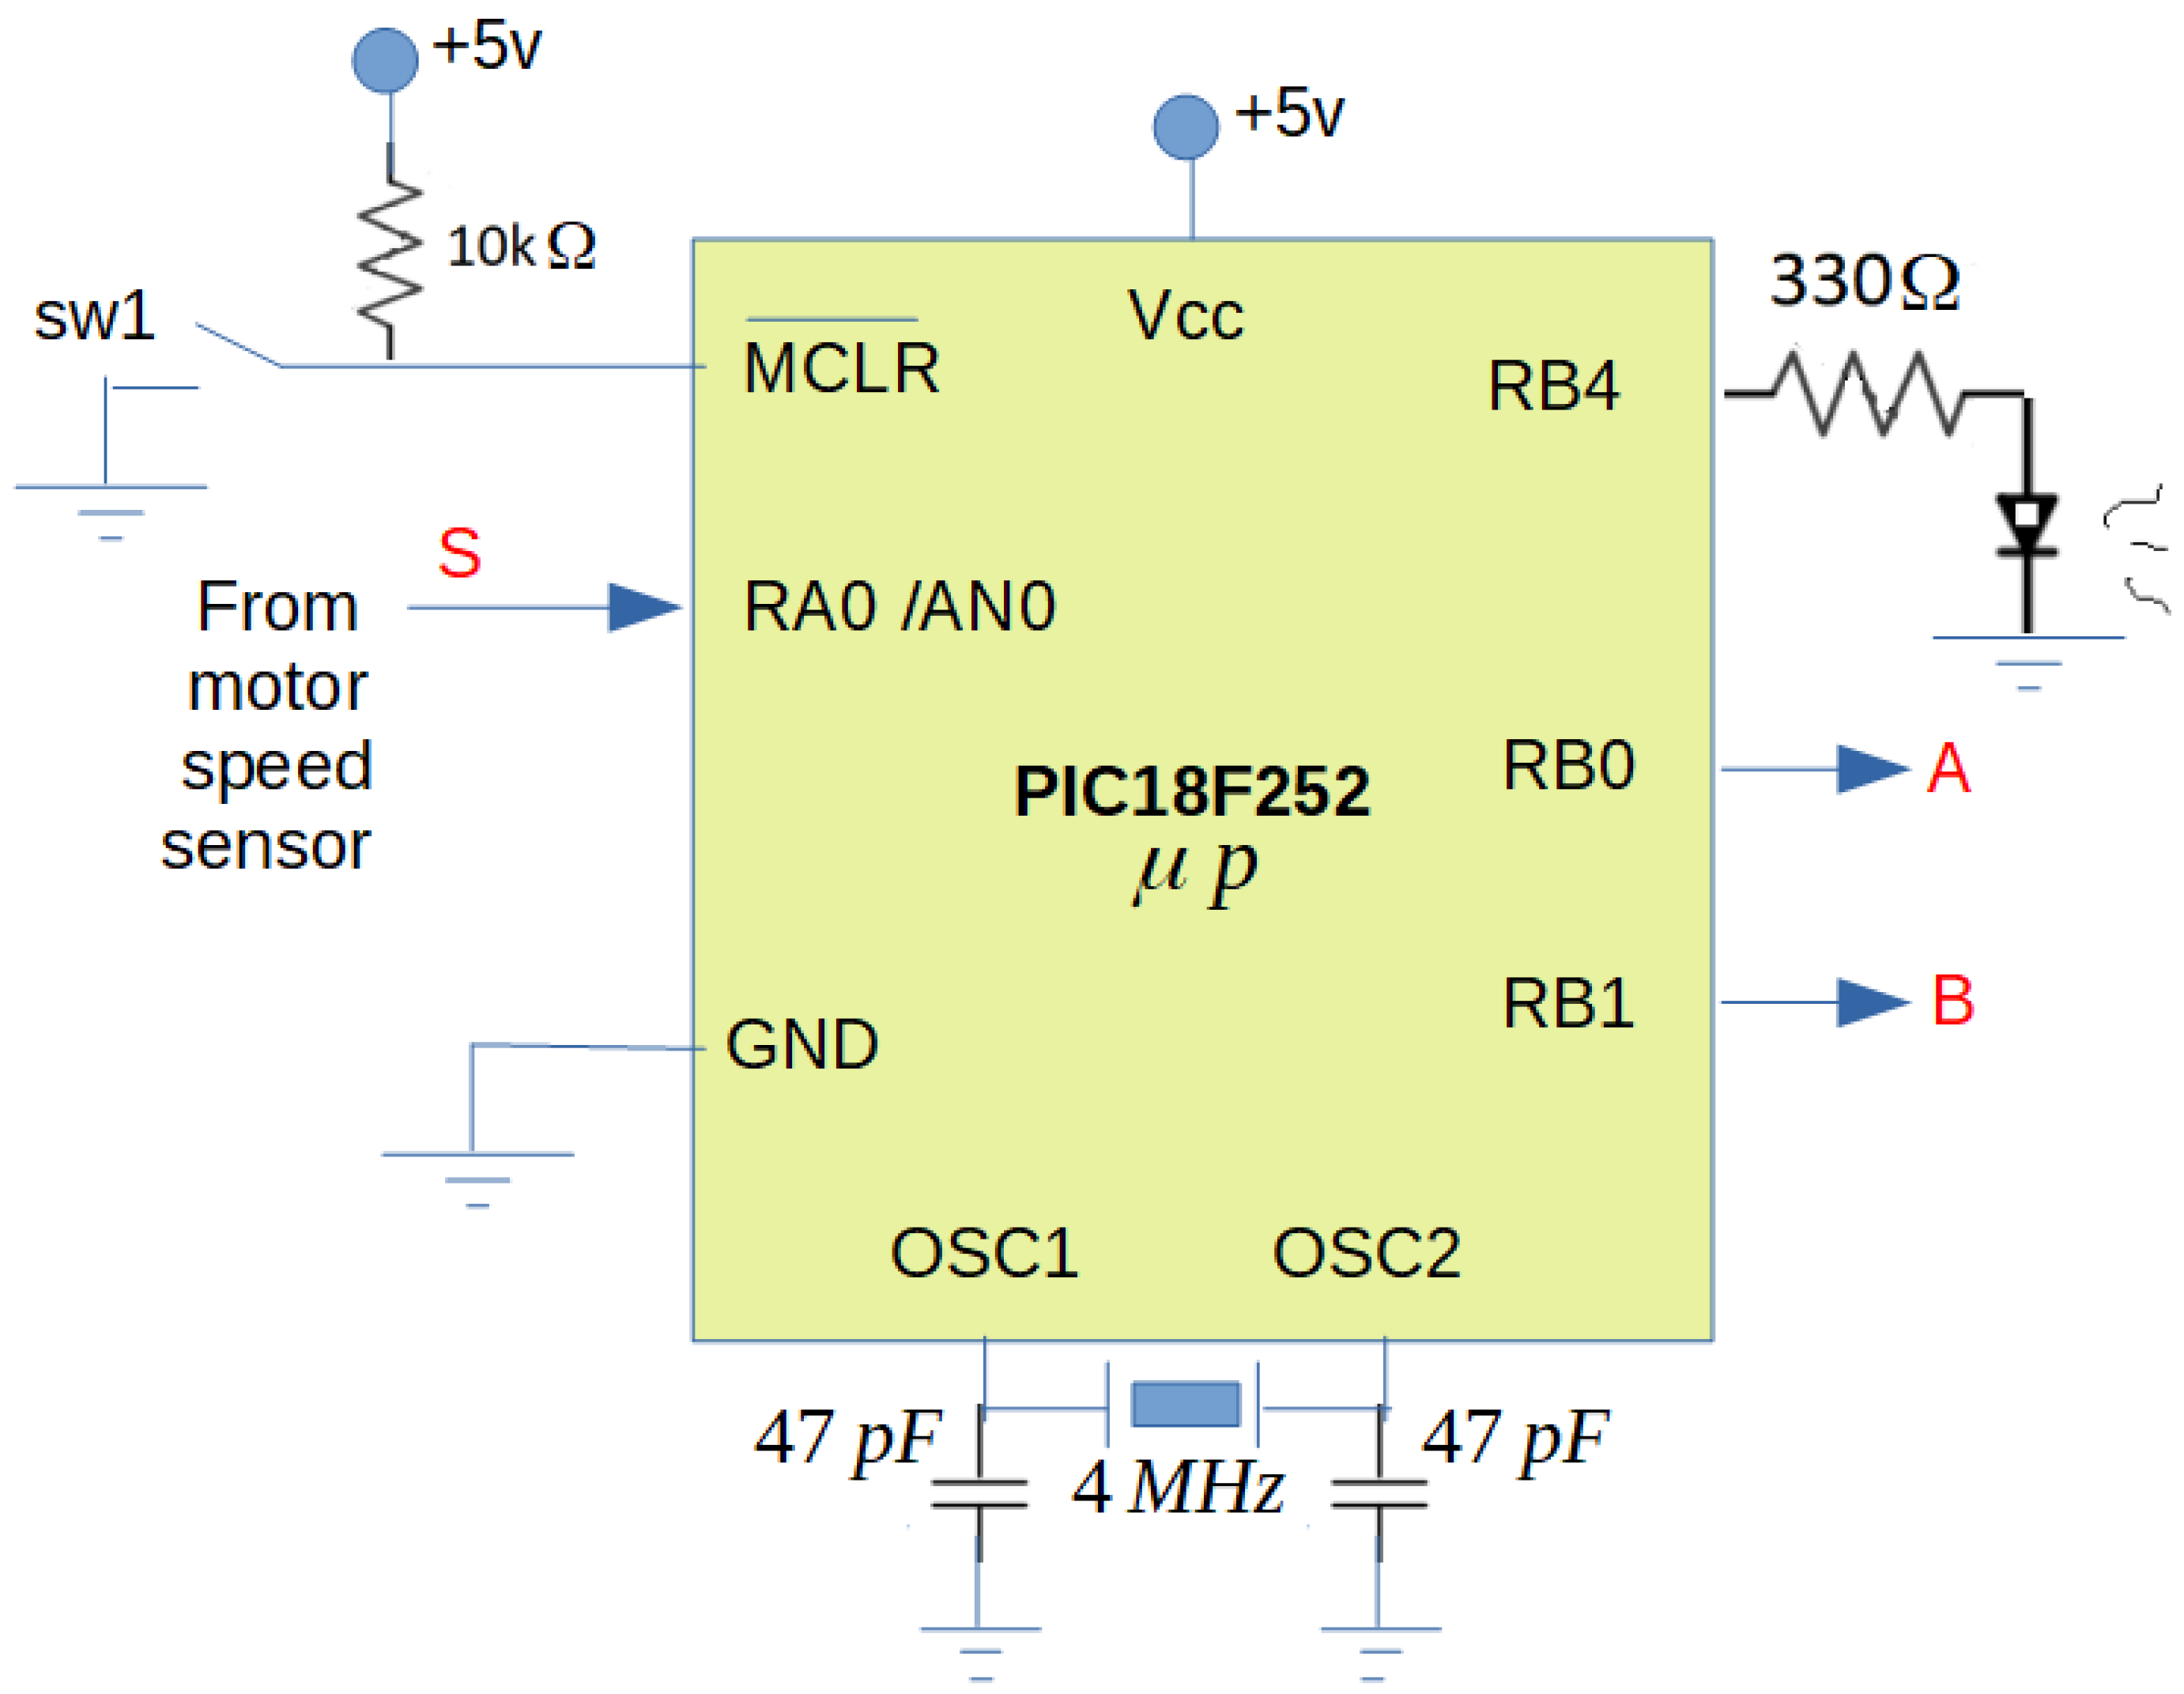
Figure 5 shows the motor speed sensor implemented in our platform. We used the 12-pole analog inductive tachometer fitted to the motor by the manufacturer. Experimentally, an output sensor gave readings of V about 2200 rpm motor speed, and about V at 1600 rpm. Figure 6 shows the diagram connection to the microcontroller unit. A picture of the experimental platform is given in Figure 7. For clarity, Appendix A shows an screenshot of the C-Program located inside the microcontroller unit.
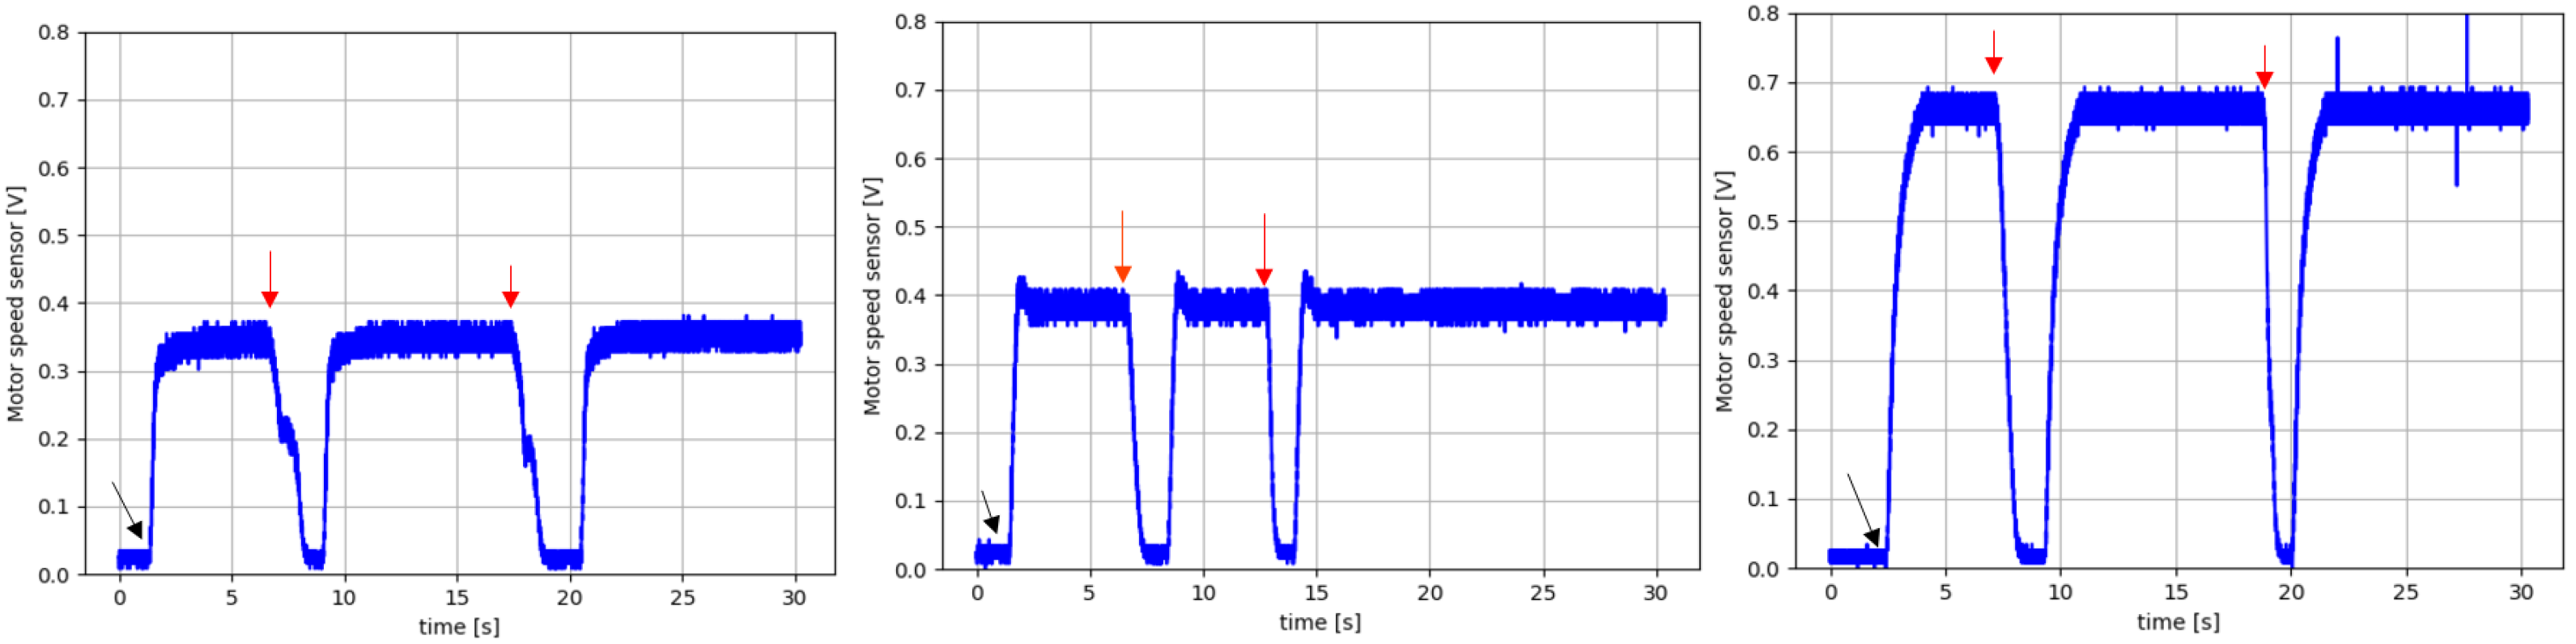
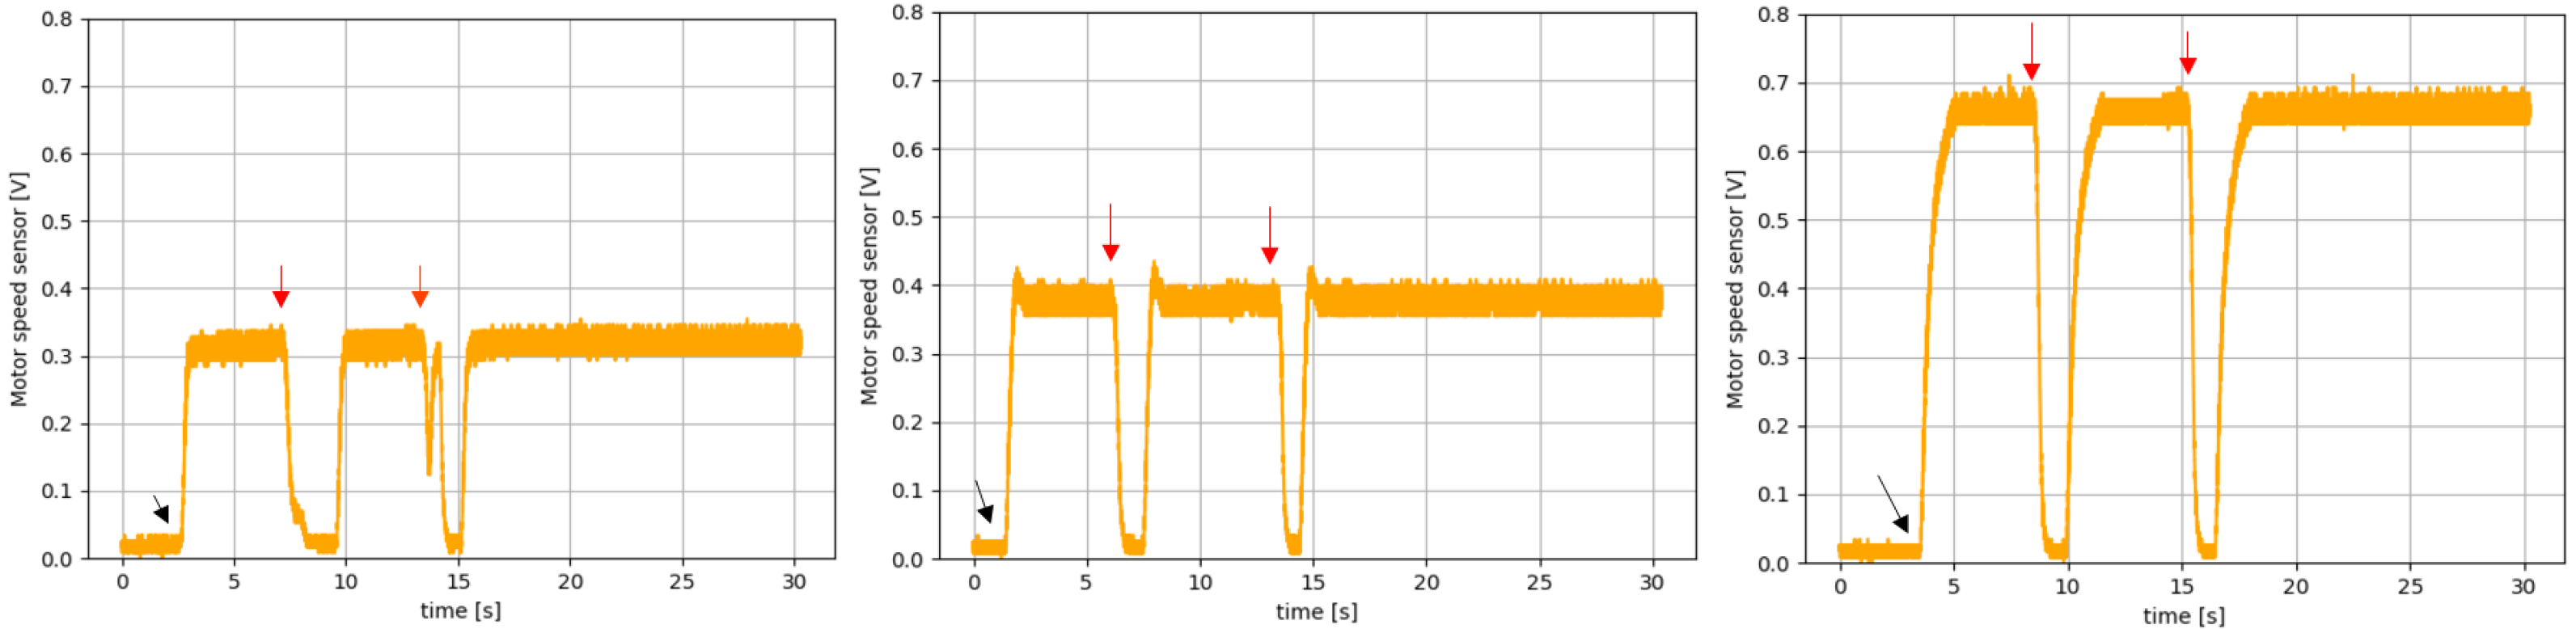
In addition, Figure 8 shows the experimental result of the motor speed sensor for different values of in hexadecimal format. On the other hand, Figure 9 shows the case of a faulty scenario by adding a capacitor of 100 F in parallel to the capacitor C of the bidirectional converter shown in Figure 4, and by using the same data. This is to appreciate the sensitivity of our experimental platform to changes in its capacitance. In Figure 8 and Figure 9, the black arrows indicate the time moments of the control activations. The red arrows represent the moment when external perturbations are added to the motor’s shaft by stopping it and then realizing it by hand.
5. Short-Circuit State Experimentation
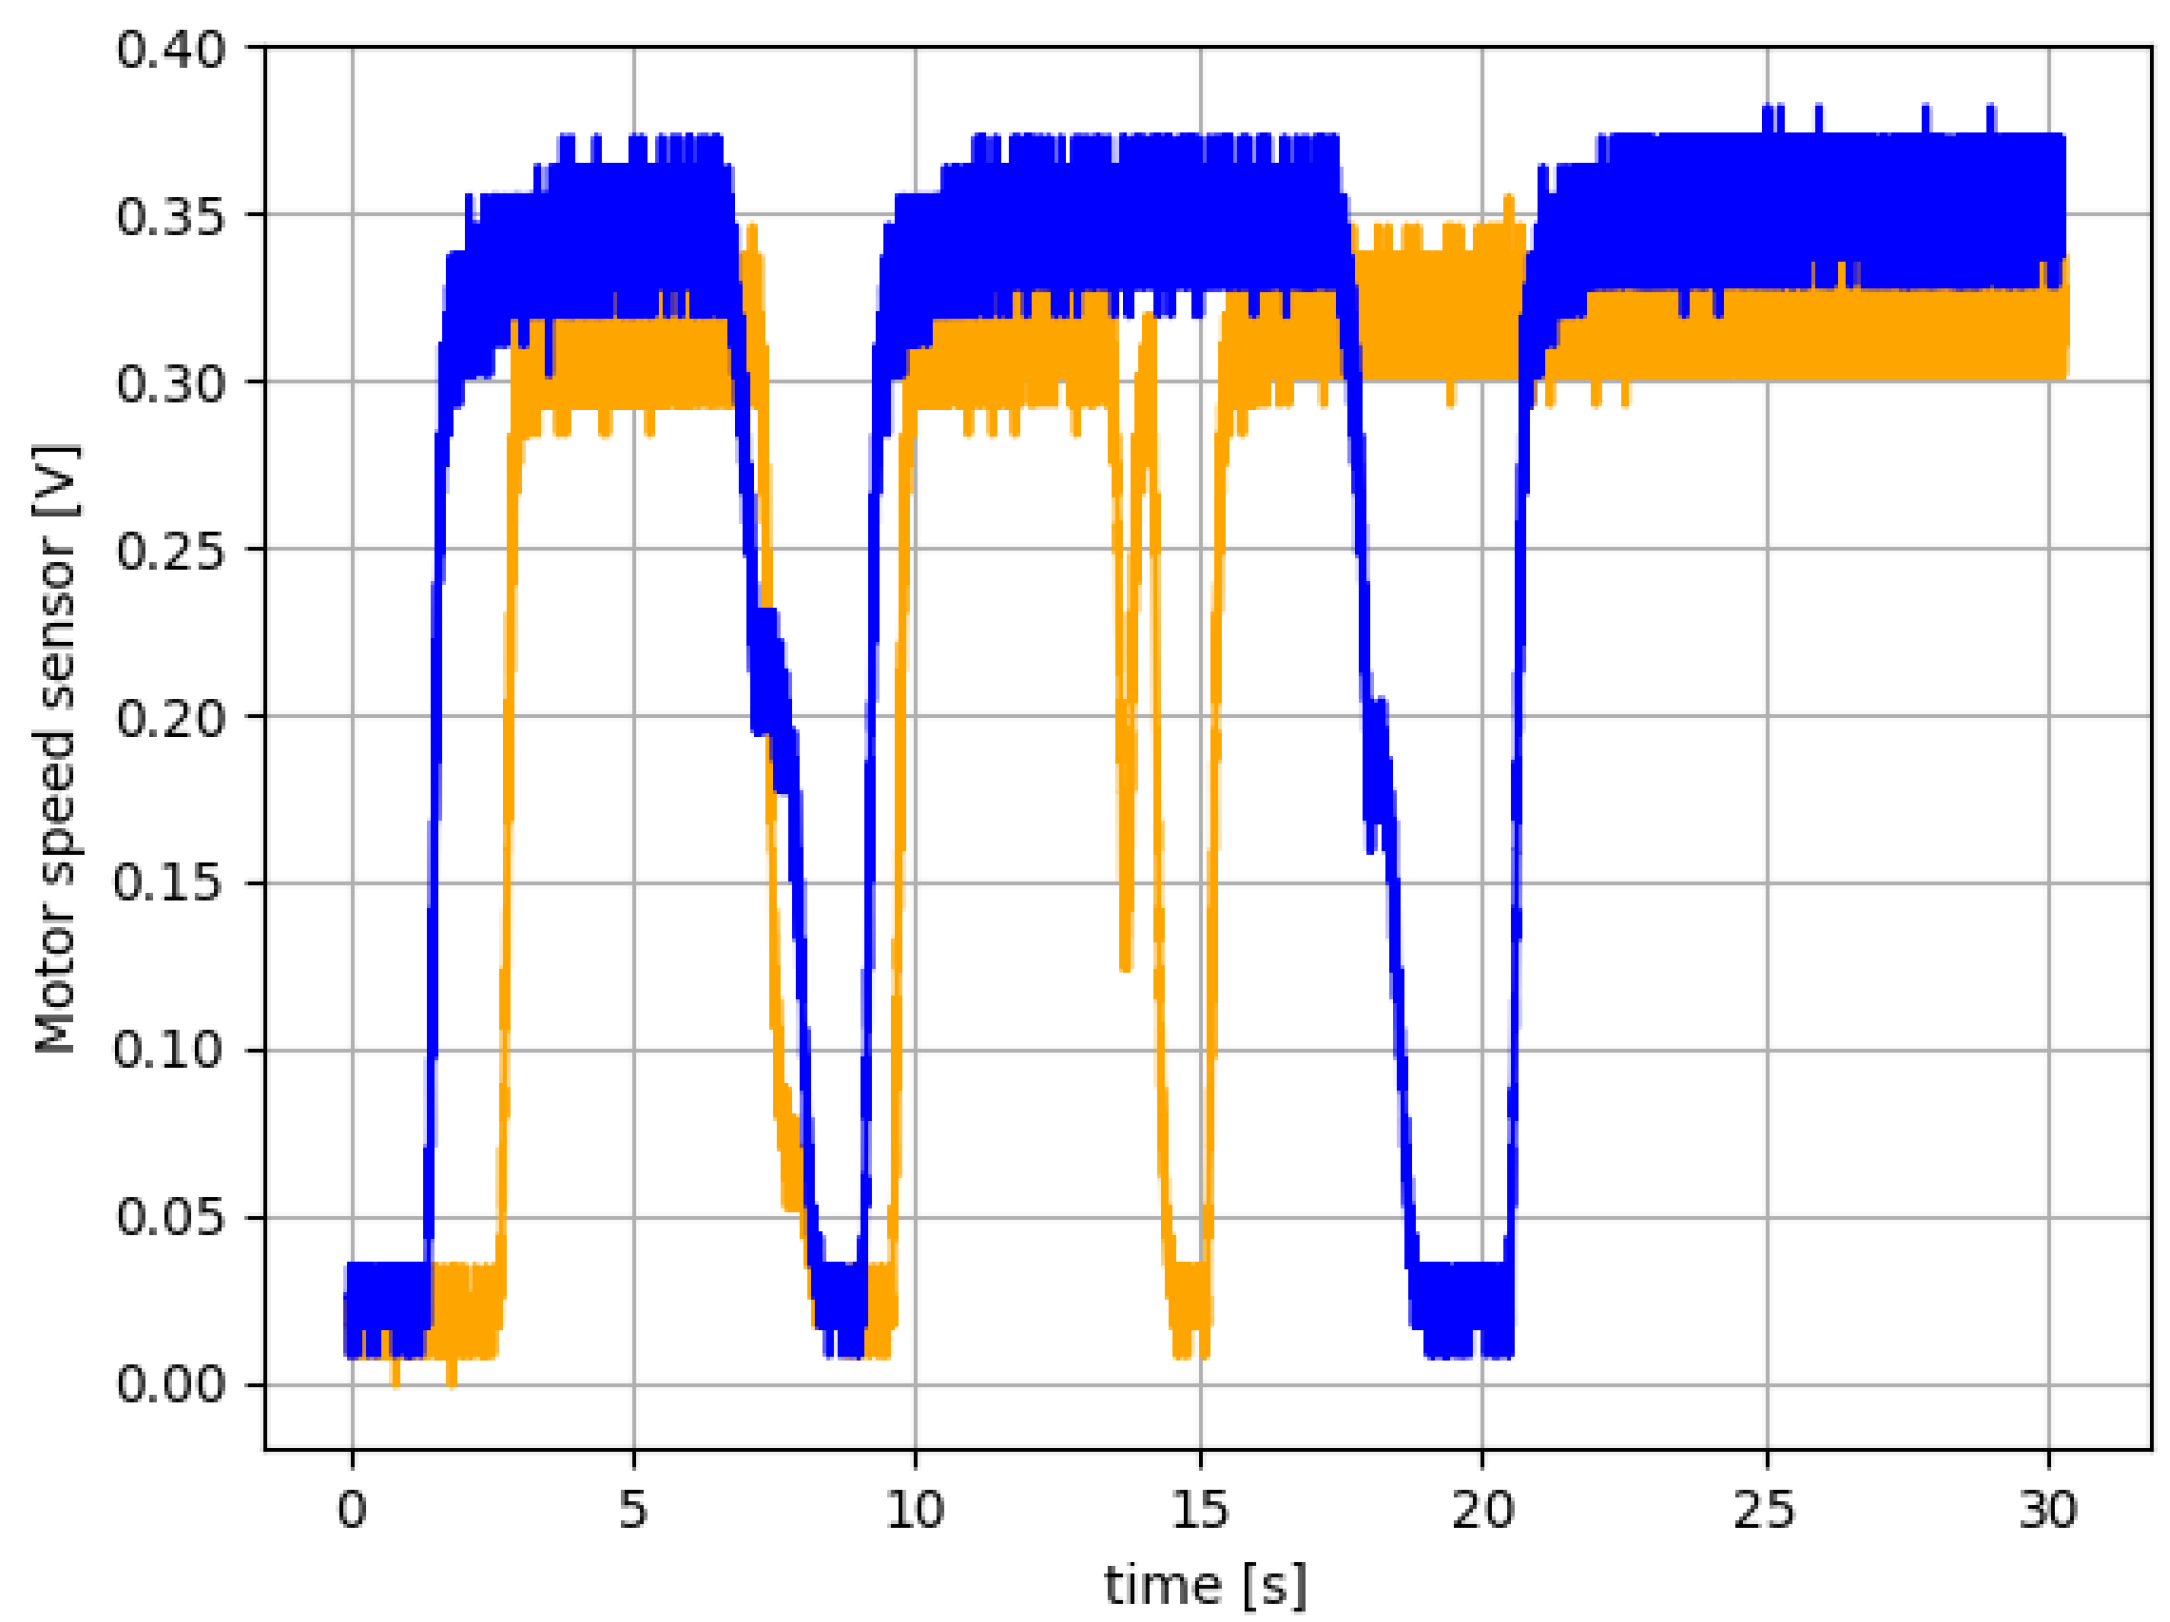
We use a motor without a load and added external torque perturbations from the previous section to study the proposed control performance. From Figure 8 and Figure 9, we can see the transient response of the controlled system for each perturbed case previously specified. The figures do not have a consistent axis scale since their objective is not a quantitative comparison, and to show the transient responses of the controlled system. We can see that the transient responses of the system are different due to the non-linear behavior of the whole system, including friction and motor-induced hysteresis, among others. Nevertheless, our controller responds and stabilizes the closed-loop system as expected from the predictive control point of view. A steady state error is observed due to the non-compensation of non-linearities of the simple predictive control, as discussed in [39]. Figure 10 shows a visual comparison between healthy and faulty cases (when the capacitor of 100 F is either missing or present) for 0x26. We can see that the controller is more sensitive to the faulty case than to the standard one.
6. Experimental Results for the Faulty Car Battery Emulator Setup
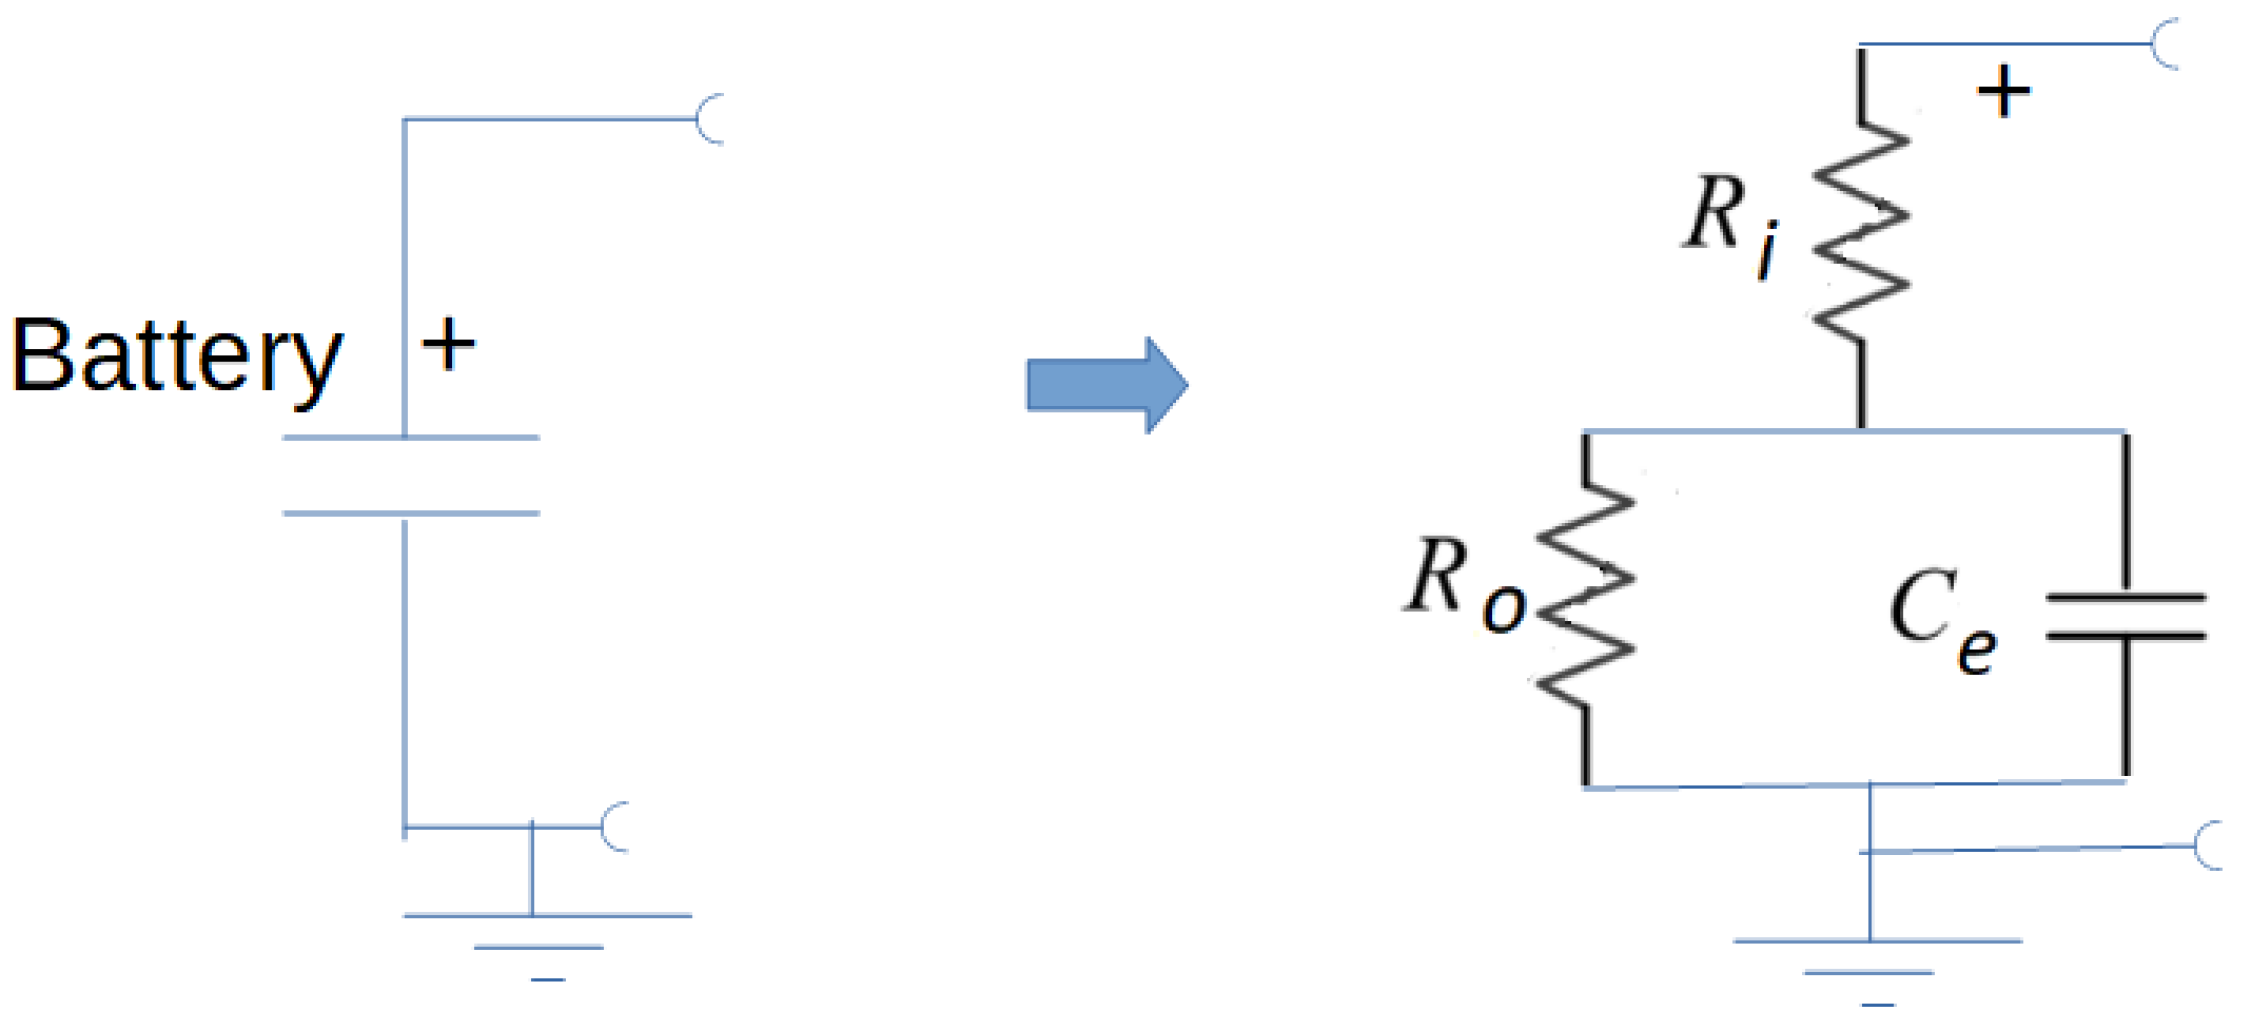
After studying the short circuit battery case to analyze our experimental platform’s performance, we successfully added a battery emulator. Based on the experiments, the best location for our battery emulator was found (see Figure 11). In addition to using a 10,000 F supercapacitor, other electronics were added to emulate a failed car battery, see Figure 12. By failures, we mean, for example, the effect of the charging/discharging process on the performance of an electric car battery. To do this, we modified the relationship between the resistances and . The load resistance can also affect the capacitor’s discharge/charge time constant. Therefore, if is a lot smaller than , and then changes, we can emulate battery failures. We proceed as follows. We set the value of the resistor to 100 . Then, will take the following values for the healthy and faulty states of our system:
- Healthy case: M ;
- Faulty case A: K ;
- Faulty case B: K .
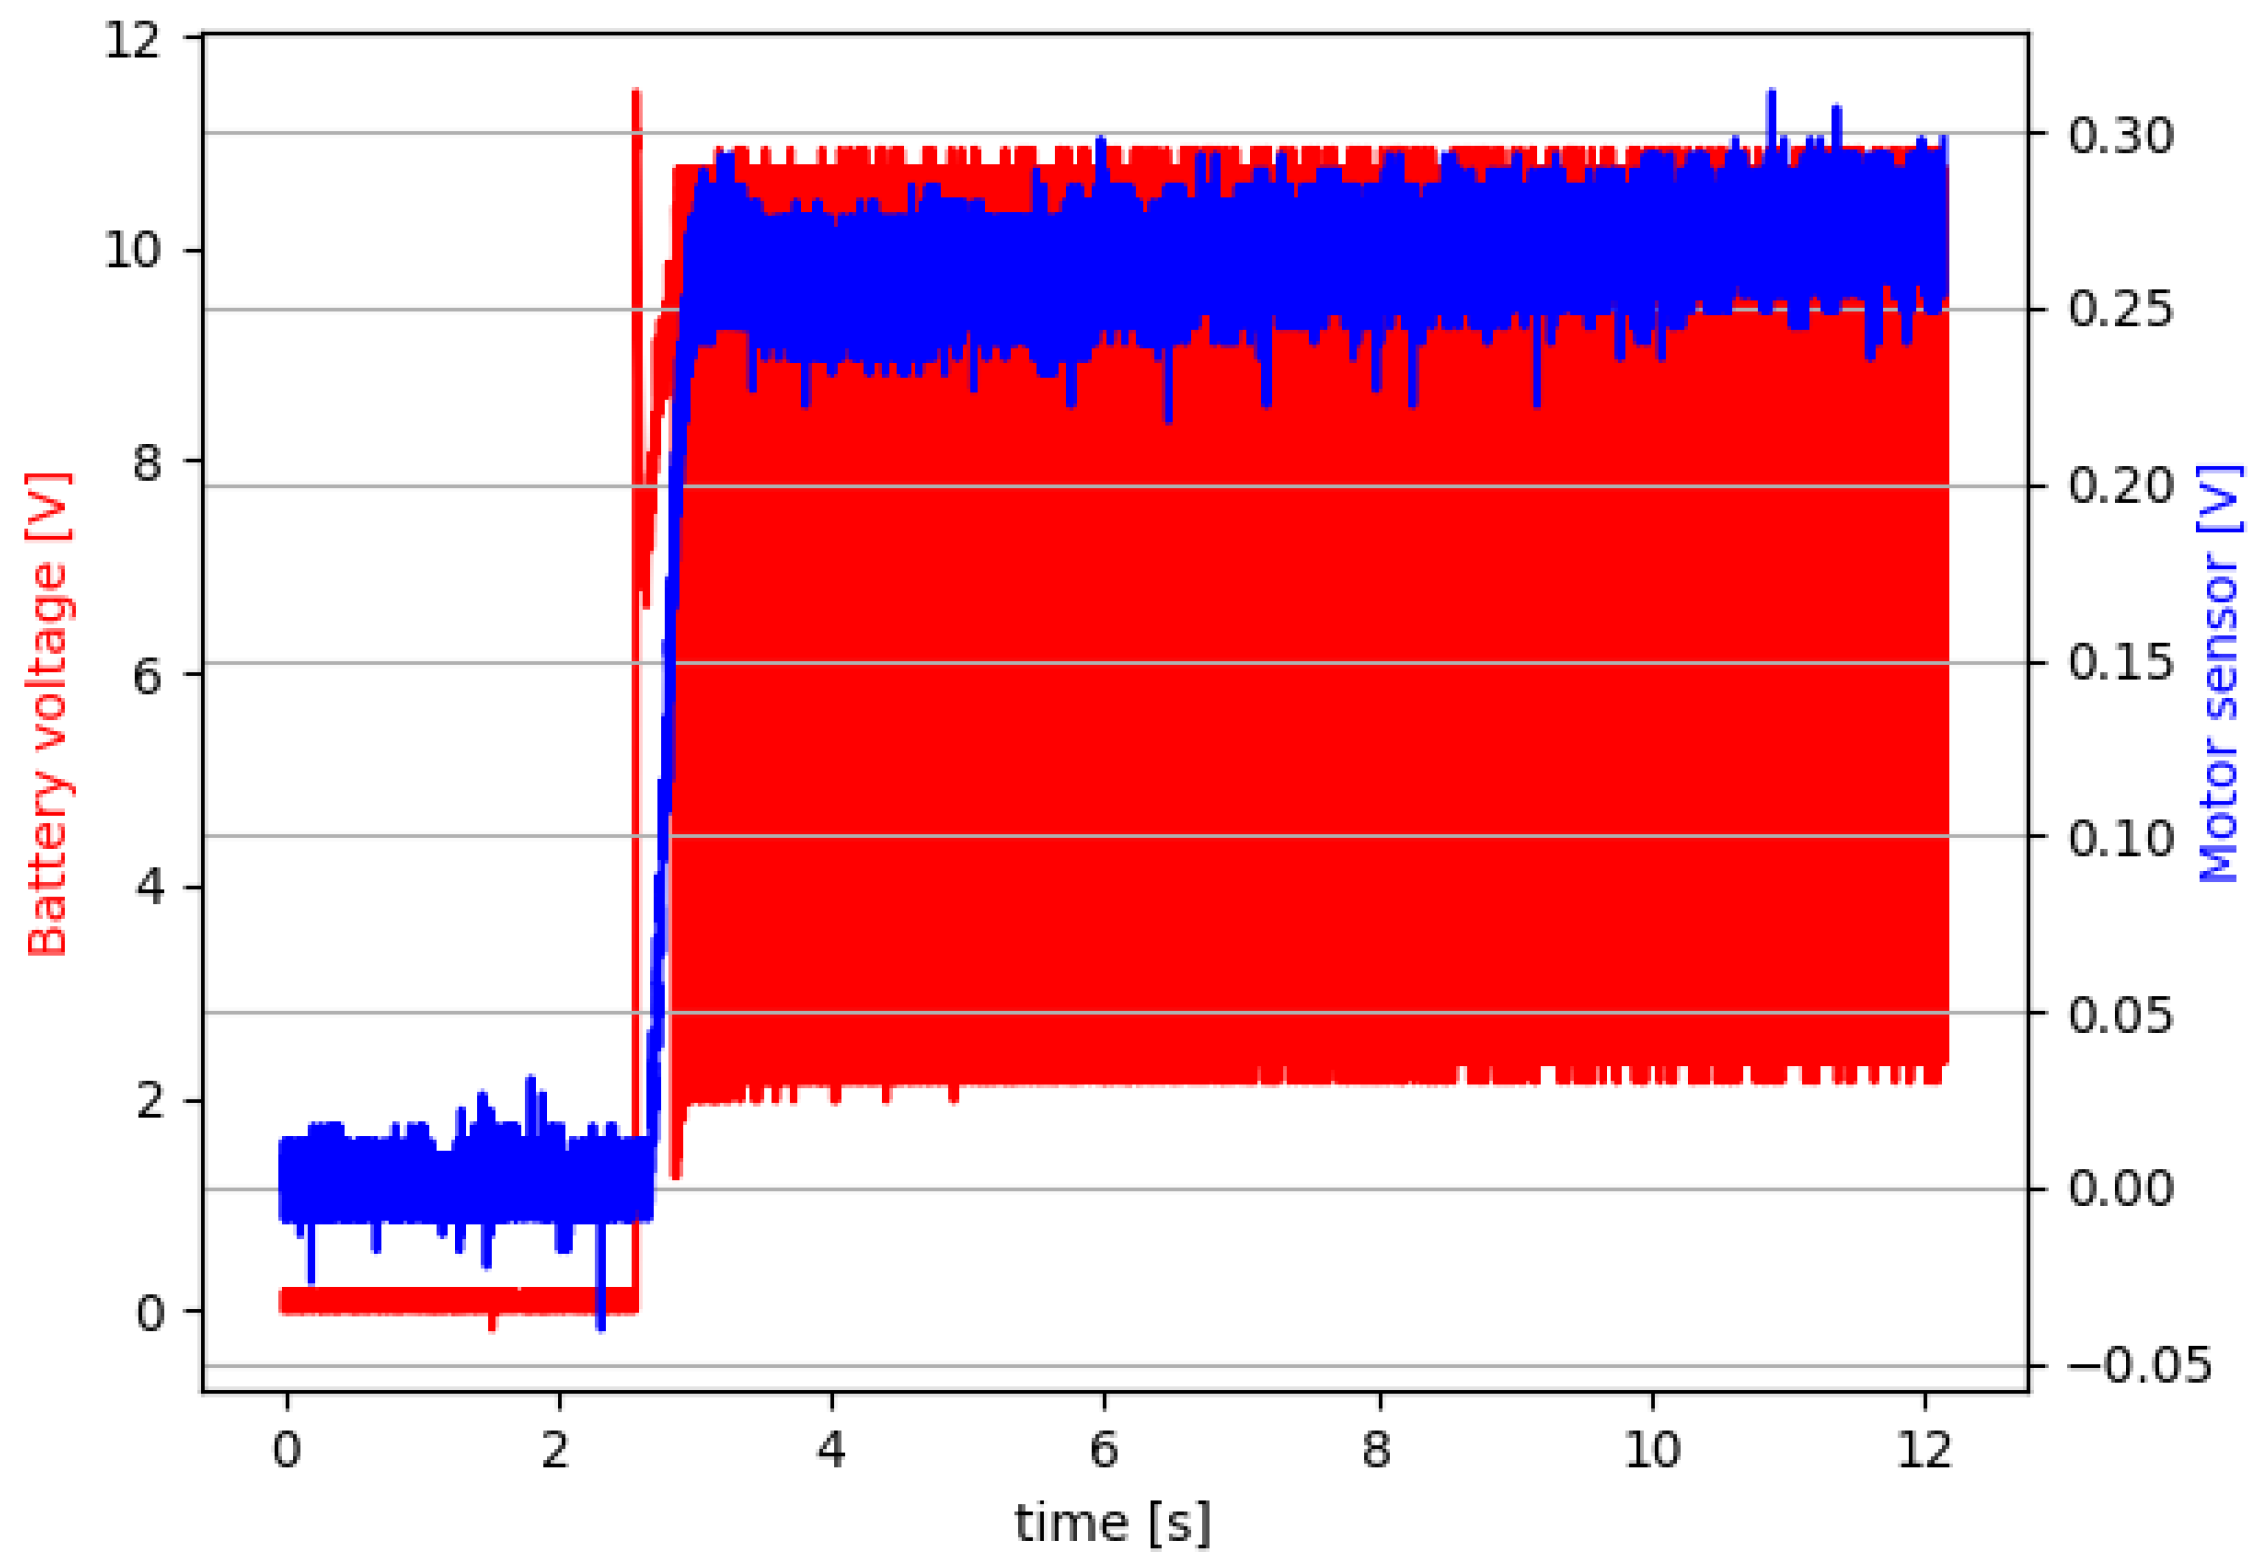
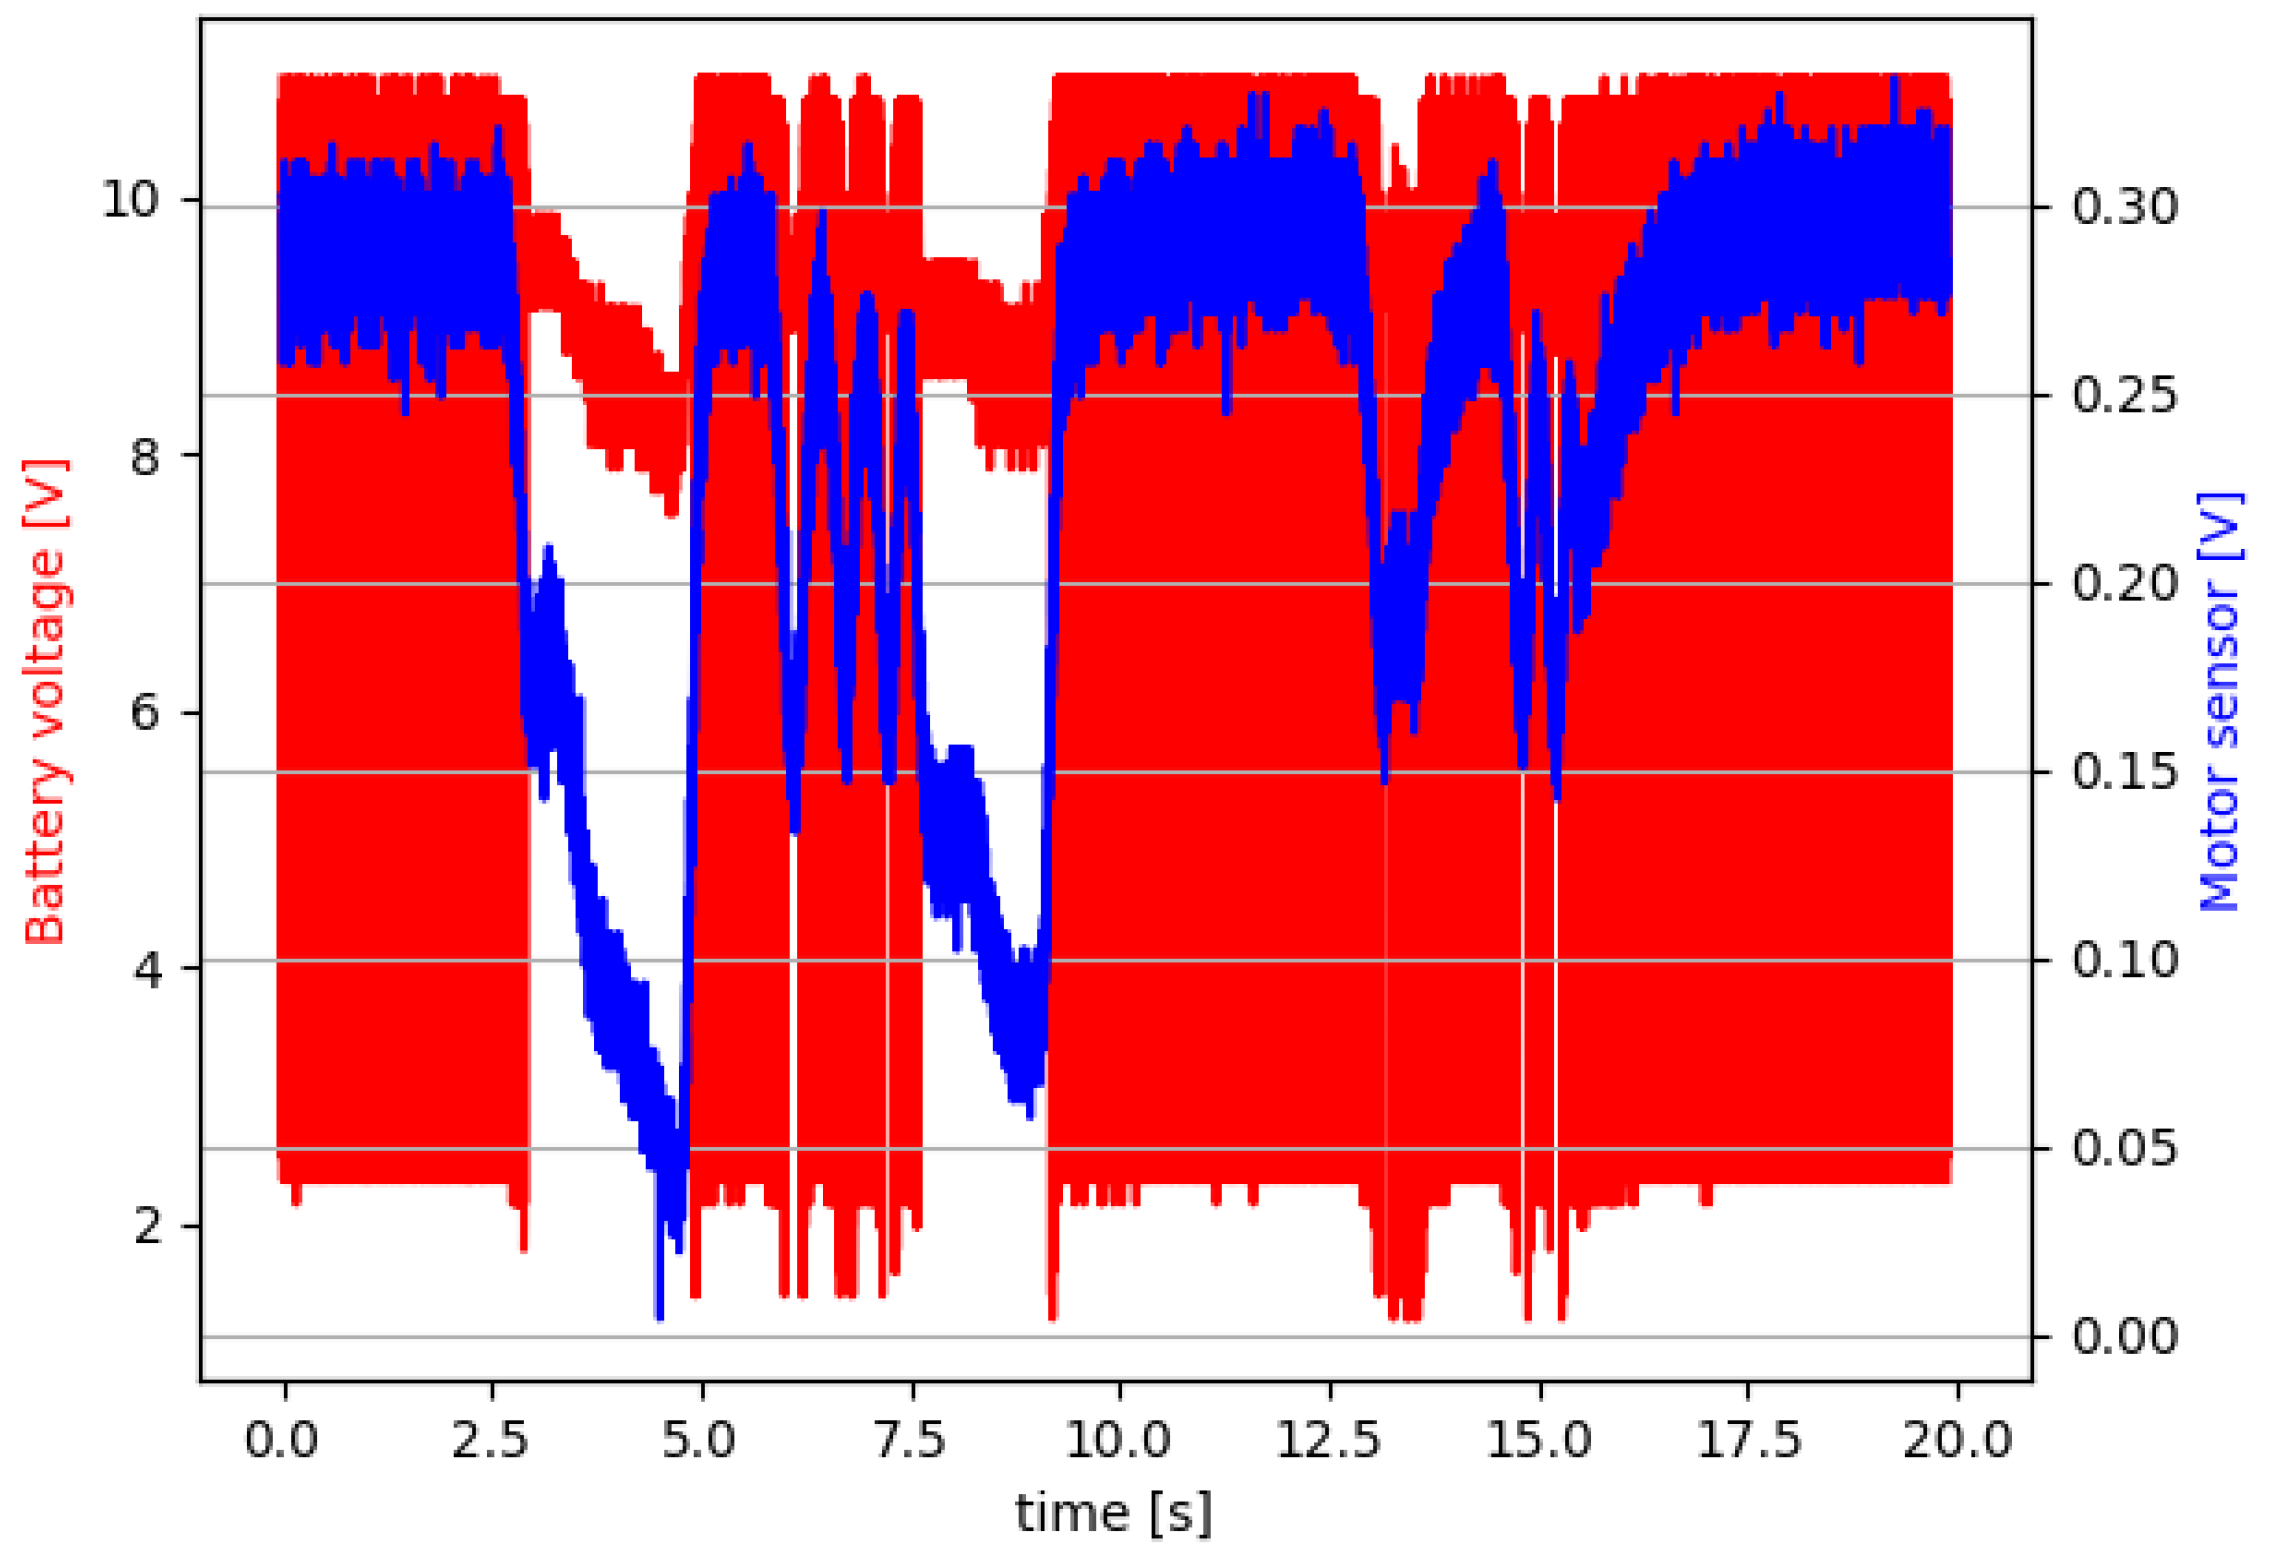
The above stages emulate the depletion of the battery as is reduced. Thus, the faulty case consists of variation in the capacitor’s charge and discharge time constant around the healthy scenario. We have used capacitance and resistance to produce time constants similar to those presented, for example, in [40]. Furthermore, our dynamic model is close to the model reported in [40]. After the short circuit phase, we set x26. During the experiment, the voltage signal from the battery model at point + is taken for each case and the information from the motor speed sensor is read too (see Figure 12). These data are also used by our fault diagnosis methods. Figure 13 and Figure 14 show the experimental results for the healthy scenario.
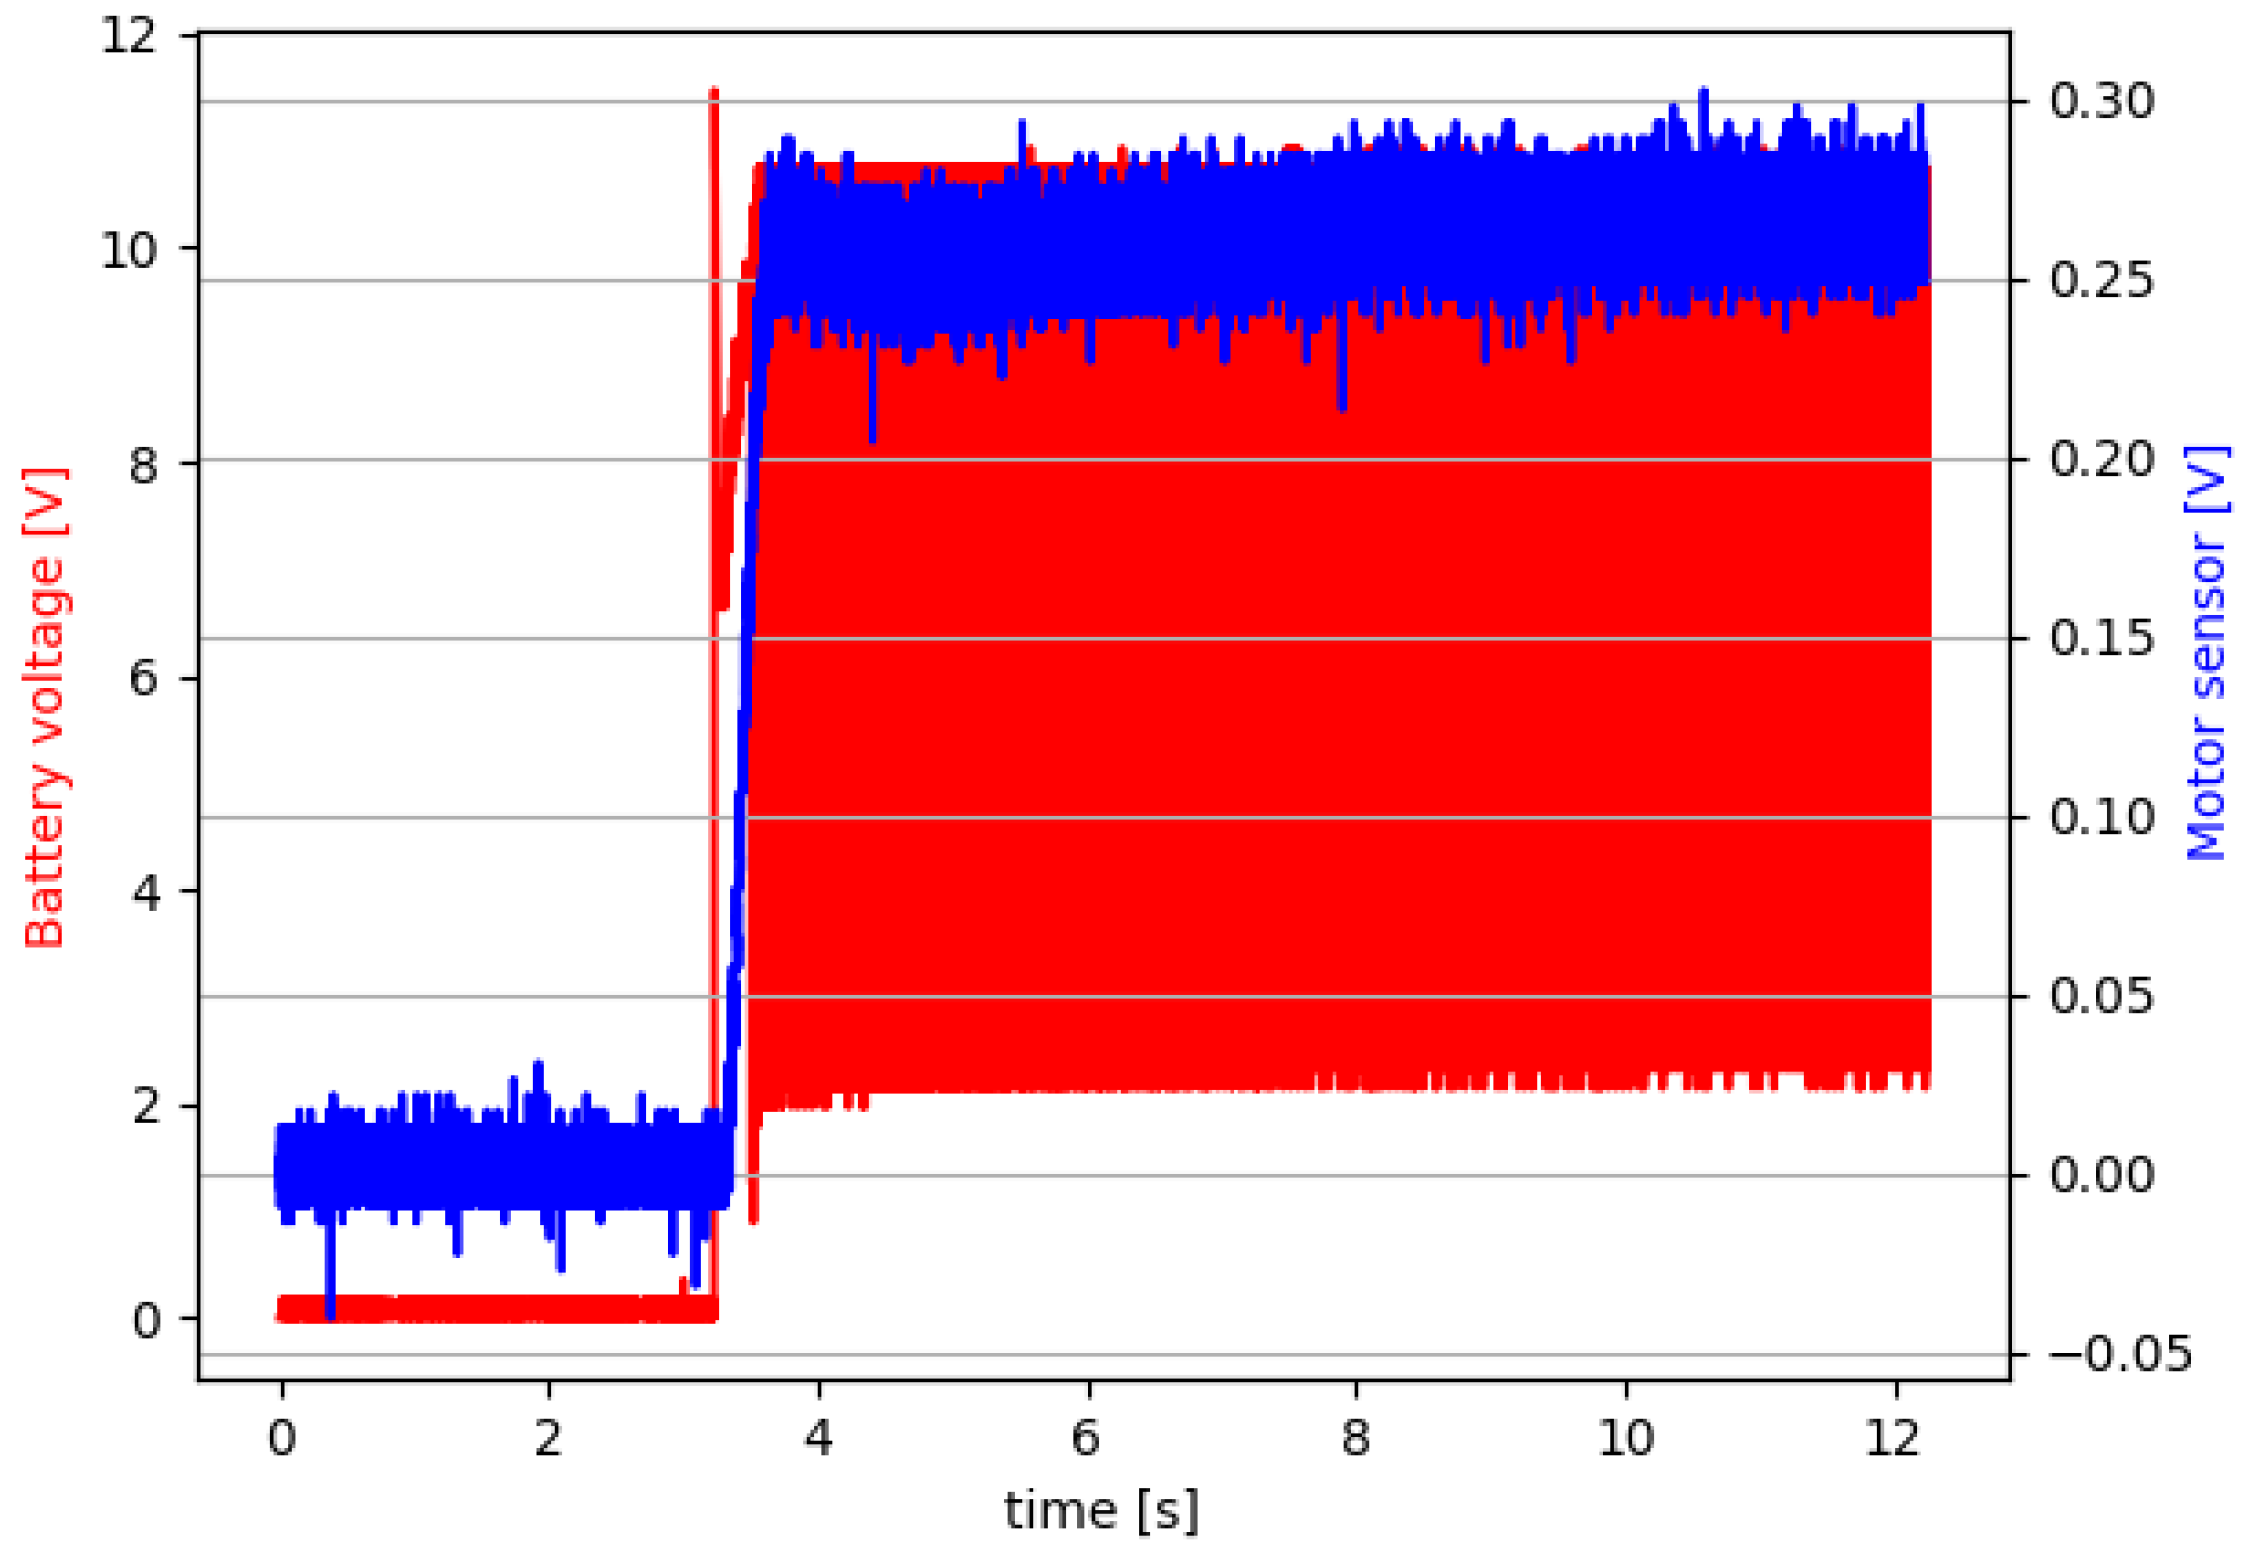
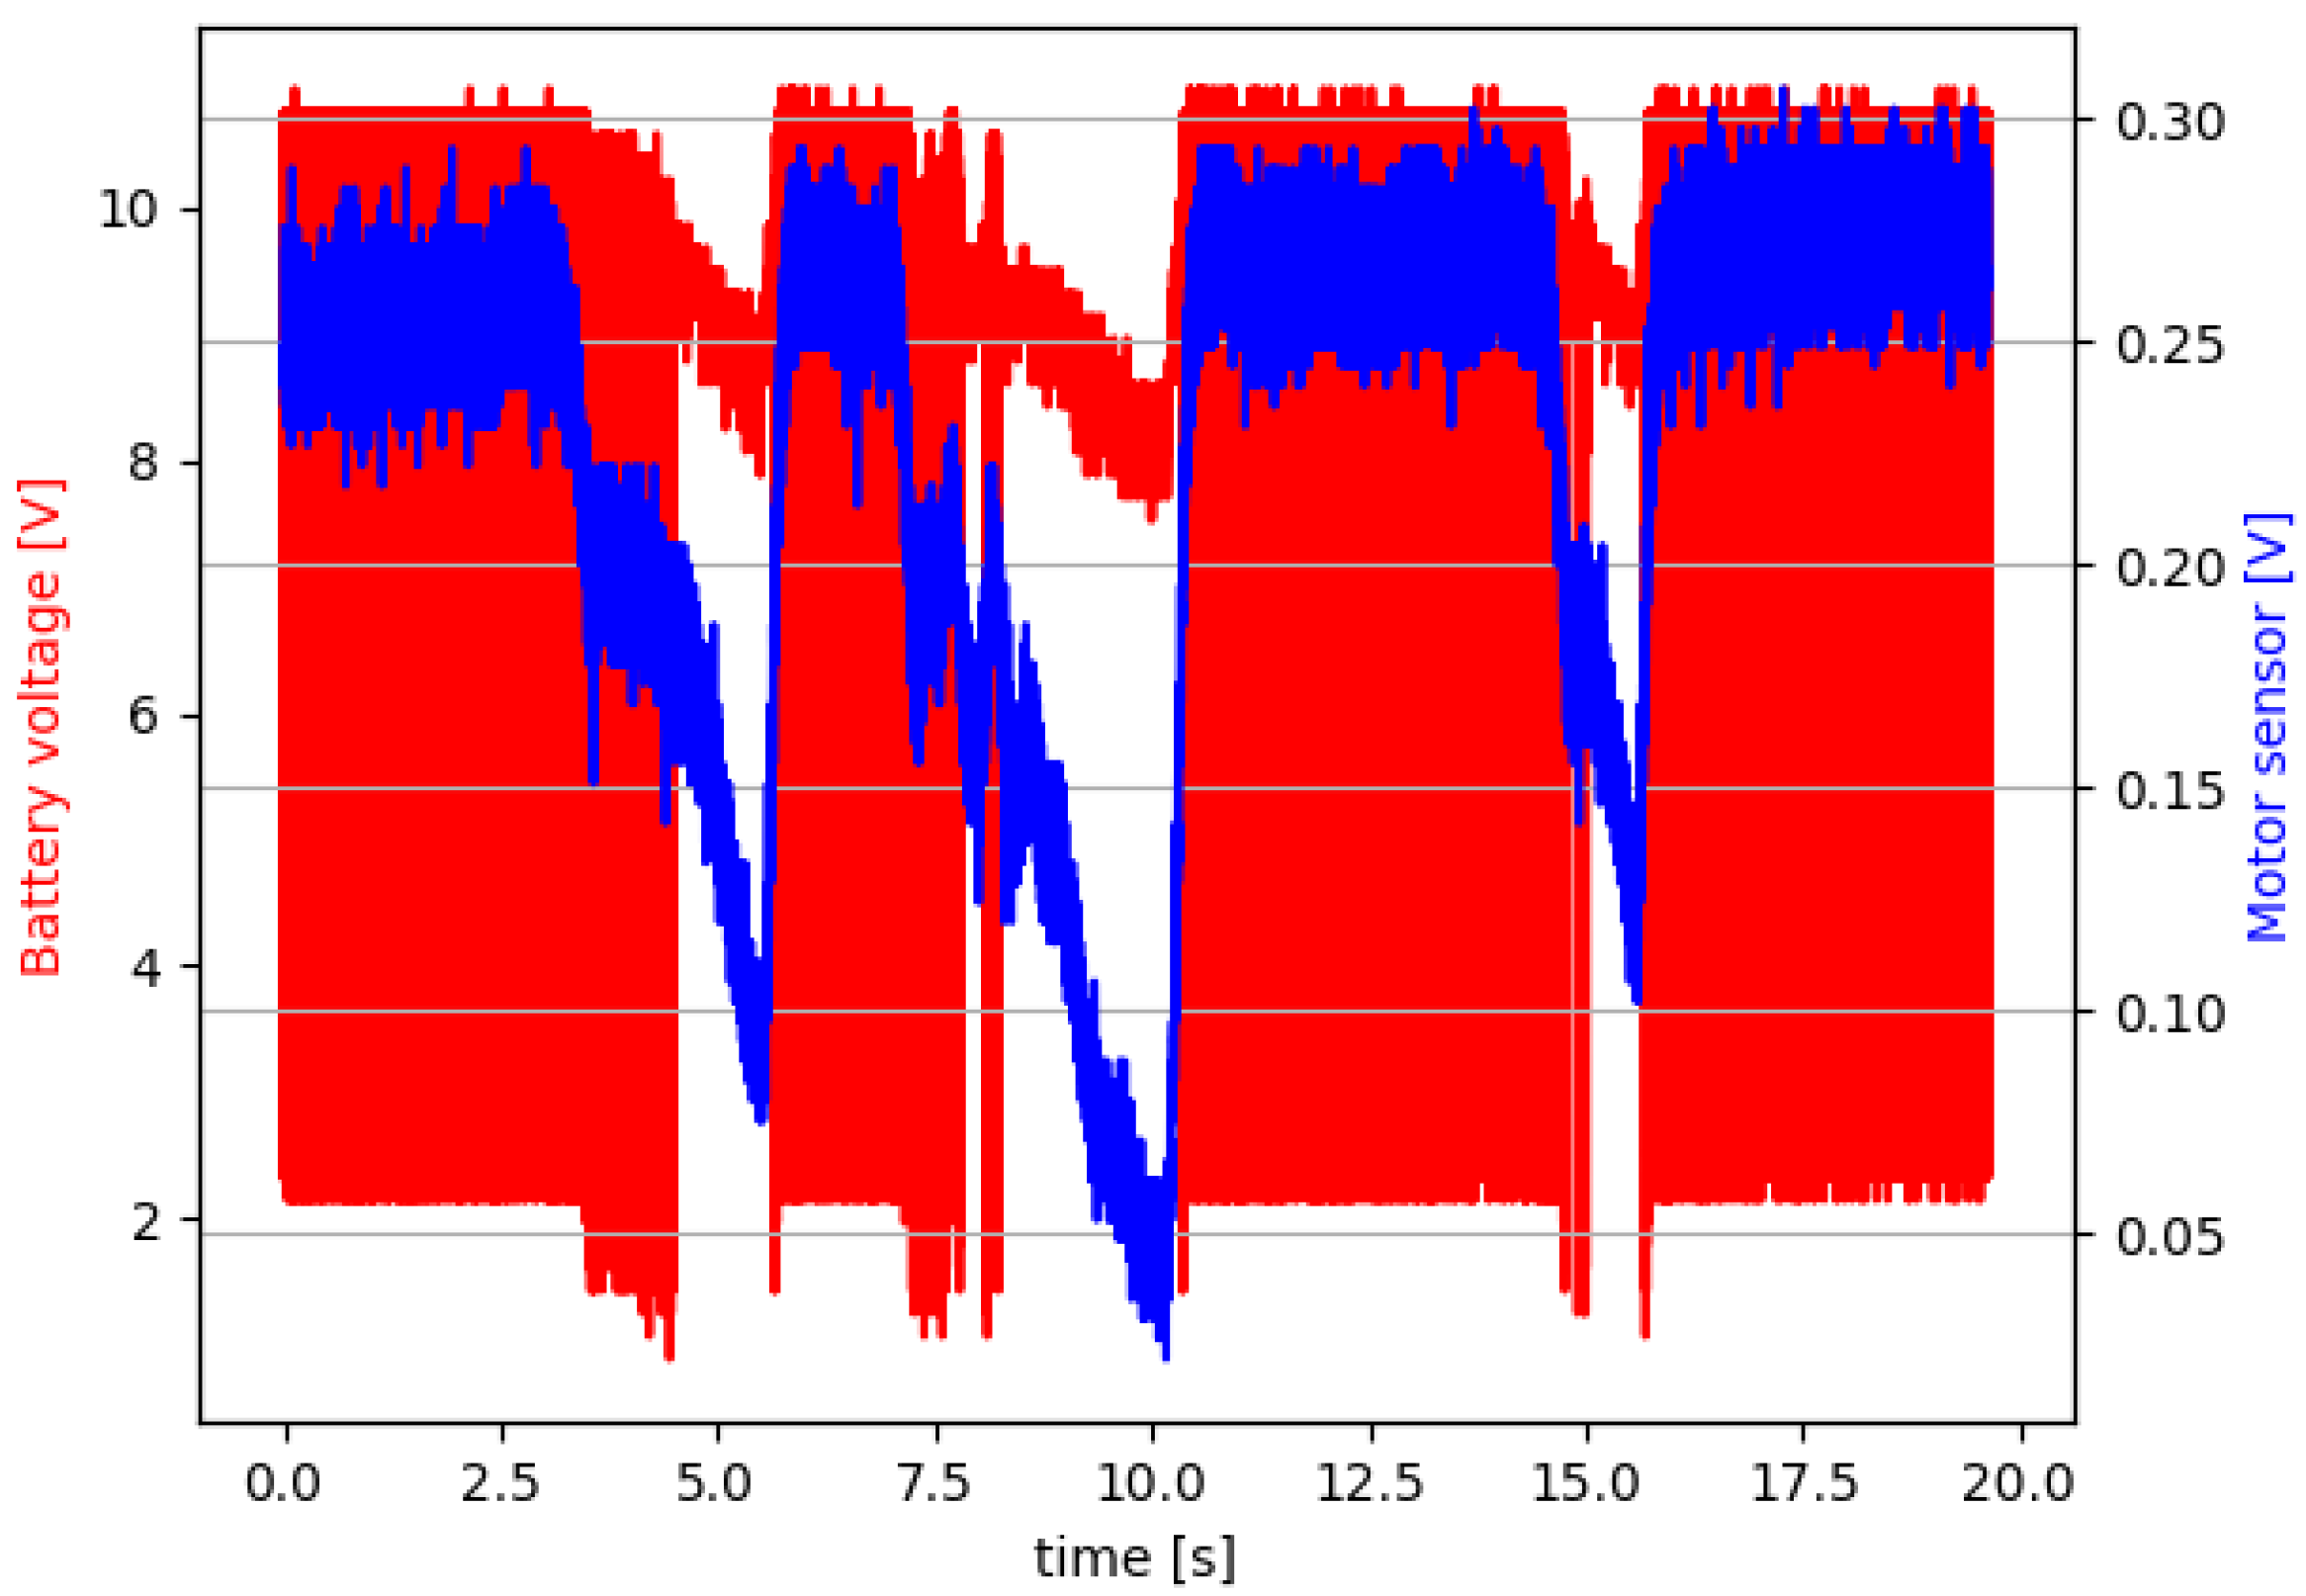
Figure 15 and Figure 16 show the experimental results for faulty case A. Similar results are obtained for faulty case B and are not presented for brevity. Comparing these figures corresponding to the healthy case (Figure 13 and Figure 14) and the figures corresponding to faulty case A (Figure 15 and Figure 16), differences can indeed be observed. The next section analyzes the corresponding data to reveal the differences between healthy and defective cases.
The following items can be used to improve the technical quality of our experimental platform:
- The motor speed sensor can be improved by using encoders or potentiometers. These sensors are more accurate in measuring the motor speed.
- NPN power transistors can be replaced by their equivalent MOSFET parts. These are more applicable from a power electronics point of view.
- Change the circuit into a printed circuit.
7. Battery Diagnoses System Design
Fault detection in electric vehicle battery systems is essential for safe driving and extending the battery life. Battery failure has traditionally been a significant safety concern for electric vehicles, and early failure diagnosis can be approached from different methodologies, e.g., Bayesian optimization [15], statistical analysis [41,42,43], and neural networks [44,45], among others. To achieve early and accurate detection of battery system failures for rapid early warnings, this paper proposes a very simple method based only on a classical analysis of normalized data. To compare the previous experimental data, it is necessary to work with normalized experimental data. The “relative value” of the battery voltage with respect to the sensor information is then calculated:
where is the voltage of the n-experiment battery and is that of the sensor. This simplifies the analysis by reducing the number of variables from two to one. This new variable is also more intuitive, as it is calculated on the basis of the sensor voltage signal, which is in principle independent of battery failure.
A statistical analysis of this was then carried out. The initial results showed some atypical values that made it difficult to interpret the graphs and the obtained overview of the statistical indicators. However, before removing these outliers, they were analyzed to see if their existence could help us to understand the dynamic behavior of the battery. As these outliers are of a relatively high magnitude, we first investigated whether these data could be considered extreme data to fit a Pareto distribution. The results did not discriminate between healthy and faulty cases.
In addition, the proportion of these outliers did not allow us to distinguish between healthy and faulty cases. Therefore, it was decided to remove them in order to facilitate the interpretation of the results. Therefore, the removal of outliers can be considered as a preprocessing stage.
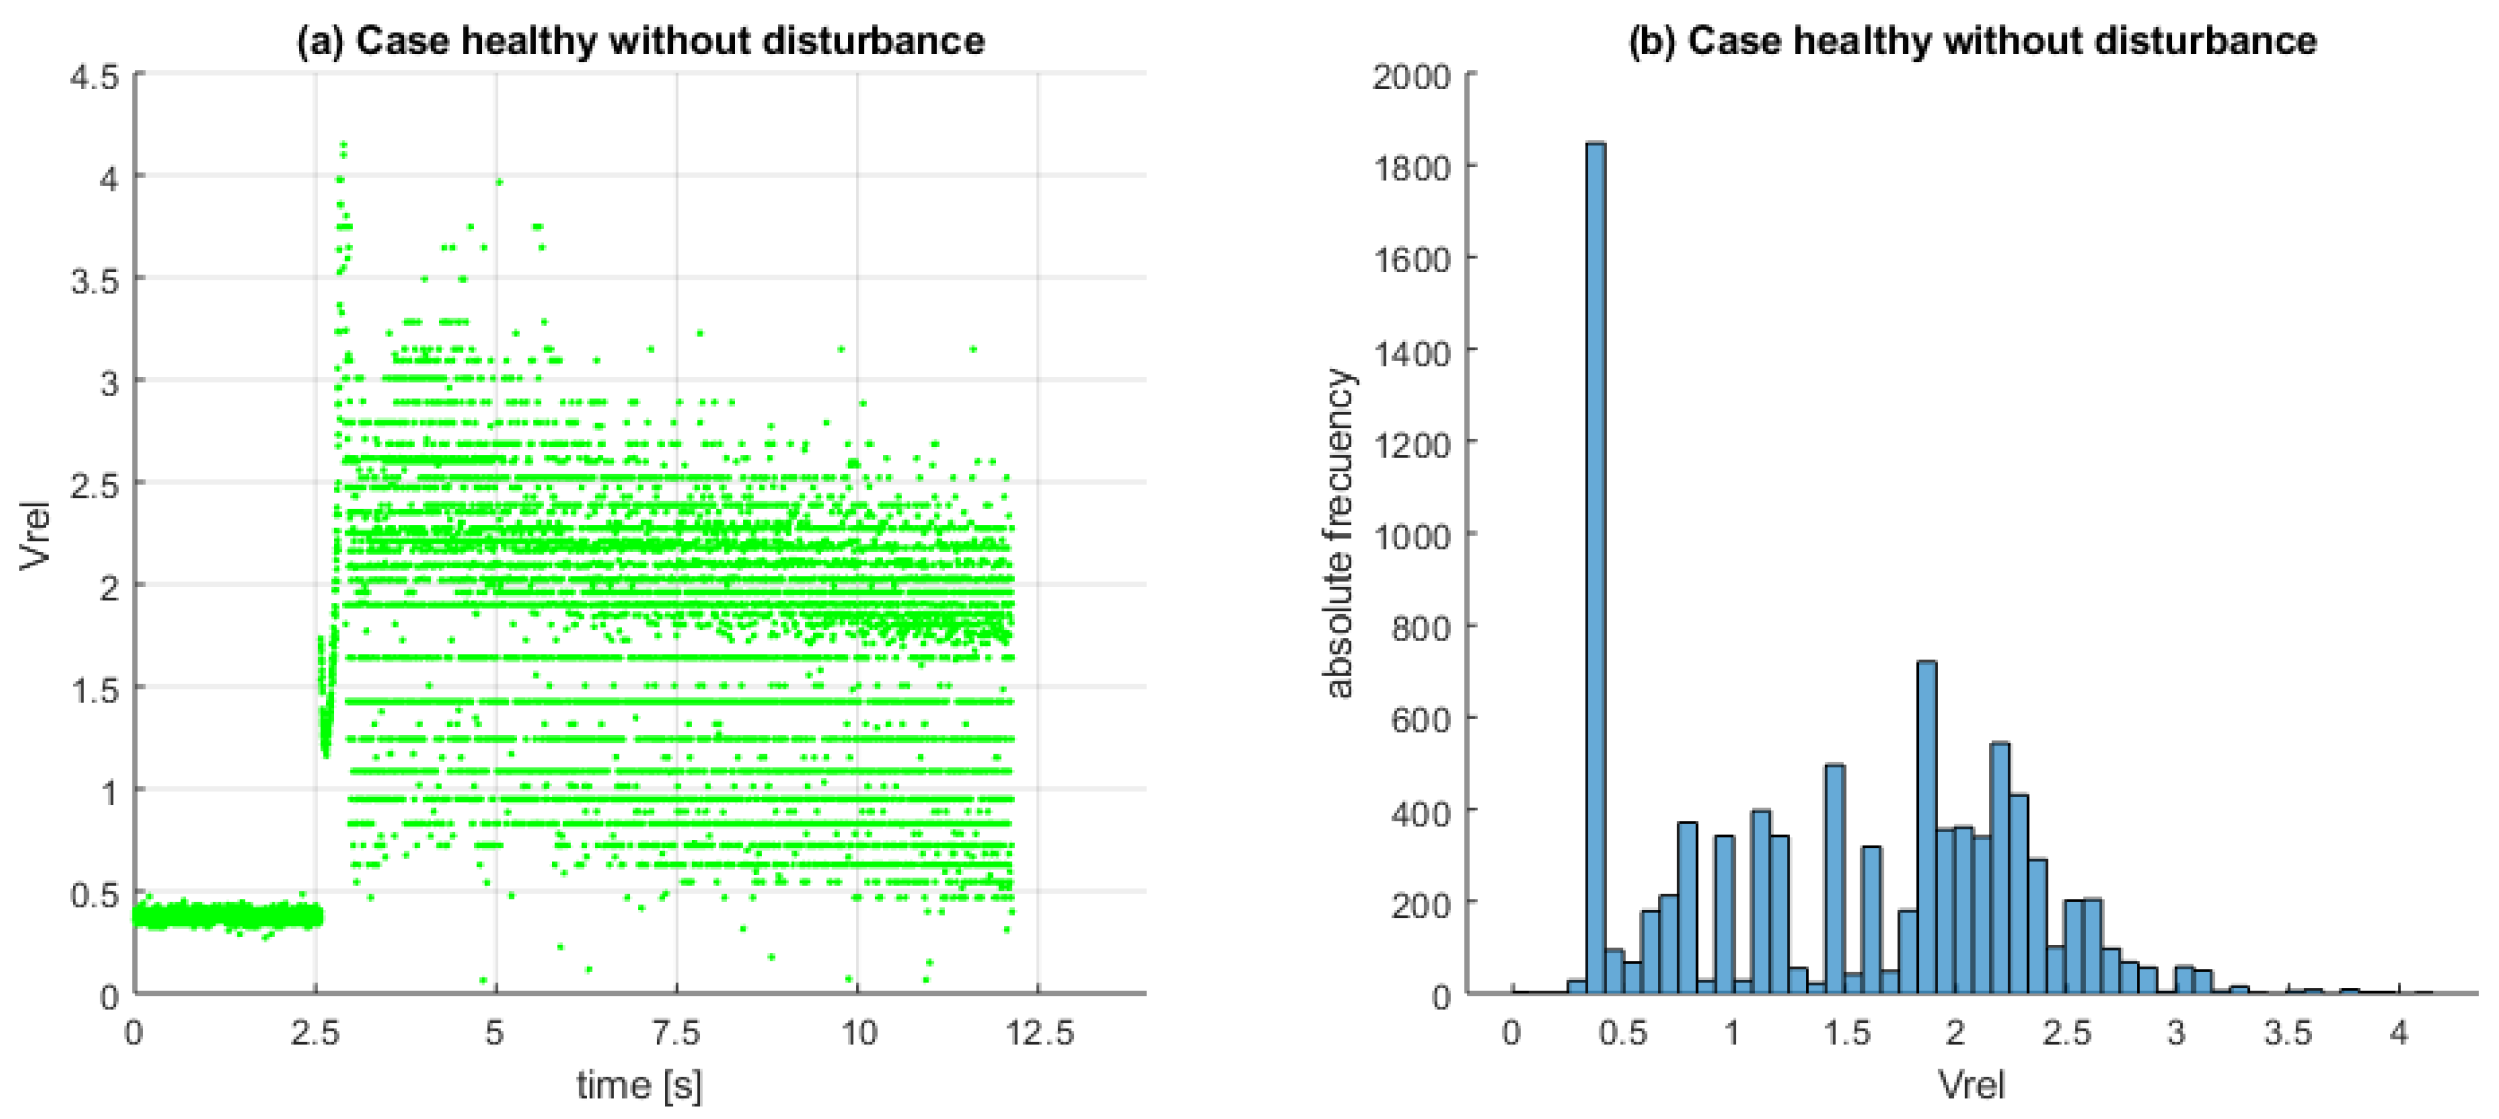
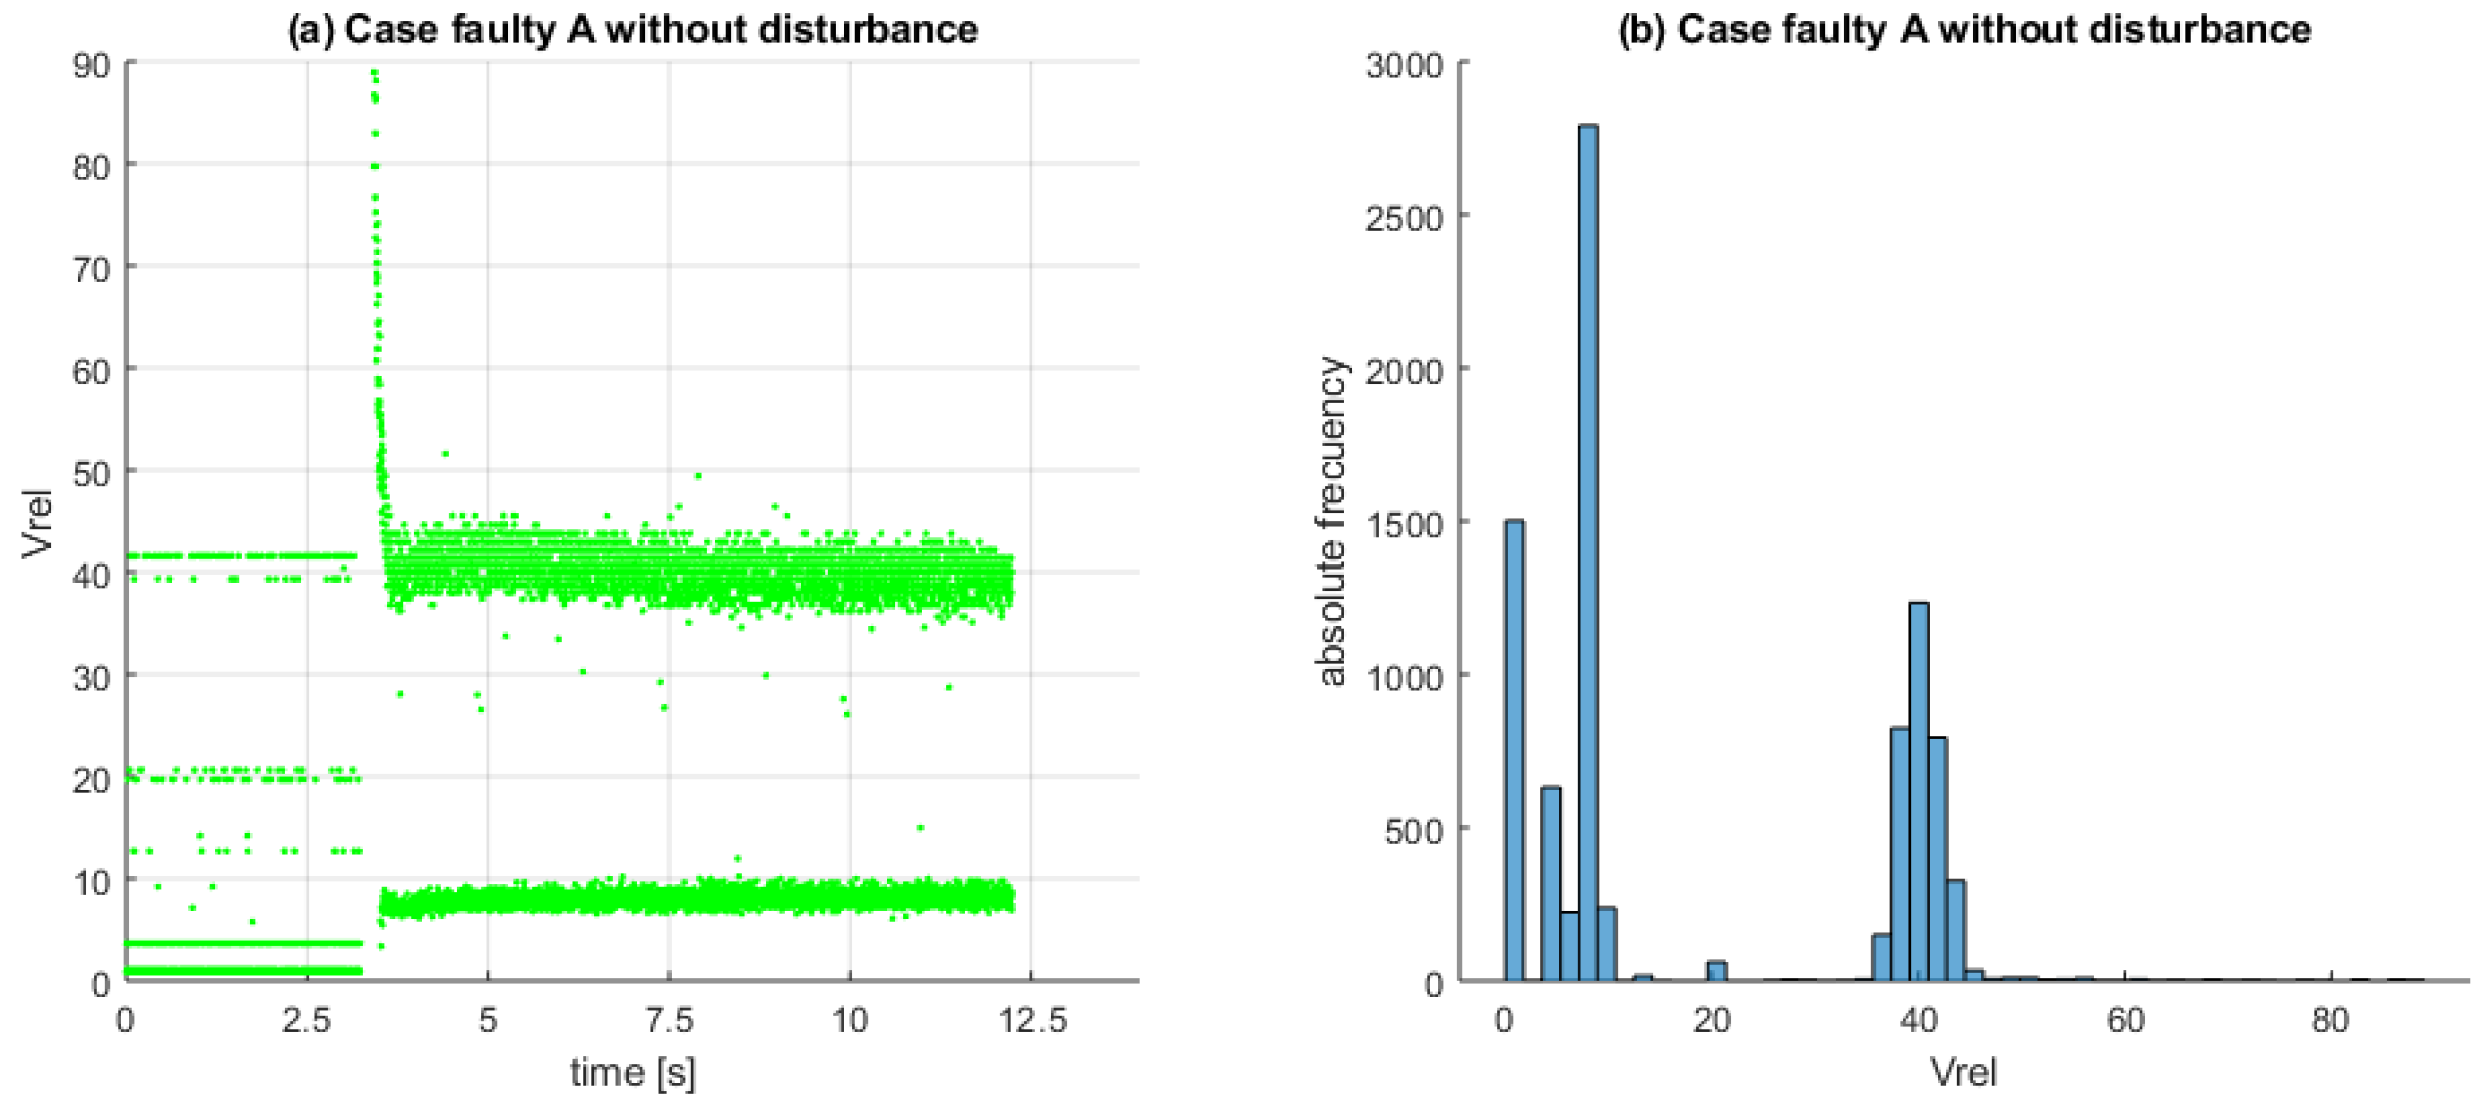
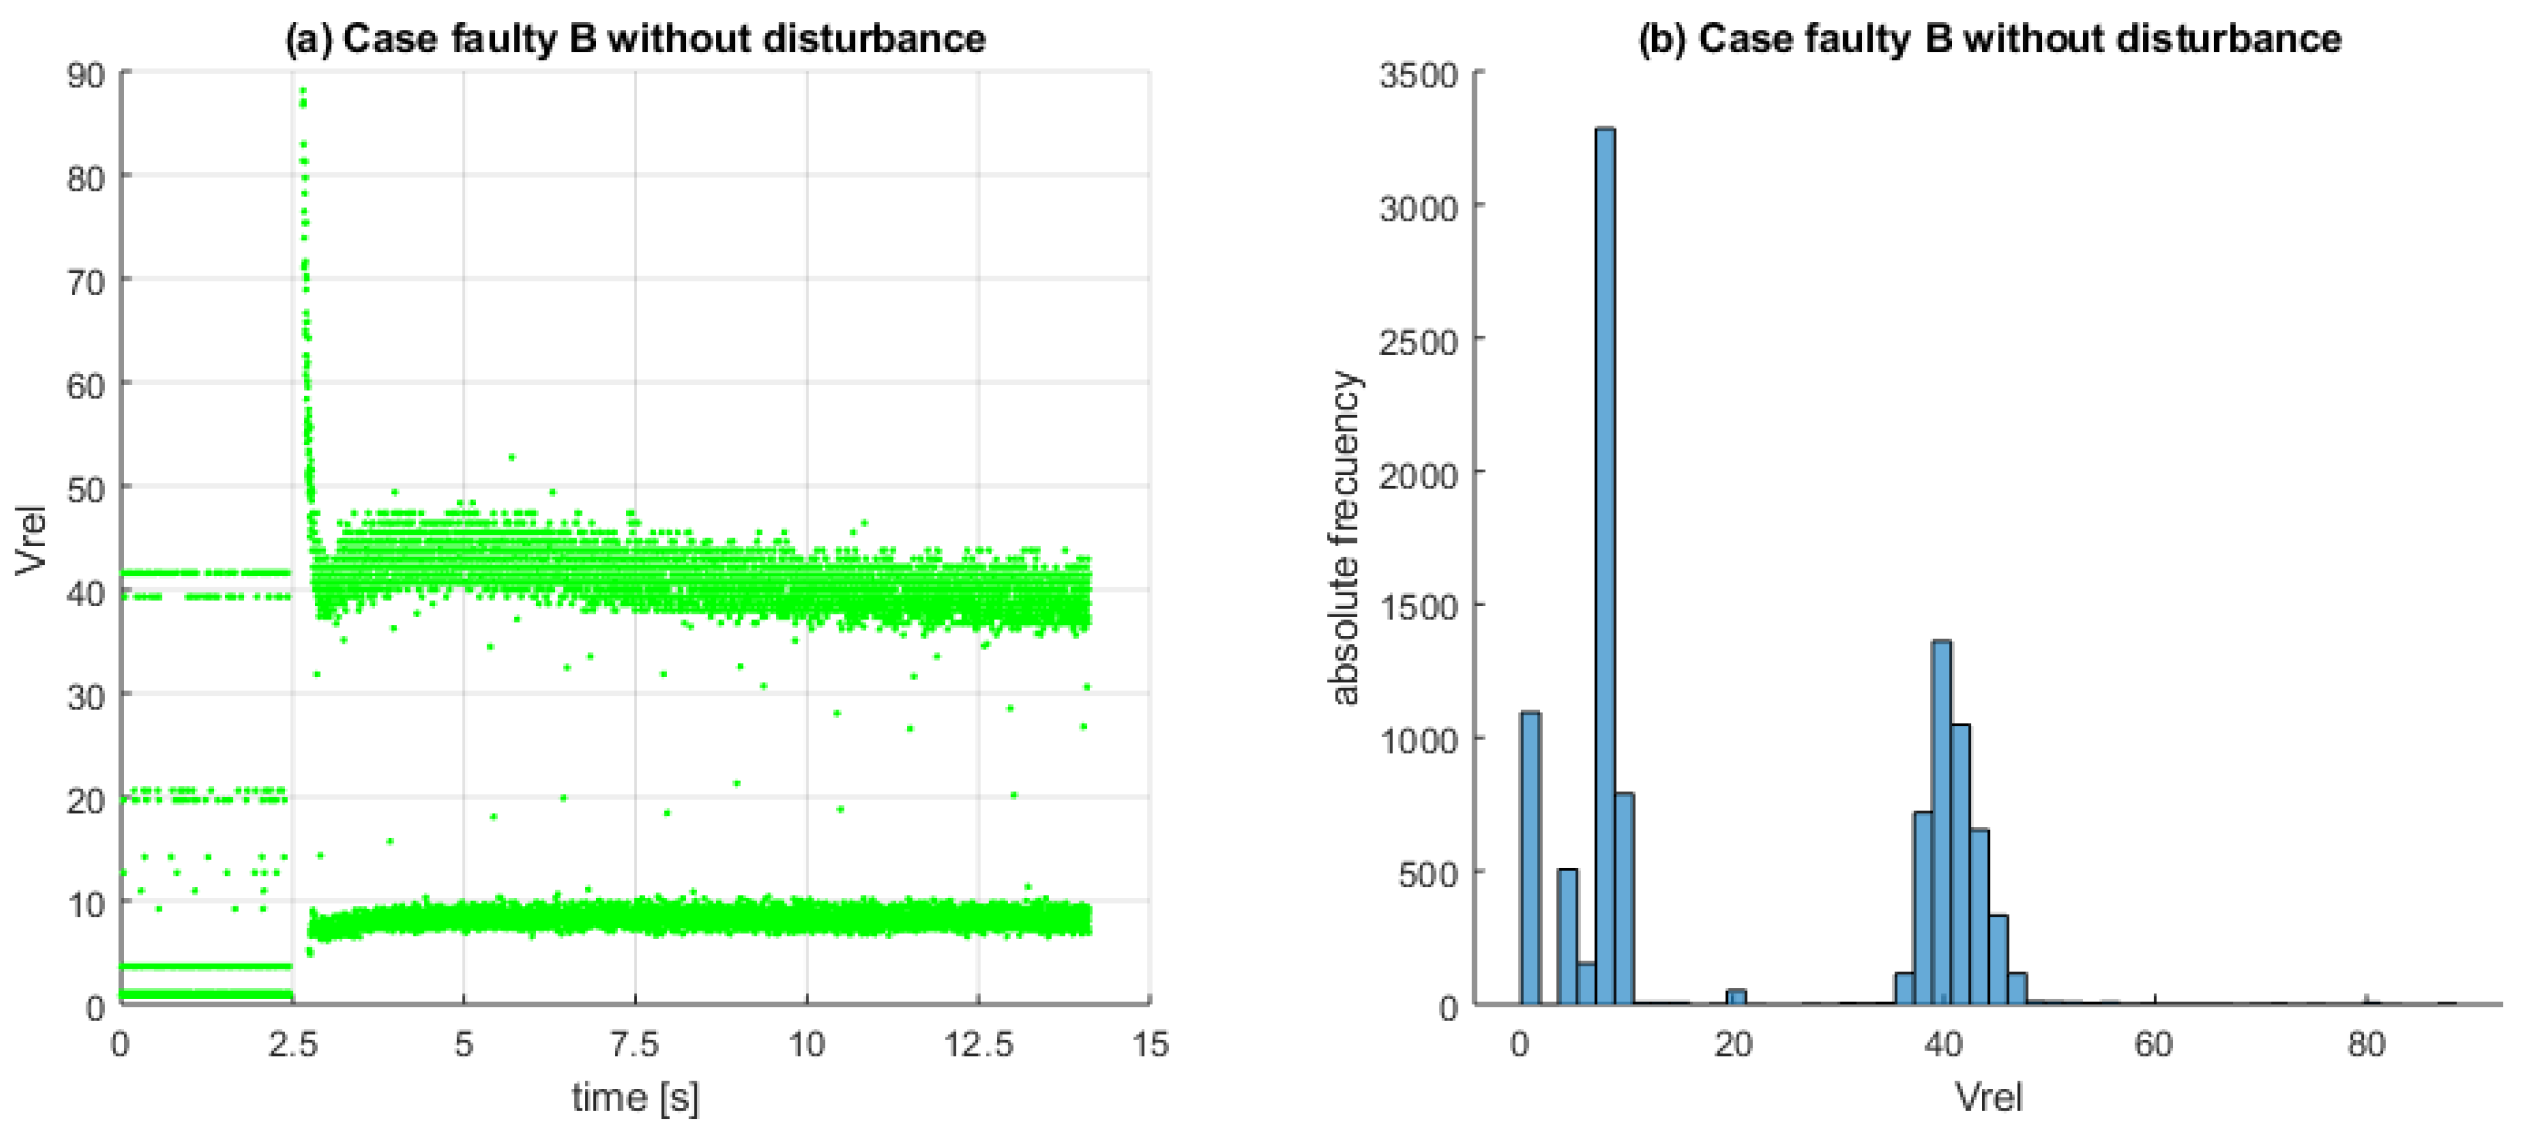
Figure 17, Figure 18, Figure 19, Figure 20, Figure 21 and Figure 22 show the experimental results after the preprocessing tasks with different approaches. The scatter plot and the histogram allow us to discuss the behavior in all cases. In Figure 17, corresponding to the healthy case without disturbances, it can be observed that the values of are distributed between approximately 0.5 and 4 with significant variability. In faulty case A without disturbances, Figure 19 shows that the importance of is concentrated in two bands. One band is centered at 6 (the lower band with fewer observations) and the other at 40 (the upper band). In both regions, the points are significantly clustered and show much less variation than in the healthy case. Similar results are obtained for faulty case B without disturbances (see Figure 21).
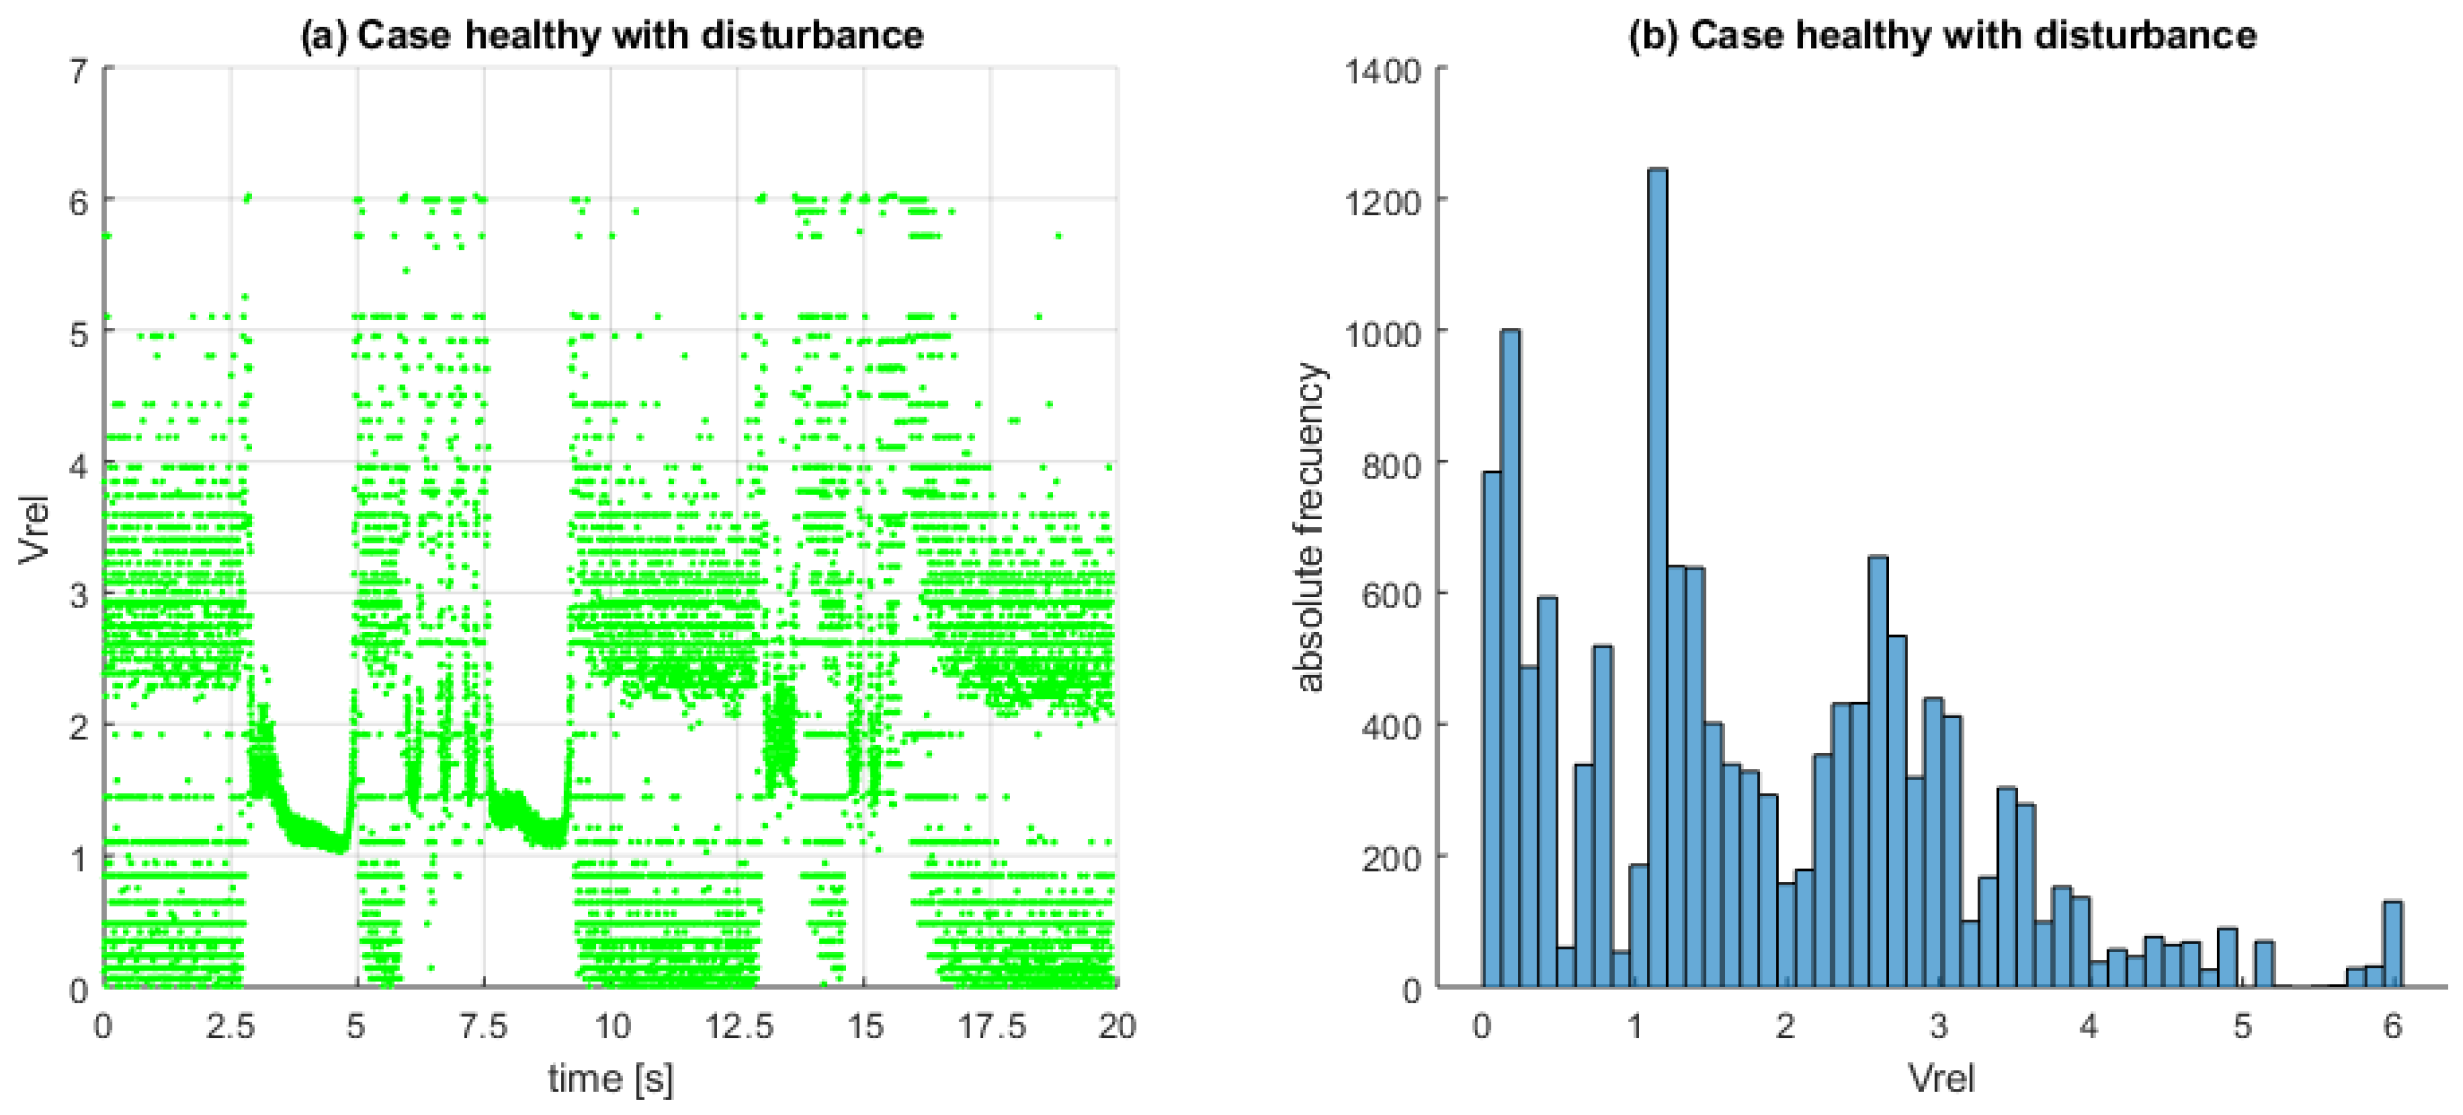
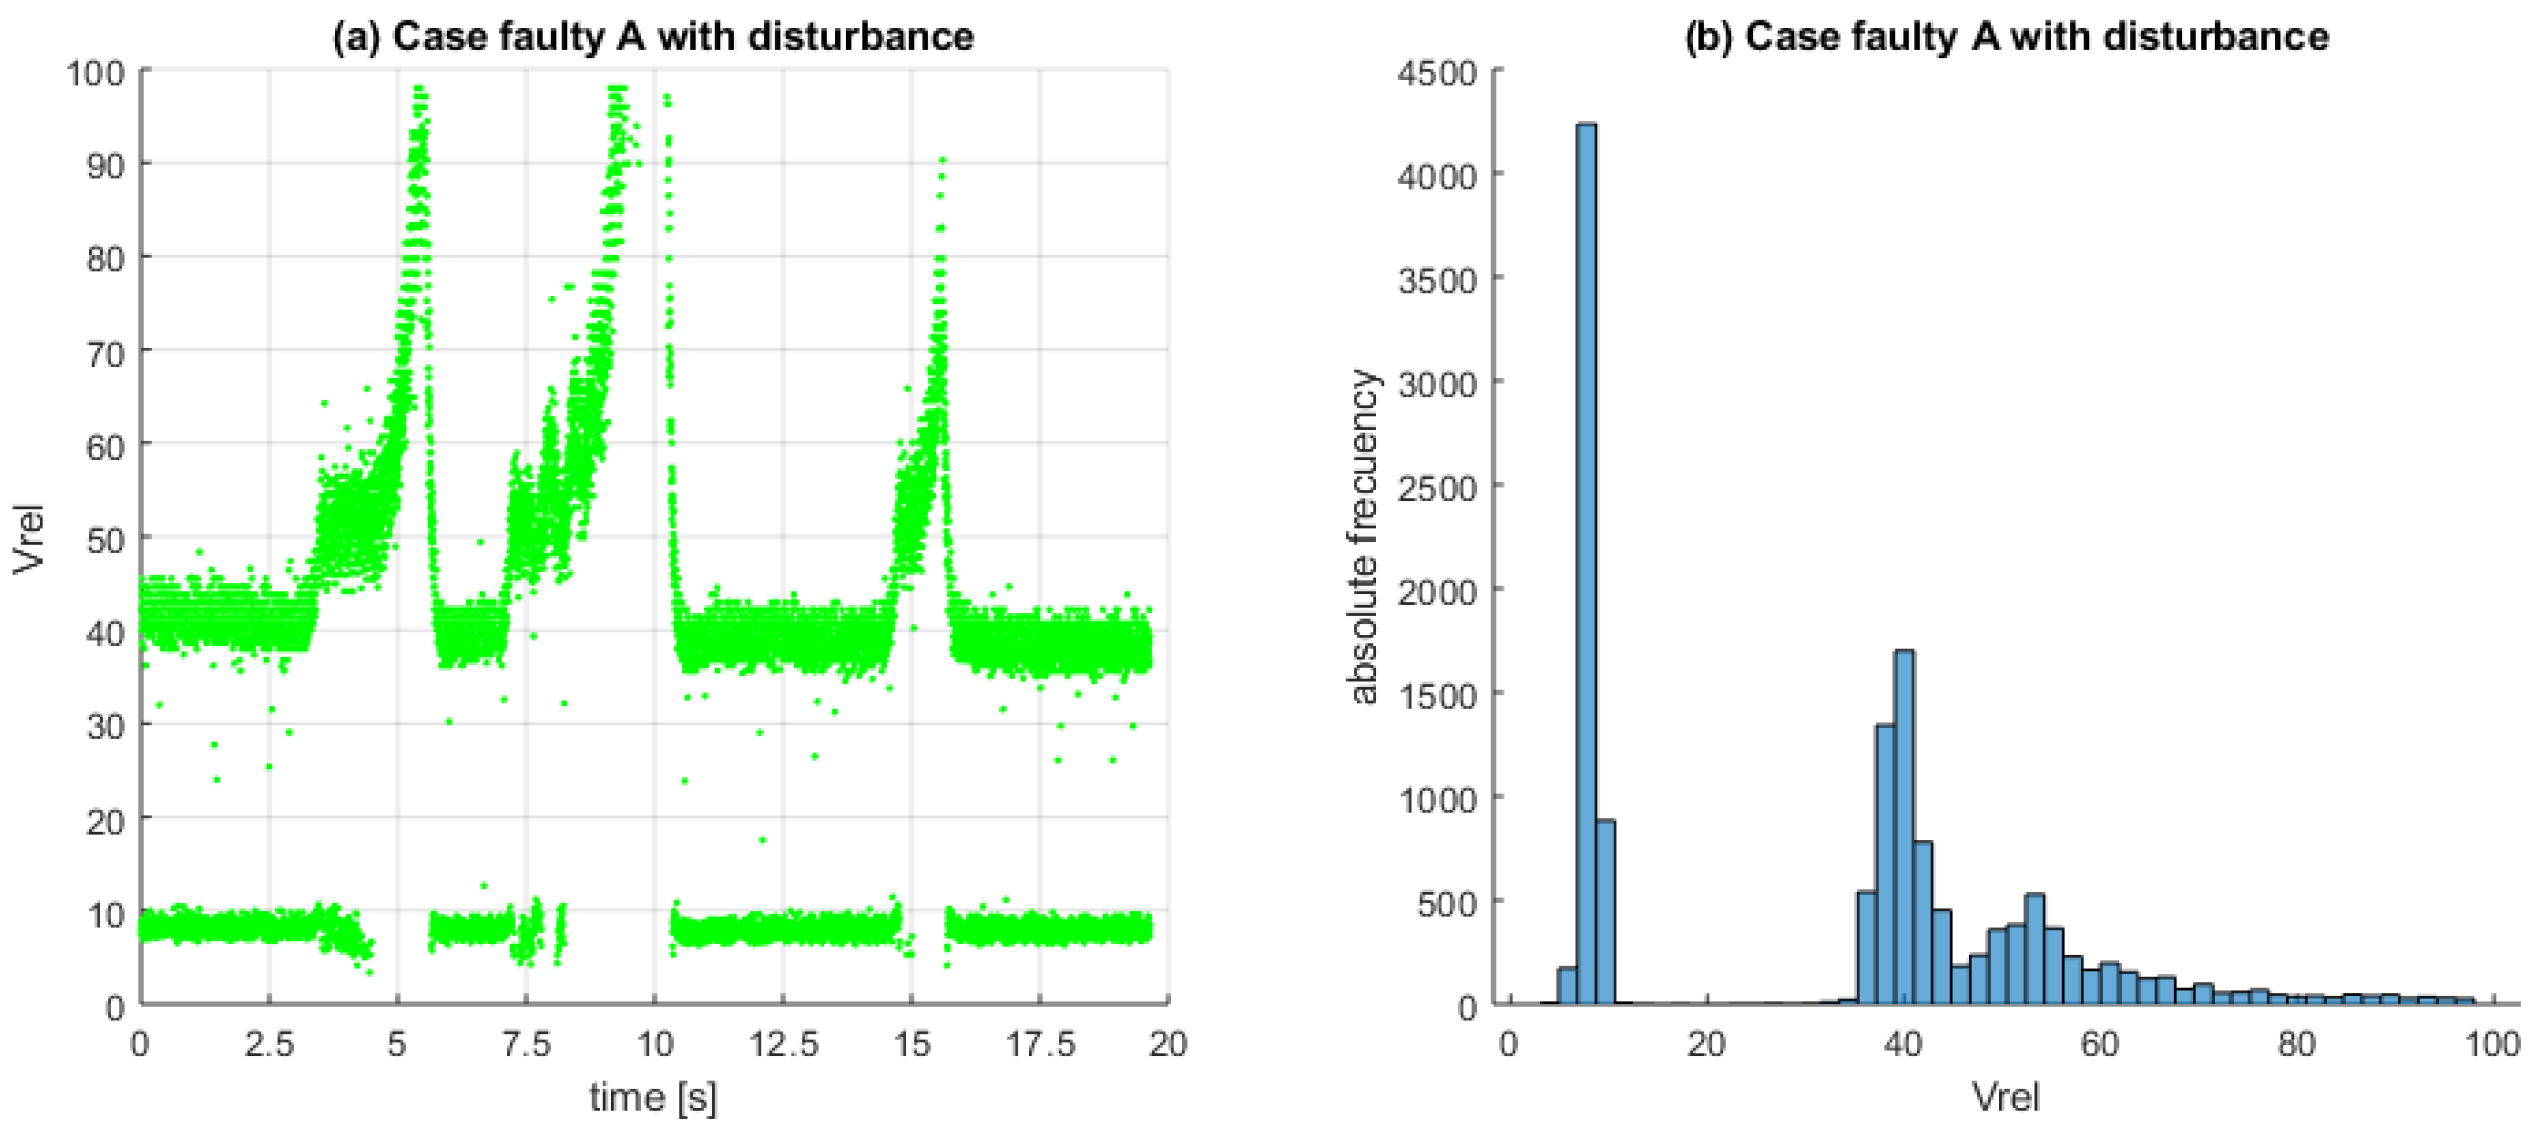
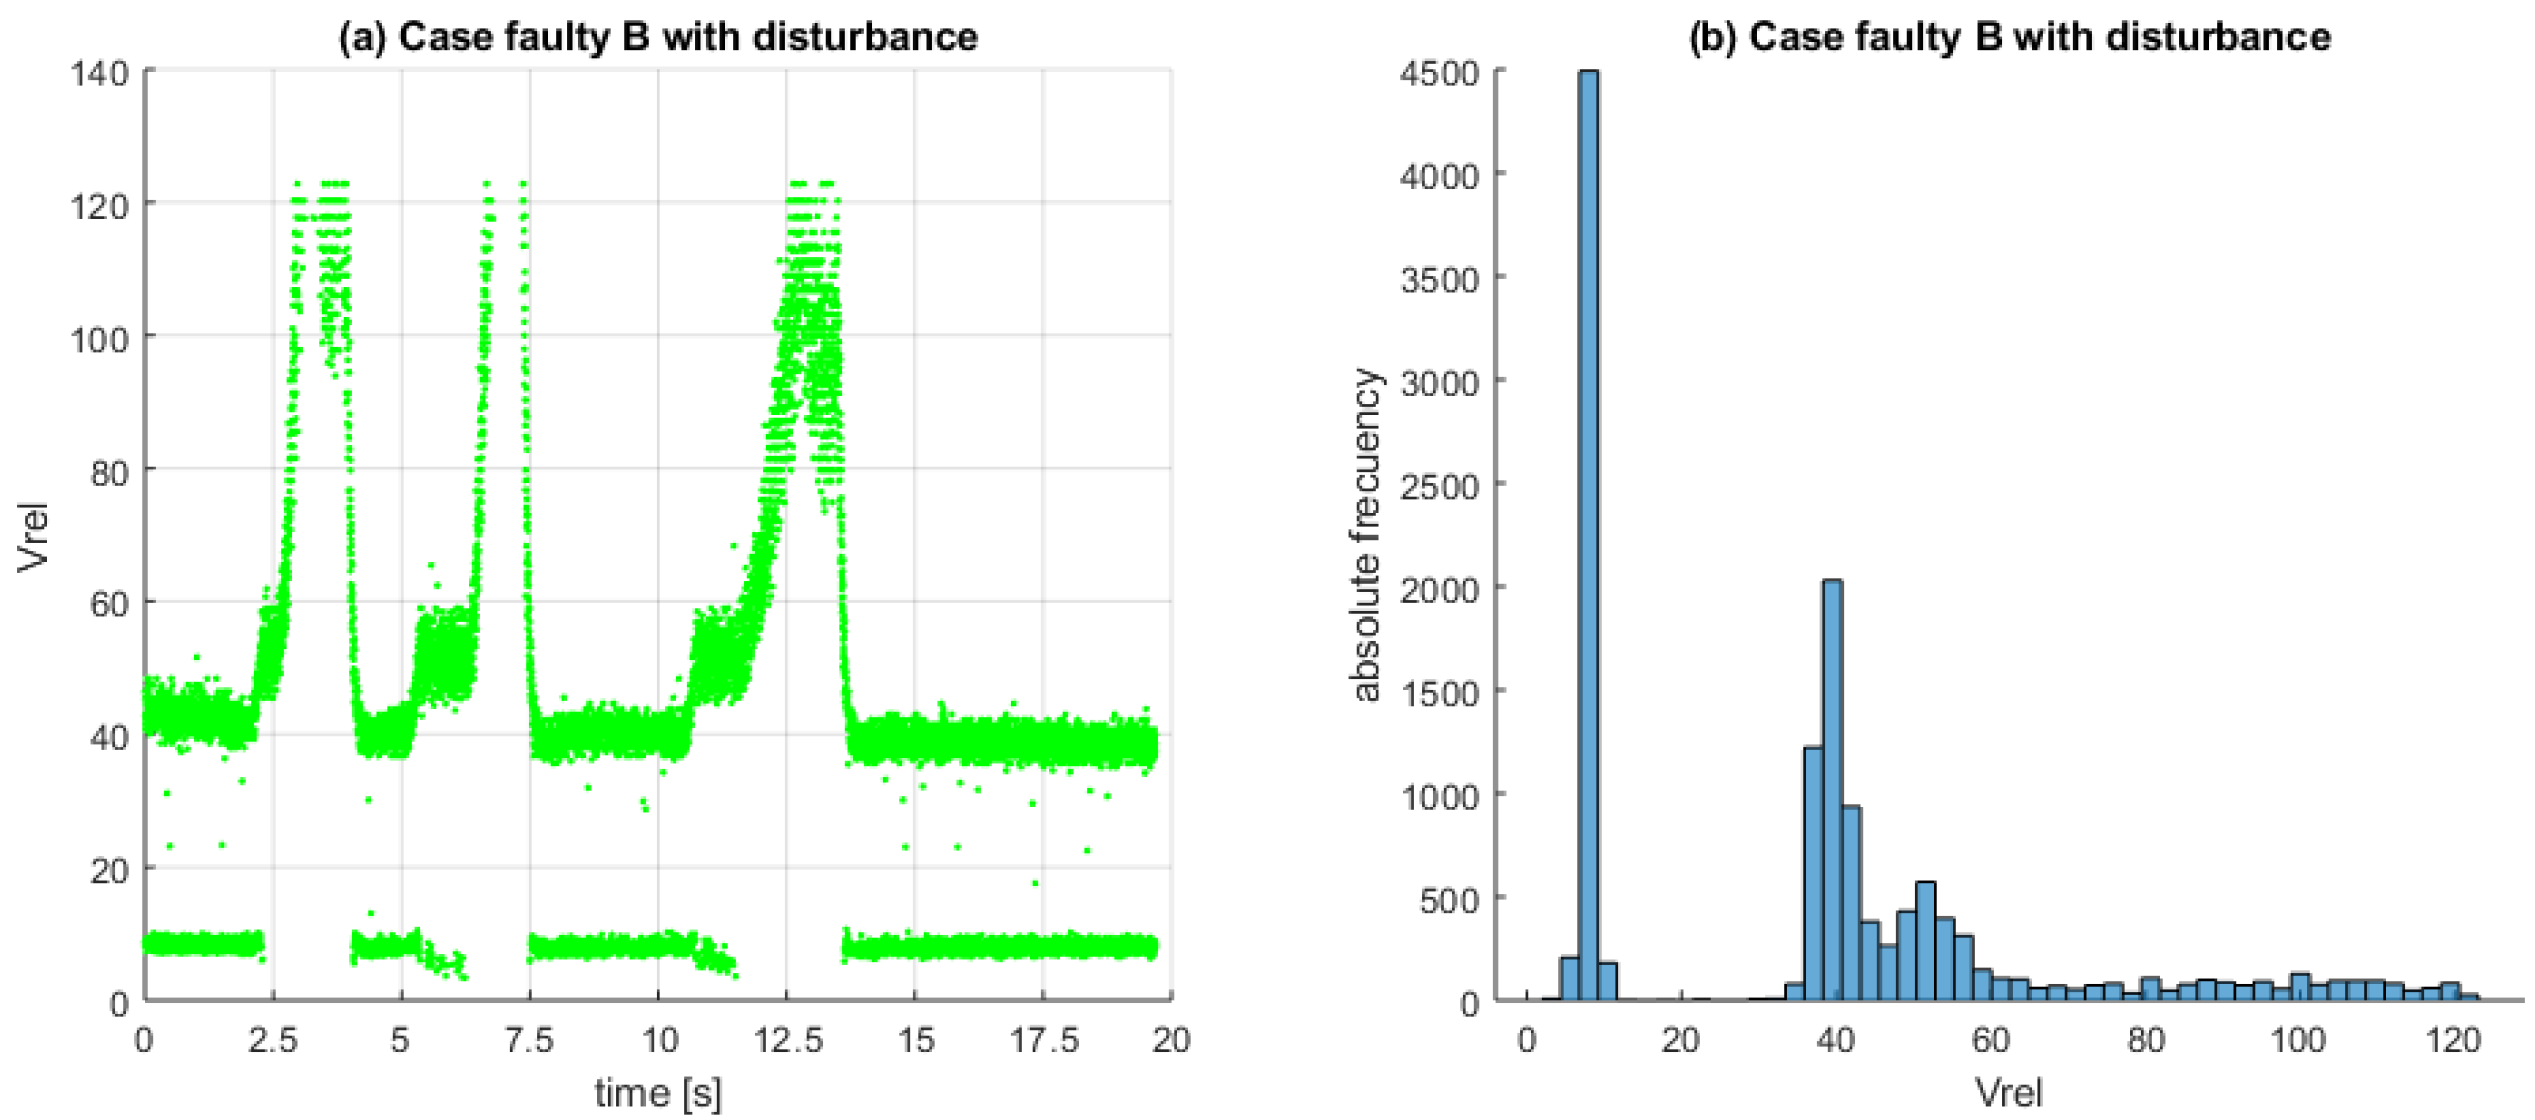
Figure 18 shows that in the healthy case with disturbances, the values are distributed approximately between the values 0 and 6, which again shows a large variability. This variability is minimal during the time intervals with disturbances, where the variation is significantly reduced. In comparison with Figure 20, we can see that the values are again highly concentrated in a lower band centered around 6 and an upper band centered around 40. In this case, in the time intervals with disturbances, the values show more significant variability, returning to the upper range when the disturbances cease. As before, in faulty case B with disturbances, Figure 22 shows similar results as in case A.
For example, in faulty cases A and B, both in the disturbed and undisturbed cases, the values are generally higher than the corresponding values in the healthy cases. They also show less variability. In general, the data distributions in the healthy and faulty cases show different behavior. Moreover, this fact allows us to consider the variable as a good indicator for diagnosing the battery status. Thus, from what has been presented so far, our objective of using a statistical tool that allows the diagnosis of failures in our system has been fully achieved. From here, a comparative study using other statistical methods, such as Bayesian optimization and neural networks, is left for future work.
In summary, and based on the experimental results, our control strategy was able to generate reliable data for the health monitoring phase. In other words, because of the efficiency of the controller and the electronic design, the data generated were sufficiently reliable that we were able to perform fault diagnosis with standard statistics. We think this is an important point. Furthermore, the technology used for this is simple and cheap. All the electronic components of our experimental platform are accessible almost anywhere in the world. Furthermore, from an academic point of view, our design can improve the skills of future engineers regarding the subject of the article.
8. Conclusions
Dealing with fault detection in electric vehicle batteries is not an easy problem, as the extensive literature shows. In this paper, we presented a study on an experimental diagnostic system. First, we designed an emulator for an electric car battery and conceived a predictive controller to regulate the velocity of the motor that is robust to external perturbations and system faults. This control strategy is based on a reduced mathematical model of a DC motor. The advantage is its simple control algorithm, which is easy to implement on the experimental platform.
In addition, its robustness was experimentally proven, but light chattering is introduced, which could affect the behavior of the electric motor. Therefore, a new experimental platform has also been designed. In future work, the controller can be improved to reduce this effect. Once the platform was created, a modification was introduced to detect damage to the battery’s charge capacity. Then, a statistical fault diagnosis method was presented based on a study of the normalized error in voltage measurements, which allows for the discrimination of the faulty behavior of the ultra-capacitator. The experimental results prove the suitability of our approach.
Thus, we can state that the main contribution of this paper was the design of a discrete predictive controller to regulate the speed of a universal motor, and the subsequent modification of the experimental setup to emulate an electric car battery to test fault scenarios and propose an innovative statistical fault detection method.
Author Contributions
Conceptualization, P.B., J.G.-B. and L.A.; methodology, P.B., J.G.-B., L.A. and G.P.-V.; software, P.B., J.G.-B. and G.P.-V.; validation, P.B., J.G.-B., L.A. and G.P.-V.; formal analysis, P.B., J.G.-B. and L.A.; investigation, P.B., J.G.-B. and G.P.-V.; resources, L.A.; data curation, P.B., J.G.-B. and G.P.-V.; writing—original draft preparation, P.B., J.G.-B., L.A. and G.P.-V.; writing—review and editing, P.B., J.G.-B., L.A. and G.P.-V.; visualization, P.B., J.G.-B., L.A. and G.P.-V.; supervision, P.B., J.G.-B., L.A. and G.P.-V. All authors have read and agreed to the published version of the manuscript.
Funding
This research received no external funding.
Data Availability Statement
Data supporting the reported results can be provided by the authors upon reasonable request.
Conflicts of Interest
The authors declare no conflict of interest.
Abbreviations
The following abbreviations are used in this manuscript:
| AC | Alternating Current |
| DC | Direct Current |
| PID | Proportional Integral Derivative |
Appendix A
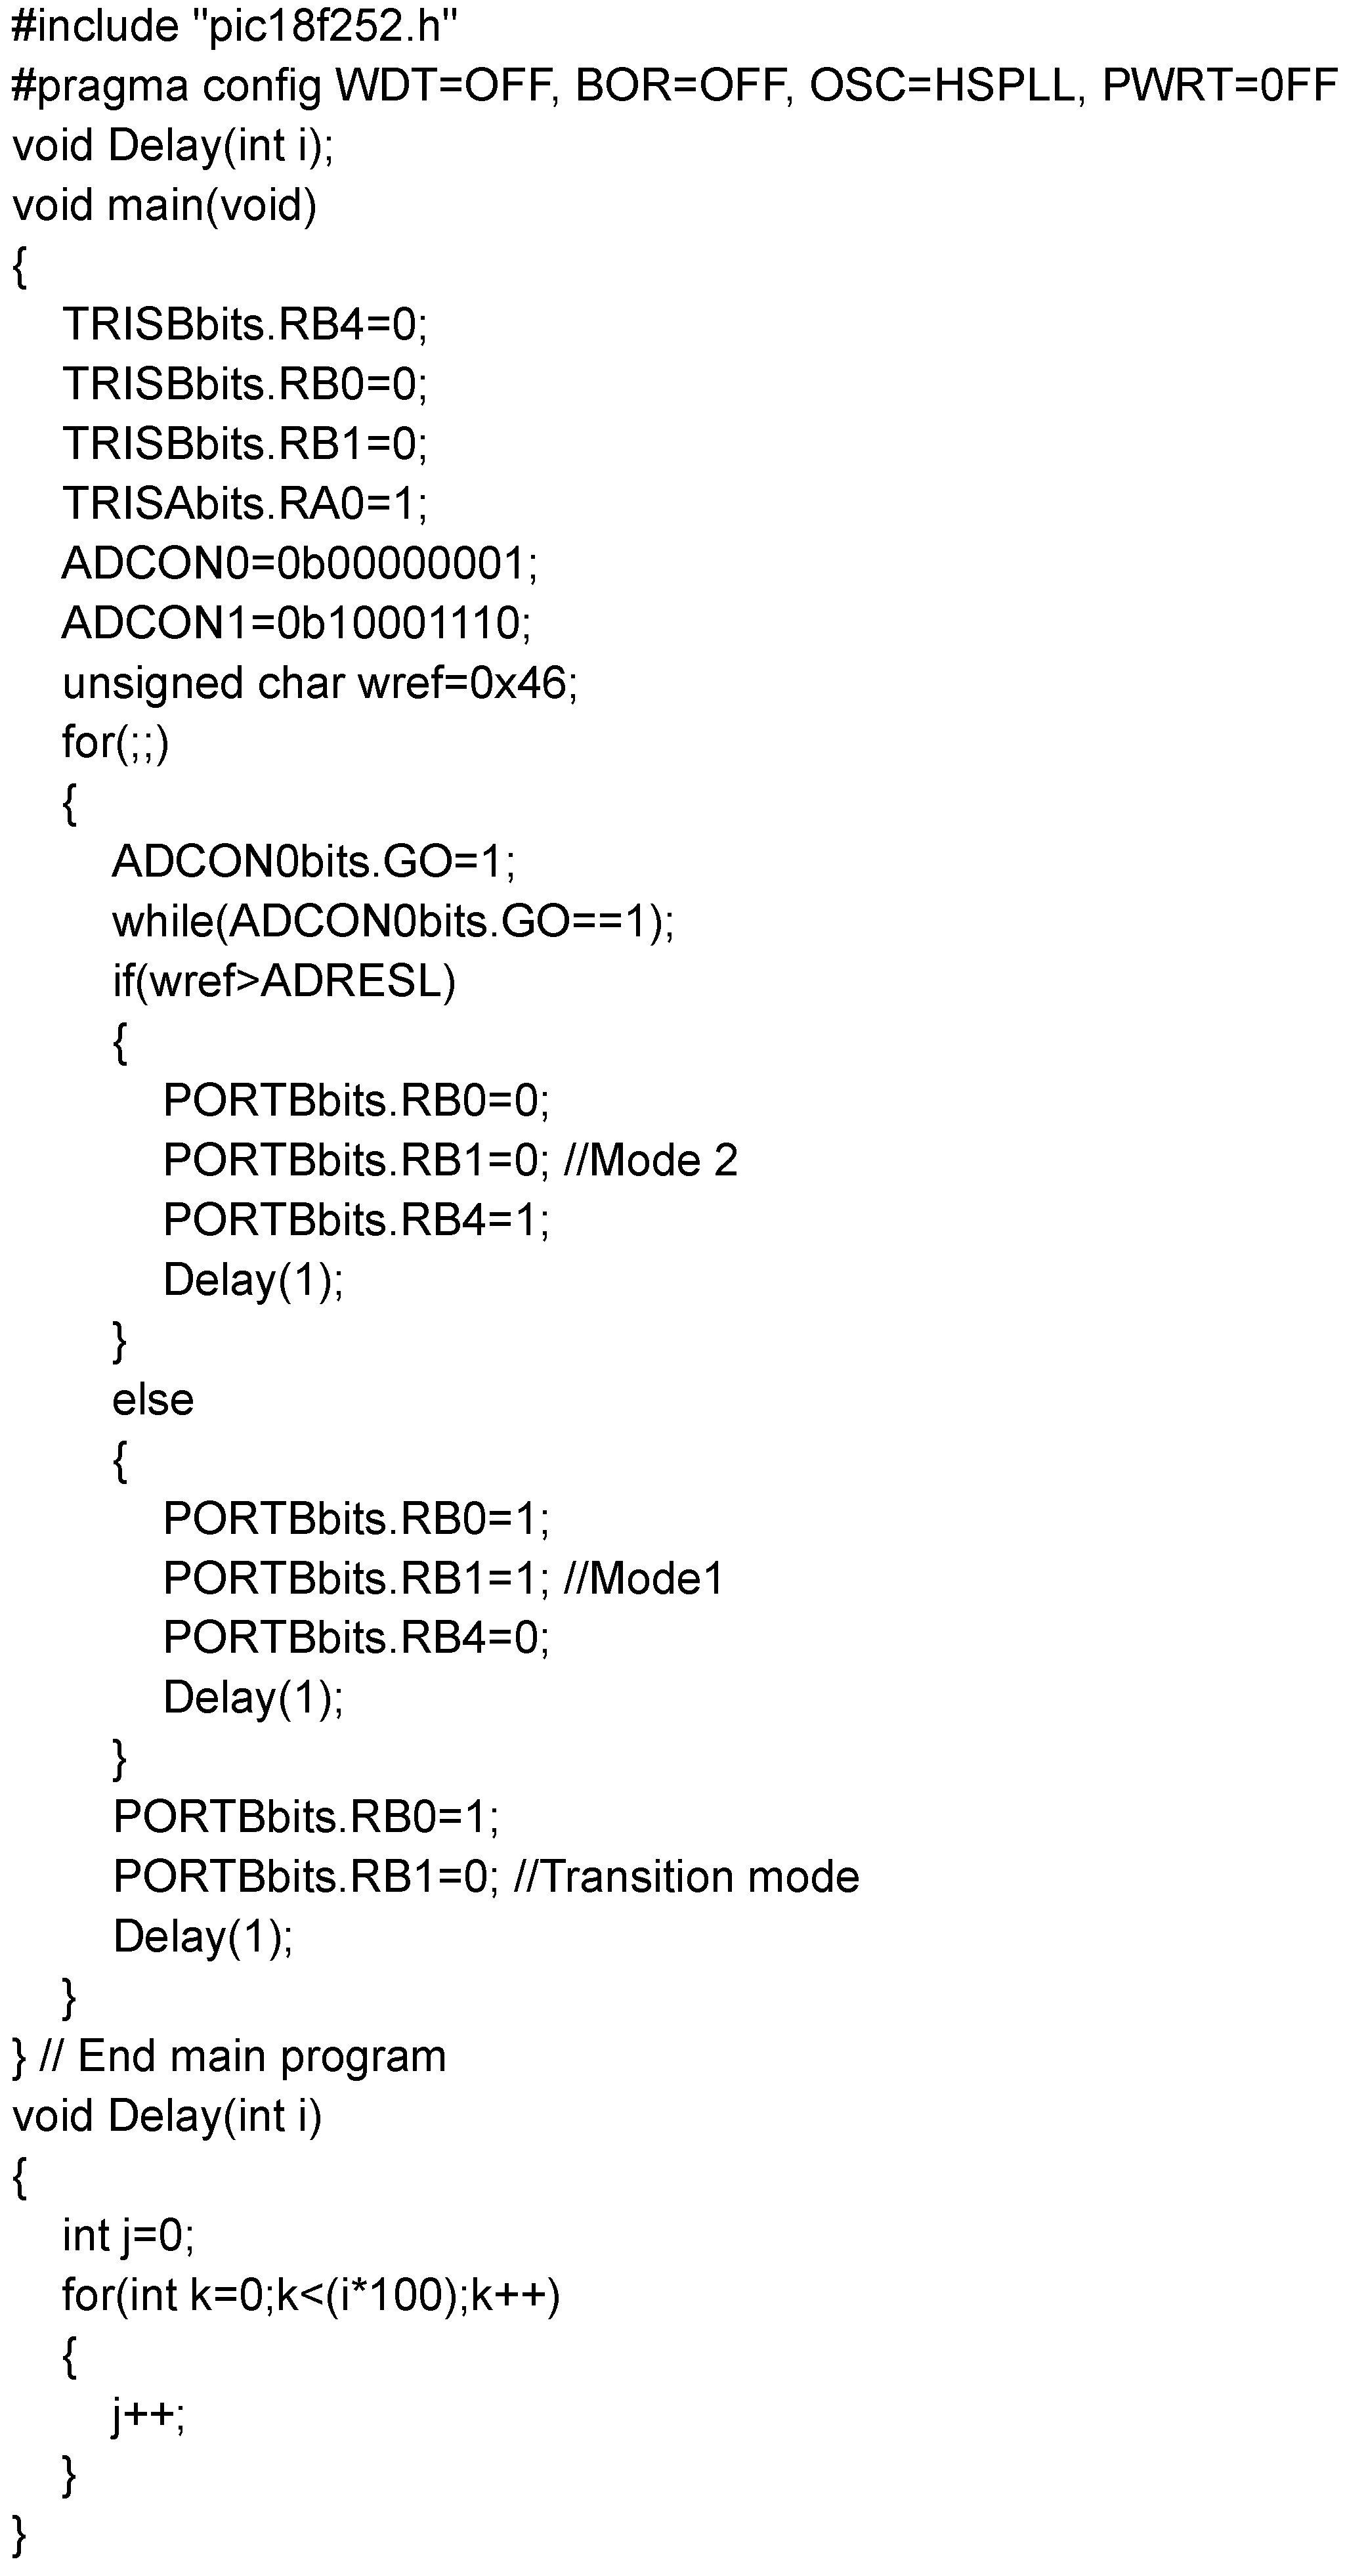
In order to make the experiment reproducible, we here present the implementation of the control algorithm, where the operational modes presented in Section 2 are clearly identified. Moreover, a time delay of 25 s was introduced for computational reasons. Figure A1 shows the C-Program inside the microcontroller unit.
Figure A1.
Screenshot of the PIC18F252 microcontroller C-Program. This is a simple program and easy to follow. The time delay introduced by the program is about 25 s.
Figure A1.
Screenshot of the PIC18F252 microcontroller C-Program. This is a simple program and easy to follow. The time delay introduced by the program is about 25 s.

References
- Imran, O.A.; Abed, W.N.A.D.; Jbarah, A.N. Speed control of universal motor. Int. J. Power Electron. Drive Syst. 2019, 10, 41–47. [Google Scholar] [CrossRef]
- Ramadan, E.A.; El-Bardini, M.; Fkirin, M.A. Design and FPGA-implementation of an improved adaptive fuzzy logic controller for DC motor speed control. Ain Shams Eng. J. 2014, 5, 803–816. [Google Scholar] [CrossRef] [Green Version]
- Alexandridis, A.T.; Konstantopoulos, G.C. Modified PI speed controllers for series-excited dc motors fed by dc/dc boost converters. Control Eng. Pract. 2014, 23, 14–21. [Google Scholar] [CrossRef]
- Zeghoudi, A.; Chermitti, A. A comparison between a Fuzzy and PID controller for universal motor. Int. J. Comput. Appl. Technol. 2014, 104, 32–36. [Google Scholar] [CrossRef]
- Maheswararao, C.U.; Babu, Y.K.; Amaresh, K. Sliding mode speed control of a DC motor. In Proceedings of the International Conference on Communication Systems and Network Technologies (IEEE-CSNT), Jammu, India, 3–5 June 2011; pp. 387–391. [Google Scholar]
- Takano, M.; Kurotani, K.; Takeda, K.; Tanisaka, A.; Kusumoto, S.; Yano, K. Application of h infinity control to motor speed control system. In Proceedings of the International Conference on Industrial Electronics, Control and Instrumentation (IECON’91), Kobe, Japan, 28 October–1 November 1991. [Google Scholar]
- Roy, T.K.; Paul, L.C.; Sarkar, M.I.; Pervej, M.F.; Tumpa, F.K. Adaptive controller design for speed control of DC motors driven by a DC-DC buck converter. In Proceedings of the International Conference on Electrical, Computer and Communication Engineering (IEEE-ECCE), Cox’s Bazar, Bangladesh, 16–18 February 2017. [Google Scholar]
- Sun, L.; You, F. Machine Learning and Data-Driven Techniques for the Control of Smart Power Generation Systems: An Uncertainty Handling Perspective. Engineering 2021, 7, 1239–1247. [Google Scholar] [CrossRef]
- De León Puig, N.I.P.; Bozalakov, D.; Acho, L.; Vandevelde, L.; Rodellar, J. An Adaptive–Predictive control scheme with dynamic Hysteresis Modulation applied to a DC–DC buck converter. ISA Trans. 2020, 105, 240–255. [Google Scholar] [CrossRef]
- Madhusudan, K.S.A.P.J.; Parikh, P.A. Design and Development of Universal Motor Control Unit using MATLAB and Arduino. In Proceedings of the National Conference on Emerging Trends, Challenges and Opportunities in Power Sector, Ahmedabad, India, 3–4 March 2017. [Google Scholar]
- Elkady, D.A.; Azazy, H.Z.; Mansour, A.S.; Shokrallah, S.S. Adaptive PI Speed controller for a universal motor. Engin. Res. J. 2015, 38, 101–108. [Google Scholar] [CrossRef]
- Hamza, B.A.; Lilia, E.A. Simulation and rapid control prototyping of DC powered universal motors speed control: Towards an efficient operation in future DC homes. Eng. Sci. Technol. Int. J. 2022, 34, 101092. [Google Scholar]
- El-Nagar, A.M.; El-Bardini, M. Practical implementation for the interval type-2 fuzzy PID controller using a low cost microcontroller. Ain Shams Eng. J. 2014, 5, 475–487. [Google Scholar] [CrossRef] [Green Version]
- Rojas-Dueñas, G.; Riba, J.R.; Moreno-Eguilaz, M. Modeling of a DC-DC bidirectional converter used in mild hybrid electric vehicles from measurements. Measurement 2021, 183, 109838. [Google Scholar] [CrossRef]
- Yang, J.; Cheng, F.; Duodu, M.; Li, M.; Han, C. High-Precision Fault Detection for Electric Vehicle Battery System Based on Bayesian Optimization SVDD. Energies 2022, 15, 8331. [Google Scholar] [CrossRef]
- Mendoza-Torres, A.; Visairo, N.; Nuñez, C.; Armenta, J.; Rodríguez, E.; Cervantes, I. Switching rule for a bidirectional DC/DC converter in an electric vehicle. Control Eng. Pract. 2019, 82, 108–117. [Google Scholar] [CrossRef]
- Viswanatha, V. Microcontroller based bidirectional buck-boost converter for photo-voltaic power plant. J. Electr. Syst. Inf. Technol. 2018, 5, 745–758. [Google Scholar]
- Rashid, M.H. Power Electronics: Circuits, Devices, and Applications, 3rd ed.; Pearson Education: Hoboken, NJ, USA, 2009; pp. 289–292. [Google Scholar]
- De Souza, A.D.R.; Efimov, D.; Raïssi, T.; Ping, X. Robust output feedback model predictive control for constrained linear systems via interval observers. Automatica 2022, 135, 109951. [Google Scholar] [CrossRef]
- Zhang, P. Advanced Industrial Control Technology; William Andrew Publishing: Oxford, UK, 2010; Chapter 2; pp. 41–70. [Google Scholar]
- Elmorshedy, M.F.; Xu, W.; El-Sousy, F.F.M.; Islam, M.R.; Ahmed, A.A. Recent Achievements in Model Predictive Control Techniques for Industrial Motor: A Comprehensive State-of-the-Art. IEEE Access 2021, 9, 58170–58191. [Google Scholar] [CrossRef]
- Wenliang, J.; Xudong, W.; Kai, Z.; Lihua, L. The Minimum Cost Current Predictive Control Strategy for Three-Phase Inverter. In Proceedings of the International Symposium on Computer, Consumer and Control (IEE-IS3C), Xi’an, China, 4–6 July 2016. [Google Scholar]
- Bernardi, E.; Adam, E.J. Fault-tolerant predictive control based on linear parameter varying scheme for industrial processes. J. Taiwan Inst. Chem. Eng. 2021, 129, 1–14. [Google Scholar] [CrossRef]
- Cai, M.; He, X.; Zhou, D. Fault-tolerant tracking control for nonlinear observer-extended high-order fully-actuated systems. J. Frankl. Inst. 2023, 360, 136–153. [Google Scholar] [CrossRef]
- Gibergans-Báguena, J.; Buenestado, P.; Pujol-Vázquez, G.; Acho, L. A Proportional Digital Controller to Monitor Load Variation in Wind Turbine Systems. Energies 2022, 15, 568. [Google Scholar] [CrossRef]
- Yin, H.; Wang, Z.; Liu, P.; Zhang, Z.; Li, Y. Voltage fault diagnosis of power batteries based on boxplots and gini impurity for electric vehicles. In Proceedings of the IEEE Electric Vehicles International Conference (EV), Bucharest, Romania, 3–4 October 2019; pp. 1–5. [Google Scholar]
- Ablay, G. An observer-based fault diagnosis in battery systems of hybrid vehicles. In Proceedings of the 8th International Conference on Electrical and Electronics Engineering (ELECO), Bursa, Turkey, 28–30 November 2013; pp. 238–242. [Google Scholar]
- Wang, Z.; Hong, J.; Liu, P.; Zhang, L. Voltage fault diagnosis and prognosis of battery systems based on entropy and Z-score for electric vehicles. Appl. Energy 2017, 196, 289–302. [Google Scholar] [CrossRef]
- Sun, Z.; Liu, P.; Wang, Z. Real-time fault diagnosis method of battery system based on Shannon entropy. Energy Procedia 2017, 105, 2354–2359. [Google Scholar] [CrossRef]
- Shen, J.; Khaligh, A. Design and real-time controller implementation for a battery-ultracapacitor hybrid energy storage system. IEEE Trans. Ind. Inform. 2016, 12, 1910–1918. [Google Scholar] [CrossRef]
- Xu, G.; Du, X.; Li, Z.; Zhang, X.; Zheng, M.; Miao, Y.; Gao, Y.; Liu, Q. Reliability design of battery management system for power battery. Microelectron. Reliab. 2018, 88, 1286–1292. [Google Scholar] [CrossRef]
- Cheng, M.W.; Wang, S.M.; Lee, Y.S.; Hsiao, S.H. Fuzzy controlled fast charging system for lithium-ion batteries. In Proceedings of the International Conference on Power Electronics and Drive Systems (PEDS), Taipei, Taiwan, 2–5 November 2009; pp. 1498–1503. [Google Scholar]
- Bansal, U.K.; Narvey, R. Speed control of DC motor using fuzzy PID controller. Adv. Electron. Electr. Eng. 2013, 3, 1209–1220. [Google Scholar]
- Petráš, I. Fractional-order feedback control of a DC motor. J. Electr. Eng. 2009, 60, 117–128. [Google Scholar]
- Santana, J.; Naredo, J.L.; Sandoval, F.; Grout, I.; Argueta, O.J. Simulation and construction of a speed control for a DC series motor. Mechatronics 2002, 12, 1145–1156. [Google Scholar] [CrossRef]
- Zhao, D.; Zhang, N. An improved nonlinear speed controller for series DC motors. In Proceedings of the of the 17th World Congress, The International Federation of Automatic Control, Seoul, Republic of Korea, 6–11 July 2008. [Google Scholar]
- Ponce De León Puig, N.I.; Rodellar, J.; Acho, L. Predictive Control with Dynamic Hysteresis Reference Trajectory: Application to a Structural Base-Isolation Model. J. Appl. Comput. Mech. 2021, 7, 1242–1251. [Google Scholar] [CrossRef]
- Maiciejowski, J.M. Predictive Control with Constraints; Prentice Hall: New York, NY, USA, 2002. [Google Scholar]
- Norambuena, M.; Lezana, P.; Rodriguez, J. A method to eliminate steady-state error of model predictive control in power electronics. IEEE J. Emerg. Sel. Top. Power Electron. 2019, 7, 2525–2530. [Google Scholar] [CrossRef]
- Fotouhi, A.; Auger, D.; Propp, K.; Longo, S.; Wild, M. A review on electric vehicle battery modelling: From Lithium-ion toward Lithium–Sulphur. Renew. Sustain. Energy Rev. 2016, 56, 1008–1021. [Google Scholar] [CrossRef] [Green Version]
- Sun, Z.; Han, Y.; Wang, Z.; Chen, Y.; Liu, P.; Qin, Z.; Zhang, Z.; Wu, Z.; Song, C. Detection of voltage fault in the battery system of electric vehicles using statistical analysis. Appl. Energy 2021, 307, 118172. [Google Scholar] [CrossRef]
- Li, S.; Zhang, C.; Du, J.; Cong, X.; Zhang, L.; Jiang, Y.; Wang, L. Fault diagnosis for lithium-ion batteries in electric vehicles based on signal decomposition and two-dimensional feature clustering. Green Energy Intell. Transp. 2022, 1, 100009. [Google Scholar] [CrossRef]
- Wu, M.; Du, W.; Zhang, F.; Zhao, N.; Wang, J.; Wang, L.; Huang, W. Fault Diagnosis Method for Lithium-Ion Battery Packs in Real-World Electric Vehicles Based on K-Means and the Fréchet Algorithm. ACS Omega 2022, 7, 40145–40162. [Google Scholar] [CrossRef]
- Li, D.; Zhang, Z.; Liu, P.; Wang, Z.; Zhang, L. Fault Diagnosis of Battery Systems for Electric Vehicles Based on Voltage Abnormality Combining the Long Short-term Memory Neural Network and the Equivalent Circuit Model. IEEE Trans. Power Electron. 2021, 36, 1303–1315. [Google Scholar] [CrossRef]
- Qiu, Y.; Sun, J.; Shang, Y.; Wang, D.A. Fault Diagnosis and Prognosis Method for Lithium-Ion Batteries Based on a Nonlinear Autoregressive Exogenous Neural Network and Boxplot. Symmetry 2021, 13, 1714. [Google Scholar] [CrossRef]
Figure 1.
Diagram of the bidirectional DC-DC converter with a DC motor. The input voltage is the optional power supply to the motor. L is the field inductive load of the motor.
Figure 1.
Diagram of the bidirectional DC-DC converter with a DC motor. The input voltage is the optional power supply to the motor. L is the field inductive load of the motor.

Figure 2.
An overview of the predictive control block, where is the setpoint and and are the output signals from the controller to the transistors.
Figure 2.
An overview of the predictive control block, where is the setpoint and and are the output signals from the controller to the transistors.

Figure 3.
Flowchart of the proposed predictive control algorithm, where k is the iteration label.

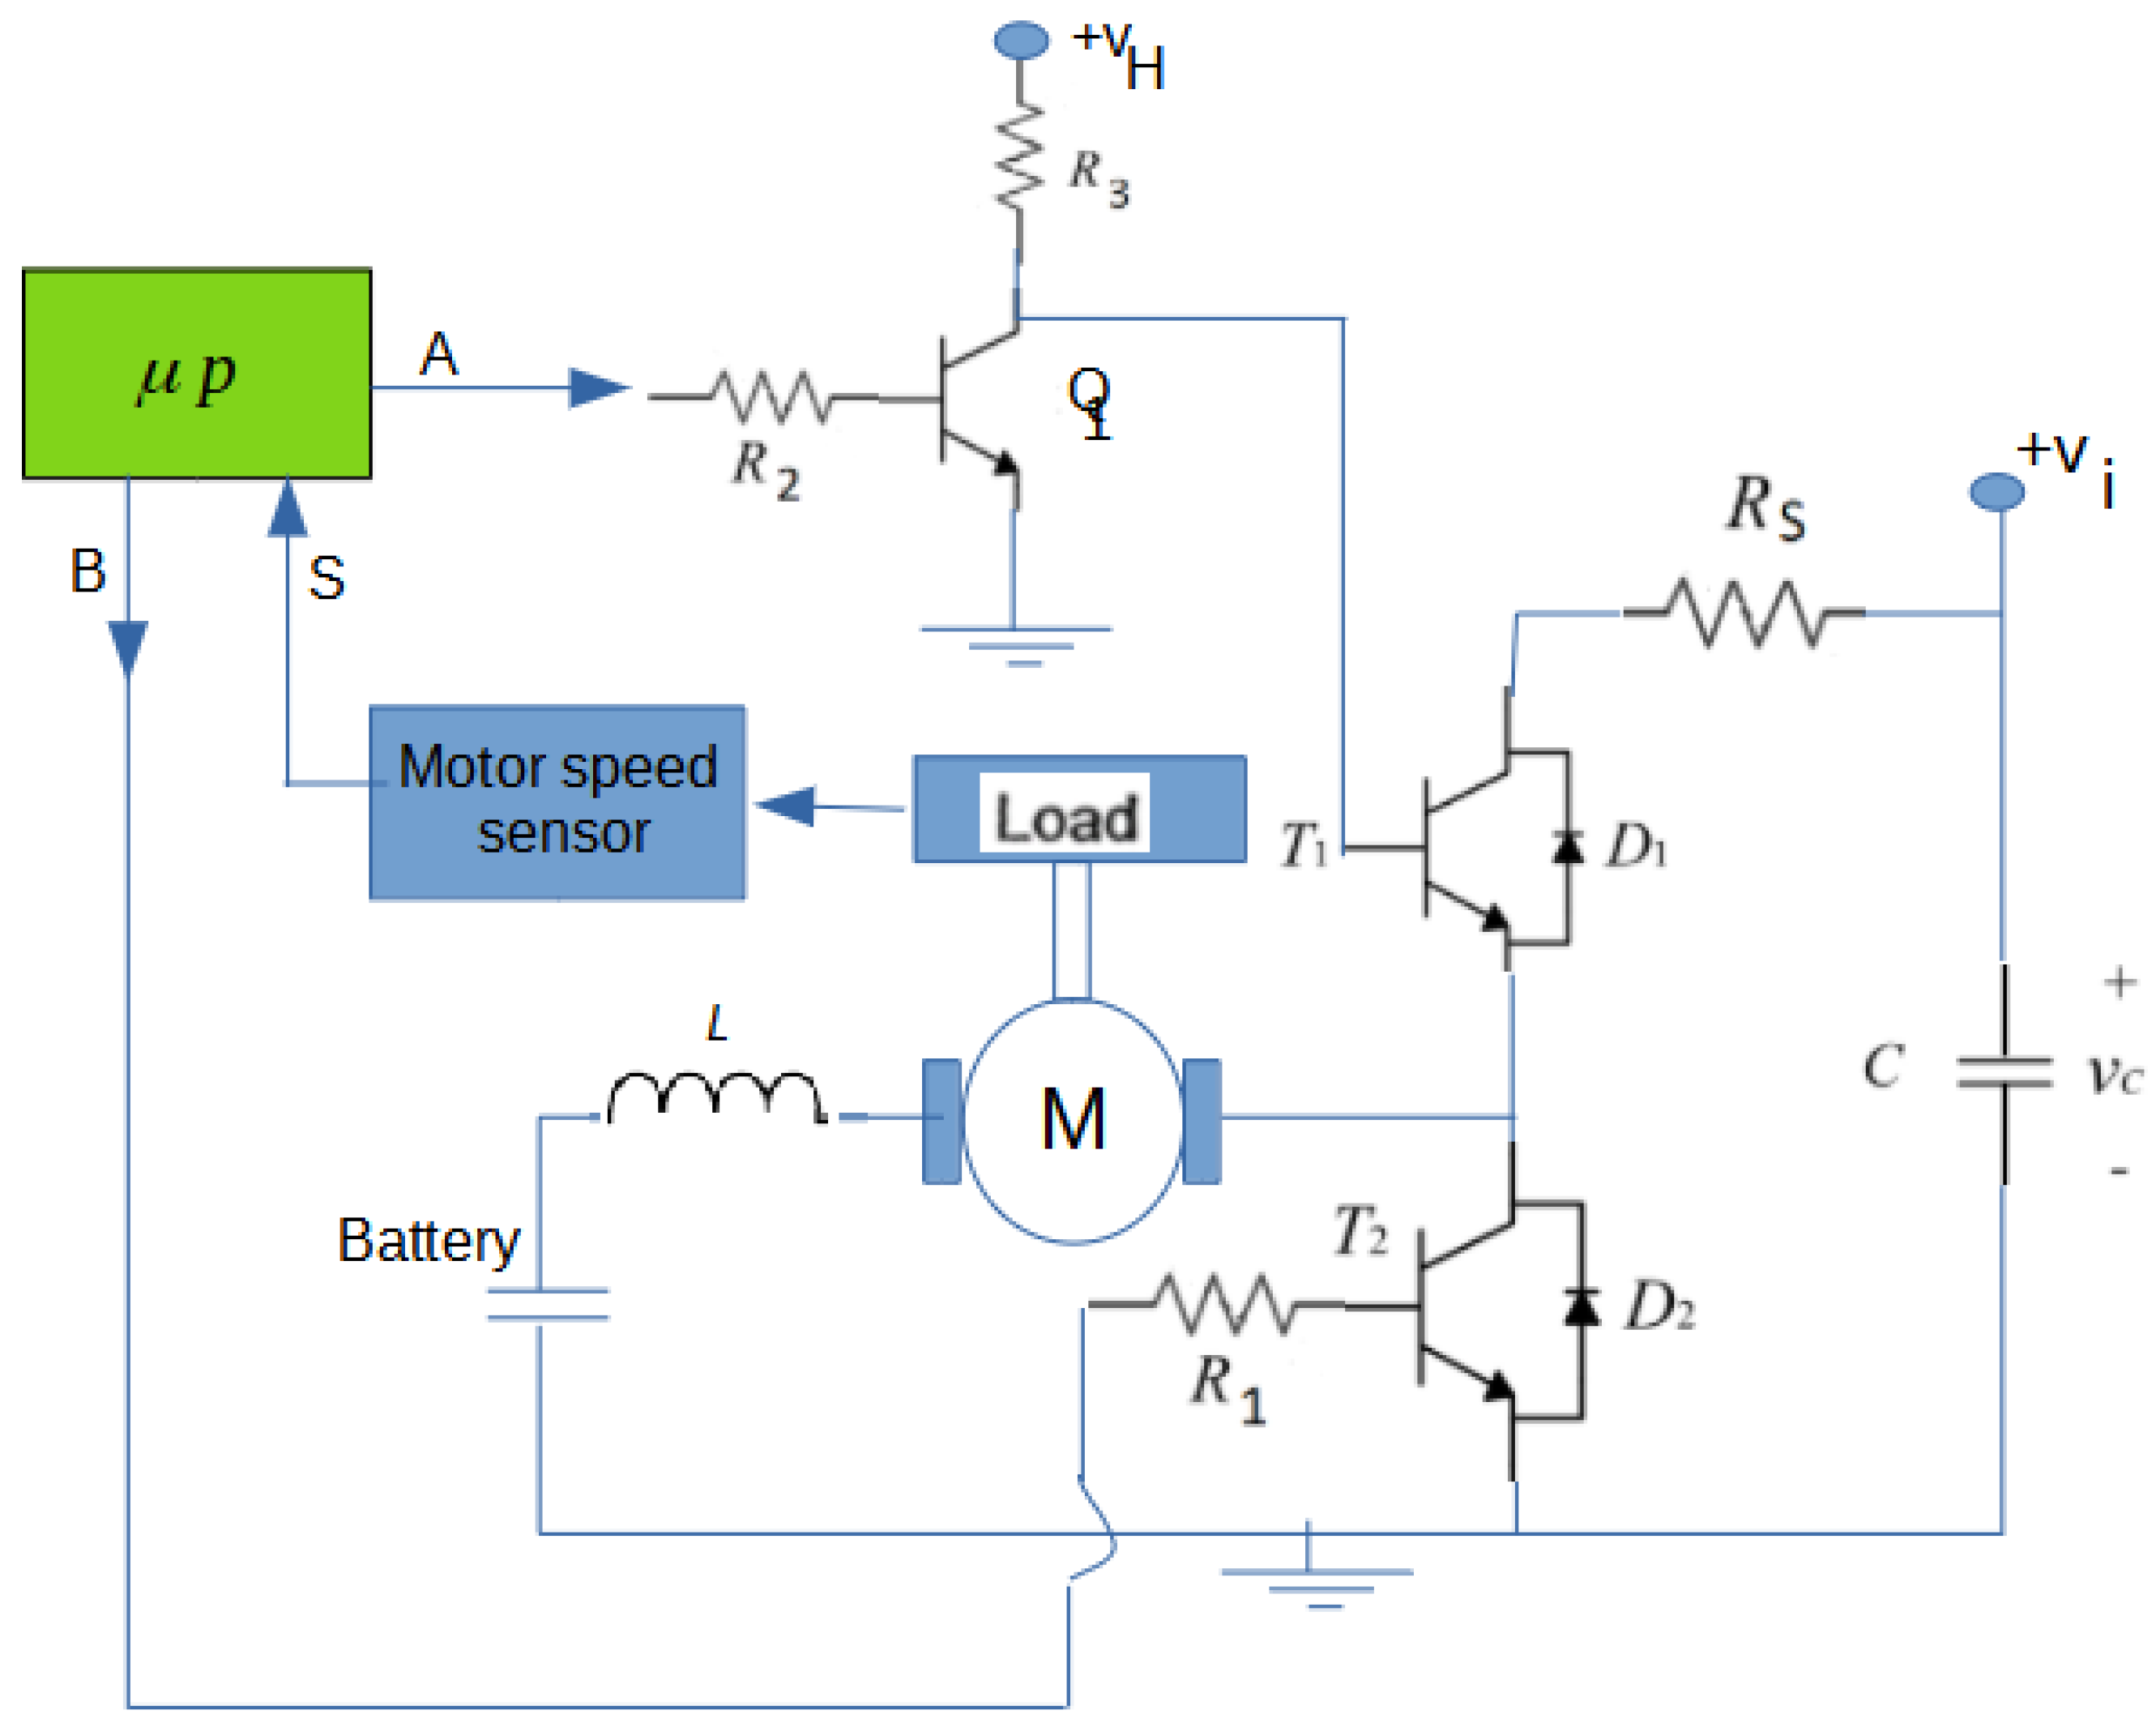
Figure 4.
An overview of the experimental platform. The reference command is given by the software inside the microprocessor program. Here, A, , , = = 330 , = 1 K, F, = 1 , V, and V at a rated current supply of A (data from the manufacturer of the power source). The DC motor has a nominal power of 220/240 V at 50/60 Hz and a nominal angular speed of 1000 rpm (data from the manufacturer of the universal motor). This motor is universal. Here, the battery is a charging capacitor, a standard emulator for electric car batteries on the road.

Figure 5.
Motor speed sensor. Here, , = = 10 K, F, and F. The operational amplifiers were realized by using an IC . Furthermore, V.
Figure 5.
Motor speed sensor. Here, , = = 10 K, F, and F. The operational amplifiers were realized by using an IC . Furthermore, V.

Figure 6.
Microcontroller diagram connection. Here, the LED in of the microcontroller is used to visualize the system operation. Additionally, the 5 V power supply includes a 10 F filter capacitor to ground it.
Figure 6.
Microcontroller diagram connection. Here, the LED in of the microcontroller is used to visualize the system operation. Additionally, the 5 V power supply includes a 10 F filter capacitor to ground it.

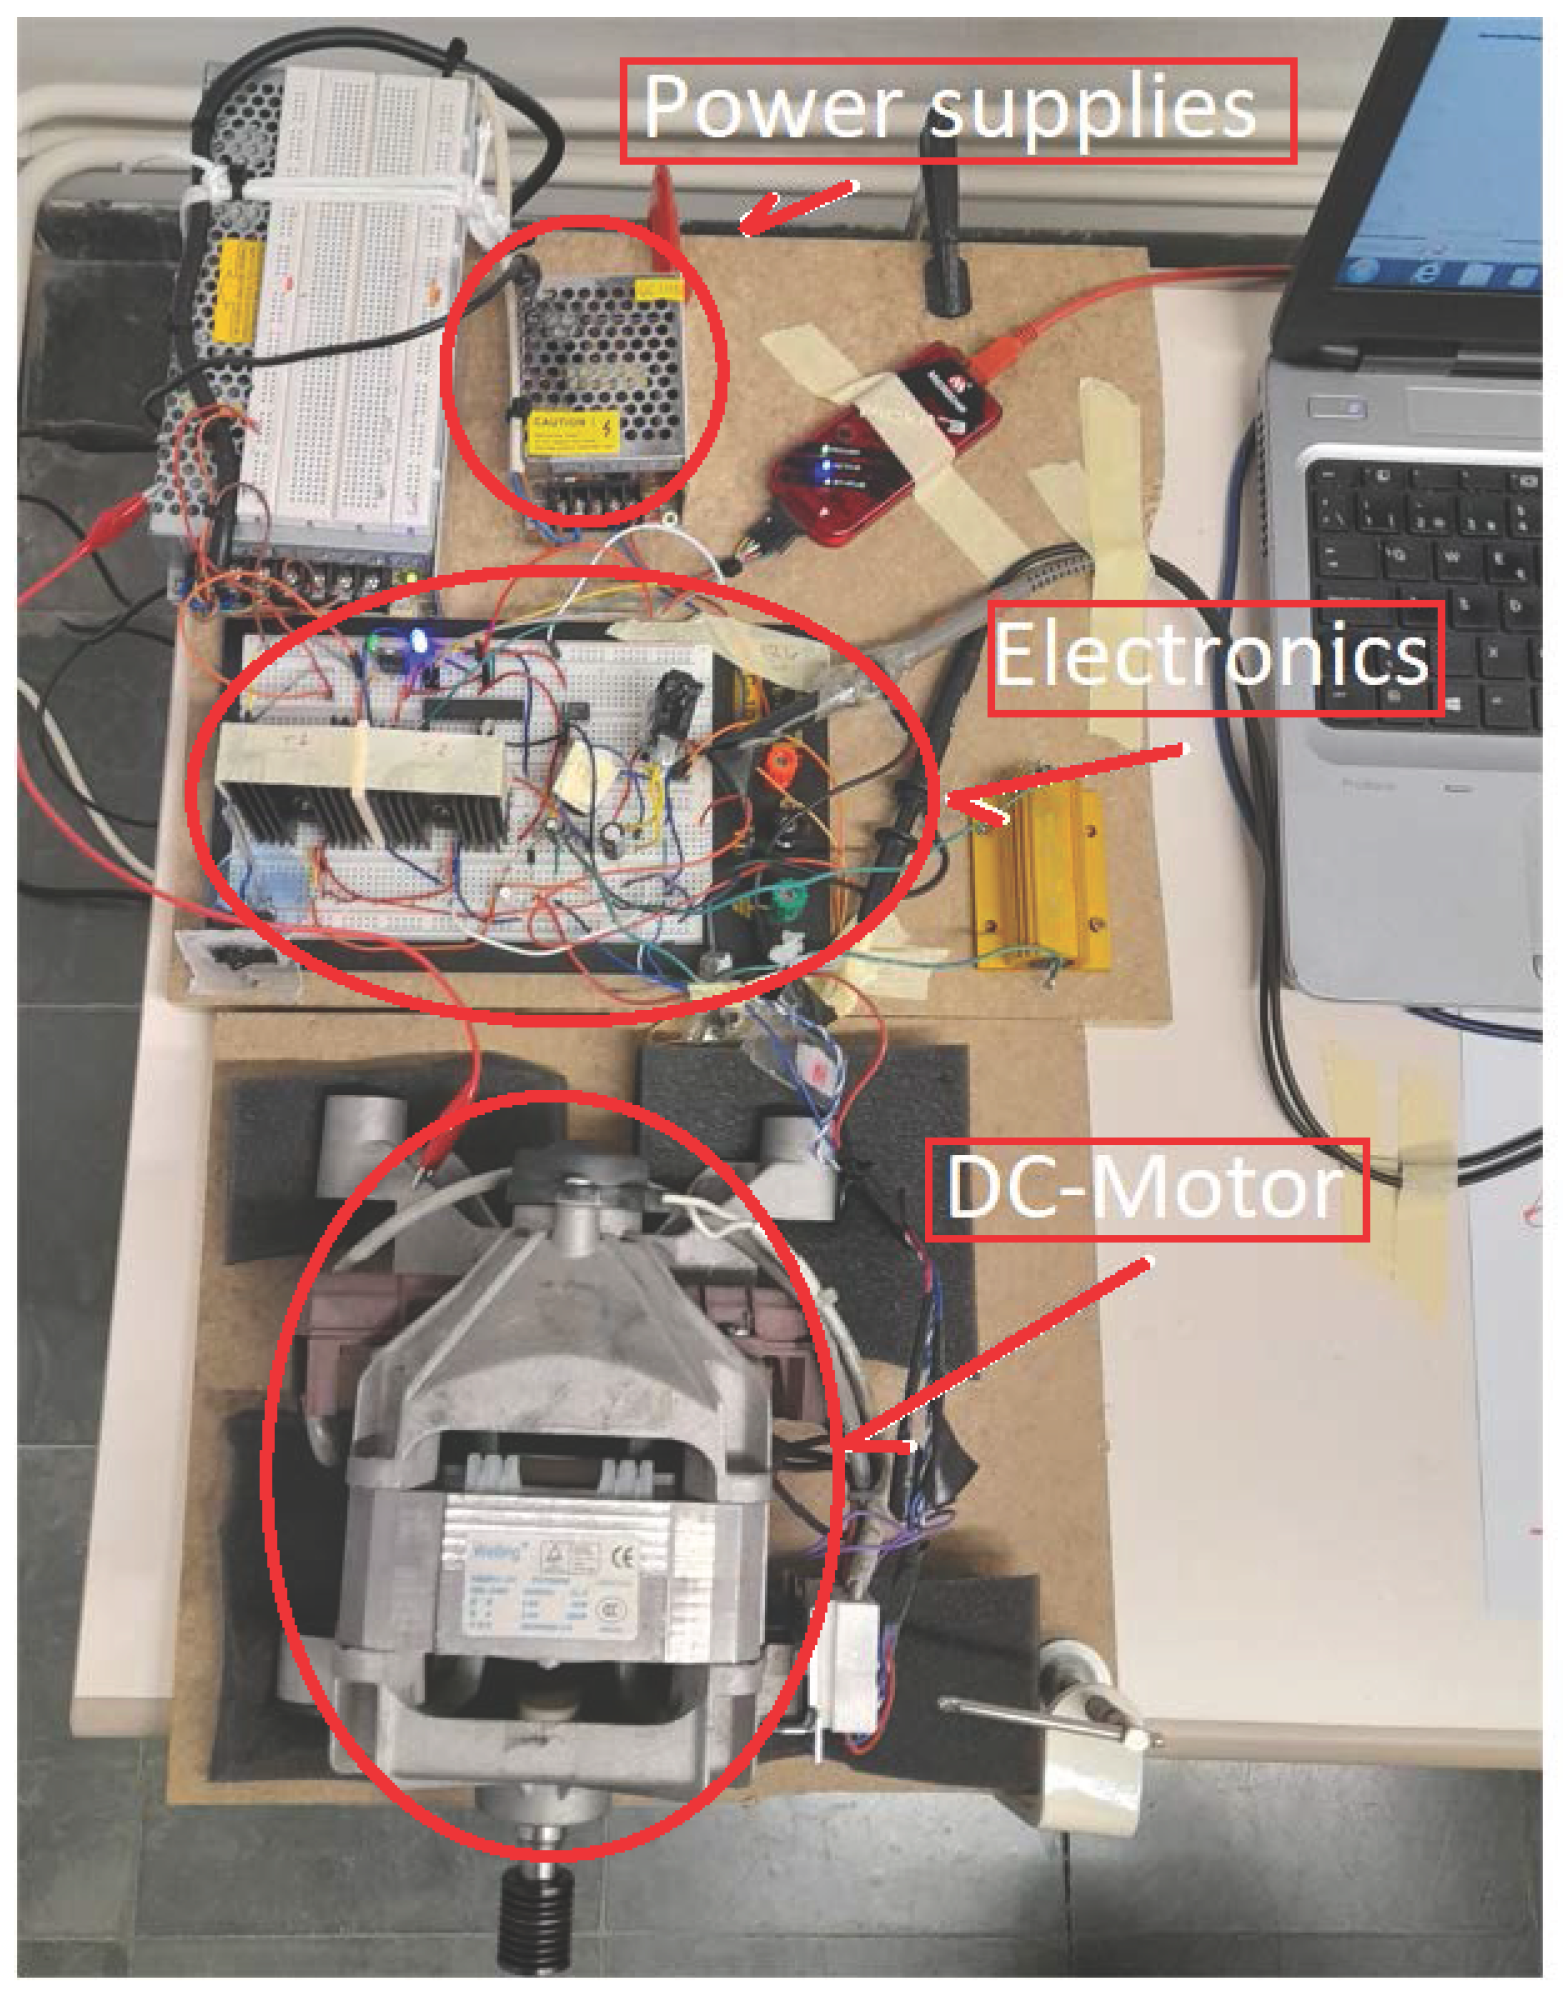
Figure 7.
A photo of the experimental platform for the short circuit battery set-up. From top to bottom: the power supply, the electronic circuits, and the DC motor (a universal motor). A data acquisition card is used to read data via the computer.
Figure 7.
A photo of the experimental platform for the short circuit battery set-up. From top to bottom: the power supply, the electronic circuits, and the DC motor (a universal motor). A data acquisition card is used to read data via the computer.

Figure 8.
Experimental result of the motor speed sensor for different references. From left to right: x26; x46, x86. Black arrow: control activation; red arrow: external perturbations (stopping it).
Figure 8.
Experimental result of the motor speed sensor for different references. From left to right: x26; x46, x86. Black arrow: control activation; red arrow: external perturbations (stopping it).

Figure 9.
Experimental results for the faulty scenario by adding a capacitor, with the same reference as Figure 8. From left to right: x26; x46; x86. The black arrows indicate control activations. Meanwhile, the red arrows indicate the presence of external perturbations, as in the standard experiment.

Figure 10.
Experimental results for (blue: nominal case; orange: faulty case).

Figure 11.
A recent experimental platform for capacitive battery monitoring, where a battery emulator is designed in terms of adding a new circuit connected to the DC motor. This circuit, which simulates a car battery, is shown in the following figure.
Figure 11.
A recent experimental platform for capacitive battery monitoring, where a battery emulator is designed in terms of adding a new circuit connected to the DC motor. This circuit, which simulates a car battery, is shown in the following figure.

Figure 12.
A simple battery electric model shown schematically in Figure 11 as the battery. is an electrolytic capacitor rated at 10,000 F.
Figure 12.
A simple battery electric model shown schematically in Figure 11 as the battery. is an electrolytic capacitor rated at 10,000 F.

Figure 13.
Experimental results for the healthy case without disturbances. The control goes from the off to the on position at about 2.8 s.
Figure 13.
Experimental results for the healthy case without disturbances. The control goes from the off to the on position at about 2.8 s.

Figure 14.
Experimental results for the healthy case with disturbances.

Figure 15.
Experimental results for faulty case A without disturbances. The control goes from the off to the on position at about 3.6 s.
Figure 15.
Experimental results for faulty case A without disturbances. The control goes from the off to the on position at about 3.6 s.

Figure 16.
Experimental results for faulty case A with disturbances.

Figure 17.
Healthy case without disturbances: (a) a dot plot of the variation in with regard to time. (b) Histogram of the variable.
Figure 17.
Healthy case without disturbances: (a) a dot plot of the variation in with regard to time. (b) Histogram of the variable.

Figure 18.
Healthy case with external disturbances: (a) a dot plot of the variation in with regard to time. (b) Histogram of the variable.
Figure 18.
Healthy case with external disturbances: (a) a dot plot of the variation in with regard to time. (b) Histogram of the variable.

Figure 19.
Faulty A case without disturbances: (a) a dot plot of the variation in with regard to time. (b) Histogram of the variable.
Figure 19.
Faulty A case without disturbances: (a) a dot plot of the variation in with regard to time. (b) Histogram of the variable.

Figure 20.
Faulty A case with external pertubations: (a) a dot plot of the variation in with regard to time. (b) Histogram of the variable.
Figure 20.
Faulty A case with external pertubations: (a) a dot plot of the variation in with regard to time. (b) Histogram of the variable.

Figure 21.
Faulty B case without disturbances: (a) a dot plot of the variation in with regard to time. (b) Histogram of the variable.
Figure 21.
Faulty B case without disturbances: (a) a dot plot of the variation in with regard to time. (b) Histogram of the variable.

Figure 22.
Faulty B case with disturbances: (a) a dot plot of the variation in with regard to time. (b) Histogram of the variable.
Figure 22.
Faulty B case with disturbances: (a) a dot plot of the variation in with regard to time. (b) Histogram of the variable.

Disclaimer/Publisher’s Note: The statements, opinions and data contained in all publications are solely those of the individual author(s) and contributor(s) and not of MDPI and/or the editor(s). MDPI and/or the editor(s) disclaim responsibility for any injury to people or property resulting from any ideas, methods, instructions or products referred to in the content. |
© 2023 by the authors. Licensee MDPI, Basel, Switzerland. This article is an open access article distributed under the terms and conditions of the Creative Commons Attribution (CC BY) license (https://creativecommons.org/licenses/by/4.0/).
Share and Cite
MDPI and ACS Style
Buenestado, P.; Gibergans-Báguena, J.; Acho, L.; Pujol-Vázquez, G. Predictive Speed Control of a DC Universal Motor Applied to Monitor Electric Vehicle Batteries. Machines 2023, 11, 740. https://doi.org/10.3390/machines11070740
AMA Style
Buenestado P, Gibergans-Báguena J, Acho L, Pujol-Vázquez G. Predictive Speed Control of a DC Universal Motor Applied to Monitor Electric Vehicle Batteries. Machines. 2023; 11(7):740. https://doi.org/10.3390/machines11070740
Chicago/Turabian StyleBuenestado, Pablo, José Gibergans-Báguena, Leonardo Acho, and Gisela Pujol-Vázquez. 2023. "Predictive Speed Control of a DC Universal Motor Applied to Monitor Electric Vehicle Batteries" Machines 11, no. 7: 740. https://doi.org/10.3390/machines11070740
Note that from the first issue of 2016, this journal uses article numbers instead of page numbers. See further details here.