
Optimization Design and Pressure Fluctuation Suppression Based on Orthogonal Method for a Centrifugal Compressor

1
State Key Laboratory of Hydro-Science and Engineering, Department of Energy and Power Engineering, Tsinghua University, Beijing 100084, China
2
China Aerodynamics Research and Development Center, Mianyang 621000, China
3
College of Mechanical and Electronic Engineering, Shandong University of Science and Technology, Qingdao 266590, China
*
Author to whom correspondence should be addressed.
Machines 2023, 11(5), 559; https://doi.org/10.3390/machines11050559
Submission received: 19 April 2023
/
Revised: 3 May 2023
/
Accepted: 13 May 2023
/
Published: 16 May 2023
(This article belongs to the Special Issue Aerodynamic Design and Optimization for Turbomachinery)
Abstract
:An air compressor is the core component of the air supply system of a hydrogen fuel cell, which demands high efficiency and reliable stability in a wide operation region. In this work, a centrifugal air compressor for a hydrogen fuel cell is first designed and then measured experimentally. Furthermore, a test rig for assessing the aerodynamic performance of the centrifugal air compressor is established, which includes a pipeline, gas flowmeter, flow regulating valve, pressure transmitter, centrifugal compressor, controller, DC power supply and computer. Then, the orthogonal method is employed to conduct the aerodynamic performance optimization. Four optimization parameters—including blade number, blade angle at the inlet, blade angle at the outlet and wrap angle—are set with three levels. Nine compressor individuals are designed according to the orthogonal method, and then numerical simulation is implemented to confirm the aerodynamic performance and flow pattern. Results show that the blade number has the greatest influence on the compressor’s performance, and the blade angle at inlet is also very important. The optimal performance of the compressor improves compared to that of the baseline compressor; the efficiencies of the baseline compressor and optimal compressor are 81.3% and 83.8%, respectively, improving by 2.5%. The frequency domain of pressure fluctuation in the centrifugal compressor is related to the stator-rotor interaction. The peak value of pressure fluctuation amplitude occurs at the rotation frequency of 833 Hz and its harmonic frequency. In comparison with the baseline compressor, the pressure fluctuation amplitude of the optimal compressor is obviously reduced, especially near the volute tongue.
1. Introduction
An air compressor is an important component of a hydrogen fuel cell because it compresses air into the cathode of the cell in order to provide oxygen for the chemical reaction. Therefore, the air compressor is the core component of the air supply system of the hydrogen fuel cell, and it will greatly affect the overall performance of the fuel cell [1,2]. In a hydrogen fuel cell vehicle, the cost of the air supply system accounts for about 16% of the total cost of the battery [3,4]. In an engineering application, the air compressor in a hydrogen fuel cell vehicle should work with high efficiency and reliable stability [5,6,7,8]. Compared with the traditional volumetric compressor, a centrifugal compressor has the advantages of high efficiency, wide operation range and compact structure, which can be widely used in the air supply system of a hydrogen fuel cell [9,10,11,12].
Relevant institutions and scholars have carried out a lot of work on the optimization design of centrifugal compressors. Marconcini et al. [13] studied an ultra-high-speed centrifugal compressor with a rotating speed of 247,000 rpm by means of measurement and numerical simulation, and they analyzed the overall flow, leakage and secondary flow in the centrifugal compressor. Krain et al. [14] conducted a lot of experimental research on the accuracy of numerical simulation in a centrifugal compressor; they found that there was a certain deviation between numerical simulation and test results at high speed and that the deviation increased with the increase in speed. Hildebrandt et al. [15] studied the influence of the blade’s back sweep angle and deflector on the flow-field distribution at the outlet of an air compressor and found that the jet wake is associated with the impeller outlet flow rate. Expanding the blade’s back sweep angle has a certain improvement effect on the impeller outlet flow rate separation. In 2016, Hyundai Motor Corporation of Korea developed the centrifugal compressor for the third generation of on-board fuel cells [16,17] and its power increased from 8 kW to 10 kW.
Zhao et al. [18] studied the nonlinear relationship between the pressure, flow, speed and height of the centrifugal air compressor for an aircraft fuel cell and concluded principles on flow and pressure control of the fuel cell high-speed centrifugal compressor. Qiu et al. [19] used CFX software to numerically simulate the flow field of a centrifugal compressor, revealing the changes in pressure, velocity, and temperature in the flow field and capturing flow characteristics, such as vortex and secondary flow. Zuo et al. [20] used the Kriging model to optimize the parameters of a centrifugal impeller; as a result, the compression ratio at the design point increased by 3.56% and the isentropic efficiency increased by 1.02%. These studies provide important references for the optimization design of centrifugal compressors.
Many scholars have also carried out a lot of research on the unsteady flow and pressure fluctuation in a centrifugal compressor. Lu et al. [21] found that the main frequency of pressure fluctuation in the impeller channel under the design condition was the blade frequency or twice the blade frequency by numerical simulation, and the main frequency of pressure fluctuation under the non-design condition was the blade frequency. Sun et al. [22] studied the influence of the number of blades on the pressure fluctuation of a centrifugal pump through numerical simulation and found that the position of the maximum pressure fluctuation varies with the number of blades. Zhang et al. [23] studied the pressure fluctuation characteristics in the volute of a vertical centrifugal pump. The research shows that the main frequency in the guide vane is the blade passing frequency, and the occurrence of low frequency pressure fluctuation is closely related to the periodic large-scale vortex in the guide vane. Zhou et al. [24,25] studied the effect of the number of impeller blades on the stall characteristics of centrifugal pumps in detail. Li et al. [26] used a compressor model level test rig to verify pressure pulsation in the compressor cavity. Based on the test results, the characteristic amplitudes corresponding to the blade channel frequencies at different rotational speeds were obtained. During the experiment, it was found that the amplitude of pressure fluctuations caused by acoustic resonance would increase exponentially, resulting in a strong destructive effect. It has been confirmed that acoustic resonance can significantly increase the internal pressure pulsation of the compressor, providing a basis for monitoring the condition of centrifugal compressor blades and suppressing damage.
In this work, a centrifugal air compressor in a 65 kW hydrogen fuel cell system was taken as the research object. The aerodynamic design of the impeller was conducted first, and then the numerical simulation and experimental measurements were taken in order to confirm the energy performance of the centrifugal air compressor. Finally, the orthogonal optimization was employed to improve the energy performance and suppress the pressure fluctuation of the centrifugal air compressor.
2. Aerodynamic Design
2.1. Design Parameter
2.2. Design Process
The geometrical parameters of the impeller and volute were determined by combining theoretical formula with CFturbo design software. Firstly, the geometrical parameters, such as impeller inlet diameter, outlet diameter and outlet width, were determined through a design theory of centrifugal air compressors. Then, a geometrical model of the blade was generated in CFturbo software. CFturbo is a professional software for the design of turbomachinery, which can automatically generate blade geometry according to the given parameters, and the blade geometrical parameters such as blade meridian flow passage, blade profile and flow angle can be adjusted and optimized.
2.3. Design Result
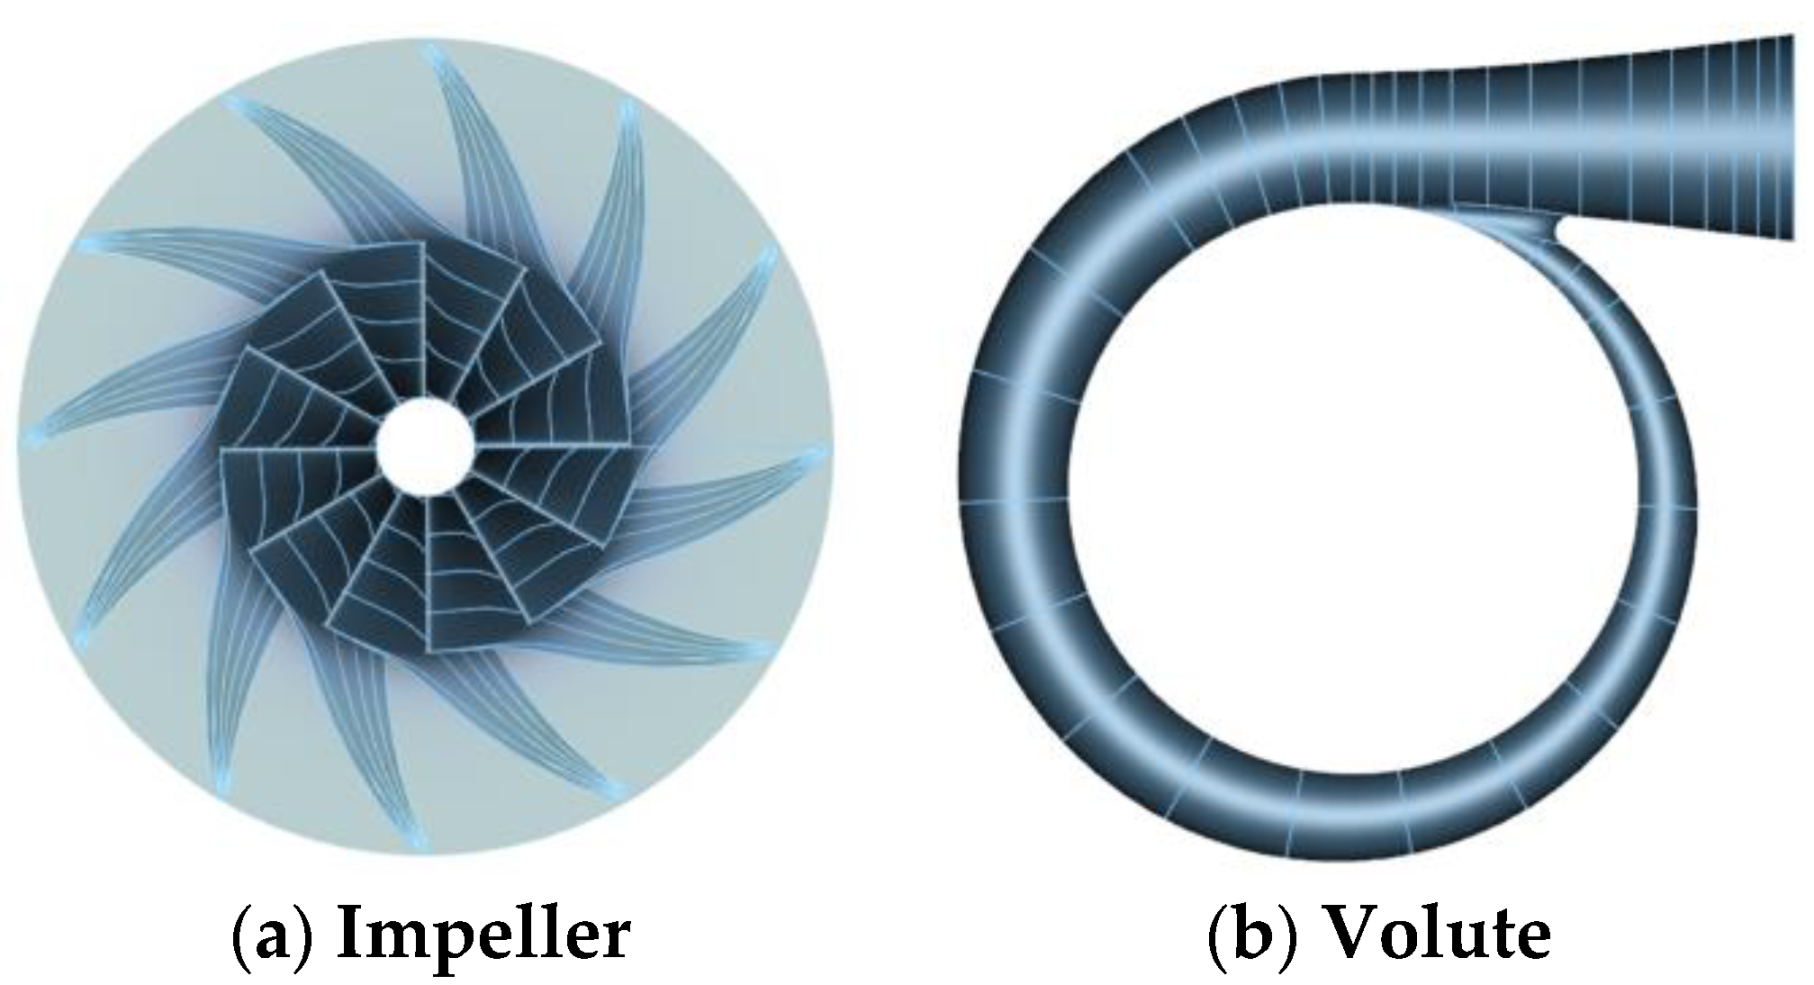
When the design process was completed, the three-dimensional geometries of the impeller and volute were established. The impeller was a closed backward-curved impeller, and the blade number was initially set as twelve. In consideration of the strength, the inlet and outlet thickness of the blade were set as 1 mm. The blade angle and blade wrap angle were calculated according to the CFturbo software. The geometrical parameters of the centrifugal compressor are shown in Table 2.
The volute was then designed on the basis of the impeller, the shape line was spiraled, and the diameter of base circle D = 1.1 D2 = 110 mm. Figure 1 shows the designed impeller and volute.
3. Numerical Simulation and Experimental Measurement
3.1. Computational Domain and Grid
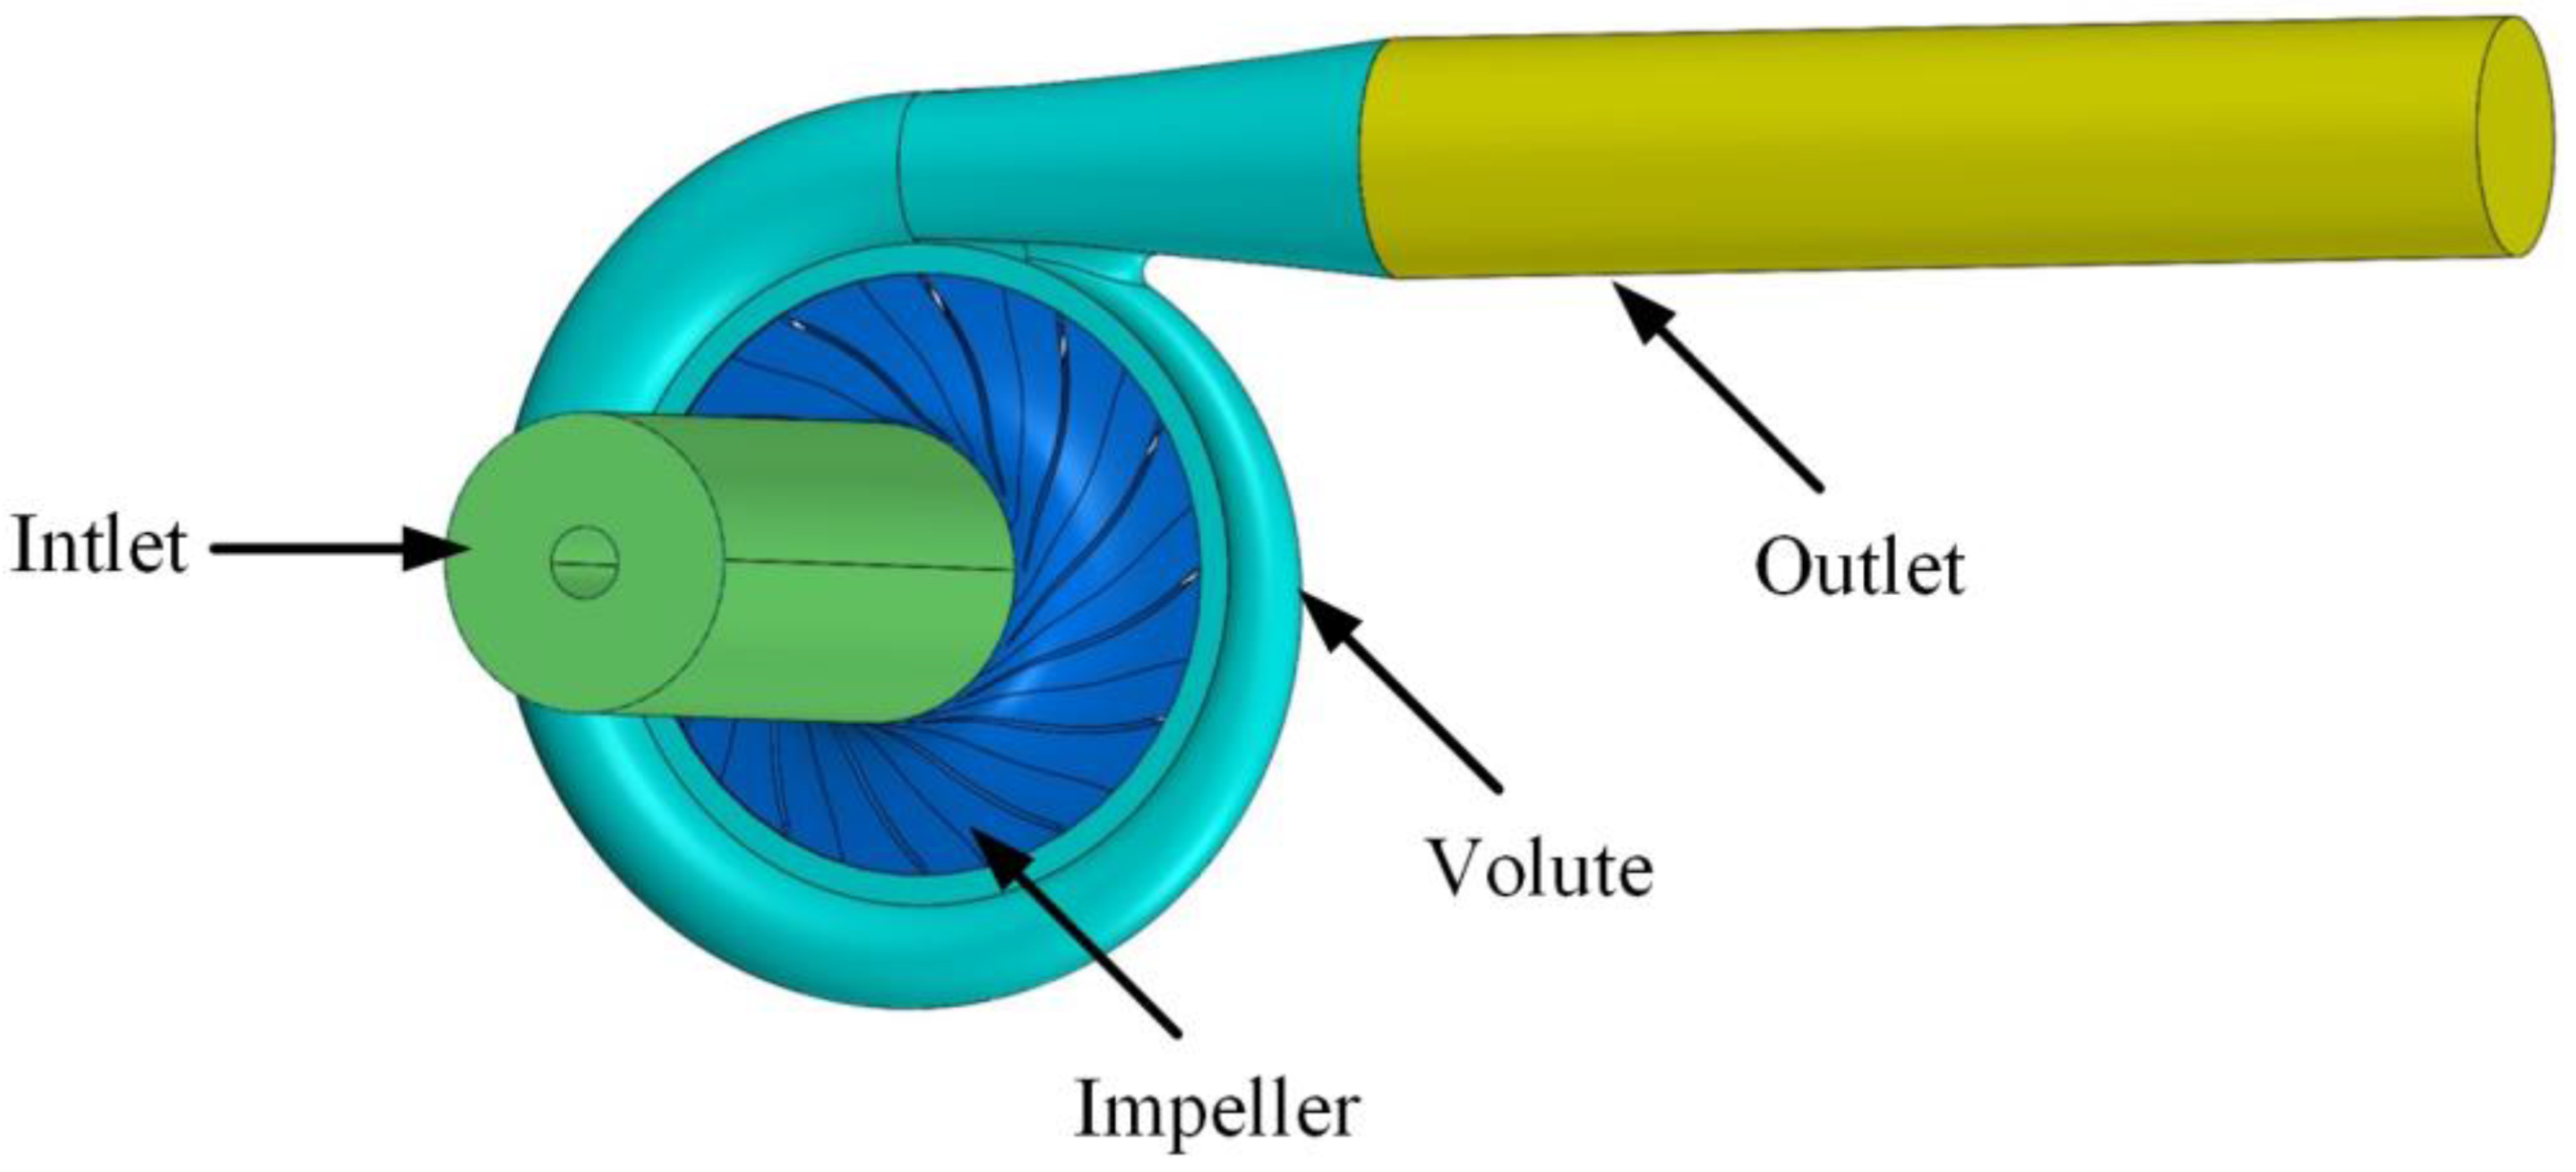
The computational domain consisted of the inlet section, impeller, volute and outlet section. The length of the inlet section was three times that of the impeller inlet diameter, and the length of the outlet section was five times that of the volute outlet diameter. Figure 2 shows the whole computational domain of the centrifugal air compressor.
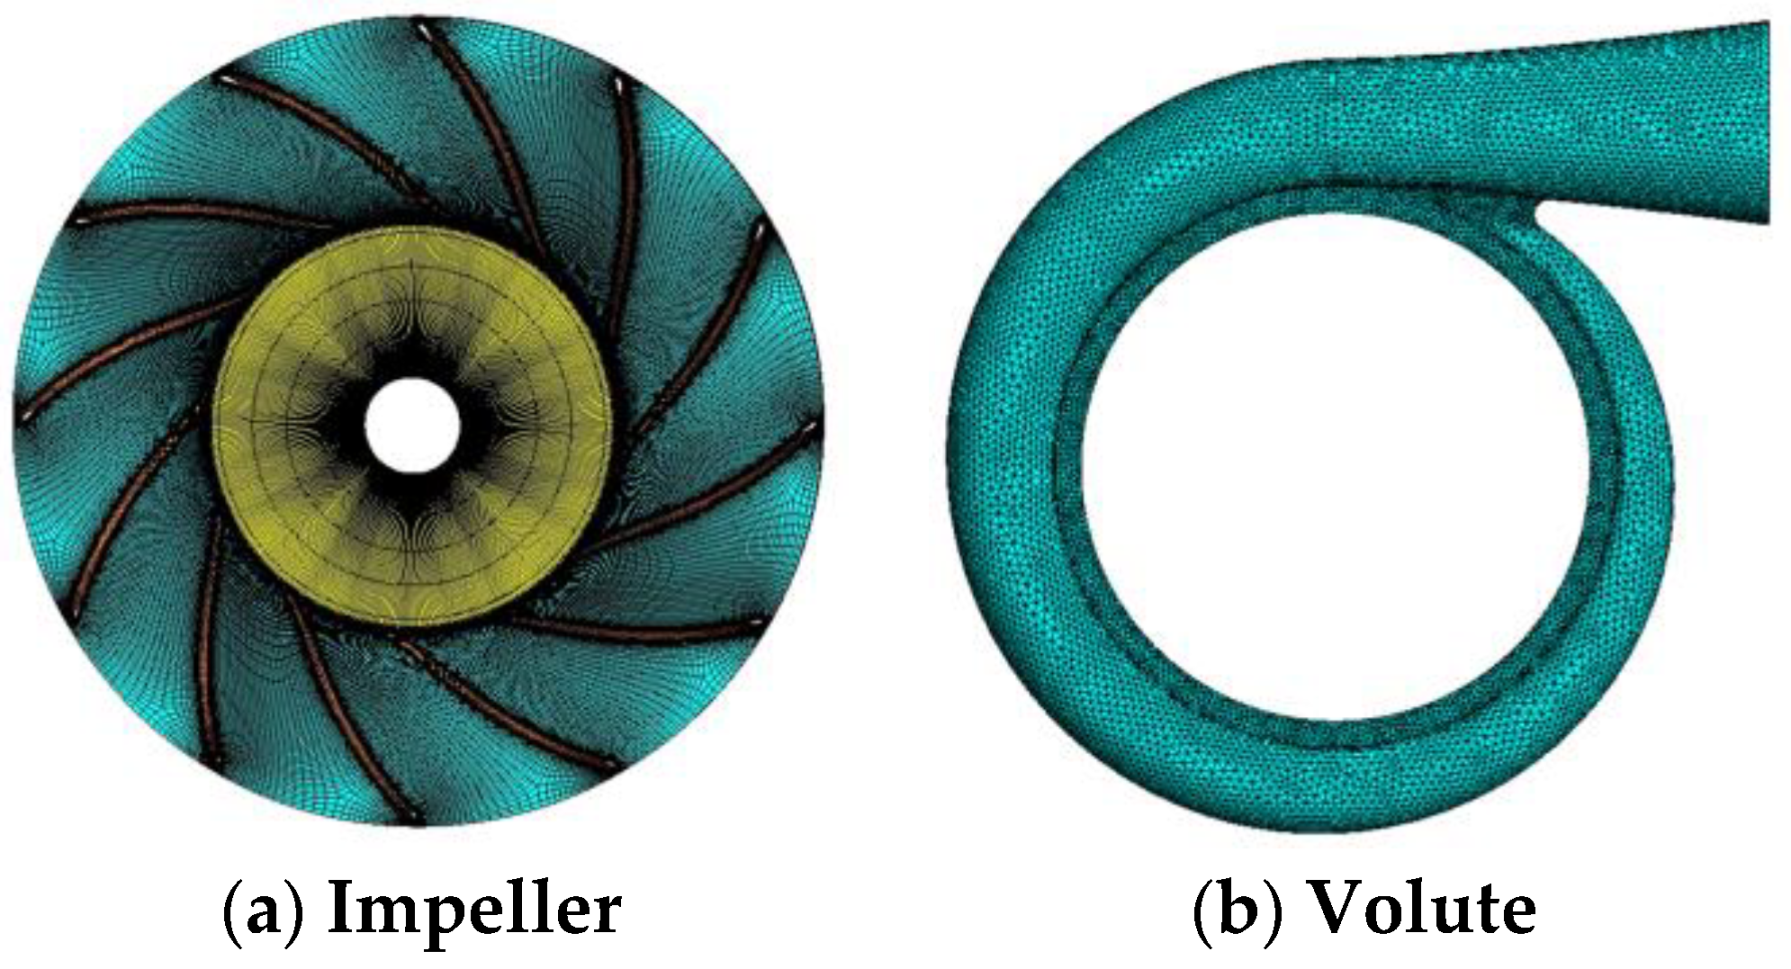
The overall computational domain of the centrifugal compressor was divided by the structured mesh. H-grid structured mesh was generated by ICEM for the inlet domain and the outlet domain. Hexahedral structured mesh was generated by Turbogrid for the impeller domain. Unstructured mesh was generated for the volute. The meshes near the wall were refined to capture the detailed flow structure. The boundary layer was set on the walls of the blade, volute, inlet section and outlet section, and the overall grid quality was above 0.35. The y+ values of the grid were basically within 30, which meets the calculation requirement of the turbulence model in this work. Figure 3 shows the computational mesh of the compressor.
3.2. Grid Independence Verification
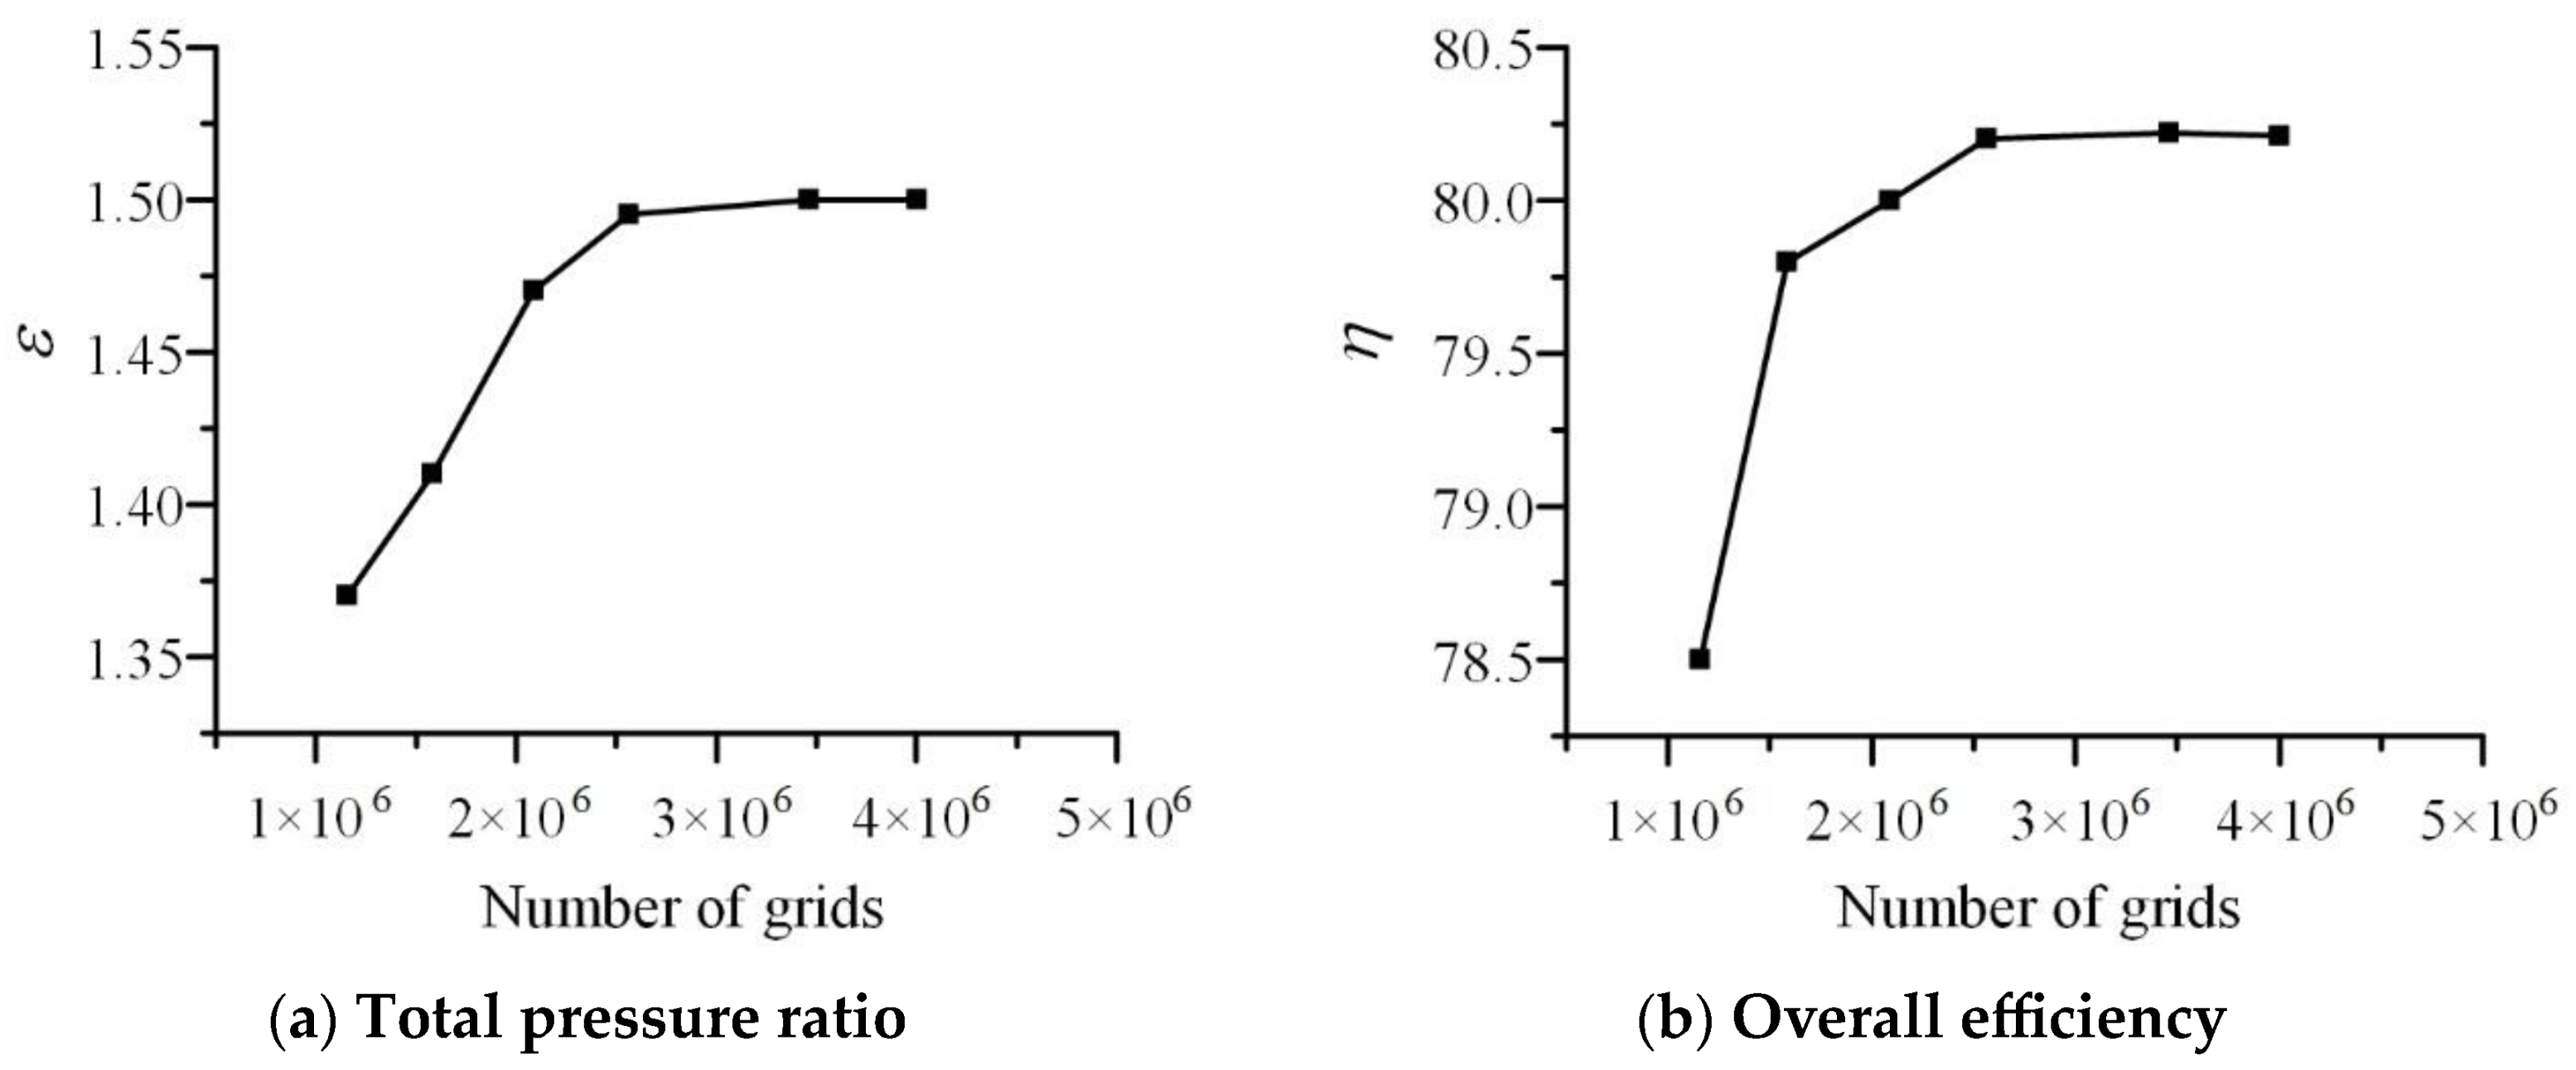
In order to reduce the influence of the number of grids on the numerical results as much as possible, the grid independence of the numerical calculation was verified. By adjusting the grid size, the total pressure ratio and efficiency of centrifugal compressors with different grid numbers were calculated, and the results are shown in Figure 4. It can be seen from Figure 4 that when the total number of grids exceeds 2.5 million, the relative pressure ratio and overall efficiency of the centrifugal compressor did not significantly improve with the increase in the number of grids. Considering the calculation accuracy and time, the total number of grids was controlled at 2.5 million.
3.3. Computational Settings
The flow field of the centrifugal compressor was numerically calculated by CFX. The rotation speed of the impeller basin was set as 50,000 r/min. The pressure ratio of the compressor was relatively small, and the influence of changes in gas physical properties due to gas temperature changes on the simulation can be ignored. Therefore, the fluid medium was set as ideal gas, and the heat transfer model was selected as total energy. The turbulence model was selected as a standard kε model. The inlet boundary condition was set as the pressure inlet and the outlet boundary condition was set as the flow outlet. The dynamic and static interface was selected as the stage interface, and the other walls were set as non-slip.
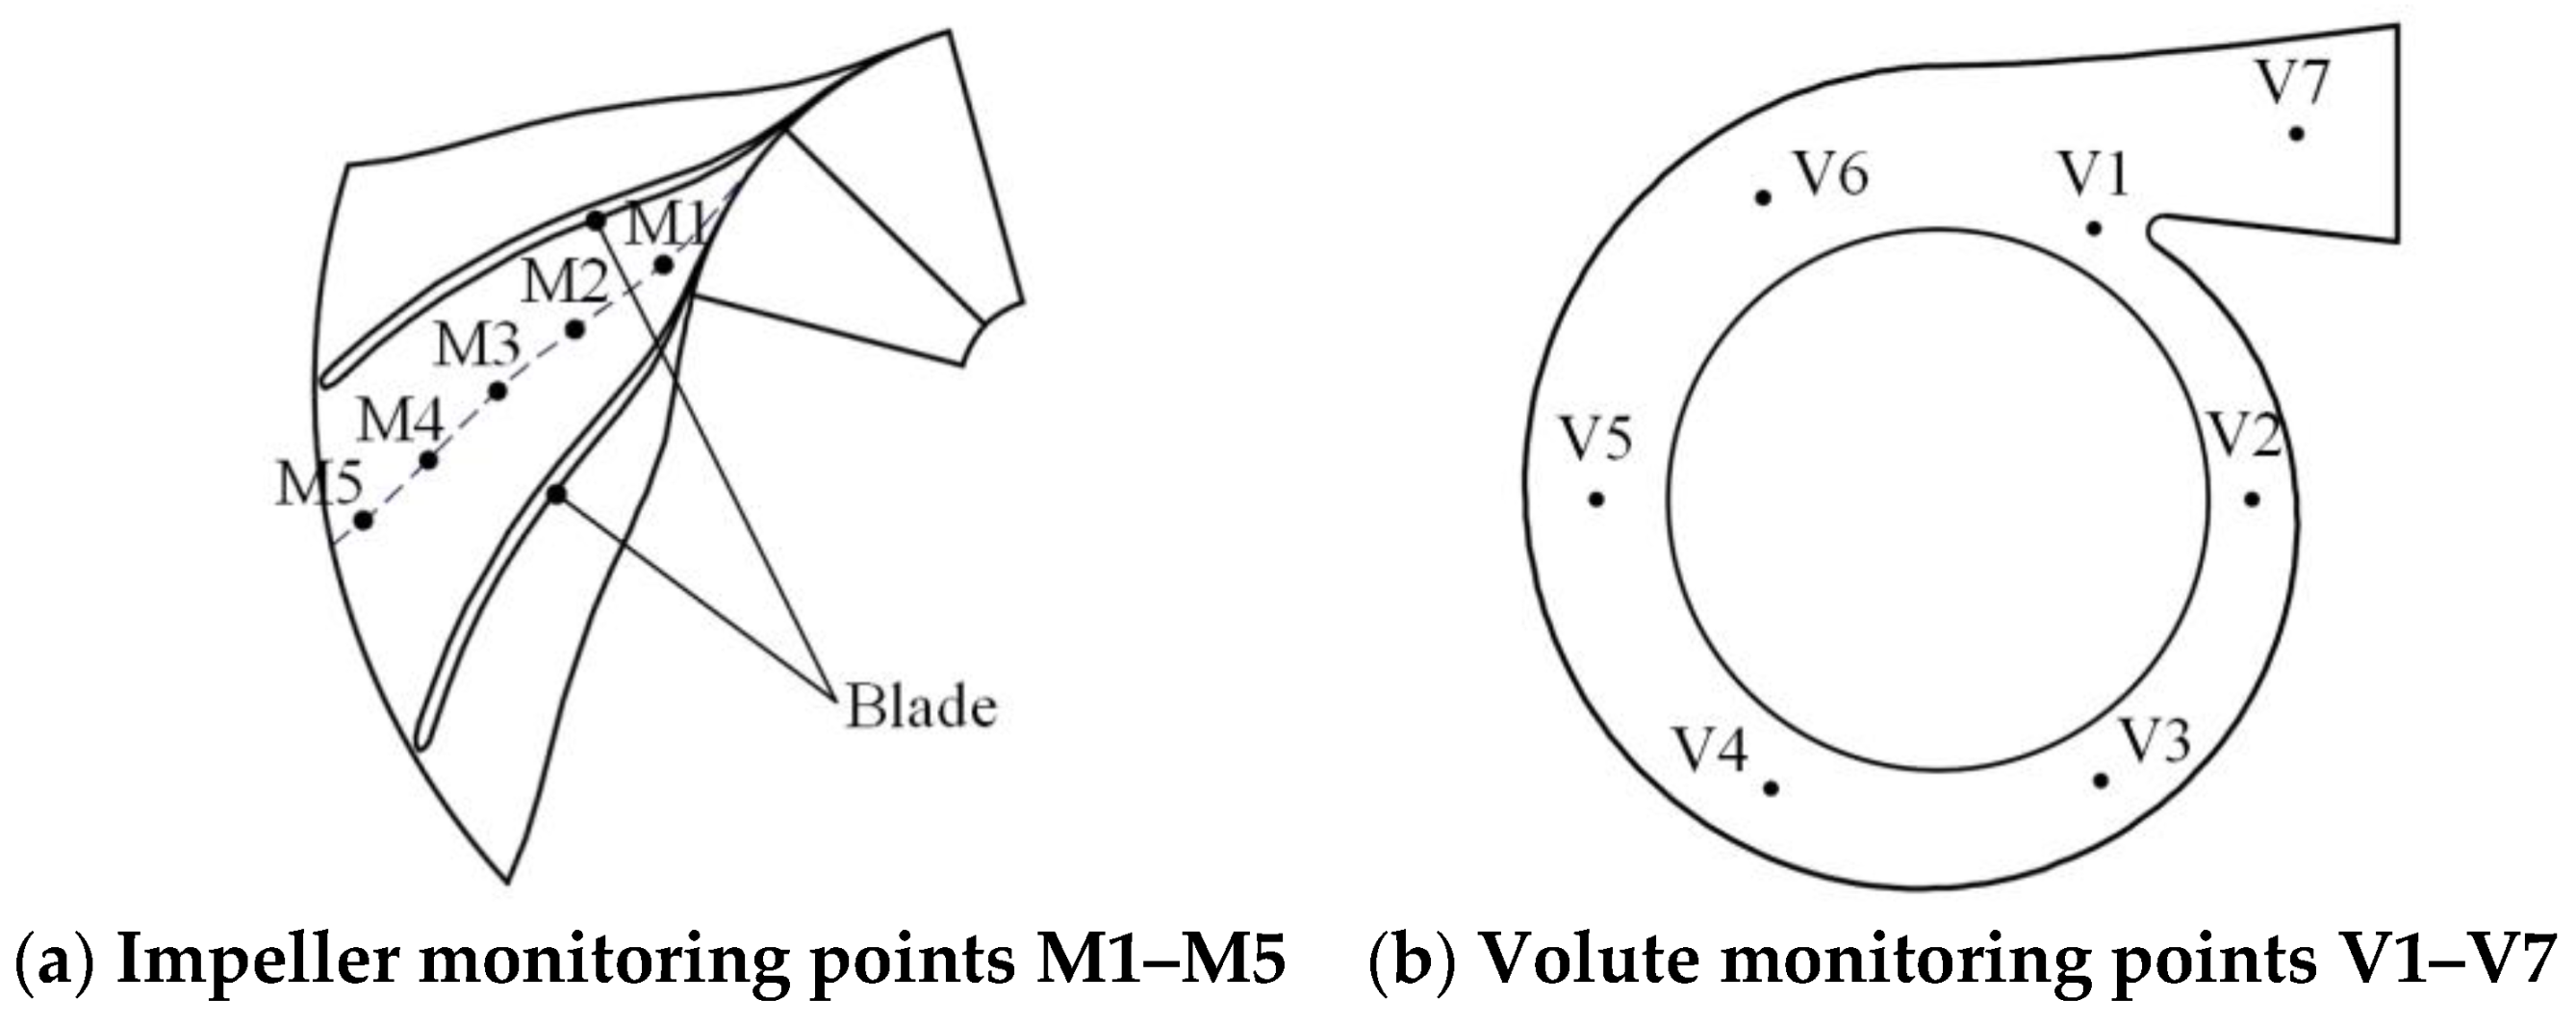
For unsteady calculation, the inlet boundary condition, outlet boundary condition and wall condition were the same as those of the steady calculation. The transient frozen rotor method was selected to deal with the interface between the rotating parts and the stable parts. In order to monitor the pressure fluctuation in the flow field, five and seven monitoring points were set in the impeller and volute, respectively. Figure 5 shows monitoring points in the compressor.
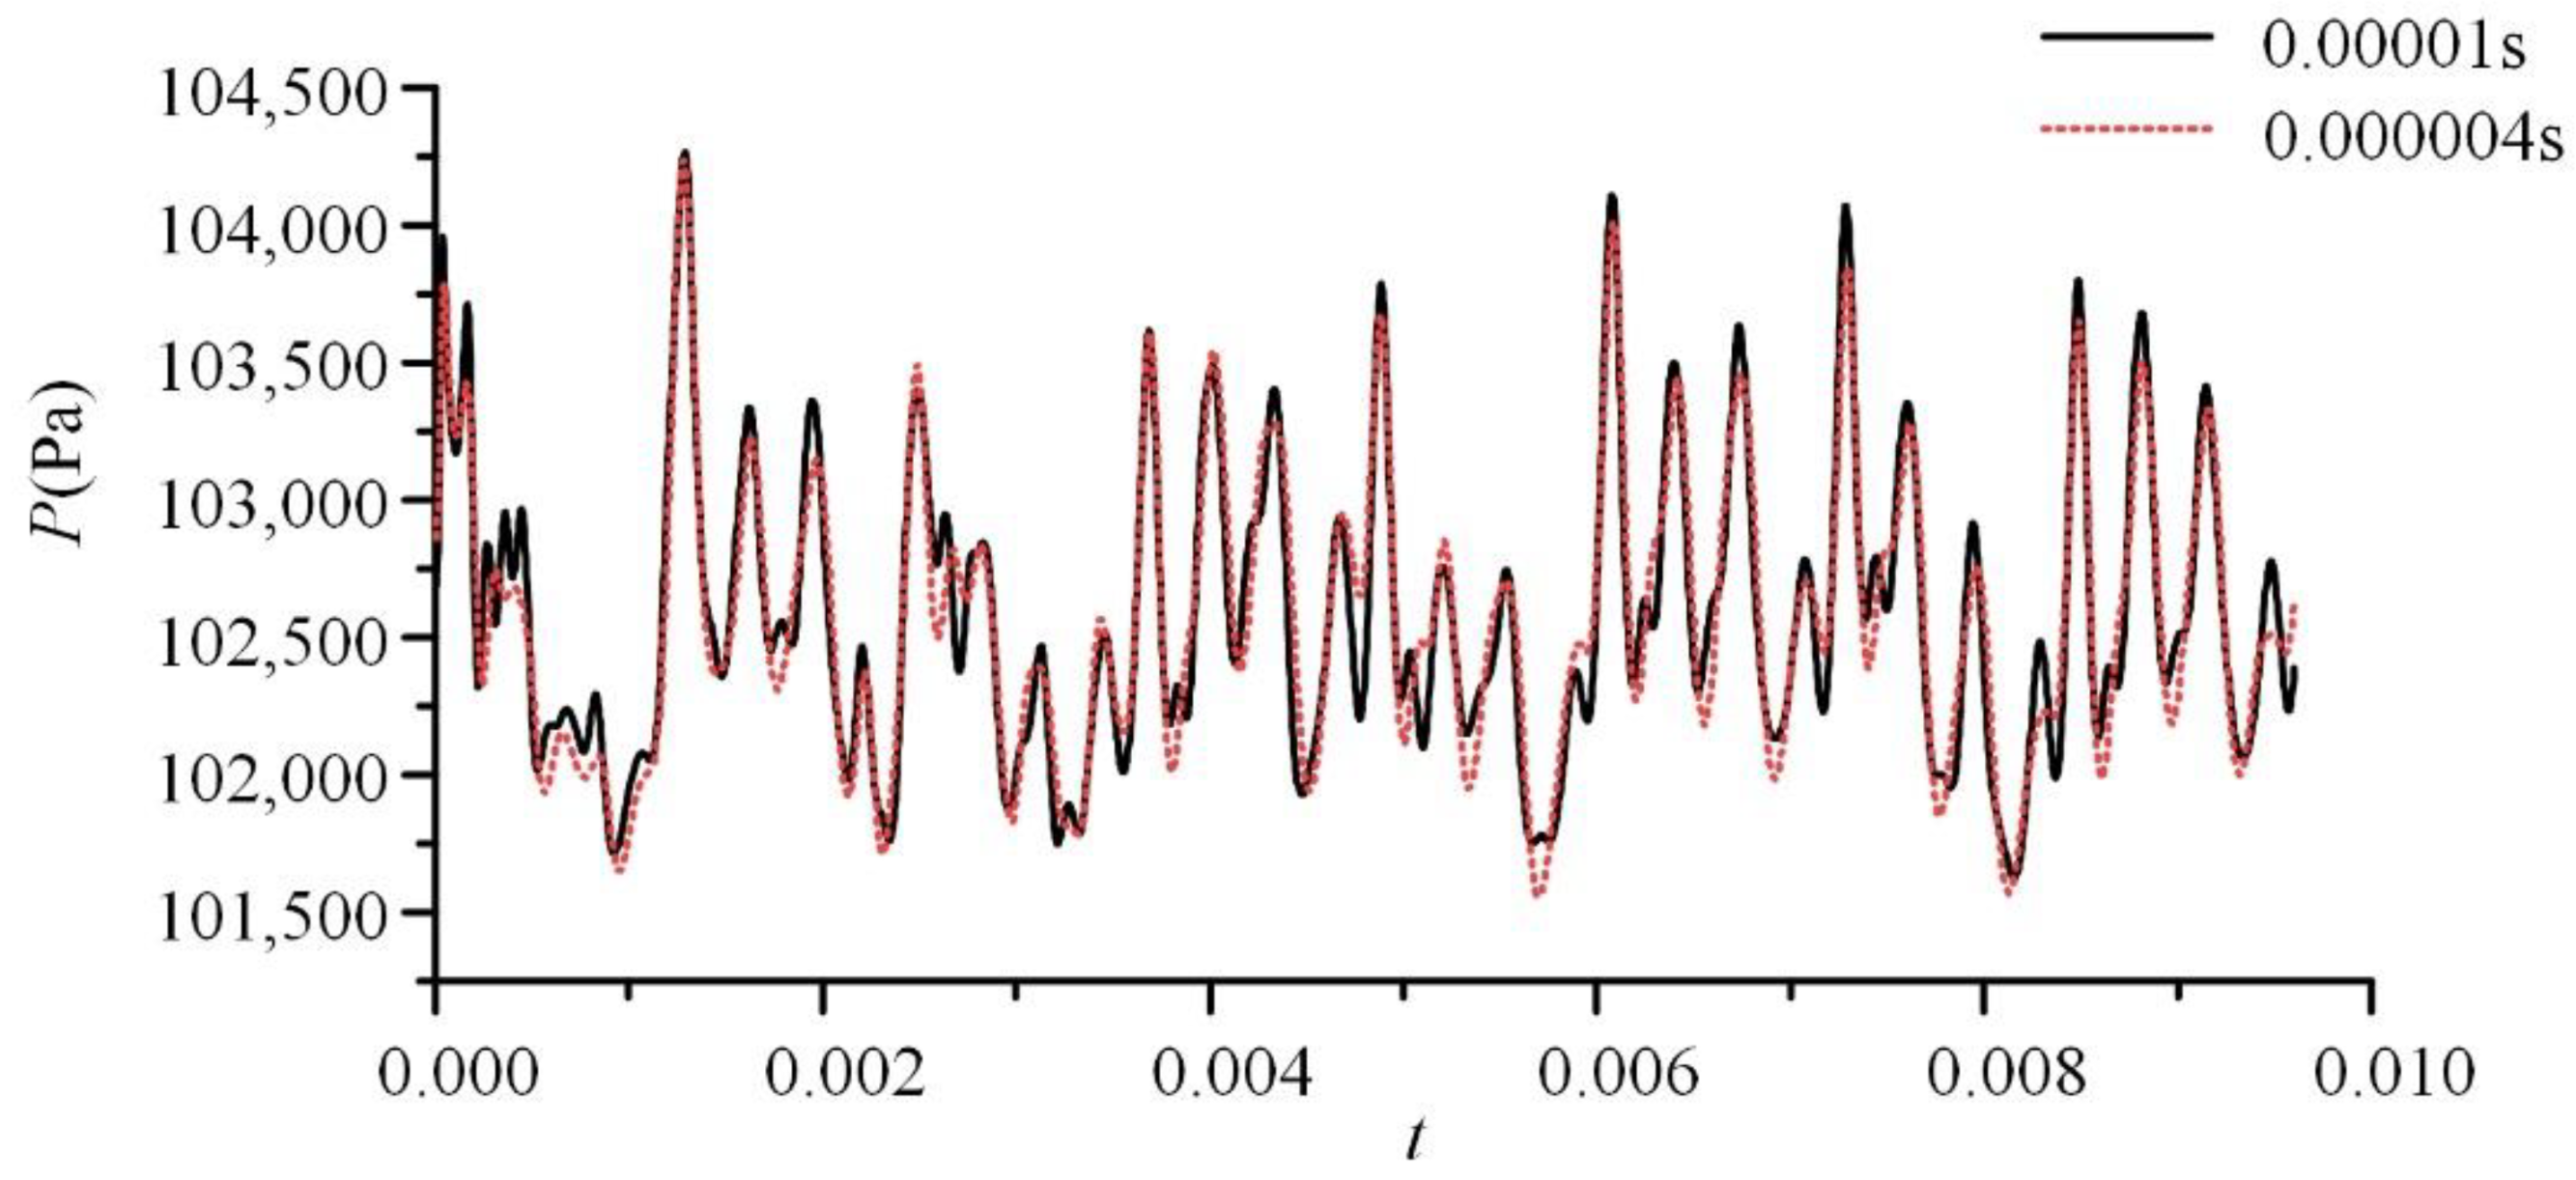
A time step of 0.00001 s was set, a cycle took 0.0012 s, and 8 cycles in total were calculated. Figure 6 shows the change of pressure at M3 point with time through unsteady calculation. The pressure fluctuation was calculated with two different time steps, and the change trend of the two was basically the same. If the calculation interval is too small, the calculation time will be very slow, so we set the calculation interval to 0.00001 s.
3.4. Numerical Simulation Results
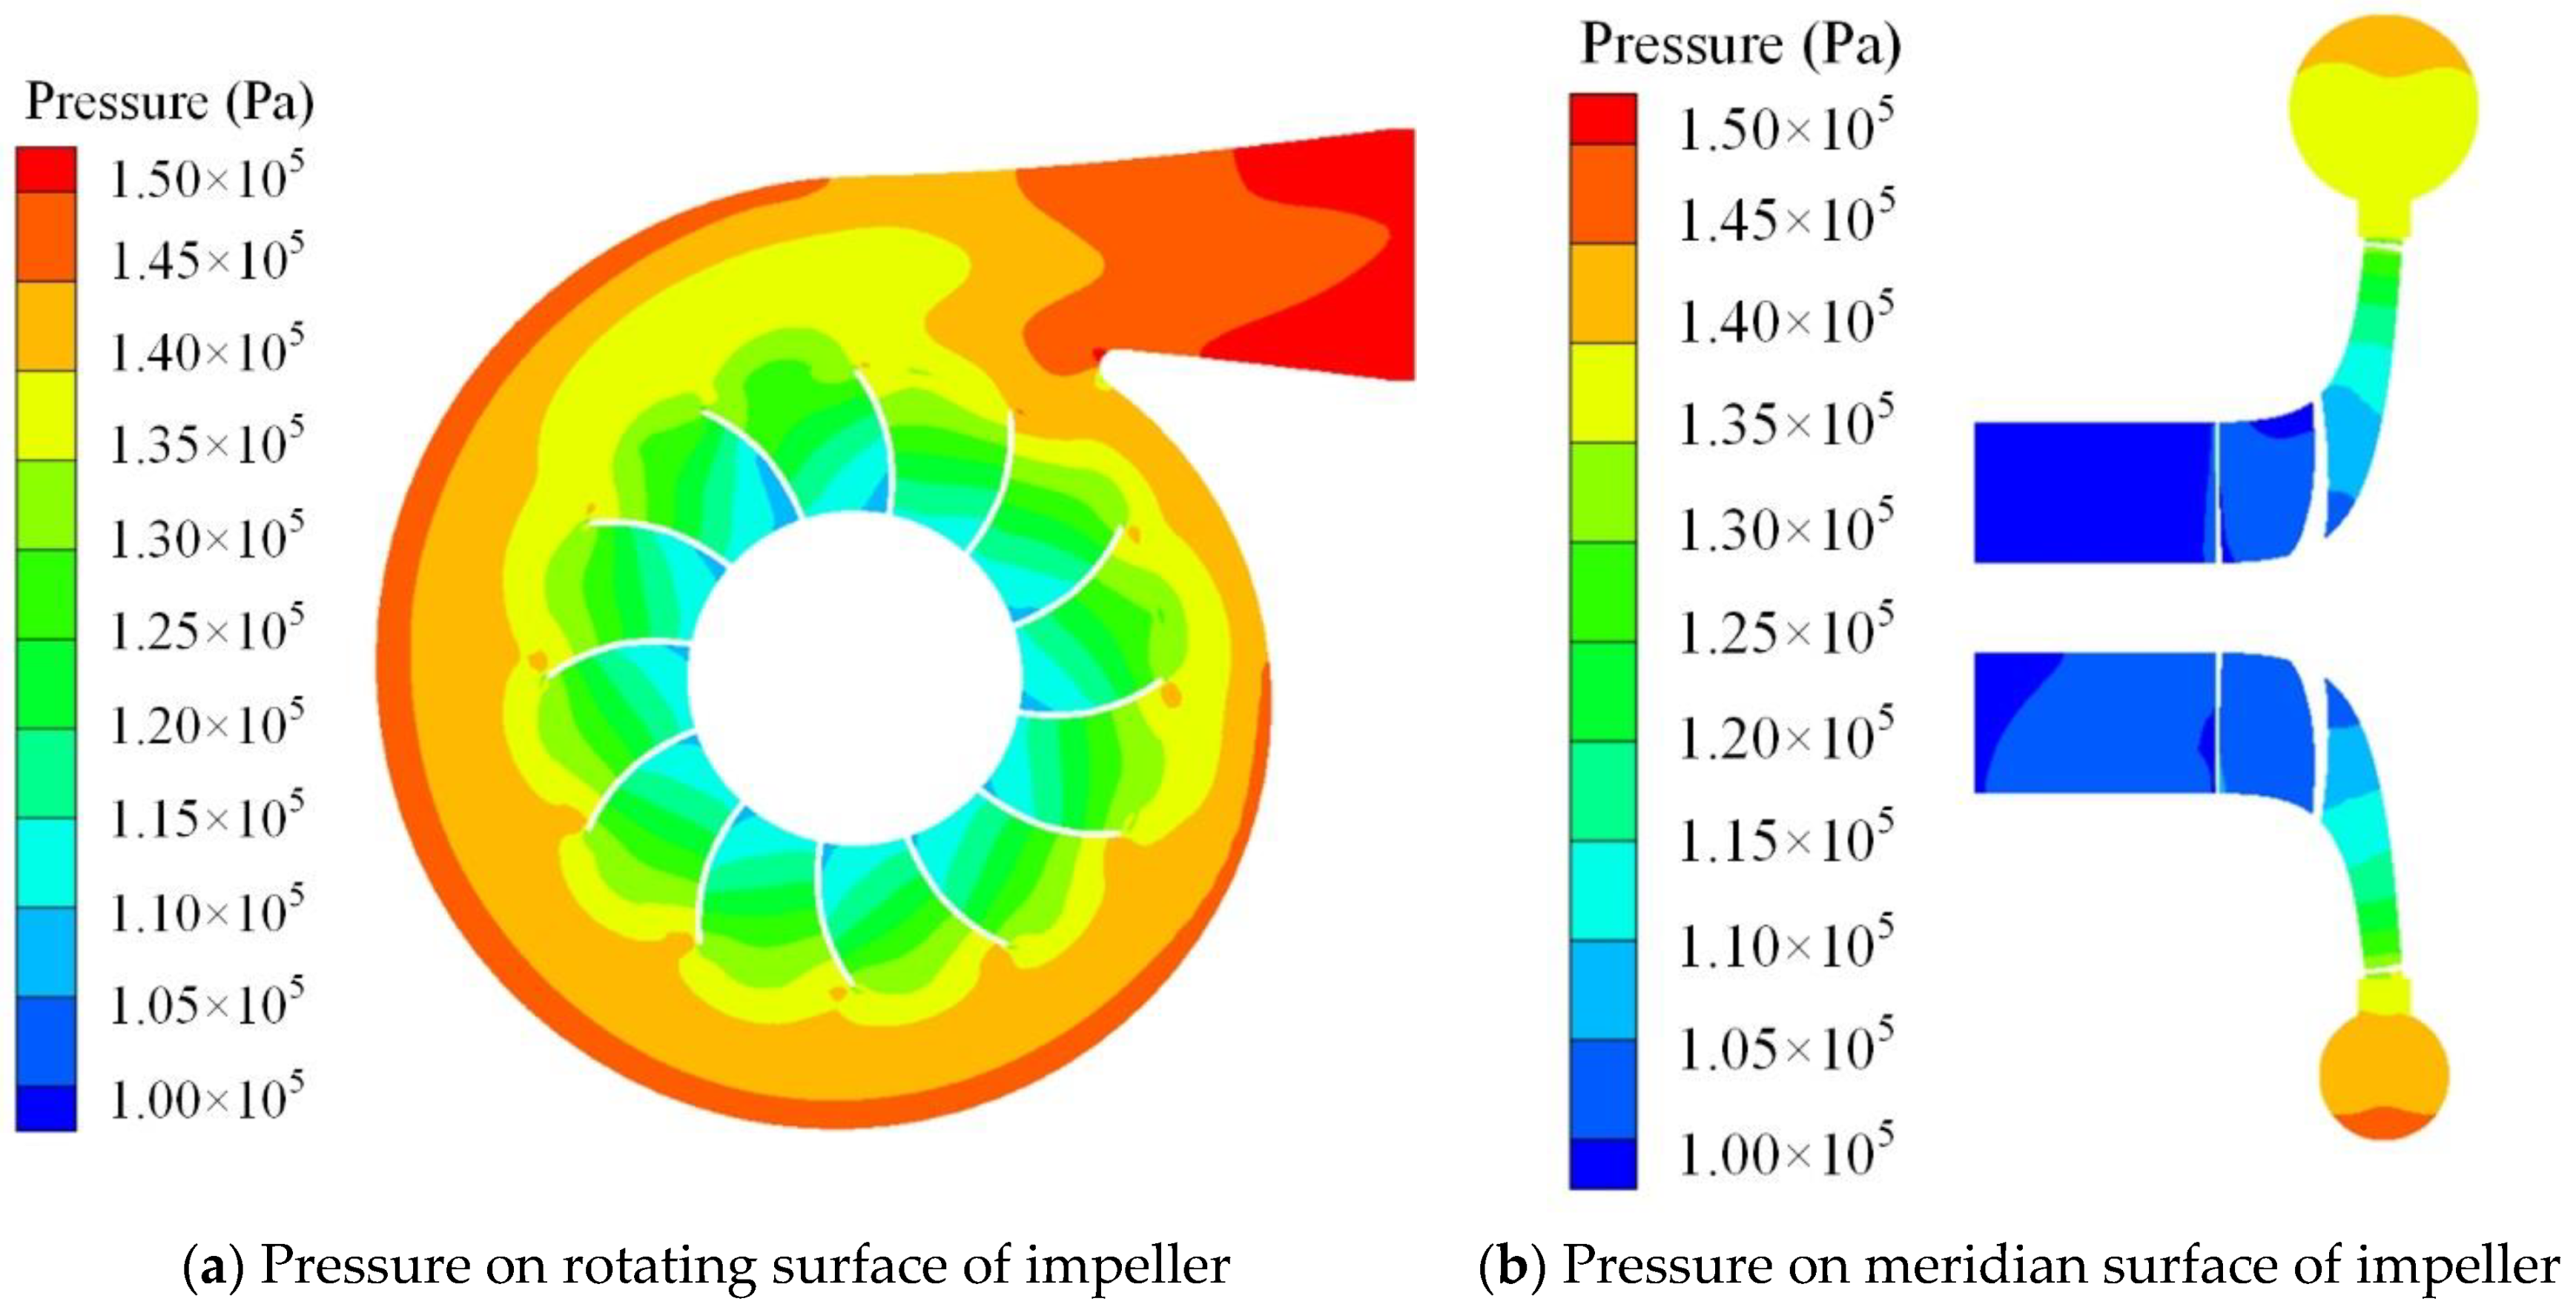
Figure 7a shows the pressure distribution in the impeller at z = 27 mm plane. It can be seen from the figure that the internal pressure in the flow field was approximately radially distributed from the impeller inlet to the outlet, and the maximum pressure appeared at the volute outlet. In the vicinity of the volute tongue, the pressure distribution was relatively complex. The pressure distribution from the volute tongue to the volute outlet was uneven, and a low-pressure zone appeared near the volute tongue. This is because the asymmetric structure of the tongue resulted in the stator-rotor interaction. Figure 7b shows the pressure distribution at the meridian surface of the compressor. From the impeller inlet to the volute, the pressure gradually increased, and the pressure gradient was relatively even.
3.5. Experiment Measurement
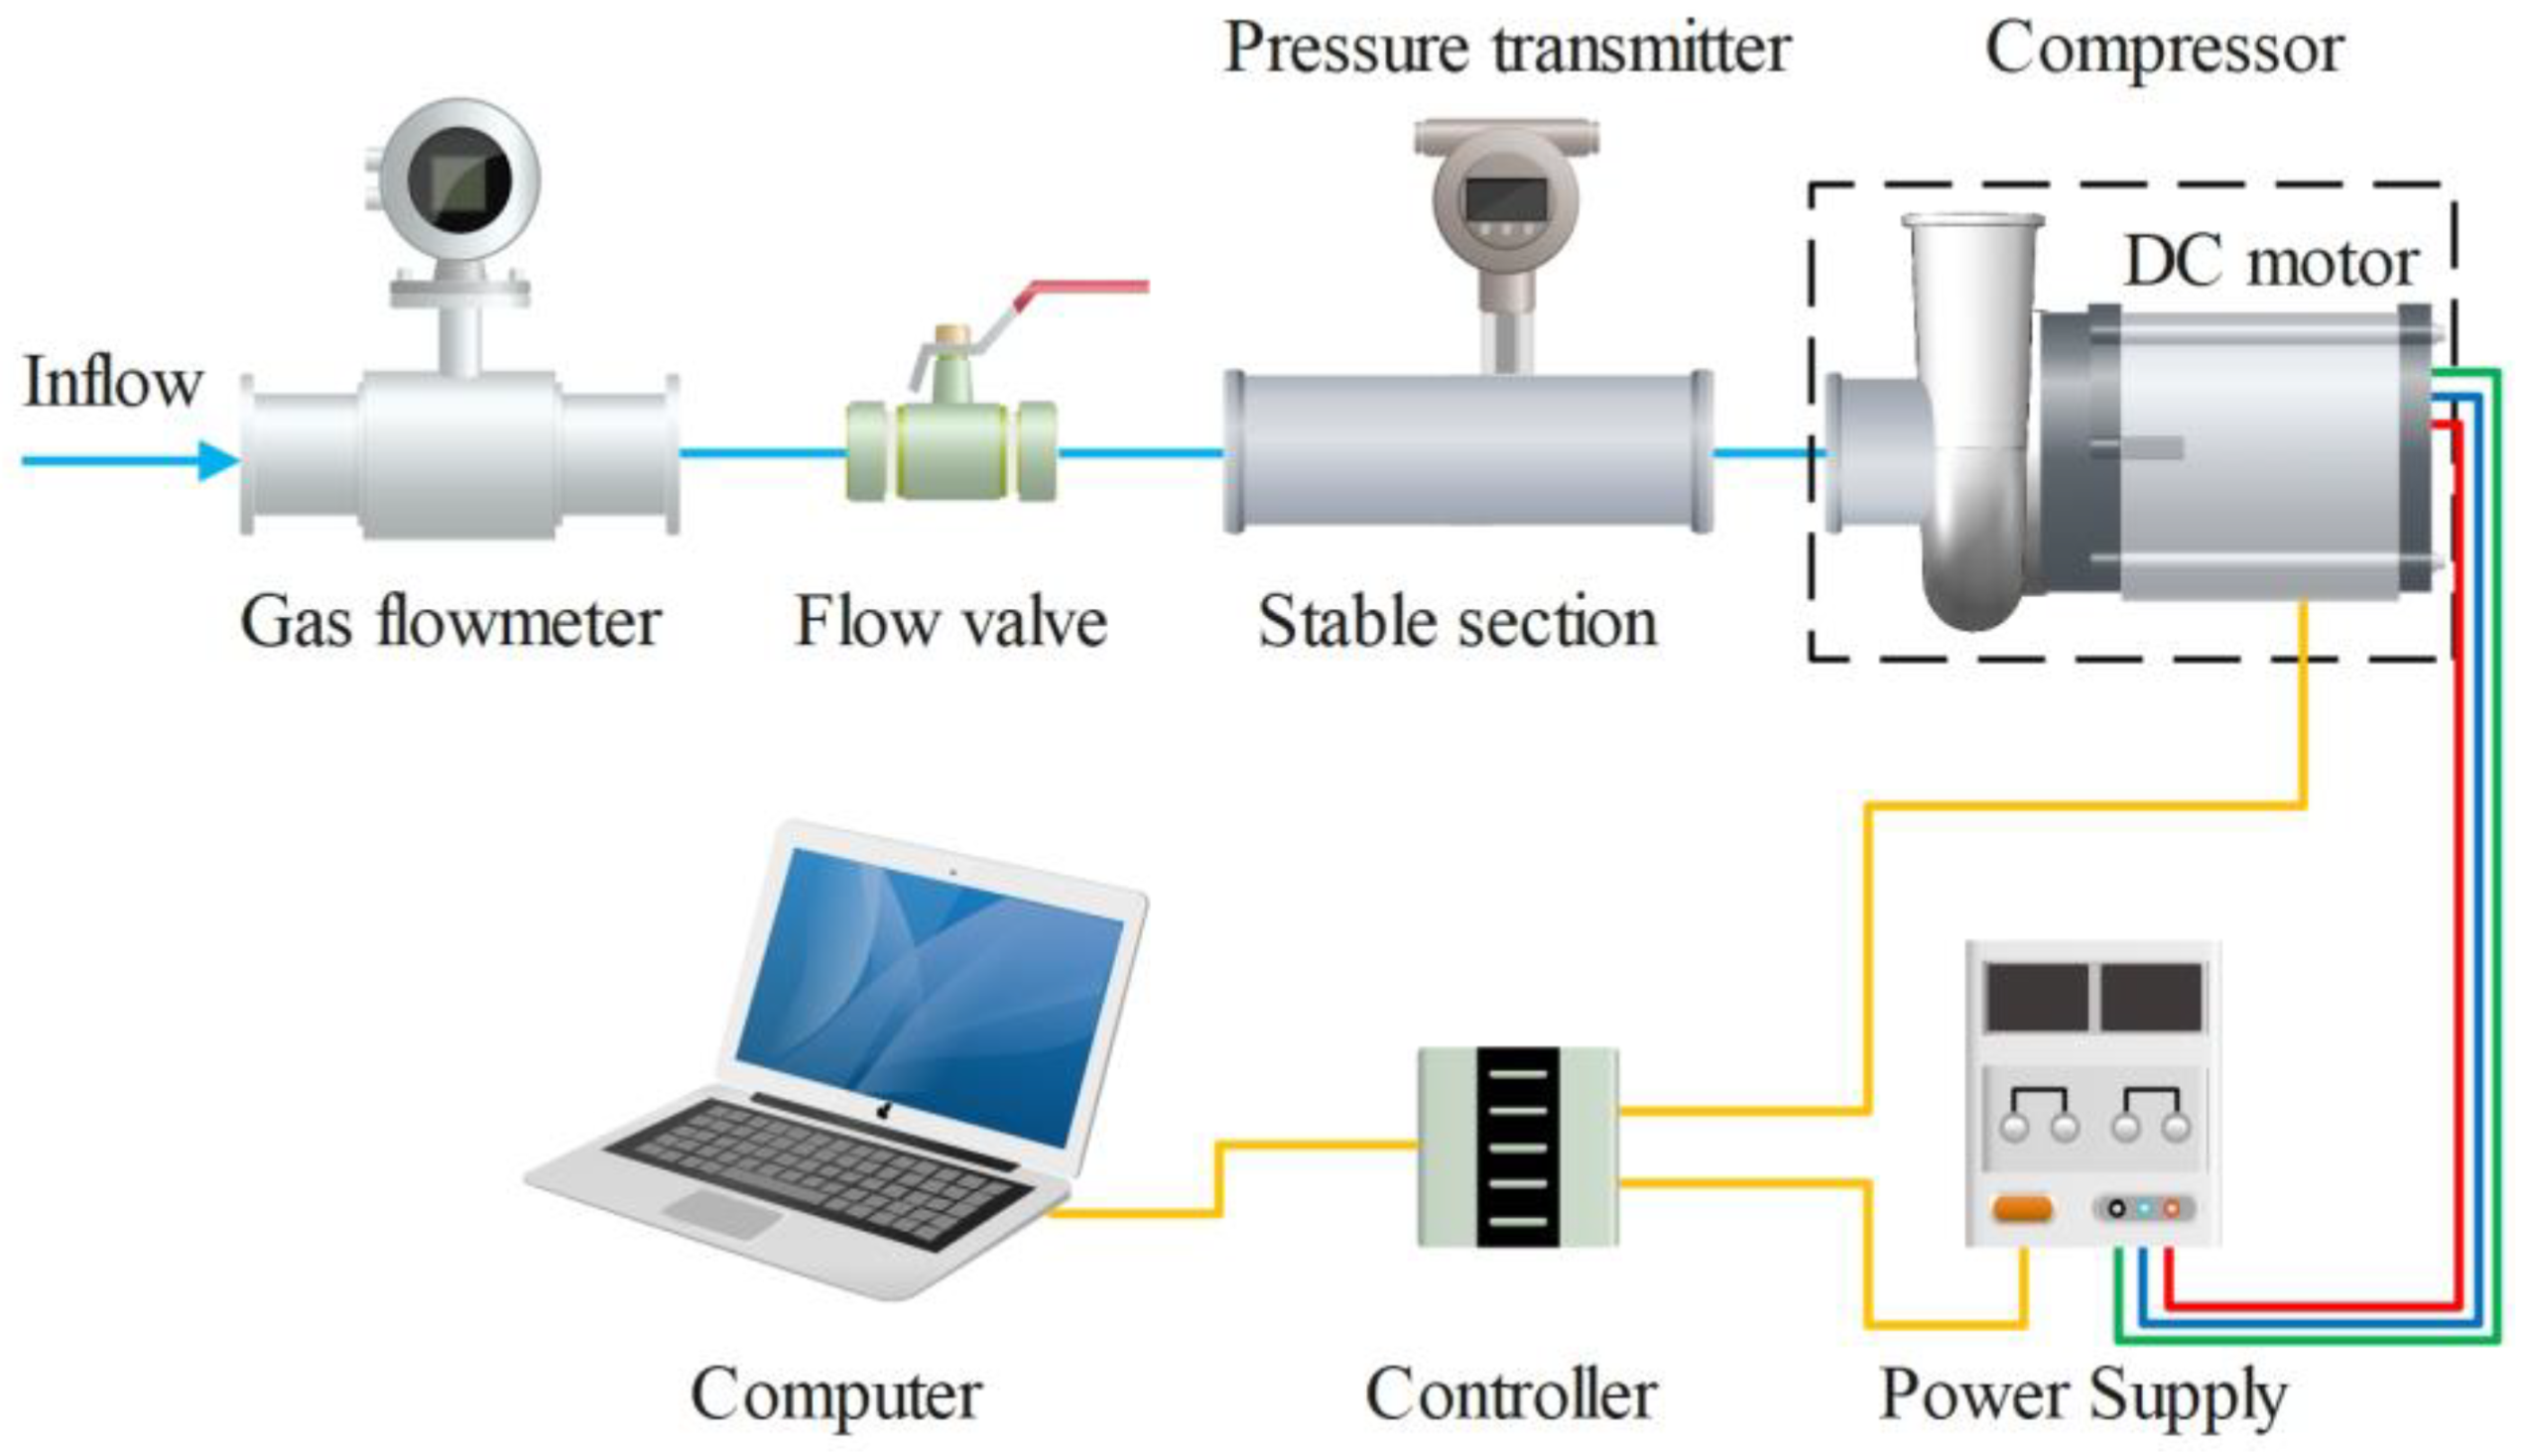
In order to verify the accuracy of the numerical simulation, a test rig for aerodynamic performance measurement was established. Figure 8 shows the schematic diagram of the test apparatus, which consisted of an air supply section and a compressor section. The air supply section included a pipeline, gas flowmeter, flow regulating valve and pressure transmitter. The compressor section included the centrifugal compressor, a controller, a DC power supply and a computer.
The flow of the centrifugal compressor was measured by a gas flowmeter, with a range of 0–450 m3/h and an accuracy of 1.5%. The flowmeter was installed horizontally in the inlet pipe of the compressor, and the length of straight pipe section before and after was greater than 5 times the pipe diameter. The pressure difference between the inlet and outlet of the centrifugal compressor was measured by the pressure transmitter on the inlet air pipe. The pressure transmitter had a range of −10–0 kPa and an accuracy of 0.5%. The speed of the centrifugal compressor was controlled by a computer program, with a speed range of 0–18,000 rpm and an accuracy of 1%. Through the above configuration, the energy performance of the centrifugal compressor could be measured.
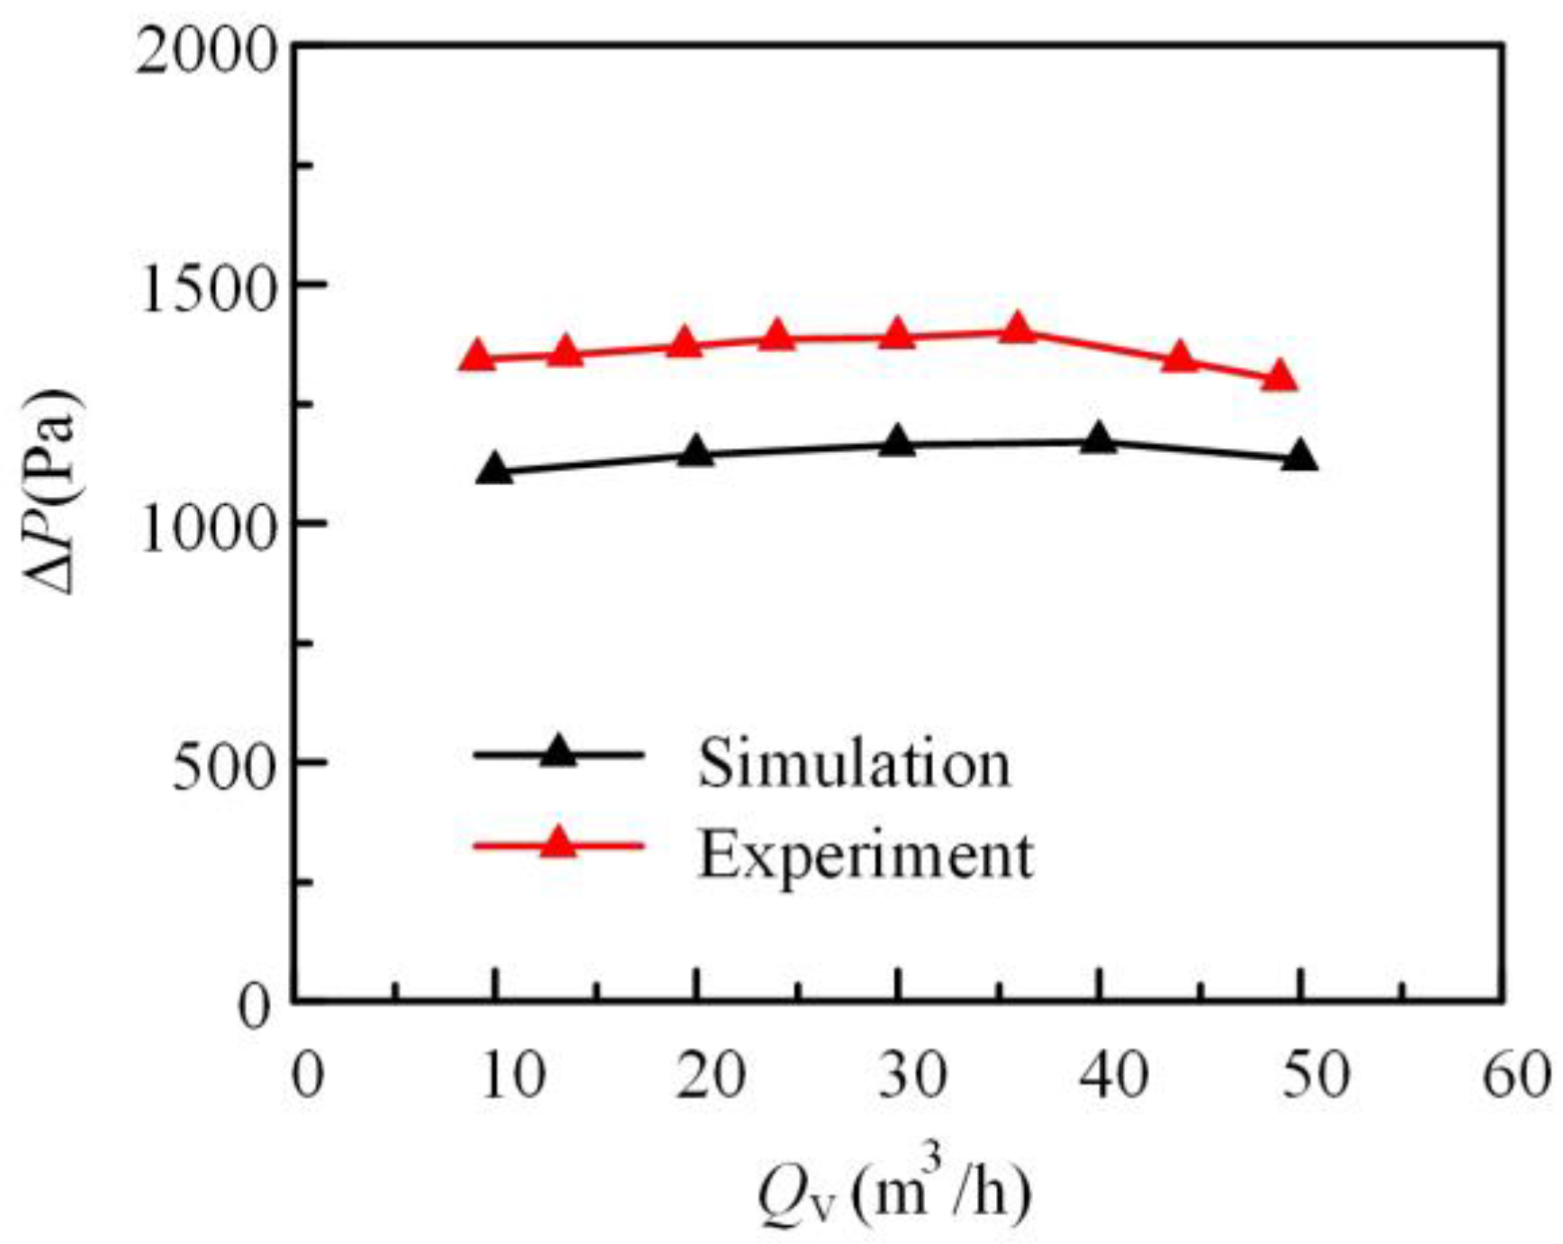
The test speed was kept at 8000 r/min, and the test results were compared with the simulation results at the same speed. The test results and simulation results are shown in Figure 9. It can be seen that the overall change of the test results and simulation results was basically the same, and the test value was slightly higher than the simulation value. As the flow rate increased, the test value decreased significantly. In general, the simulation value was basically consistent with the test value, which indicates that the numerical calculation can reflect the actual flow inside the centrifugal compressor.
4. Orthogonal Optimization and Pressure Fluctuation
4.1. Multiple Parameter Optimization
The impeller is a crucial component of the centrifugal compressor and is the only work component in the compressor. Whether the impeller structure is reasonable directly affects the working performance of the whole machine [29,30]. In this section, multi-parameter optimization design [31,32] will be carried out for the impeller structure to improve the aerodynamic performance of the centrifugal air compressor.
The efficiency of the centrifugal compressor was set as the optimization objective; four parameters—namely, the blade number, the blade angle at the inlet, the blade angle at the outlet and the blade wrap angle—were selected as the optimization parameters. The initial selections of the number of blades, inlet blade angle, outlet blade angle and wrap angle were 12, 50°, 60° and 50°, respectively.
The orthogonal method was adopted to conduct the optimization design according to the standard orthogonal test table L9 (34), in which three levels are set for each parameter. According to our research experience, the regions of blade number, blade angle at inlet, blade angle at outlet and wrap angle were set as 9–15, 40–60, 45–75 and 40–60, respectively. Table 3 shows the orthogonal parameter and level. A, B, C and D represent four factors, and 1, 2 and 3 represent three levels.
According to the orthogonal table, nine individuals were determined and then nine compressors were designed, meshed and simulated. Table 4 shows the details of parameter, pressure ratio and efficiency of the compressor. The minimum and maximum pressure ratios are 1.435 and 1.58, respectively. The minimum and maximum efficiencies are 77.74% and 83.12%, respectively.
In the orthogonal method, in order to evaluate the influence of every specific parameter, the average value k of pressure ratio is defined as follows:
where i is the level of the parameter, n is the individual number of the corresponding parameter at level i and εj is the pressure ratio of tested compressors with level i. The average value of efficiency is defined as the same formula.
Range R describes the influence weight of each parameter, and can be defined as follows:
Table 5 shows the range analysis for compressor efficiency. According to Table 5, the number of blades had the greatest impact on the efficiency of the centrifugal compressor, followed by the blade angle at the inlet. The blade angle at the outlet and the blade wrap angle also had an impact on the efficiency, but the impact was relatively weak. According to the analysis results, A3B1C1D3 was selected as the optimal result to design the finial optimal impeller of the compressor.
Table 6 shows the comparison of structural parameters between the baseline impeller and the optimized impeller.
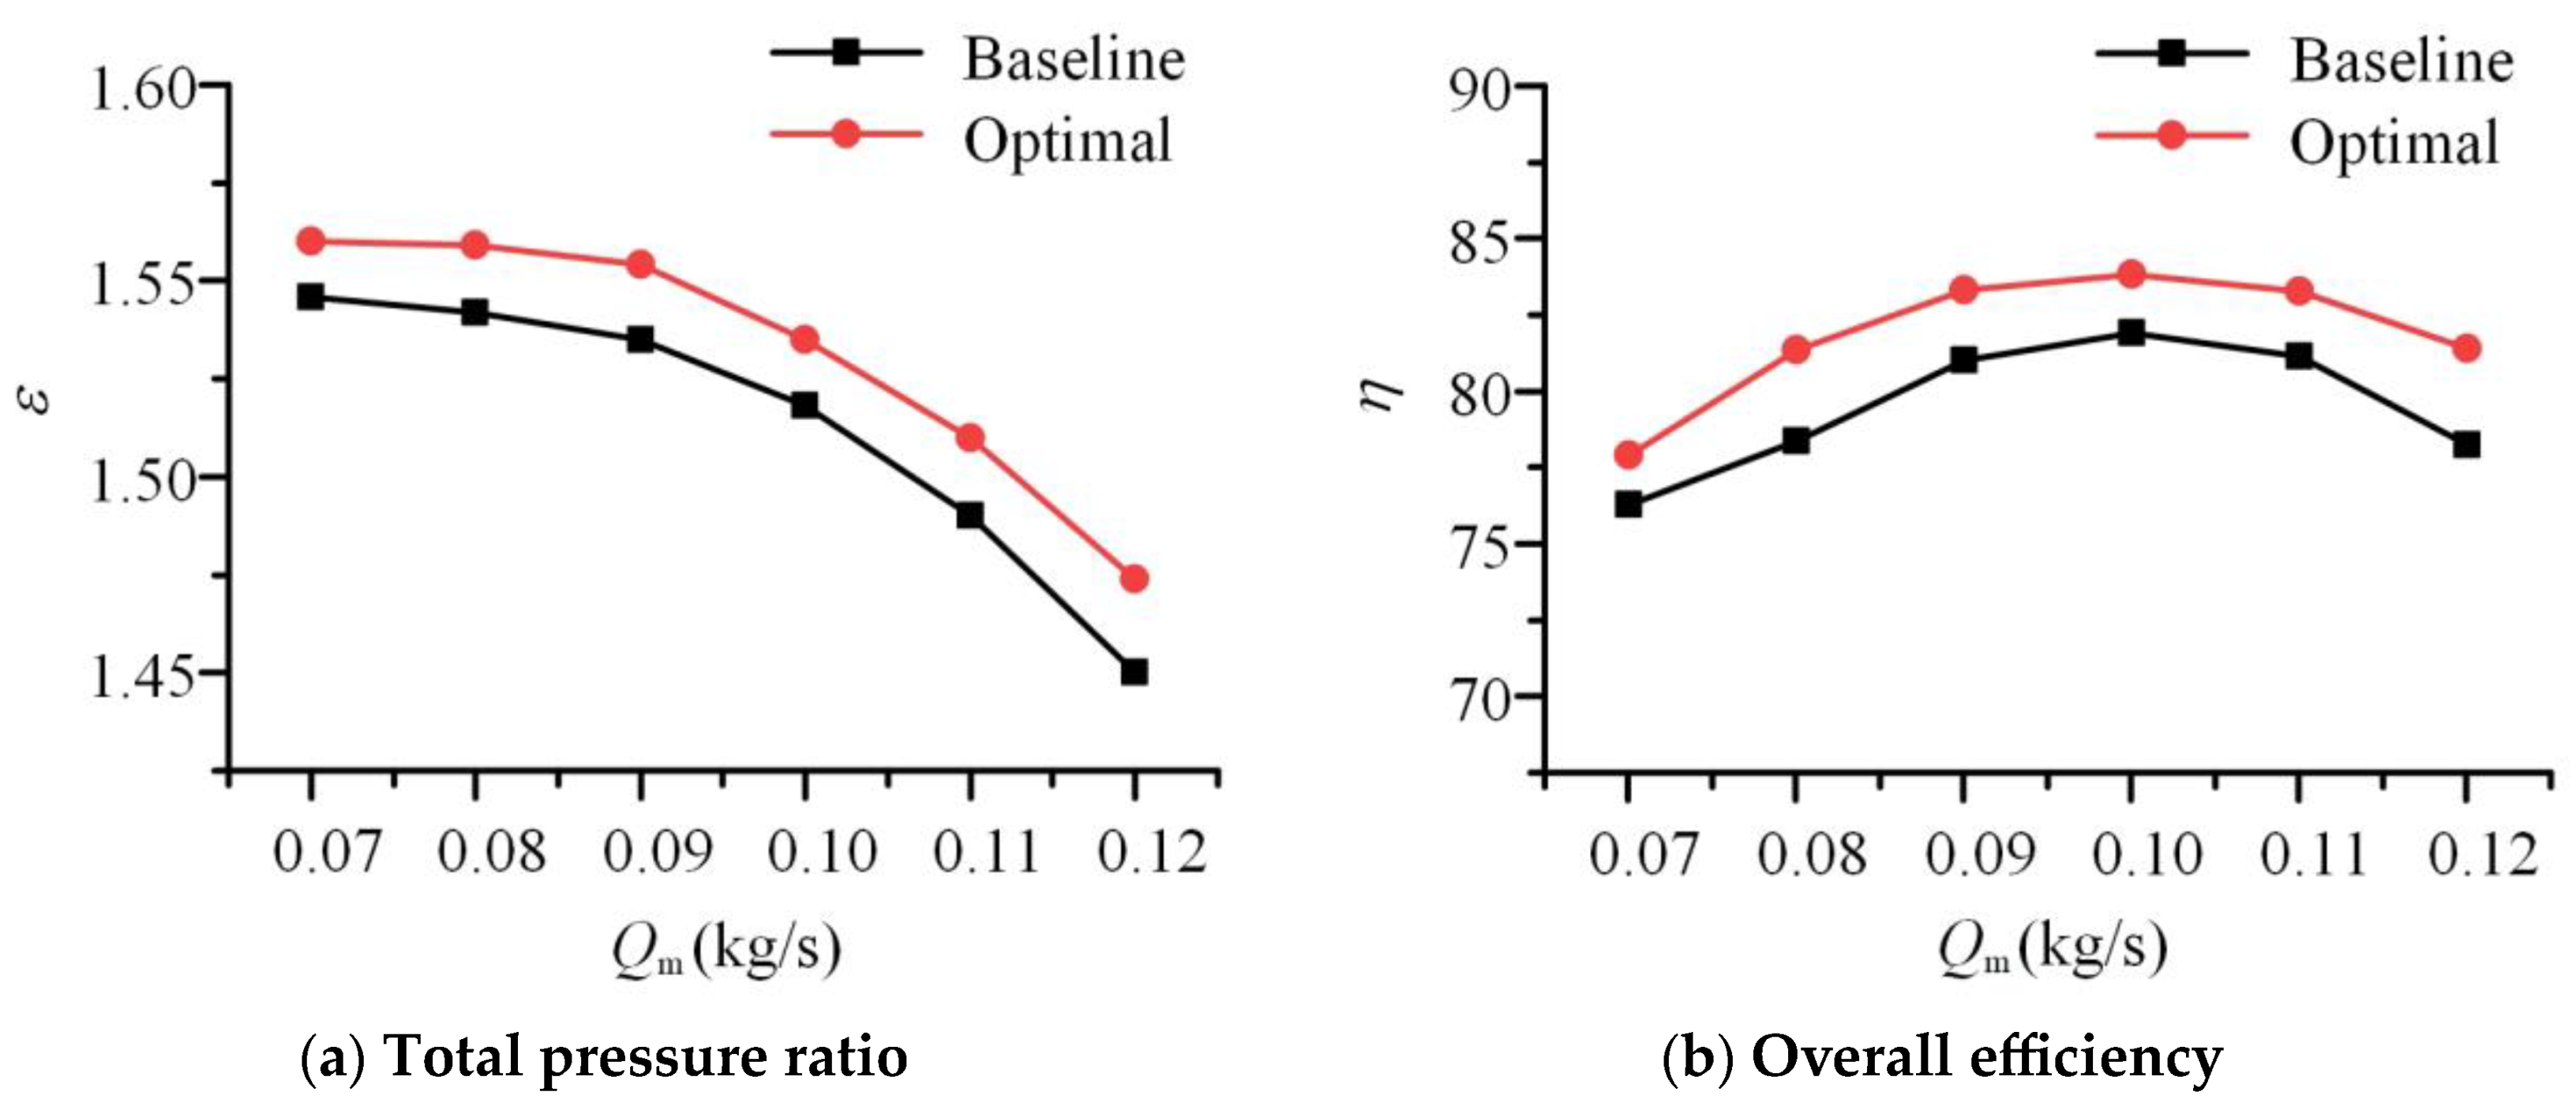
Figure 10 shows the comparison of external characteristic curves of the baseline compressor and the optimal compressor. It can be seen from the figure that the change trend of external characteristics was basically the same for the baseline compressor and the optimal compressor, and the external characteristics of the optimal centrifugal compressor were significantly better than those of the baseline. Compared with the baseline, the pressure ratio and efficiency of the optimal compressor were improved, which indicates that the optimal blade geometry and flow field were more reasonable. At a design flow rate of 0.1 kg/s, the pressure ratios of the baseline compressor and the optimal compressor were 1.518 and 1.535, respectively, improving by 1.12%. Additionally, the efficiencies of the baseline compressor and the optimal compressor were 81.3% and 83.8%, respectively, improving by 2.50%.
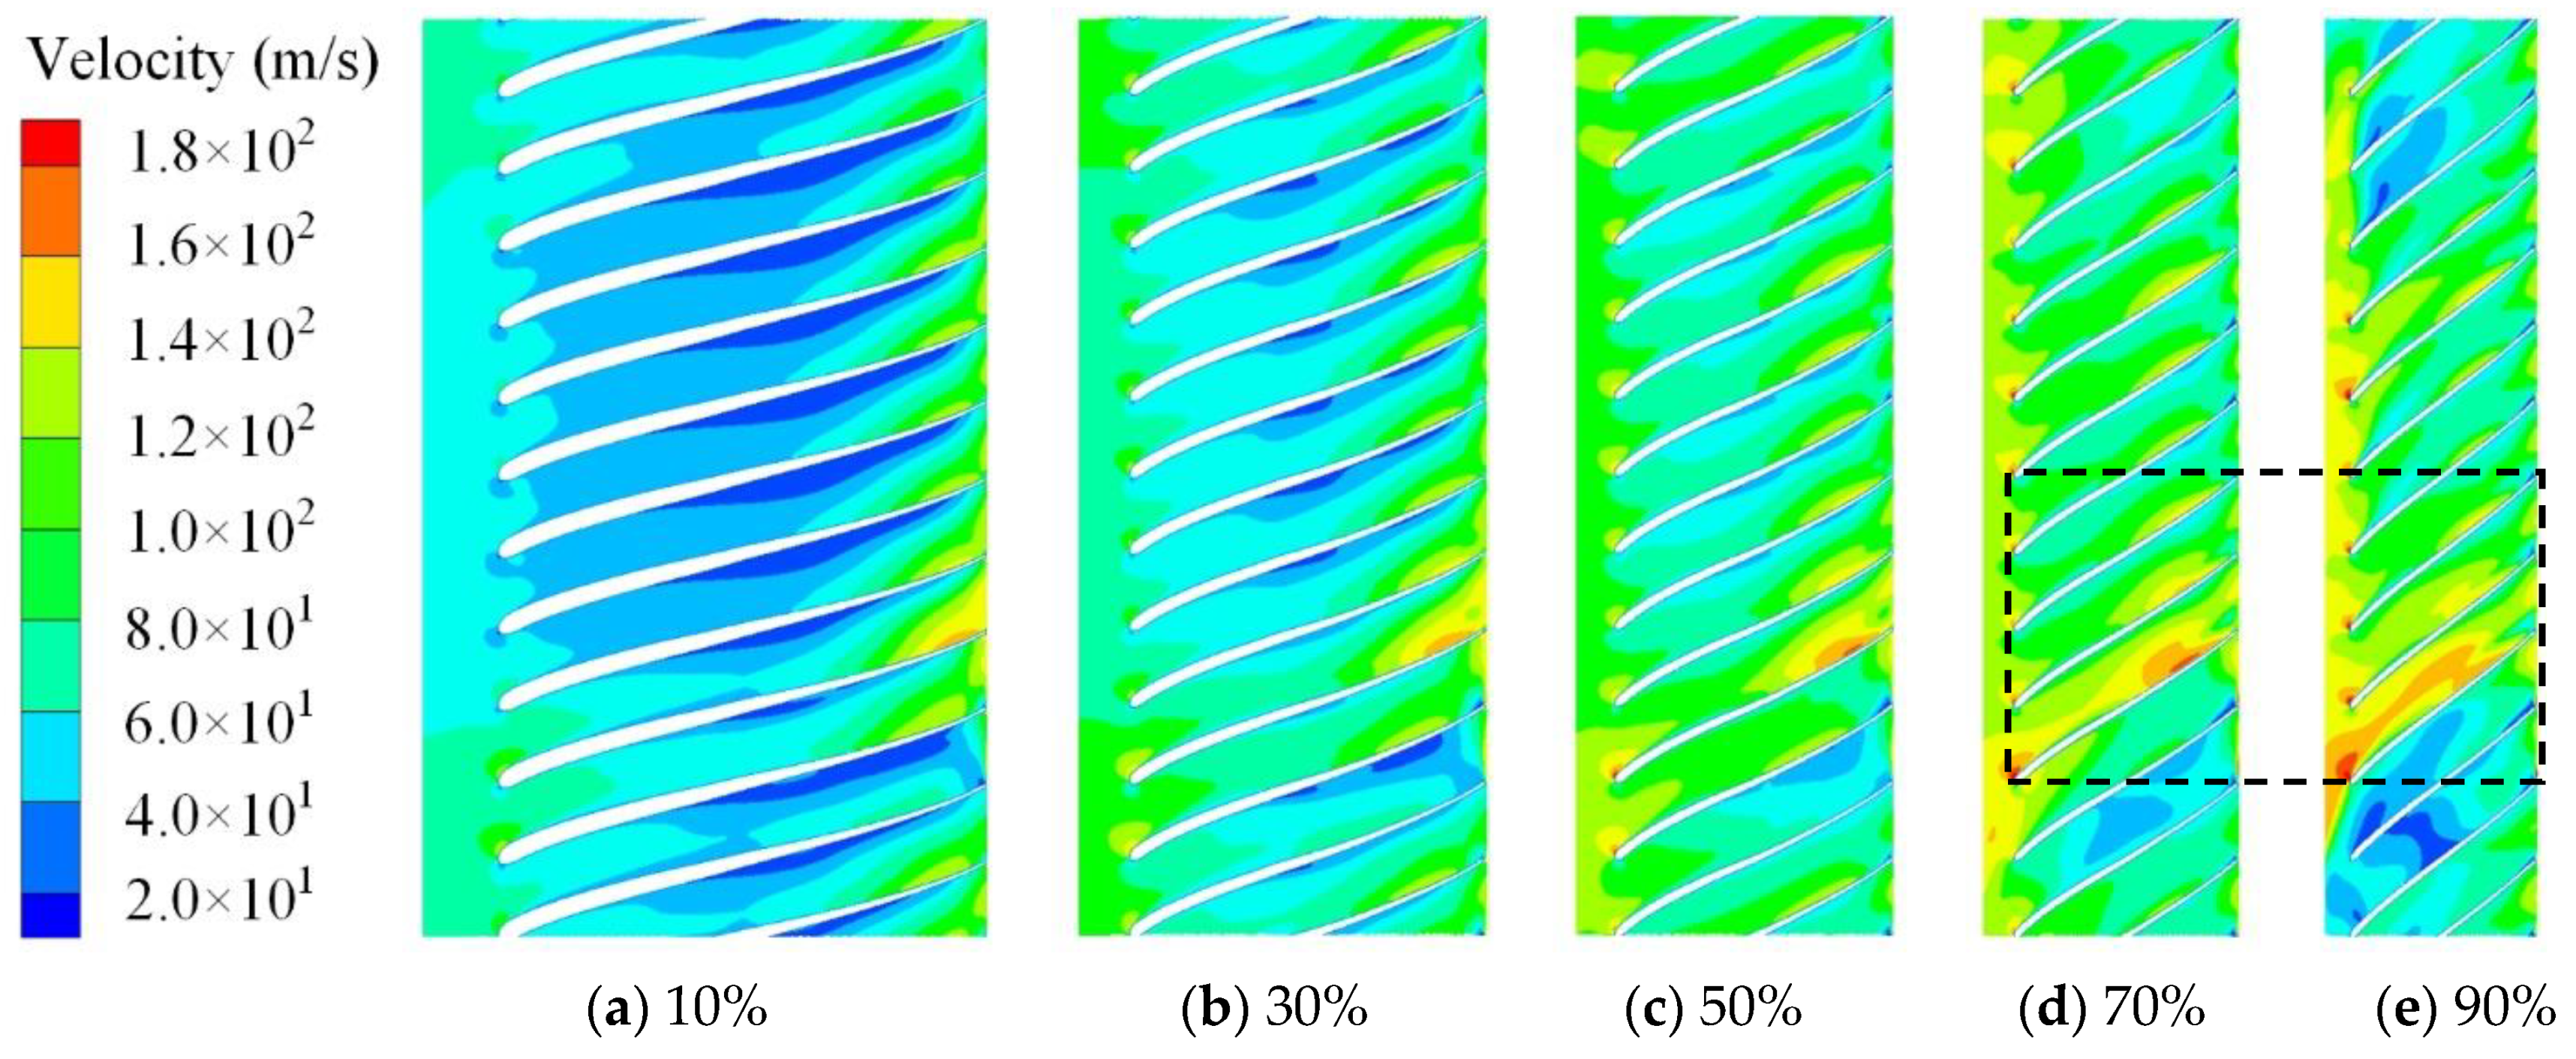
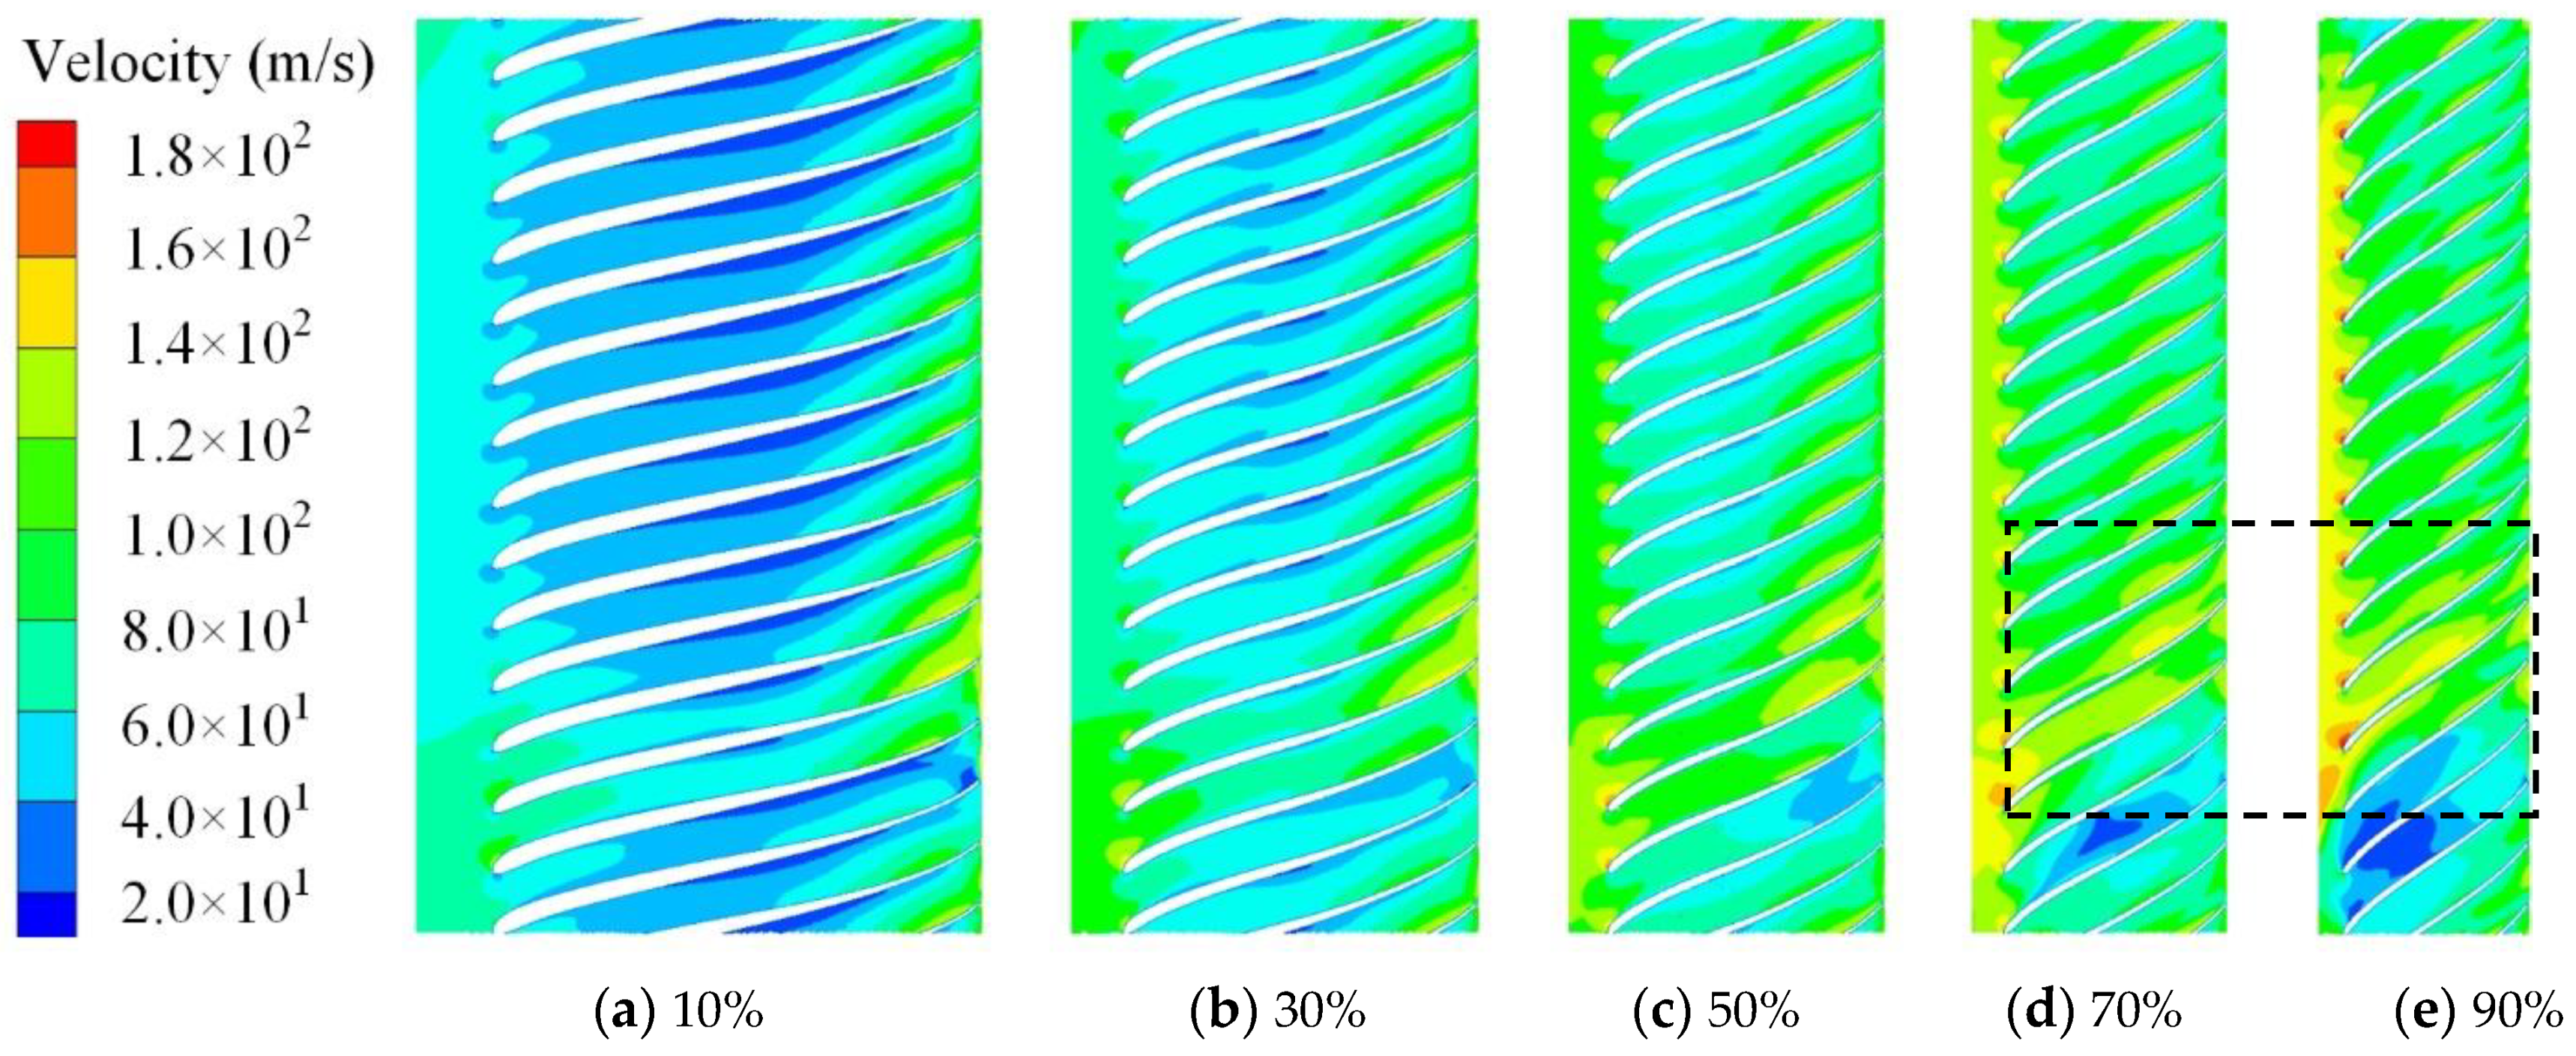
Figure 11 and Figure 12 show the velocity distribution of the baseline and the optimal centrifugal compressors at different blade height sections. It can be seen from the figure that the velocity in the flow field gradually increased with the increase in blade height due to the centrifugal force. Compared with the baseline, the local high-speed zone of the flow passage between the blades of the optimized centrifugal compressor was significantly reduced. At 70% and 90% of the blade height, the improvement of the local high-speed zone was the most obvious. The local high-speed zone of the optimized impeller blade was significantly reduced, and the flow field changed more evenly, which indicates that the matching degree of the impeller and volute was improved, and the flow separation has been effectively suppressed.
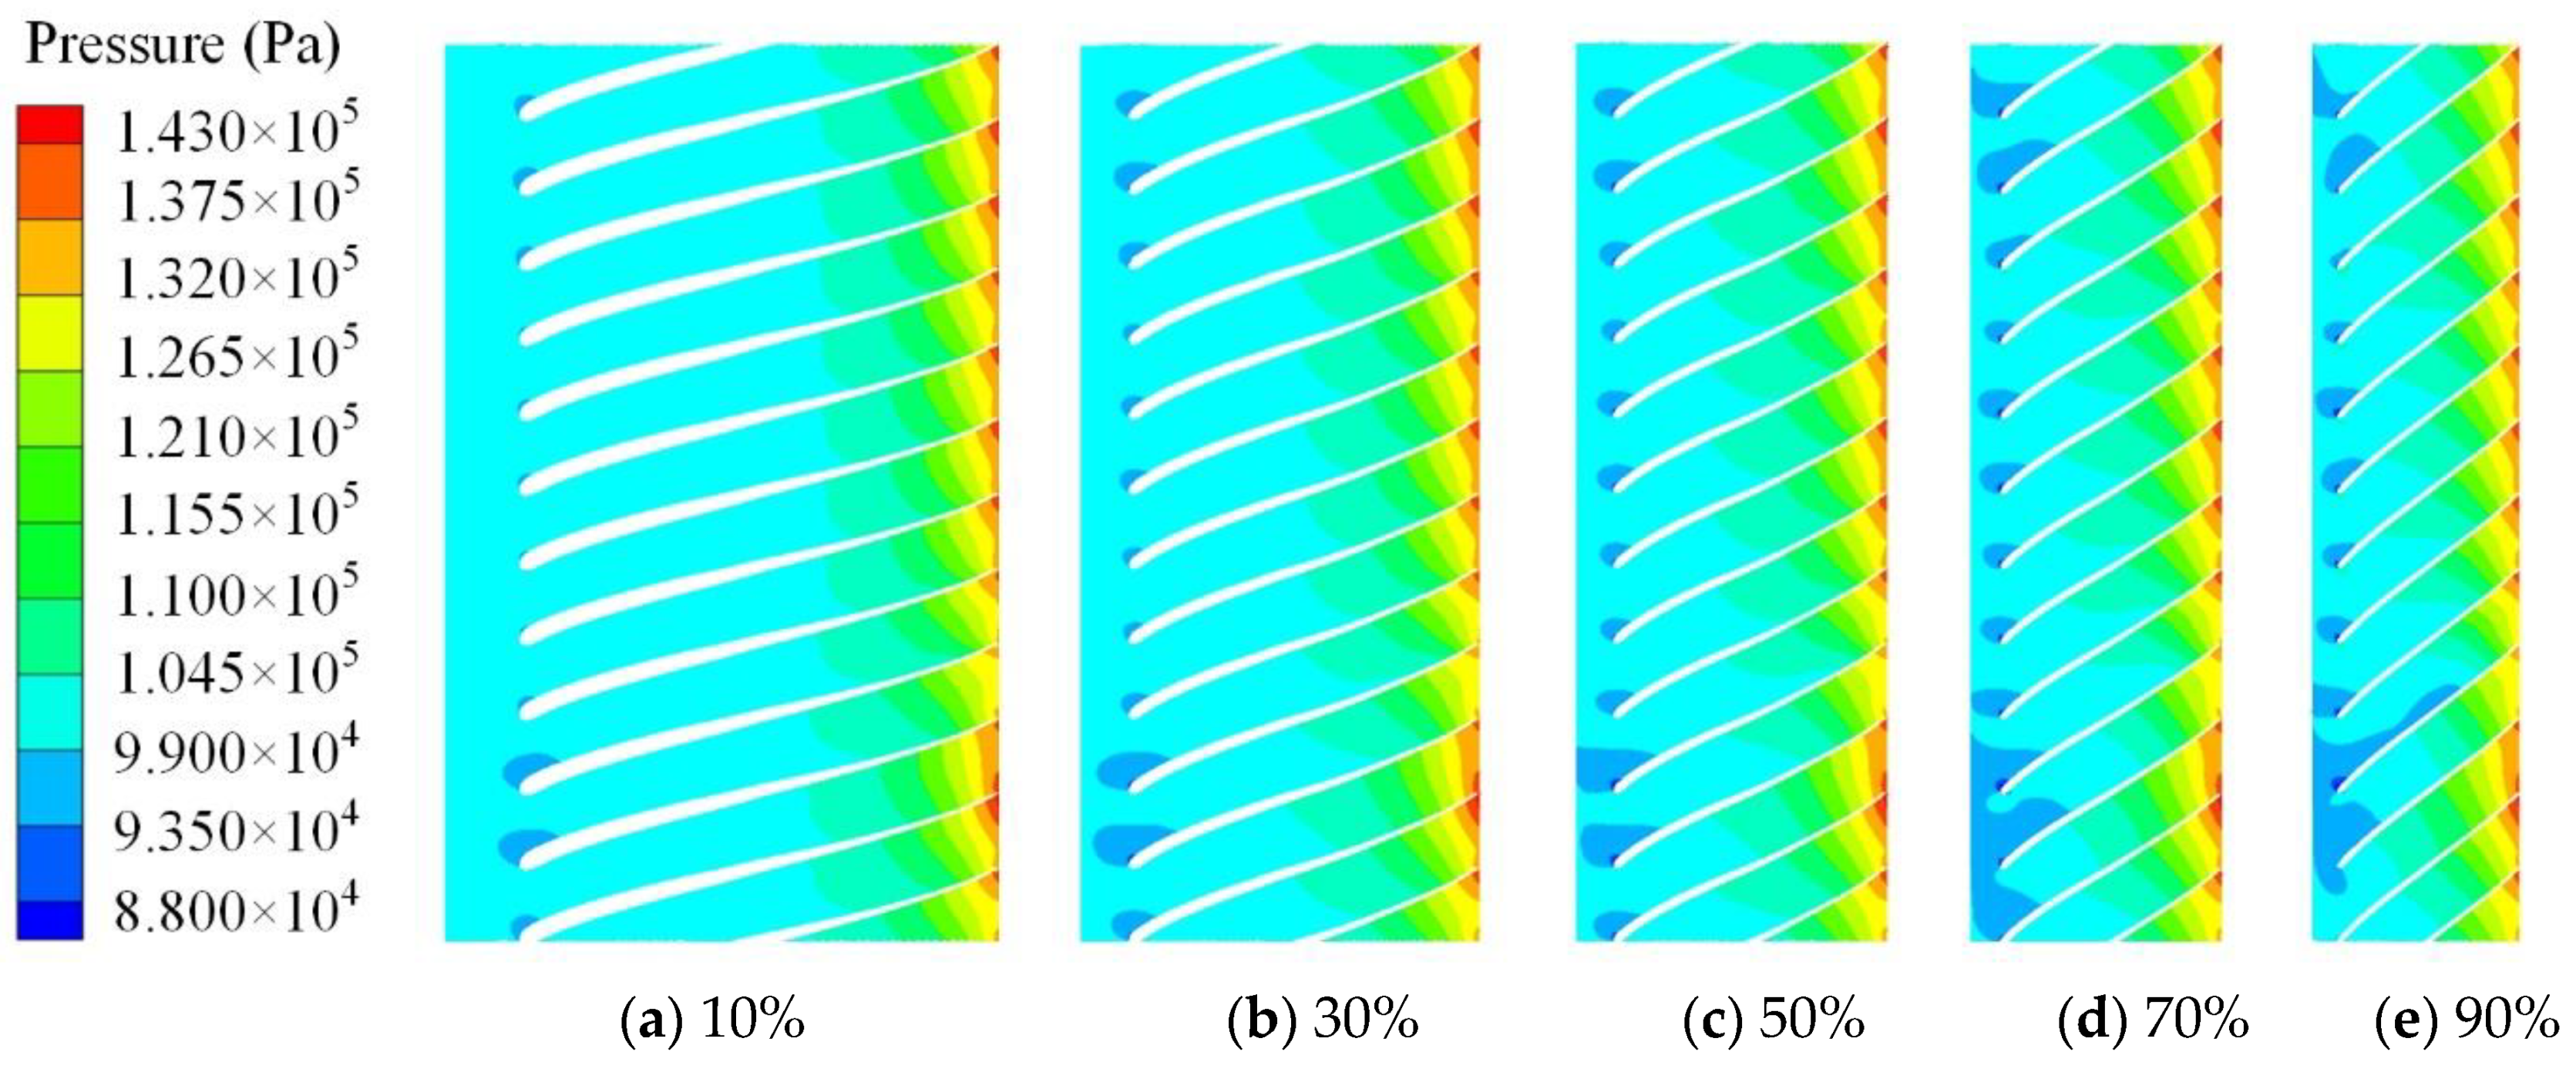
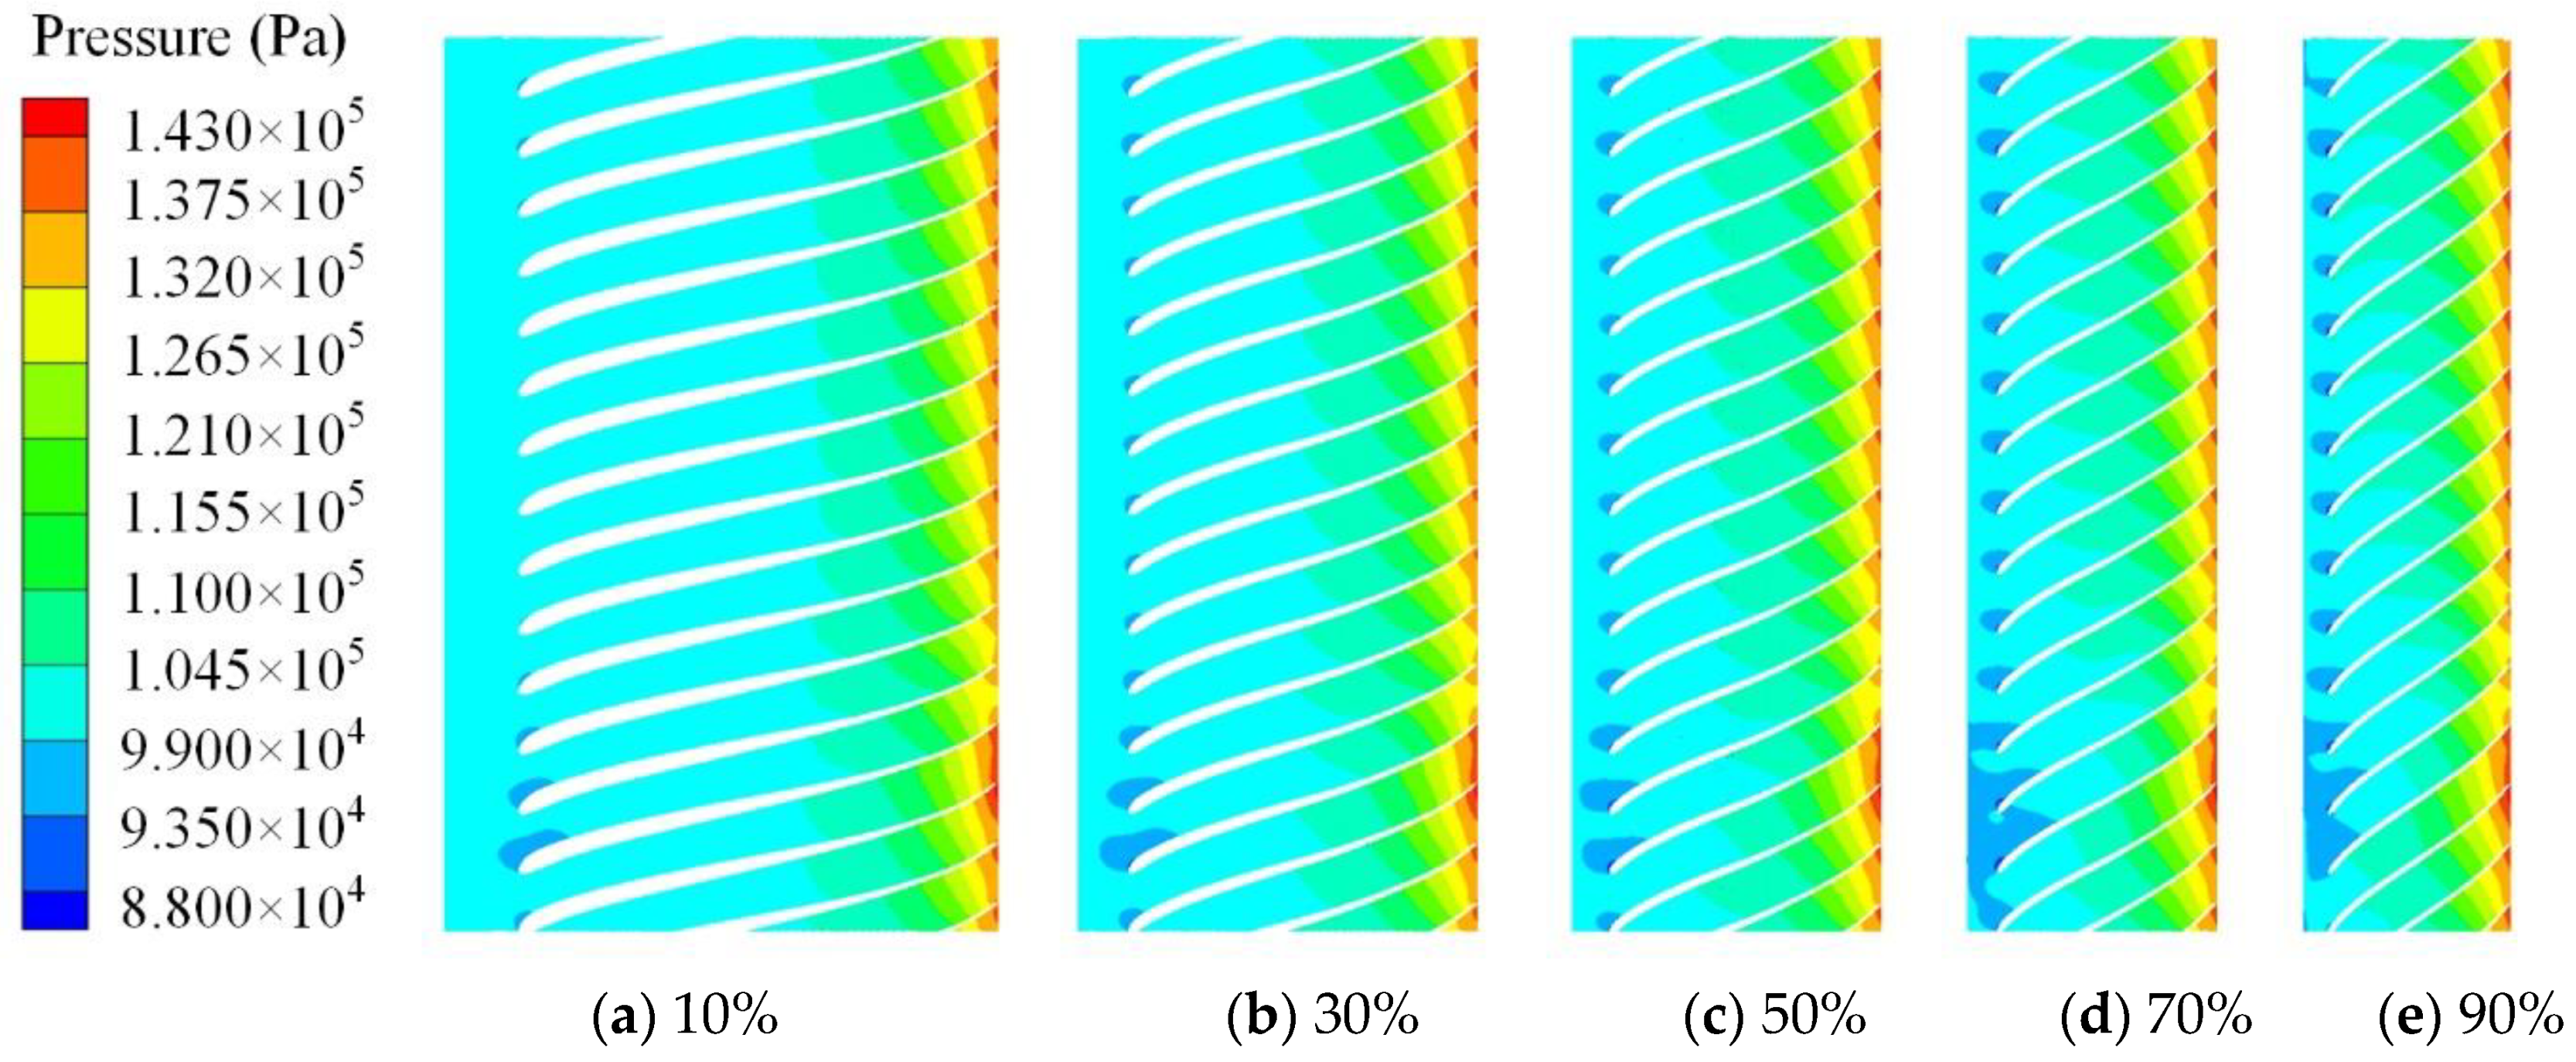
Figure 13 and Figure 14 show the pressure distribution nephogram of the baseline and the optimized centrifugal compressor at different blade height sections. It can be seen that after the air entered from the impeller inlet, the pressure gradually increased as the impeller rotated. After impeller optimization, with the reduction of the local high-speed zone between blades, the local low-pressure zone in the flow field was also significantly reduced. The transition from the low-pressure zone at the impeller inlet to the high-pressure zone at the impeller outlet was more natural, the pressure distribution in the flow field was more uniform, the blade structure was more reasonable and the overall change of the flow field was more stable.
4.2. Pressure Fluctuation Suppression
Pressure fluctuation is a common phenomenon in a compressor, and severe pressure fluctuation will cause vibration, unstable operation and irregular noise, affecting the operation efficiency and stability of the compressor [33,34,35]. For the centrifugal compressor, it is particularly important to maintain stable operation. Frequency domain analysis is a commonly used analysis method for pressure fluctuation. In frequency domain analysis, the time domain signal of pressure fluctuation is directly converted into frequency domain by the Fast Fourier Transform. In this work, the dimensionless pressure fluctuation coefficient CP was used to represent the pressure fluctuation of the monitoring point, and it can be expressed as follows:
where P is the pressure of the monitoring point, is the average value of pressure, is the air density and is the circumferential speed at the impeller outlet.
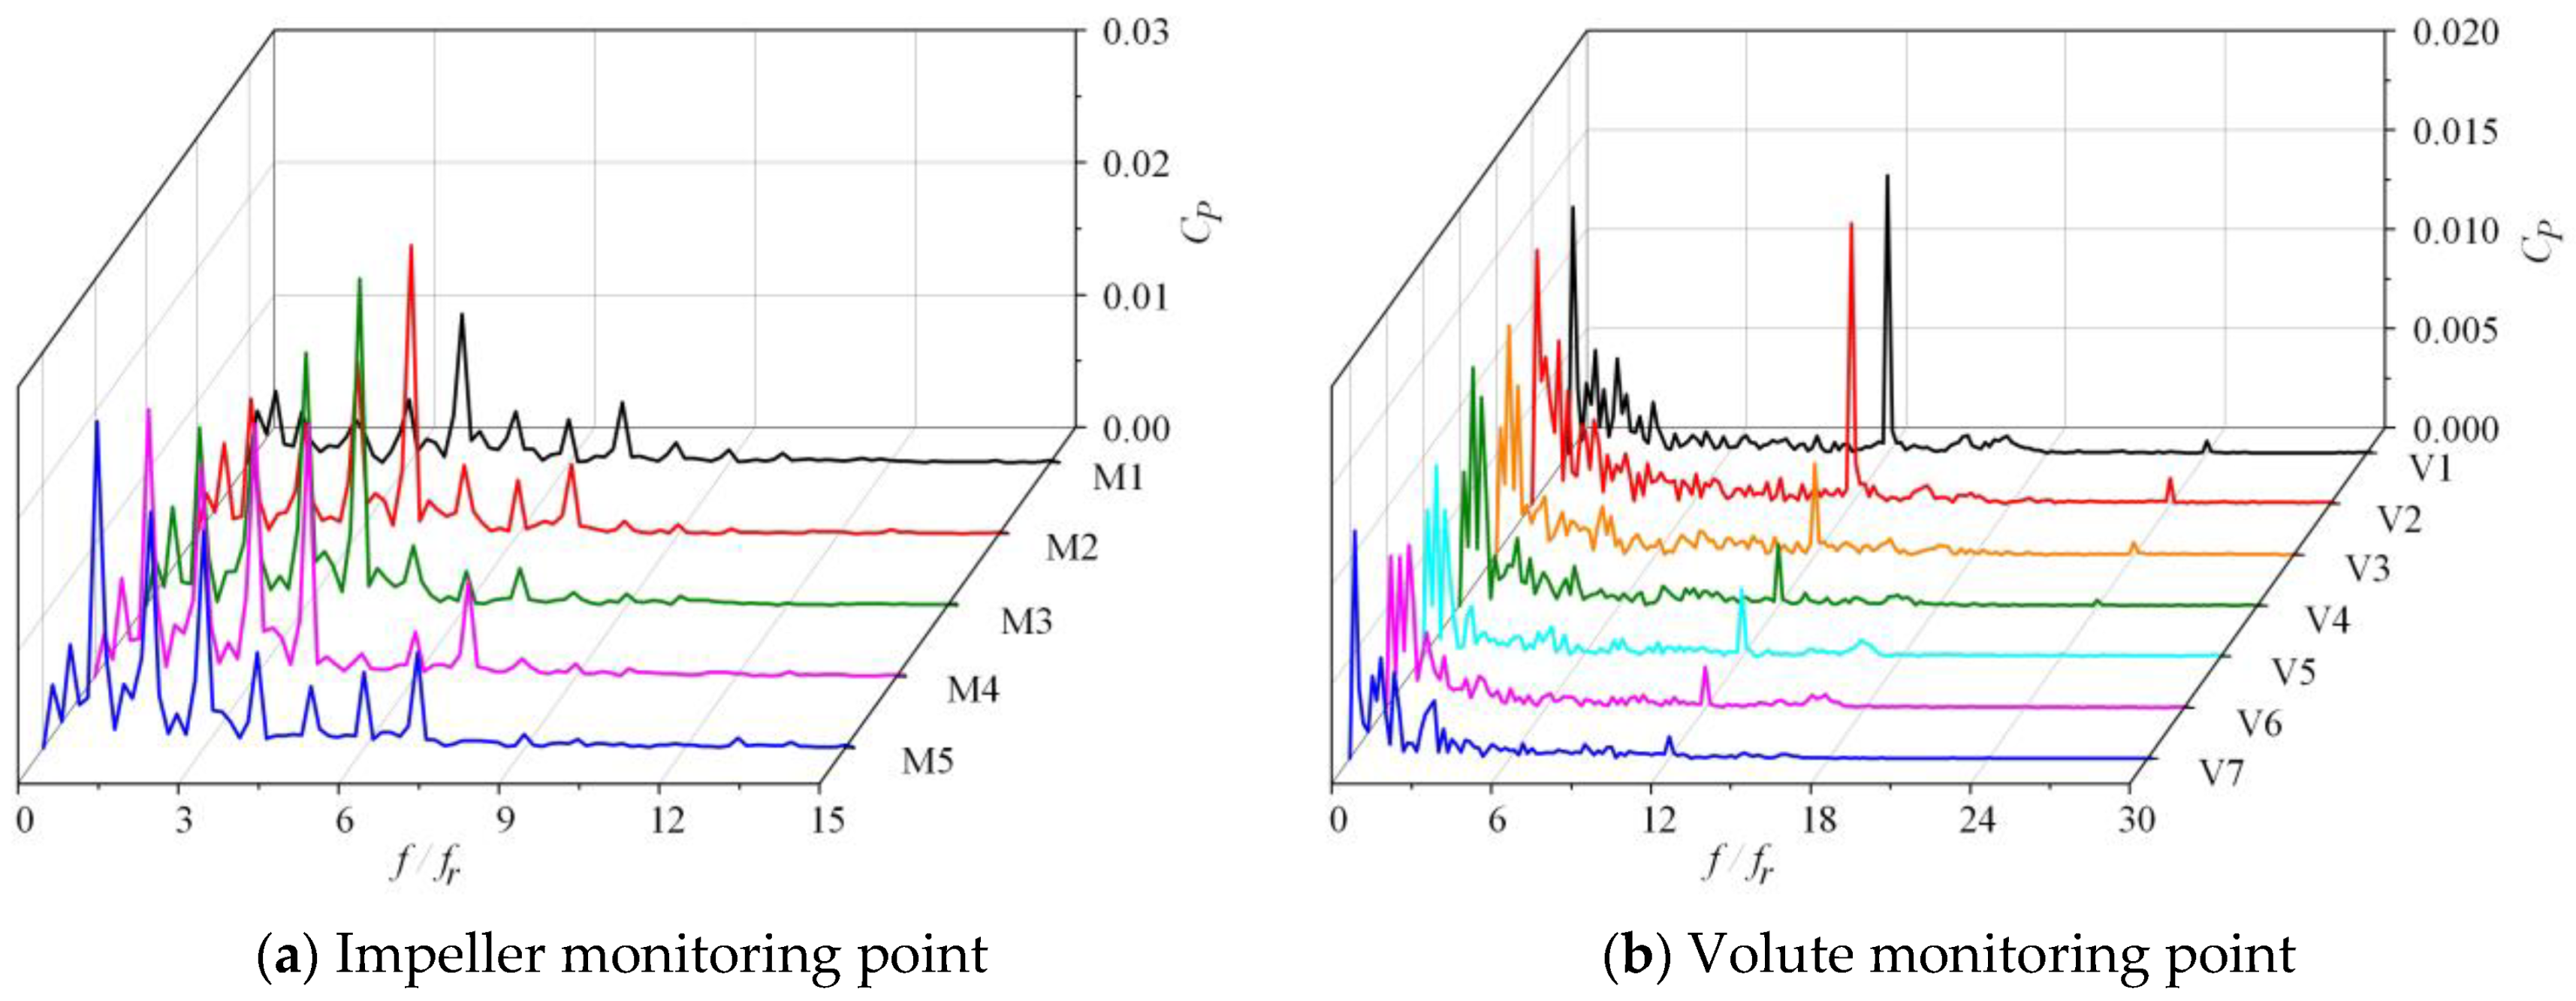
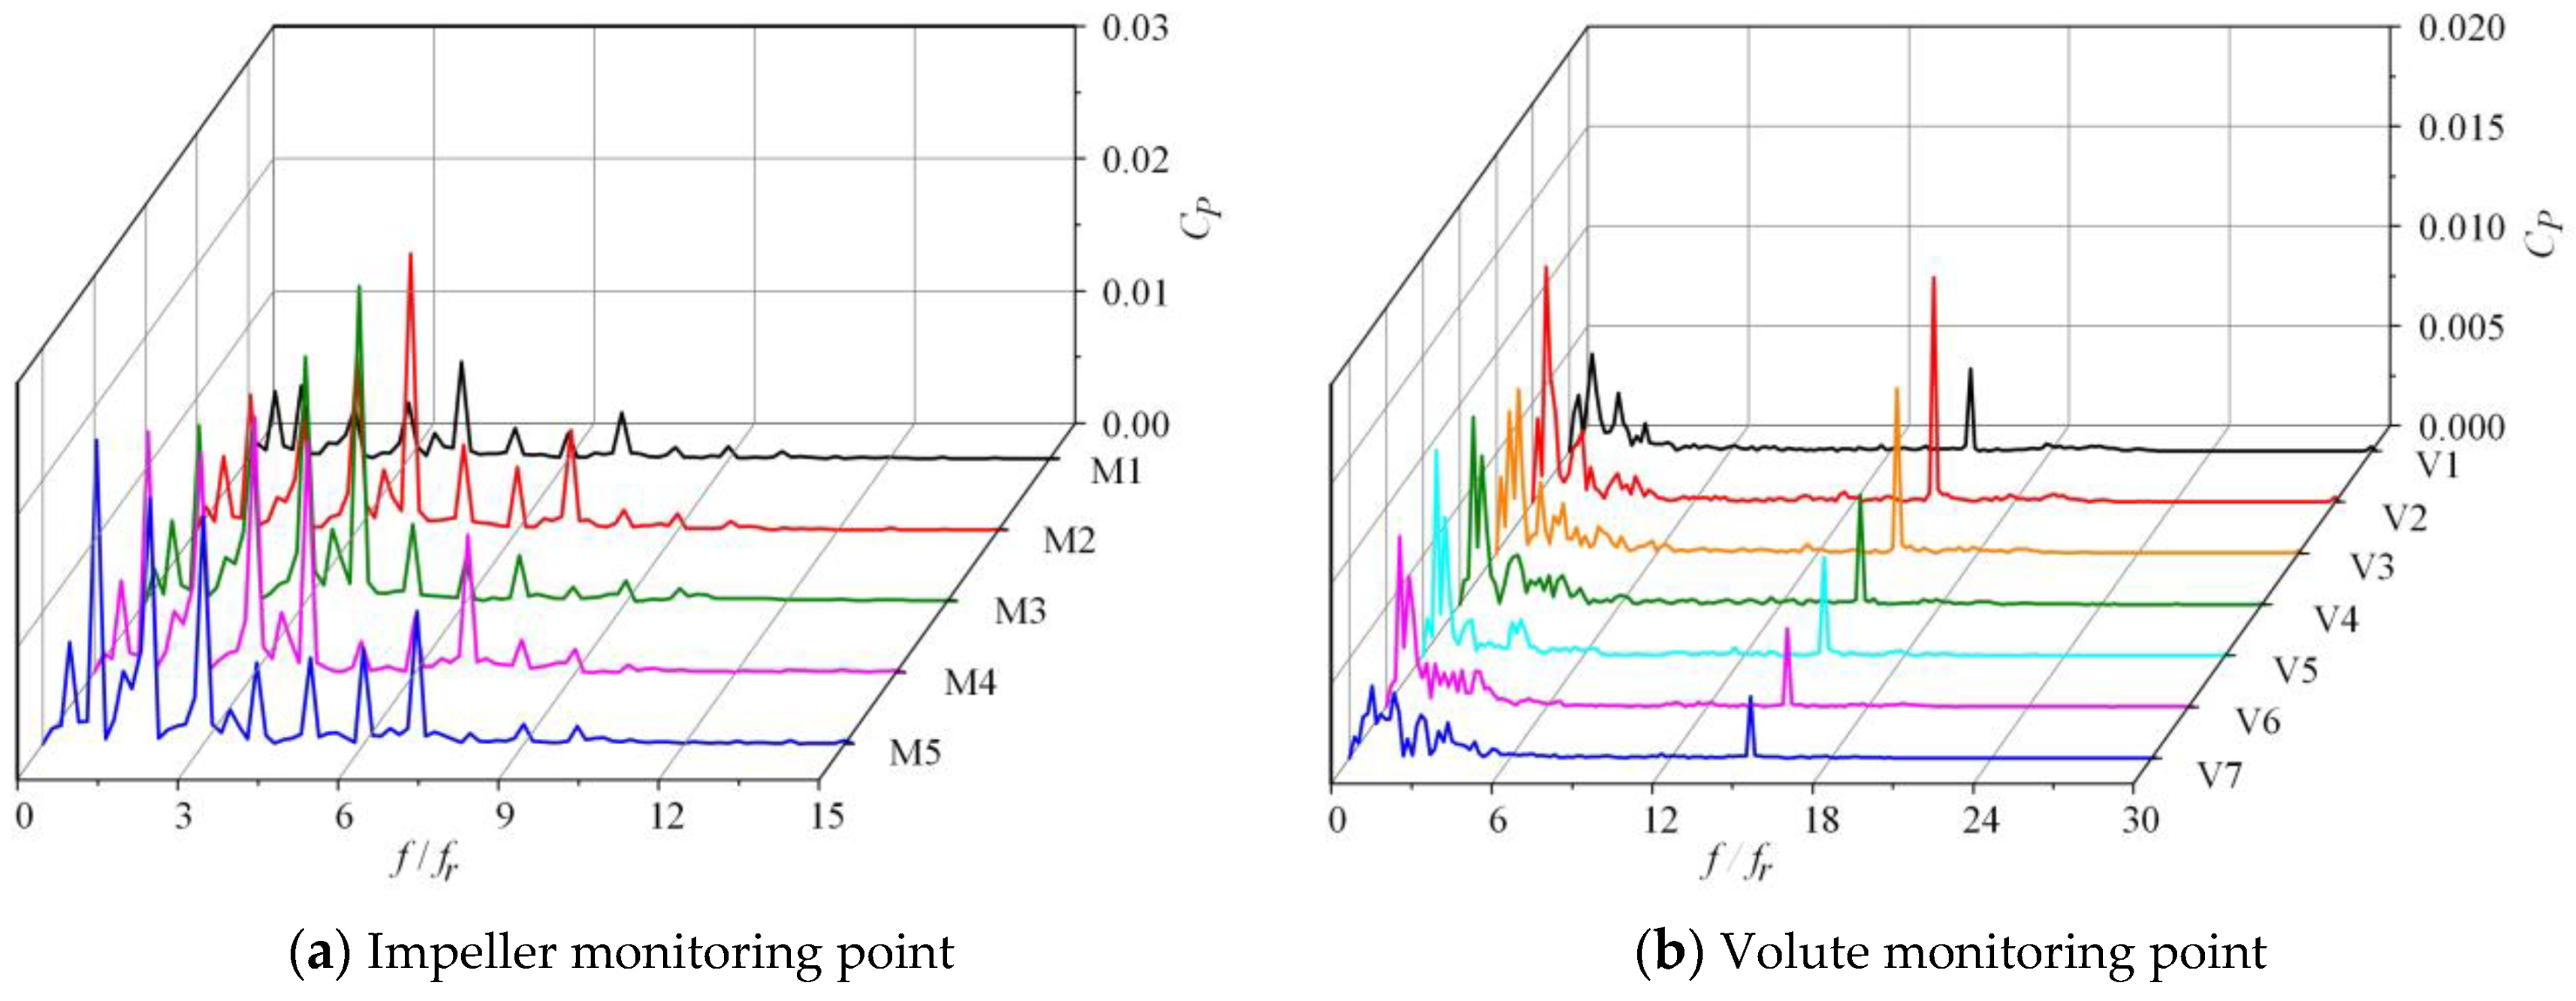
Figure 15 shows the frequency domain of pressure fluctuation for the baseline compressor. Figure 16 shows the frequency domain of pressure fluctuation for the optimal compressor. It can be seen that the peak of pressure fluctuation amplitude in the impeller occurred at the impeller rotation frequency (833 Hz) and its harmonic frequency. Among these monitoring points, the dominant frequencies for points M1, M2 and M3 were four times that of the rotation frequency, and the dominant frequencies for points M4 and M5 were the rotation frequency. On the whole, the amplitude of pressure fluctuation increased from the impeller inlet to the outlet. The pressure fluctuations at the monitoring points V1–V7 in volute were affected by the impeller rotation frequency and the blade passing frequency. The peak value of pressure fluctuation occurred at the impeller rotation frequency and blade passing frequency. The blade passing frequency was related to the rotation frequency and blade number. In the volute, the peak value of pressure fluctuation near the volute tongue was obviously large, and the stator-rotor interaction along the volute circumference gradually decreased, which made the peak of pressure fluctuation also gradually decrease.
The comparison of frequency domain between the baseline compressor and the optimal compressor shows that the pressure fluctuation of the optimal compressor was greatly reduced, especially near the volute tongue. The reason is that the optimal impeller geometry was more reasonable for the flow field in the impeller, and the pressure fluctuation was optimized and reduced. Based on the flow-field analysis, it can be seen that the airflow velocity at the inlet of the impeller increased, and the flow separation phenomenon at the outlet was suppressed. The local high-speed area in the flow channel shrank, and the low-pressure area correspondingly decreased. The flow field was more fluent, and the pressure gradient was more uniform, which resulted in a decrease in the intensity of pressure fluctuation. The peaks of the pressure fluctuation coefficient at point M1 in the baseline compressor and the optimal compressor were 0.0113 and 0.0073, respectively, decreasing by 35.1%. The peaks of the pressure fluctuation coefficient at point V1 in the baseline compressor and the optimal compressor were 0.0140 and 0.0041, respectively, decreasing by 70.5%.
5. Conclusions
In this work, the design optimization and pressure fluctuation suppression of a centrifugal air compressor in a hydrogen fuel cell was investigated. First, the aerodynamic design of the impeller was conducted; then, the numerical simulation and experimental measurements were taken in order to confirm the energy performance of the centrifugal air compressor. Finally, the orthogonal optimization was employed to improve the energy performance and suppress the pressure fluctuation of the centrifugal air compressor. According to the investigation, the following conclusions can be drawn:
- (1)
- A test rig for the aerodynamic performance of the centrifugal air compressor is established, including a pipeline, gas flowmeter, flow regulating valve, pressure transmitter, centrifugal compressor, controller, DC power supply and computer. A baseline centrifugal compressor is designed and measured in the test rig, and its rated rotation speed, flowrate and pressure ratio are 50,000 r/min, 0.1 kg/s, and 1.5, respectively.
- (2)
- Four optimization parameters—including blade number, blade angle at inlet, blade angle at outlet and wrap angle—are chosen, and three levels for the optimization parameters are determined by experience. According to a range analysis of the orthogonal method, the influence level of optimization parameters on efficiency is sorted by blade number, blade angle at inlet, blade angle at outlet and wrap angle. The number of blades has the greatest impact on compressor efficiency due to its ability to control the flow field, and the blade angle also has a great impact on compressor efficiency due to the work principle of the Euler equation. The energy performance of the optimal compressor is significantly improved than that of the baseline compressor at design point of flow rate, which is 0.1 kg/s. The efficiencies of the baseline compressor and optimal compressor are 81.3% and 83.8%, respectively, improving by 2.5%.
- (3)
- The frequency domain of pressure fluctuation in the centrifugal compressor is related to the stator-rotor interaction. The peak value of pressure fluctuation amplitude occurs at the rotation frequency of 833 Hz and its harmonic frequency. After optimization, the matching between the impeller and the volute is improved, and the intensity of pressure pulsation is reduced. The impeller structure is optimized based on the orthogonal method, the flow separation phenomenon at the impeller outlet is suppressed and the local high-speed area in the flow channel is reduced, which leads to the low-pressure area being correspondingly reduced. The pressure gradient in the flow channel is more uniform, and the intensity of pressure pulsation is reduced. In comparison to the baseline compressor, the pressure fluctuation amplitude of the optimal compressor is obviously reduced, especially near the volute tongue. The peak of the pressure fluctuation coefficient at point M1 is decreased by 35.1%, and the peak of the pressure fluctuation coefficient at point V1 is decreased by 70.5%.
The flow field is crucial for the impeller’s efficiency and operation stability, and the visualization methods of high-speed cameras and PIV (particle image velocimetry) have been greatly developed. Therefore, visualization methods can be used to obtain the flow details in the impeller and then applied to further optimize the impeller’s performance in future work.
Author Contributions
Conceptualization, H.Z., L.T., D.Y. and B.L.; methodology, H.Z., L.T., D.Y. and B.L.; software, H.Z.; validation, H.Z. and H.L.; investigation, H.Z., L.T., D.Y., B.L., H.L. and H.F.; writing—review and editing, B.L. and L.T.; project administration, L.T.; funding acquisition, L.T. All authors have read and agreed to the published version of the manuscript.
Funding
This work has been supported by the Open Fund of Science and Technology on Thermal Energy and Power Laboratory [TPL2021A02], the Guoqiang Institute of Tsinghua University [2021GQG1003], the Huaneng Group science and technology research project [KTHT-U22YYJC07] and the State Key Laboratory of Hydroscience and Engineering [sklhse-2023-E-03].
Data Availability Statement
Data will be made available on request.
Acknowledgments
This work has been supported by the Open Fund of Science and Technology on Thermal Energy and Power Laboratory [TPL2021A02], the Guoqiang Institute of Tsinghua University [2021GQG1003], the Huaneng Group science and technology research project [KTHT-U22YYJC07] and the State Key Laboratory of Hydroscience and Engineering [sklhse-2023-E-03].
Conflicts of Interest
The authors declare no conflict of interest.
References
- Garche, J.; Bonhoff, K.; Ehret, O.; Tillmetz, W. The German National Innovation Programme Hydrogen and Fuel Cell Technology. Fuel Cells 2010, 9, 192–196. [Google Scholar] [CrossRef]
- Gao, H. China’s energy transformation under the targets of peaking carbon emissions and carbon neutral. Int. Pet. Econ. 2021, 29, 1–6. [Google Scholar]
- He, X.; Zheng, X. Mechanisms of sweep on the performance of transonic compressor impellers. J. Propuls. Power 2016, 32, 1220–1229. [Google Scholar] [CrossRef]
- Li, H.; Yang, Z.; Jiang, C.; Hong, W. Study on Containment Structure of Aeroengine Air Turbine Starter. Aeroengine 2019, 45, 51–57. [Google Scholar]
- Ahluwalia, R.K. Performance and cost of automotive fuel cell systems with ultra-low platinum loadings. J. Power Sources 2011, 196, 4619–4630. [Google Scholar] [CrossRef]
- Jiao, K.; Xuan, J.; Du, Q.; Bao, Z.; Xie, B.; Wang, B.; Zhao, Y.; Fan, L.; Wang, H.; Hou, Z.; et al. Designing the next generation of proton-exchange membrane fuel cells. Nature 2021, 595, 361–369. [Google Scholar] [CrossRef]
- Fang, Y.; Cheng, J.; Liu, S.; Chen, G.; Huang, D.; Sheng, X. Research Status and Prospect of China’s Hydrogen Fuel Cell Vehicle Industry. Contemp. Chem. Res. 2022, 118, 183–185. [Google Scholar]
- Jewell, J.; McCollum, D.; Emmerling, J.; Bertram, C.; Gernaat, D.E.; Krey, V.; Paroussos, L.; Berger, L.; Fragkiadakis, K.; Keppo, I.; et al. Limited emission reductions from fuel subsidy removal except in energy-exporting regions. Nature 2018, 554, 229–233. [Google Scholar] [CrossRef]
- Staffell, I.; Scamman, D.; Abad, A.V.; Balcombe, P.; Dodds, P.E.; Ekins, P.; Shah, N.; Ward, K.R. The role of hydrogen and fuel cells in the global energy system. Energy Env. 2019, 12, 463–491. [Google Scholar] [CrossRef]
- Itaoka, K.; Saito, A.; Sasaki, K. Public perception on hydrogen infrastructure in Japan: Influence of rollout of commercial fuel cell vehicles. Int. J. Hydrog. Energy 2017, 42, 7290–7296. [Google Scholar] [CrossRef]
- Cano, Z.P.; Banham, D.; Ye, S.; Hintennach, A.; Lu, J.; Fowler, M.; Chen, Z. Batteries and fuel cells for emerging electric vehicle markets. Nat. Energy 2018, 3, 279–289. [Google Scholar] [CrossRef]
- Eberle, U.; Müller, B.; von Helmolt, R. Fuel cell electric vehicles and hydrogen infrastructure: Status 2012. Energy Env. 2012, 5, 8780–8798. [Google Scholar] [CrossRef]
- Marconcini, M.; Rubechini, F.; Arnone, A.; Ibaraki, S. Numerical Analysis of the Vaned Diffuser of a Transonic Centrifugal Compressor. J. Turbomach. 2010, 132, 041012. [Google Scholar] [CrossRef]
- Krain, H.; Hoffmann, B. Flow Study of a Redesigned High Pressure Ratio Centrifugal Compressor. J. Propuls. Power 2008, 24, 7. [Google Scholar] [CrossRef]
- Hildebrandt, A.; Genrup, M. Numerical Investigation of the Effect of Different Back Sweep Angle and Exducer Width on the Impeller Outlet Flow Pattern of a Centrifugal Compressor with Vaneless Diffuser. J. Turbomach. 2007, 129, 1077–1086. [Google Scholar] [CrossRef]
- Ha, K.K.; Jeong, T.B.; Kang, S.H.; Kim, H.J.; Won, K.M.; Park, C.Y.; Jung, W.Y.; Cho, K.Y. Experimental Investigation on Aero-Acoustic Characteristics of a Centrifugal Compressor for the Fuel-Cell Vehicle. J. Mech. Sci. Technol. 2013, 27, 3287–3297. [Google Scholar] [CrossRef]
- Ha, K.K.; Lee, C.H.; Kim, C.M.; Kim, S.H.; Ahn, B.K. A Study on the Characteristics of an Oil-Free Centrifugal Compressor for Fuel-Cell Vehicles. SAE Int. J. Altern. Powertrains 2016, 5, 167–174. [Google Scholar] [CrossRef]
- Zhao, D.; Hua, Z.; Liang, Y.; Chen, F. Centrifugal Air Compressor Characteristic Research on the Fuel Cells in the Aircraft. Aviat. Sci. Technol. 2017, 2, 64–68. [Google Scholar]
- Zhu, G.H.; Qiu, T.H.; Xie, M. The Analysis of Aerodynamic Load For High Speed Centrifugal Compressor Blade. Adv. Mater. Res. 2013, 675, 103–106. [Google Scholar] [CrossRef]
- Zuo, S.; Wei, K.; Wu, X.; Nie, Y.; Xu, S. Multi-objective parameter optimization of centrifugal compressor impeller using Kriging model. J. Agric. Eng. 2016, 1, 77–82. [Google Scholar]
- Lu, Y.; Tan, L.; Han, Y.; Liu, M. Cavitation-vibration correlation of a mixed flow pump under steady state and fast start-up conditions by experiment. Ocean Eng. 2022, 251, 111158. [Google Scholar] [CrossRef]
- Sun, W.; Tan, L. Cavitation-Vortex-Pressure fluctuation interaction in a centrifugal pump using bubble rotation modified cavitation model under partial load. J. Fluids Eng.-Trans. ASME 2020, 142, 051206. [Google Scholar] [CrossRef]
- Zhang, D.; Shi, W.; Wang, C.; Guo, T.; Zou, P. Influence of impeller and guide vane blade number on pressure fluctuation in mixed flow pump. J. Drain. Irrig. Mach. Eng. 2012, 30, 167–170. [Google Scholar]
- Zhou, P.J.; Wang, F.J.; Yang, Z.J.; Mou, J.G. Investigation of rotating stall for a centrifugal pump impeller using various SGS models. J. Hydrodyn. 2017, 29, 235–242. [Google Scholar] [CrossRef]
- Zhou, P.J.; Wang, F.J.; Yao, Z.F. Study on effects of blade number on stall characteristics for centrifugal pump impeller. J. Mech. Eng. 2016, 52, 207–215. [Google Scholar] [CrossRef]
- Li, H.; Zhang, X.; Guo, C.; Zhang, X. Acoustic resonance analysis for centrifugal compressors and experiment verification. J. Mech. Eng. 2014, 50, 73–79. [Google Scholar] [CrossRef]
- Zhang, Y.; Bao, P.; Wan, Y.; Xu, S. Modeling and Analysis of Air Supply System of Polymer Electrolyte Membrane Fuel Cell System. Energy Procedia 2017, 142, 1053–1058. [Google Scholar] [CrossRef]
- Konno, N.; Mizuno, S.; Nakaji, H.; Ishikawa, Y. Development of compact and high-performance fuel cell stack. SAE Mobilus 2015, 4, 123–129. [Google Scholar] [CrossRef]
- Liu, M.; Han, Y.; Tan, L.; Lu, Y.; Ma, C.; Gou, J. Theoretical prediction model of transient performance for a mixed flow pump under fast start-up conditions. Phys. Fluids 2023, 35, 025125. [Google Scholar] [CrossRef]
- Liu, M.; Tan, L.; Cao, S. Design method of controllable blade angle and orthogonal optimization of pressure rise for a multiphase pump. Energies 2018, 11, 1048. [Google Scholar] [CrossRef]
- Dai, Z.; Tan, L.; Han, B.; Han, S. Multi-parameter optimization design of axial flow pump based on orthogonal method. Energies 2022, 15, 9379. [Google Scholar] [CrossRef]
- Fan, H.; Zhang, J.; Zhang, W.; Liu, B. Multiparameter and multiobjective optimization design based on orthogonal method for mixed flow fan. Energies 2020, 13, 2819. [Google Scholar] [CrossRef]
- Xiao, W.; Tan, L. Design method of controllable velocity moment and optimization of pressure fluctuation suppression for a multiphase pump. Ocean Eng. 2021, 220, 108402. [Google Scholar] [CrossRef]
- Tang, H.; He, F. Numerical simulation of flow field in centrifugal pump. Water Pump Technol. 2002, 2, 3–9. [Google Scholar]
- Tang, X.; Gu, N.; Wang, W.; Wang, Z.; Peng, R. Aerodynamic robustness optimization and design exploration of centrifugal compressor impeller under uncertainties. Int. J. Heat Mass Transf. 2021, 180, 121799. [Google Scholar] [CrossRef]
Figure 1.
Geometry of impeller and volute.

Figure 2.
Computational domain.

Figure 3.
Computational mesh.

Figure 4.
Grid independence verification.

Figure 5.
Monitoring points in compressor.

Figure 6.
Comparison of pressure fluctuation.

Figure 7.
Pressure distribution in centrifugal compressor.

Figure 8.
Schematic diagram of test apparatus.

Figure 9.
Comparison between simulation results and experimental results.

Figure 10.
External characteristic curves of baseline and optimal compressor at rated speed.

Figure 11.
Velocity distribution at different blade height sections of baseline compressor.

Figure 12.
Velocity distribution at different blade height sections of optimal compressor.

Figure 13.
Pressure at different blade height sections of baseline compressor.

Figure 14.
Pressure at different blade height sections of optimal compressor.

Figure 15.
Frequency domain of pressure fluctuation in baseline compressor.

Figure 16.
Frequency domain of pressure fluctuation in optimal compressor.


Table 1.
Basic design parameters.
| Design Parameters | Value |
|---|---|
| Rated speed N0 | 50,000 r/min |
| Mass flow Qm | 0.1 kg/s |
| Inlet temperature T0 | 293.15 K |
| Inlet pressure P0 | 101,325 Pa |
| Total pressure ratio ε | 1.5 |
Table 2.
Impeller geometrical parameters.
| Structural Parameters | Value |
|---|---|
| Impeller inlet diameter | 50 mm |
| Impeller outlet diameter | 100 mm |
| Impeller outlet width | 5 mm |
| Blade inlet installation angle | 50° |
| Blade outlet installation angle | 60° |
| Blade wrap angle | 60° |
Table 3.
Orthogonal parameter and level.
| Level | Blade Number (A) | Blade Angle at Inlet/° (B) | Blade Angle at Outlet/° (C) | Wrap Angle/° (D) |
|---|---|---|---|---|
| 1 | 9 | 40 | 45 | 40 |
| 2 | 12 | 50 | 60 | 50 |
| 3 | 15 | 60 | 75 | 60 |
Table 4.
Orthogonal table.
| Scheme | A | B/° | C/° | D/° | /% | |
|---|---|---|---|---|---|---|
| 1 | 9 | 40 | 45 | 40 | 1.435 | 79.25 |
| 2 | 9 | 50 | 60 | 50 | 1.447 | 79.60 |
| 3 | 9 | 60 | 75 | 60 | 1.463 | 77.74 |
| 4 | 12 | 40 | 60 | 60 | 1.52 | 82.20 |
| 5 | 12 | 50 | 75 | 40 | 1.556 | 80.20 |
| 6 | 12 | 60 | 45 | 50 | 1.492 | 80.75 |
| 7 | 15 | 40 | 75 | 50 | 1.58 | 82.01 |
| 8 | 15 | 50 | 45 | 60 | 1.532 | 83.12 |
| 9 | 15 | 60 | 60 | 40 | 1.558 | 80.81 |
Table 5.
Range analysis for compressor efficiency.
| Average Value | A/% | B/% | C/% | D/% |
|---|---|---|---|---|
| k1 | 78.86 | 81.18 | 81.04 | 80.09 |
| k2 | 81.05 | 80.97 | 80.87 | 80.82 |
| k3 | 82.01 | 79.77 | 80.01 | 81.02 |
| R | 3.15 | 1.41 | 1.03 | 0.93 |
Table 6.
Comparison of baseline compressor and optimal compressor.
| Scheme | A | B/° | C/° | D/° | /% | |
|---|---|---|---|---|---|---|
| Baseline | 12 | 50 | 60 | 60 | 1.518 | 81.3 |
| Optimal | 15 | 40 | 45 | 60 | 1.535 | 83.8 |
Disclaimer/Publisher’s Note: The statements, opinions and data contained in all publications are solely those of the individual author(s) and contributor(s) and not of MDPI and/or the editor(s). MDPI and/or the editor(s) disclaim responsibility for any injury to people or property resulting from any ideas, methods, instructions or products referred to in the content. |
© 2023 by the authors. Licensee MDPI, Basel, Switzerland. This article is an open access article distributed under the terms and conditions of the Creative Commons Attribution (CC BY) license (https://creativecommons.org/licenses/by/4.0/).
Share and Cite
MDPI and ACS Style
Zhao, H.; Tan, L.; Yang, D.; Liu, B.; Fan, H.; Li, H. Optimization Design and Pressure Fluctuation Suppression Based on Orthogonal Method for a Centrifugal Compressor. Machines 2023, 11, 559. https://doi.org/10.3390/machines11050559
AMA Style
Zhao H, Tan L, Yang D, Liu B, Fan H, Li H. Optimization Design and Pressure Fluctuation Suppression Based on Orthogonal Method for a Centrifugal Compressor. Machines. 2023; 11(5):559. https://doi.org/10.3390/machines11050559
Chicago/Turabian StyleZhao, Huanxin, Lei Tan, Dangguo Yang, Bing Liu, Honggang Fan, and Hongshuai Li. 2023. "Optimization Design and Pressure Fluctuation Suppression Based on Orthogonal Method for a Centrifugal Compressor" Machines 11, no. 5: 559. https://doi.org/10.3390/machines11050559
Note that from the first issue of 2016, this journal uses article numbers instead of page numbers. See further details here.