
Shape Accuracy Improvement in Selective Laser-Melted Ti6Al4V Cylindrical Parts by Sliding Friction Diamond Burnishing


1
Institute of Manufacturing Science, University of Miskolc, 3515 Miskolc, Hungary
2
Institute of Engineering and Agriculture, University of Nyiregyhaza, 4400 Nyiregyhaza, Hungary
*
Author to whom correspondence should be addressed.
Machines 2022, 10(10), 949; https://doi.org/10.3390/machines10100949
Submission received: 15 September 2022
/
Revised: 12 October 2022
/
Accepted: 15 October 2022
/
Published: 19 October 2022
(This article belongs to the Special Issue Additive Manufacturing of Machine Components)
Abstract
:Additively manufactured metallic parts usually need postprocessing in order to achieve required shape accuracy. Cylindrical test specimens were produced by selective laser melting from Ti6Al4V powder material with different processing parameters. The aim of postprocessing was modification of shape accuracy. Sliding friction diamond burnishing was applied as the postprocessing method. A five-factor, two-level full factorial design of experiment was implemented with factors being infill laser power, infill laser scan speed, burnishing speed, feed and force. Improvement ratios of two roundness parameters were defined, calculated from experimental data, and studied by main effect and interaction analysis. It has been demonstrated that burnishing feed has the largest main effect to improvement in roundness total and cylindricity. Additionally, parameters of both selective laser melting and diamond burnishing appear in three largest interaction terms. Empirical functions were fit to measurement data. Results show that improvement in roundness parameters are strongly nonlinear functions of all factors.
1. Introduction
Additive manufacturing (AM) methods brought a revolution into several fields of technology like mechanical engineering, the medical field, pharmaceutical industry, food, vehicle manufacturing, nuclear industries, space industry, construction and even the garment and jewellery trade, processing a wide variety of materials from polymers, metals, ceramics and concrete to biomaterials [1,2,3,4]. AM is applied for manufacturing both prototypes and end-use parts. It has the advantage of having the capability of producing parts with almost arbitrary shape directly from an electronic body model with the same machine, without retooling, thus providing high flexibility to manufacturing systems. Despite its promising features, AM must not be considered as a universal solution for manufacturing tasks. Combining AM and conventional technologies is usually necessary and advisable for either economic or technical reasons [5,6,7]. Today, AM in itself cannot fulfil all quality demands in industry, especially surface quality requirements, dimensional and shape accuracy, limited build size and low production rate [8,9,10,11]. Therefore, it has to be supplemented by a so-called postprocessing operation.
In this paper we focus on the dimensional and shape accuracy of metallic parts, especially Ti6Al4V parts, produced by selective laser melting (SLM).
A number of studies have examined dimensional and shape accuracy of selective laser-melted Ti6Al4V parts. Yang et al. [12] studied the shape accuracy of stainless steel orthodontic brackets produced by SLM, and managed to decrease the average size error to 10 micrometres by optimizing process parameters. Cuesta et al. [13] studied the effect of sandblasting and heat treatment to the size accuracy and face flatness of stainless steel cubes. They showed that sandblasting has an anisotropic effect. As an example, flatness of a side plane managed to decrease from 67.2 to 42.1 μm by a process of sandblasting. Pal et al. [14] reported dimensional errors of cuboid and tensile test specimens manufactured by SLM of the material Ti6Al4V. In their experiment, series three SLM parameters and the orientation of the products on the tray were varied. Dimensional errors of length depends on each experimental factor and fall in the magnitude of 0.1 mm. Miranda et al. [15] studied SLM-ed Ti6Al4V thin walled tubes. They found that wall thickness primarily depends on laser scan speed, and other SLM parameters are also significant. Bartolomeu et al. [16] performed complex experimental and theoretical research on the size accuracy and elastic modulus of porous structures in order to predict these in the case of medical implants. Zhang et al. [17] proposed a theoretical model for precompensation of dimensional errors of the SLM method and succeeded in decreasing the dimensional inaccuracies to the magnitude of 20 micrometres. Maamoun et al. [18] performed an experimental study on three different Al alloys, and managed to decrease dimensional errors in the range 0.15–0.19 mm by optimizing SLM process parameters. Hong et al. [19] applied an artificial neural network system to compensate dimensional errors of SLM-made lattice structures for medical purposes. Sommer et al. [20] studied the effect of micro milling on the dimensional and shape accuracy of SLM-manufactured block-like parts, and succeeded in decreasing dimensional errors under 2 micrometres.
Ti6Al4V is known as a widely used alloy in industry and is also frequently studied in scientific research. In our work we investigated a special form of Ti6Al4V containing extra-low interstitials (ELI). The chemical composition of Ti6Al4V ELI in weight% is 5.5–6.75% Al, 3.5–4.5% V, C ≤ 0.08%, O ≤ 0.2%, N ≤ 0.05%, H ≤ 0.015%, Fe ≤ 0.4%. All other elements must be present in less than 0.1%, and the total amount of other elements must be less than 0.4% [21].
Advantages of this material are its low mass density together with good mass–strength ratio, chemical endurance, and biocompatibility. It is applied in land, aerial and marine vehicles, in the chemical, pharmaceutical, food, biomedical and nuclear industries, and in several other fields. A weak side of this material is its poor tribological behaviour, namely weak wear resistance and unstable friction coefficient [22]. Ti6Al4V appears both as wrought and in additively manufactured form in industry [23,24,25].
Today numerous additive manufacturing (AM) technologies are known and applied in practice. Standard ISO/ASTM 52900:2021 defines seven categories of processes [26]. One of those is powder bed fusion (PBF), in which a thermal source selectively fuses regions of a powder bed. We talk about sintering when material is not melted or partly melted and melting when the fused part of the material is totally melted during the process.
Selective laser melting (SLM) is a PBF AM technology, which applies a laser beam as the thermal source, and fuses material with total melting. When SLM is applied to metals, it is sometimes called direct metal selective laser melting (DMSLM). In this paper we talk about the SLM of Ti6Al4V alloy, and for the sake of simplicity we refer to this process as SLM.
In the SLM process, metal powder is used as feedstock. The process is realized in a closed chamber filled with inert gas, like argon. Before melting, a blade spreads a thin layer with thickness 0.01–0.1 mm in magnitude. Then, the laser beam scans and melts regions of the surface of the metal powder which are to be joined to the part under construction. After scanning a new powder layer is spread, and the process is repeated. SLM is a layer-by-layer manufacturing technology.
Properties of parts resulting from SLM are dependent on all processing parameters [27,28,29,30], as is the case for almost all AM methods [31]. After the SLM procedure, usually postprocessing must be applied in order to achieve the required quality of the part [9,32].
In our experiments, sample parts were produced by an EOS M290 400 W SLM machine. Diamond burnishing was applied as a postprocessing procedure to modify shape accuracy.
Previously, the authors of this paper studied the dimensional and shape accuracy of SLM-ed parts without any postprocessing [33,34]. Investigations showed that inaccuracies are dependent on SLM processing parameters. The influence of SLM processing parameters and burnishing parameters on the surface roughness improvement in selective laser-melted Ti6Al4V parts by sliding friction diamond burnishing was studied [35], and it was demonstrated that all factors impact the ratio of improvement. However, the effect of sliding friction diamond burnishing in shaping accuracy has not yet been studied following SLM of the Ti6Al4V alloy.
The aim of this study is to set up, perform and evaluate experiments for exploring how laser power, laser scan speed (SLM processing parameters) and burnishing speed, and feed and force (postprocessing parameters) influence the improvement in shape accuracy, namely the roundness parameters of cylindrical test specimens made of the Ti6Al4V ELI alloy.
2. Materials and Methods
In this section, the Ti6Al4V ELI material, selective laser melting applied for production of test specimens, measurement methods for roundness, sliding friction diamond burnishing as a postprocessing method, the design of experiment and sample production are introduced.
2.1. Measurement of Roundness, Geometry of Test Specimens
In this paper, the two most frequently used roundness parameters, roundness total (RONt) and cylindricity (CYLt), are investigated.
An introduction to metrology of rotationally symmetric parts can be found in [32]. Measurement of a cylindrical form in general involves fixing spatial point coordinates along several reference circles, usually laying in equidistant planes. In our work, we applied 12 reference circles so that neighbours are separated by 2 mm from each other.
Roundness total is related to measurement data on a single reference circle. A circle fitted by the least-squares method is determined first. This is the least-squares reference circle (LSCI), and its centre is referred as the least-square centre. Maximum deviation of measurement data in radius from LSCI outward is the peak, and maximum deviation inward is the valley. Separation of peak and valley is roundness total (RONt). It is given in a distance unit like millimetre or micrometre.
Cylindricity (CYLt) is defined by the same scheme as RONt, the difference being that it refers to cylinders. First a cylinder is fit to all measurement data on a certain cylindrical test specimen by the least-squares method; this is the least-squares cylinder (LSCY). This means that data along all the reference circle on a specimen (in our experiments 12 reference circles) are considered. Peak means the largest distance of measurement data outward from LSCY, whereas valley means largest distance inward. Separation of peak and valley is defined as cylindricity CYLt, and it is given in a distance unit.
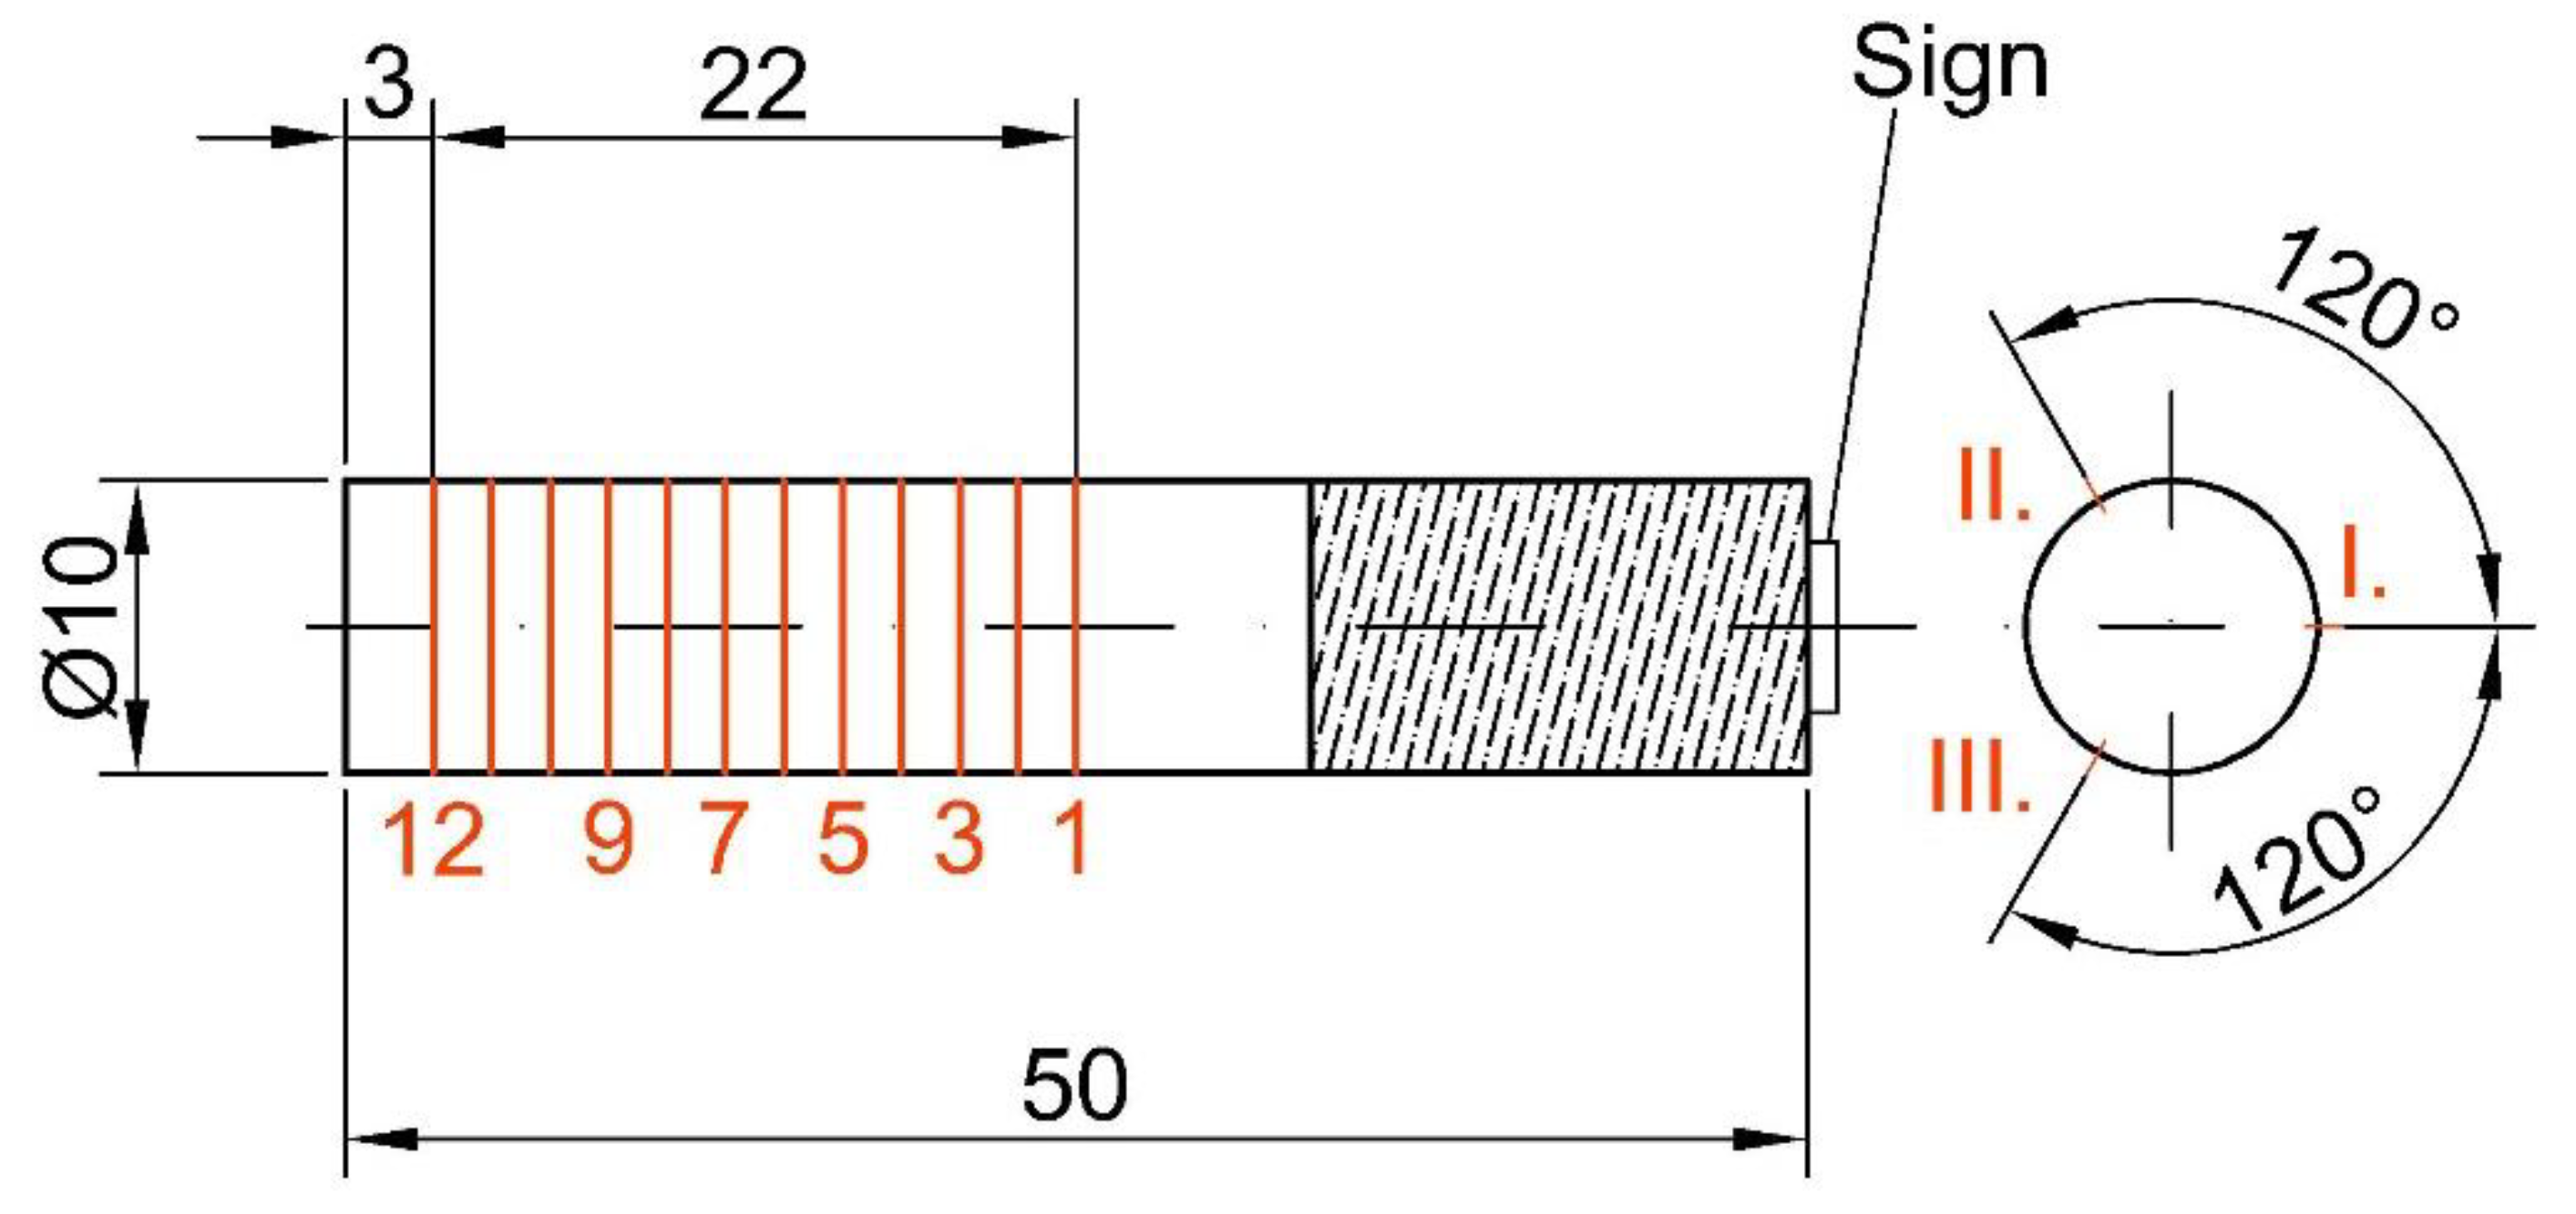
Test specimens were designed as cylinders with 10 mm diameter and 50 mm height, as shown in Figure 1. Manufacturing with the SLM method was carried out in a vertical direction. For each SLM parameter set, eight test specimens were produced.
Figure 1 also demonstrates the pathways of cylindricity measurements. We used 12 equidistant circles. The spatial position of three points on each circular path was measured at equal angular distance (120°). Thus, coordinate data of 36 points were collected for a single test specimen. From these data, cylindricity (CYLt) and roundness total (RONt) were derived for each test specimen. For a single specimen 12 RONt data were calculated from measurement points along the 12 circles, and a single CYLt.
2.2. Sliding Friction Diamond Burnishing
In [23], a brief summary can be read on sliding friction diamond burnishing (SFDB) and its application to cylindrical parts. Here we emphasize that diamond tool is static (does not roll, but slides), is pressed to the specimen with burnishing force (F) and moved parallel to turning axis with burnishing feed (f). The relative velocity of the burnishing tool and the specimen is denoted by v.
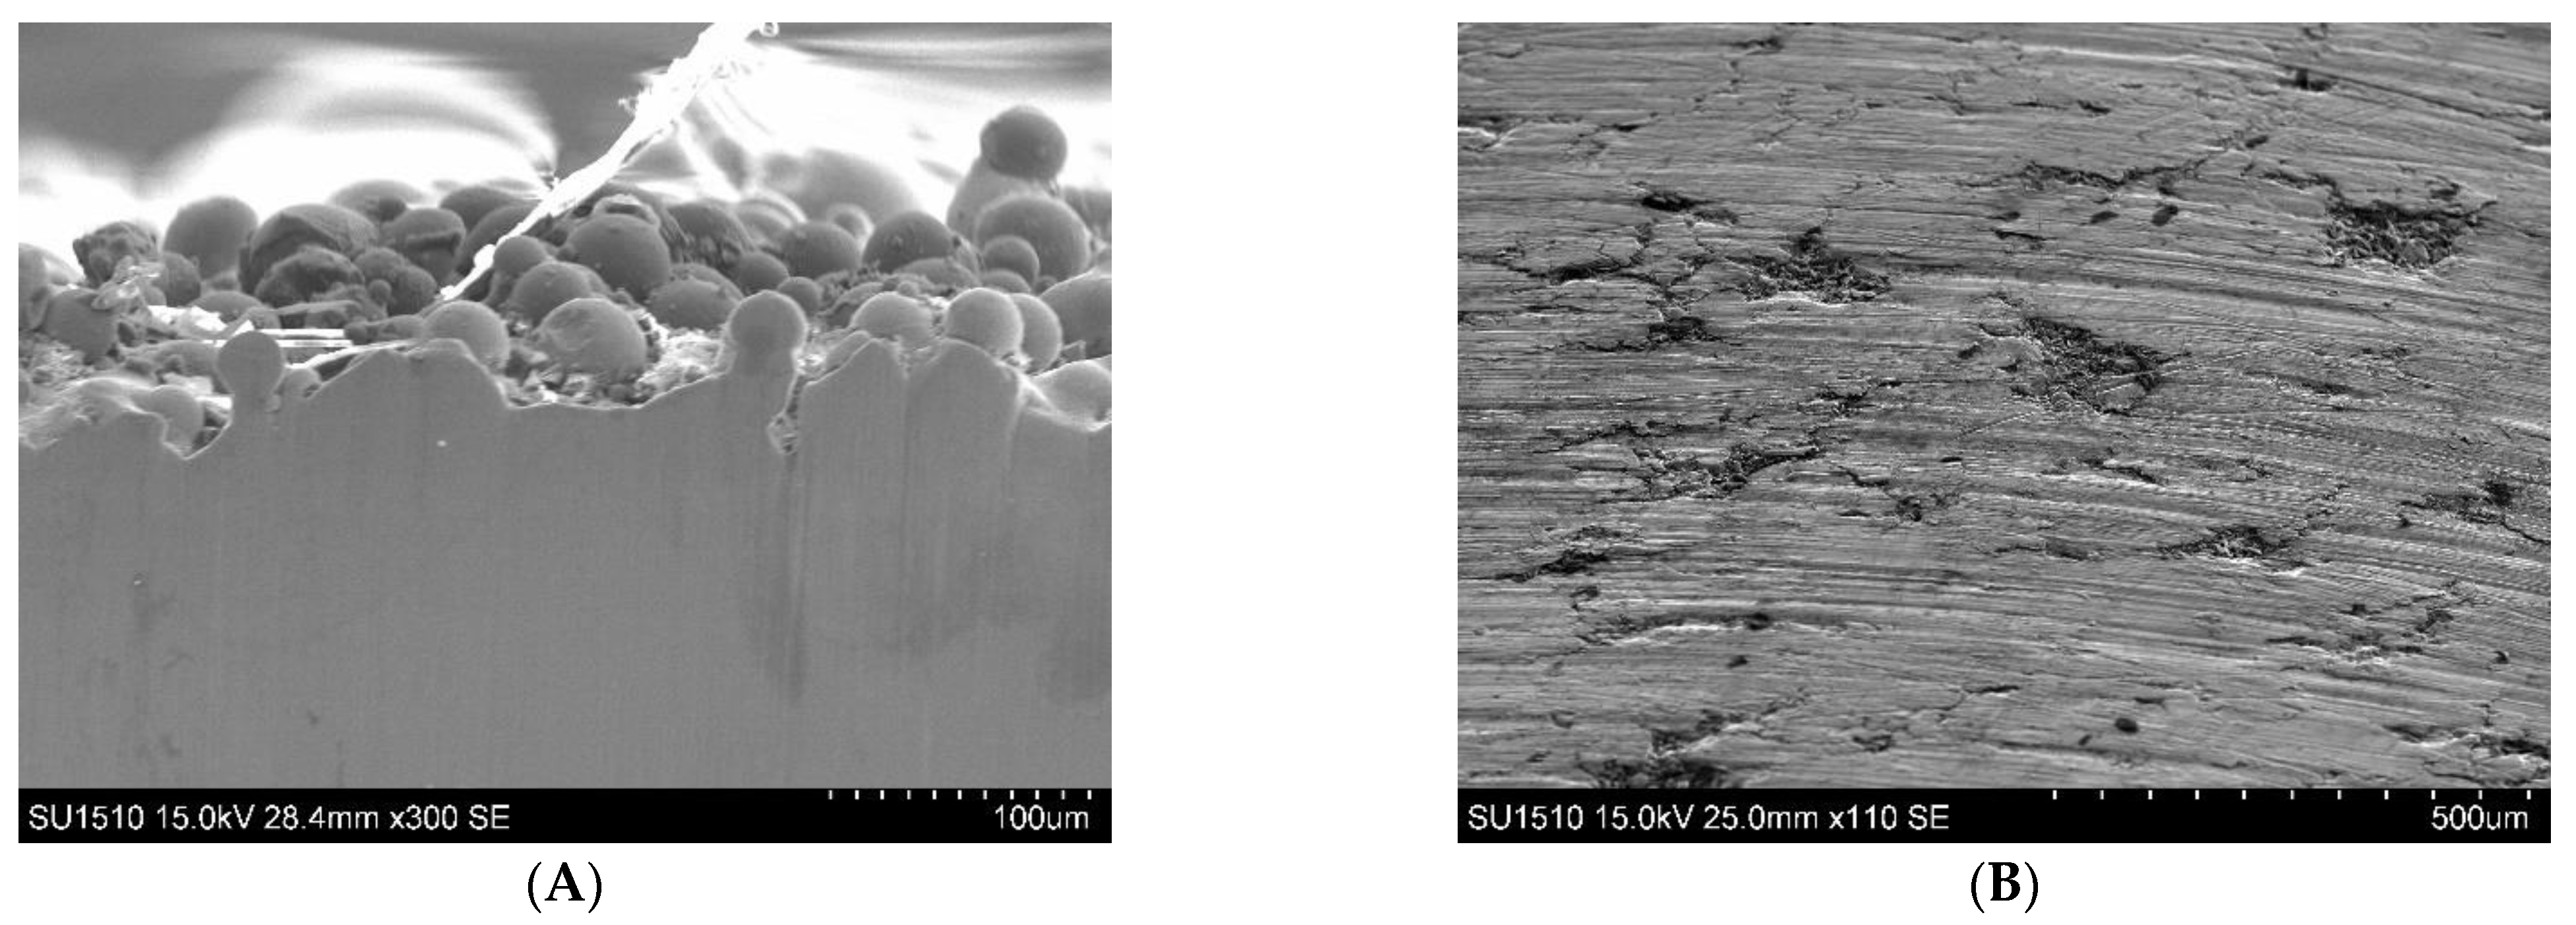
SFDB modifies the surface of the specimen, causing morphological changes. Figure 2 shows two electron microscopic images, one being the raw surfaces of a specimen after manufacturing and before burnishing, and another being a specimen after SFDB. Peaks may suffer plastic deformations, valleys may be filled in so that the surface becomes more compact, and as a result surface roughness and surface hardness can be improved.
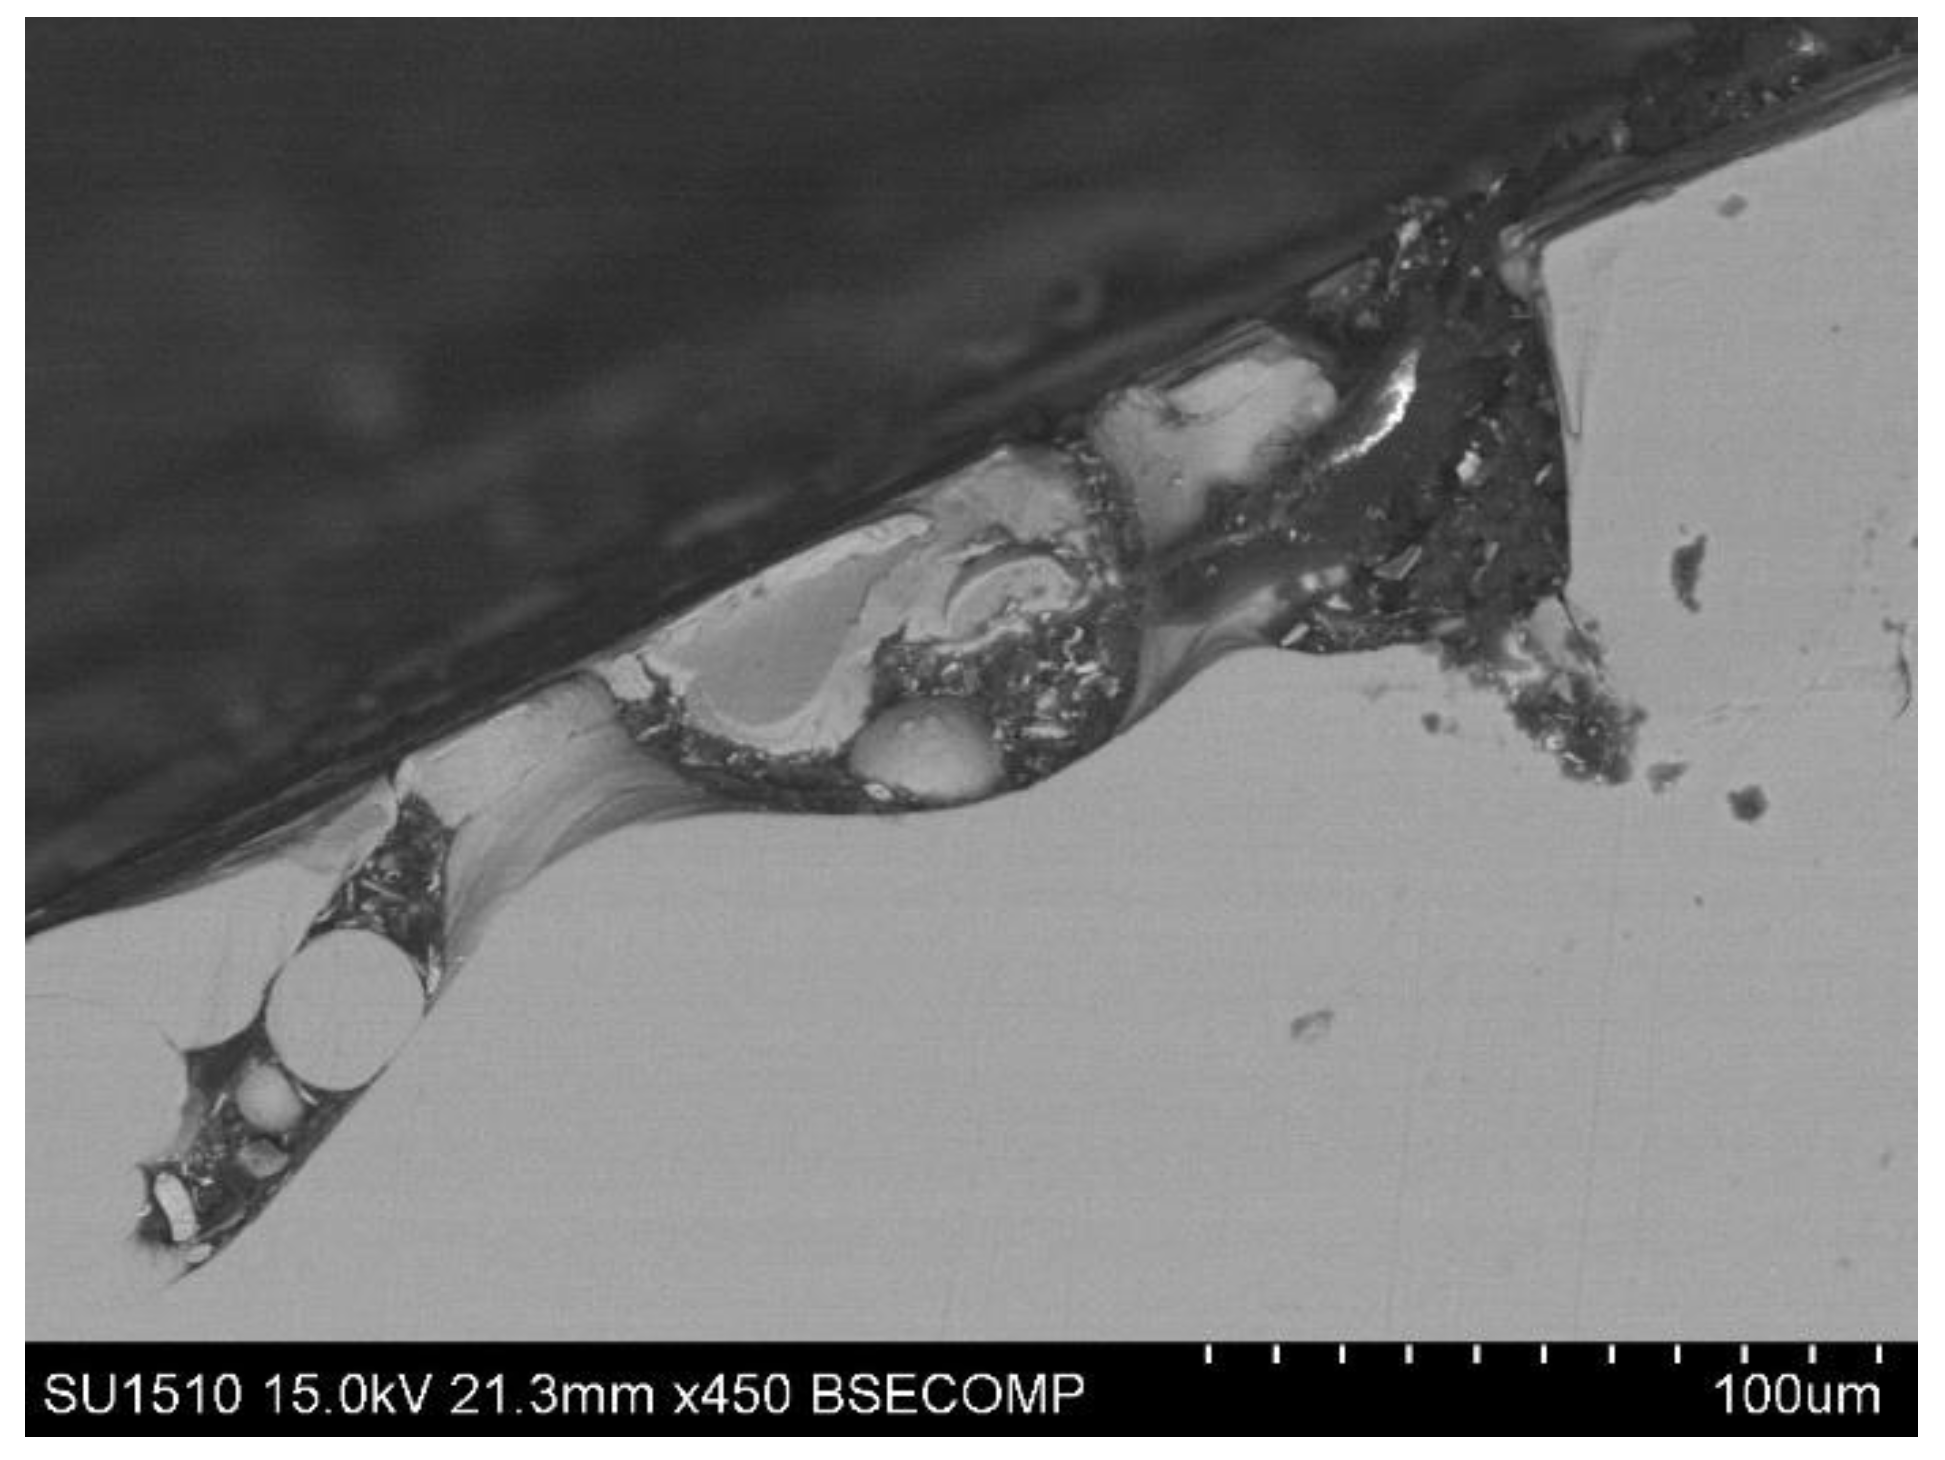
Figure 3 shows modified surface morphology on the cross section of sample E1. Unchanged internal pore defects located relatively far from surface are also observable. In our work the surface is modified by SFDB, and the internal pore defects are left mostly unchanged.
In our experiments we investigated how SFDB influenced the shape accuracy of the specimen. An effect is expected because the main relative movement of the tool and specimen’s side takes place along the cylindrical surface.
2.3. Sample Production and Design of Experiment
Five groups of test specimens were produced with different SLM processing parameters. Each group involved eight test specimens. Infill laser power (P) and infill laser scan speed (u) were used as factors. Layer thickness (t) was set to 0.03 mm, hatch distance (h) to 0.14 mm, and both were kept constant. All other process parameters of EOS M290 400 W machine were left at default value. Here it is noted that default value of P is 280 W, and of u is 1200 mm/s.
In SLM technology, there is a widely used quantity for describing the procedure—the so-called energy input (e). It is calculated as e = P/uht, and its unit is W/mm3. More precisely, we could call it power density input into the lightened (scanned) part of the powder layer. This is neither an independent parameter, nor a factor, but can be calculated from factors.
In Table 1, one can see that the A, B, D and E parameter settings form a two-factor, two-level full factorial experiment. Parameter set C is interesting because it has the same energy input as D and E, and so we will be able to make comparisons between cases with equal energy input.
Besides P and u, three additional factors were included in our experiments. Those are three parameters of SFDB: burnishing force (F), burnishing feed (f) and relative velocity (v). All have two values forming a three-factor, two-level full factorial sub-experiment. Table 2 shows values of these factors.
These technological parameters were applied for all the additively manufactured specimen groups. Notations of specimens are built up from letters of groups (A–E) and numbers from Table 2 referring to the burnishing parameter set.
Eventually we have a five-factor, two-level full factorial experiment. Additionally, sample set C is also investigated because it has the same energy input as D and E.
2.4. Statistical Methods
After an experimental data collection statistical investigation was performed to clear up which factors have significant effect on roundness properties, as well as to determine what the functional relation is between factors and roundness total and cylindricity, two software tools were applied.
Programming language R 4.2.1 was used for three tasks. First, a general overview of data distribution was created in the form of boxplots. These plots are faceted by factors to qualitatively reveal the influence of certain factors on improvement ratios. Since we have five factors, a single plot is not enough for this, because at most the effects of three factors can be visualized on a faceted boxplot. That is why we prepared a boxplot using the two SLM parameters, and another one with the three burnishing parameters. Our second task with the R programming environment was seeking a mathematical model which fits best to our experimental data. The step() function of R was applied for this purpose. This function requires a starting formula of the mathematical model, and then automatically generates another formulas by eliminating terms containing exiguous information. This is determined by seeking the model with the smallest value of Akaike’ information criterion (AIC). The third application of R was the ANOVA investigation to find out which factors and interaction terms play significant roles in roundness parameter modification. The aim of ANOVA is to distinguish differences caused by factors from differences caused by measurement errors (noise).
For, since it is known in general that material properties of AM-manufactured parts are dependent on processing parameters, we performed function fitting by burnishing parameters in each group of test specimens A–E. We may remember that the groups differ from each other in SLM processing parameters according to Table 1. This task was attained by Mathcad 15 software.
Before statistical calculations were conducted by the software, the main effects and interaction effects of factors were calculated. We applied these quantities to estimate the importance of the role of factors in changing roundness parameters. The main effect of a certain factor in case of two-level factors is defined as the signed sum of measurement results (y) divided by the number of repetitions (n). A sign is positive (+) if the factor is at higher level in the experiment, and negative (−S) if the factor is at a lower level in the experiment. So, the sign depends both on which factor is investigated, and which experiment the measurement result stems from. Let us denote the sign of a factor level in an experiment as . The main effect (ME) of a factor can be calculated as
Interaction (IE) of two factors can be calculated as
3. Evaluation of Results
3.1. Data Visualization and ANOVA
The roundness data RONt and CYLt measured for each test specimen are listed in Appendix A, Table A1. The mean value and standard deviation of roundness data are summarized in Table 3. Roundness parameters decreased with SFDB, which means that test specimens became more cylindrical. One can say that peaks and valleys moved closer to each other.
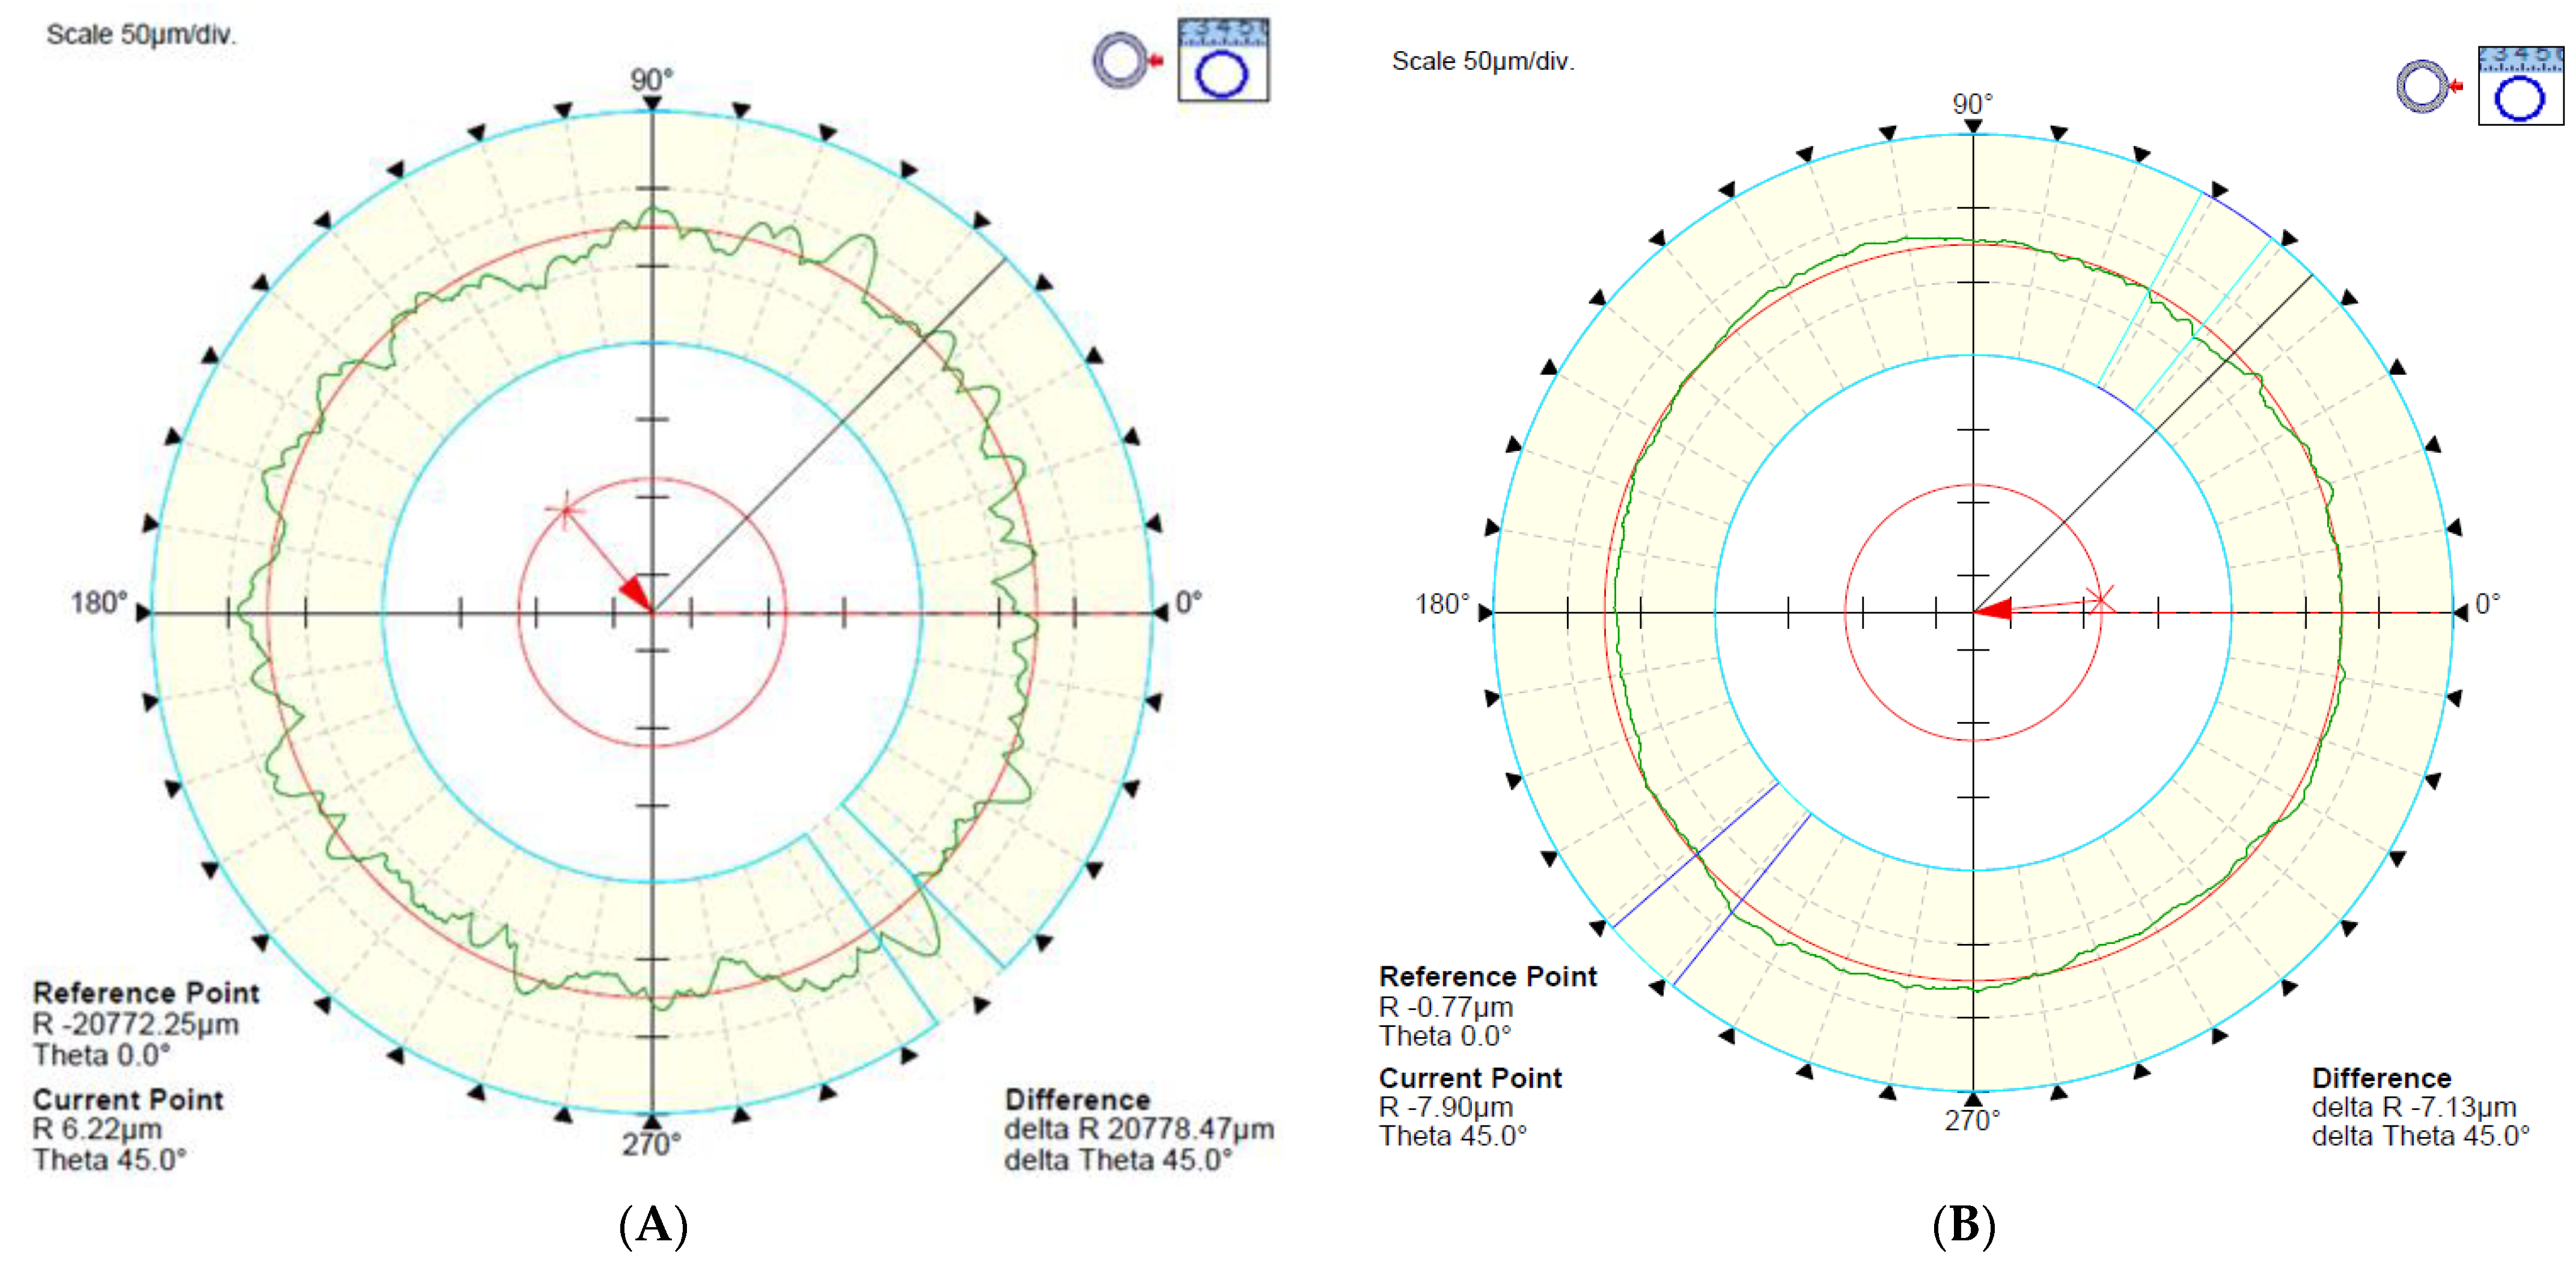
As an example, Figure 5 demonstrates the roundness error diagram before and after burnishing in the middle of sample signed E08 (Figure 1). In Figure 1, there is a numbering in orange, indicating the measurement locations of the various roundness errors. The 6th measurement location is in the middle, and the Figure 5 shows the roundness error measured here before (Figure 5a) and after burnishing (Figure 5b). We note that the scale of Figure 5a,b is the same, measuring at 50 μm/div. Knowing this, the improvement in roundness can be seen from Figure 5.
To the quantitative characterization of change in roundness features, we introduce so-called improvement ratios according to following formulas:
where:
IRONt—improvement ratio of RONt (roundness total) in percentage (%),
RONtb—average of RONt values for the given test specimen before SFDB in micrometers,
RONta—average of RONt values for the given test specimen after SFDB in micrometers,
where:
ICYLt—improvement ratio of CYLt (cylindricity) in percentage (%),
CYLtb—CYLt values for the given test specimen before SFDB in micrometers,
CYLta—CYLt values for the given test specimen after SFDB in micrometers.
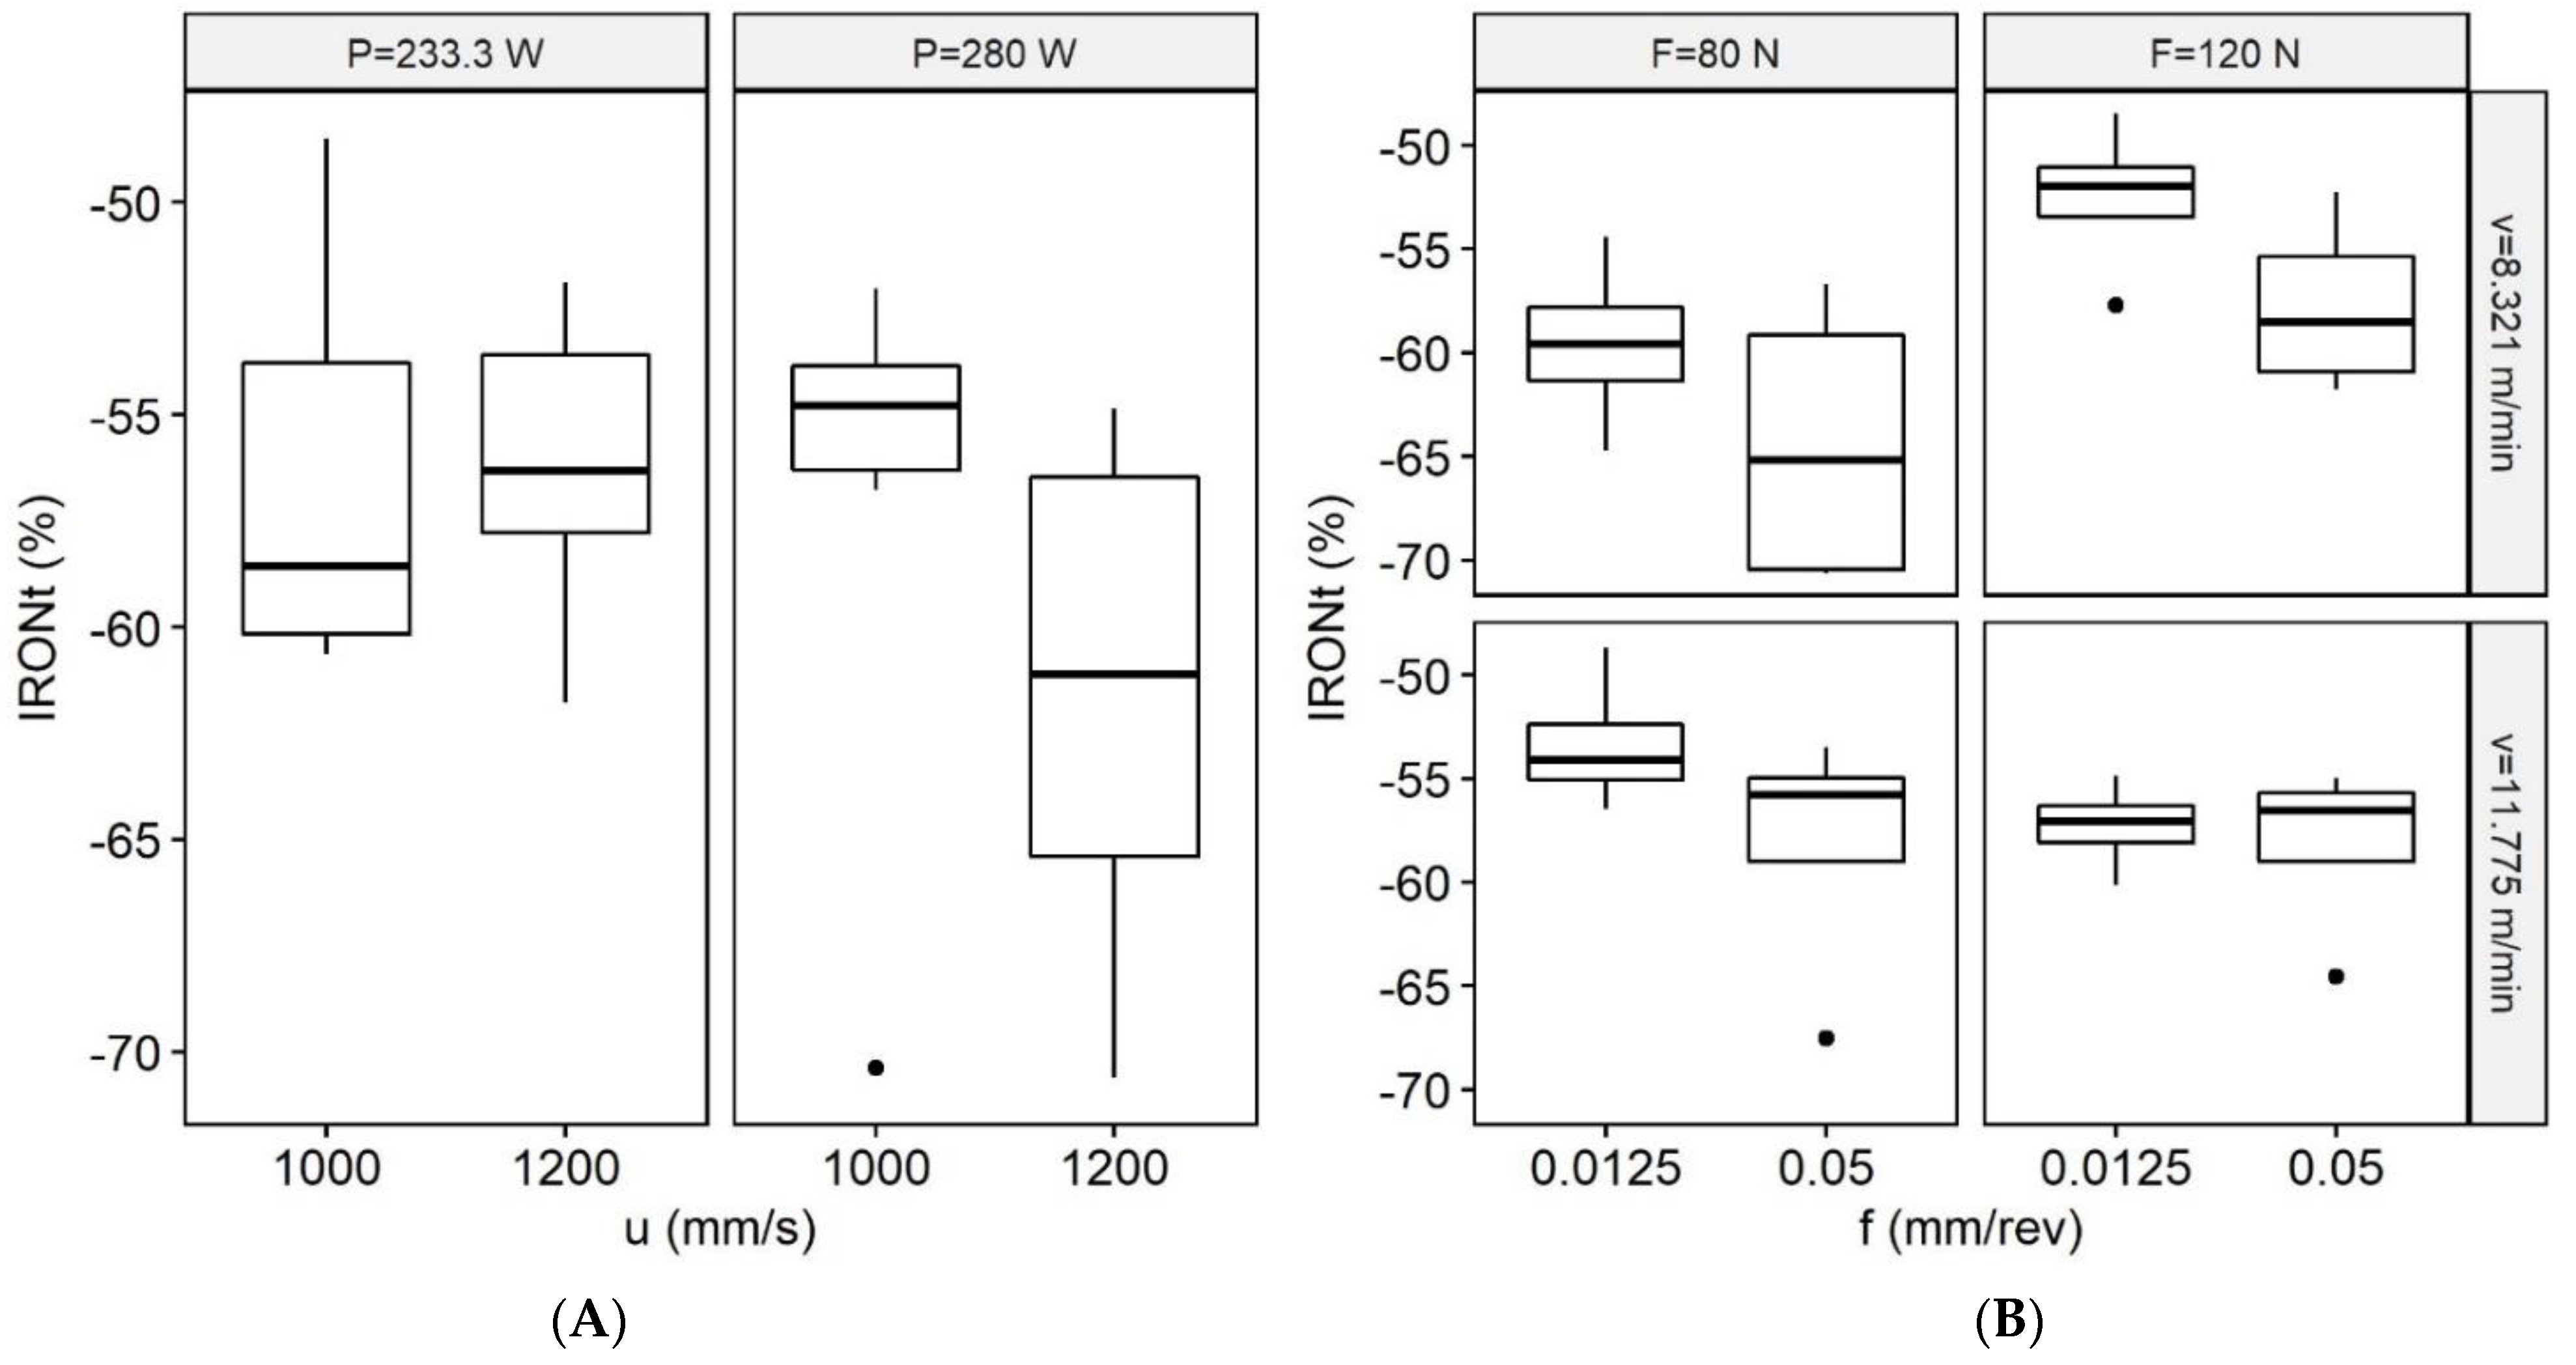
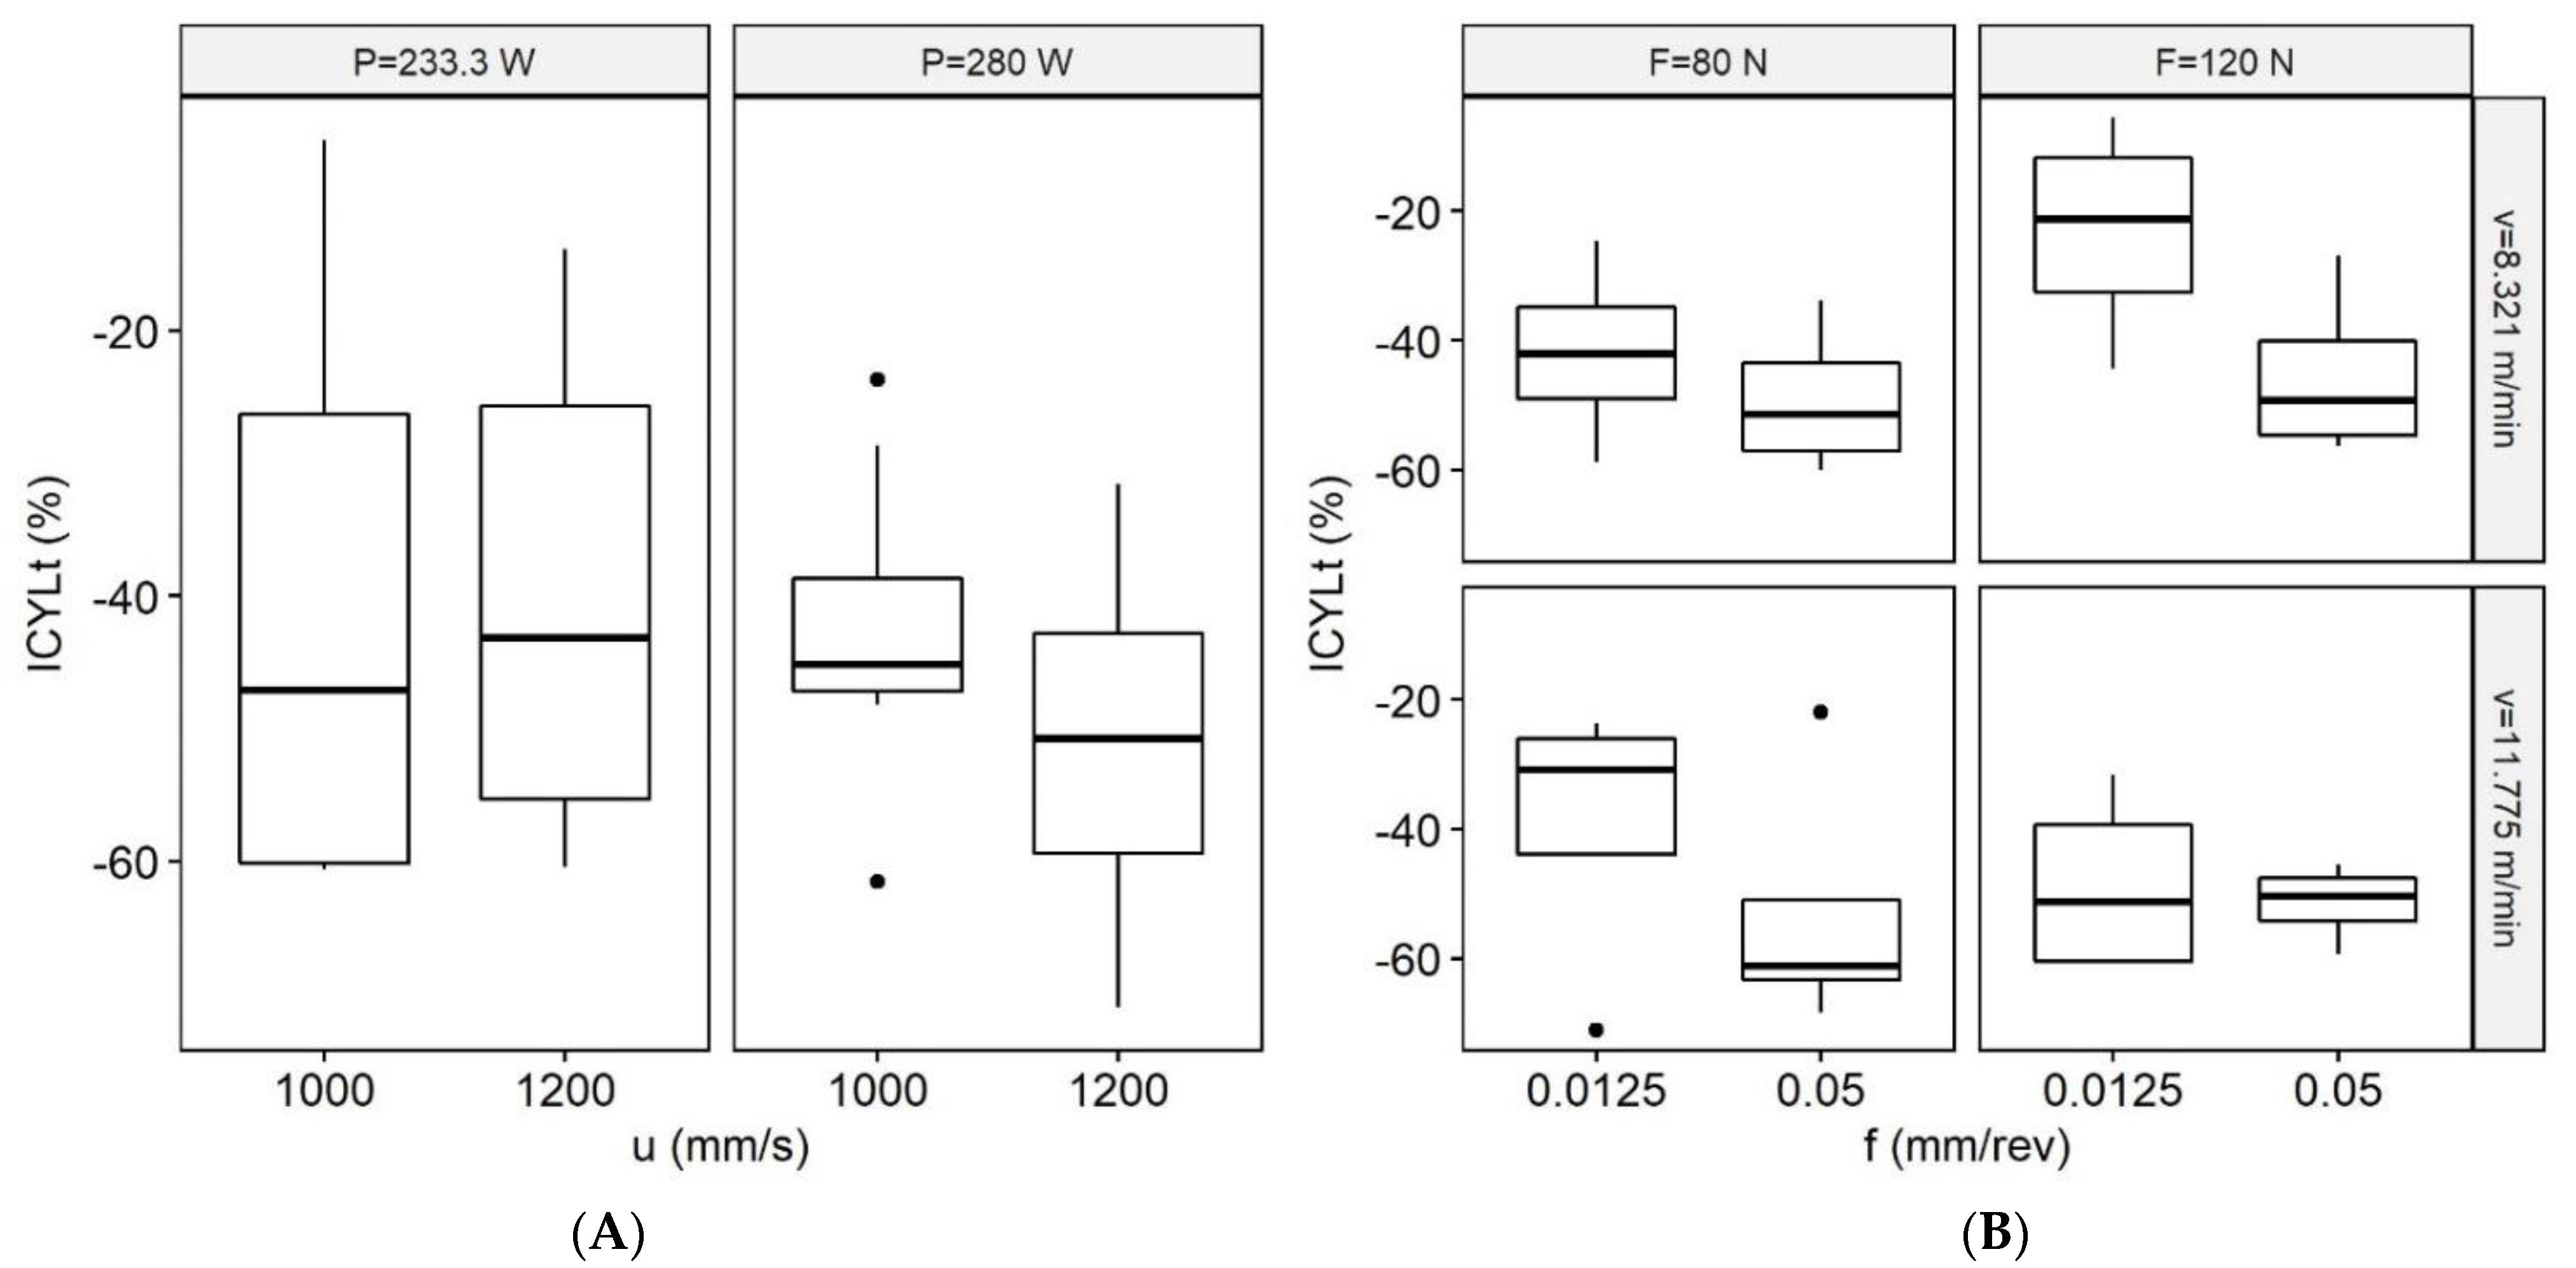
Boxplots provide simple visualization tools for comparison of data belonging to different levels of factors. Figure 6 and Figure 7 show boxplot diagrams of improvement ratios IRONt and ICYLt, respectively. On the left side are boxes derived using SLM parameters, and on left side boxes derived using burnishing parameters are shown. Thick lines indicate mean values, boxes represent lower and upper quartiles, and dots show outliers.
Since groups of tests specimens, A, B, D and E belongs to a five-factor, two-level full factorial experiment, we can calculate the main effects and interactions of factors for th3e improvement ratio of both roundness quantities measured.
In Table 4 and Table 5, letters P, u, v, f and F refer to the main effect of factors P, u, v, f and F, while letter combinations like Pu refer to interactions of factors.
Table 4 shows that burnishing feed has the largest main effect on IRONt, and the SLM parameters laser power and laser scan speed also have strong effect. The largest interaction term belongs to vF. Furthermore, Pu and PF are also large. There are only two negative values in Table 3, and those are small in magnitude.
Concerning ICYLt, Table 5 demonstrates generally larger values than those in Table 3. Burnishing feed has the maximum main effect, others have significantly less of an effect, and burnishing speed has a negative value. The largest interaction term belongs to vF (the same as for IRONt). There are also four other interactions with absolute values close to each other and larger than others: Pu, PF, uv, and uf, which is negative. For cylindricity, we see four negative values in Table 4, two of which are relatively large.
In Appendix B the preliminary statistical considerations are presented.
3.2. Experimental Formulas for Groups
Empirical formulas were fit to data to obtain a detailed idea about how improvement ratios of roundness parameters depend on experimental factors. Formulas were derived separately for each group of test specimens from A to E.
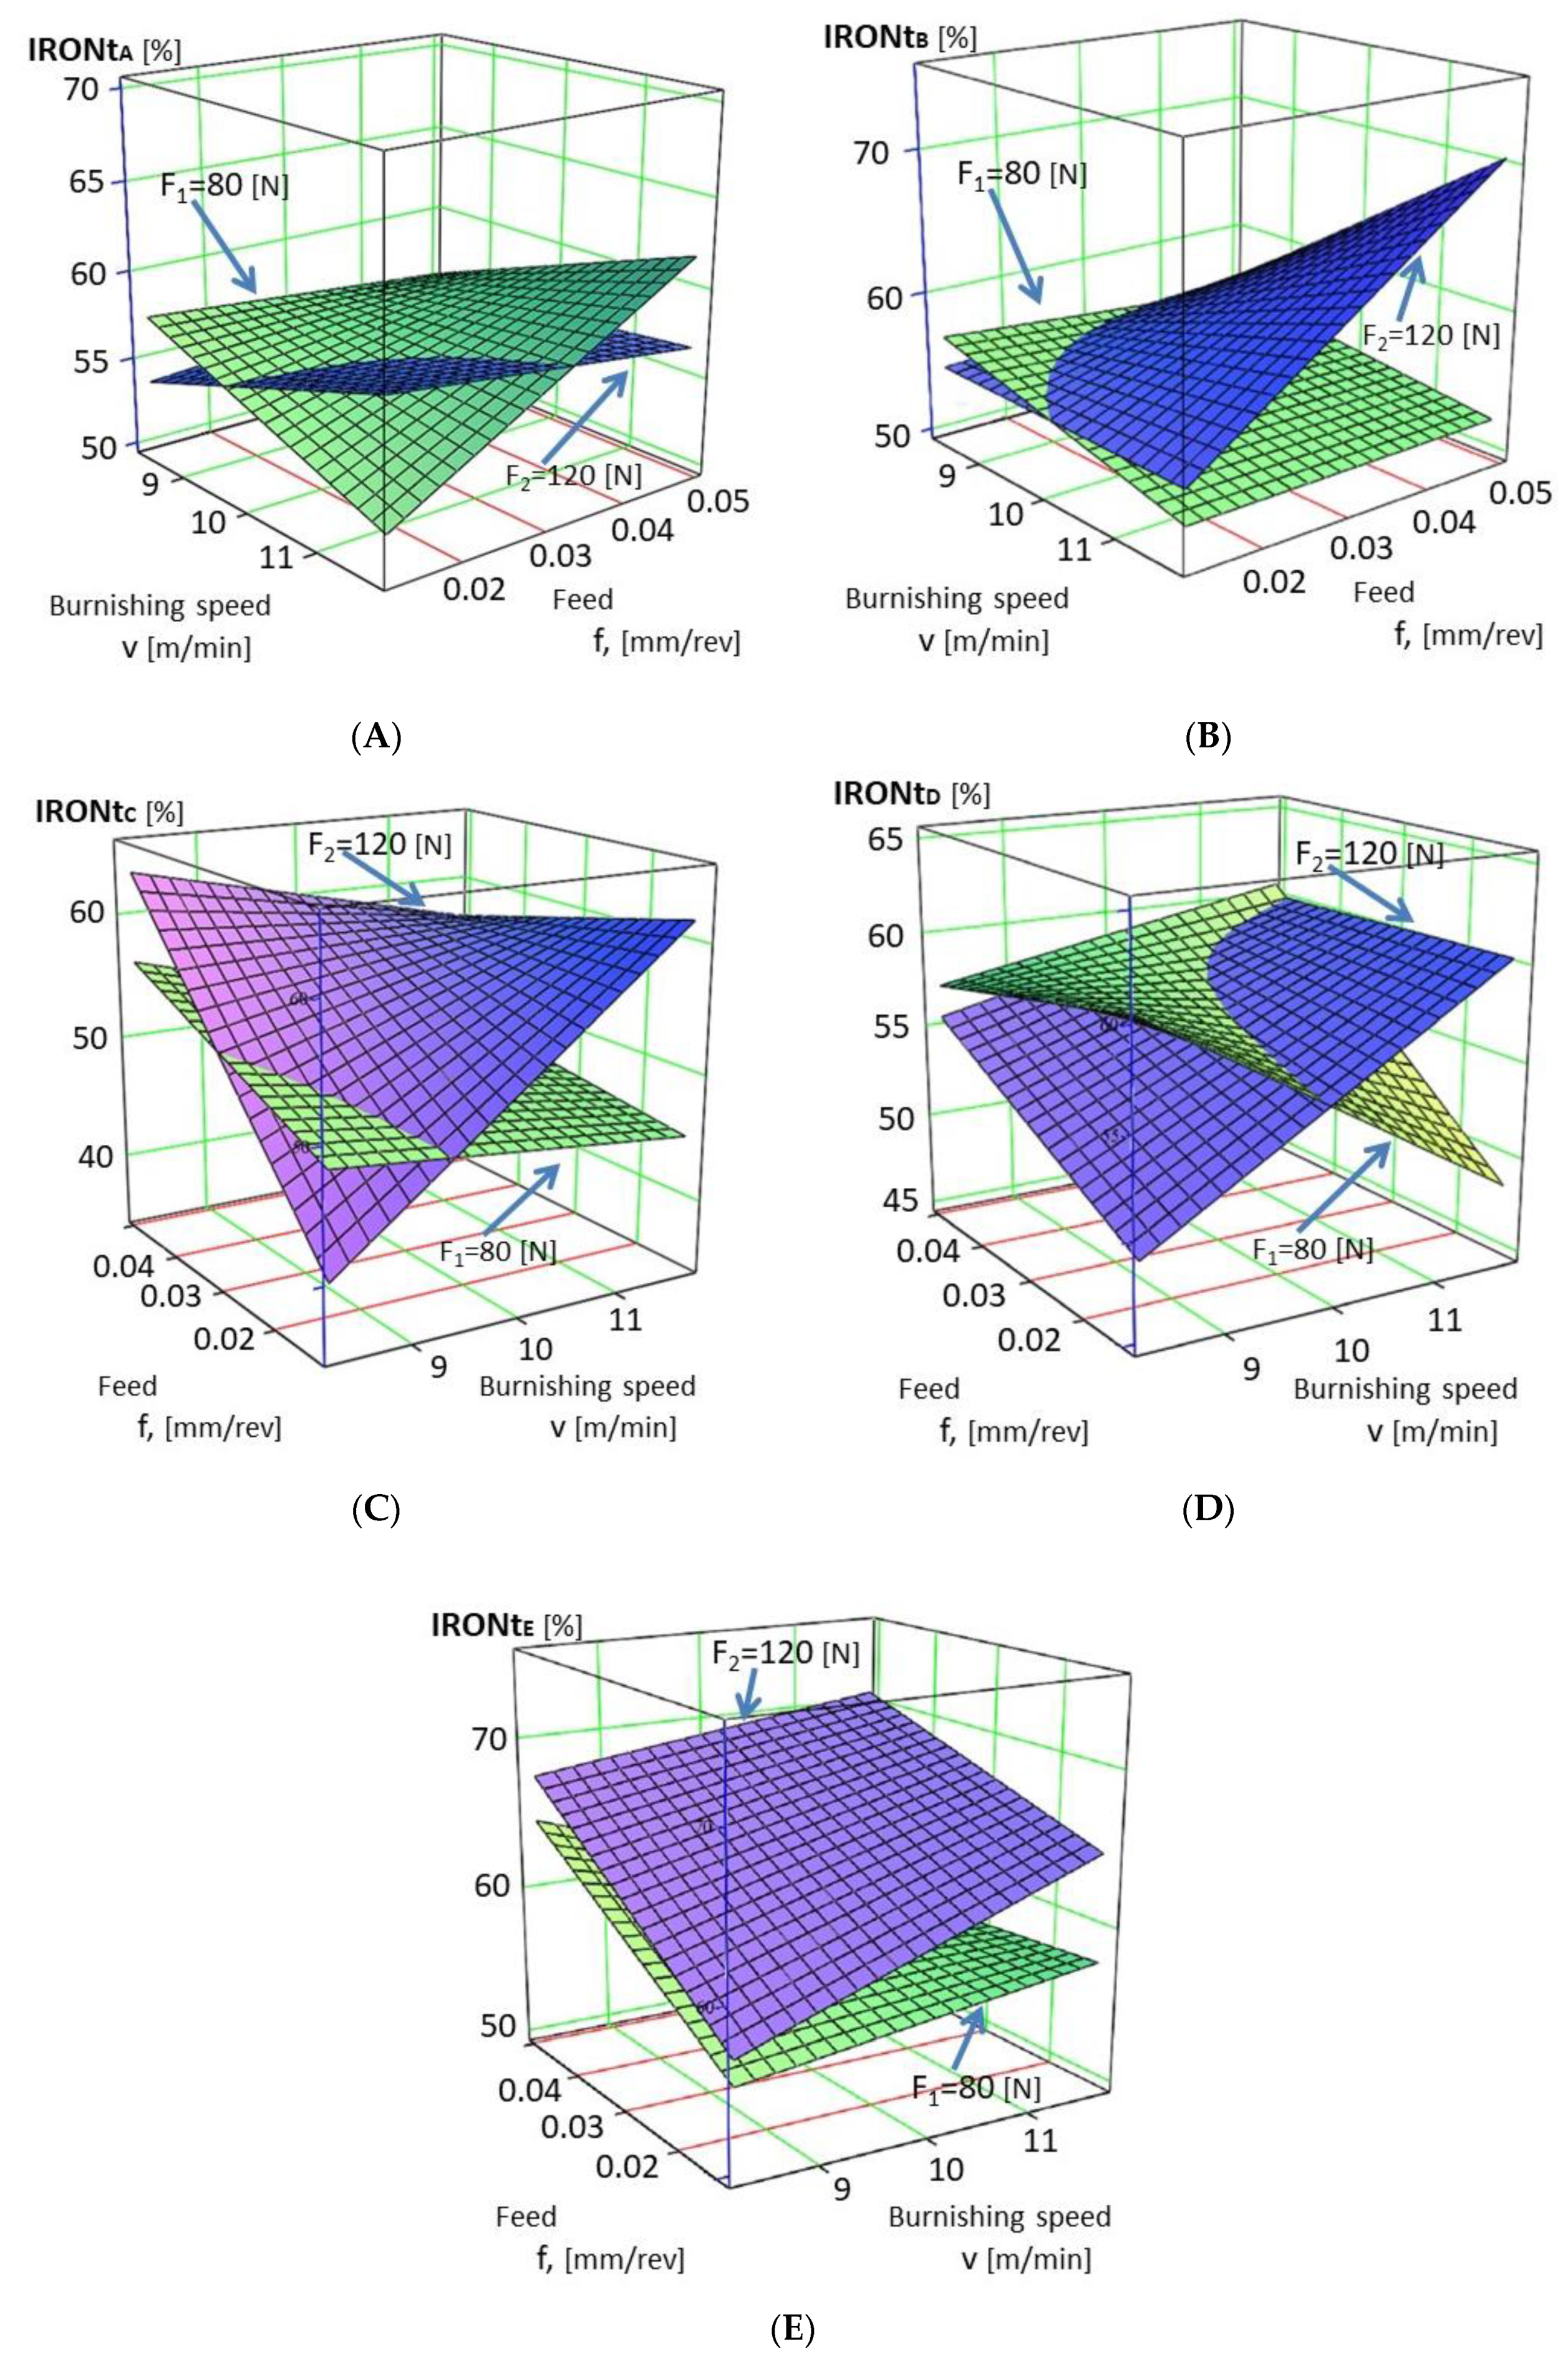
Figure 8 contains five plots belonging to groups A–E. Each plot shows roundness total improvement ratio as a function of burnishing speed and velocity. One of two surfaces belongs to burnishing force F = 80 N, and the other belongs to F = 120 N. Equations (5)–(9) are plotted in Figure 8.
4. Discussion
We have obtained roundness data of cylindrical test specimens, both before burnishing and after burnishing. Data of the before burnishing state does not depend on burnishing parameters, only on the SLM parameters involved as factors: infill laser power and infill laser scan speed. So, these data are comparable with dimensional accuracy data of the SLM-manufactured Ti6Al4V parts reported in references. In the introduction, we saw that the literature has reported that dimensional inaccuracy can be decreased to 20 µm by optimizing SLM parameters.
Since our cylinders were fabricated in vertical direction, their alignment is identical with Figure 1 in [14] lengthwise and vertical terms. Figure 5 in [14] shows the width and thickness error of tensile test specimens made in this alignment. We can note that width and thickness in this case are horizontal dimensions, just like radius data of our cylinders along a special reference circle. Since RONt is the sum of the peak and valley, it is qualitatively comparable with the width and thickness errors of test specimens fabricated in the lengthwise vertical direction in [14]. In Table 3, the mean value of all RONt is 69.96 µm. In [14], width and thickness errors vary from 0.02 mm to 0.5 mm depending on the manufacturing parameters. Though SLM parameters are not the same, dimensional errors measured in the reference and the RONt value determined by us falls in the same magnitude.
One can observe in Table 4 and Table 5 that the maximum value of the main effect belongs to burnishing feed (f), and the largest interaction term is vF. It suggests that burnishing parameters are more determinative in roundness improvement than SLM parameters. However, when we inspect the second- and third-largest values, we can discover that SLM parameters are also included.
Among the test specimens produced with different SLM parameters, the best circularity error improvements (IRONt) were provided by the following specimens in order: E8, B8, C7, A4 and D4. In the specimen the label letters (A–E) refer to the SLM parameters according to Table 1, while the numbers indicate the burnishing technology parameters according to Table 2.
Based on our results, the recommended burnishing technology parameters to achieve the best circularity shape error improvements are as follows: vc2 = 11.775 m/min, f2 = 0.05 mm/rev and F2 = 120 N. The best cylindricity deviation improvements were experienced in the samples marked E5, B7, D7, A1 and C6, which were produced mainly at vc1 = 8.321 m/min, f1 = 0.0125 mm/rev and F2 = 120 N.
The method of function regression provides more detailed information.
It is apparent from the diagrams in Figure 6 that better improvement in circularity can be observed in the case of the larger burnishing force F = 120 N for all SLM parameter combinations, except Group A. Improvement in cylindricity increases with the increase in both burnishing feed and velocity. Consequently, it is advisable to apply higher values of SFDB parameters (v, f, F) in order to achieve effective improvement in circularity.
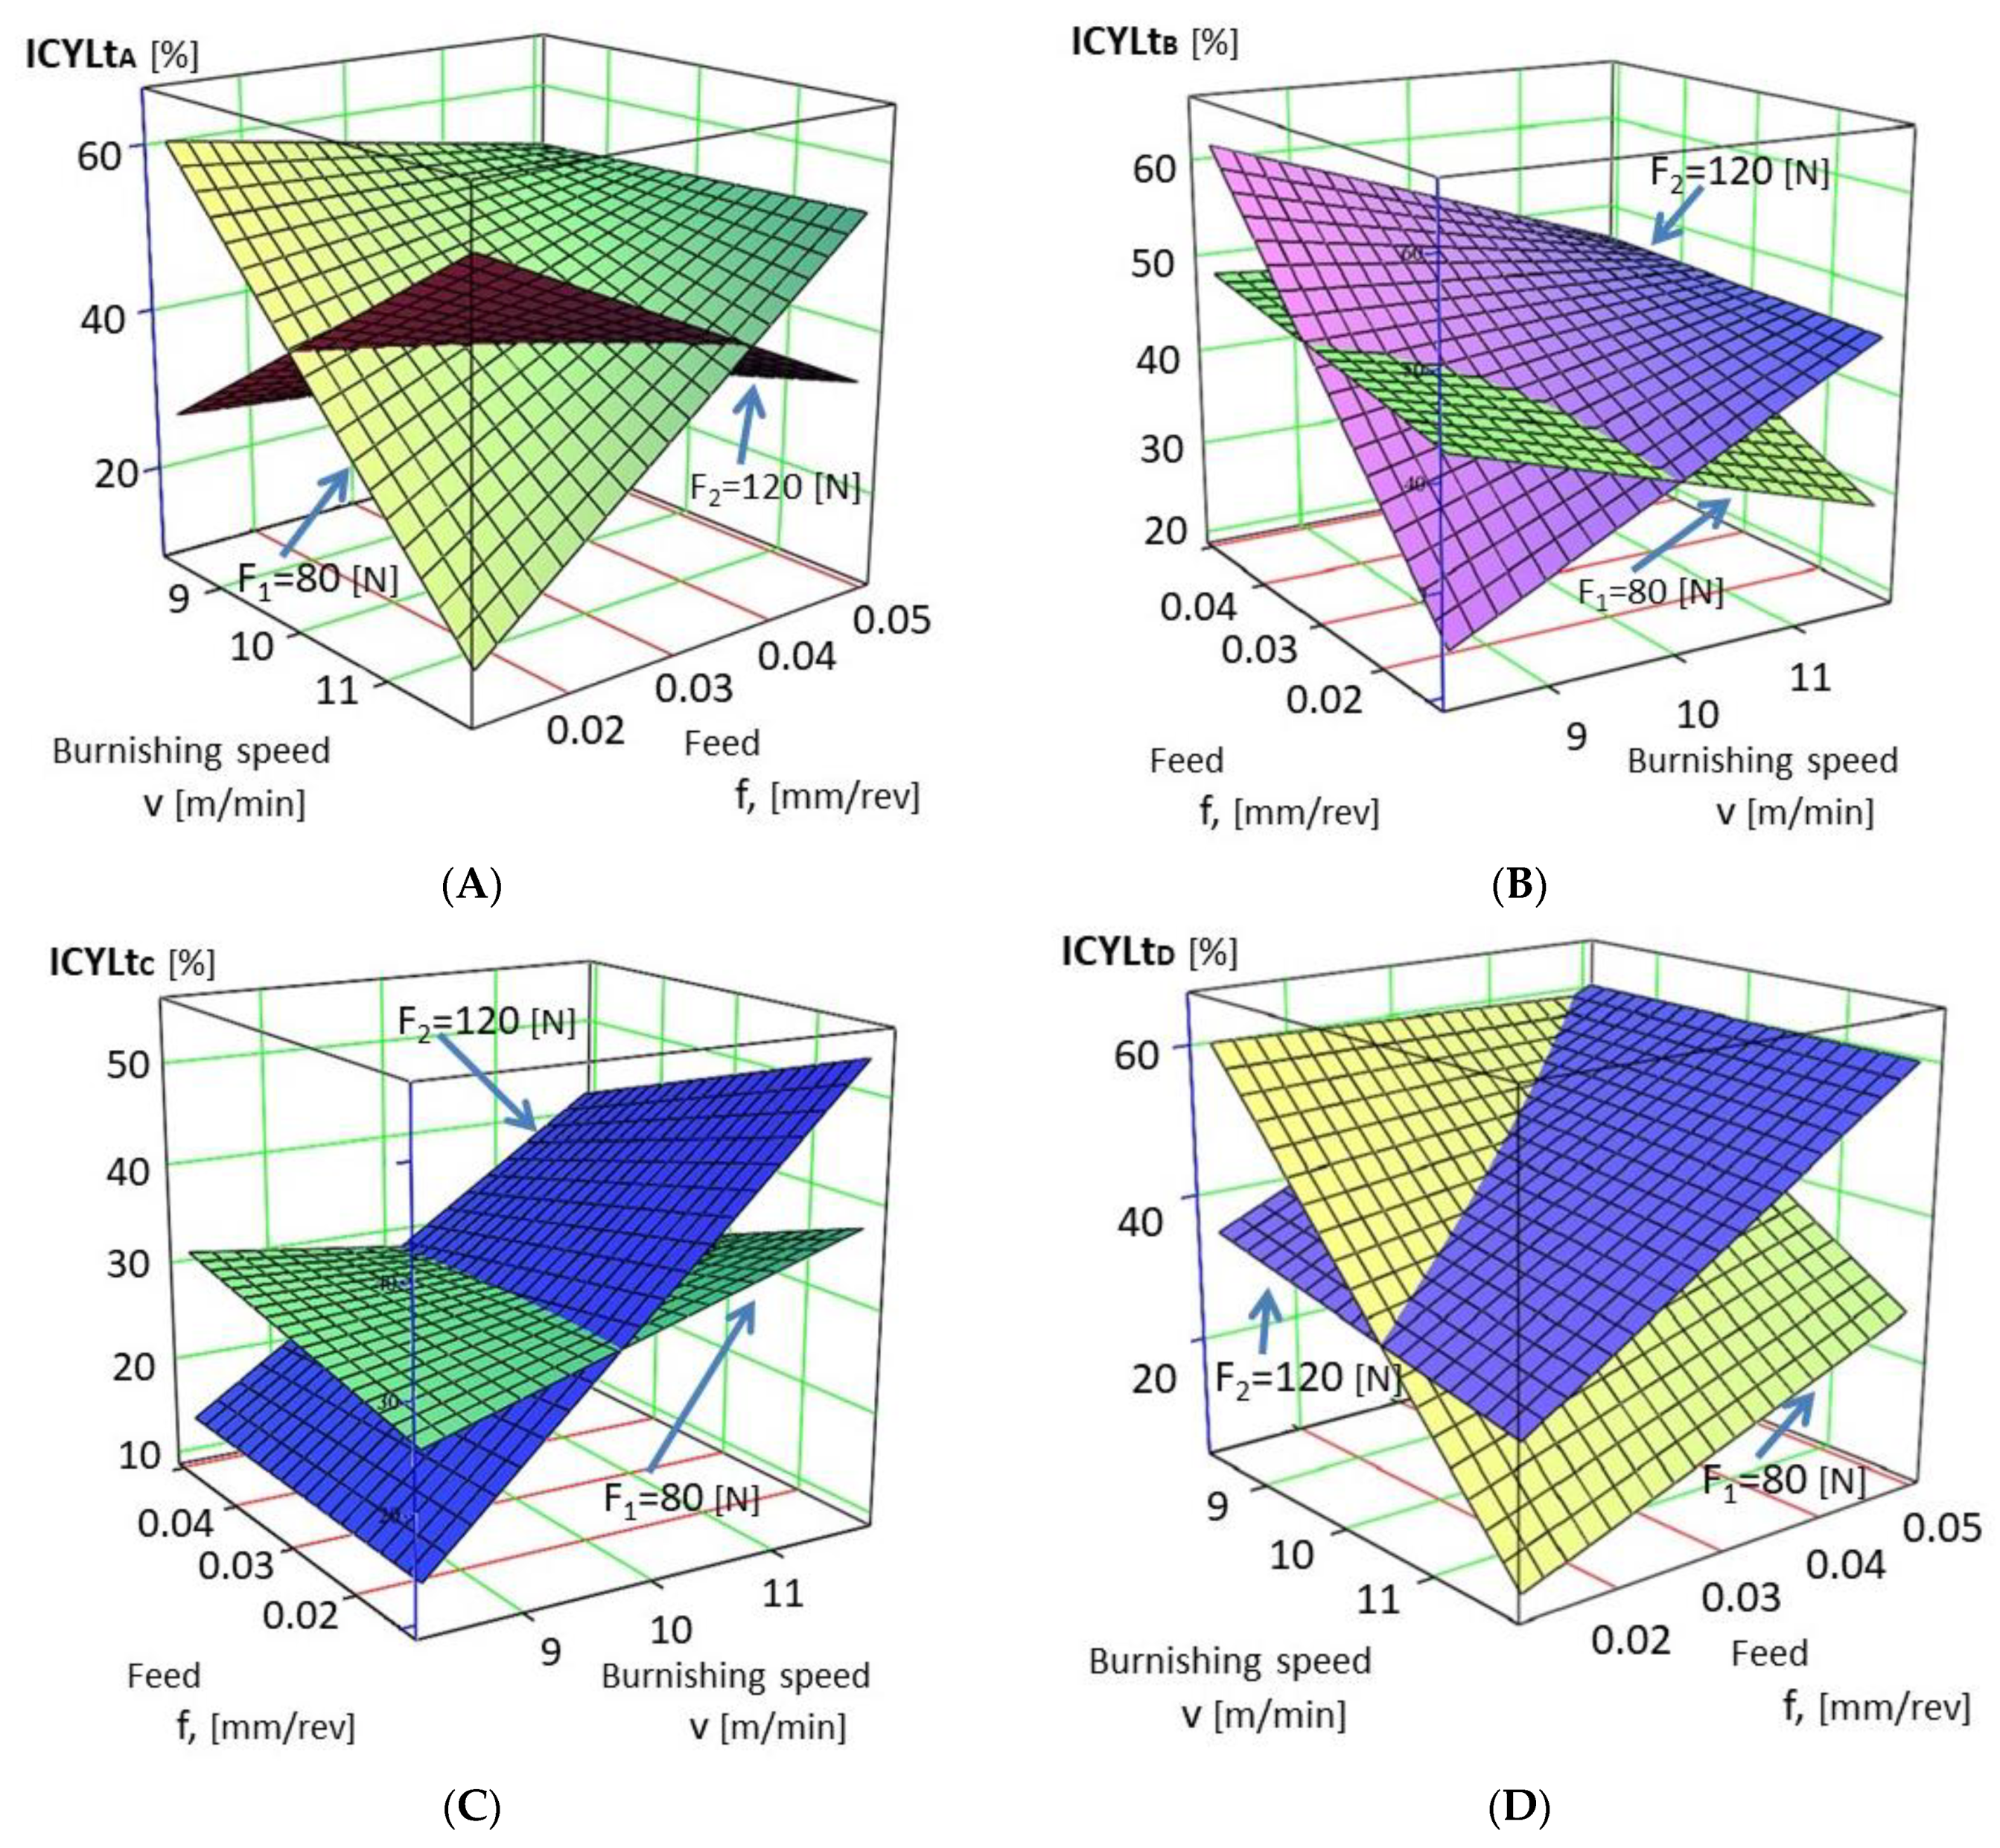
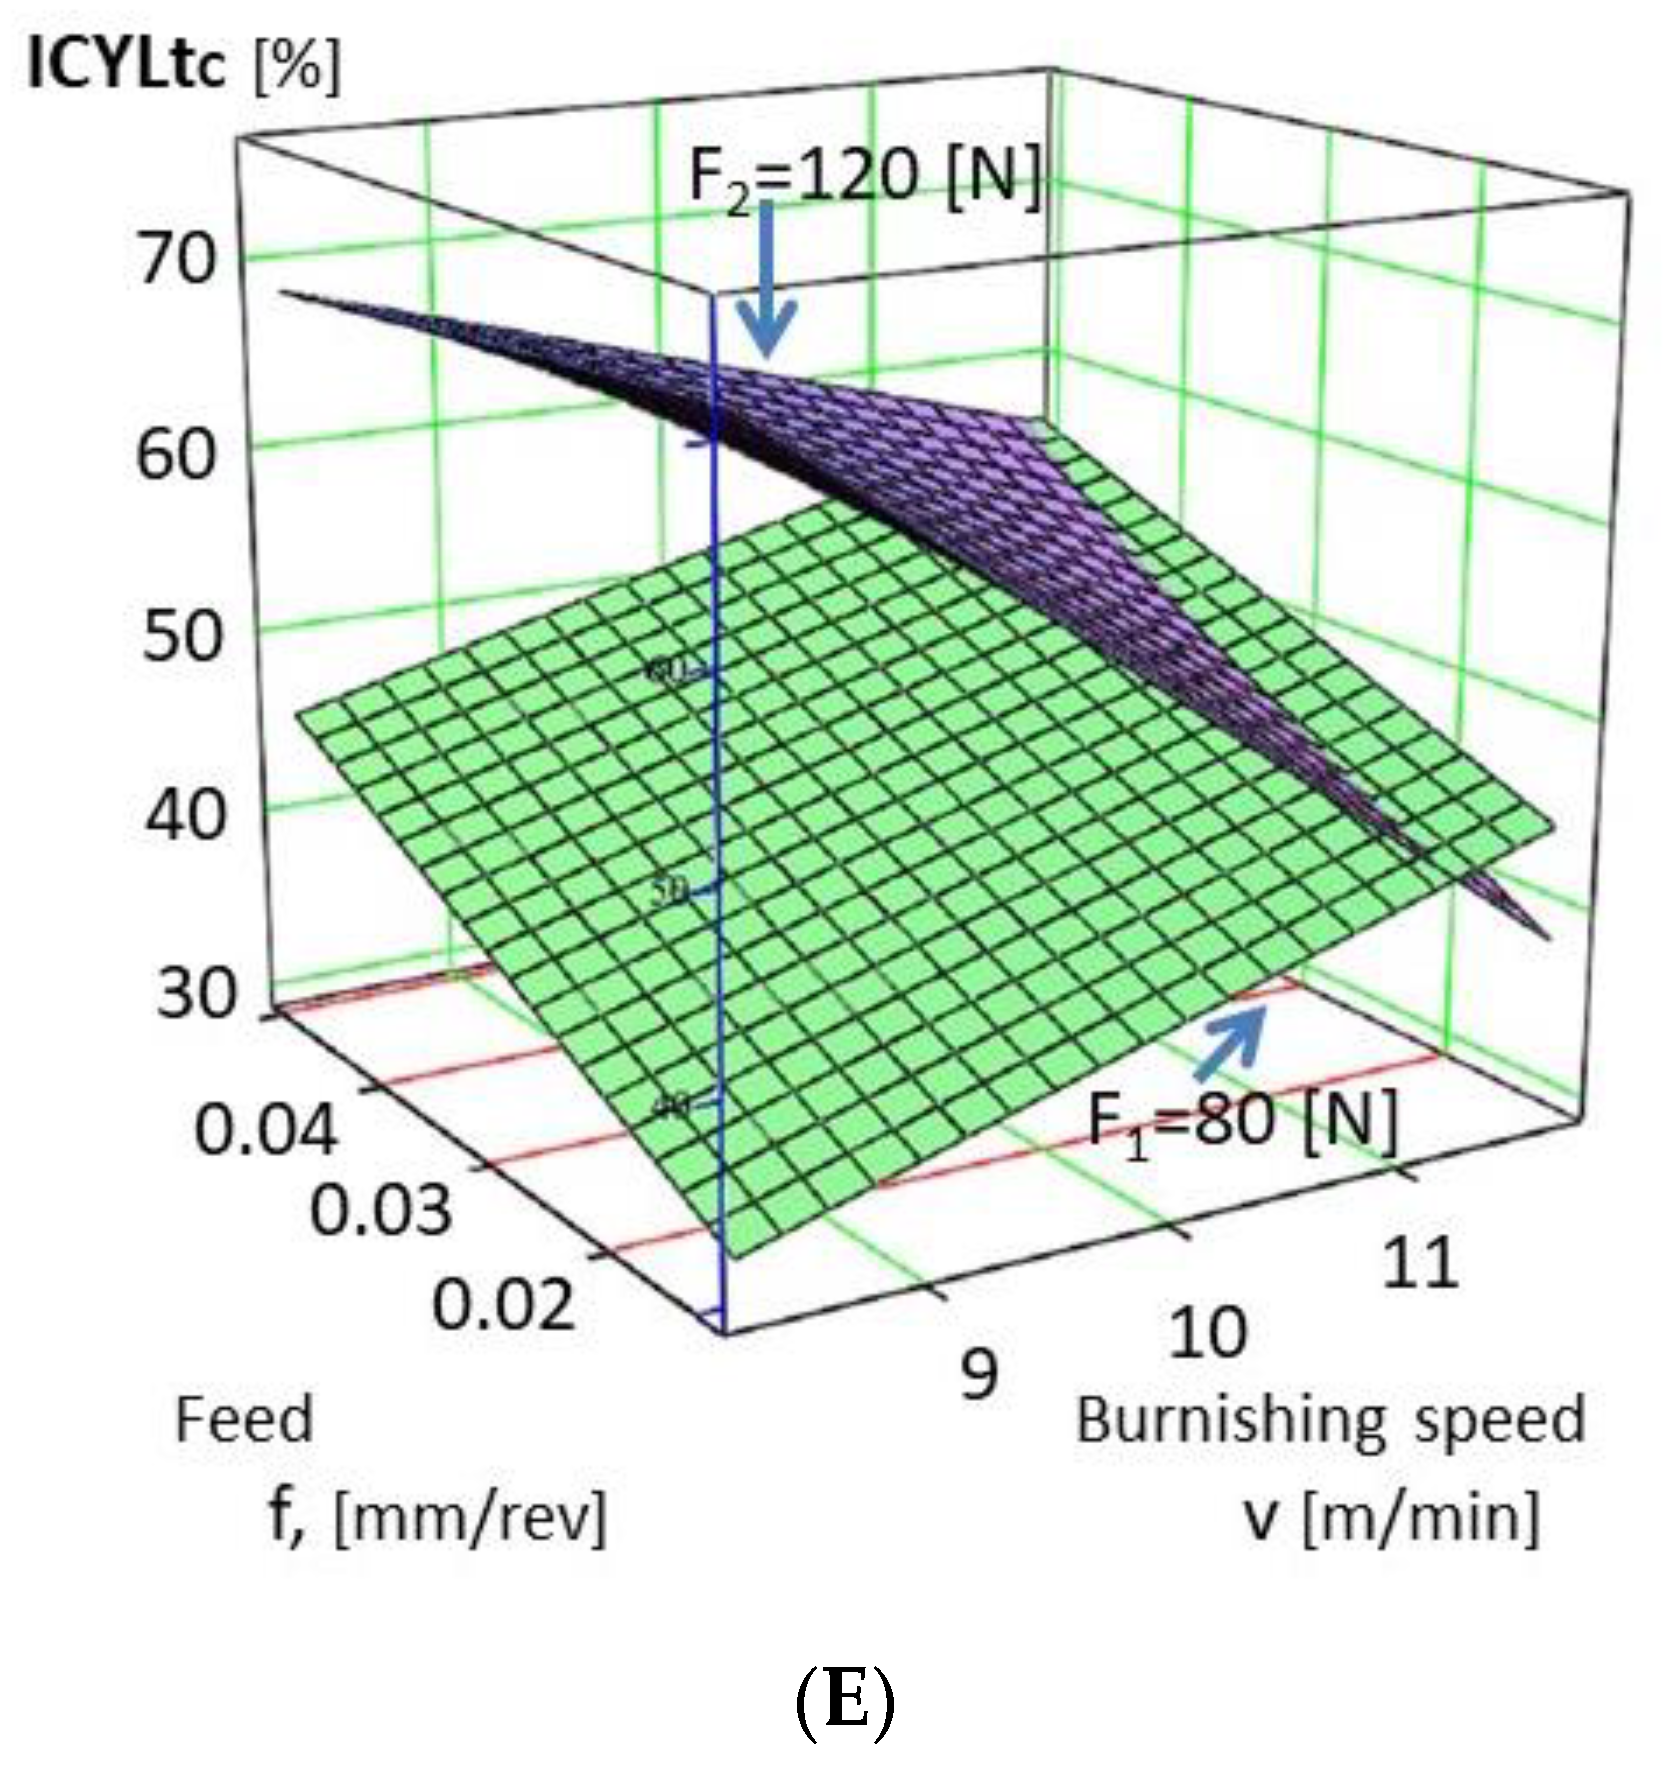
We cannot make such a definite statement for improvement in cylindricity based on our experiments. The effects of SBDF parameters on the improvement in cylindricity are different for each SLM combinations. The following statements can be stated on the basis of diagrams on Figure 7.
- For Sample Set A most favourable parameters are F = 80 N, v = 8.321 m/min, f = 0.0125 mm/rev, so decrease in f and v is reasonable.
- In Sample Set B advantageous parameters are F = 120 N, and in the case of small burnishing speed the increase in feed, but for small feed the increase in speed results in better improvement in cylindricity.
- The best burnishing parameters for Set C are F = 120 N, and cylindricity can be improved by increase in burnishing speed and decrease in feed.
- In the case of Sample Group D at burnishing force F = 120 N it is advantageous to apply higher feed for both speed values, but at F = 80 N smaller speed yields better increase for both feed values.
- For Sample Set E the burnishing force F = 120 N is better and decreasing of both burnishing speed and feed results in better improvement in cylindricity.
Since we studied surface roughness previously [23], correlation between surface roughness improvement and roundness data improvement can be discussed. We obtained Ra improvement ratios IRa and Rz improvement ratios IRz from [23] and performed a Pearson’s correlation test with 0.05 confidence level between those and IRONt and ICYLt computed in this paper(Table 6).
Values for p of Pearson’s correlation coefficients are under 0.05 only for CYLt data. We can observe a weak anticorrelation. It can be stated that correlation between surface roughness and roundness improvement ratios is not so strong. A possible explanation of this is that SFDB modifies only surface morphology and leaves unchanged the compact “hard core” of the body as it may be foreboded from Figure 2A. Probably at higher burnishing forces stronger correlation may be obtained between roughness and roundness improvement. This may be a direction of a future investigation.
5. Conclusions
The aim of our work was to investigate the effect of sliding friction diamond burnishing (SFDB) on the roundness parameters of cylindrical parts made of Ti6Al4V alloy by selective laser melting (SLM), where SFDB was applied as a postprocessing method.
In this paper, we studied by the factorial experiment design method how the SLM processing parameters (laser power, laser scan speed) and postprocessing parameters (burnishing speed, feed and force) influence improvement in shape accuracy (namely circularity error and deviation of cylindricity) in the case of cylindrical test specimens made of Ti6Al4V ELI alloy.
- In general, SFDB improves unambiguously and effectively both circularity and cylindricity. The lowest improvement ratio observed was 12.97% (ICYLt of Sample C5), the highest 70.38% (IRONt of Sample B8). Roundness parameters never became poorer, and they always got better in our experiments.
- Each experimental factor has positive main effects on circularity improvement.
- Burnishing feed (f) has the largest positive main effect on both circularity and cylindricity improvement.
- Combination Fv had largest positive interaction for both circularity and cylindricity improvement.
- There are several significant interaction terms for circularity and cylindricity improvement indicating that the five factors applied in our experiments influence roundness improvement in a nonlinear way.
- Circularity can be improved more effectively with larger burnishing force.
- Comprehension between experimental factors and cylindricity improvement is much more complex, and no general statements can be made. For details, please see the discussion.
In future work the parameter window may be enlarged, and new parameters could be involved especially SLM parameters layer thickness and hatch distance. Investigation can also be extended in the field of technology. Sliding friction diamond burnishing experiments can be performed by diamond tools with different geometry of dimensions. Results of rolling diamond burnishing experiments could be interesting to compare to results reported here. Improvement (or change) in other roundness parameters can be investigated like taper, radial runout, co-axiality or straightness. Dimensions of samples can also be the subject of a study, because there must be a lower bound for the radius under which burnishing force cause not only local smoothing, but deformation (bending) of the whole shape of the specimen.
Author Contributions
Conceptualization, G.V., G.D. and F.S.; methodology, G.V. and G.D.; software, G.V. and G.D.; validation, G.V., and G.D.; formal analysis, G.V.; investigation, G.V., G.D. and F.S.; resources, G.V. and G.D.; data curation, G.V. and G.D; writing—original draft preparation, G.D.; writing—review and editing, G.V. and G.D.; visualization, G.V. and G.D.; supervision, G.V. and G.D.; project administration, G.V. and G.D.; funding acquisition, G.V. and G.D. All authors have read and agreed to the published version of the manuscript.
Funding
Project no. NKFI-125117 has been implemented with the support provided from the National Research, Development, and Innovation Fund of Hungary, financed under the K_17 funding scheme. This work was co-supported by a project entitled “Research of osteosynthesis of implants and development trabecular structure using additive manufacturing”, and with identification number: GINOP-2.2.1-15-2017-00055.
Data Availability Statement
Not applicable.
Acknowledgments
Acknowledge the support provided from the National Research,
Development and Innovation Fund of Hungary, financed under the K_17
funding scheme. This work was co-supported by a project entitled
“Research of osteosynthesis of implants and development trabecular
structure using additive manufacturing”.
Conflicts of Interest
The authors declare no conflict of interest. The funders had no role in the design of the study; in the collection, analyses, or interpretation of data; in the writing of the manuscript; or in the decision to publish the results.
Appendix A. Measurement Data and Improvement
In this appendix roundness measurement data RONt and CYLt are reported for each test specimens. RONt data are average values of 12 roundness total value for a single test specimen along 12 different pathways as demonstrated in Figure 1 and its explanation. CYLt data are not averages since cylindricity can be calculated once for a cylinder. Improvement ratios IRONt and ICYLt are calculated according to the description given in Equations (3) and (4).

Table A1.
Measured roundness total (RONt) and cylindricity (CYLt) for test specimens and calculated improvement ratios IRONt, ICYLt, respectively.
Table A1.
Measured roundness total (RONt) and cylindricity (CYLt) for test specimens and calculated improvement ratios IRONt, ICYLt, respectively.
| RONtb | RONta | IRONt | CYLtb | CYLta | ICYLt | ||
|---|---|---|---|---|---|---|---|
| A1 | 83.42 | 35.56 | 57.38 | A1 | 155.54 | 61.55 | 60.43 |
| A2 | 52.34 | 25.18 | 51.89 | A2 | 47.02 | 40.50 | 13.87 |
| A3 | 71.76 | 31.61 | 55.96 | A3 | 90.08 | 42.75 | 52.54 |
| A4 | 62.35 | 23.84 | 61.77 | A4 | 89.31 | 40.96 | 54.14 |
| A5 | 50.51 | 23.43 | 53.62 | A5 | 63.43 | 46.38 | 26.88 |
| A6 | 67.05 | 27.54 | 58.93 | A6 | 120.57 | 49.62 | 58.85 |
| A7 | 57.34 | 26.68 | 53.47 | A7 | 104.72 | 81.73 | 21.95 |
| A8 | 48.81 | 21.13 | 56.71 | A8 | 67.97 | 44.98 | 33.82 |
| B1 | 59.61 | 25.76 | 56.78 | B1 | 84.69 | 49.10 | 42.02 |
| B2 | 47.28 | 22.69 | 52.02 | B2 | 57.89 | 41.30 | 28.66 |
| B3 | 65.08 | 29.30 | 54.98 | B3 | 92.27 | 47.80 | 48.20 |
| B4 | 79.88 | 38.14 | 52.25 | B4 | 116.59 | 64.76 | 44.45 |
| B5 | 56.03 | 25.45 | 54.58 | B5 | 74.95 | 57.22 | 23.66 |
| B6 | 65.67 | 29.95 | 54.39 | B6 | 86.94 | 47.10 | 45.82 |
| B7 | 83.28 | 36.53 | 56.14 | B7 | 105.16 | 40.46 | 61.53 |
| B8 | 59.73 | 17.69 | 70.38 | B8 | 80.07 | 42.60 | 46.80 |
| C1 | 63.14 | 32.88 | 47.93 | C1 | 89.24 | 66.93 | 25.00 |
| C2 | 81.24 | 44.62 | 45.08 | C2 | 87.01 | 54.16 | 37.75 |
| C3 | 68.76 | 30.14 | 56.16 | C3 | 73.21 | 50.42 | 31.13 |
| C4 | 57.28 | 29.69 | 48.17 | C4 | 78.11 | 57.91 | 25.86 |
| C5 | 61.70 | 37.20 | 39.71 | C5 | 66.53 | 57.90 | 12.97 |
| C6 | 66.03 | 25.29 | 61.69 | C6 | 118.88 | 55.26 | 53.52 |
| C7 | 56.34 | 20.66 | 63.33 | C7 | 64.47 | 55.60 | 13.76 |
| C8 | 64.38 | 27.83 | 56.77 | C8 | 81.35 | 46.93 | 42.31 |
| D1 | 84.90 | 33.84 | 60.14 | D1 | 95.94 | 38.03 | 60.36 |
| D2 | 62.73 | 32.31 | 48.49 | D2 | 76.12 | 71.84 | 5.62 |
| D3 | 79.66 | 34.12 | 57.17 | D3 | 113.63 | 46.31 | 59.24 |
| D4 | 76.47 | 30.11 | 60.62 | D4 | 79.38 | 58.05 | 26.87 |
| D5 | 77.23 | 39.62 | 48.69 | D5 | 70.16 | 45.67 | 34.91 |
| D6 | 69.75 | 27.71 | 60.27 | D6 | 85.69 | 64.54 | 24.68 |
| D7 | 65.30 | 29.08 | 55.46 | D7 | 129.07 | 50.80 | 60.64 |
| D8 | 87.75 | 35.13 | 59.97 | D8 | 119.21 | 47.60 | 60.07 |
| E1 | 78.56 | 35.52 | 54.78 | E1 | 88.53 | 60.60 | 31.55 |
| E2 | 85.43 | 36.13 | 57.71 | E2 | 111.04 | 61.86 | 44.29 |
| E3 | 84.53 | 29.97 | 64.55 | E3 | 134.14 | 73.20 | 45.43 |
| E4 | 84.60 | 36.86 | 56.43 | E4 | 134.74 | 58.80 | 56.36 |
| E5 | 87.30 | 38.00 | 56.47 | E5 | 165.74 | 48.03 | 71.02 |
| E6 | 74.47 | 26.29 | 64.69 | E6 | 89.87 | 55.47 | 38.28 |
| E7 | 85.63 | 27.83 | 67.51 | E7 | 158.26 | 50.02 | 68.39 |
| E8 | 85.04 | 24.98 | 70.62 | E8 | 110.62 | 48.60 | 56.07 |
Appendix B
In this section we consider IRONt and ICYLt as functions of all the factors P, u, v, F and F. Data presented in Appendix A are used.
Seeking for the mathematical formula of a function to be fit to experimental data always needs circumspection. Here, we used the step() function of the R programming langue to analyze what terms of a polynomial approximation are plays most important role. This investigation showed relevance of factors and their interaction terms in roundness improvement ratios IRONt and ICYLt defined in Section 3.1., Equations (3) and (4).
Initial formula in step() function was set to
This function generates systematically modified versions of this formula by eliminating terms, calculates Akaike’s information criterion values for modified models and selects the one with minimal value.
Here we present ANOVA analysis of the starting and final models in case of IRONt and ICYLt data.
In case of IRONt ANOVA output for the starting model:
| Df | Sum Sq | Mean Sq | F value | Pr(>F) | |
| P | 1 | 60.014 | 60.014 | 3.4449 | 0.08196. |
| u | 1 | 50.585 | 50.585 | 2.9037 | 0.10772 |
| v | 1 | 26.996 | 26.996 | 1.5496 | 0.23111 |
| f | 1 | 124.353 | 124.353 | 7.1380 | 0.01671 * |
| F | 1 | 47.322 | 47.322 | 2.7164 | 0.11882 |
| P:u | 1 | 56.219 | 56.219 | 3.2270 | 0.09134. |
| P:v | 1 | 0.536 | 0.536 | 0.0308 | 0.86299 |
| P:f | 1 | 12.055 | 12.055 | 0.6920 | 0.41774 |
| P:F | 1 | 82.890 | 82.890 | 4.7580 | 0.04443 * |
| u:v | 1 | 0.007 | 0.007 | 0.0004 | 0.98375 |
| u:f | 1 | 0.001 | 0.001 | 0.0001 | 0.99434 |
| u:F | 1 | 0.510 | 0.510 | 0.0293 | 0.86628 |
| v:f | 1 | 9.741 | 9.741 | 0.5592 | 0.46545 |
| v:F | 1 | 156.084 | 156.084 | 8.9594 | 0.00860 ** |
| f:F | 1 | 6.243 | 6.243 | 0.3584 | 0.55780 |
| Residuals | 16 | 278.738 | 17.421 | ||
| --- | |||||
| Signif. codes: 0 ‘***’ 0.001 ‘**’ 0.01 ‘*’ 0.05 ‘.’ 0.1 ‘ ’ 1 | |||||
and ANOVA output for the final model:
| Df | Sum Sq | Mean Sq | F value | Pr(>F) | |
| P | 1 | 60.014 | 60.014 | 4.4840 | 0.045236 * |
| u | 1 | 50.585 | 50.585 | 3.7795 | 0.064215. |
| v | 1 | 26.996 | 26.996 | 2.0171 | 0.168953 |
| f | 1 | 124.353 | 124.353 | 9.2912 | 0.005706 ** |
| F | 1 | 47.322 | 47.322 | 3.5357 | 0.072784. |
| P:u | 1 | 56.219 | 56.219 | 4.2004 | 0.051986. |
| P:F | 1 | 82.890 | 82.890 | 6.1932 | 0.020502 * |
| v:F | 1 | 156.084 | 156.084 | 11.6620 | 0.002371 ** |
| Residuals | 23 | 307.831 | 13.384 | ||
| --- | |||||
| Signif. codes: 0 ‘***’ 0.001 ‘**’ 0.01 ‘*’ 0.05 ‘.’ 0.1 ‘ ’ 1 | |||||
Coefficients and summary of final function for IRONt:
| Coefficients: | ||||
| Estimate | Std. Error | t value | Pr(>|t|) | |
| (Intercept) | −57.1142 | 1.9402 | −29.438 | <2 × 10⁻¹⁶ *** |
| P280 | −3.3069 | 2.2403 | −1.476 | 0.15348 |
| u1200 | 0.1363 | 1.8292 | 0.075 | 0.94124 |
| v8.321 | 6.2541 | 1.8292 | 3.419 | 0.00235 ** |
| f0.05 | −3.9426 | 1.2934 | −3.048 | 0.00571 ** |
| F80 | 3.6303 | 2.2403 | 1.620 | 0.11877 |
| P280:u1200 | −5.3018 | 2.5869 | −2.049 | 0.05199. |
| P280:F80 | 6.4378 | 2.5869 | 2.489 | 0.02050 * |
| v8.321:F80 | −8.8341 | 2.5869 | −3.415 | 0.00237 ** |
| --- | ||||
| Signif. codes: 0 ‘***’ 0.001 ‘**’ 0.01 ‘*’ 0.05 ‘.’ 0.1 ‘ ’ 1 | ||||
| Residual standard error: 3.658 on 23 degrees of freedom | ||||
| Multiple R-squared: 0.6626, Adjusted R-squared: 0.5452 | ||||
| F statistic: 5.645 on 8 and 23 DF, p value: 0.0005035 | ||||
In case of ICYLt ANOVA output for the starting model:
| Df | Sum Sq | Mean Sq | F value | Pr(>F) | |
| P | 1 | 298.0 | 297.96 | 1.0085 | 0.33021 |
| u | 1 | 113.7 | 113.75 | 0.3850 | 0.54368 |
| v | 1 | 529.0 | 528.97 | 1.7904 | 0.19958 |
| f | 1 | 1076.7 | 1076.67 | 3.6442 | 0.07437. |
| F | 1 | 110.0 | 110.00 | 0.3723 | 0.55032 |
| P:u | 1 | 200.9 | 200.88 | 0.6799 | 0.42174 |
| P:v | 1 | 144.4 | 144.38 | 0.4887 | 0.49455 |
| P:f | 1 | 10.4 | 10.39 | 0.0352 | 0.85364 |
| P:F | 1 | 209.5 | 209.45 | 0.7089 | 0.41220 |
| u:v | 1 | 226.0 | 226.01 | 0.7650 | 0.39471 |
| u:f | 1 | 303.3 | 303.30 | 1.0266 | 0.32604 |
| u:F | 1 | 21.1 | 21.15 | 0.0716 | 0.79247 |
| v:f | 1 | 82.6 | 82.59 | 0.2796 | 0.60425 |
| v:F | 1 | 456.9 | 456.95 | 1.5466 | 0.23155 |
| f:F | 1 | 7.3 | 7.28 | 0.0246 | 0.87726 |
| Residuals | 16 | 4727.1 | 295.45 | ||
| --- | |||||
| Signif. codes: 0 ‘***’ 0.001 ‘**’ 0.01 ‘*’ 0.05 ‘.’ 0.1 ‘ ’ 1 | |||||
and ANOVA output for the final model:
| Df | Sum Sq | Mean Sq | F value | Pr(>F) | |
| v | 1 | 529.0 | 528.97 | 2.2512 | 0.14511 |
| f | 1 | 1076.7 | 1076.67 | 4.5821 | 0.04149 * |
| F | 1 | 110.0 | 110.00 | 0.4681 | 0.49968 |
| v:F | 1 | 456.9 | 456.95 | 1.9447 | 0.17453 |
| Residuals | 27 | 6344.3 | 234.97 | ||
| --- | |||||
| Signif. codes: 0 ‘***’ 0.001 ‘**’ 0.01 ‘*’ 0.05 ‘.’ 0.1 ‘ ’ 1 | |||||
Coefficients and summary of final function for ICYLt:
| Coefficients: | ||||
| Estimate | Std. Error | t value | Pr(>|t|) | |
| (Intercept) | −39.7478 | 6.0592 | −6.560 | 4.91 × 10−07 *** |
| v8.321 | −0.5738 | 7.6644 | −0.075 | 0.9409 |
| f0.05 | −11.6010 | 5.4196 | −2.141 | 0.0415 * |
| F80 | 11.2657 | 7.6644 | 1.470 | 0.1532 |
| v8.321 :F80 | −15.1153 | 10.8391 | −1.395 | 0.1745 |
| --- | ||||
| Signif. codes: 0 ‘***’ 0.001 ‘**’ 0.01 ‘*’ 0.05 ‘.’ 0.1 ‘ ’ 1 | ||||
| Residual standard error: 15.33 on 27 degrees of freedom | ||||
| Multiple R-squared: 0.2551, Adjusted R-squared: 0.1447 | ||||
| F statistic: 2.312 on 4 and 27 DF, p value: 0.08339 | ||||
These functions have 5 variables, so it is not straightforward to visualize and analyze. For this reason, we investigated experimental functions separately for specimen groups A–E. This is described in Section 3.2.
References
- Vafadar, A.; Guzzomi, F.; Rassau, A.; Hayward, K. Advances in Metal Additive Manufacturing: A Review of Common Processes, Industrial Applications, and Current Challenges. Appl. Sci. 2021, 11, 1213. [Google Scholar] [CrossRef]
- Haghdadi, N.; Laleh, M.; Moyle, M.; Primig, S. Additive manufacturing of steels: A review of achievements and challenges. J. Mater. Sci. 2021, 56, 64–107. [Google Scholar] [CrossRef]
- Paolini, A.; Kollmannsberger, S.; Rank, E. Additive manufacturing in construction: A review on processes, applications, and digital planning methods. Addit. Manuf. 2019, 30, 100894. [Google Scholar] [CrossRef]
- Rajic, A.; Desnica, E.; Palinkaš, I.; Nedelcu, D.; Vulicevic, L. 3D Printing Technology with Plastic Materials for Hip Implant Master Patterns Manufacturing. Mater. Plast. 2019, 56, 882–890. [Google Scholar] [CrossRef]
- Popov, V.V.; Fleisher, A. Hybrid additive manufacturing of steels and alloys. Manuf. Rev. 2020, 7, 6. [Google Scholar] [CrossRef] [Green Version]
- Knezevic, I.; Bojic, S.; Lukic, D.; Rackov, M.C. Application of 3D Printed Fixtures for Welding. J. Prod. Eng. 2019, 22, 15–18. [Google Scholar] [CrossRef]
- Michal, D.; Hrušecký, R.; Košťál, P.; Molnár, I. Analysis of Shape and Dimensional Deformation of the Model with a Precision Circular Hole Produced by Digital Light Processing (DLP) Additive Technology. Mater. Sci. Forum 2020, 994, 213–220. [Google Scholar] [CrossRef]
- Temmler, A.; Qi, S. Surface Structuring by Laser Remelting (WaveShape): Microstructuring of Ti6Al4V for a Small Laser Beam Diameter and High Scan Speeds. Micromachines 2021, 12, 660. [Google Scholar] [CrossRef]
- Cosma, C.; Balc, N.; Moldovan, M.; Morovic, L.; Gogola, P.; Borzan, C. Post-processing of customized implants made by laser beam melting from pure Titanium. J. Optoelectron. Adv. Mater. 2017, 19, 738–747. [Google Scholar]
- Kozior, T.; Bochnia, J.; Zmarzły, P.; Gogolewski, D.; Mathia, T.G. Waviness of Freeform Surface Characterizations from Austenitic Stainless Steel (316L) Manufactured by 3D Printing-Selective Laser Melting (SLM) Technology. Materials 2020, 13, 4372. [Google Scholar] [CrossRef]
- Raaj, R.K.; Anirudh, P.V.; Karunakaran, C.; Kannan, C.; Jahagirdar, A.; Joshi, S.; Balan, A.S.S. Exploring grinding and burnishing as surface post-treatment options for electron beam additive manufactured Alloy 718. Surf. Coat. Technol. 2020, 397, 126063. [Google Scholar] [CrossRef]
- Yang, Y.; Lu, J.; Luo, Z.; Wang, D. Accuracy and density optimization in directly fabricating customized orthodontic production by selective laser melting. Rapid Prototyp. J. 2012, 18, 482–489. [Google Scholar] [CrossRef]
- Cuesta, E.; Alvarez, B.J.; Zapico, P.; Giganto, S. Analysis of post-processing influence on the geometrical and dimensional accuracy of selective laser melting parts. Rapid Prototyp. J. 2020, 26, 1713–1722. [Google Scholar] [CrossRef]
- Pal, S.; Kokol, V.; Gubeljak, N.; Hadzistevic, M.; Hudak, R.; Drstvensek, I. Dimensional errors in selective laser melting products related to different orientations and processing parameters. Mater. Tehnol. 2019, 53, 551–558. [Google Scholar] [CrossRef]
- Miranda, G.; Faria, S.; Bartolomeu, F.; Pinto, E.; Alves, N.; Silva, F. The Influence of Laser Power and Scan Speed on the Dimensional Accuracy of Ti6Al4V Thin-Walled Parts Manufactured by Selective Laser Melting. Metals 2022, 12, 1226. [Google Scholar] [CrossRef]
- Bartolomeu, F.; Fonseca, J.; Peixinho, N.; Alves, N.; Gasik, M.; Silva, F.S.; Miranda, G. Predicting the output dimensions, porosity and elastic modulus of additive manufactured biomaterial structures targeting orthopedic implants. J. Mech. Behav. Biomed. Mater. 2019, 99, 104–117. [Google Scholar] [CrossRef]
- Zhang, L.; Zhang, S.; Zhu, H.; Hu, Z.; Wang, G.; Zeng, X. Horizontal dimensional accuracy prediction of selective laser melting. Mater. Des. 2018, 160, 9–20. [Google Scholar] [CrossRef]
- Maamoun, A.H.; Xue, Y.F.; Elbestawi, M.A.; Veldhuis, S.C. Effect of Selective Laser Melting Process Parameters on the Quality of Al Alloy Parts: Powder Characterization, Density, Surface Roughness, and Dimensional Accuracy. Materials 2018, 11, 2343. [Google Scholar] [CrossRef] [Green Version]
- Hong, R.; Zhang, L.; Lifton, J.; Daynes, S.; Wei, J.; Feih, S.; Lu, W.F. Artificial neural network-based geometry compensation to improve the printing accuracy of selective laser melting fabricated sub-millimetre overhang trusses. Addit. Manuf. 2021, 37, 101594. [Google Scholar] [CrossRef]
- Sommer, D.; Götzendorfer, B.; Esen, C.; Hellmann, R. Design Rules for Hybrid Additive Manufacturing Combining Selective Laser Melting and Micromilling. Materials 2021, 14, 5753. [Google Scholar] [CrossRef]
- Titanium Alloy: Ti-6Al-4V. Available online: http://www.metalspiping.com/titanium-alloy-ti-6al-4v.html (accessed on 15 August 2022).
- Kandeva, M.; Kostadinov, G.; Penyashki, T.; Kamburov, V.; Dimitrova, R.; Valcanov, S.; Nikolov, A.; Elenov, B.; Petrzhik, M. Abrasive Wear Resistance of Electrospark Coatings on Titanium Alloys. Tribol. Ind. 2022, 44, 132–142. [Google Scholar] [CrossRef]
- Shunmugavel, M.; Polishetty, A.; Nomani, J.; Goldberg, M.; Littlefair, G. Metallurgical and Machinability Characteristics of Wrought and Selective Laser Melted Ti-6Al-4V. J. Metall. 2016, 2016, 1–10. [Google Scholar] [CrossRef] [Green Version]
- Liu, S.; Shin, Y.C. Additive manufacturing of Ti6Al4V alloy: A review. Mater. Des. 2019, 164, 107552. [Google Scholar] [CrossRef]
- Bruschi, S.; Bertolini, R.; Bordin, A.; Medea, F.; Ghiotti, A. Influence of the machining parameters and cooling strategies on the wear behavior of wrought and additive manufactured Ti6Al4V for biomedical applications. Tribol. Int. 2016, 102, 133–142. [Google Scholar] [CrossRef]
- ISO/ASTM 52900:2021(en), Additive Manufacturing—General Principles—Fundamentals and Vocabulary. Available online: https://www.iso.org/obp/ui#iso:std:iso-astm:52900:ed-2:v1:en (accessed on 7 September 2022).
- Zhong, C.; Liu, J.; Zhao, T.; Schopphoven, T.; Fu, J.; Gasser, A.; Schleifenbaum, J.H. Laser Metal Deposition of Ti6Al4V—A Brief Review. Appl. Sci. 2020, 10, 764. [Google Scholar] [CrossRef] [Green Version]
- Yap, C.Y.; Chua, C.K.; Dong, Z.L.; Liu, Z.H.; Zhang, D.Q.; Loh, L.E.; Sing, S.L. Review of selective laser melting: Materials and applications. Appl. Phys. Rev. 2015, 2, 041101. [Google Scholar] [CrossRef]
- Buican, G.R.; Oancea, G.; Lancea, C.; Pop, M.A. Influence of Layer Thickness on Internal Structure of Parts Manufactured from 316-L Steel Using SLM Technology. Appl. Mech. Mater. 2015, 809, 369–374. [Google Scholar] [CrossRef]
- Grozav, S.D.; Sterca, A.D.; Kočiško, M.; Pollák, M.; Ceclan, V. Feasibility of Predictive Models for the Quality of Additive Manufactured Components Based on Artificial Neural Networks. Machines 2022, 10, 128. [Google Scholar] [CrossRef]
- Singla, A.K.; Banerjee, M.; Sharma, A.; Singh, J.; Bansal, A.; Gupta, M.K.; Khanna, N.; Shahi, N.S.; Goyal, D.K. Selective laser melting of Ti6Al4V alloy: Process parameters, defects and post-treatments. J. Manuf. Process. 2021, 64, 161–187. [Google Scholar] [CrossRef]
- Taylor Hobson Ltd. A Fundamental Guide to the Measurement of Cylindrical Form, 3rd ed.; Taylor Hobson Ltd: Leicester, UK, 2011; Available online: www.taylor-hobson.com (accessed on 15 August 2022).
- Dezső, G.; Kósa, P. Dimensional and shape accuracy of cylindrical and rectangular parallelepiped–like parts made by selective laser melting technology. Ann. Fac. Eng. Hunedoara Int. J. Eng. 2020, 18, 39–45. [Google Scholar]
- Dezső, G.; Kósa, P. Effect of manufacturing parameters on circular runout of selective laser melted metallic parts’. Ann. Fac. Eng. Hunedoara Int. J. Eng. 2021, 14, 59–63. [Google Scholar]
- Varga, G.; Dezső, G.; Szigeti, F. Surface roughness improvement by sliding friction burnishing of parts produced by selective laser melting of ti6al4v titanium alloy. Machines 2022, 10, 400. [Google Scholar] [CrossRef]
Figure 1.
Design of test specimens and measurement pathways. Linear dimensions are given in mm. Orange numbers are not dimensions, but ordinal numbers of reference circles. “Sign” means that letters A–E are printed onto the end of each specimen, denoting which group it belongs to. See Table 1 for details.

Figure 2.
Electron microscopic images of Ti6Al4V test specimens produced by SLM. (A) without burnishing as is manufactured. This is the edge of a polished cross section, so unevenness of the surface also can be observed. On the upper part, partly melted and adhered metal power particles are visible. (B) Cylindrical surface after SFBD. Morphology of the surface changed substantially; a banded pattern is formed by the diamond tool. Valleys not completely filled in are also discernible. SLM parameters: layer thickness: 0.03 mm, hatch distance: 0.14 mm, laser power: 233.33 W, scan speed: 1200 mm/s, laser spot diameter: 0.01 mm, machine: EOS M290 400 W.

Figure 3.
Electron microscopic image of the cross section of sample E1 after burnishing. Modified surface morphology and unchanged internal pore defects are observable.
Figure 3.
Electron microscopic image of the cross section of sample E1 after burnishing. Modified surface morphology and unchanged internal pore defects are observable.

Figure 4.
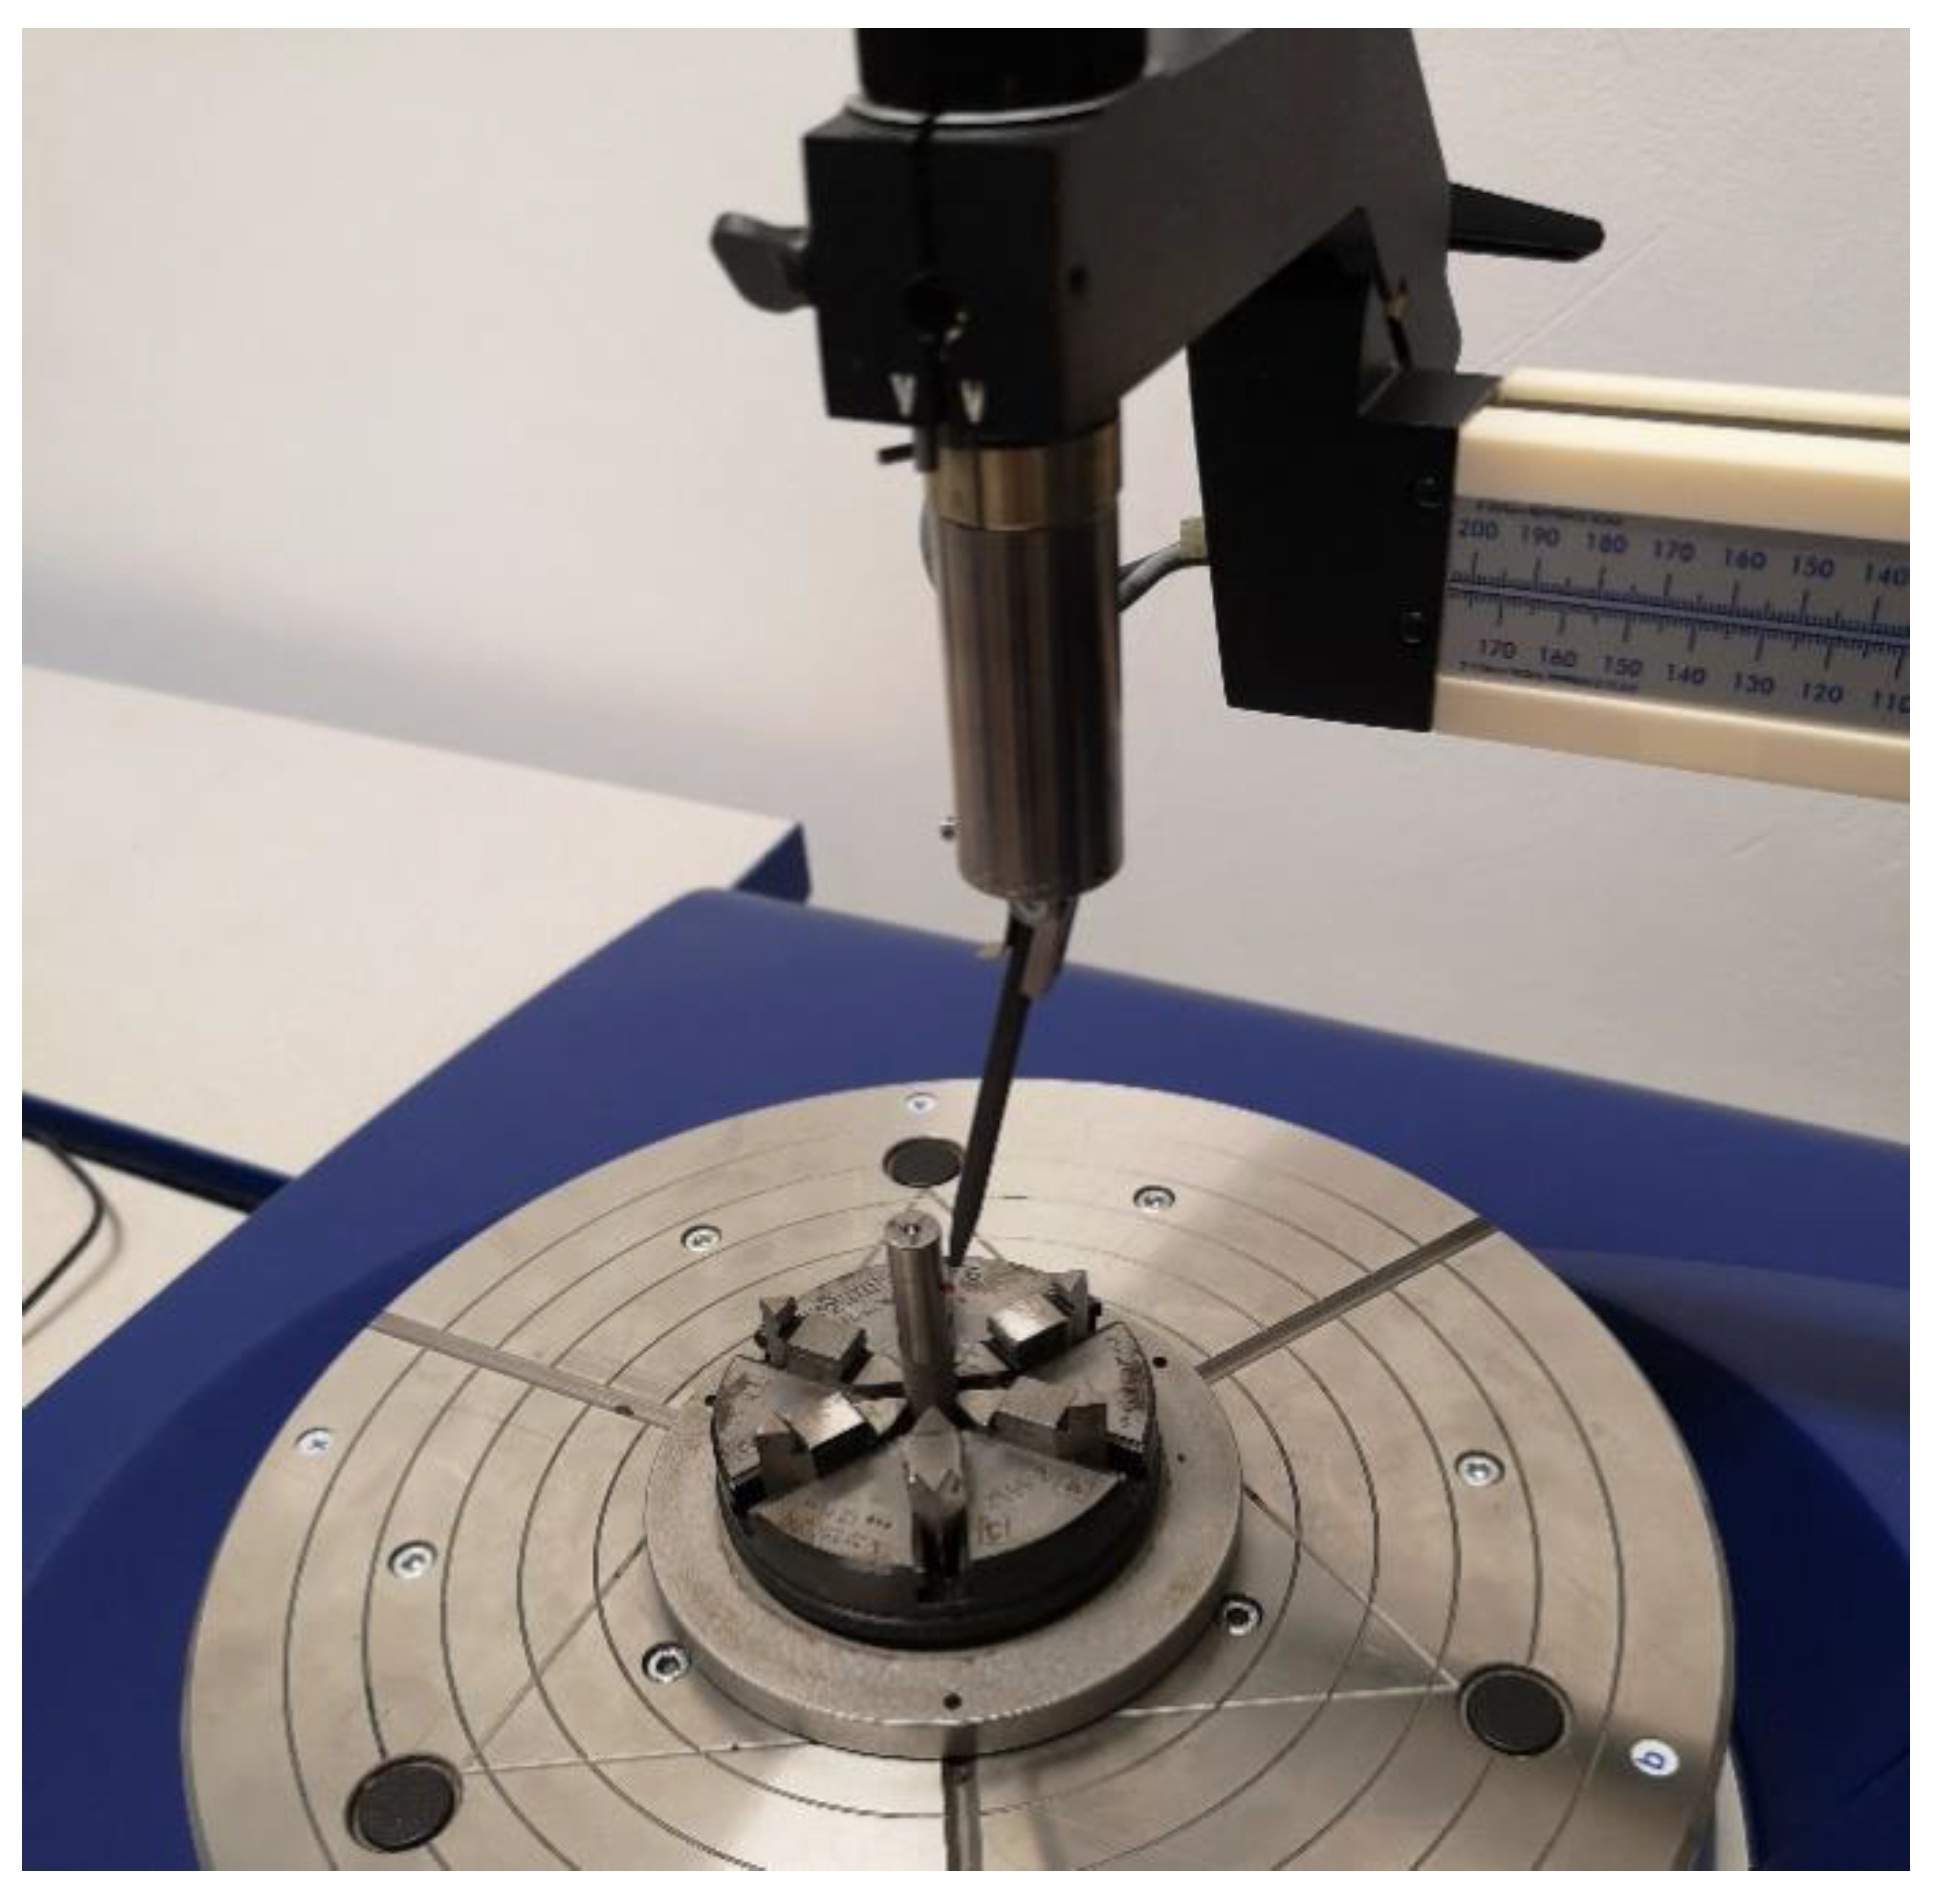
Measuring area of the Taylor Hobson Talyrond 365 circular shape and positional error measuring equipment.
Figure 4.
Measuring area of the Taylor Hobson Talyrond 365 circular shape and positional error measuring equipment.

Figure 5.
Cylindricity error diagram before (A) and after (B) burnishing in the middle (in the 6th measuring location) of sample E8.
Figure 5.
Cylindricity error diagram before (A) and after (B) burnishing in the middle (in the 6th measuring location) of sample E8.

Figure 6.
Faceted boxplots of IRONt data, according to experimental factors (A) boxes by laser power P and laser scan speed u, (B) boxes by burnishing feed f, burnishing speed v, and burnishing force F.
Figure 6.
Faceted boxplots of IRONt data, according to experimental factors (A) boxes by laser power P and laser scan speed u, (B) boxes by burnishing feed f, burnishing speed v, and burnishing force F.

Figure 7.
Faceted boxplots of ICYLt data according to experimental factors (A) boxes by laser power P and laser scan speed u, (B) boxes by burnishing feed f, burnishing speed v, and burnishing force F.
Figure 7.
Faceted boxplots of ICYLt data according to experimental factors (A) boxes by laser power P and laser scan speed u, (B) boxes by burnishing feed f, burnishing speed v, and burnishing force F.

Figure 8.
Graphs of empirical formulas Equations (5)–(9). (A) Plot of Equation (3). (B) Plot of Equation (4). (C) Plot of Equation (5). (D) Plot of Equation (6). (E) Plot of Equation (7).
Figure 8.
Graphs of empirical formulas Equations (5)–(9). (A) Plot of Equation (3). (B) Plot of Equation (4). (C) Plot of Equation (5). (D) Plot of Equation (6). (E) Plot of Equation (7).

Figure 9.
Graphs of empirical formulas Equations (10)–(14). (A) Plot of Equation (10). (B) Plot of Equation (11). (C) Plot of Equation (12). (D) Plot of Equation (13). (E) Plot of Equation (14).
Figure 9.
Graphs of empirical formulas Equations (10)–(14). (A) Plot of Equation (10). (B) Plot of Equation (11). (C) Plot of Equation (12). (D) Plot of Equation (13). (E) Plot of Equation (14).


Table 1.
Infill laser power (P) and infill laser scan speed (u) values applied for groups of test specimens denoted by A–E, and energy input (e) calculated from SLM parameters.
Table 1.
Infill laser power (P) and infill laser scan speed (u) values applied for groups of test specimens denoted by A–E, and energy input (e) calculated from SLM parameters.
| A | B | C | D | E | |
|---|---|---|---|---|---|
| P (W) | 233.33 | 280 | 336 | 233.33 | 280 |
| u (mm/s) | 1200 | 1000 | 1441 | 1000 | 1200 |
| e (W/mm3) | 46.3 | 66.7 | 55.5 | 55.5 | 55.5 |
Table 2.
Burnishing technological experimental parameters.
| No | Speed v (m/min) | Feed f (mm/rev) | Force F (N) |
|---|---|---|---|
| 1 | 8.321 | 0.0125 | 80 |
| 2 | 11.775 | 0.0125 | 80 |
| 3 | 8.321 | 0.0500 | 80 |
| 4 | 11.775 | 0.0500 | 80 |
| 5 | 8.321 | 0.0125 | 120 |
| 6 | 11.775 | 0.0125 | 120 |
| 7 | 8.321 | 0.0500 | 120 |
| 8 | 11.775 | 0.0500 | 120 |
Table 3.
Mean values and standard deviations of RONt and CYLt data before and after burnishing, and of improvement ratios.
Table 3.
Mean values and standard deviations of RONt and CYLt data before and after burnishing, and of improvement ratios.
| RONtb (µm) | RONta (µm) | IRONt (%) | CYLtb (µm) | CYLta (µm) | ICYLt (%) | |
|---|---|---|---|---|---|---|
| mean | 69.96 | 30.16 | −56.59 | 96.45 | 53.08 | −41.24 |
| st. dev. | 12.00 | 5.83 | 6.29 | 27.66 | 9.83 | 16.64 |
Table 4.
Main effects and interactions of experimental factors regarding the improvement ratio of roundness total (IRONt).
Table 4.
Main effects and interactions of experimental factors regarding the improvement ratio of roundness total (IRONt).
| IRONt | |||||||
|---|---|---|---|---|---|---|---|
| P | 5.48 | Pu | 5.30 | uv | 0.06 | vf | 2.21 |
| u | 5.03 | Pv | −0.52 | uf | −0.02 | vF | 8.83 |
| v | 3.67 | Pf | 2.46 | uF | 0.51 | fF | 1.77 |
| f | 7.89 | PF | 6.44 | ||||
| F | 4.86 |
Table 5.
Main effects and interactions of experimental factors regarding the improvement ratio of cylindricity (ICYLt).
Table 5.
Main effects and interactions of experimental factors regarding the improvement ratio of cylindricity (ICYLt).
| ICYLt | |||||||
|---|---|---|---|---|---|---|---|
| P | 12.21 | Pu | 10.02 | uv | 10.63 | vf | 6.43 |
| u | 7.54 | Pv | 8.50 | uf | −12.31 | vF | 15.12 |
| v | −16.26 | Pf | 2.28 | uF | −3.25 | fF | −1.91 |
| f | 23.20 | PF | 10.23 | ||||
| F | 7.42 |
Table 6.
Pearson’s product–moment correlation coefficients and p values for surface roughness improvement ratios (IRa, IRz) and roundness parameter improvement ratios (IRONt, ICYLt).
Table 6.
Pearson’s product–moment correlation coefficients and p values for surface roughness improvement ratios (IRa, IRz) and roundness parameter improvement ratios (IRONt, ICYLt).
| Pearson’s Correlation | ||
|---|---|---|
| cor | p | |
| IRa and IRONt | −0.099 | 0.58 |
| IRa and ICYLt | −0.542 | 0.0013 |
| IRz and IRONt | −0.0076 | 0.97 |
| IRz and ICYLt | −0.458 | 0.0083 |
Publisher’s Note: MDPI stays neutral with regard to jurisdictional claims in published maps and institutional affiliations. |
© 2022 by the authors. Licensee MDPI, Basel, Switzerland. This article is an open access article distributed under the terms and conditions of the Creative Commons Attribution (CC BY) license (https://creativecommons.org/licenses/by/4.0/).
Share and Cite
MDPI and ACS Style
Varga, G.; Dezső, G.; Szigeti, F. Shape Accuracy Improvement in Selective Laser-Melted Ti6Al4V Cylindrical Parts by Sliding Friction Diamond Burnishing. Machines 2022, 10, 949. https://doi.org/10.3390/machines10100949
AMA Style
Varga G, Dezső G, Szigeti F. Shape Accuracy Improvement in Selective Laser-Melted Ti6Al4V Cylindrical Parts by Sliding Friction Diamond Burnishing. Machines. 2022; 10(10):949. https://doi.org/10.3390/machines10100949
Chicago/Turabian StyleVarga, Gyula, Gergely Dezső, and Ferenc Szigeti. 2022. "Shape Accuracy Improvement in Selective Laser-Melted Ti6Al4V Cylindrical Parts by Sliding Friction Diamond Burnishing" Machines 10, no. 10: 949. https://doi.org/10.3390/machines10100949
Note that from the first issue of 2016, this journal uses article numbers instead of page numbers. See further details here.