
Functional Safety Analysis and Design of Sensors in Robot Joint Drive System


College of Intelligence Science and Technology, National University of Defense Technology, Changsha 410073, China
*
Author to whom correspondence should be addressed.
Machines 2022, 10(5), 360; https://doi.org/10.3390/machines10050360
Submission received: 18 April 2022
/
Revised: 4 May 2022
/
Accepted: 9 May 2022
/
Published: 10 May 2022
(This article belongs to the Special Issue Reliability Evaluation for Industrial Systems: State of the Art)
Abstract
:The reliable operation of the sensors of robot joint drive systems (RJDs) is a key factor in ensuring the safety of equipment and personnel. Over the years, additional safety-related systems have been designed to prevent safety incidents caused by robot failures, ignoring the functional safety issues of the robot sensors themselves. In view of this, based on IEC61508, a functional safety analysis and design method for sensors of RJDs is proposed in this paper. Firstly, the hazard analysis and risk assessment clarified the goals that the safety protection function of the RJD’s sensor should achieve. Then, by establishing the motor drive model and transmission model, a model-based sensor fault diagnosis and isolation strategy is proposed. Considering the fault-tolerant operation of system, a fail-operational hardware architecture of the safety-related system is designed. Markov analysis shows that the safety integrity level (SIL) of safety-related systems can reach SIL3. Finally, experiments are designed to validate the proposed fault diagnosis and fault tolerance strategy. The results show that the safety-related system can effectively locate sensor failures, realize fault-tolerant control when a single sensor fails and perform safe torque off (STO) protection when multiple sensors fail.
1. Introduction
With the development of artificial intelligence technology, robotics technology is entering a new stage of high integration and intelligence. A large number of integrated advanced electronic technologies have greatly improved the performance of the robot in terms of motion accuracy, environmental perception and autonomous learning capabilities [1,2,3]. Robots with human–robot cooperation function have been widely used in industrial manufacturing, weapons and equipment, logistics services and other fields. However, the safety issues brought about by moving machinery in the process of human–robot interaction have become an important challenge for robot development. Robot joints composed of motors, reducers, drivers, sensors and other modules are the “muscle” of the robot, which accurately controls the movement of the robot. The failure of RJDs will lead to abnormal movement of the robot, which will have a negative impact on humans. The traditional safety measure is to isolate the robot work area with a fence [4]. Obviously, this is not in line with the development concept of human–robot collaboration. In the subsequent development process, people have successively carried out research on the safety of joint drive systems. In terms of structure, safety joints with compliant mechanisms are designed to change their stiffness according to external forces, which can ensure that no safety accidents occur when a collision occurs [5,6]. In terms of sensors, surface skin sensors and visual sensors can be used [7,8] to improve the perception ability of machine joints and ensure the safety of joint end devices [9]. The kinematics control algorithm is used to optimize the control calculation, and the robot can avoid obstacles safely by setting the travel constraint interval [10,11]. However, these measures are implemented only if the RJD works properly.
Current and position sensors are the most basic and important feedback data sources for closed-loop control of RJDs [12]. Sensor data interruption, loss, errors and other conditions can lead to hazards. A lot of research work has been carried out on the sensor safety of RJDs. The reliability can be improved by establishing a redundant sensor structure by adding additional position sensors [13,14] and current sensors [15]. However, the cost and installation space issues caused by redundancy need to be considered. Analytical redundancy does not depend on sensor devices and exhibits certain advantages in operability. In [16,17], a real-time sensor state estimation method based on extended Kalman filter was proposed for fault diagnosis and protection of actual sensors. Zhang et al., adopted the method based on model redundancy, and selected the minimum over-constrained subsystem set to detect and isolate the faults of each sensor by taking advantage of the over-constrained characteristics of the structural model [18]. The above methods are susceptible to model inaccuracy. Sensorless technology has also been applied in sensor failure diagnosis. In [19,20], Bourogaoui et al., used high-frequency signal injection to extract the rotor position signal carried in the three-phase winding current of the motor as the diagnosis condition of sensor failure. However, sensorless technology still relies on current sensor data. In addition, some intelligent detection algorithms can also effectively detect sensor failure of RJDs, such as wavelet transform [21], deep learning [22], neural network [23], etc. The above work mainly focused on the analysis and diagnosis method of sensor failure, and did not pay enough attention to the functional safety analysis and implementation. Theoretically, efficient diagnostic methods of sensors can improve the system reliability, but functional safety depends on more aspects. In this paper, according to the IEC61508 specification, the sensor failure of RJDs is systematically analyzed and studied from the aspects of functional safety concept design, model-based diagnostic test method construction, safety-related system architecture design and system safety integrity level evaluation.
The SIL is an important indicator for quantitative assessment of functional safety in IEC61508. It defines the safety function evaluation as four discrete failure probability intervals; the lower the probability, the higher the safety level. Unlike faults, failure is defined as terminating the ability of an element or item to perform its intended function [24]. Therefore, reliability block diagrams [25], fault tree analysis [26], Petri nets [27] and other failure probability evaluation methods are widely used in SIL evaluation. The Markov technique is an important method for system reliability analysis. It describes the random process of each state change of the system by establishing different state transition relationships, in discrete or continuous-time conditions, of the system. It has been widely used in the functional safety assessment of safety instruments [28], electronic systems [29], large equipment [30] and other fields. However, as the system becomes more complex, the amount of computation required by Markov model states increases exponentially. Many scholars reduce the amount of computation by simplifying the Markov model or combining it with other techniques. Azizpour et al. [31] demonstrated a method to simplify complex Markov models analytically, and to compensate for the reduced computational bias by introducing a correction factor. Liang et al. [32] decomposes a typical nuclear reactor protection system into several independent subsystems, and calculates the failure rate of each simple subsystem separately, which greatly simplifies the number of states in the model. Compared with the full model, the deviation of the reliability assessment results is negligible. For this paper, the proposed simplified Markov model of the safety-related system is established by defining the system security state reasonably. Through the analysis of the Markov model, the SIL of the safety-related system under typical application conditions is obtained.
This paper is organized as follows. In Section 2, the risk analysis and risk assessment of sensor failure of RJDs are carried out, and the functional safety objectives are defined. In Section 3, through the analysis of the permanent-magnet synchronous motor (PMSM) drive model and transmission model of RJDs, the diagnosis and fault tolerance methods for the failure of the current sensor, and the position sensor are proposed. In Section 4, according to the proposed diagnostic testing method, the redundant hardware architecture of the safety-related system for sensor failure is designed. In Section 5, a simplified Markov model of the proposed architecture is established, and the SIL of the security-related system is obtained through analysis and calculation. Section 6 describes an experimental platform built to verify the effectiveness of the failure detection and isolation method proposed in Section 3. Finally, Section 7 concludes this paper and points out follow-up work.
2. Functional Safety Concept Design
2.1. Basics of RJDs
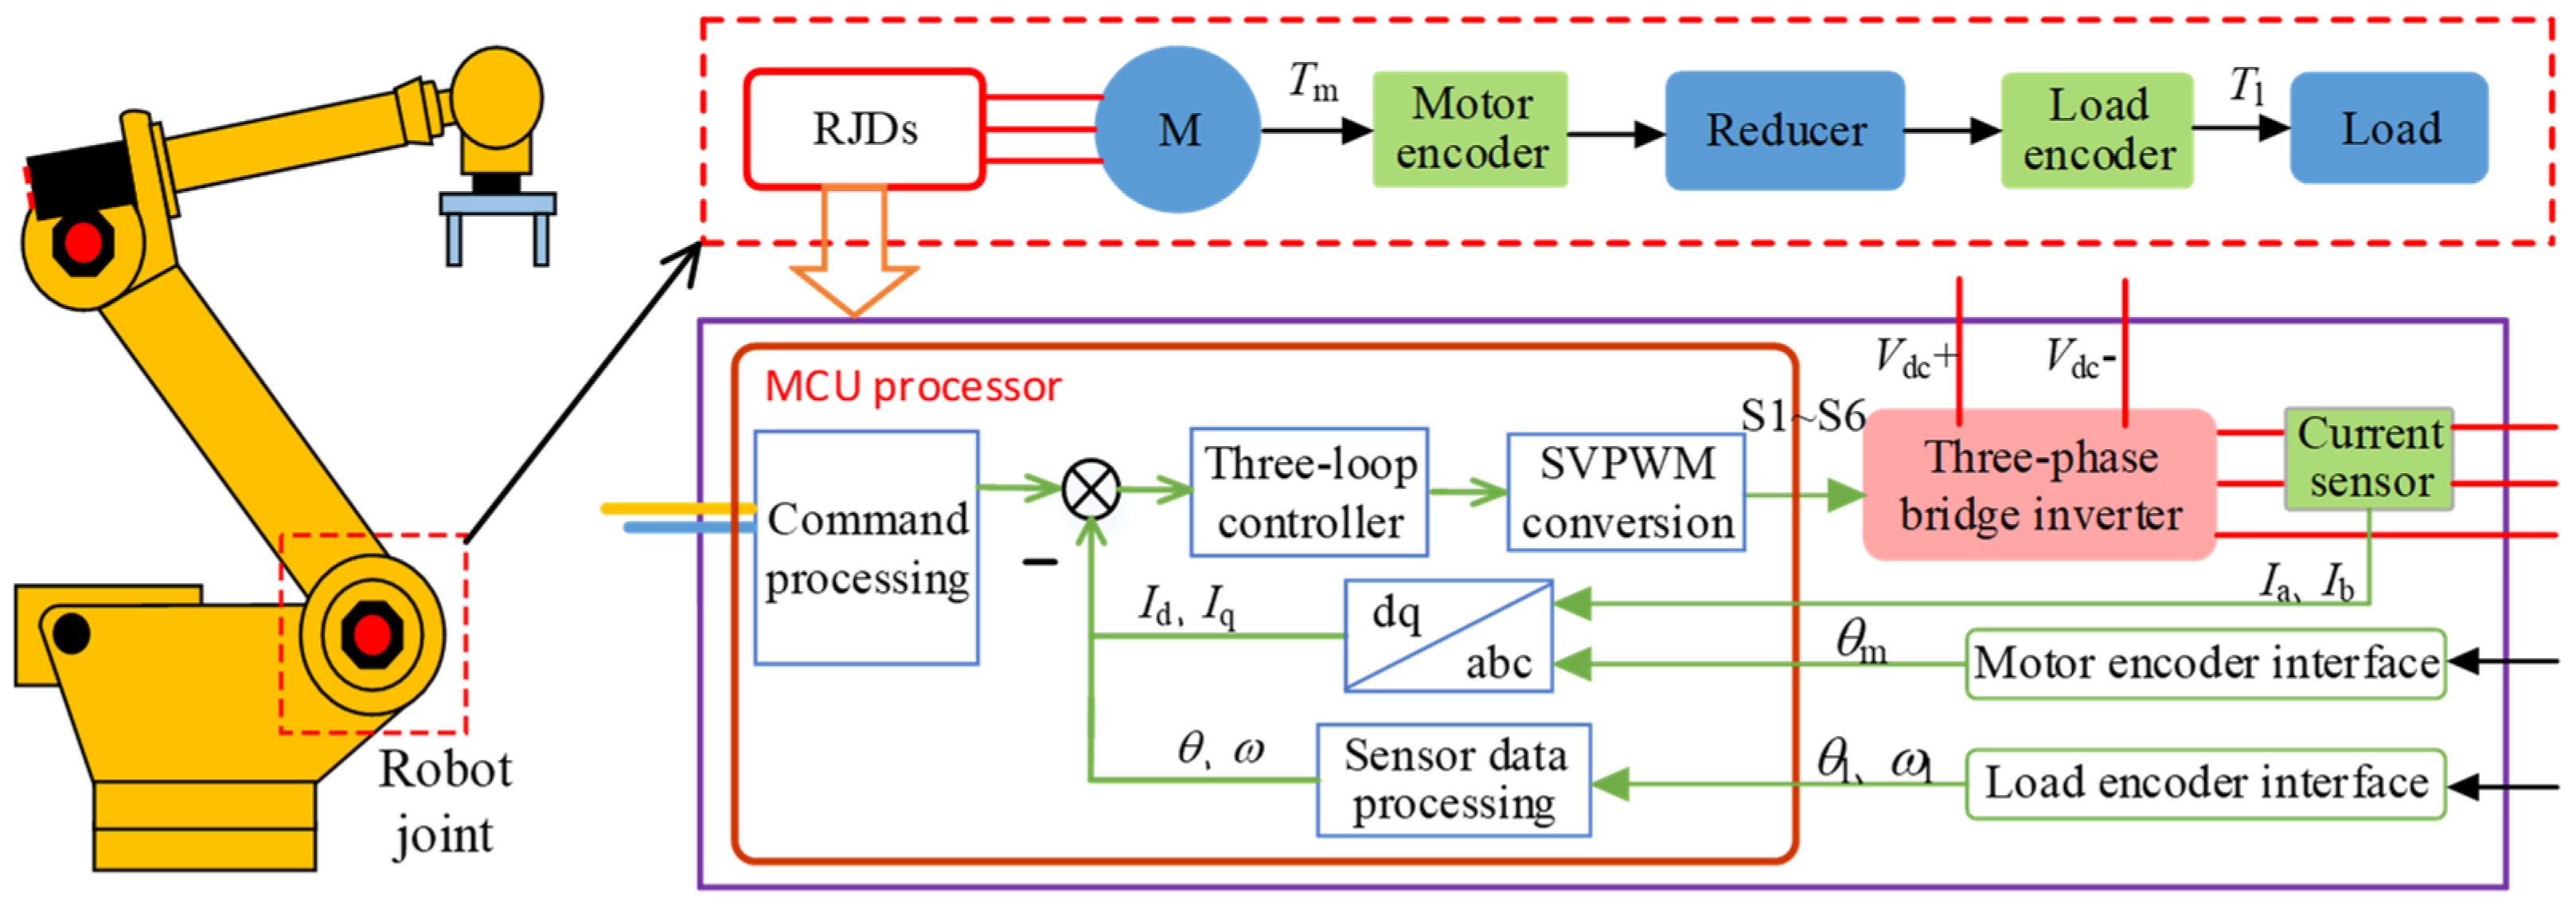
A typical RJD uses a field-oriented control (FOC) algorithm to control the switching process of the inverter and generate a three-phase alternating current (AC) voltage to generate the corresponding electromagnetic torque of the permanent-magnet synchronous motor (PMSM). The output torque of the motor is transmitted to the load through transmission components such as a reducer. Figure 1 shows the structure and principle of a robot joint. The microcontroller unit (MCU) processor is the core processing device of the servo control, completing fieldbus data transceiver processing, closed-loop control, sensor data acquisition and processing, space vector pulse width modulation (SVPWM), modulation output and other functions. The three-phase full-bridge inverter is used to convert the SVPWM control signal into the three-phase power voltage of the motor to achieve the power conversion function of the drive system. In a PMSM, the reducer and load are the ultimate actuators for the transfer of electromagnetic torque to the load. In addition, the current sensor collects the motor phase current, the motor encoder collects the rotor angle, and the joint attitude encoder is installed on the output end of the reducer to collect the actual joint speed and angle. This paper mainly analyzes and studies the functional safety of current sensors and encoders used in RJDs.
2.2. Hazard Analysis and Risk Assessment
According to IEC61508, the purpose of hazard analysis and risk assessment is to clarify hazards and hazardous events, confirm the sequence of hazardous events, and determine the risks of known hazardous events to equipment under control. For the whole robot system, there are many risks caused by environmental factors, human factors, component failure, and other conditions, and they all affect each other, and the risk inducements are complex. In order to isolate the uncontrollable factors and focus the research on the sensors of RJDs, the following assumptions should be made before hazard analysis and risk assessment:
- A1: External environmental factors (such as fire, power cut, etc.) are not considered.
- A2: The operator has the ability to program the robot correctly.
- A3: The impact of other faults on RJDs is not considered.
- A4: Each failure in the system can occur at most once at the same time.
- A5: In the hazard analysis and risk assessment, the redundancy of the sensors is not considered. This is further considered as a functional safety requirement and will be reflected in the safety structure proposed later.
In RJDs, if safety measures such as redundancy and diagnosis are not considered, the failure of any one sensor will lead to the fault of closed-loop control and cause an accident. In particular, in the working environment of human–robot collaboration, it is easy to cause safety hazards to the staff. Based on the above assumptions, the typical failure forms, failure causes and their impact on RJDs are summarized in Table 1.
Through the analysis of the influence of sensor failure on the system, the impact of sensor failure on the whole robot system in Table 1 can be summarized by the following four consequences:
- H1: The failure of closed-loop control, causing the robot joint to fly;
- H2: Abnormal current control causes overcurrent of power device to burn driver and servo motor;
- H3: Violent shaking during the movement accompanied by large current fluctuation;
- H4: Robot joints do not respond to commands or respond intermittently.
Taking an industrial robot for manufacturing as a typical scenario, a target SIL is assigned to each event using the risk assessment method recommended by IEC62061. The risk assessment method specified in IEC62061 is based on four aspects: severity (Se), frequency and duration of exposure (Fr), probability of occurrence of a hazardous event (Pr) and probability of avoiding or limiting harm (Av). Table 2 shows the SIL evaluation process and results for H1. According to this method, the SIL evaluation levels of H2, H3 and H4 are SIL1, SIL1 and SIL2, respectively. Therefore, the assigned SIL level of the sensor fail-safe function should not be lower than SIL2. This also complies with the performance recommendations for robotic safety-related systems in ISO 10218-2.
2.3. Safety Goals
According to IEC61508, safety-related systems for sensor failure should be designed for RJDs. This includes designing redundant reliability circuits in hardware to reduce random failure probability of hardware and designing diagnostic testing strategies with high diagnostic coverage in software to effectively monitor dangerous failures. In addition, when a dangerous failure occurs, the safety-related system can timely and effectively detect the danger and take measures to avoid danger.
In this paper, an effective safety-related system is designed for sensor failure of RJDs to achieve the following safety goals:
- SG1: When any sensor in the joint drive system fails, the system can locate and isolate the fault to ensure that the system still has full driving capability.
- SG2: In the event of failure of any two sensors in RJDs, the system can be stopped by means of STO.
- SG3: The SIL of the safety-related system should not be lower than SIL2.
3. Failure Analysis and Diagnosis of Sensors of RJDs Based on Model
3.1. Mathematical Model of RJDs
The mathematical model of RJDs is mainly composed of the PMSM drive model, inverter model, and the joint transmission model. The PMSM drive model describes the electromagnetic torque output characteristics of the stator voltage and current alterations in the PMSM. The inverter model describes the alterations in the current inside the inverter during the power conversion process. The joint drive model describes the dynamic relationship between the motor and the load.
In order to simplify the coupling parameters, such as self-inductance and mutual inductance, the PMSM model usually adopts a synchronous rotation d-q coordinate system. Equation (1) shows the transformation method of three-phase static coordinate system and the d-q coordinate system.
where Ia, Ib and Ic are three-phase currents, Id and Iq are d-q axis currents, and θe is the electrical angle.
According to the FOC control principle, the mathematical model of the PMSM in the rotating coordinate system is shown as Equation (2):
where Ud and Uq are the d and q axis voltages, Ld and Lq stand for the d and q axis inductances, R is the stator resistance, Tm is the electromagnetic torque of the motor, Pn represents the number of pole pairs, ωm denotes the motor speed, and ψf is the permanent magnet flux.
Figure 2 shows a typical three-phase full-bridge inverter structure. By controlling the switching mode and action time of each power device in the inverter, the target vector is synthesized in the SVPWM cycle to realize the control of the PMSM. Under the SVPWM control signal, the bus current of the inverter directly reflects the magnitude and direction of the three-phase current in different switching states. The relationship is as follows:
where Im is the bus current, and Sa, Sb and Sc are the switch states of the upper bridge arm of the inverter, respectively.
Furthermore, according to Kirchhoff’s current law, the three-phase currents satisfy the following relationship.
The joint transmission model mainly describes the process in which the reducer is connected to the motor shaft and transmits the electromagnetic torque to the load. The reducer is elastically connected to the PMSM, which can be simplified as a two-mass system [33], as shown in Figure 3. The moment of inertia of the motor is Jm, the output electromagnetic torque is Tm, and the angular displacement of the motor is θm. When the motor moves, the connecting shaft generates the load torque Ts1 and transmits it to the servo motor. The torsional stiffness of the connecting shaft is Ks. The output torque of the transmission part is Ts2, and the moment of inertia is Jl. In addition, Tmf and Tlf are the frictional torques at the motor end and the reducer end, respectively. θm and θl are the motor output angle and the reducer output angle, respectively, and r is the reduction ratio of the reducer.
According to the torque balance equation of the transmission system, the dynamic model of the robot joint can be established as Equation (5):
3.2. Current Sensor Failure Diagnosis
Based on the RJD model established above, the redundant relationship of each phase current in the model is analyzed to realize the failure diagnosis of the current sensor.
The intuitive method is to calculate the three-phase current of the motor under the original command of the inverter, and then compare this to the actual current of the sensor to achieve failure diagnosis. However, in practical applications, it may be necessary to add new sensors to detect the phase voltage. At the same time, inverter faults may also be introduced. Therefore, the residuals of the model are designed according to the model Formulas (3) and (4) to diagnose the failure of the current sensor.
The PMSM is a three-phase balanced load, and the three-phase current satisfies the condition in Equation (4). The failure of any sensor will result in the failure of Equation (4). Design residual R1 is as follows:
Equation (3) provides the relationship between the bus current and the three-phase current in each switching state. By comparing the difference between the bus current value and the corresponding phase current value under different Sa, Sb and Sc states, the failure diagnosis of each phase current sensor can be realized. Design residuals R2–R4 are as follows:
Under normal conditions of each current sensor, the values of residuals R1–R4 are 0. Once a sensor fails, the residuals R1–R4 will show different states, and the failure sensor can be diagnosed and located according to the states of R1–R4. Take the failure of the A-phase current sensor as an example for analysis. When the A-phase current sensor fails, it will cause the current value Ia to deviate from the real value, so the calculation results of R1 and R2 will not be 0. At this time, the B-phase current sensor, C-phase current sensor and bus current sensor work normally, so the calculation results of R3 and R4 remain 0.
When a current sensor fails, the failed sensor can be diagnosed and located according to the residual status in Table 3. The failed sensor is isolated, and the normal two-phase current sensors’ data are used to calculate Id and Iq according to Equations (1) and (4). Then, the closed-loop control is carried out according to Equation (2). If two-phase current sensors fail, STO should be started for safety protection.
3.3. Encoder Failure Diagnosis
According to Equation (5), the motor angle θm collected by the motor encoder and the reducer output angle θl collected by the load encoder have the relationship shown in Equation (8):
From Equation (8), it can be diagnosed whether the motor encoder and the load encoder are working normally. The design residual R5 is as follows:
When the result of R5 is not 0, it means that at least one encoder has failed. However, the result cannot achieve the accurate location of the failed encoder.
Hall sensors are integrated at the end of the PMSM to provide initial rotor information for the PMSM startup. Essentially, the Hall sensor is a low-resolution absolute position sensor. When performing position detection, the output of the Hall sensor can generate 24 states in one electrical angle cycle after four-fold-frequency subdivision. It provides 3° resolution on a five-pair PMSM. Utilizing the technique of interpolation, the resolution can be higher [26]. When using the Hall sensor angle for diagnosis, the error brought by its resolution Et should be considered as Equation (10).
where θh is the angle of the Hall sensor, and θa is the actual angle.
Therefore, the residuals R6 and R7 are designed to diagnose the failure of the motor encoder and the load encoder, respectively.
Table 4 shows the states of the residuals R5–R7 when the motor encoder, load encoder, and Hall sensor fail. According to the residual state, the system encoder failure can be diagnosed and located.
In addition, when the motor encoder fails, the angle value of the motor end can be obtained by calculating the angle of the load encoder in Equation (8) to realize fault-tolerant operation. When the load encoder fails, the load angle can be calculated through the motor encoder angle value in Equation (12). If the Hall sensor fails, no other operations are performed. When any two sensors fail, STO protection is activated.
4. Safety-Related System Architecture Design
In this section, according to the proposed fault diagnosis and fault tolerance method, a sensor-safety-related system is integrated based on typical PMSM driver hardware. Figure 4 shows the schematic diagram of the safety-related system structure proposed in this paper. The sensor subsystem is composed of a bus current sensor, three-phase current sensor, motor encoder, motor Hall sensor, and load absolute encoder, which detects the PMSM status data in real time. As a logic subsystem, the MCU controller module collects the feedback information of the sensor subsystem and uses the model residual to diagnose the failure of the sensors. The final element subsystem mainly includes a power switch and gate drive circuit, which executes the STO protection instructions of the logic subsystem.
4.1. Logic Subsystem
The logic subsystem is used to realize PMSM control, fault diagnosis and the tolerance algorithm, which is generally realized by an MCU chip. Dual-core MCU architecture is a widely used security chip architecture. Ref. [34] proposes a method of checker monitoring and dual-core lockstep under the dual-core architecture, which effectively improves the reliability of the chip. Considering the impact of circuit complexity on circuit board space and cost, this paper uses an SoC chip, integrating two independent MCU cores as the key part of logic subsystem.
The functional structure of the chip is shown in Figure 5. The communication data processing module and the sensor feedback processing module transmit the instructions and feedback information required for closed-loop control to MCU1 and MCU2, respectively, through the on-chip high-speed bus. Since the same procedure is executed, the output results of the controllers in the two MCUs should be consistent under normal circumstances. In addition, a status monitoring program is designed to output the running status of the MCU program in real time. A field-programmable gate array (FPGA) logic module is essentially a hardware structure, which is more reliable than MCU. Therefore, the MCU status-checking module and the control signal output module are designed in the FPGA logic. If the MCU status checking module detects an abnormality through the MCU running status, the control signal output module isolates the abnormal MCU and selects the normal MCU operation result output.
4.2. Sensor Subsystem
The sensor subsystem is composed of current sensors and position sensors, which provide indispensable information about current, angle and velocity for closed-loop control and also fault diagnosis. Due to the highly integrated structure of RJDs, adding additional sensors to improve reliability is limited by the installation space. According to the analysis in Section 3, the circuit structure of the sensor subsystem shown in Figure 6 is designed.
Current sensors are installed in the drive circuit, without being restricted by the installation space. We use Σ-Δ modulator and sampling resistor to detect the UVW three-phase current and bus current. Additionally, the FPGA resources should be used in the logic subsystem to design four Sinc3 filters to convert the output bit stream of the Σ-Δ sampling chips into current signals.
RJDs use quadrature pulse encoders and Hall sensors as PMSM rotor position measurement sensors. An absolute encoder based on the RS485 interface is used as the deceleration output angle sensor. In order to avoid power signal noise from harming the circuit board components, high-speed digital isolators, differential receivers and RS485 converters are used to isolate and level-shift the Hall signal, quadrature pulse signal and RS485 signal, respectively.
4.3. Final Element Subsystem
IEC 61800-5-2 states that STO should ensure that power that can cause rotation or motion is not applied to the motor, and that the electrical drive safety-related system does not provide energy to the motor that generates torque. Therefore, the power cut-off circuit and gate drive cut-off circuit as shown in Figure 7 are designed as the final element subsystem.
When a dangerous failure occurs, the STO protection module will generate control signals Sa1 and Sa2 to cut off the power supply and the motor connection. The Sa1 signal is used to disable the gate driver and sets the PWM1~6 signal output by the SVPWM module to 0. In this way, the power device cannot be turned on, and the motor is isolated from the power supply. Sa2 turns off the power switch S7 on the bus through the comparison circuit, preventing the power supply from supplying energy from the source. Both methods can realize the STO function, and the hardware channels work independently of each other to form a redundant structure.
5. Safety Integrity Analysis Based on Markov Model
So far, the diagnostic methods and safety-related system architectures related to sensor failure of RJDs have been discussed in detail. This section uses the Markov model to evaluate the proposed architecture to verify whether it meets the SIL required by SG3.
5.1. Analysis before Assessment
When RJDs are working, the driver needs to adjust the motor and load in real time. This is a typical continuous mode of operation, and failure rate per hour (PFH) should be taken as a condition for safety integrity assessment. In addition, since the time of the system is continuous and the state is discrete, the time-homogeneous Markov model can be used for analysis.
According to IEC61165, in the time-homogeneous Markov chain {X(t), t ≥ 0}, if the state space I = {in, n ≥ 0} satisfies any 0 ≤ t1 < t2 <…< tn + 1 and i1, i2,…, in+1 ∈ I conditions, then there is the following relationship:
The conditional probability is given in Equation (13) in the form of transition probability:
where Pij(t) is the transition probability matrix.
The IEC61165 standard restricts the actual application conditions of the Markov method, and the following assumptions should be made before modeling:
- MA1: The failure of each element of the system does not affect the failure of other elements at any time and does not consider the probability of two or more failures occurring at the same time.
- MA2: Each element can be restored to its original state after maintenance.
- MA3: The failure rate λ and repair rate μ of all elements are constant with respect to time.
- MA4: When the system is in the initial state, all elements are running normally.
Modeling based on the above assumptions should also consider the element failure rates, diagnosis coverage and the effect of common-cause failure.
When describing device failure, not every failure will lead to a dangerous failure of the system. IEC61508 defines the elemental failure rate λ as being composed of the dangerous failure rate λD and the safe failure rate λS.
The confirmation of λD and λS requires a large number of experimental statistics. This article refers to [35] to analyze the failure rate evaluation model of commonly used electronic devices. High-quality electronic components and the reliability evaluation model should be used to calculate the failure rate of key components in the logic subsystem (LS), sensor subsystem (SS) and final component subsystem (FS) proposed above. The results are shown in Table 5.
With diagnostic measures, dangerous failures may be detected by diagnostic methods. Diagnostic coverage (DC) is the reduced fraction of dangerous failures due to diagnostic methods. IEC61508-2 provides a range of DCs that can be achieved by different diagnostic methods. By comparing the diagnostic methods proposed in Section 3, the DC of each subsystem can be obtained, as shown in Table 6.
Common-cause failures are the result of one or more events that cause two or more separate channels to fail simultaneously in a multi-channel system. In this paper, the β factor model is used to describe the common-cause failure of each subsystem, and β = 0.02 is evaluated by the scoring table recommended in IEC61508.
5.2. Markov Model for Safety-Related System
In SS, LS and FS, each subsystem has three states: dangerous failure, detected dangerous failure and undetected dangerous failure. This will make the transfer matrix size of the Markov model 11 × 11, resulting in a huge amount of calculation. Through the analysis of the subsystem state, it can be found that the safety state of each subsystem will not play a decisive role in the evaluation of safety integrity, but will only increase the complexity of the model. Therefore, only detected dangerous states are given when modeling, which reduces the influence of other states on model complexity.
States S0–S4, when defined, respectively represent the normal operation of the system, the detected LS dangerous failure, the detected SS dangerous failure, the detected FS dangerous failure and all undetected dangerous states. The system state transition diagram is shown in Figure 8.
S0 is a safe state, S1–S3 are sub-safe states, and S4 is a dangerous state. When transitioning from a safe state to a sub-safe state, it is necessary to consider the influence of the dangerous failure rate, DC and common-cause failure at the same time. Therefore, the transition rate from S0 to S1, S2 and S3 is as follows:
where DCLS, DCSS and DCFS are the DCs of LS, SS and FS, respectively, and λDLS, λDSS and λDFS are the dangerous failure rates of LS, SS and FS, respectively. λnm is the transition rate from Sn to Sm.
In state S1, the LS has detected a dangerous failure. If an SS or FS dangerous failure occurs before repair, the entire system undergoes dangerous failure. At this time, the state will transfer from S1 to S4. Similarly, the transition rates of S2 and S3 to S4 can be obtained.
If there is an undetected dangerous failure of LS and SS, it will cause the system to transfer directly from S0 to S4. In addition, failures of LS, SS and FS due to common causes can also directly transfer the system from a safe state to a dangerous failure state. The transition rate λ04 from S0 to S4 is:
According to Equations (16)–(18), the system transition matrix Q can be obtained:
We let P0(t), P1(t), P2(t), P3(t) and P4(t) be the probabilities that the system is in S0–S4 states at time t, respectively. The initial state of the system is S0. The differential equation can be obtained as follows:
where P(t) is the state probability vector.
By solving the differential equation, P(t) can be calculated. In IEC61508, the value of PFH can be obtained by calculating the probability series of the transition from all safe states to dangerous states with time as a variable. The calculation starts from the initial state S0 and ends at the system end time TM. The PFH calculation method for safety-related systems is as follows:
According to the general conditions for the use and maintenance of industrial robots, and considering the typical common-cause failure rate, system running time and maintenance time, the calculation results of the PFH for safety-related systems are shown in Table 7:
The safety integrity assessment results show that the SIL of the safety-related system architecture proposed in this paper can reach the target safety integrity level SIL3 under the conditions of use and maintenance in typical industrial application scenarios.
6. Experiment
This section describes an experimental platform constructed to verify the model-based diagnosis and fault tolerance strategy proposed in this paper. Figure 9 shows the experimental platform, which consisted of a system-on-chip (SoC) control board with a cortex-m3 core, a three-phase inverter composed of SCT3060ALGC11 SiC-MOSFET from a Rohm semiconductor, a PMSM with rated speed of 3000 rpm and rated torque of 2.39 Nm, an RV reducer with a reduction ratio of 1:161 and an absolute encoder. The motor encoder was a 2500-line quadrature pulse encoder, which was integrated into the motor together with the Hall sensor. The absolute encoder was installed at the output of the reducer as a load encoder. Two isolated power supplies were used to provide control power and bus power, respectively, and the arbitrary waveform generator was used as a command source. Model-based diagnosis and fault tolerance strategy were integrated in the SoC chip and output the residuals’ calculation result to the PC for recording and observation.
In the experimental study, we constructed four typical failure scenarios of a current sensor, motor encoder, Hall sensor and absolute encoder to verify the fault tolerance of single-sensor failure and the safety protection function of multi-sensor failure.
6.1. A-Phase Current Sensor Failure
The single-point failure of the current sensor is a common failure mode, and the failure of the A-phase current sensor was constructed to verify the fault tolerance strategy. We set the drive to torque closed-loop mode and the torque command to 1 Nm. After the system was working normally at t = 1 s, we artificially applied a 0.5 A current bias on the A-phase current feedback. Figure 10a shows the changes in R1–R4 before and after the current bias was applied, in which only R1 and R2 generated a bias of about 0.5 A at t = 1 s, while R3 and R4 had no obvious bias. At this point, the diagnostic program determined that the A-phase current sensor had failed, and applied the values of the B-phase and C-phase current value to the torque closed loop. Figure 10b shows the change in torque current Iq in the process of diagnosis and fault tolerance. It can be seen that the torque had no obvious fluctuation.
6.2. B-Phase and Bus Current Sensor Failure
When multiple current sensor failures occur, safety protection should be carried out in time. The safety protection function was verified by constructing the case where both the B-phase current sensor and the bus current sensor failed. We set the drive to torque closed-loop mode, and the torque command was 1 Nm. When t = 1 s, we artificially applied a bias of 0.5 A to the B-phase current feedback, when t = 2 s, and set the bus current feedback to 0. As seen in Figure 11a, R1 and R3 had a 0.5 A bias at t = 1 s, and it was diagnosed that the B-phase current sensor failed. Since the fault-tolerant operation switched the current sensor, the zero bias caused the torque current to fluctuate in the range of 0.1 A, as shown in Figure 11b. At t = 2 s, the bus current sensor failed, and the output was 0, resulting in a large bias in R2, R3 and R4. At this time, the STO protection function took effect, and the torque current became 0. After STO protection, due to inertia and back electromotive force, the torque current had a short-term small-amplitude oscillation, as shown in Figure 11b.
6.3. Motor Encoder Failure
The motor encoder provides the vector direction of FOC control, and its failure will seriously affect the closed-loop effect of PMSM. We set the drive to speed closed-loop mode, and the speed command was 600 r/m. When t = 1 s, a random error of 20% was artificially added to the feedback angle of the encoder. In Figure 12a, it can be seen that R5 and R6 had a deviation of about 0.7 rad at t = 1 s, which is greater than the threshold in Equation (10). It could be diagnosed as motor encoder failure. Using the calculation result of Equation (8) as the motor angle, the motor speed did not fluctuate significantly during the fault-tolerant switching, as shown in Figure 12b.
6.4. Load Encoder and Hall Sensor Failure
We constructed the failure of the load encoder and Hall sensor and verified the diagnosis and protection function of multi-point failure of the position sensor. We set the drive to speed closed-loop mode, and the speed command was 600 r/m. At t = 1 s, the absolute encoder angle was artificially added with a random error of 20%, and at t = 2 s, the output of the Hall sensor was artificially set to 0. Figure 13a shows that the deviation of R5 and R7 exceeded the threshold at t = 1 s. At this time, the system used the motor encoder angle to calculate the load angle according to Equation (12) and continued to run. At t = 2 s, the values of R6 and R7 showed a gradually decreasing trend. At t = 2.038 s, when R6 and R7 exceeded the threshold, the system immediately performed STO protection. Figure 13b shows that the motor speed started to decelerate freely at 2.083 s and decelerated to 0 at t = 2.334 s.
7. Conclusions
This paper has conducted a comprehensive analysis and design of the sensor functional safety of RJDs based on IEC61508. By analyzing the danger posed by sensor failure of RJDs to the whole system in typical application scenarios, the SIL and safety goals that RJD safety-related systems should achieve was determined. By establishing the RJDs mathematical model, a sensor fault diagnosis and fault tolerance method based on residual variation characteristics of the model was proposed. In addition, the fail-operational hardware architecture of the safety-related system of RJDs was designed on the basis of the typical drive circuit. Using the Markov modeling analysis method, the proposed safety-related system hardware circuit was modeled and analyzed. The results show that the SIL of the proposed safety-related system reached SIL3. Finally, an experimental test platform was built to verify the effectiveness of the diagnostic and fault-tolerant methods proposed in this paper. The sensor functional safety analysis and design method described in this paper were consistent with the functional safety design process defined in IEC61508. It not only provides a reference for the functional safety design of the sensor of RDJs, but also provides guidance for the functional safety design of other drive systems. In the future, further research and verification will be conducted on the overall functional safety of RJDs.
Author Contributions
Conceptualization, L.C. and D.F.; methodology, L.C.; software, L.C.; validation, L.C., D.F. and X.X.; formal analysis, X.X.; investigation, L.C.; resources, D.F.; data curation, J.Z.; writing—original draft preparation, L.C.; writing—review and editing, L.C.; visualization, X.X.; supervision, D.F.; project administration, D.F.; funding acquisition, X.X. All authors have read and agreed to the published version of the manuscript.
Funding
This research was funded by the National Natural Science Foundation of China (Grant No. U19A2072).
Institutional Review Board Statement
Not applicable.
Informed Consent Statement
Not applicable.
Data Availability Statement
Not applicable.
Conflicts of Interest
The authors declare no conflict of interest.
References
- Zhu, W.H.; Lamarche, T.; Dupuis, E.; Jameux, D.; Barnard, P.; Liu, G. Precision control of modular robot manipulators: The VDC approach with embedded FPGA. IEEE Trans. Robot. 2013, 29, 1162–1179. [Google Scholar] [CrossRef]
- Zhang, J.; Liu, R.; Yin, K.; Wang, Z.; Gui, M.; Chen, S. Intelligent collaborative localization among air-ground robots for industrial environment perception. IEEE Trans. Ind. Electron. 2018, 66, 9673–9681. [Google Scholar] [CrossRef]
- Yang, C.; Luo, J.; Liu, C.; Li, M.; Dai, S.L. Haptics electromyography perception and learning enhanced intelligence for teleoperated robot. IEEE Trans. Autom. Sci. Eng. 2018, 16, 1512–1521. [Google Scholar] [CrossRef] [Green Version]
- Morioka, M.; Adachi, S.; Sakakibara, S.; Tan, J.T.C.; Kato, R.; Arai, T. Cooperation between a high-power robot and a human by functional safety. J. Robot. Mechatron. 2011, 23, 926–938. [Google Scholar] [CrossRef]
- Ahmed, R.M.; Ananiev, A.V.; Kalaykov, I.G. Safe robot with reconfigurable compliance/stiffness actuation. In Proceedings of the ASME/IFToMM International Conference on Reconfigurable Mechanisms and Robots, London, UK, 22–24 June 2009. [Google Scholar]
- Zheng, J.; Wang, S.; Housden, J.; Hou, Z.G.; Rhode, K. A Safety Joint with Passive Compliant and Manual Override Mechanisms for Medical Robotics. In Proceedings of the IEEE International Conference on Intelligence and Safety for Robotics, Tokoname, Japan, 4–6 March 2021. [Google Scholar]
- Schmitz, A.; Maiolino, P.; Maggiali, M.; Natale, L.; Cannata, G.; Metta, G. Methods and technologies for the implementation of large-scale robot tactile sensors. IEEE Trans. Robot. 2011, 27, 389–400. [Google Scholar] [CrossRef]
- Mohammed, A.; Schmidt, B.; Wang, L. Active collision avoidance for human–robot collaboration driven by vision sensors. Int. J. Comput. Integr. Manuf. 2017, 30, 970–980. [Google Scholar] [CrossRef]
- Tsuji, S.; Kohama, T. A general-purpose safety light curtain using Tof sensor for end effector on human collaborative robot. IEEE Trans. Electr. Electron. Eng. 2020, 15, 1868–1874. [Google Scholar] [CrossRef]
- Li, C.; Liu, F.; Wang, Y.; Buss, M. Concurrent learning-based adaptive control of an uncertain robot manipulator with guaranteed safety and performance. IEEE Trans. Syst. Man Cybern. Syst. 2021, 99, 1–15. [Google Scholar] [CrossRef]
- Peng, J.; Luo, W.; Liu, W.; Yu, W.; Wang, J. A suboptimal and analytical solution to mobile robot trajectory generation amidst moving obstacles. Auton. Robot. 2015, 39, 1–23. [Google Scholar] [CrossRef] [Green Version]
- Wu, H.; Feng, J. A Review of Fault Diagnosis Methods of Robot Joint Servo System. In Proceedings of the IEEE International Conference on Mechatronics and Automation (ICMA), Beijing, China, 13–16 October 2020. [Google Scholar]
- Hashlamon, I.; Erbatur, K. Joint sensor fault detection and recovery based on virtual sensor for walking legged robots. In Proceedings of the IEEE International Symposium on Industrial Electronics (ISIE), Istanbul, Turkey, 1–4 June 2014. [Google Scholar]
- Hong, Y.; Sun, Z.; Zou, X.; Long, J. Multi-joint Industrial Robot Fault Identification using Deep Sparse Auto-Encoder Network with Attitude Data. In Proceedings of the Prognostics and Health Management Conference (PHM-Besançon), Besancon, France, 4–7 May 2020. [Google Scholar]
- Wang, H.; Pekarek, S.; Fahimi, B. Multilayer control of an induction motor drive: A strategic step for automotive applications. IEEE Trans. Power Electron. 2006, 21, 676–686. [Google Scholar] [CrossRef]
- Foo, G.H.B.; Zhang, X.; Vilathgamuwa, D.M. A sensor fault detection and isolation method in interior permanent-magnet synchronous motor drives based on an extended Kalman filter. IEEE Trans. Ind. Electron. 2013, 60, 3485–3495. [Google Scholar] [CrossRef]
- Zhou, Y.; Xu, J.; Jing, Y. Comparison of centralized multi-sensor measurement and state fusion methods with ensemble Kalman filter for process fault diagnosis. In Proceedings of the Chinese Control and Decision Conference, Xuzhou, China, 26–28 May 2010. [Google Scholar]
- Zhang, J.; Rizzoni, G. Functional safety of electrified vehicles through model-based fault diagnosis. IFAC Pap. 2015, 48, 454–461. [Google Scholar] [CrossRef]
- Bourogaoui, M.; Sethom, H.B.; Belkhodja, I.S. Real-time encoder faults detection and rotor position estimation for permanent magnet synchronous motor drives fault tolerant sensorless control using digital signal controller. Math. Comput. Simul. 2017, 1, 131. [Google Scholar] [CrossRef]
- Jeong, Y.S.; Sul, S.K.; Schulz, S.E.; Patel, N.R. Fault detection and fault-tolerant control of interior permanent-magnet motor drive system for electric vehicle. IEEE Trans. Ind. Appl. 2005, 41, 46–51. [Google Scholar] [CrossRef]
- Gaeid, K.S.; Ping, H.W.; Khalid, M.; Masaoud, A. Sensor and sensorless fault tolerant control for induction motors using a wavelet index. Sensors 2012, 12, 4031–4050. [Google Scholar] [CrossRef]
- Long, J.; Mou, J.; Zhang, L.; Zhang, S.; Li, C. Attitude data-based deep hybrid learning architecture for intelligent fault diagnosis of multi-joint industrial robots. J. Manuf. Syst. 2021, 61, 736–745. [Google Scholar] [CrossRef]
- Wang, J.; Wang, D.; Wang, S.; Li, W.; Song, K. Fault diagnosis of bearings based on multi-sensor information fusion and 2D convolutional neural network. IEEE Access 2021, 9, 23717–23725. [Google Scholar] [CrossRef]
- Blank, M.; Staroswiecki, M.; Wu, N.E. Concepts and methods in fault-tolerant control. In Proceedings of the 2001 American Control Conference, Arlington, TX, USA, 25–27 June 2001. [Google Scholar]
- Fazlollahtabar, H.; Niaki, S. Integration of fault tree analysis, reliability block diagram and hazard decision tree for industrial robot reliability evaluation. Ind. Robot. 2017, 44, 754–764. [Google Scholar] [CrossRef]
- Huang, C.; Li, L. Architectural design and analysis of a steer-by-wire system in view of functional safety concept. Reliab. Eng. Syst. Saf. 2020, 198, 106822. [Google Scholar] [CrossRef]
- Zhao, X.; Malasse, O.; Buchheit, G. Verification of safety integrity level of high demand system based on Stochastic Petri Nets and Monte Carlo Simulation. Reliab. Eng. Syst. Saf. 2019, 184, 258–265. [Google Scholar] [CrossRef]
- Haghgoo, O.; Damchi, Y. Reliability modelling of capacitor voltage transformer using proposed Markov model. Electr. Power Syst. Res. 2022, 202, 107573. [Google Scholar] [CrossRef]
- Ge, H.; Asgarpoor, S. Reliability evaluation of equipment and substations with fuzzy Markov processes. IEEE Trans. Power Syst. 2010, 25, 1319–1328. [Google Scholar]
- Wan, Y.; Huang, H.; Das, D.; Pecht, M. Thermal reliability prediction and analysis for high-density electronic systems based on the Markov process. Microelectron. Reliab. 2016, 56, 182–188. [Google Scholar] [CrossRef]
- Azizpour, H.; Lundteigen, M.A. Analysis of simplification in Markov-based models for performance assessment of Safety Instrumented System. Reliab. Eng. Syst. Saf. 2019, 183, 252–260. [Google Scholar] [CrossRef]
- Liang, Q.; Yang, Y.; Zhang, H.; Peng, C.; Lu, J. Analysis of simplification in Markov state-based models for reliability assessment of complex safety systems. Reliab. Eng. Syst. Saf. 2022, 221, 108373. [Google Scholar] [CrossRef]
- Jiang, X.; Fan, D.; Fan, S.; Xie, X.; Chen, N. High-precision gyro-stabilized control of a gear-driven platform with a floating gear tension device. Front. Mech. Eng. 2021, 16, 487–503. [Google Scholar] [CrossRef]
- Bellotti, M.; Mariani, R. How future automotive functional safety requirements will impact microprocessors design. Microelectron. Reliab. 2010, 50, 1320–1326. [Google Scholar] [CrossRef]
- United States of Department of Defense. Reliability Prediction of Electronic Equipment, MIL-HDBK-217F; United States of Department of Defense: Washington, DC, USA, 1995. [Google Scholar]
Figure 1.
Schematic diagram of robot joint.

Figure 2.
Three-phase bridge inverter structure diagram.

Figure 3.
Schematic diagram of the two-mass system.

Figure 4.
Schematic diagram of sensor-safety-related system structure.

Figure 5.
Schematic diagram of SOC chip function structure.

Figure 6.
Schematic diagram of sensor acquisition circuit structure.

Figure 7.
Schematic diagram of STO protection circuit structure.

Figure 8.
Markov model for safety-related systems.

Figure 9.
Experiment setup of the robot joint drive system.

Figure 10.
Residual and torque current under A-phase current sensor failure: (a) residuals under a 0.5 A bias of A-phase current sensor at 1 s; (b) torque current during A-phase current sensor failure.
Figure 10.
Residual and torque current under A-phase current sensor failure: (a) residuals under a 0.5 A bias of A-phase current sensor at 1 s; (b) torque current during A-phase current sensor failure.

Figure 11.
Residual and torque current under B-phase and bus current sensor failure: (a) residuals under a 0.5 A bias of B-phase current sensor at 1 s and 0 output of bus current sensor at 2 s; (b) torque current during B-phase and bus current sensor failure.
Figure 11.
Residual and torque current under B-phase and bus current sensor failure: (a) residuals under a 0.5 A bias of B-phase current sensor at 1 s and 0 output of bus current sensor at 2 s; (b) torque current during B-phase and bus current sensor failure.

Figure 12.
Residual and PMSM velocity under motor encoder failure: (a) residuals under a 20% bias of motor encoder angle at 1 s; (b) velocity during motor encoder failure.
Figure 12.
Residual and PMSM velocity under motor encoder failure: (a) residuals under a 20% bias of motor encoder angle at 1 s; (b) velocity during motor encoder failure.

Figure 13.
Residual and PMSM velocity under motor and load encoder failure: (a) residuals under a 20% bias of load encoder angle at 1 s and 0 output of Hall at 2 s; (b) velocity during motor and load encoder failure.
Figure 13.
Residual and PMSM velocity under motor and load encoder failure: (a) residuals under a 20% bias of load encoder angle at 1 s and 0 output of Hall at 2 s; (b) velocity during motor and load encoder failure.


Table 1.
Analysis of sensors’ failure cause and influence of robot joint drive system.
| Failure Type | Cause | Impact |
|---|---|---|
| Phase current sensor failure |
| Causes errors in the collected current data, resulting in the following dangers:
|
| Motor encoder failure |
| Causes errors in the rotor positioning, resulting in the following dangers:
|
| Load encoder failure |
| Causes feedback velocity and position errors, resulting in the following dangers:
|
Table 2.
SIL assessment for H1.
| Hazard | The Failure of Closed-Loop Control, Causing the Robot Joint to Fly | |
|---|---|---|
| Application scenario | Manufacturing and processing | |
| Potential Crash Scenario | The robot hits the workers at high velocity. | |
| SIL assessment | Severity | Irreversible: broken limb(s), losing a finger(s) |
| Frequency of exposure | ≥1 per hour | |
| Probability of occurrence | Possible | |
| Probabilities of avoiding or limiting harm | Rarely | |
| Assigned SIL value | SIL 2 | |
Table 3.
Residual state table in case of current sensor failure.
| Residual | A-Phase Current Sensor Failure | B-Phase Current Sensor Failure | C-Phase Current Sensor Failure | Bus Current Sensor Failure |
|---|---|---|---|---|
| R1 | ≠0 | ≠0 | ≠0 | Not care |
| R2 | ≠0 | =0 | =0 | ≠0 |
| R3 | =0 | ≠0 | =0 | ≠0 |
| R4 | =0 | =0 | ≠0 | ≠0 |
Table 4.
Residual state table in case of angle sensor failure.
| Residual | Motor Encoder Failure | Load Encoder Failure | Hall Sensor Failure |
|---|---|---|---|
| R5 | ≠0 | ≠0 | =0 |
| R6 | >Et | <Et | >Et |
| R7 | <Et | >Et | >Et |
Table 5.
Failure rate evaluation results of subsystem.
| Subsystem | Main Components | Quantity | Component Failure Rate (10−9/h) | Subsystem Failure Rate (10−9/h) |
|---|---|---|---|---|
| LS | Microprocessor | 1 | 553.8 | 553.8 |
| SS | High-precision resistor | 4 | 8 | 1466.8 |
| Isolated Σ-Δ modulator | 4 | 51.6 | ||
| Digital isolator | 1 | 39.4 | ||
| Differential line receiver | 1 | 40.2 | ||
| RS-485 transceiver | 1 | 48.8 | ||
| Hall sensor | 1 | 100 | ||
| Orthogonal pulse encoder | 1 | 500 | ||
| Rotary electric encoder | 1 | 500 | ||
| FS | MOSFET | 1 | 129 | 427 |
| Zener diode | 1 | 16 | ||
| Operational amplifier | 1 | 48 | ||
| Gate driver | 3 | 78 |
Table 6.
Diagnosis coverage of each subsystem.
| Subsystem | Diagnostic Techniques/Measures | Maximum DC Considered Achievable | Estimated DC |
|---|---|---|---|
| LS | Logical monitoring of program sequence | High | 90% |
| SS | Reference sensor/and Input comparison | High | 99% |
| FS | Reference sensor | Medium | 85% |
Table 7.
PFH of safety-related system under different condition.
| NO. | β | μ | TM (Year) | PFH (h−1) | SIL |
|---|---|---|---|---|---|
| 1 | 0.02 | 1/8 | 10 | 7.132 × 10⁻⁷ | SIL3 |
| 2 | 0.02 | 1/16 | 10 | 7.132 × 10⁻⁷ | SIL3 |
| 3 | 0.02 | 1/16 | 20 | 7.133 × 10⁻⁷ | SIL3 |
| 4 | 0.1 | 1/16 | 20 | 8.841 × 10⁻⁷ | SIL3 |
| 5 | 0.1 | 1/32 | 20 | 8.842 × 10⁻⁷ | SIL3 |
| 6 | 0.02 | 1/8 | 10 | 7.132 × 10⁻⁷ | SIL3 |
Publisher’s Note: MDPI stays neutral with regard to jurisdictional claims in published maps and institutional affiliations. |
© 2022 by the authors. Licensee MDPI, Basel, Switzerland. This article is an open access article distributed under the terms and conditions of the Creative Commons Attribution (CC BY) license (https://creativecommons.org/licenses/by/4.0/).
Share and Cite
MDPI and ACS Style
Chen, L.; Fan, D.; Zheng, J.; Xie, X. Functional Safety Analysis and Design of Sensors in Robot Joint Drive System. Machines 2022, 10, 360. https://doi.org/10.3390/machines10050360
AMA Style
Chen L, Fan D, Zheng J, Xie X. Functional Safety Analysis and Design of Sensors in Robot Joint Drive System. Machines. 2022; 10(5):360. https://doi.org/10.3390/machines10050360
Chicago/Turabian StyleChen, Lingyu, Dapeng Fan, Jieji Zheng, and Xin Xie. 2022. "Functional Safety Analysis and Design of Sensors in Robot Joint Drive System" Machines 10, no. 5: 360. https://doi.org/10.3390/machines10050360
Note that from the first issue of 2016, this journal uses article numbers instead of page numbers. See further details here.