
SERS Performance of Ti3C2Tx MXene-Based Substrates Correlates with Surface Morphology
 ,
,  , , , , , and
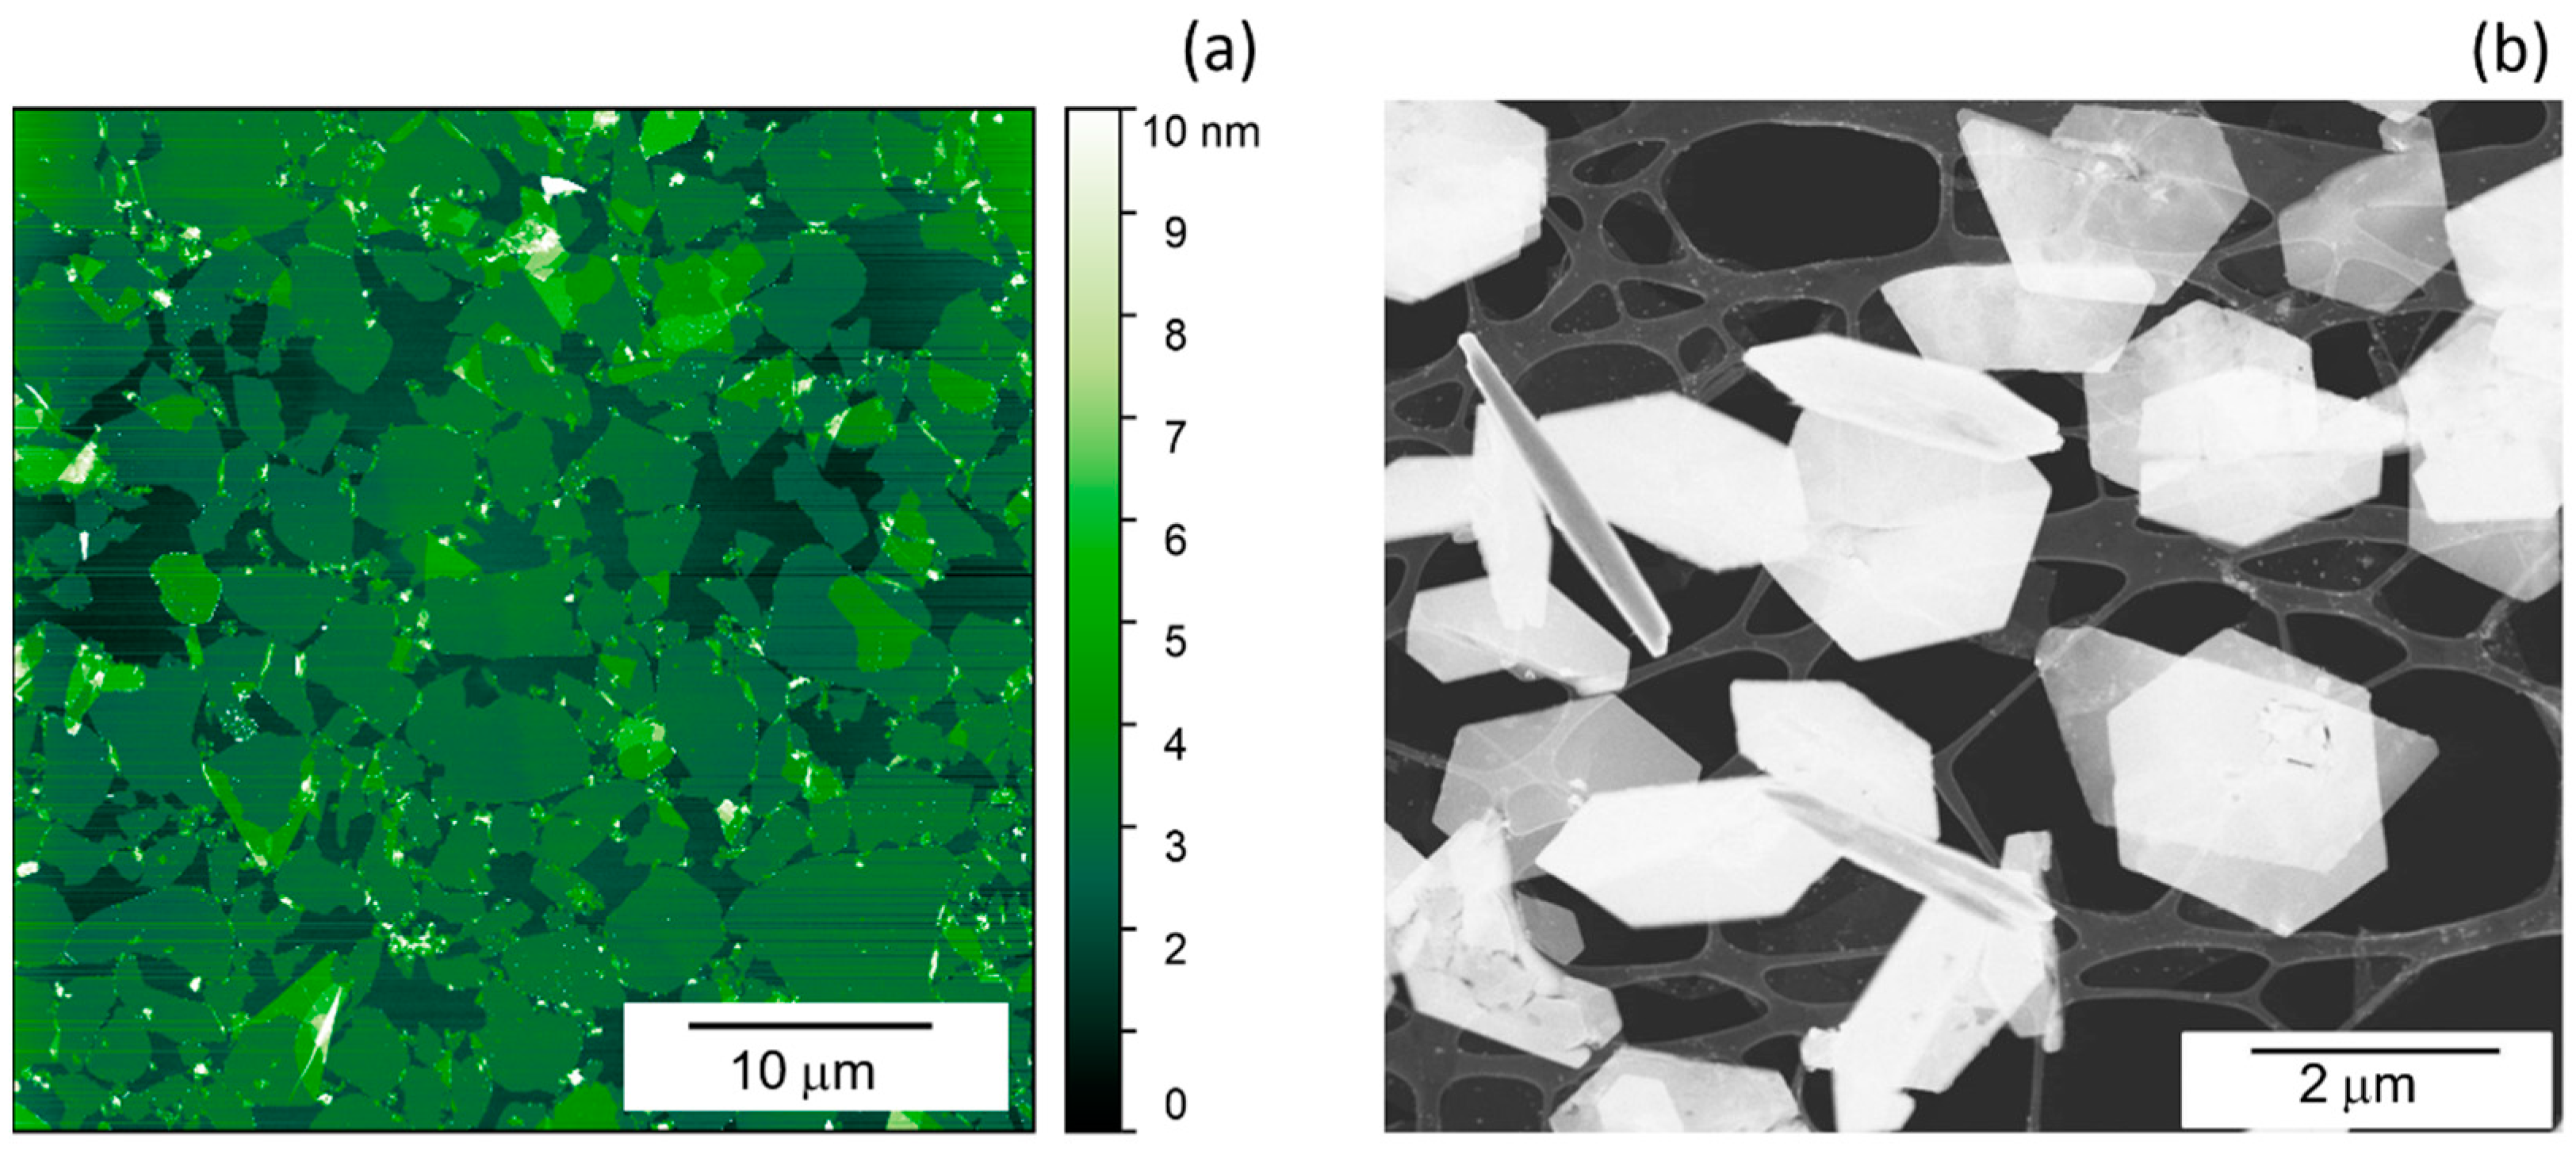
Abstract
:1. Introduction
2. Materials and Methods
2.1. Synthesis and Analysis of 2D MXene Nanoflakes
2.2. Synthesis and Analysis of MXene-Based SERS Substrates
3. Results and Discussion
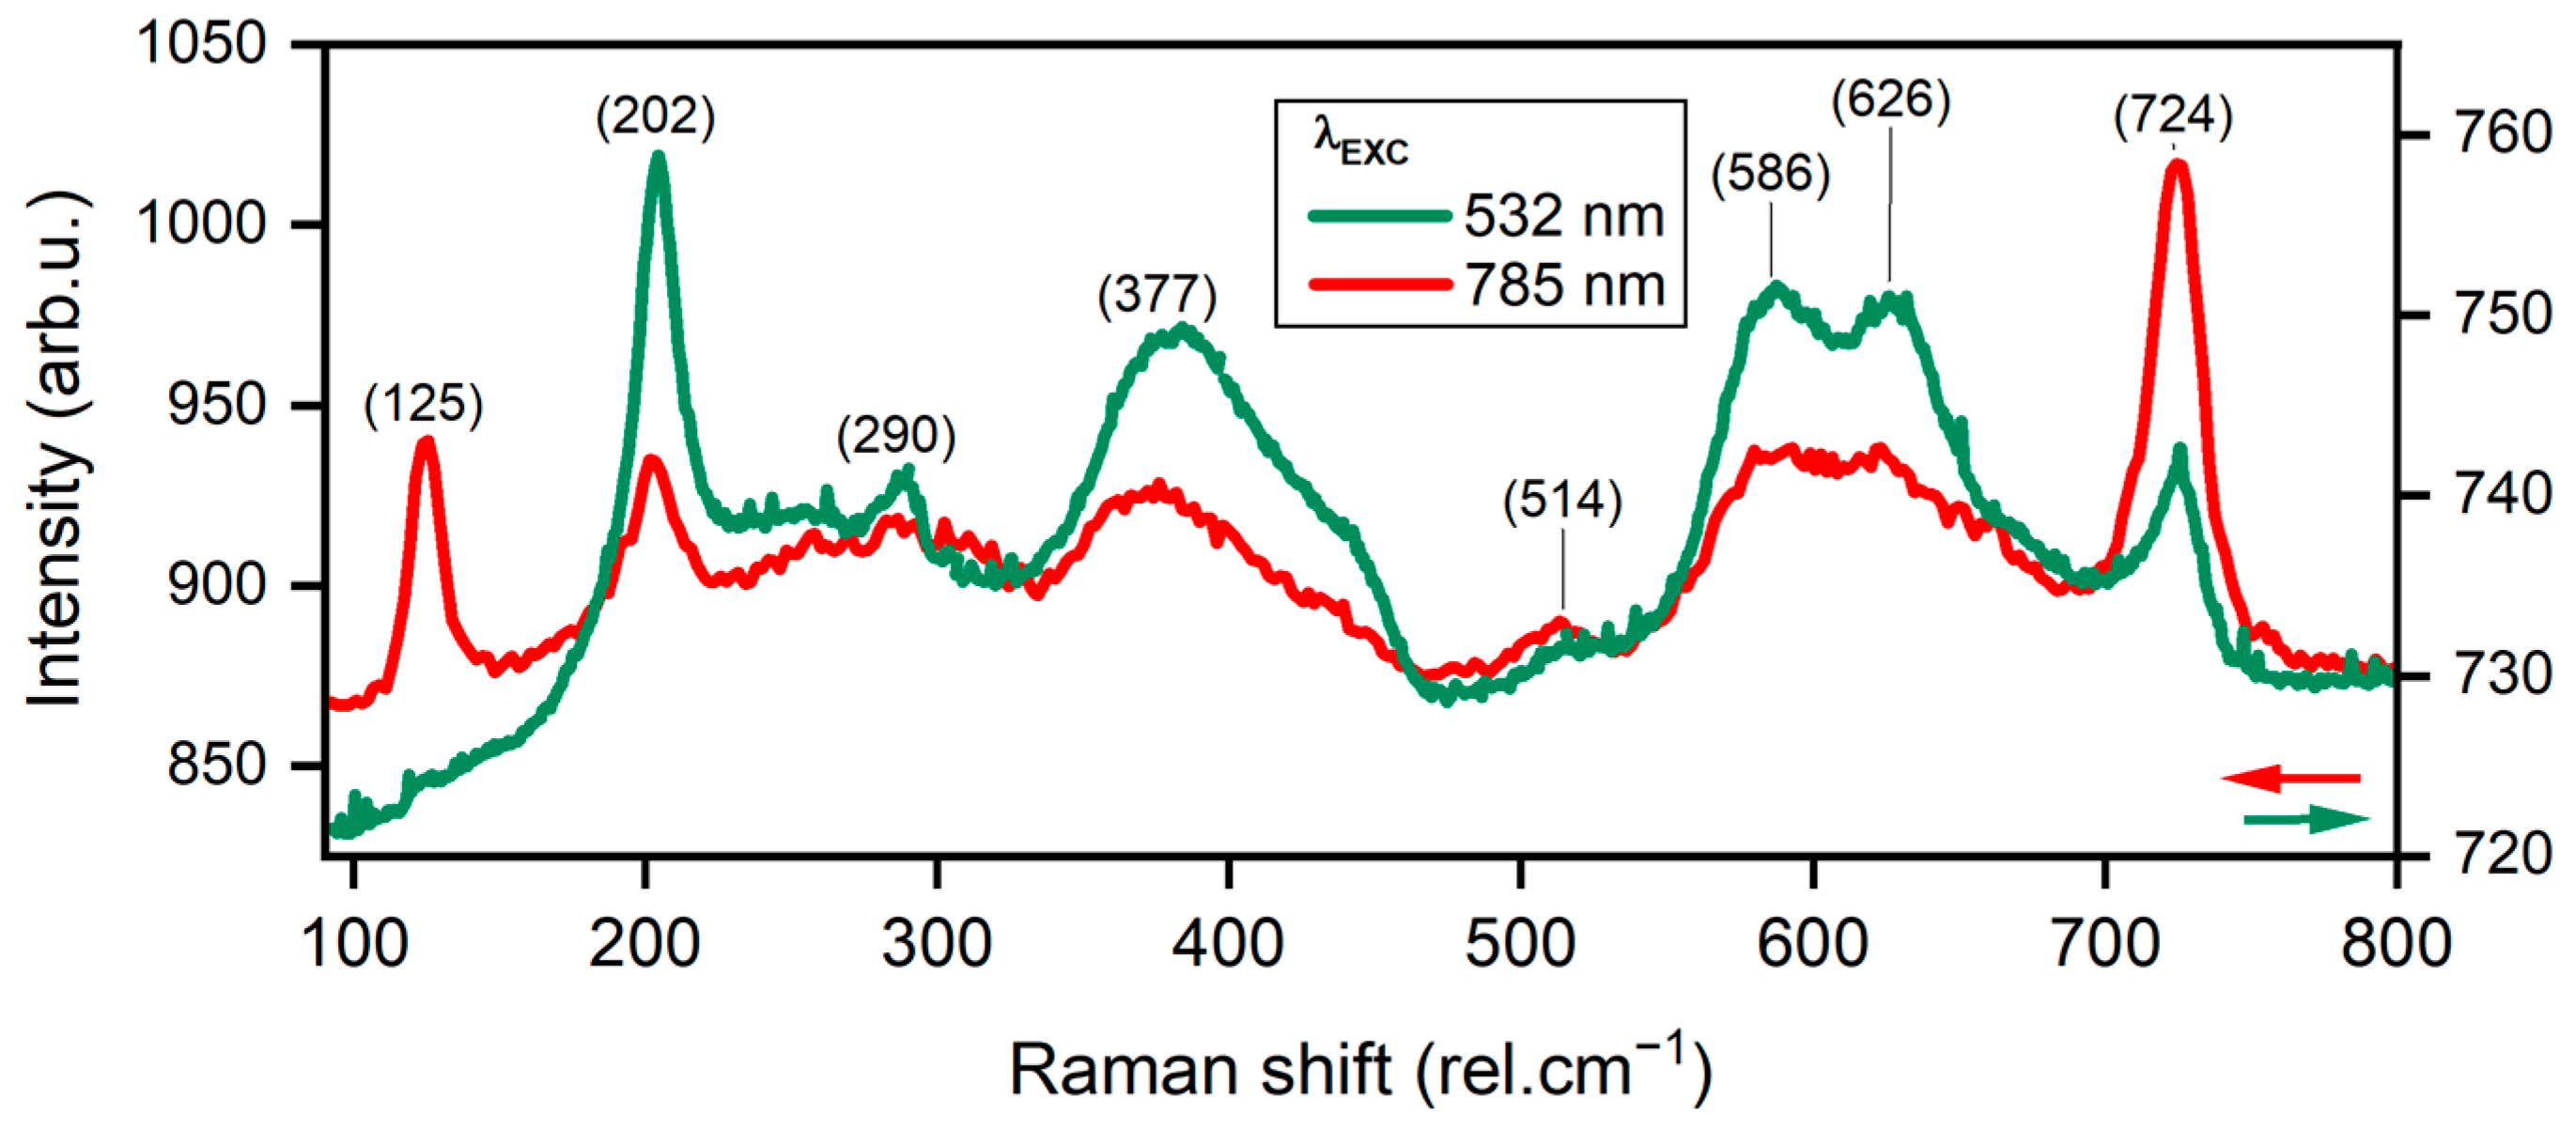
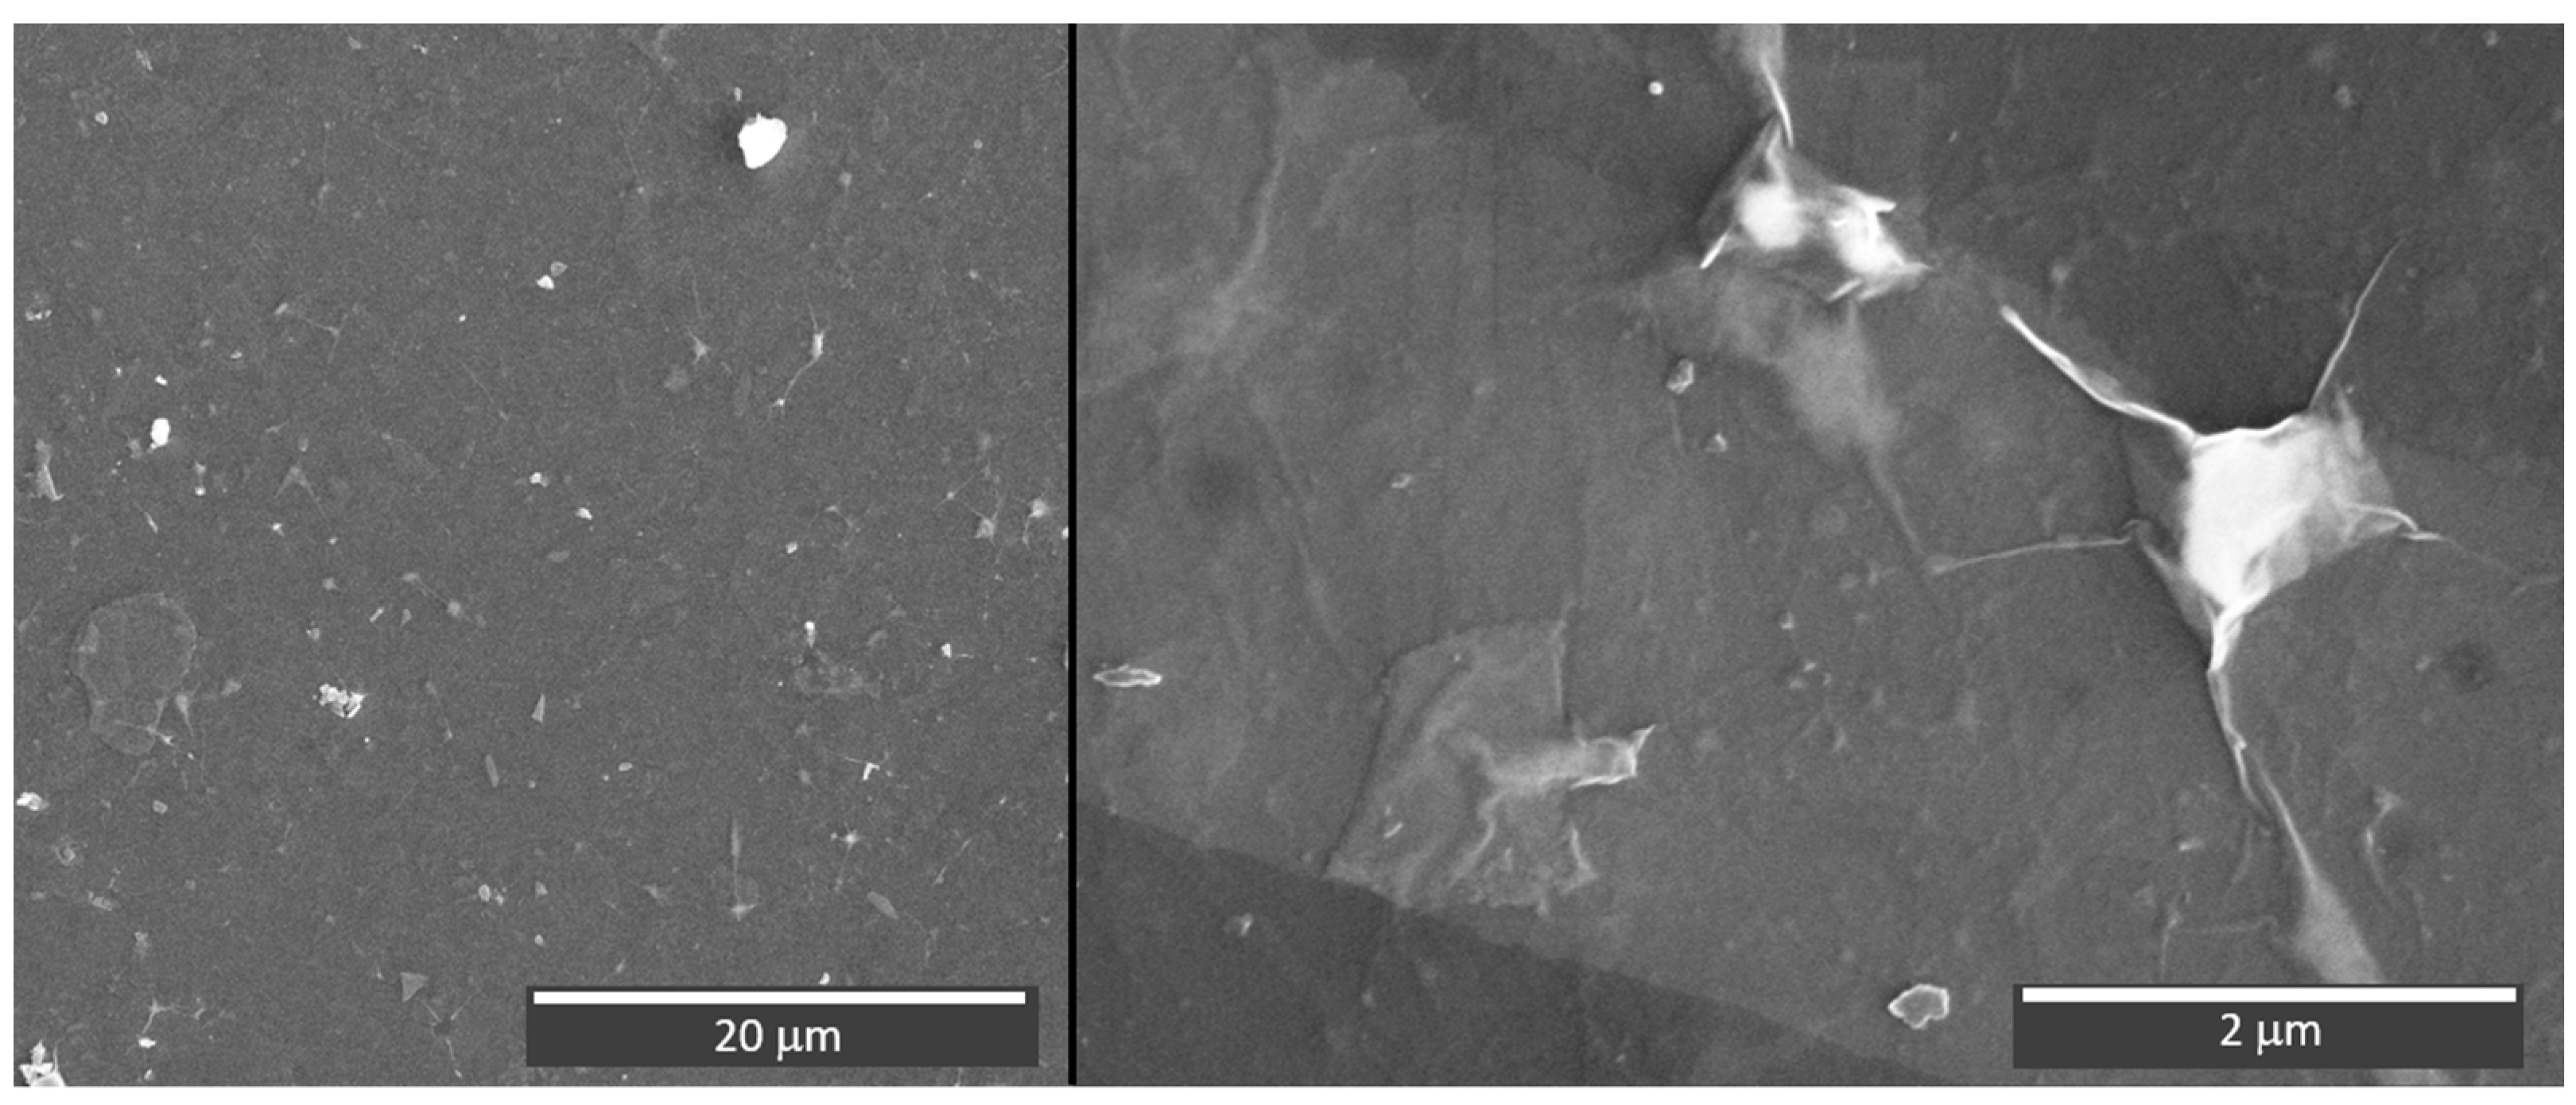
3.1. Few Layer MXene Nanoflakes
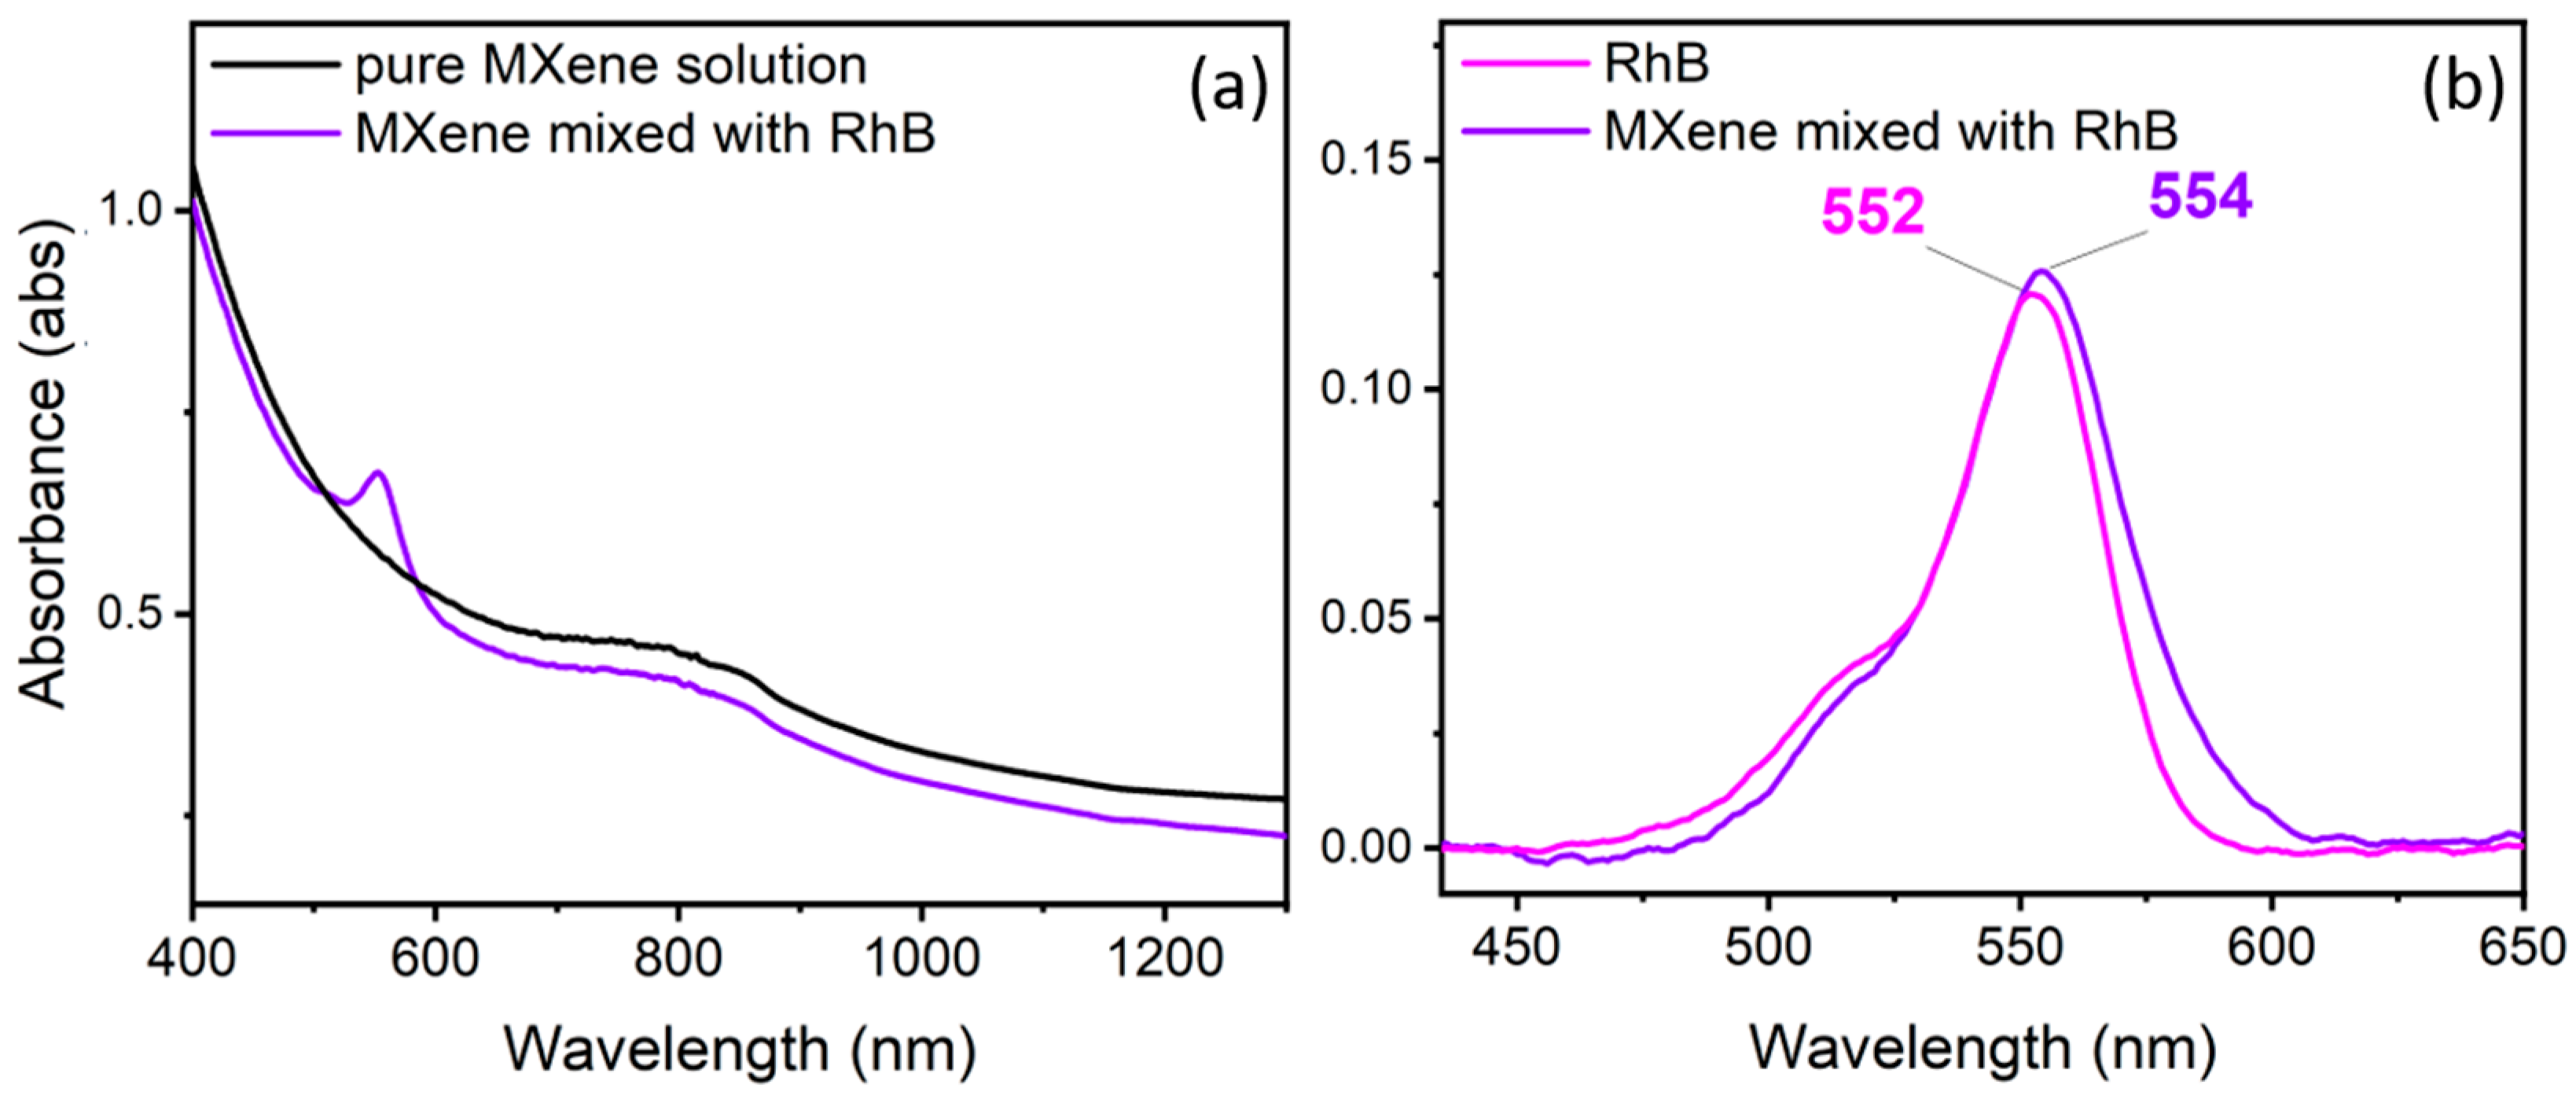
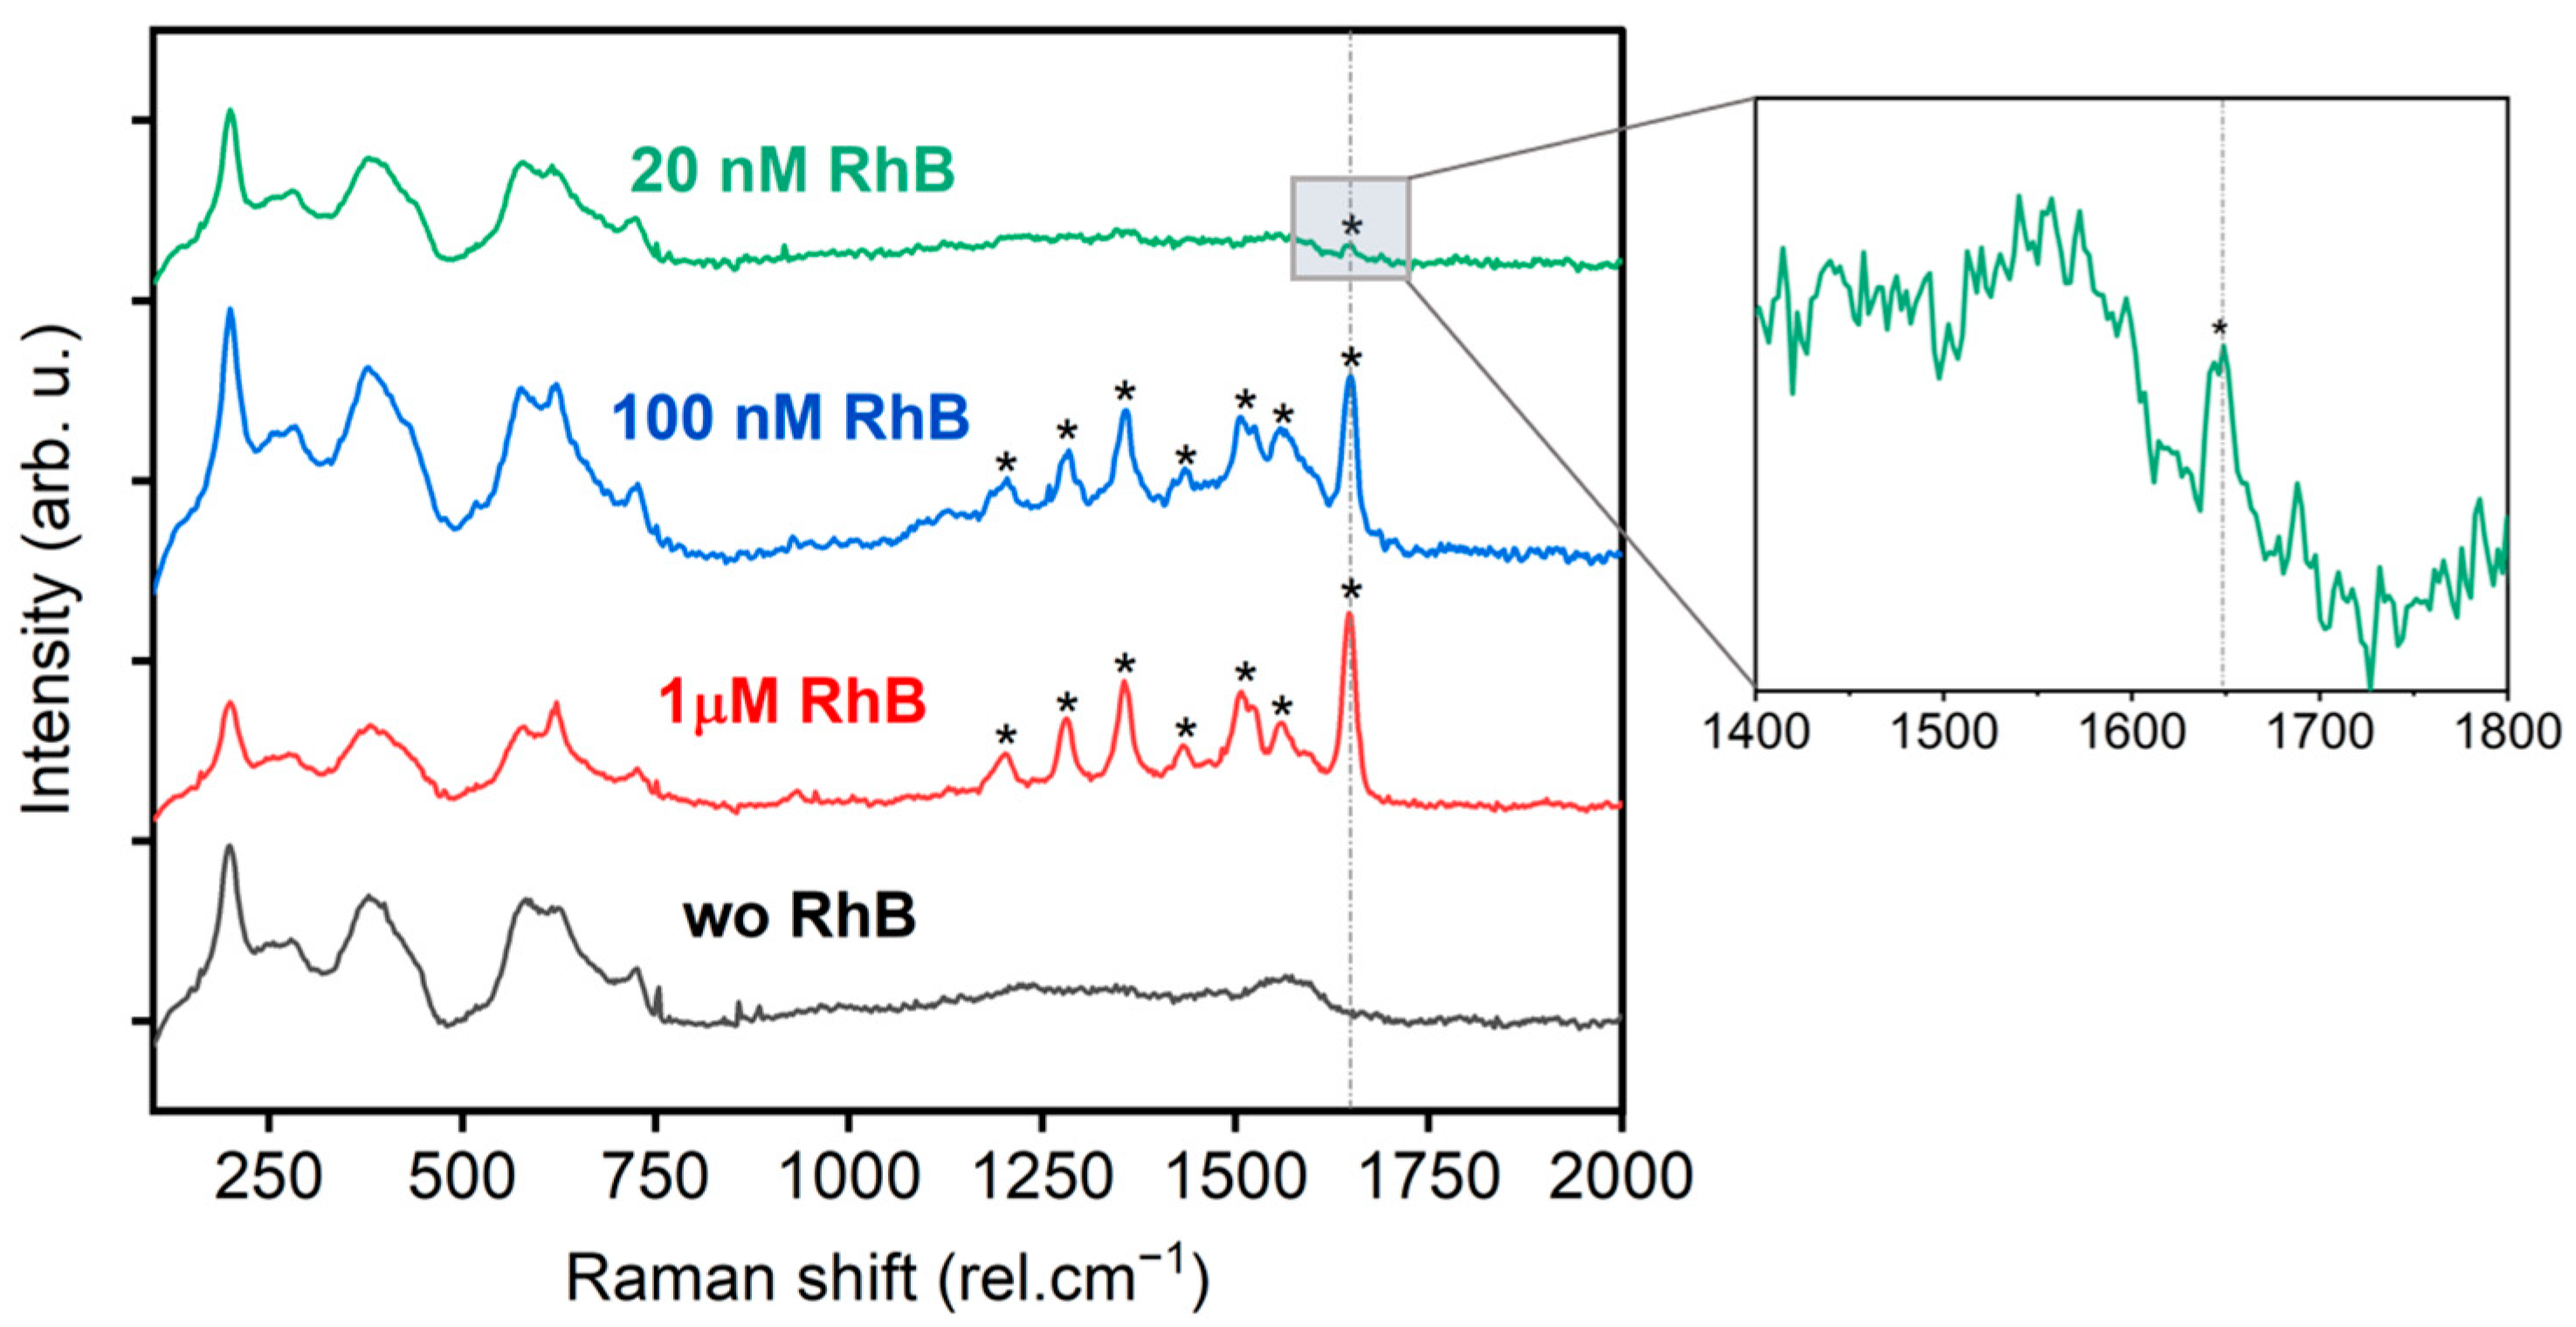
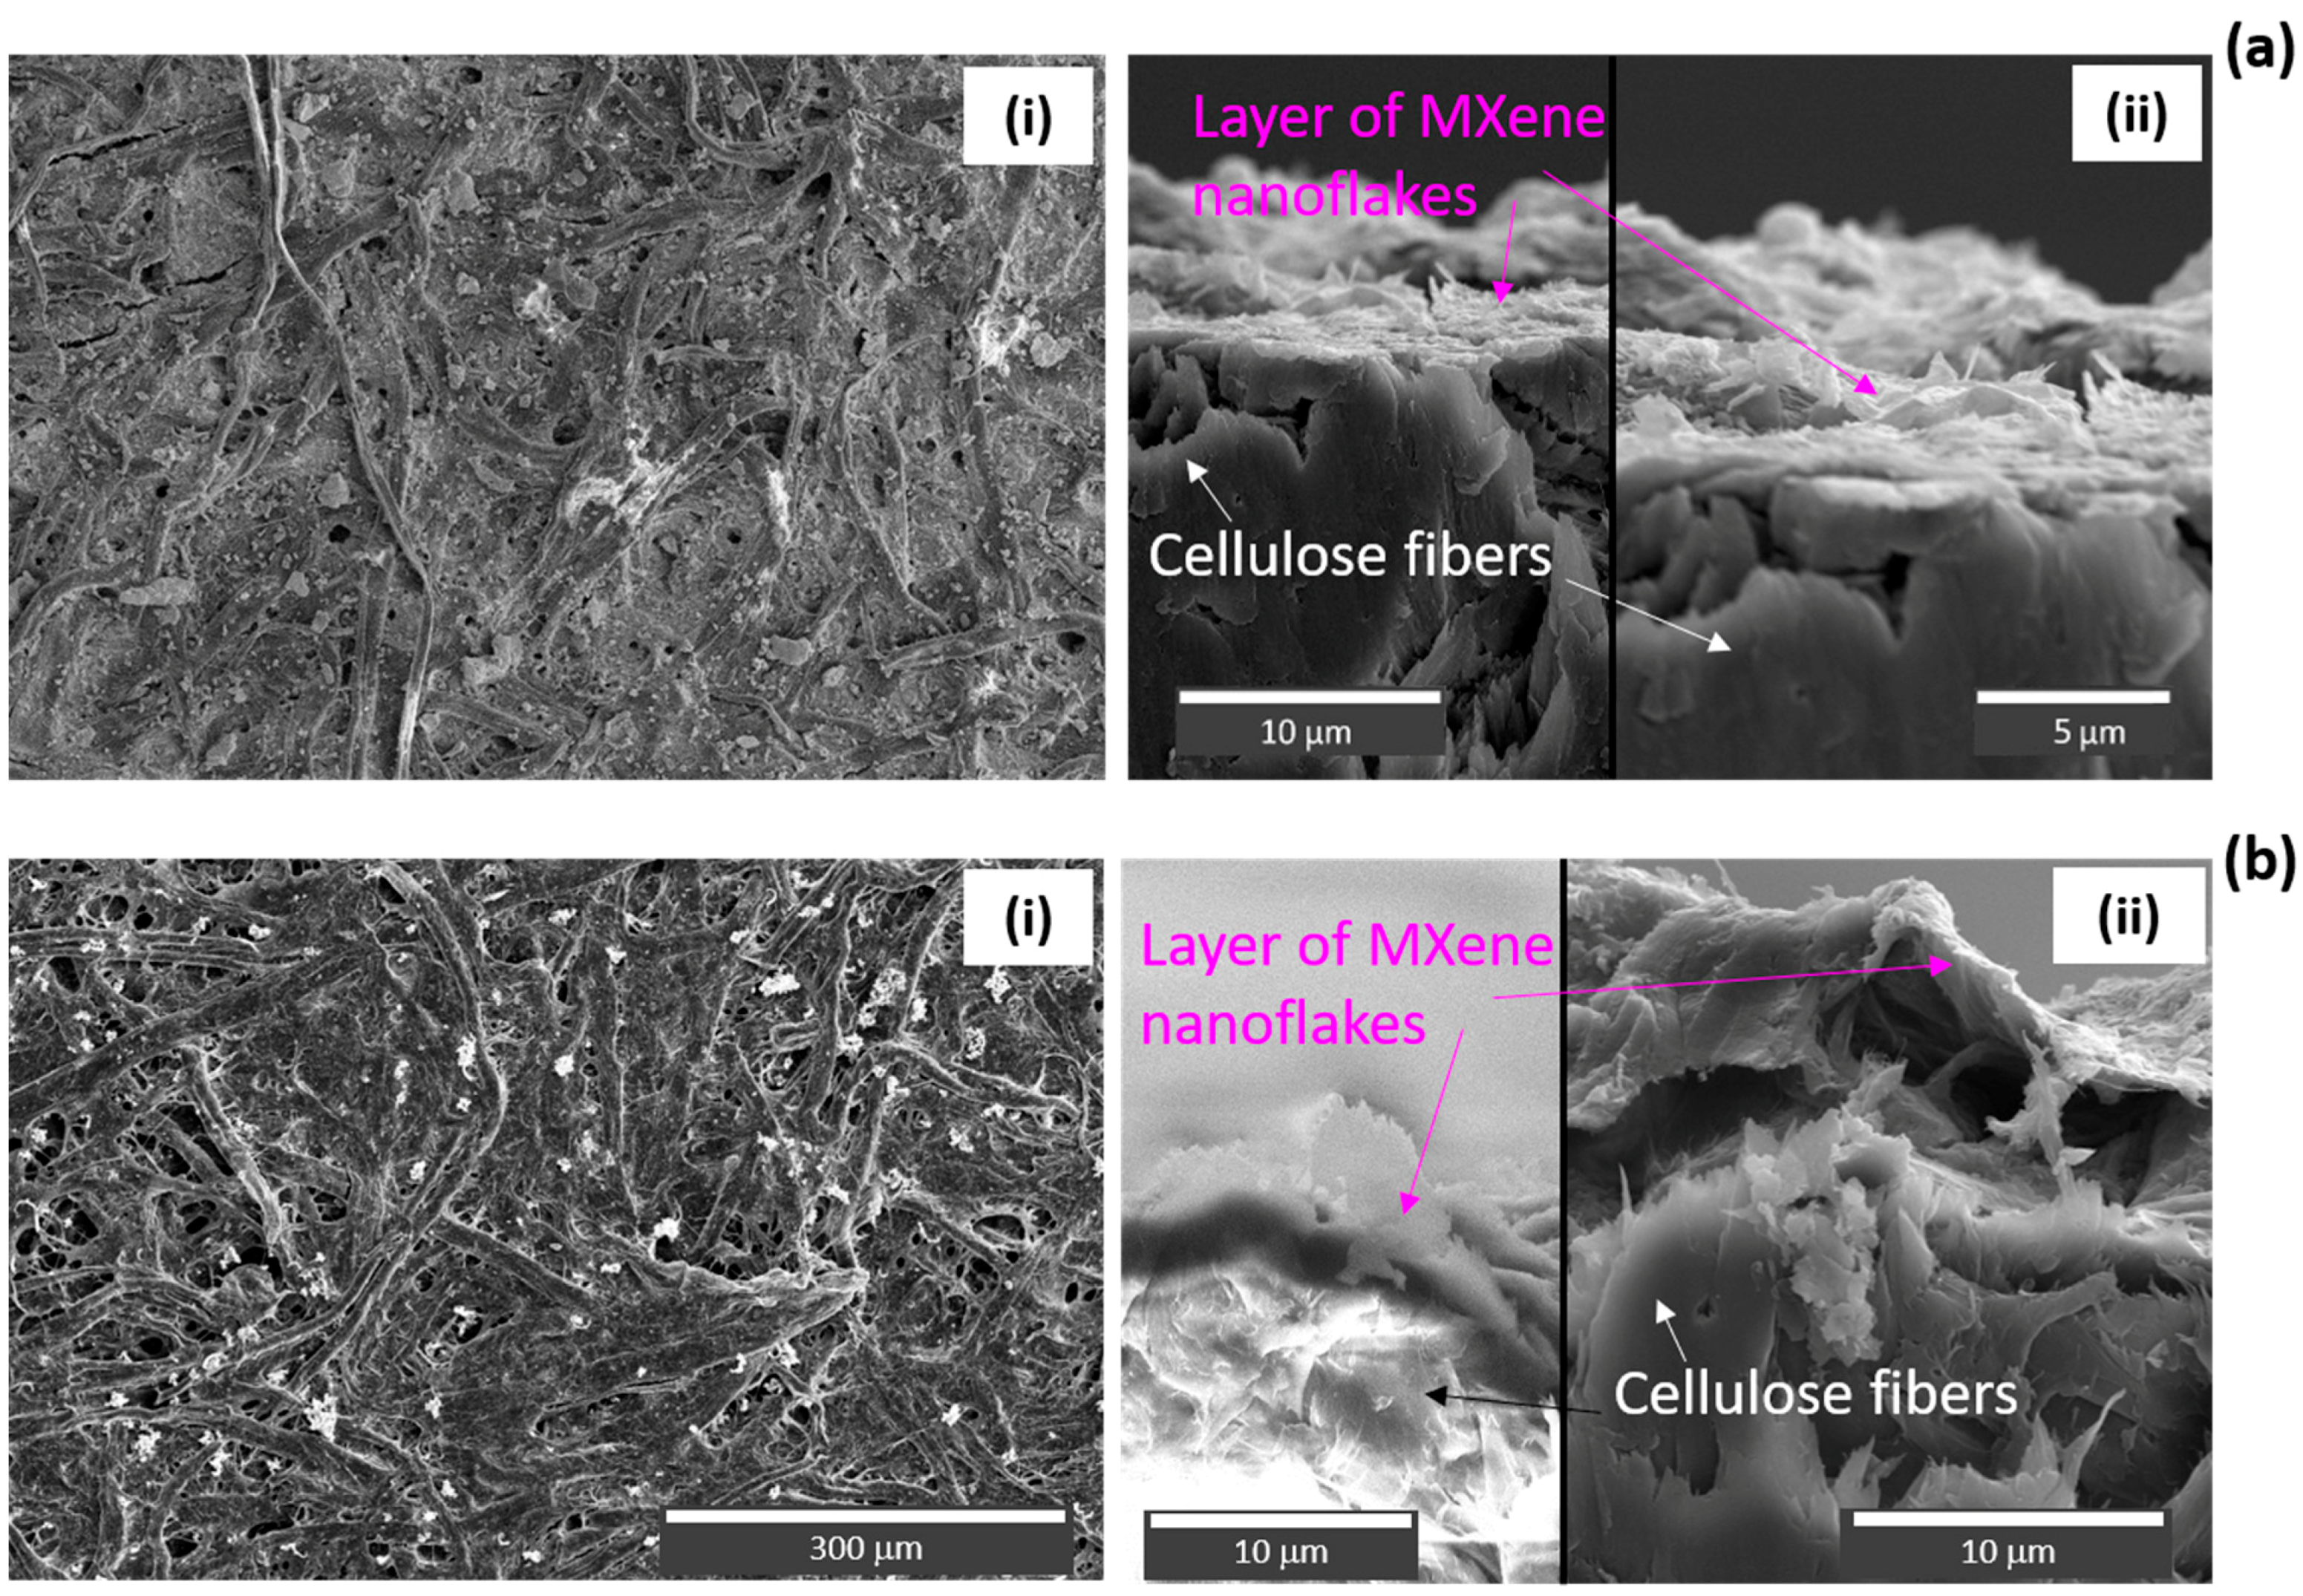
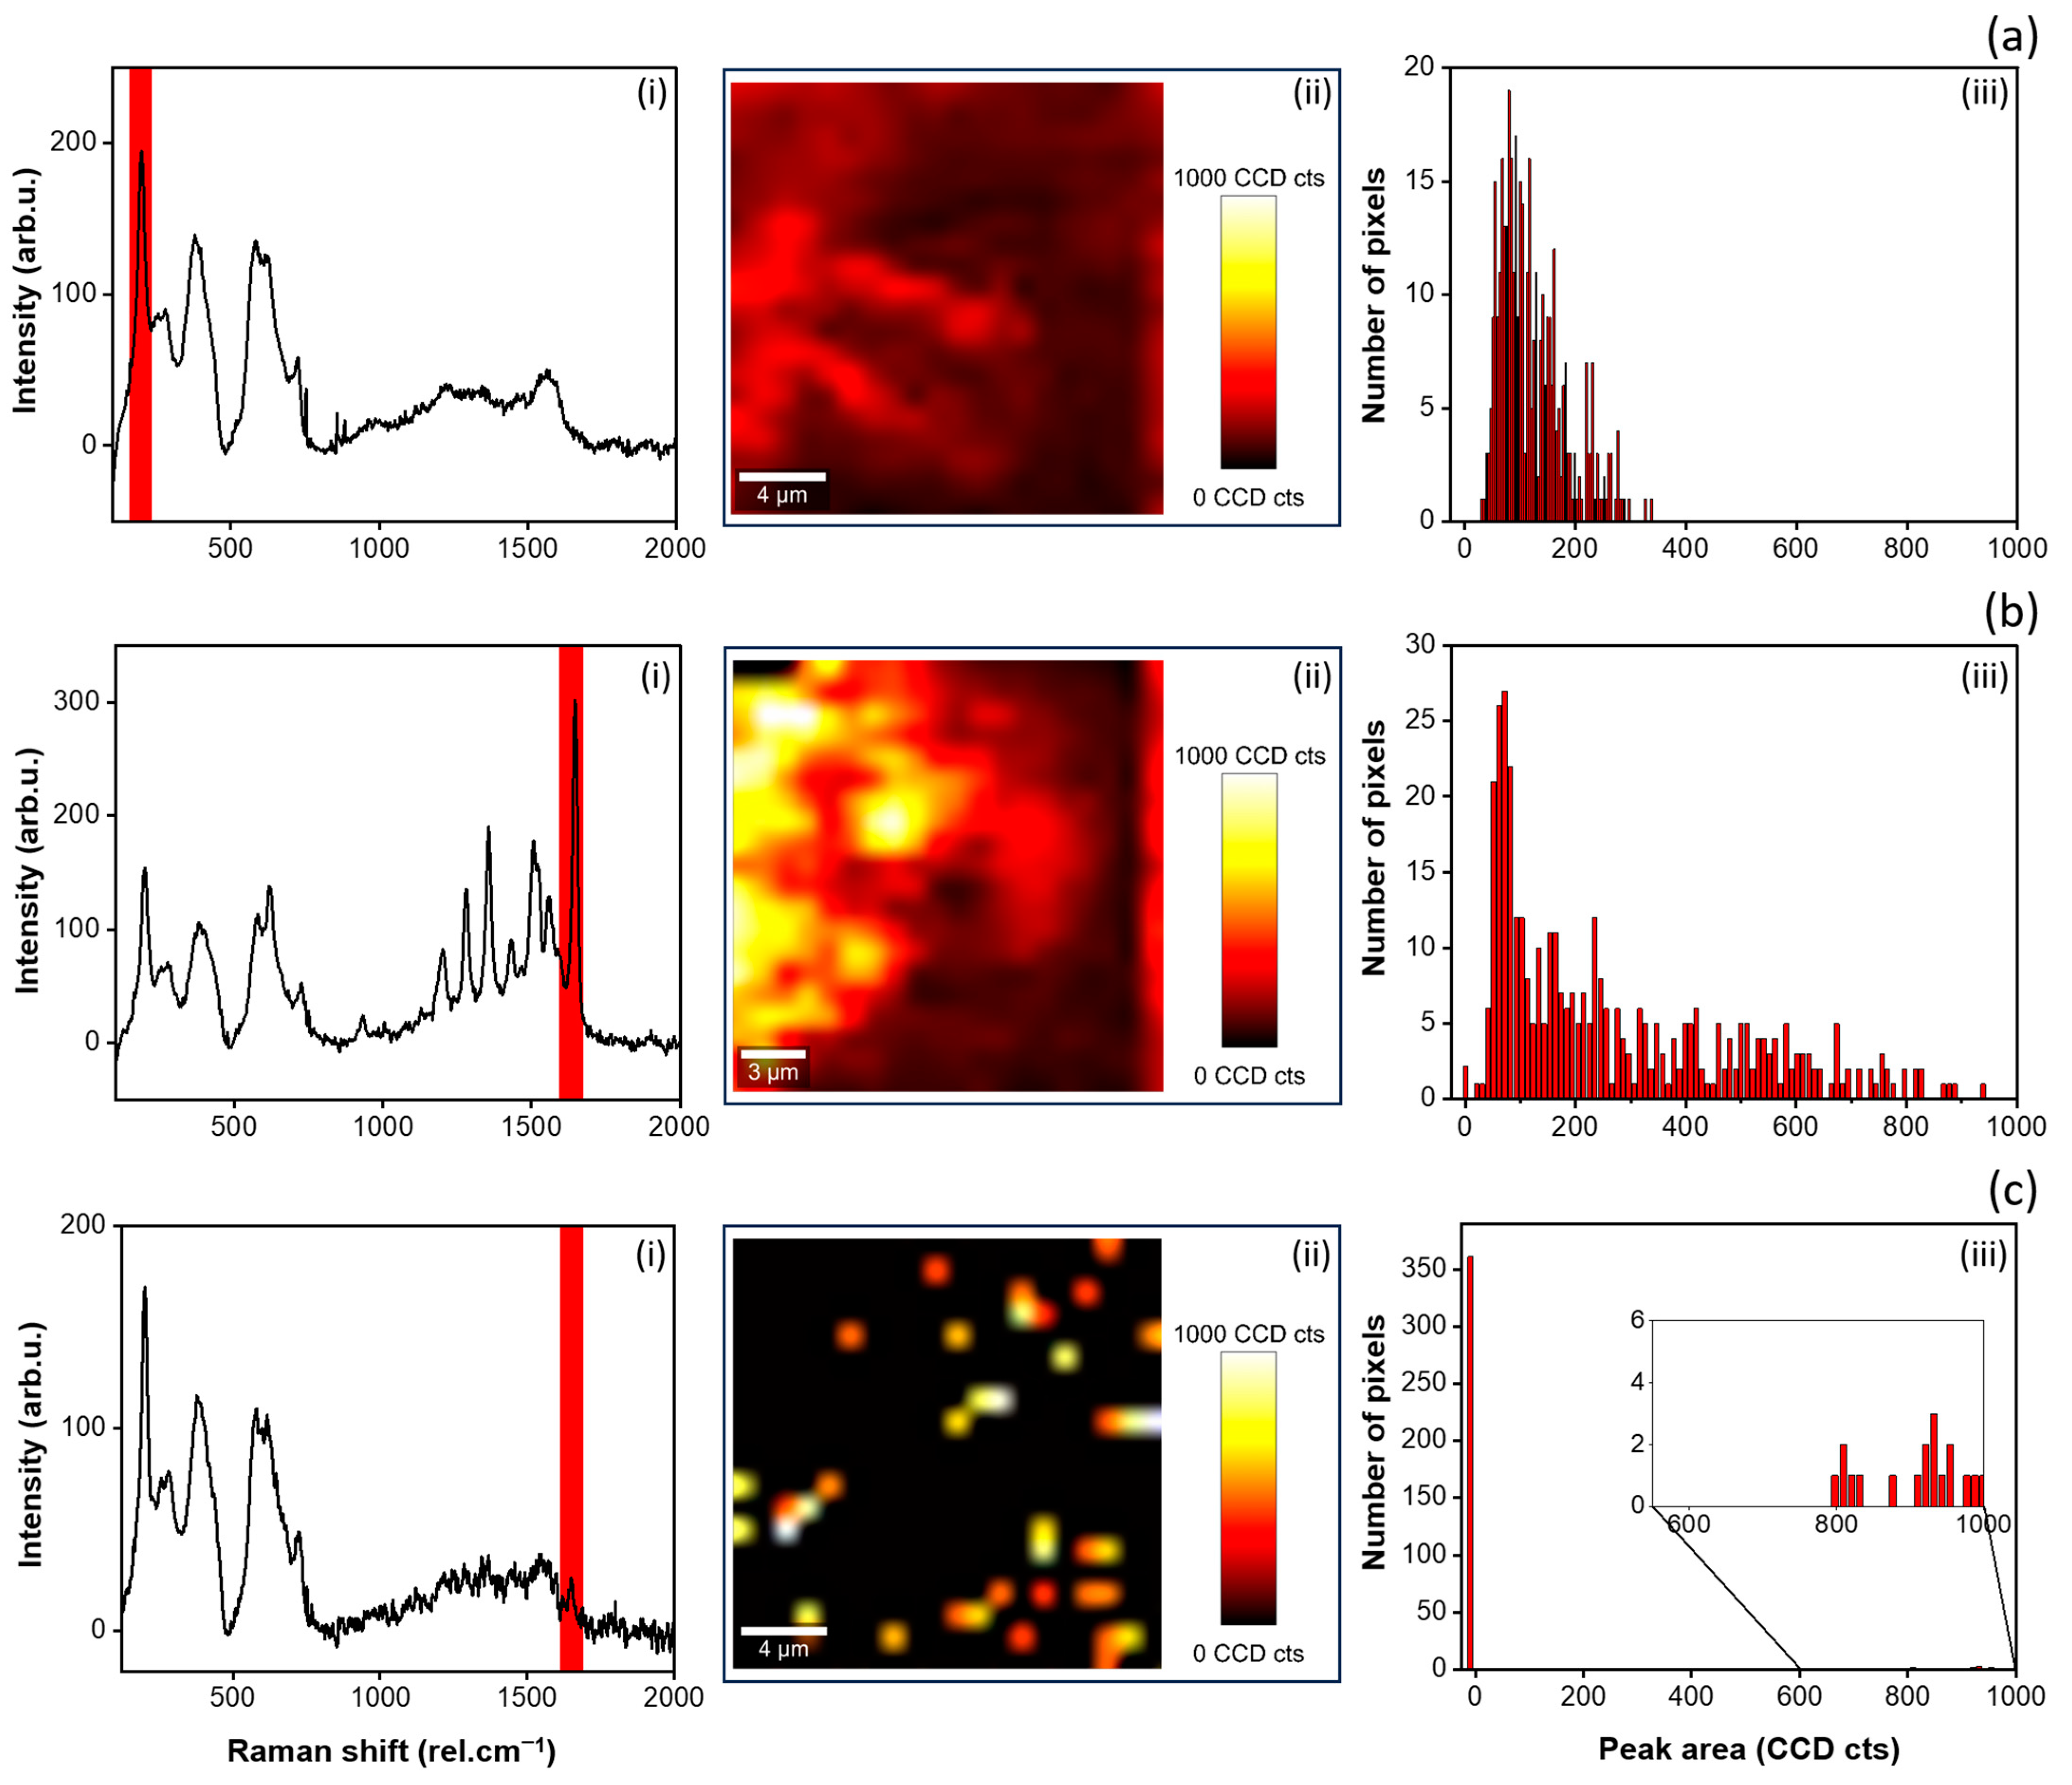
3.2. Few Layer MXene SERS Substrates
4. Conclusions
Supplementary Materials
Author Contributions
Funding
Data Availability Statement
Conflicts of Interest
References
- Ding, S.Y.; You, E.M.; Tian, Z.Q.; Moskovits, M. Electromagnetic Theories of Surface-Enhanced Raman Spectroscopy. Chem. Soc. Rev. 2017, 46, 4042–4076. [Google Scholar] [CrossRef]
- Lee, H.K.; Lee, Y.H.; Koh, C.S.L.; Phan-Quang, G.C.; Han, X.; Lay, C.L.; Sim, H.Y.F.; Kao, Y.C.; An, Q.; Ling, X.Y. Designing Surface-Enhanced Raman Scattering (SERS) Platforms beyond Hotspot Engineering: Emerging Opportunities in Analyte Manipulations and Hybrid Materials. Chem. Soc. Rev. 2019, 48, 731–756. [Google Scholar] [CrossRef] [PubMed]
- Lombardi, J.R.; Birke, R.L. Theory of Surface-Enhanced Raman Scattering in Semiconductors. J. Phys. Chem. C 2014, 118, 11120–11130. [Google Scholar] [CrossRef]
- Wang, X.; Shi, W.; She, G.; Mu, L. Surface-Enhanced Raman Scattering (SERS) on Transition Metal and Semiconductor Nanostructures. Phys. Chem. Chem. Phys. 2012, 14, 5891–5901. [Google Scholar] [CrossRef]
- Chen, M.; Liu, D.; Du, X.; Lo, K.H.; Wang, S.; Zhou, B.; Pan, H. 2D Materials: Excellent Substrates for Surface-Enhanced Raman Scattering (SERS) in Chemical Sensing and Biosensing. TrAC Trends Anal. Chem. 2020, 130, 115983. [Google Scholar] [CrossRef]
- Feng, S.; dos Santos, M.C.; Carvalho, B.R.; Lv, R.; Li, Q.; Fujisawa, K.; Elías, A.L.; Lei, Y.; Perea-López, N.; Endo, M.; et al. Ultrasensitive Molecular Sensor Using N-Doped Graphene through Enhanced Raman Scattering. Sci. Adv. 2016, 2, e1600322. [Google Scholar] [CrossRef]
- Jabłońska, A.; Jaworska, A.; Kasztelan, M.; Berbeć, S.; Pałys, B. Graphene and Graphene Oxide Applications for SERS Sensing and Imaging. Curr. Med. Chem. 2018, 26, 6878–6895. [Google Scholar] [CrossRef] [PubMed]
- Karthick Kannan, P.; Shankar, P.; Blackman, C.; Chung, C.H. Recent Advances in 2D Inorganic Nanomaterials for SERS Sensing. Adv. Mater. 2019, 31, 1803432. [Google Scholar] [CrossRef]
- Wang, X.; Shi, W.; Wang, S.; Zhao, H.; Lin, J.; Yang, Z.; Chen, M.; Guo, L. Two-Dimensional Amorphous TiO2 Nanosheets Enabling High-Efficiency Photoinduced Charge Transfer for Excellent SERS Activity. J. Am. Chem. Soc. 2019, 141, 5856–5862. [Google Scholar] [CrossRef]
- Peng, Y.; Lin, C.; Tang, M.; Yang, L.; Yang, Y.; Liu, J.; Huang, Z.; Li, Z. Niobium Pentoxide Ultra-Thin Nanosheets: A Photocatalytic Degradation and Recyclable Surface-Enhanced Raman Scattering Substrate. Appl. Surf. Sci. 2020, 509, 145376. [Google Scholar] [CrossRef]
- Zheng, Z.; Cong, S.; Gong, W.; Xuan, J.; Li, G.; Lu, W.; Geng, F.; Zhao, Z. Semiconductor SERS Enhancement Enabled by Oxygen Incorporation. Nat. Commun. 2017, 8, 1993. [Google Scholar] [CrossRef]
- Guselnikova, O.; Lim, H.; Kim, H.J.; Kim, S.H.; Gorbunova, A.; Eguchi, M.; Postnikov, P.; Nakanishi, T.; Asahi, T.; Na, J.; et al. New Trends in Nanoarchitectured SERS Substrates: Nanospaces, 2D Materials, and Organic Heterostructures. Small 2022, 18, 2107182. [Google Scholar] [CrossRef] [PubMed]
- Yin, Z.; Li, Y.; Xu, J.; Qian, Z.F.; Xiong, K. Recent Advances of Perovskite Materials for Surface Enhanced Raman Scattering and Their Applications. Mater. Today Phys. 2022, 27, 100815. [Google Scholar] [CrossRef]
- Patra, A.; Bhavya, M.B.; Manasa, G.; Samal, A.K.; Rout, C.S. 2D MXenes as a Promising Candidate for Surface Enhanced Raman Spectroscopy: State of the Art, Recent Trends, and Future Prospects. Adv. Funct. Mater. 2023, 33, 2306680. [Google Scholar] [CrossRef]
- Venkateshalu, S.; Grace, A.N. MXenes—A New Class of 2D Layered Materials: Synthesis, Properties, Applications as Supercapacitor Electrode and Beyond. Appl. Mater. Today 2020, 18, 100509. [Google Scholar] [CrossRef]
- Khazaei, M.; Ranjbar, A.; Arai, M.; Sasaki, T.; Yunoki, S. Electronic Properties and Applications of MXenes: A Theoretical Review. J. Mater. Chem. C Mater. 2017, 5, 2488–2503. [Google Scholar] [CrossRef]
- Maleski, K.; Shuck, C.E.; Fafarman, A.T.; Gogotsi, Y. The Broad Chromatic Range of Two-Dimensional Transition Metal Carbides. Adv. Opt. Mater. 2021, 9, 2001563. [Google Scholar] [CrossRef]
- Mohammadi, A.V.; Rosen, J.; Gogotsi, Y. The World of Two-Dimensional Carbides and Nitrides (MXenes). Science (1979) 2021, 372, eabf1581. [Google Scholar] [CrossRef]
- Satheeshkumar, E.; Makaryan, T.; Melikyan, A.; Minassian, H.; Gogotsi, Y.; Yoshimura, M. One-Step Solution Processing of Ag, Au and Pd@MXene Hybrids for SERS. Sci. Rep. 2016, 6, 32049. [Google Scholar] [CrossRef]
- Peng, Y.; Cai, P.; Yang, L.; Liu, Y.; Zhu, L.; Zhang, Q.; Liu, J.; Huang, Z.; Yang, Y. Theoretical and Experimental Studies of Ti3C2 MXene for Surface-Enhanced Raman Spectroscopy-Based Sensing. ACS Omega 2020, 5, 26486–26496. [Google Scholar] [CrossRef]
- Barveen, N.R.; Wang, T.J.; Chang, Y.H. A Photochemical Approach to Anchor Au NPs on MXene as a Prominent SERS Substrate for Ultrasensitive Detection of Chlorpromazine. Microchim. Acta 2022, 189, 16. [Google Scholar] [CrossRef]
- Liu, R.; Jiang, L.; Yu, Z.; Jing, X.; Liang, X.; Wang, D.; Yang, B.; Lu, C.; Zhou, W.; Jin, S. MXene (Ti3C2Tx)-Ag Nanocomplex as Efficient and Quantitative SERS Biosensor Platform by in-Situ PDDA Electrostatic Self-Assembly Synthesis Strategy. Sens. Actuators B Chem. 2021, 333, 129581. [Google Scholar] [CrossRef]
- Xiong, S.; He, T.; Zhou, T.; Wang, D.; Wang, Y.; Dai, C.; Liu, W. In Situ Synthesis of MXene/Ag Nanocomposites Based Flexible SERS Substrates on PDMS for Detection on Fruit Surfaces. Colloids Surf. A Physicochem. Eng. Asp. 2022, 654, 130077. [Google Scholar] [CrossRef]
- Sarycheva, A.; Makaryan, T.; Maleski, K.; Satheeshkumar, E.; Melikyan, A.; Minassian, H.; Yoshimura, M.; Gogotsi, Y. Two-Dimensional Titanium Carbide (MXene) as Surface-Enhanced Raman Scattering Substrate. J. Phys. Chem. C 2017, 121, 19983–19988. [Google Scholar] [CrossRef]
- Limbu, T.B.; Chitara, B.; Garcia Cervantes, M.Y.; Zhou, Y.; Huang, S.; Tang, Y.; Yan, F. Unravelling the Thickness Dependence and Mechanism of Surface-Enhanced Raman Scattering on Ti3C2TXMXene Nanosheets. J. Phys. Chem. C 2020, 124, 17772–17782. [Google Scholar] [CrossRef]
- Xie, X.J.; Zhu, Y.M.; Li, F.; Zhou, X.W.; Xue, T. Preparation and Characterization of Ti3C2Tx with SERS Properties. Sci. China Technol. Sci. 2019, 62, 1202–1209. [Google Scholar] [CrossRef]
- Ye, Y.; Yi, W.; Liu, W.; Zhou, Y.; Bai, H.; Li, J.; Xi, G. Remarkable Surface-Enhanced Raman Scattering of Highly Crystalline Monolayer Ti3C2 Nanosheets. Sci. China Mater. 2020, 63, 794–805. [Google Scholar] [CrossRef]
- Liu, R.; Jiang, L.; Lu, C.; Yu, Z.; Li, F.; Jing, X.; Xu, R.; Zhou, W.; Jin, S. Large-Scale Two-Dimensional Titanium Carbide MXene as SERS-Active Substrate for Reliable and Sensitive Detection of Organic Pollutants. Spectrochim. Acta A Mol. Biomol. Spectrosc. 2020, 236, 118336. [Google Scholar] [CrossRef] [PubMed]
- Elumalai, S.; Lombardi, J.R.; Yoshimura, M. The Surface-Enhanced Resonance Raman Scattering of Dye Molecules Adsorbed on Two-Dimensional Titanium Carbide Ti3C2Tx (MXene) Film. Mater. Adv. 2020, 1, 146–152. [Google Scholar] [CrossRef]
- Soundiraraju, B.; George, B.K. Two-Dimensional Titanium Nitride (Ti2N) MXene: Synthesis, Characterization, and Potential Application as Surface-Enhanced Raman Scattering Substrate. ACS Nano 2017, 11, 8892–8900. [Google Scholar] [CrossRef]
- Lan, L.; Fan, X.; Yu, S.; Gao, J.; Zhao, C.; Hao, Q.; Qiu, T. Flexible Two-Dimensional Vanadium Carbide MXene-Based Membranes with Ultra-Rapid Molecular Enrichment for Surface-Enhanced Raman Scattering. ACS Appl. Mater. Interfaces 2022, 14, 40427–40436. [Google Scholar] [CrossRef]
- He, Z.; Rong, T.; Li, Y.; Ma, J.; Li, Q.; Wu, F.; Wang, Y.; Wang, F. Two-Dimensional TiVC Solid-Solution MXene as Surface-Enhanced Raman Scattering Substrate. ACS Nano 2022, 16, 4072–4083. [Google Scholar] [CrossRef]
- Peng, Y.; Lin, C.; Long, L.; Masaki, T.; Tang, M.; Yang, L.; Liu, J.; Huang, Z.; Li, Z.; Luo, X.; et al. Charge-Transfer Resonance and Electromagnetic Enhancement Synergistically Enabling MXenes with Excellent SERS Sensitivity for SARS-CoV-2 S Protein Detection. Nanomicro Lett. 2021, 13, 52. [Google Scholar] [CrossRef] [PubMed]
- Peng, Y.; Yang, L.; Li, Y.; Zhang, W.; Xu, M.; Lin, C.; Liu, J.; Huang, Z.; Yang, Y. Design of MXene-Based Multiporous Nanosheet Stacking Structures Integrating Multiple Synergistic SERS Enhancements for Ultrasensitive Detection of Chloramphenicol. JACS Au 2024, 4, 730–743. [Google Scholar] [CrossRef] [PubMed]
- Adomavičiūtė-Grabusovė, S.; Ramanavičius, S.; Popov, A.; Šablinskas, V.; Gogotsi, O.; Ramanavičius, A. Selective Enhancement of SERS Spectral Bands of Salicylic Acid Adsorbate on 2D Ti3C2Tx-Based MXene Film. Chemosensors 2021, 9, 223. [Google Scholar] [CrossRef]
- Yang, K.; Zhu, K.; Wang, Y.; Qian, Z.; Zhang, Y.; Yang, Z.; Wang, Z.; Wu, L.; Zong, S.; Cui, Y. Ti3C2Tx MXene-Loaded 3D Substrate toward On-Chip Multi-Gas Sensing with Surface-Enhanced Raman Spectroscopy (SERS) Barcode Readout. ACS Nano 2021, 15, 12996–13006. [Google Scholar] [CrossRef]
- Wang, J.; He, J.; Kan, D.; Chen, K.; Song, M.; Huo, W. MXene Film Prepared by Vacuum-Assisted Filtration: Properties and Applications. Crystals 2022, 12, 1034. [Google Scholar] [CrossRef]
- Richter, Ł.; Albrycht, P.; Księżopolska-Gocalska, M.; Poboży, E.; Bachliński, R.; Sashuk, V.; Paczesny, J.; Hołyst, R. Fast and Efficient Deposition of Broad Range of Analytes on Substrates for Surface Enhanced Raman Spectroscopy. Biosens. Bioelectron. 2020, 156, 112124. [Google Scholar] [CrossRef]
- Mičušík, M.; Šlouf, M.; Stepura, A.; Soyka, Y.; Ovodok, E.; Procházka, M.; Omastová, M. Aging of 2D MXene Nanoparticles in Air: An XPS and TEM Study. Appl. Surf. Sci. 2023, 610, 155351. [Google Scholar] [CrossRef]
- Sarycheva, A.; Gogotsi, Y. Raman Spectroscopy Analysis of the Structure and Surface Chemistry of Ti3C2T XMXene. Chem. Mater. 2020, 32, 3480–3488. [Google Scholar] [CrossRef]
- Yang, Y.Y.; Zhou, W.T.; Song, W.L.; Zhu, Q.Q.; Xiong, H.J.; Zhang, Y.; Cheng, S.; Luo, P.F.; Lu, Y.W. Terminal Groups-Dependent Near-Field Enhancement Effect of Ti3C2Tx Nanosheets. Nanoscale Res. Lett. 2021, 16, 60. [Google Scholar] [CrossRef]
- Lioi, D.B.; Neher, G.; Heckler, J.E.; Back, T.; Mehmood, F.; Nepal, D.; Pachter, R.; Vaia, R.; Kennedy, W.J. Electron-Withdrawing Effect of Native Terminal Groups on the Lattice Structure of Ti3C2Tx MXenes Studied by Resonance Raman Scattering: Implications for Embedding MXenes in Electronic Composites. ACS Appl. Nano Mater. 2019, 2, 6087–6091. [Google Scholar] [CrossRef]
- Lin, S.; Hasi, W.L.J.; Lin, X.; Han, S.Q.G.W.; Lou, X.T.; Yang, F.; Lin, D.Y.; Lu, Z.W. Rapid and Sensitive SERS Method for Determination of Rhodamine B in Chili Powder with Paper-Based Substrates. Anal. Methods 2015, 7, 5289–5294. [Google Scholar] [CrossRef]
- Hantanasirisakul, K.; Gogotsi, Y. Electronic and Optical Properties of 2D Transition Metal Carbides and Nitrides (MXenes). Adv. Mater. 2018, 30, 1804779. [Google Scholar] [CrossRef] [PubMed]
- Aydin, E.; El-Demellawi, J.K.; Yarali, E.; Aljamaan, F.; Sansoni, S.; Ur Rehman, A.; Harrison, G.; Kang, J.; El Labban, A.; De Bastiani, M.; et al. Scaled Deposition of Ti3C2Tx MXene on Complex Surfaces: Application Assessment as Rear Electrodes for Silicon Heterojunction Solar Cells. ACS Nano 2022, 16, 2419–2428. [Google Scholar] [CrossRef]
- Misyura, S.Y. Evaporation of a Sessile Water Drop and a Drop of Aqueous Salt Solution. Sci. Rep. 2017, 7, 14759. [Google Scholar] [CrossRef]


Disclaimer/Publisher’s Note: The statements, opinions and data contained in all publications are solely those of the individual author(s) and contributor(s) and not of MDPI and/or the editor(s). MDPI and/or the editor(s) disclaim responsibility for any injury to people or property resulting from any ideas, methods, instructions or products referred to in the content. |
© 2024 by the authors. Licensee MDPI, Basel, Switzerland. This article is an open access article distributed under the terms and conditions of the Creative Commons Attribution (CC BY) license (https://creativecommons.org/licenses/by/4.0/).
Share and Cite
Salehtash, F.; Annušová, A.; Stepura, A.; Soyka, Y.; Halahovets, Y.; Hofbauerová, M.; Mičušík, M.; Kotlár, M.; Nádaždy, P.; Albrycht, P.; et al. SERS Performance of Ti3C2Tx MXene-Based Substrates Correlates with Surface Morphology. Materials 2024, 17, 1385. https://doi.org/10.3390/ma17061385
Salehtash F, Annušová A, Stepura A, Soyka Y, Halahovets Y, Hofbauerová M, Mičušík M, Kotlár M, Nádaždy P, Albrycht P, et al. SERS Performance of Ti3C2Tx MXene-Based Substrates Correlates with Surface Morphology. Materials. 2024; 17(6):1385. https://doi.org/10.3390/ma17061385
Chicago/Turabian StyleSalehtash, Farnoush, Adriana Annušová, Anastasiia Stepura, Yaryna Soyka, Yuriy Halahovets, Monika Hofbauerová, Matej Mičušík, Mário Kotlár, Peter Nádaždy, Paweł Albrycht, and et al. 2024. "SERS Performance of Ti3C2Tx MXene-Based Substrates Correlates with Surface Morphology" Materials 17, no. 6: 1385. https://doi.org/10.3390/ma17061385