Article

Sustainable Mining: Reuse of Clay from Abandoned Areas in the South of Brazil for Ceramic Production Based on a Simplex Design

by
Emily Saviatto
1,
Alexandre Zaccaron
1,
Vitor de Souza Nandi
1,
Juliana Acordi
1,
Sabrina Arcaro
1,
Fabiano Raupp-Pereira
1,
Sergio Luciano Galatto
2 and
Manuel Joaquim Ribeiro
3,*
1
Post-Graduate Program on Materials Science and Engineering (PPGCEM), Universidade do Extremo Sul Catarinense, Avenida Universitária 1105, Universitário, Criciúma 88806-000, SC, Brazil
2
Institute of Environmental and Technological Research-IPAT, Universidade do Extremo Sul Catarinense, Rod. Gov. Jorge Lacerda 3800, Sangão, Criciúma 88807-600, SC, Brazil
3
Materials Research and Development Center (UIDM), Polytechnic Institute of Viana do Castelo, Rua Escola Industrial e Comercial de Nun’Álvares, 4900-347 Viana do Castelo, Portugal
*
Author to whom correspondence should be addressed.
Materials 2023, 16(19), 6466; https://doi.org/10.3390/ma16196466
Submission received: 4 September 2023 / Revised: 24 September 2023 / Accepted: 26 September 2023 / Published: 28 September 2023

Abstract

:
The environmental impact of clay mining can be minimized using extractive mineral circularity practices. Combining the available knowledge of the characteristics of different clays with statistical tools was a decisive step for the improved use of mining resources. Through blends, all the mined materials can be incorporated to produce quality ceramic products. This study identified two types of clay from abandoned mining areas in the southern state of Santa Catarina, Brazil. These raw materials were valued together with plastic clay, which is widely used in the region, to develop 10 different formulations using a mixture design method. The clays were characterized using average granulometric distribution, mineralogical composition, and chemical, thermal and plasticity analyses. The specimens were shaped by extrusion, dried in an oven, fired in a muffle furnace and characterized based on their shrinkage, water absorption and compressive strength values. Two clays with varying characteristics—one with low workability and the other with a high silica content—exhibited difficulties (generating defects) in the extrusion shaping process, which compromised the final quality of the ceramic paste. Results showed that incorporating up to 45% by mass of the low-workability clay resulted in an increase in water absorption. The more siliceous clay improved dimensional control; however, its use at high contents (~80%) decreased the mechanical resistance. Nevertheless, when used in controlled amounts, these clays can be beneficial to the production of blocks and bricks because they have the potential to improve some properties of the finished ceramic products.

1. Introduction

Clays are among the most abundant materials on the Earth’s surface [1,2]; thus, they are the most commonly used raw materials for construction ceramics, such as bricks and roof tiles [3,4,5,6]. Despite the introduction of newly developed materials in the construction industry, traditional clay ceramics are still widely used [7] and are considered the foundation of this sector [8]. Brazil is among the largest producers and consumers of clay ceramics [9]. Following a decline of 6.3% in 2020, the gross domestic product (GDP) of the construction sector grew by 9.7% in 2021 [10].
According to data from the National Ceramic Industry Association (Associação Nacional da Industria Cerâmica-ANICER) [11], Brazil has 6903 factories throughout its national territory, with most of them located in the southern and southeastern regions. The sector has an annual revenue of BRL 18 billion, representing 4.8% of the civil construction industry in the country and generating approximately 293,000 direct and 900,000 indirect jobs. The relevance of the ceramics industry at the national level is also highlighted by the fact that approximately 90% of the masonry and roofing in the country is based on clay ceramics. Furthermore, an average of 5.3 billion blocks and roof tiles are produced monthly according to the National Ceramic Industry Association [11], resulting in a monthly consumption of approximately 10.3 million tons of clay.
The Brazilian mining-ceramics sector is predominantly composed of small-scale and family-owned companies [12], often lacking the technical knowledge related to raw materials. Therefore, these ceramists only exploit the mineral portions based on an empirical evaluation of their texture [13]. This has led to the abandonment of less valuable mineral pockets, that is, clay materials with properties that are unattractive to the ceramic sector. This exploration method, which is known as ambitious mining, is an environmental concern that has been addressed in Article 48 of the Mining Code-Decree No. 227/67. This article assigns responsibility to the Federal Government for managing mineral resources, the mineral production industry, and the distribution, trade and consumption of mineral products with a specific focus on ambitious mining. Therefore, this article addresses mining conducted with a pre-established plan of noncompliance and those performed in a way that hinders the subsequent economic exploitation of the deposit [14].
Ambitious mining can result in the disposal of large volumes of clay material, leading to the abandonment of the mined area and stagnation in the environmental recovery. Thus, new areas must be explored to supply the ceramics sector. To postpone the need to obtain new mineral sources, the utilization of different raw materials must be optimized to extend the life of the deposit.
The southern region of Santa Catarina, Brazil, is a major center for clay ceramics, accounting for 2.5% of the national production [15]; however, the abandonment of areas after clay mining is a concern in the region [16]. According to the Cooperative of Mineral Exploration in the Urussanga River Basin (Cooperativa de Exploração Mineral da Bacia do Rio Urussanga-COOPEMI), a licensed area of approximately 120 ha is currently underutilized because of two factors: (i) their intrinsic characteristics, such as low workability and high silica concentration, and (ii) a lack of knowledge about the properties of these raw materials, which requires a significant investment for research. Therefore, efforts are being made in the Local Productive Arrangement (LPA) of the Mineral Base in Morro da Fumaça to valorize these natural resources as alternative primary mineral sources for ceramic formulations, with the aim of integrating the sector into the practices of circularity and sustainable mineral resource exploitation.
In this study, abandoned areas in the region were identified and the characteristics of the underutilized raw materials from each of these areas were determined using a statistical mixture design method. Subsequently, clay-ceramic compositions were developed based on this previous work. And finally, statistical analysis proved to be an allied tool in the development of mixtures to solve problems of poor disposal of natural resources.

2. Materials and Methods

2.1. Geological Configurations of the Study Region

The clay ceramic production center of Morro da Fumaça is located in the southeastern region of the state of Santa Catarina; the lithological description of the production area is shown in Figure 1. In this region, sedimentary and volcanic rock outcrops form the sequence of the eastern edge of the Paraná Basin along with unconsolidated sediments from the coastal plain and current alluvial deposits. The regional crystalline basement is composed of late-post-tectonic granitoid rocks [17].
In this region, there is a geological alteration trend from the Serra Geral Mountain range to the coastal region. The Serra do Rio do Rastro can be found in the interior, where the White Column [18] is located, along with formations of the Paraná Basin—an intracratonic basin filled with sedimentary and volcanic rocks that developed between the Ordovician and Cretaceous periods. The coastal region exhibits a diversity of sand, silt and clay deposits related to both marine and continental processes, with geological representations from the Quaternary period. In the Criciúma Sheet, the outcropping sequences have ages ranging from Permian to Cretaceous [19].

2.2. Sample Preparation and Characterization Techniques

Three clays were used in this study: two from abandoned areas (referred to as A1 and A2), while the other (A3) was collected from a commonly used clay in the ceramic manufacturing process. Representative samples (~90 kg) of each clay were collected from different locations (Figure 1) for characterization tests.
Chemical characterization was performed using X-ray fluorescence spectrometry (Axios Max Panalytical, Malvern, UK) with wavelength dispersion (WDXRF). The loss on ignition (LoI) of the samples was performed after thermal treatment at 1000 °C, and with 3 h of dwell-time. For the characterization of the crystalline phases present in the clay samples, an X-ray diffractometer (XRD-D8 Advance Bruker, Billerica, MA, USA) was used. Data collection was conducted in the 2-theta range of 4°–72° at 40 kV and 40 mA using CuKα radiation at a wavelength of 1.5406 Å. Crystalline phases were quantified using the Rietveld method [20].
Thermal characterization was performed using differential scanning calorimetry (DSC) and thermogravimetric analysis (TGA) with a simultaneous analyzer (TA Instruments, model SDT Q600, New Castle, DE, USA). Samples were heated from room temperature to 1100 °C at a rate of 10 °C/min.
Particle size distribution was determined by laser diffractometry using the CILAS 1064 instrument between the range of 0.04 µm and 500 µm for 60 s and using sodium polyacrylate as the dispersant (Disperlan LP/G, Lamberti Brazil, Nova Odessa, Brazil). A small sample of each formulation was collected to obtain coarse particles, which are the portion of the material that cannot be disaggregated without the aid of a tool or comminution method [21]. The test involved analyzing the percentage of the materials retained on a 325 ASTM mesh sieve (45 µm) using Equation (1).
C p = w r w 0 × 100
where C p = coarser particles (%), w r   = retained weight (g) and w 0 = initial gross weight (g).
Tests were performed on each clay to measure the Atterberg plasticity index [22] through the liquid limit ( L L ) and plastic limit ( P L ) based on ISO 17892-12:2018 [23]. The samples were prepared for both tests, which consisted of dehydrating the material and passing it through a 4.8 mm sieve. The test was performed using the Casagrande method. Based on the obtained limits, the plasticity index ( P I ) was determined using Equation (2).
P I = L L P L
where P I = plasticity index, L L = liquid limit and P L = plastic limit.

2.3. Composition Development

The compositions were determined using the experimental design (simplex centroid), which involved defining formulations with different proportions of clays/studied materials (Figure 2). In this study, ten formulations were defined (Table 1)—three pure clays (A1, A2, and A3), two-way interactions (sides) and three-way interactions (centroids). The mixture design was based on an effective mathematical model to predict the properties of each original component, as well as their specific proportions.
The formulations were prepared on a wet basis, and for this purpose, a portion of each raw material was dried in an oven (DeLeo oven No. 2211) at 60 ± 10 °C for 24 h to determine the natural moisture content (Equation (3)).
W = ( w w w d ) w w × 100
where W = water content (%), w w = wet weight (g) and w d = dry weight (g).
The water used in the study was the natural water of the raw materials. To carry out the mixtures, the water was disregarded but not removed. Approximately 10 kg (dry mass) was used for each formulation.
Subsequently, the compositions were weighed and dosed in their natural state using a scale (Marte balance, AC 10 K, precision of 0.1 g), then mixed in a laboratory-scale laminator (BERTAN equipment) and homogenized for 24 h in a sealed container.
The samples forming were determined using the vacuum extrusion method (NATREB, model NTB 140) at a vacuum pressure of 760 mmHg and a helix speed of 20 rpm. Thirty test specimens with dimensions of 36.5 × 51 × 70 mm3 were prepared for each formulation.
Finally, these specimens underwent thermal treatment—drying (DeLeo oven No. 2211) at 50 ± 5 °C for 24 h then at 100 ± 5 °C for an additional 24 h—to eliminate the forming moisture. All pieces were measured with a manual caliper (UNIVERSAL, precision of 0.02 mm) to determine the drying shrinkage according to Equation (4).
S h d = ( L 0 L f ) L 0 × 100
where S h d = drying shrinkage (%), L 0 = initial length of the green pieces (mm) and L f = final length after drying the pieces (mm).
Firing was performed in a muffle furnace (Jung, model J200) at a heating rate of 1.7 °C/min to up to a temperature of 900 °C and with a firing dwell-time of 120 min; firing was performed in triplicate. Firing followed the traditional/representative cycle used in the ceramic industries in the Mineral LPA in the Morro da Fumaça region. All fired pieces were manually measured with calipers (UNIVERSAL, precision of 0.02 mm) to obtain their firing shrinkage according to Equation (5).
S h f = ( L 0 L f ) L 0 × 100
where S h f = firing shrinkage (%), L 0 = the initial length after drying the pieces (mm) and L f = the final length after firing (mm).
After firing, a visual analysis of the pieces was conducted to identify systematic defects, such as cracks, irregular surfaces or deformations that could disqualify the product/piece.
The fired pieces were weighed (Marte AC 10 K, precision of 0.1 g) and submerged in water to determine their water absorption ( W A ) content. The test was conducted based on Equation (6).
W A = ( w w w d ) w d × 100
where W A = water absorption (%), w w = weight before oven-drying (g) and w d = weight after oven-drying (g).
The mechanical compressive strength test was performed on 15 fired test specimens, 5 from each firing cycle. The tests were performed using a universal testing machine (EMIC DL 10000) with a force application rate of 100 N/s.
To validate the findings, the technological tests were evaluated using the analysis of variance (ANOVA) statistical technique; response surfaces were plotted to aid in their interpretation. The confidence level (probability) was set to 95%. For the analysis, the highest F-value (indicating higher significance) and lowest p-value (indicating higher reliability) were considered (p = 100 × (1 − p-value)). A model was selected based on its output and the adjusted coefficient of determination (R2). Statistical analysis was performed using the Statistica 10.0 software (Tulsa, OK, USA, StatSoft©).
After statistical analysis, the boundaries with the best results were identified to validate the study. The areas on the response surface that exhibited water absorption outside the limits established by the standard (between 8% and 25%) and mechanical strength < 1.5 MPa were disregarded. ANOVA plays a pivotal role in the fine-tuning of clay ceramic formulations by pinpointing the key factors influencing their properties. This statistical analysis allows you to improve product quality and performance.

3. Results and Discussion

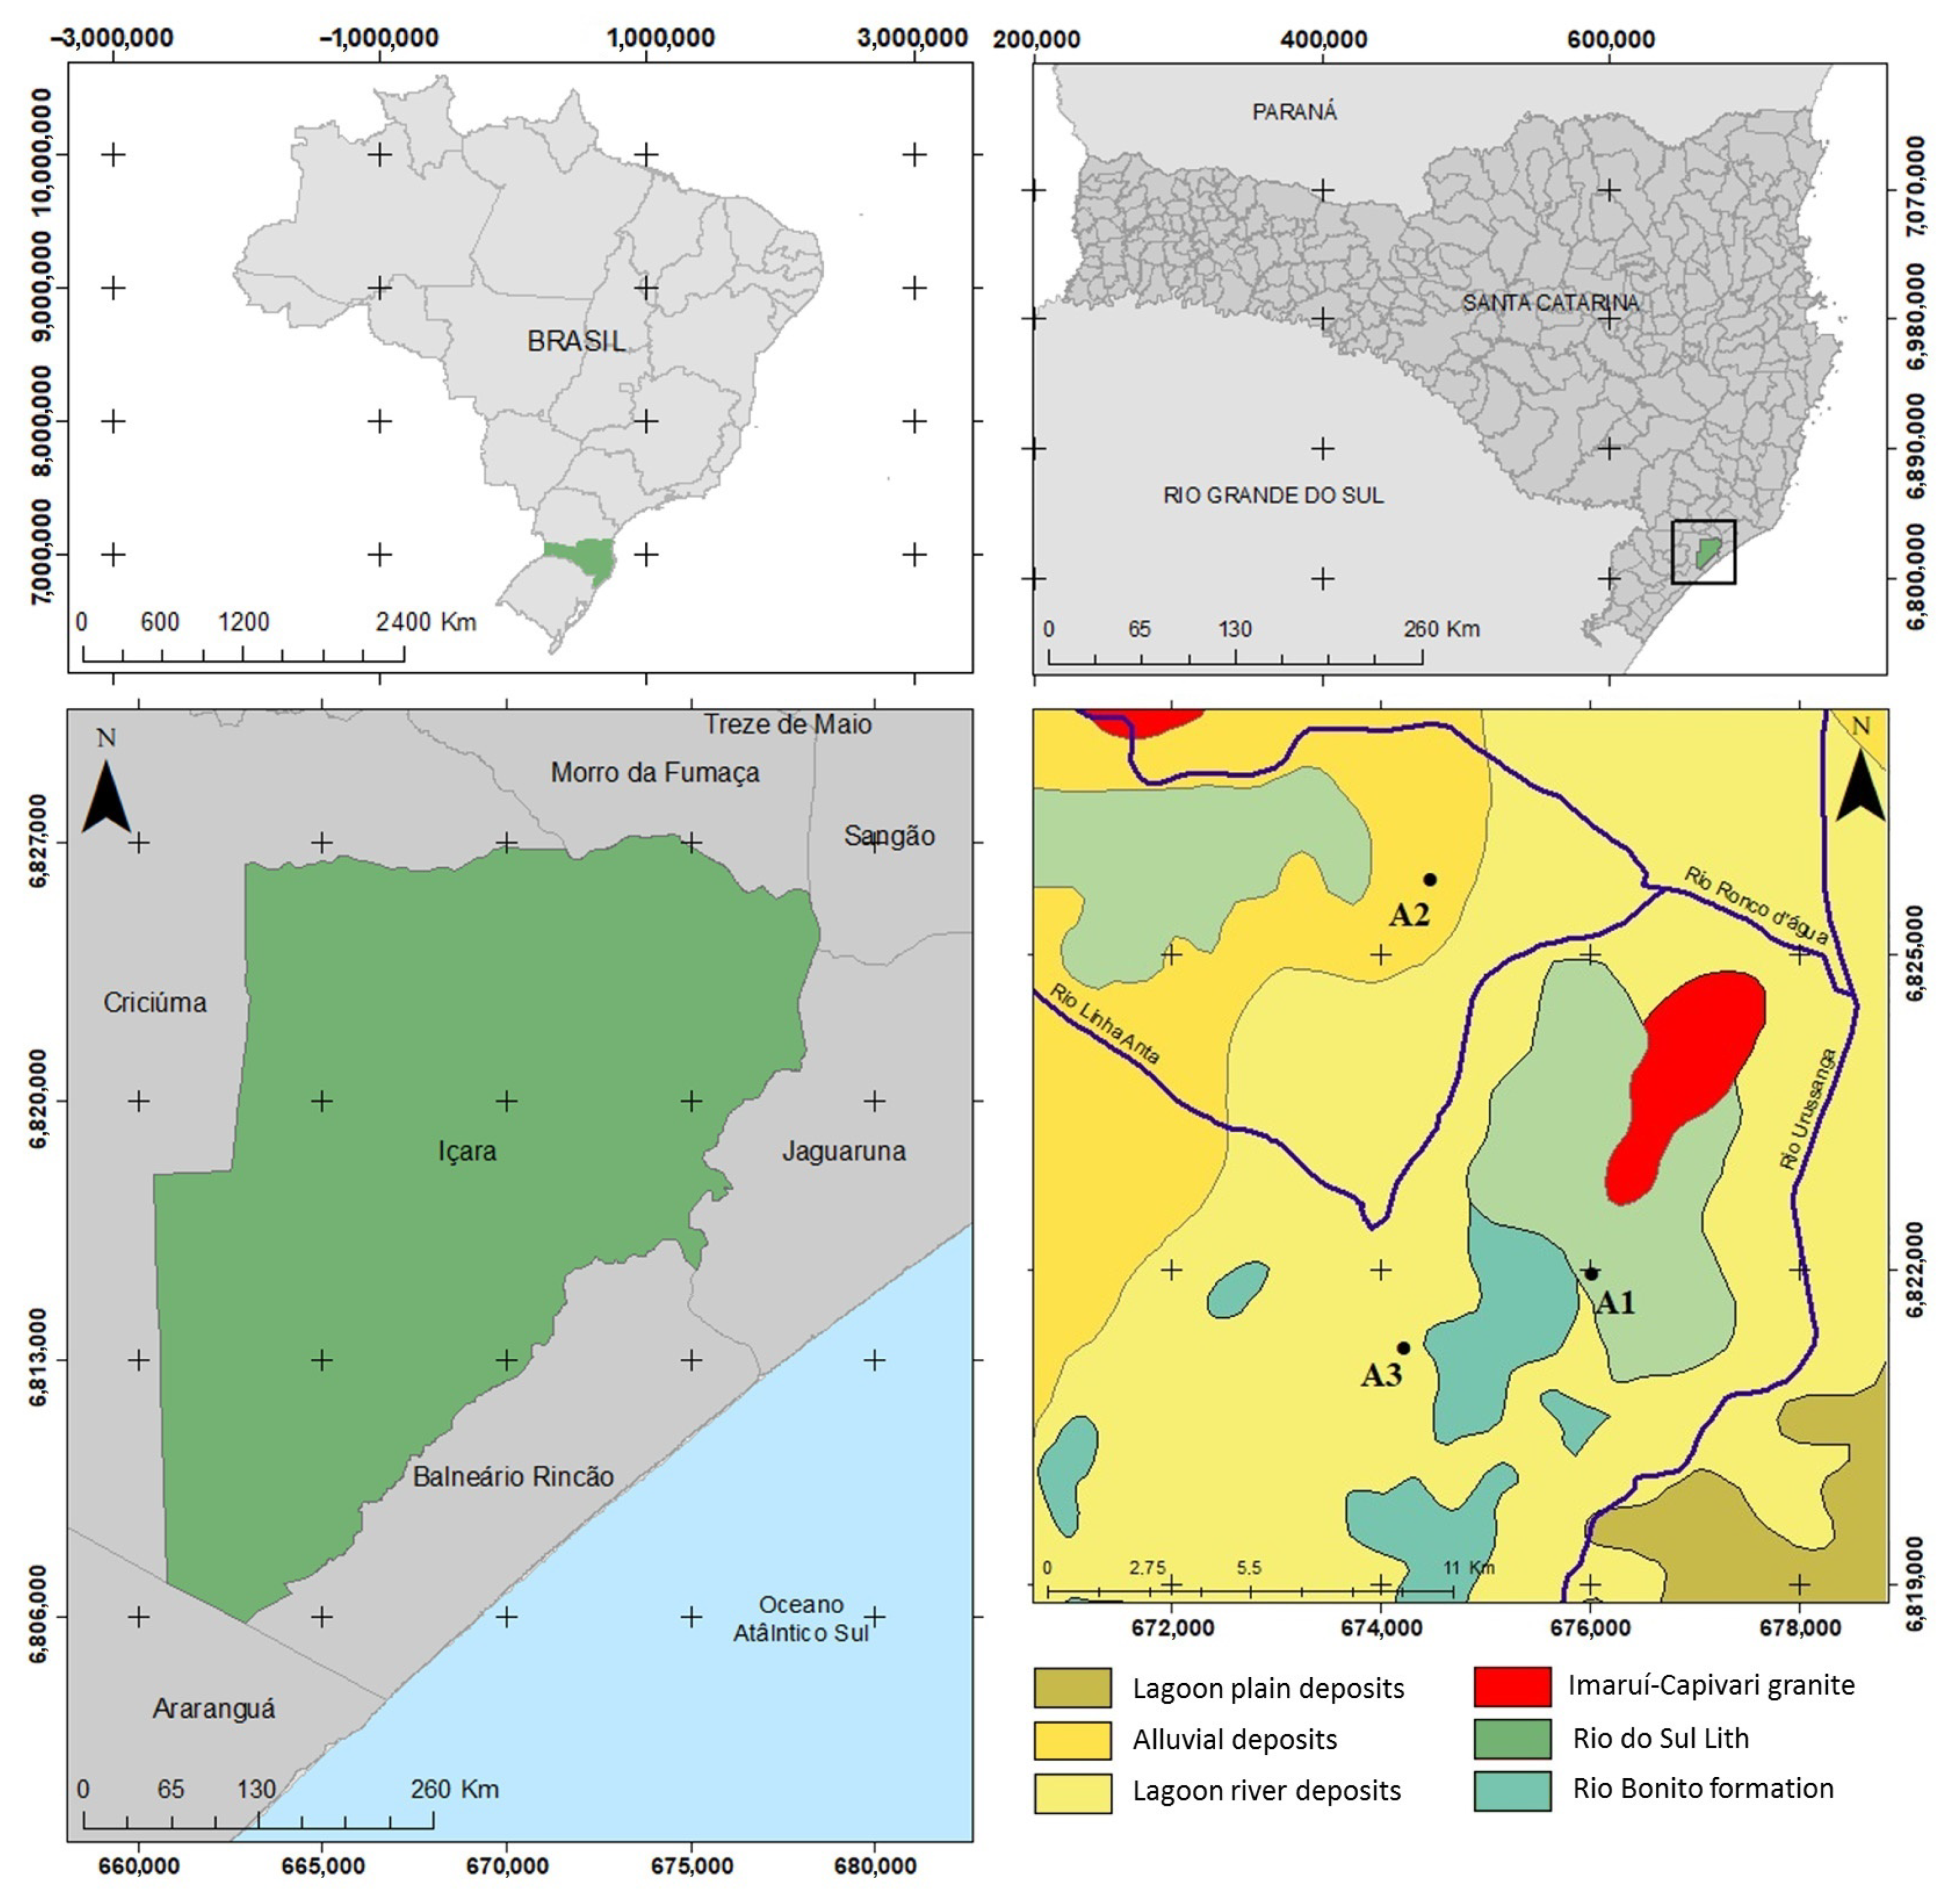
3.1. Raw Materials Characterization

The chemical characterization of the studied clays (Table 2) showed that they were primarily composed of silica (SiO2) followed by alumina (Al2O3). The silica content of A2 (85.33%) was higher than that of the other clays. This may be associated with the high content of free silica, which is unusual in clay ceramic manufacturing. The alumina content of 7.98% may also be related to the high content of free silica, which proportionally reduces the content of other oxides and may be an indication of the presence of clay minerals. Clays with a SiO2 percentage > 80% have previously been studied by Zaccaron et al. [15]. Clays A1 and A3 had SiO2 contents of 57.57% and 69.08%, respectively, and Al2O3 contents of 22.51% and 18.20%, respectively; therefore, they were within the range of clays used in the production of ceramic materials [7,24,25,26,27].
The mass percent of alkaline and alkaline-earth oxides (CaO, MgO, K2O, and Na2O)—compounds that facilitate the sintering of ceramic materials by acting as fluxing agents [2]—in all clays was less than 1%.
Chromophore oxides (Fe2O3 and TiO2), which give the clay pieces reddish (F) and blue (Ti) colors after firing and are commonly used in the production of bricks and roof tiles [28,29,30,31], were also found in the clay samples. The mass percent of Fe2O3 in the A1 sample was 8.95%, representing ~10% of the chromophore oxides. In contrast, the mass percent of Fe2O3 in A2 and A3 was 2.56% and 4.45%, respectively.
The loss on ignition (LoI) is associated with the amount of chemically combined water in inorganic materials and sometimes with the presence of organic matter [32,33]. The LoI in the A2 sample (3.67%) was lower than that of the other samples, possibly owing to its high content of free silica. For clays A1 and A3, the LoI content was 9.09% and 7.20%, respectively; these values may be associated with the dehydroxylation of clay minerals and the reduction in organic matter [34,35].
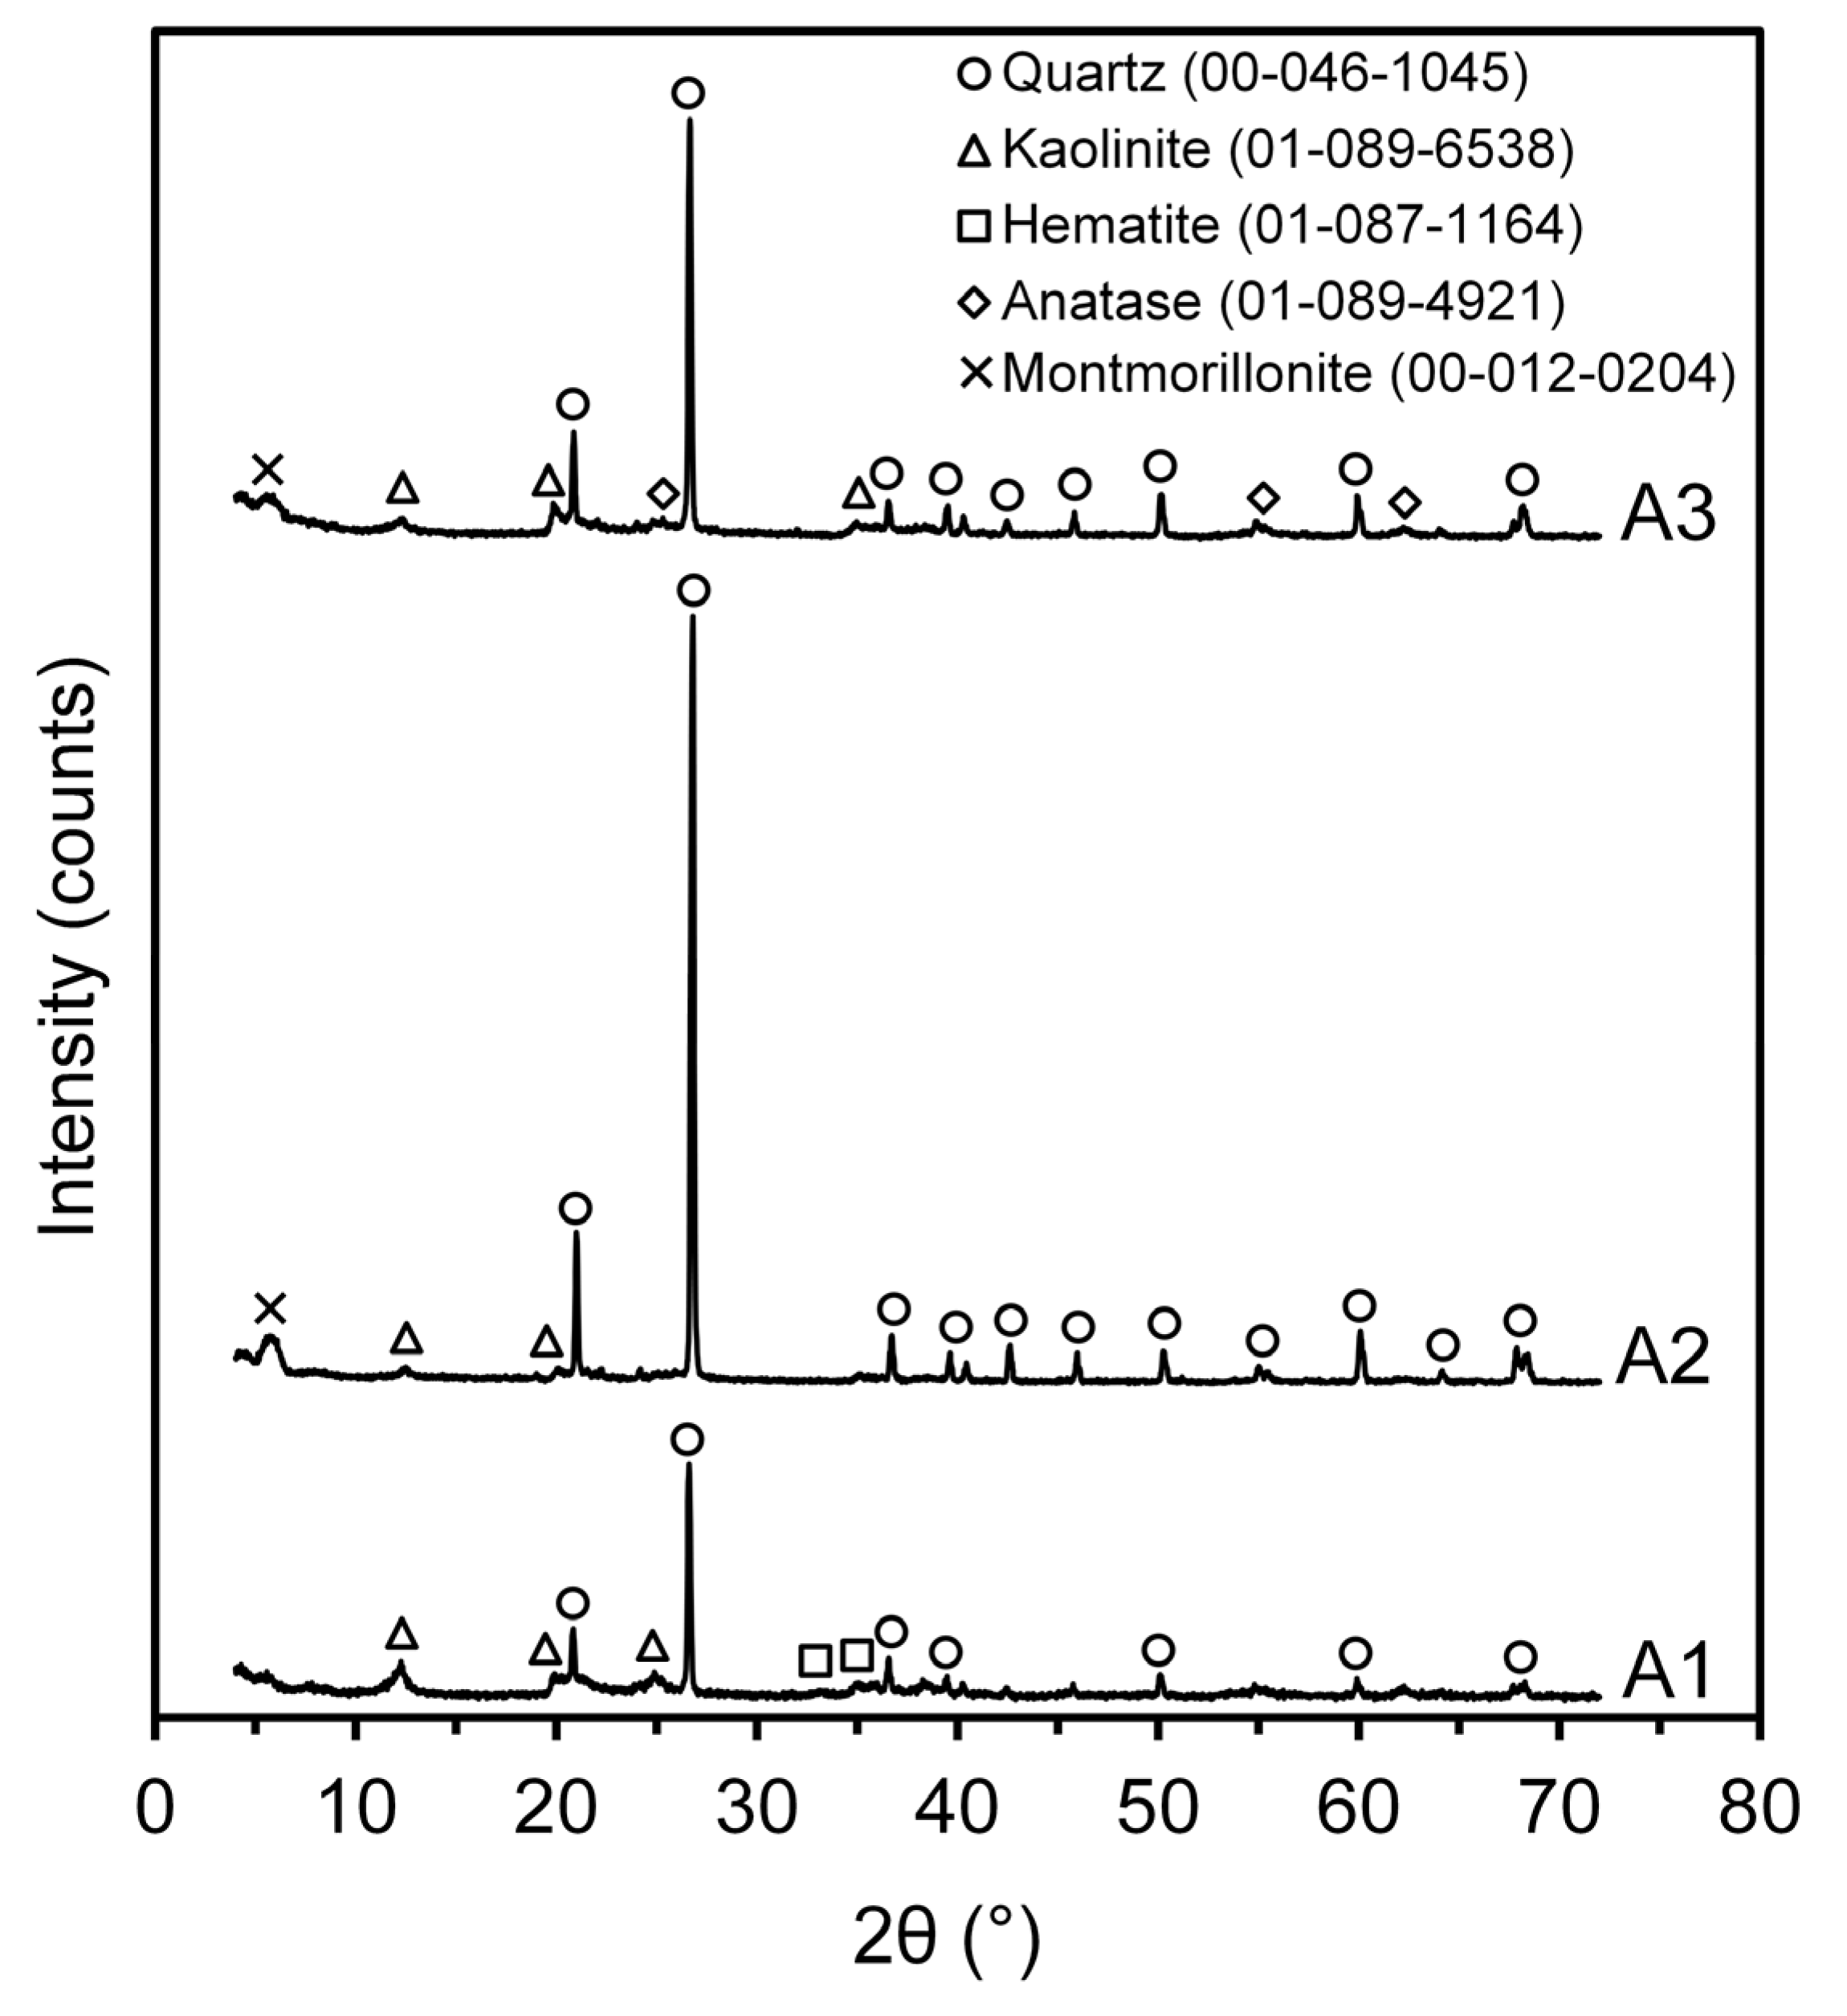
The mineralogical compositions of the clays were determined using X-ray diffraction (XRD), as shown in Figure 3. The major crystalline phases found in the clays [36,37] were quartz (SiO2, JCPDS 00-046-1045) and the clay minerals, kaolinite (Al2(Si2O5)(OH)4, JCPDS 01-089-6538) and montmorillonite ((Na,Ca)0,3(Al,Mg)2Si4O10(OH)2.nH2O, JCPDS 00-012-0204). Minor minerals, such as hematite (α-Fe2O3-JCPDS 01-087-1164) and anatase (TiO2, JCPDS 01-089-4921), were also observed.
Quartz plays an important role in the ceramic process by acting as a deplasticizer in the extrusion process, assisting in the dimensional control of the piece, and ensuring the formation of capillaries in the shaped ceramic body, thereby facilitating drying [38,39]. Therefore, the controlled introduction of A2 into the paste can incorporate significant multifunctionalities in the manufacturing of ceramic blocks.
The characterization of kaolinitic clays with a high content of hematite (3.43% Fe2O3) is intrinsically correlated with the manifestation of a distinctive red color in the natural clay and after the firing process commonly used in the manufacturing of ceramics [40,41]. The presence of Fe3+ can contribute to the formation of low-melting eutectics and reduce refractoriness; additionally, anatase, which is usually associated with the TiO2 content, may also contribute to variations in color tone [41]. This oxide (TiO2) is known as a glass modifier and can act at high temperatures to form a glass phase, which has the potential to increase the strength of the samples [42]. The weight percentages of minerals based on quantitative analysis using Rietveld refinement are listed in Table 3; the quartz content of A2 (84.32%) was higher than that of the other clays, not being a content commonly used in the manufacture of clay ceramics.
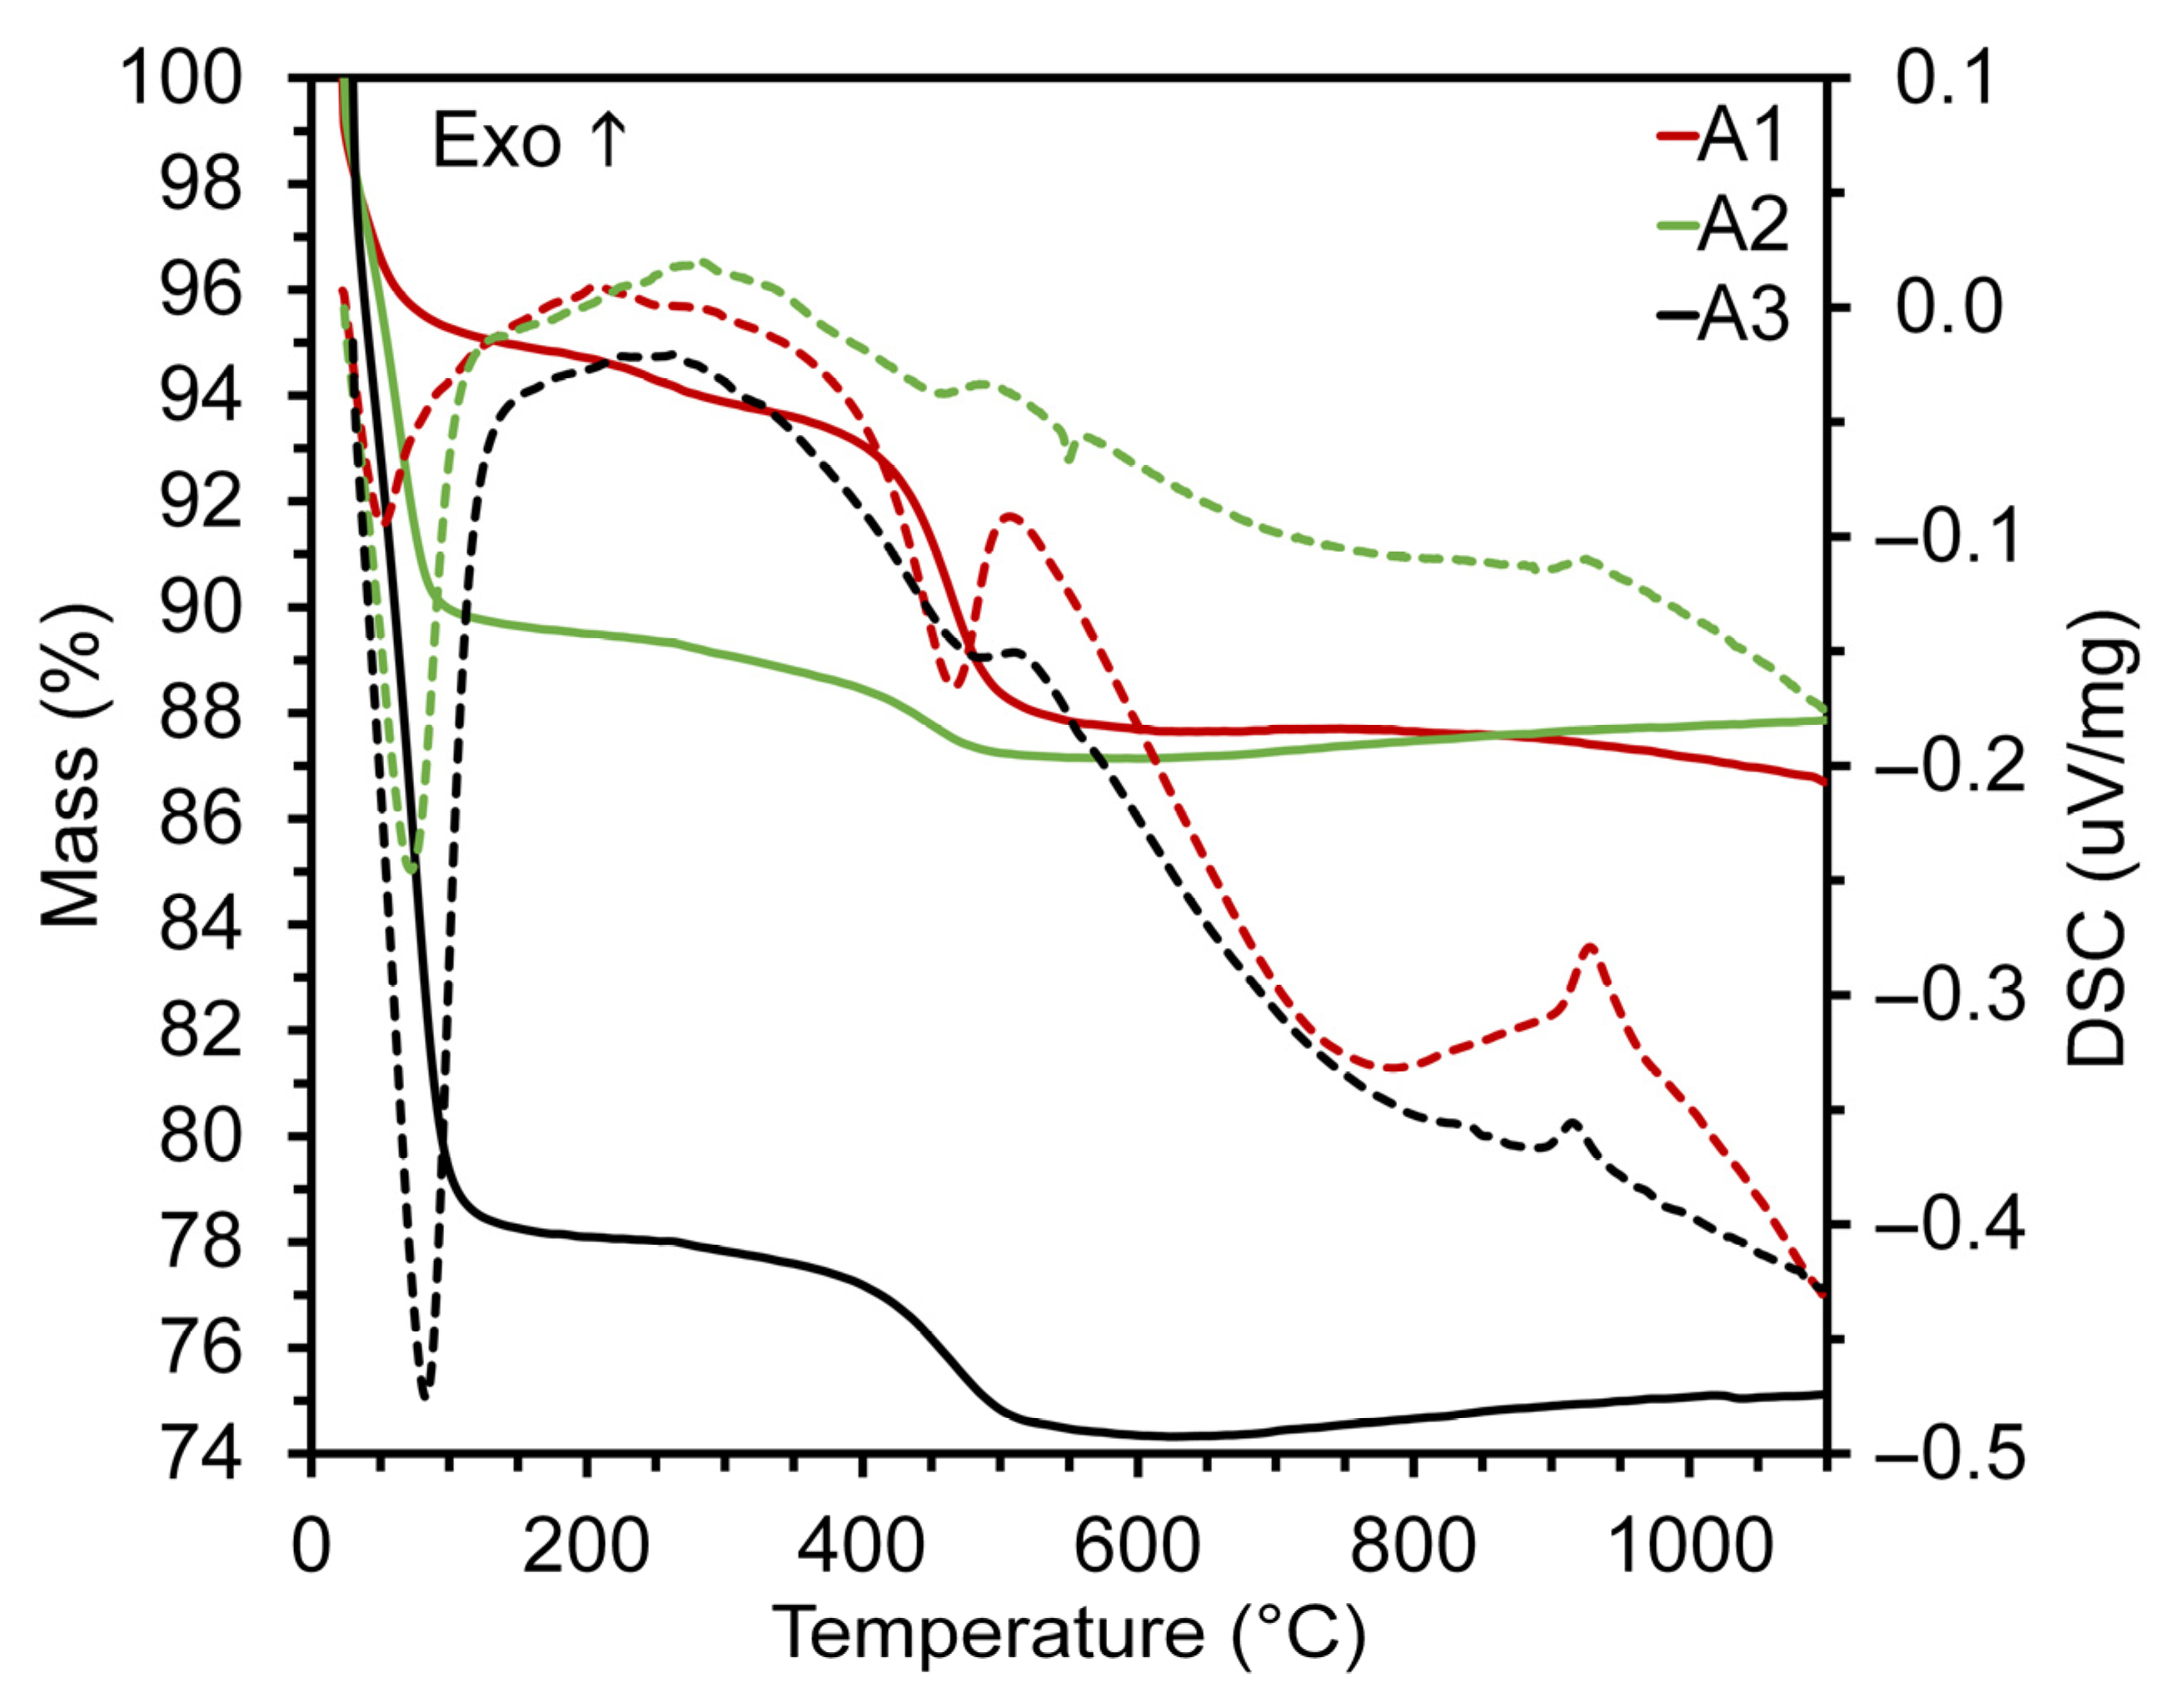
The thermal behavior of the raw materials (Figure 4) showed that the initial mass loss, which occurred from room temperature (23 °C) to 200 °C, was attributed to the elimination of adsorbed water from kaolinite [43]; and in natural humidity, this accounted for a 5.3%, 10.5% and 21.9% reduction in the mass of A1, A2 and A3, respectively. Between 200 and 350 °C, there was a mass loss of <1% for all samples accompanied by a marginal exothermic inflection in the DSC curve, which was possibly related to the oxidation of organic matter.
The endothermic inflection observed in the DSC curves, Figure 4, at the temperature range of 350–650 °C was mainly due to the dehydroxylation (release of OH structural groups) of the clay minerals [44,45]. This corresponded to a mass loss of 5.94%, 1.6% and 3.12% for A1, A2 and A3, respectively (TGA curves). At 550 °C, a small endothermic peak without an associated mass loss was observed in A2, possibly related to the allotropic transformation of quartz (α-quartz to β-quartz) [46,47]. In clay ceramic manufacturing, this inversion can lead to cracks if cooling occurs abruptly [30]. Finally, the exothermic peak at 920 °C in the DSC curve corresponds to the formation of mullite [48,49,50,51].
Particle size is a fundamental aspect in the study of clays because the shape and type of mineral composition can influence the physical characteristics of the raw material. In some cases, this can affect the mechanical strength, permeability and density of the material. Finer particles can improve packing, increasing the density of the piece and its mechanical strength; however, they can also hinder drying by impeding the transfer of moisture from the interior to the surface of the piece, where the evaporation process takes place. Therefore, particle size distribution is a crucial characteristic for the processing of plastic formation and for achieving the desired properties in clay ceramic products [52].
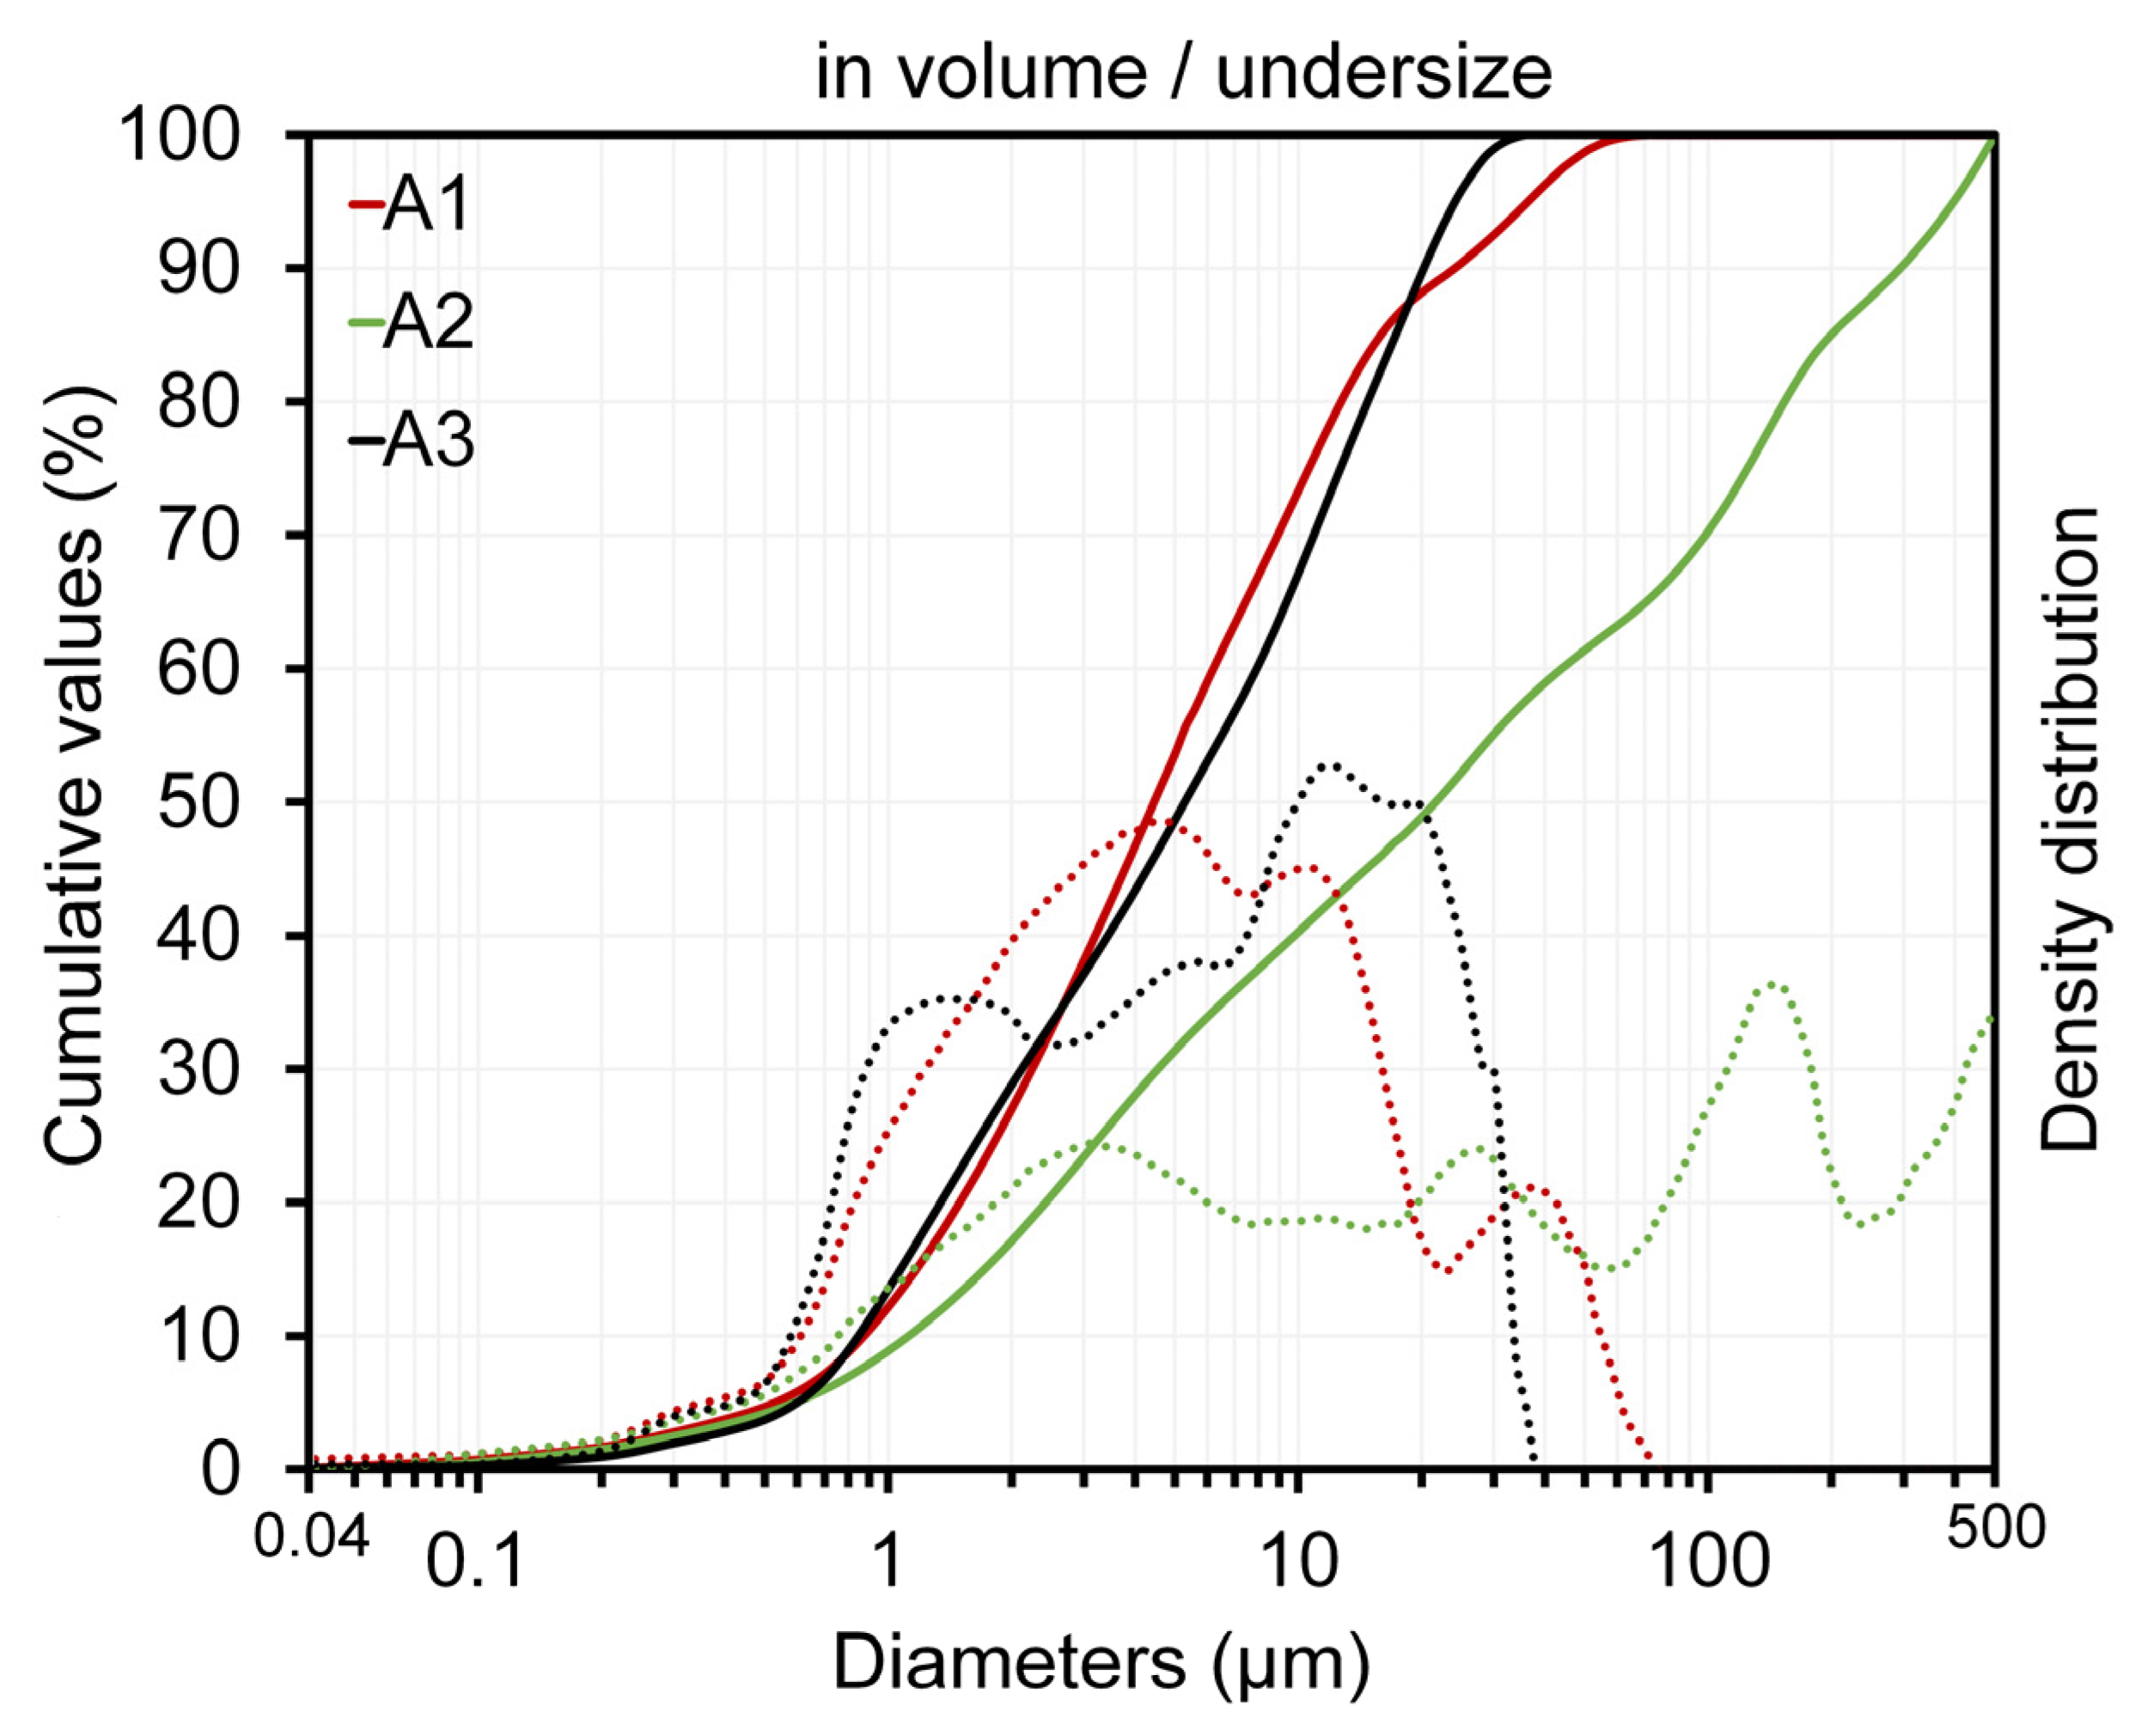
The samples exhibited a multimodal particle size distribution (Figure 5). This behavior may be associated with the different morphologies and densities of the constituent particles in the clays [53,54]. The granulometric distributions of the raw materials in the fractions accumulated at 10, 50 and 90%, as well as their mean particle sizes (Daverage), are listed in Table 4.
The Daverage of the A1 and A3 clays (8 µm) exhibited distributions with finer characteristics. However, the Daverage of the A2 clay was >85 μm, in which some particles were >200 μm in size.
The coarse particle content retained in a particular mesh/sieve during manufacturing may be associated with the product quality, dimensional variation, mechanical strength, water absorption, extrusion rate, drying and firing properties [55].
The coarse particle content (Table 4) showed that among the clays, clay A3 (F3 composition) had the lowest free silica percentage, while that of clay A2 (F2) was the highest; clay A1 (F1) had an intermediate content (18%). Low percentages of coarse particles may be associated with a higher number of fine particles, which tends to increase the packing factor and densification of the shaped body after the drying process. In contrast, higher coarse particle percentages create a structure that contributes to dimensional stability; however, excessive amounts can adversely affect other properties, such as plasticity for the shaping process and the mechanical strength after firing [56].
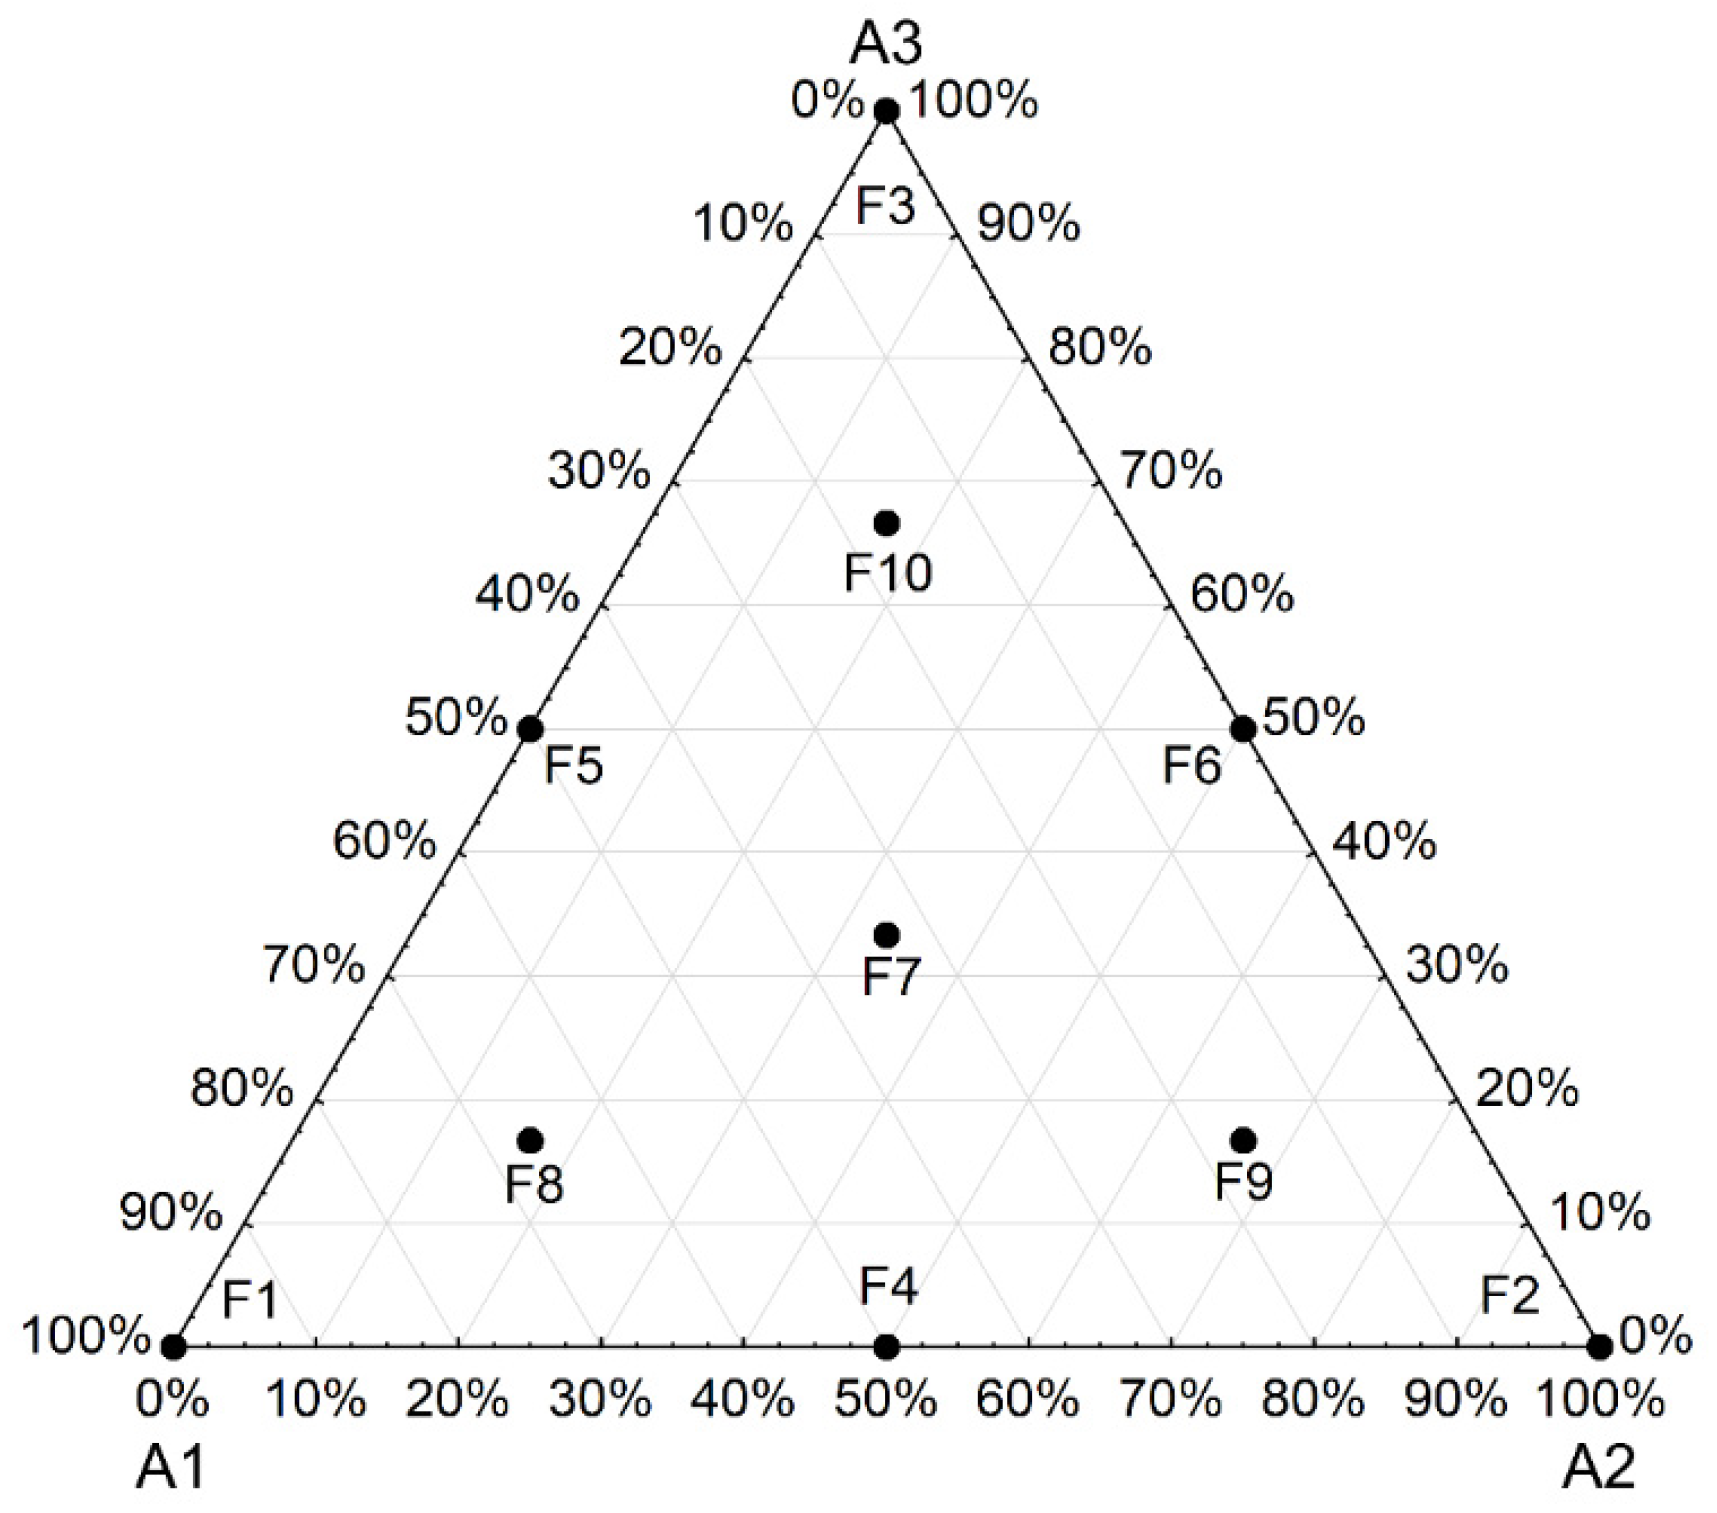
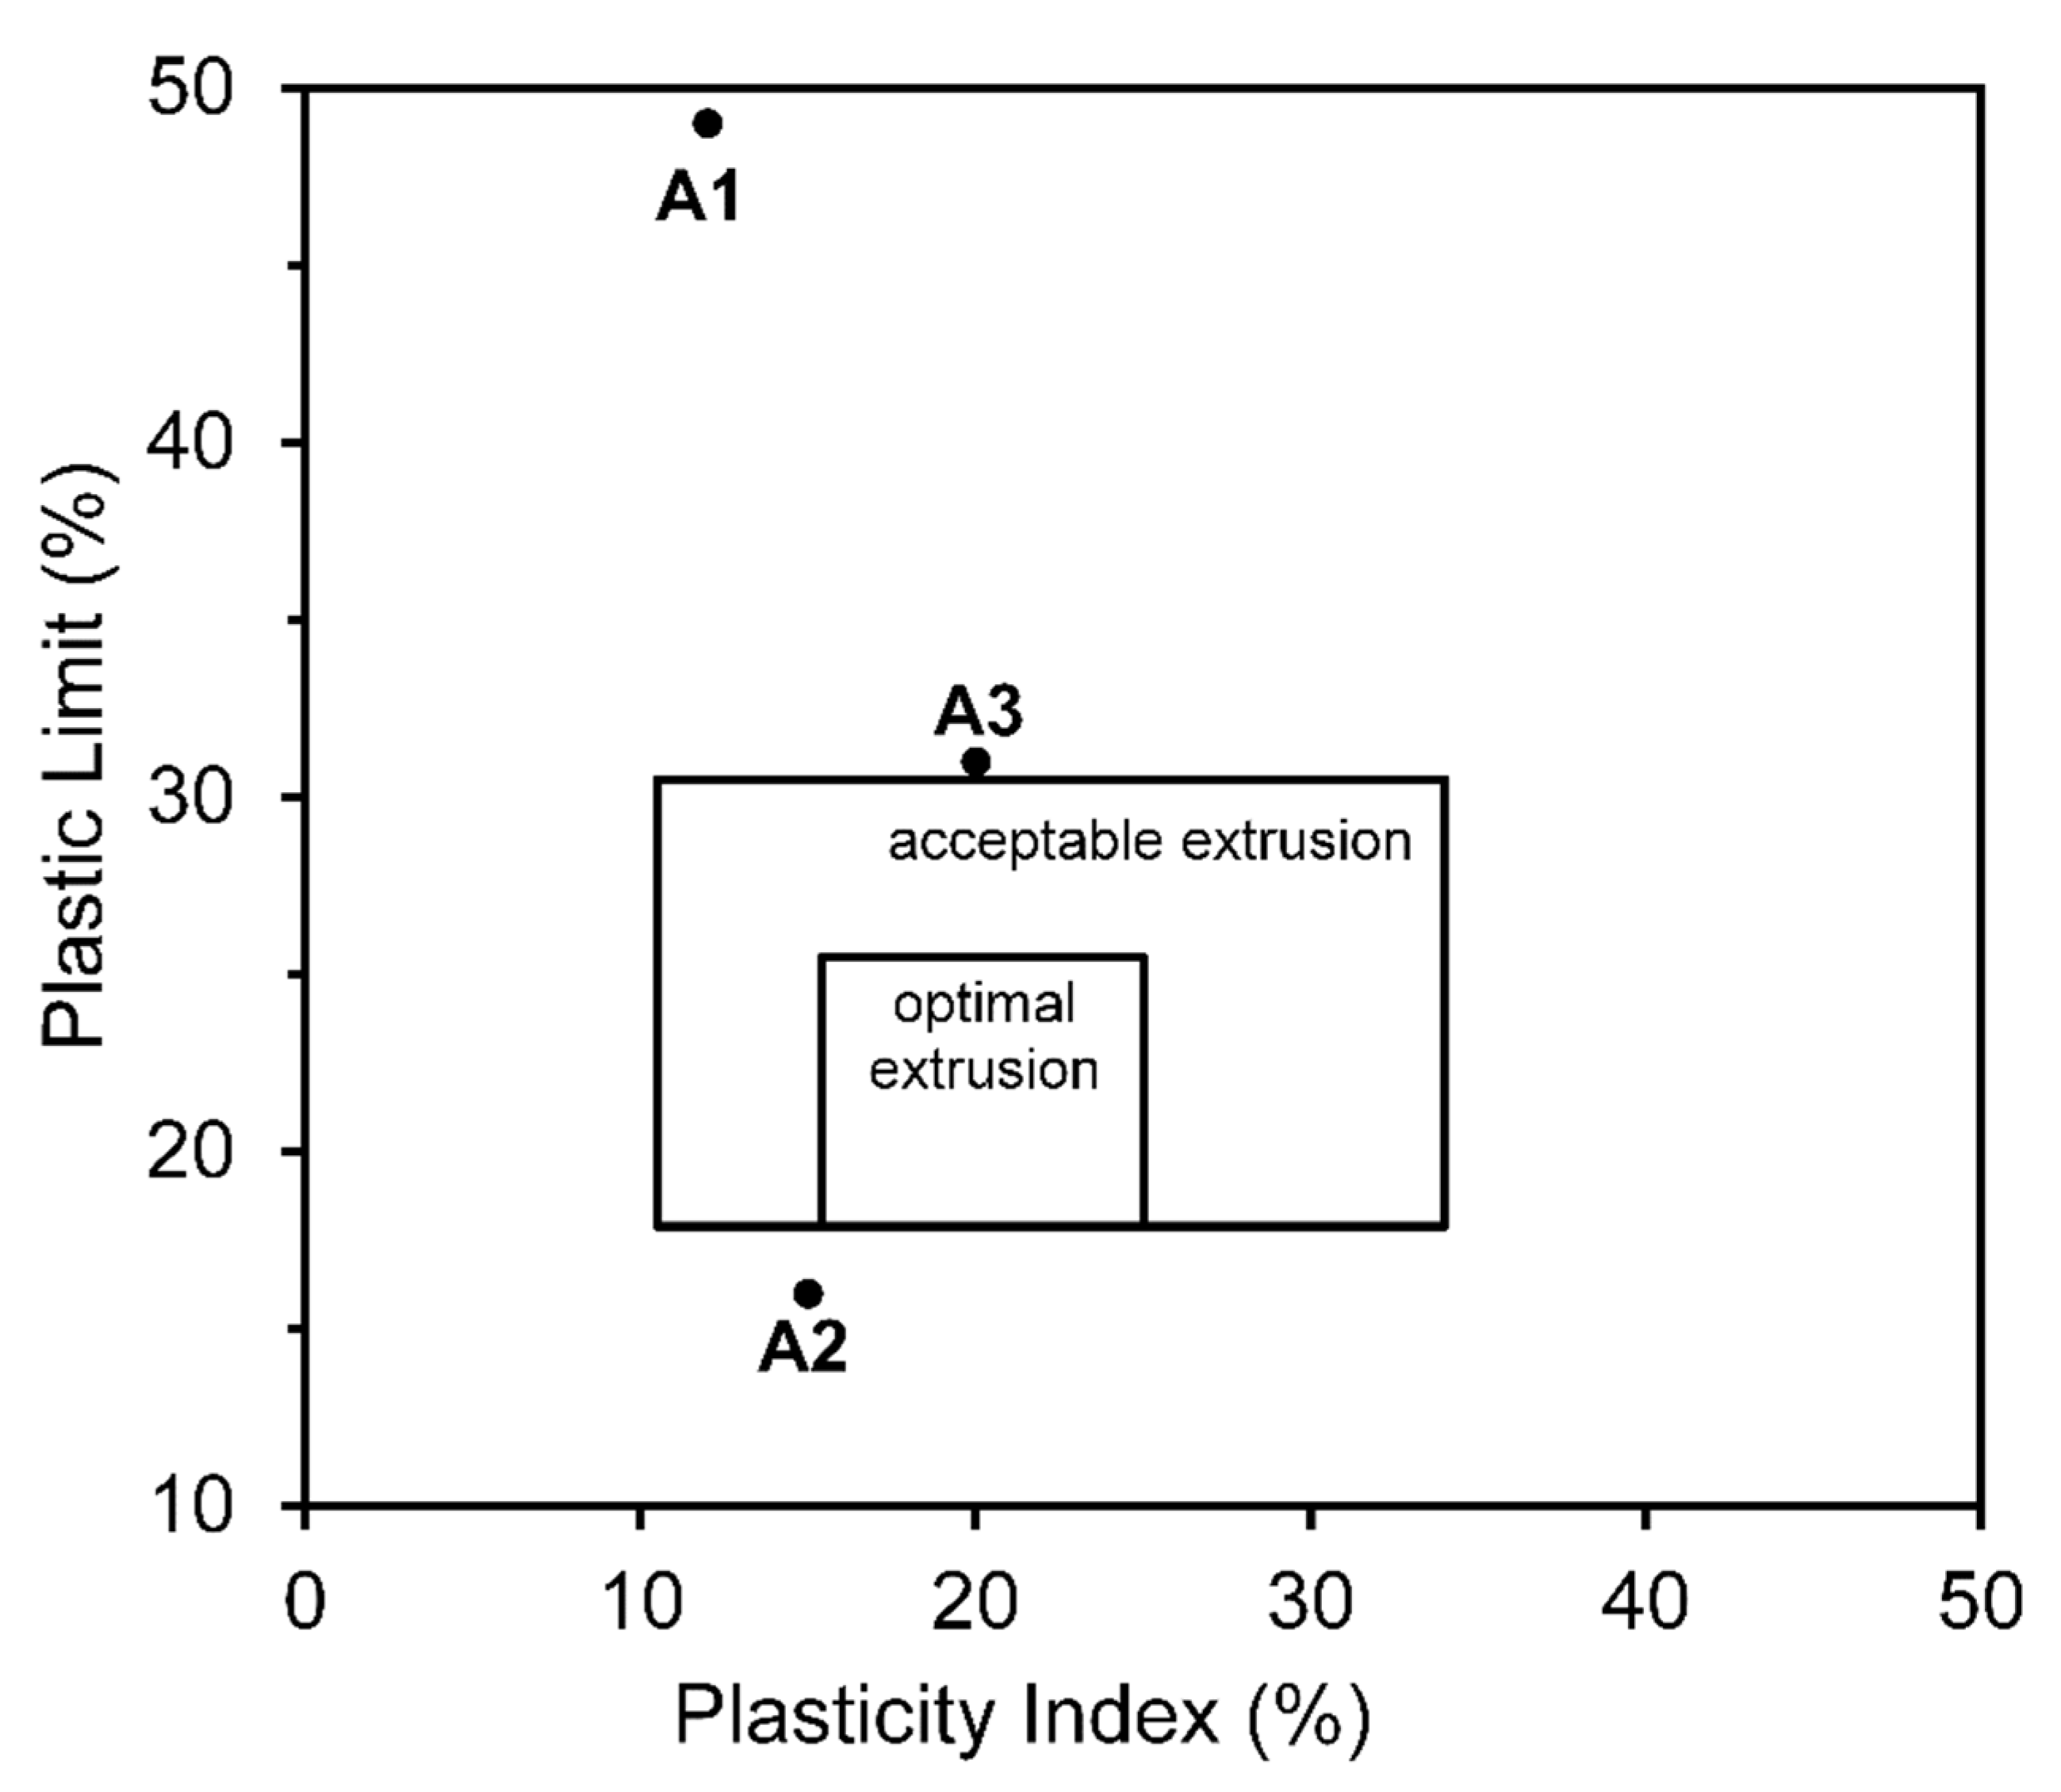
The Atterberg Plasticity Index (PI), which estimates the degree of clay plasticity, is presented in Table 5. According to Burmister’s classification [57] (0 nonplastic; 1–5 slight; 5–10 low; 10–20 medium; 20–40 high; >40 very high), A1 and A2 exhibited moderate plasticity (12 and 15%), while A3 was identified as a clay with good plasticity (20%). Based on these findings, a clay workability index was developed (Figure 6) using the method described by Marsigli and Dondi [58]. Despite the low Daverage value of A1 (similar to that of A3), its plasticity was also low; this may be owing to the presence of nonplastic fine minerals, such as hematite [59], which is characteristic of a low workability index. Sample A2 was between the acceptable and optimal extrusion zones, whereas A3 was almost within the acceptable extrusion zone because of its Atterberg Plasticity Index, which was higher than that of the other clays. Therefore, clay blends can adjust these indices to provide cohesion and plasticity, which are necessary characteristics for the plastic formation of clay pieces [60]. The use of inert materials provides structural support that helps maintain the shape of the clay piece during drying and firing [61]. Therefore, the clays from the abandoned areas (A1 and A2) can be included in the ceramic formulation as more inert components and cohesion regulators, aiding in the manufacturing process of extruded clay ceramics, particularly in the drying and firing stages.

3.2. Technological Characterization of the Clays Compositions

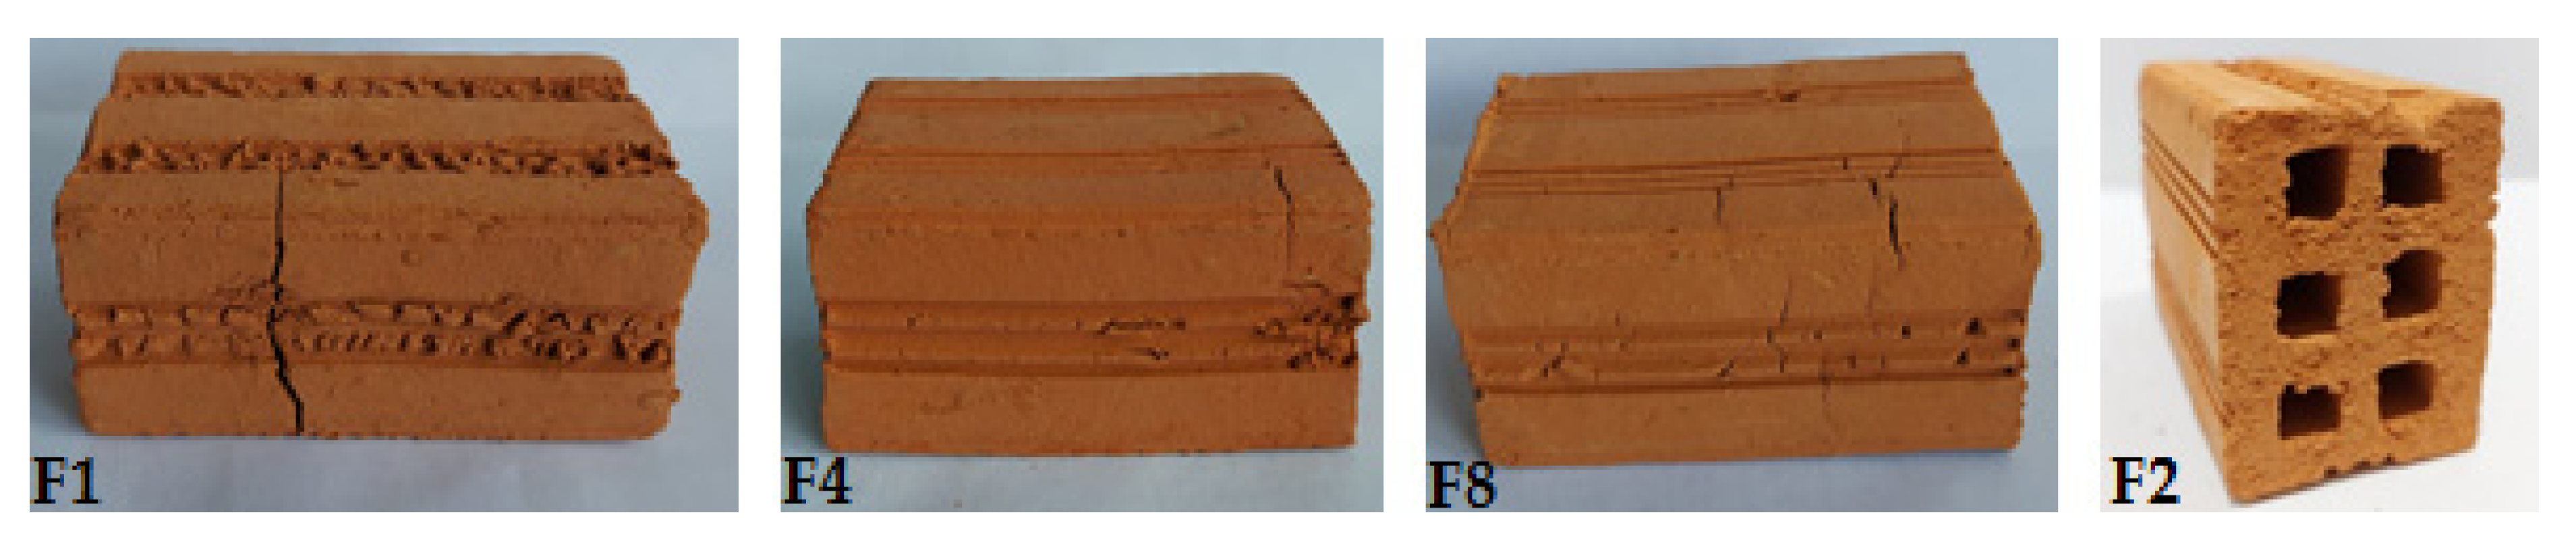
Visual analysis of the extruded ceramic blocks revealed the presence of manufacturing defects, such as cracks, irregular surfaces and deformations, which were associated with the use of clays A1 and A2. The F1, F4 and F8 compositions (Table 1), which contained levels greater than 50% of A1, exhibited cracks that occurred during extrusion (Figure 7). This was possibly owing to the lack of plasticity of clay A1. The roughness of sample F2 was also observed (Figure 7), indicating that quartz was present in excess because it increases the coarseness of the paste.
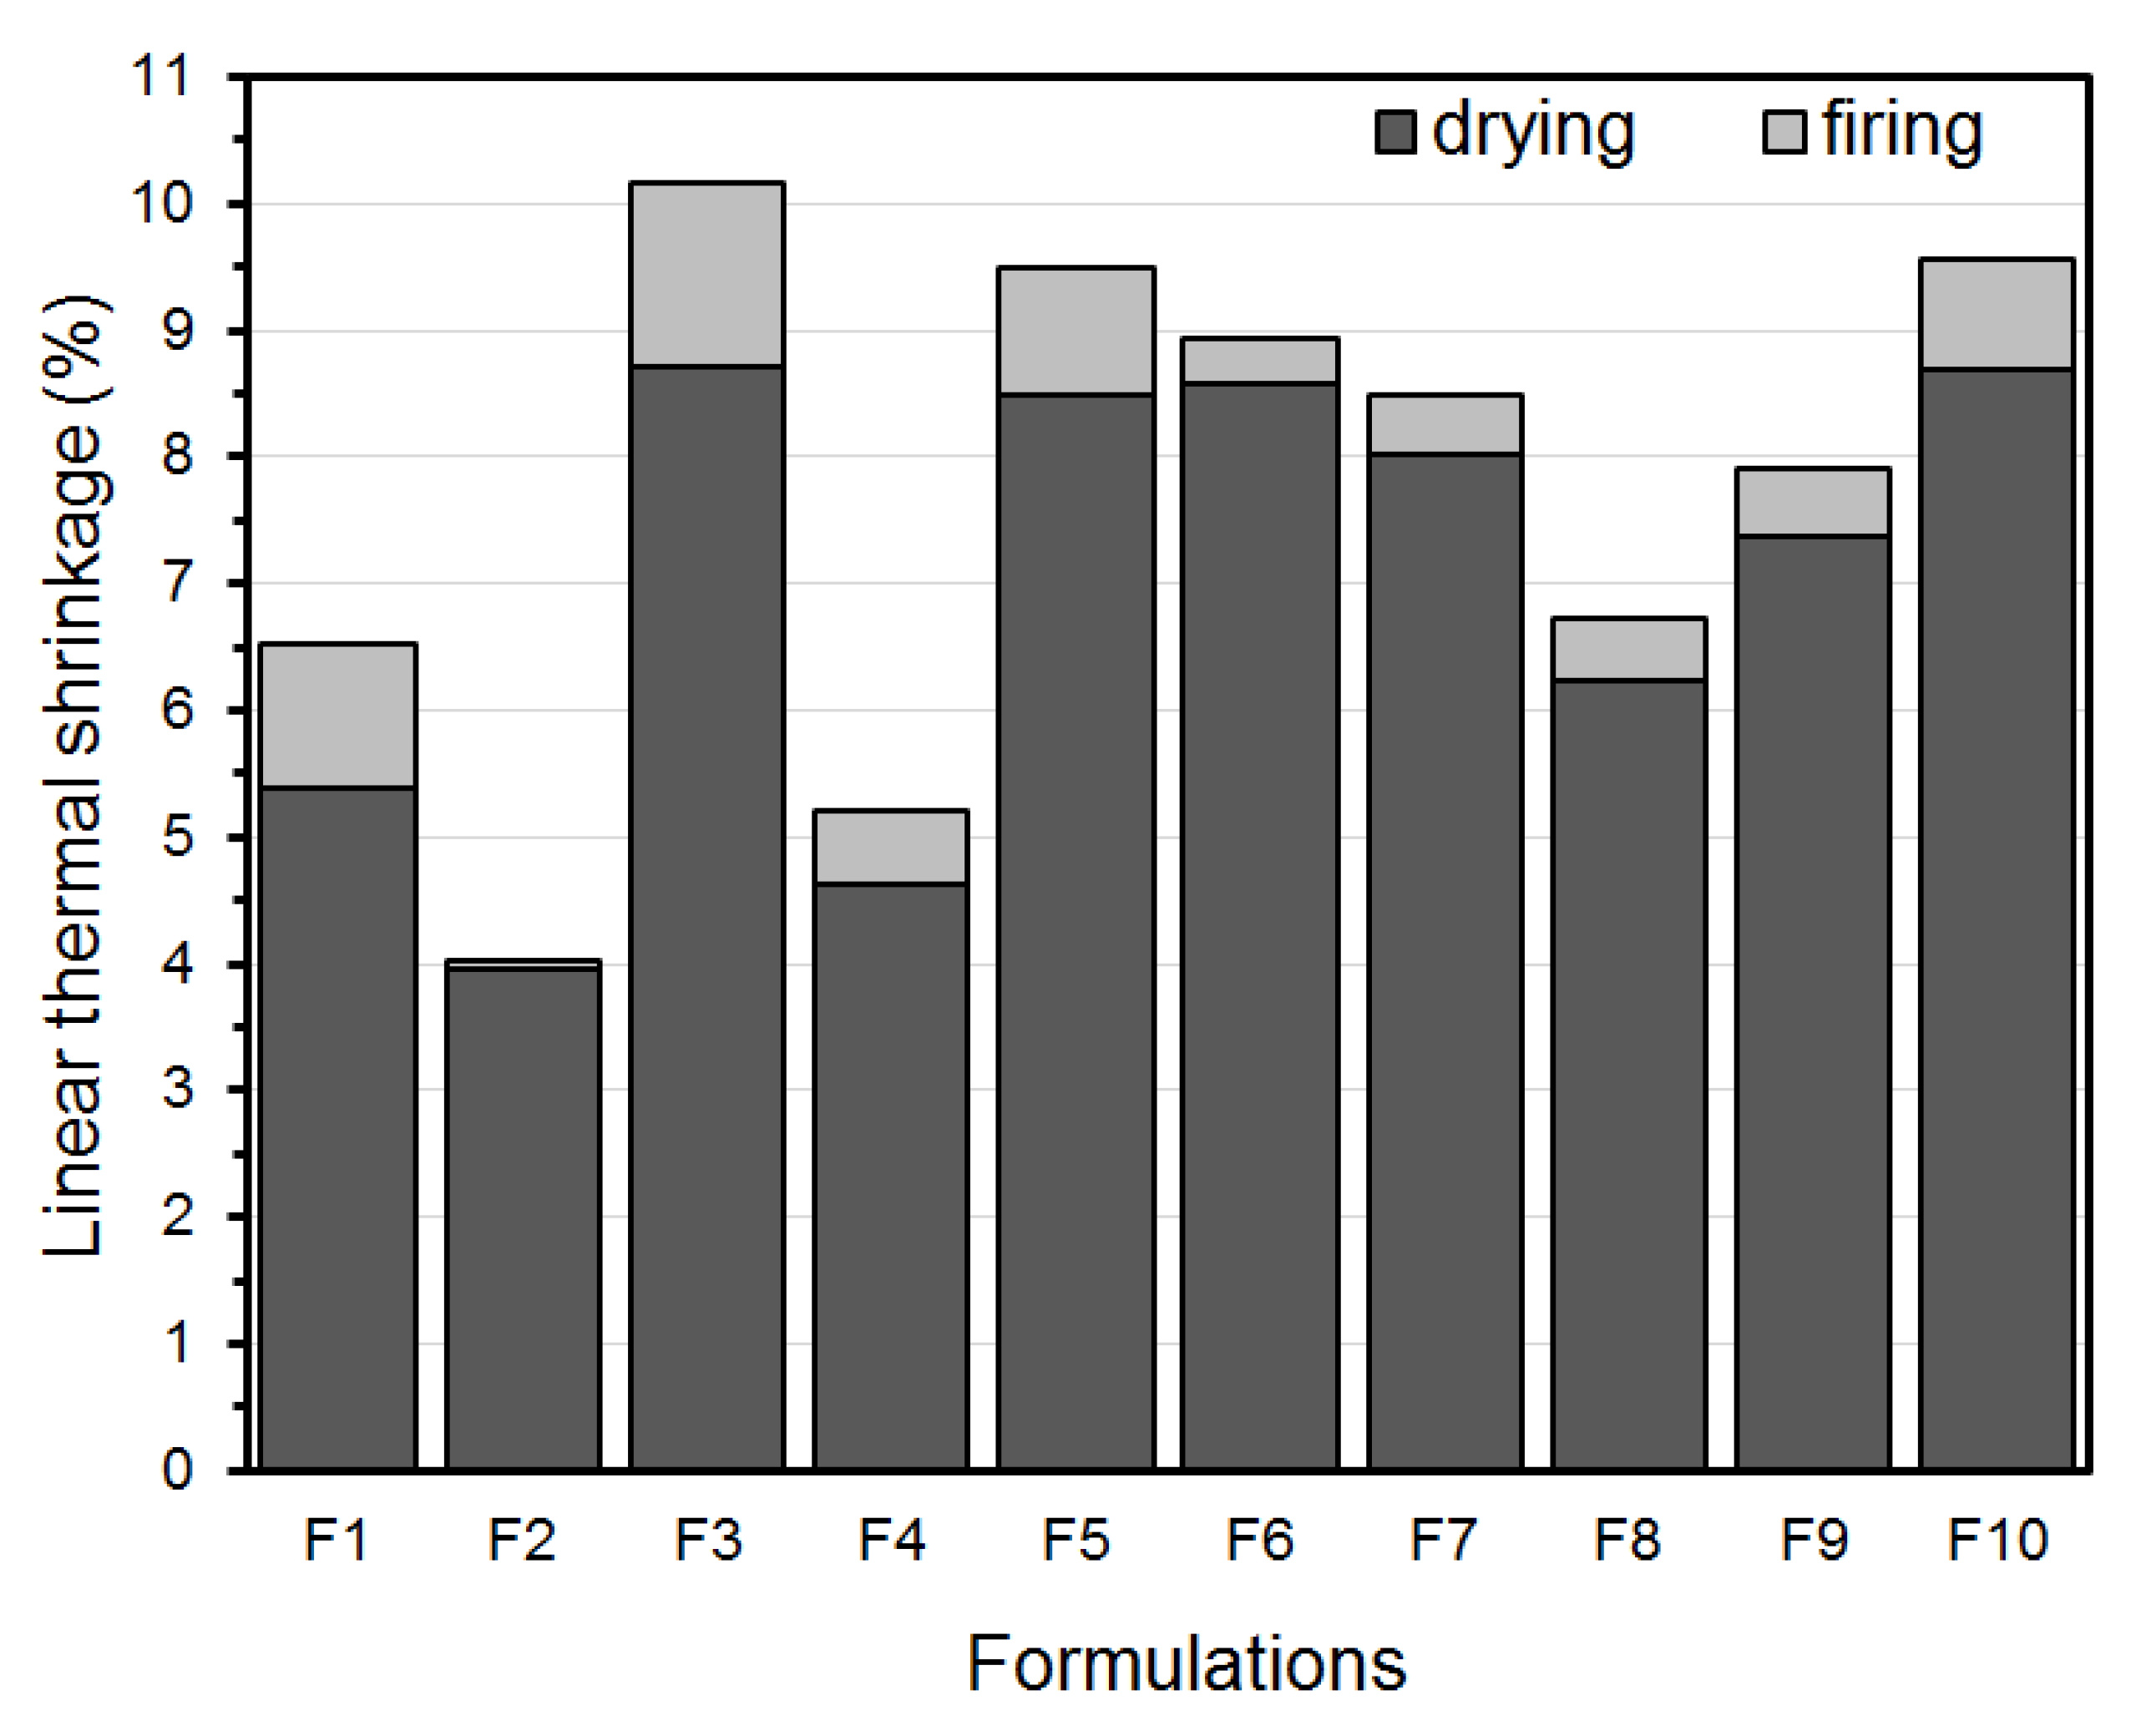
Linear thermal shrinkage is an essential technical parameter in the production of structural ceramics, as dimensional control is one of the requirements established by the standards [62].
Figure 8 shows the drying and firing shrinkage behavior of the developed formulations. Sample F3, composed of a material with higher plasticity and smaller particle size, exhibited the highest drying shrinkage among the clay formulations. This is typically associated with higher densification and the high amount of water adsorbed by clay minerals. However, sample F2 had a higher gross residue content and lower drying shrinkage than the other clay formulations. This was observed because the presence of fine nonclay materials aids in water elimination and the dimensional stability of the ceramic pieces [63,64].
The firing shrinkage behavior of the formulations showed that F2, with a high content of free silica, exhibited higher dimensional stability (less shrinkage) than that of samples F1 and F3. On the other hand, the presence of fluxing oxides (higher in F1 and F3), which enhance the formation of a liquid phase in the ceramic body and the densification of the piece, may cause an increase in shrinkage [65].
According to Dondi [66], variation in drying shrinkage is “acceptable” or “optimal” between 3 and 10 cm/m and 5 and 8 cm/m, respectively. In contrast, the “acceptable” or “optimal” variations in firing shrinkage are 1.5 to 3 cm/m and <1.5 cm/m, respectively.
Clays with higher shrinkage values are more susceptible to cracks owing to the stresses generated by the shrinkage differences between the thinner and thicker areas of the piece [67]. Therefore, the characteristics of clays A1 and A2 can be used to control shrinkage during the drying process.
The technological properties—total shrinkage ( S h ), water absorption ( W A ) and mechanical strength—of the clay formulations are presented in Table 6.
ANOVA was performed on the technological properties to validate the results (Table 7); response surfaces were plotted to aid in their interpretation. The confidence level was set at 95%. The highest F-value and lowest p-value, which are indicative of higher significance and reliability (p), respectively, were considered. The determination coefficient (R2) was also used to select a model.
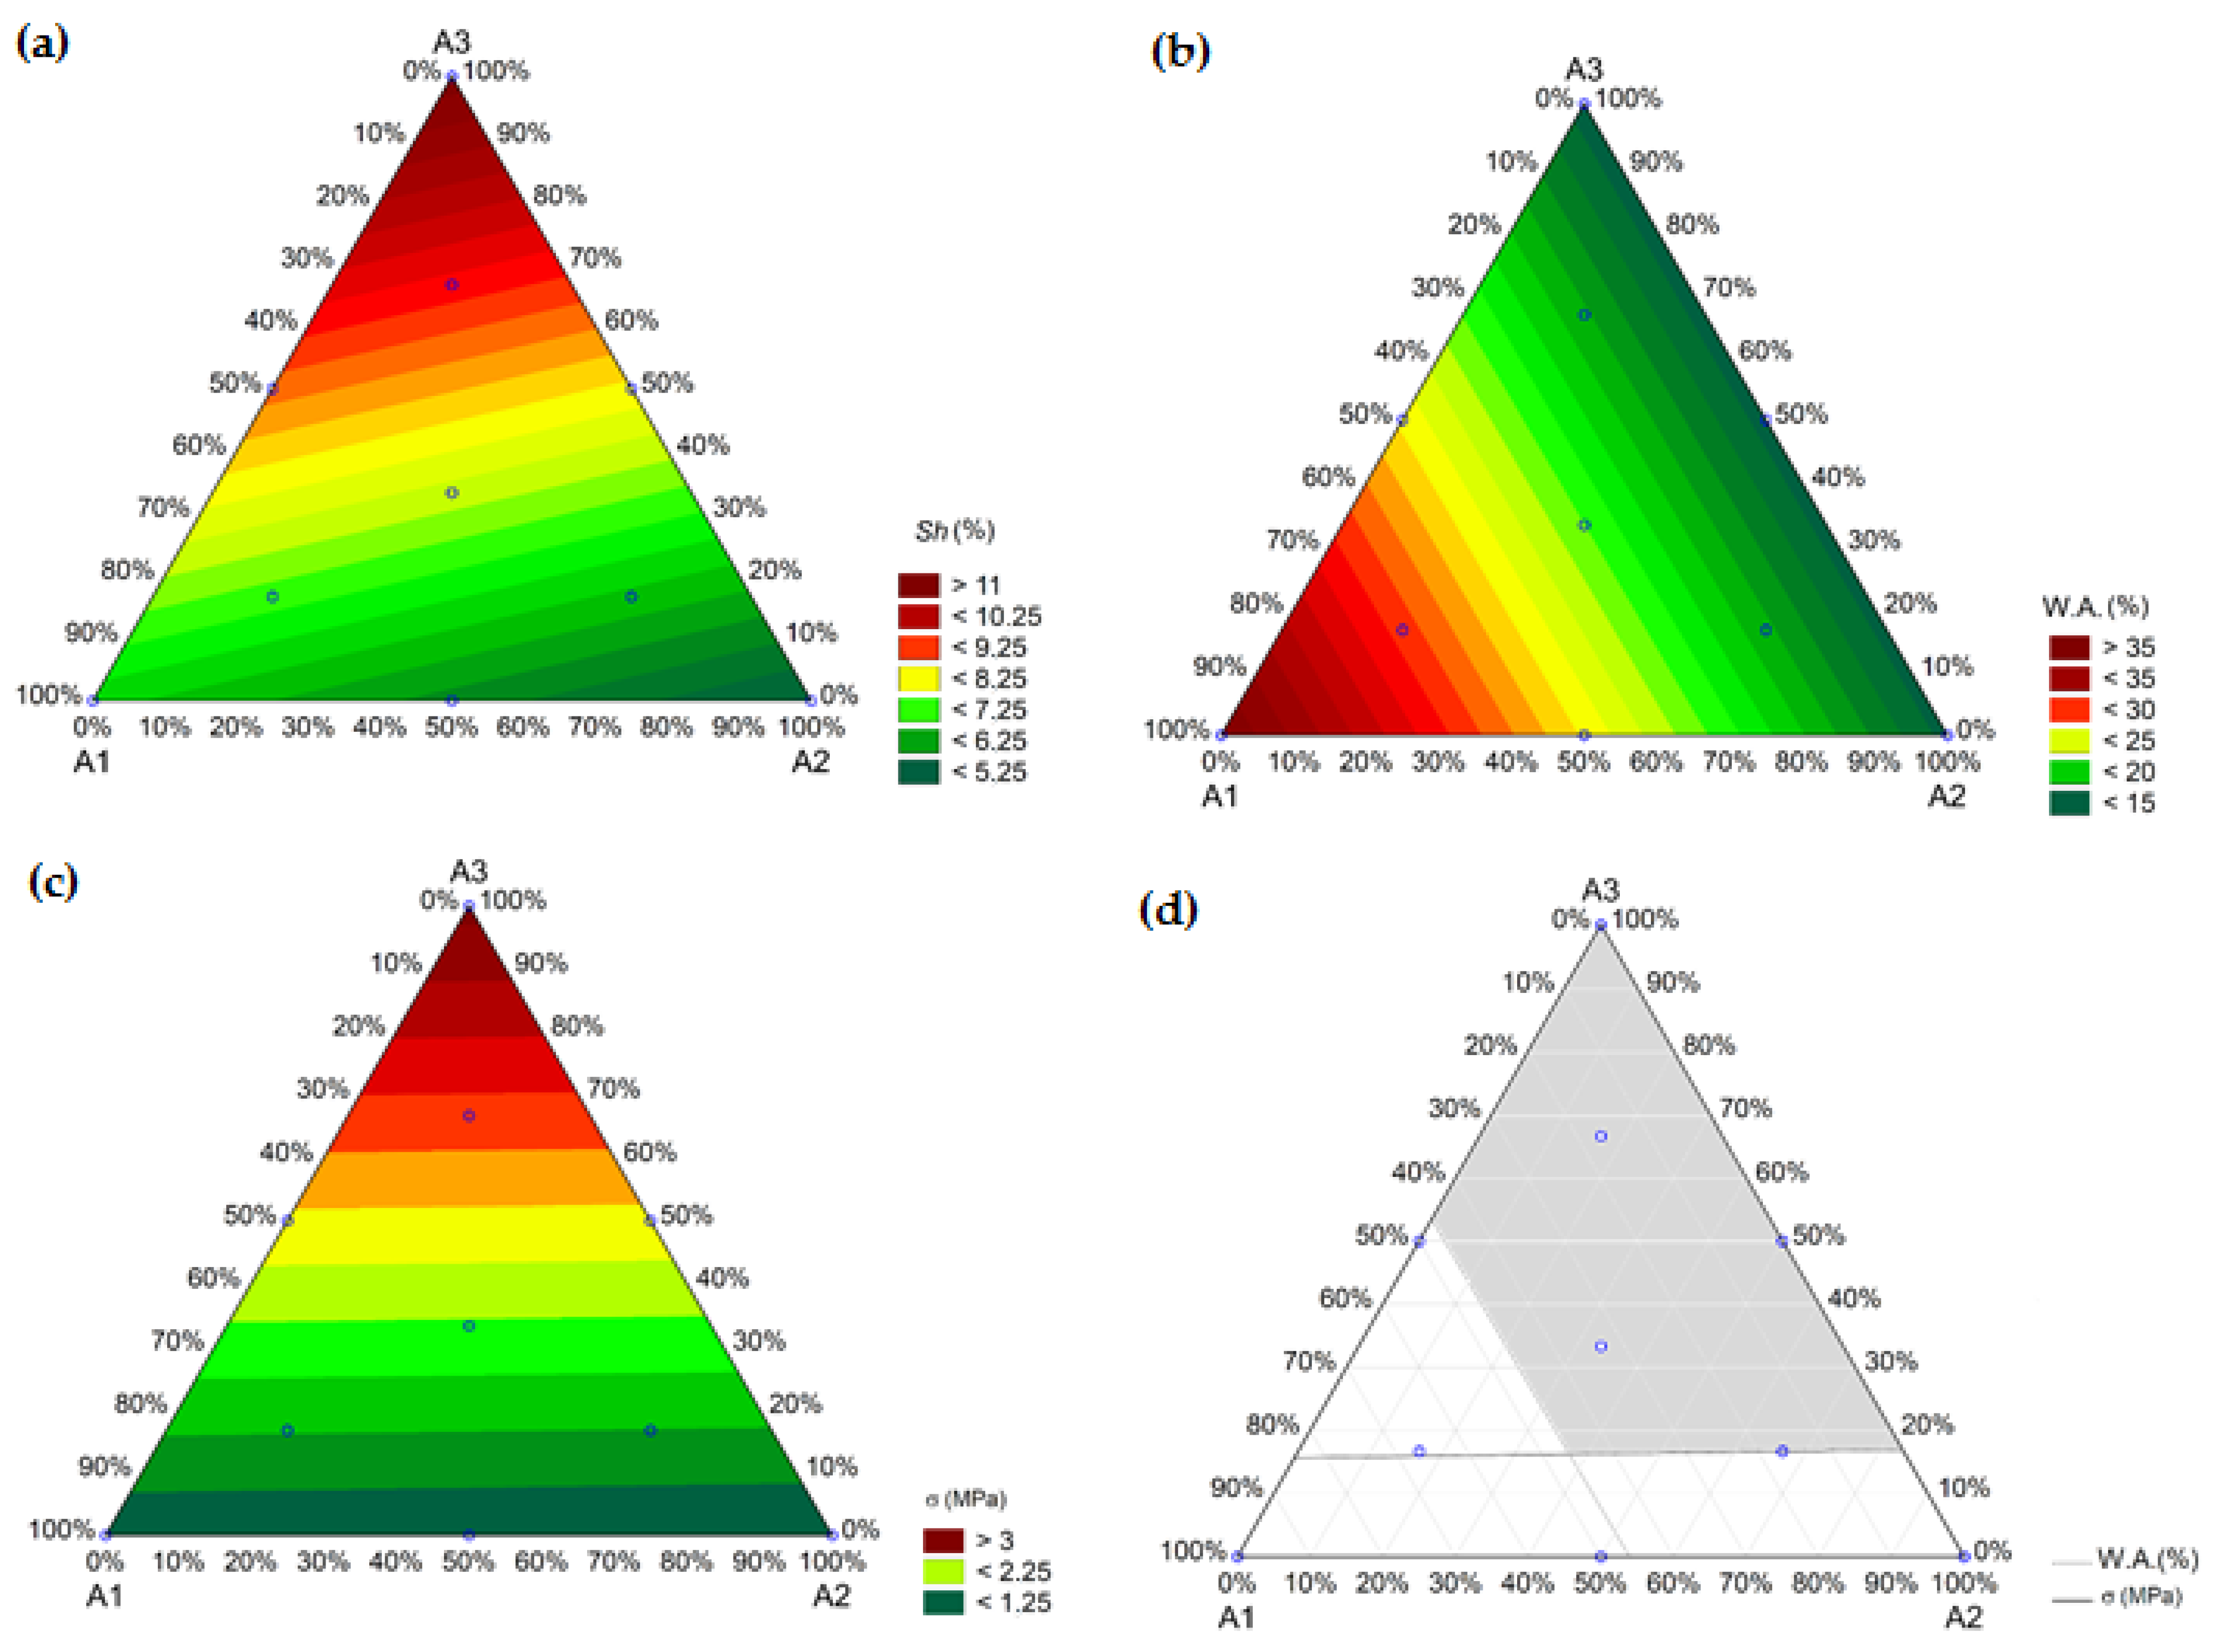
The response surface of the total linear thermal shrinkage (Figure 9a) showed that A3 exhibited the highest total shrinkage (>11%) among the clays, while the value of A2 was the lowest (<5.25%). Regarding the water absorption ( W A ) test, the response surface (Figure 9b) showed that A1 was a determining factor for increasing the W A in the system; additionally, compositions with approximately 50% of this clay exceeded the 25% limit established by the technical standards [62]. In contrast, the W A of clays A2 and A3 were low, even though A2 had a high coarse particle content. This suggested that A2 may be suitable for blend development and dimensional stability. Finally, the response surface for the compressive mechanical strength test (Figure 9c) demonstrated that the inclusion of A1 and A2 clays generally decreased the mechanical strength of the pieces. In contrast, the presence of the A3 clay improved mechanical strength owing to the high densification of the ceramic bodies. Additionally, it showed that approximately 15% of A3 was required to achieve the minimum mechanical strength of 1.5 MPa, according to the technical standard [62]. Equations (7)–(9) show the fitting formulas for the selected models and the developed tests for total linear thermal shrinkage ( S h ), water absorption ( W A ) and mechanical resistance in compression ( σ ), using clays one ( A 1 ), two ( A 2 ) and three ( A 3 ).
S h = 6.60 × A 1 + 5.20 × A 2 + 11.16 × A 3
W A = 37.08 × A 1 + 14.58 × A 2 + 14.39 × A 3
σ = 1.06 × A 1 + 1.02 × A 2 + 3.84 × A 3
The working range of the studied raw materials was identified by removing the areas that exceeded 25% water absorption and that were below the 1.5 MPa compressive mechanical strength, which is in gray in Figure 9d. The incorporation of the A1 clay above ~45% significantly increased the water absorption, which exceeded the technological limits (8–25%); additionally, when the sum of the A1 and A2 clays was >80%, the compressive mechanical strength was <1.5 MPa. Therefore, the hatched area represents the applicability range of different clays based on normative specifications.
In general, conventional clays that are widely used in the production of clay ceramics are known for their favorable plasticity/workability, mechanical strength and, in porcelain products, low water absorption after firing. These traditional clays have been extensively exploited by the ceramics industry because of their availability and ease of use. The application of less conventional raw materials, characterized by high quartz content and low plasticity, represents an innovative and promising approach to the production of clay ceramics. Despite the technical challenges associated with the incorporation of less commonly used clays, such as the higher variability in their properties that require adjustments in formulations, their potential for addressing the challenging future production conditions and sustainability requirements of the sector is enormous.
The prospected exploration areas, according to the data provided by COOPEMI, contain an estimated volume ranging from 180,000 m3 to 220,000 m3, corresponding to approximately 6 ha of licensed but unexplored areas. Unique characteristics, such as a distinct mineral content (for example, A2 with 84.32% quartz) and unique chemical compositions (for example, A1 with 8.95% Fe2O3 and A2 with 93.31% SiO2 + Al2O3), require more process control but can be beneficial for region-specific mineral circularity actions. Production techniques, such as drying, where the A2 clay exhibits a high coarse particle content (58%) and larger grains (average diameter = 85.92 µm), may result in reduced shrinkage and dimensional stability of ceramic pieces.
The use of statistical tools has extended the lifespan of abandoned mines. The adopted evaluation approach, based on these findings, can be applied as a guide for the study of other abandoned areas. Thus, it provides dual benefits: contributing to environmental preservation through the rehabilitation of neglected areas and establishing a sustainable supply of raw materials for ceramic production within the LPA minerals, which is of great relevance to the Brazilian construction industry.

4. Conclusions

Through the characterization of clays from an ambitious mining area, the characteristics that explain why the mining industry does fully explore mineral resources were identified. The results showed that clay A1 exhibited low workability and A2 was characterized as a highly sandy clay owing to its high silica content (85.33%). However, using statistical tools, the viability of introducing these raw materials into ceramic matrices was determined by adjusting their formulations according to their characteristics. Clays A2 and A3 were marginally within acceptable extrusion zones; however, the forming process could be adjusted during formulation development.
In this study, the cumulative incorporation of clays A1 and A2 could be as high as 80% by mass, combined with 20% of clay A3. Using A1 in proportions exceeding 45% resulted in water absorption that exceeded the limit established by the standard (25%). The use of clay A2 improved the control of the dimensional stability of the produced ceramic pieces; however, in excess (~80%), A2 reduced the mechanical strength below the standard limit (1.5 MPa).
Finally, it was demonstrated that the development of clay blends with raw materials having different characteristics is essential for achieving a balance between ceramic product processing and the performance of sustainable production systems.

Author Contributions

Conceptualization: E.S., A.Z. and S.L.G.; Data curation: E.S. and A.Z.; Formal analysis: A.Z.; Funding acquisition: A.Z.; Investigation: E.S. and A.Z.; Methodology: E.S. and A.Z.; Project administration: A.Z. and S.L.G.; Resources: F.R.-P. and M.J.R.; Supervision: A.Z. and S.L.G.; Validation: A.Z., V.d.S.N., S.A., F.R.-P. and M.J.R.; Visualization: E.S.; Writing—original draft: E.S. and A.Z.; Writing—Review and editing: V.d.S.N., J.A., S.A., F.R.-P. and M.J.R. All authors have read and agreed to the published version of the manuscript.

Funding

CNPq/Brazil: process no. 380935/2023-6, 306897/2022-9 and 307702/2022-7, CAPES/Brazil; process no. 88887.502321/2020-00 and FAPESC/Brazil; process no. 301913/2023-4.

Institutional Review Board Statement

Not applicable.

Informed Consent Statement

Not applicable.

Data Availability Statement

Not applicable.

Acknowledgments

The authors are very grateful to the Coordination for Higher Education Improvement (Coordenação de Aperfeiçoamento de Pessoal de Nível Superior-CAPES), National Council for Scientific and Technological Development (Conselho Nacional de Desenvolvimento Científico e Tecnológico-CNPq) and the Support Foundation for Research and Innovation of Santa Catarina (Fundação de Amparo à Pesquisa e Inovação de Santa Catarina-FAPESC) for the financial support of this study. The authors also thank Local Production Arrangement-LPA Clay Ceramic from Morro da Fumaça (Arranjo Produtivo Local -APL Cerâmica Vermelha de Morro da Fumaça) for their assistance in developing this study.

Conflicts of Interest

The authors declare that they have no conflict of interest.

References

  1. Semiz, B. Characteristics of Clay-Rich Raw Materials for Ceramic Applications in Denizli Region (Western Anatolia). Appl. Clay Sci. 2017, 137, 83–93. [Google Scholar] [CrossRef]
  2. Tsozué, D.; Nzeugang, A.N.; Mache, J.R.; Loweh, S.; Fagel, N. Mineralogical, Physico-Chemical and Technological Characterization of Clays from Maroua (Far-North, Cameroon) for Use in Ceramic Bricks Production. J. Build. Eng. 2017, 11, 17–24. [Google Scholar] [CrossRef]
  3. Lee, V.-G.; Yeh, T.-H. Sintering Effects on the Development of Mechanical Properties of Fired Clay Ceramics. Mater. Sci. Eng. A 2008, 485, 5–13. [Google Scholar] [CrossRef]
  4. Lahcen, D.; Hicham, E.E.; Latifa, S.; Abderrahmane, A.; Jamal, B.; Mohamed, W.; Meriam, E.; Nathalie, F. Characteristics and Ceramic Properties of Clayey Materials from Amezmiz Region (Western High Atlas, Morocco). Appl. Clay Sci. 2014, 102, 139–147. [Google Scholar] [CrossRef]
  5. Sadik, C.; Albizane, A.; el Amrani, I.E. Composition and Ceramic Characteristics of Cretaceous Clays from Morocco. In Proceedings of the 13th International Ceramics Congress, Part of CIMTEC 2014, Montecatini Terme, Italy, 8–13 June 2014; Trans Tech Publications Ltd.: Montecatini Terme, Italy, 2014; pp. 209–214. [Google Scholar]
  6. Balde, M.Y.; Njiomou Djangang, C.; Bah, A.; Blanchart, P.; Njopwouo, D. Effect of Physicochemical Characteristics on the Use of Clays from Kindia (Guinea) in Ceramic Compositions. Int. J. Appl. Ceram. Technol. 2021, 18, 1033–1042. [Google Scholar] [CrossRef]
  7. Manoharan, C.; Sutharsan, P.; Dhanapandian, S.; Venkatachalapathy, R.; Asanulla, R.M. Analysis of Temperature Effect on Ceramic Brick Production from Alluvial Deposits, Tamilnadu, India. Appl. Clay Sci. 2011, 54, 20–25. [Google Scholar] [CrossRef]
  8. da Silva Nazário, L.C.; dos Santos, A.R.; de Figueiredo Lopes Lucena, L.; de Moura Silva, V.E. Panorama Da Indústria de Cerâmica Vermelha e Os Impactos Ambientais Na Região Do Seridó. In Anais do Congresso Brasileiro de Gestão Ambiental e Sustentabilidade; Congestas 2018: JoãoPessoa, Brazil, 2018; Volume 6, pp. 437–444. [Google Scholar]
  9. Vieira, C.M.F.; Sánchez, R.; Monteiro, S.N. Characteristics of Clays and Properties of Building Ceramics in the State of Rio de Janeiro, Brazil. Constr. Build. Mater. 2008, 22, 781–787. [Google Scholar] [CrossRef]
  10. CBIC PIB Da Construção Fecha o Ano Com Crescimento de 9.7%, a Maior Alta Em 11 Anos. Available online: https://cbic.org.br/pib-da-construcao-fecha-o-ano-com-crescimento-de-97-a-maior-alta-em-11-anos/ (accessed on 25 October 2022).
  11. ANICER Dados Oficiais. Available online: https://www.anicer.com.br/anicer/setor/dados-oficiais/ (accessed on 29 October 2022).
  12. do Prado, U.S.; Bressiani, J.C. Panorama Da Indústria Cerâmica Brasileira Na Última Década. Cerâmica Ind. 2013, 18, 7–11. [Google Scholar] [CrossRef]
  13. de Aguiar, M.C.; Gadioli, M.C.B.; Sant’Anna, M.A.K.; de Almeida, K.M.; Giori, A.J.N. Processos de Fabricação de Cerâmica Vermelha; CETEM/MCTI: Rio de Janeiro, Brazil, 2022. [Google Scholar]
  14. Brasil Decreto-Lei No 227. Available online: http://www.planalto.gov.br/ccivil_03/decreto-lei/del0227.htm (accessed on 26 August 2022).
  15. Zaccaron, A.; de Souza Nandi, V.; Dal Bó, M.; Peterson, M.; Angioletto, E.; Bernardin, A.M. Characterization and Use of Clays and Argillites from the South of Santa Catarina State, Brazil, for the Manufacture of Clay Ceramics. Clay Miner. 2020, 55, 172–183. [Google Scholar] [CrossRef]
  16. Rebelo, W.B.; Zaccaron, A. Evolução Da Mineração de Argila Para Cerâmica Vermelha Na Região Da AMREC**, Sob a Ótica Da Lavra Ambiciosa: Um Estudo de Caso. Tecnol. Metal. Mater. Mineração 2020, 17, e2023. [Google Scholar] [CrossRef]
  17. Zaccaron, A. Estudo Do Processo de Secagem Rápida Em Argilas Utilizadas Para a Fabricação de Cerâmica Vermelha; Universidade do Extremo Sul Catarinense—UNESC: Criciúma, Brazil, 2018. [Google Scholar]
  18. White, I.C. Relatório Final Da Comissão de Estudos Das Minas de Carvão de Pedra Do Brasil; DNPM: Rio de Janeiro, Brasil, 1908; pp. 301–617. [Google Scholar]
  19. da Silva, M.A.S.; Leites, S.R. Programa Levantamentos Geológicos Básicos Do Brasil; CPRM: Brasília, Brazil, 2000. [Google Scholar]
  20. Rietveld, H.M. A Profile Refinement Method for Nuclear and Magnetic Structures. J. Appl. Crystallogr. 1969, 2, 65–71. [Google Scholar] [CrossRef]
  21. Zaccaron, A.; Galatto, S.L.; de Souza Nandi, V.; Fernandes, P. Incorporação de Chamote Na Massa de Cerâmica Vermelha Como Valorização Do Resíduo. Cerâmica Ind. 2014, 19, 33–39. [Google Scholar] [CrossRef]
  22. Andrade, F.A.; Al-qureshi, H.A.; Hotza, D. Measuring the Plasticity of Clays: A Review. Appl. Clay Sci. 2011, 51, 1–7. [Google Scholar] [CrossRef]
  23. ISO 17892-12; Geotechnical Investigation and Testing—Laboratory Testing of Soil—Part 12: Determination of Liquid and Plastic Limits. ISO: Geneva Switzerland, 2018; 27p.
  24. Dondi, M. Clay Materials for Ceramic Tiles from the Sassuolo District (Northern Apennines, Italy). Geology, Composition and Technological Properties. Appl. Clay Sci. 1999, 15, 337–366. [Google Scholar] [CrossRef]
  25. Nyakairu, G.W.; Kurzweil, H.; Koeberl, C. Mineralogical, Geochemical, and Sedimentological Characteristics of Clay Deposits from Central Uganda and Their Applications. J. Afr. Earth Sci. 2002, 35, 123–134. [Google Scholar] [CrossRef]
  26. Baccour, H.; Medhioub, M.; Jamoussi, F.; Mhiri, T.; Daoud, A. Mineralogical Evaluation and Industrial Applications of the Triassic Clay Deposits, Southern Tunisia. Mater. Charact. 2008, 59, 1613–1622. [Google Scholar] [CrossRef]
  27. Mohsen, Q.; El-maghraby, A. Characterization and Assessment of Saudi Clays Raw Material at Different Area. Arab. J. Chem. 2010, 3, 271–277. [Google Scholar] [CrossRef]
  28. Dondi, M.; Raimondo, M.; Zanelli, C. Clays and Bodies for Ceramic Tiles: Reappraisal and Technological Classification. Appl. Clay Sci. 2014, 96, 91–109. [Google Scholar] [CrossRef]
  29. Imen, M.; Slim, B.; Nathalie, F.; Gaied, M.E. Incorporation of Siliceous Sand and Lignite Tailings from Miocene Deposits (Zeramdine, Eastern Tunisia) in Clay Bricks and Ceramic Tiles: Technological Feasibility. Arab. J. Geosci. 2021, 14, 282. [Google Scholar] [CrossRef]
  30. de Oliveira Guimarães, C.A.; Delaqua, G.C.G.; de Azevedo, A.R.G.; Monteiro, S.N.; Amaral, L.F.; Souza, C.L.M.; da Silva, A.G.P.; de Holanda, J.N.F.; Vieira, C.M.F. Heating Rate Effect during Sintering on the Technological Properties of Brazilian Red Ceramics. Int. J. Adv. Manuf. Technol. 2022, 119, 8125–8135. [Google Scholar] [CrossRef]
  31. Wang, S.; Gainey, L.; Mackinnon, I.D.R.; Allen, C.; Gu, Y.; Xi, Y. Thermal Behaviors of Clay Minerals as Key Components and Additives for Fired Brick Properties: A Review. J. Build. Eng. 2023, 66, 105802. [Google Scholar] [CrossRef]
  32. Maestrelli, S.C.; Roveri, C.D.; Nunes, A.G.P.; Faustino, L.M.; Aielo, G.F.; Pinto, L.P.A.; Manochio, C.; Cal, T.M.L.; Ribeiro, F.F.; Mariano, N.A. Estudo de Caracterização de Argilas Não Plásticas Da Região de Poços de Caldas, MG. Cerâmica 2013, 59, 242–248. [Google Scholar] [CrossRef]
  33. Abubakar, I.; Yauri, U.A.B.; Faruq, U.Z.; Noma, S.S.; Sharif, N. Characterization of Dabagi Clay Deposit for Its Ceramics Potential. Afr. J. Environ. Sci. Technol. 2014, 8, 455–459. [Google Scholar] [CrossRef]
  34. Loutou, M.; Taha, Y.; Benzaazoua, M.; Daafi, Y.; Hakkou, R. Valorization of Clay By-Product from Moroccan Phosphate Mines for the Production of Fired Bricks. J. Clean. Prod. 2019, 229, 169–179. [Google Scholar] [CrossRef]
  35. Wang, S.; Gainey, L.; Wang, X.; Mackinnon, I.D.R.; Xi, Y. Influence of Palygorskite on In-Situ Thermal Behaviours of Clay Mixtures and Properties of Fired Bricks. Appl. Clay Sci. 2022, 216, 106384. [Google Scholar] [CrossRef]
  36. Varela, M.L.; do Nascimento, R.M.; Martinelli, A.E.; Hotza, D.; Melo, D.M.A.; Melo, M.A.F. Otimização de Uma Metodologia Para Análise Mineralógica Racional de Argilominerais. Cerâmica 2005, 51, 388–392. [Google Scholar] [CrossRef]
  37. Albers, A.P.F.; Melchiades, F.G.; Machado, R.; Baldo, J.B.; Boschi, A.O. Um Método Simples de Caracterização de Argilominerais Por Difração de Raios X. Cerâmica 2002, 48, 34–37. [Google Scholar] [CrossRef]
  38. Zaccaron, A.; de Souza Nandi, V.; Bernardin, A.M. Fast Drying for the Manufacturing of Clay Ceramics Using Natural Clays. J. Build. Eng. 2021, 33, 101877. [Google Scholar] [CrossRef]
  39. de Souza Nandi, V.; Zaccaron, A.; Raupp-Pereira, F.; Arcaro, S.; Bernardin, A.M.; Montedo, O.R.K. Plastic Behaviour of Clay Materials for the Manufacture of Fast-Drying Red Ceramics. Clay Miner. 2023, 58, 26–37. [Google Scholar] [CrossRef]
  40. Jordan, M.M.; Montero, M.A.; García-Sánchez, E.; Martínez-Poveda, A. Firing Behaviour of Tertiary, Cretaceous and Permo-Triassic Clays from Castellon Ceramic Cluster (Spain). Appl. Clay Sci. 2020, 198, 105804. [Google Scholar] [CrossRef]
  41. de Lima Silva, M.; Pereira, F.M.M. Caracterização de Argilas Provenientes de Indústria de Cerâmica Vermelha Do Município Do Crato—Ceará, Brasil. Res. Soc. Dev. 2021, 10, e448101018392. [Google Scholar] [CrossRef]
  42. Ituma, C.G.; Etukudoh, A.B.; Abuh, M.A.; Akpomie, K.G.; Obioha, C.I. Utilization of Nkpuma-Akpatakpa Clay in Ceramics: Characterization and Microstructural Studies. J. Appl. Sci. Environ. Manag. 2018, 22, 47. [Google Scholar] [CrossRef]
  43. Horváth, E.; Frost, R.L.; Makó, É.; Kristóf, J.; Cseh, T. Thermal Treatment of Mechanochemically Activated Kaolinite. Thermochim. Acta 2003, 404, 227–234. [Google Scholar] [CrossRef]
  44. Escalera, E.; Tegman, R.; Antti, M.L.; Odén, M. High Temperature Phase Evolution of Bolivian Kaolinitic-Illitic Clays Heated to 1250 °C. Appl. Clay Sci. 2014, 101, 100–105. [Google Scholar] [CrossRef]
  45. de Almeida Azzi, A.; Osacký, M.; Uhlík, P.; Čaplovičová, M.; Zanardo, A.; Madejová, J. Characterization of Clays from the Corumbataí Formation Used as Raw Material for Ceramic Industry in the Santa Gertrudes District, São Paulo, Brazil. Appl. Clay Sci. 2016, 132–133, 232–242. [Google Scholar] [CrossRef]
  46. Schackow, A.; Correia, S.L.; Effting, C. Influence of Microstructural and Morphological Properties of Raw Natural Clays on the Reactivity of Clay Brick Wastes in a Cementitious Blend Matrix. Cerâmica 2020, 66, 154–163. [Google Scholar] [CrossRef]
  47. Comin, A.B.; Zaccaron, A.; de Souza Nandi, V.; Inocente, J.M.; Muller, T.G.; Peterson, M. Characterization and Use of Clays from the Rio Bonito Formation/Paraná Basin for Ceramic Industry Application. Int. J. Appl. Ceram. Technol. 2021, 18, 1814–1824. [Google Scholar] [CrossRef]
  48. Mymrin, V.; Klitzke, W.; Alekseev, K.; Catai, R.E.; Nagalli, A.; dos Santos Izzo, R.L.; Romano, C.A. Red Clay Application in the Utilization of Paper Production Sludge and Scrap Glass to Fabricate Ceramic Materials. Appl. Clay Sci. 2015, 107, 28–35. [Google Scholar] [CrossRef]
  49. Meng, Y.; Gong, G.; Wei, D.; Xie, Y. In Situ High Temperature X-ray Diffraction Study on High Strength Aluminous Porcelain Insulator with the Al2O3-SiO2-K2O-Na2O System. Appl. Clay Sci. 2016, 132–133, 760–767. [Google Scholar] [CrossRef]
  50. Laita, E.; Bauluz, B. Mineral and Textural Transformations in Aluminium-Rich Clays during Ceramic Firing. Appl. Clay Sci. 2018, 152, 284–294. [Google Scholar] [CrossRef]
  51. Laita, E.; Bauluz, B.; Mayayo, M.J.; Yuste, A. Mineral and Textural Transformations in Mixtures of Al-Rich and Al–K-Rich Clays with Firing: Refractory Potential of the Fired Products. Ceram. Int. 2021, 47, 14527–14539. [Google Scholar] [CrossRef]
  52. Vieira, C.M.F.; de Souza, E.T.A.; Monteiro, S.N. Efeito Da Incorporação de Chamote No Processamento e Microestrutura de Cerâmica Vermelha. Cerâmica 2004, 50, 254–260. [Google Scholar] [CrossRef]
  53. Mütze, T. International Journal of Mineral Processing Modelling the Stress Behaviour in Particle Bed Comminution. Int. J. Miner. Process. 2016, 156, 14–23. [Google Scholar] [CrossRef]
  54. Wang, Q.; Li, S.; Yu, H.; Li, F.; Xu, H.; Qiao, H.; Liu, J.; Du, Q. Processing Research Influence of Raw Material Grain Composition on the Properties of Fused Silica Ceramics. J. Ceram. Process. Res. 2017, 18, 594–598. [Google Scholar]
  55. Benedet, G.A.; Zaccaron, A.; Inocente, J.M.; de Souza Nandi, V.; Arcaro, S.; Raupp-Pereira, F.; Neto, D.G. Mining Circular Economy: Potential of Rice Husk Ash as an Alternative Mineral Source in the Production of Clay Ceramics Using Simplex Design. Process Saf. Environ. Prot. 2023, 176, 716–724. [Google Scholar] [CrossRef]
  56. Nandi, V.S.; Zaccaron, A.; Fernandes, P.; Dagostin, J.P.; Bernadin, A.M. Adição de Vidro Reciclado de Lâmpadas Na Fabricação de Cerâmica Vermelha. Cerâmica Ind. 2014, 19, 29–32. [Google Scholar] [CrossRef]
  57. Burmister, D.M. Principles and Techniques of Soil Identifications. Proc. Highw. Res. Board 1949, 29, 402–433. [Google Scholar]
  58. Marsigli, M.; Dondi, M. Plasticitá Delle Argille Italiane per Laterizi e Previsione Del Loro Comportamento in Foggiatura. L’Industria dei Laterizi 1997, 46, 214–222. [Google Scholar]
  59. Alves, W.A.; Baldo, J.B. O Potencial de Utilização de Um Resíduo Argiloso Na Fabricação de Revestimento Cerâmico Parte I—Caracterização. Cerâmica Ind. 1997, 2, 38–40. [Google Scholar]
  60. Pérez-Villarejo, L.; Eliche-Quesada, D.; Iglesias-Godino, F.J.; Martínez-García, C.; Corpas-Iglesias, F.A. Recycling of Ash from Biomass Incinerator in Clay Matrix to Produce Ceramic Bricks. J. Environ. Manag. 2012, 95, S349–S354. [Google Scholar] [CrossRef]
  61. Ferreira, C.; Ribeiro, A.; Ottosen, L. Possible Applications for Municipal Solid Waste Fly Ash. J. Hazard. Mater. 2003, 96, 201–216. [Google Scholar] [CrossRef] [PubMed]
  62. ABNT NBR 15270-1; Componentes Cerâmicos—Blocos e Tijolos Para Alvenaria—Parte 1: Requisitos. Associação Brasileira de Normas Técnicas: São Paulo, Brazil, 2017.
  63. Gömze, L.A.; Gömze, L.N. Relations between the Material Structures and Drying Properties of Ceramic Bricks and Roof Tiles. Epa.-J. Silic. Based Compos. Mater. 2008, 60, 102–107. [Google Scholar] [CrossRef]
  64. Nascimento, J.J.S.; Belo, F.A.; de Lima, A.G.B. Experimental Drying of Ceramics Bricks Including Shrinkage. Defect Diffus. Forum 2015, 365, 106–111. [Google Scholar] [CrossRef]
  65. Comin, A.B.; Zaccaron, A.; de Souza Nandi, V.; Inocente, J.M.; Muller, T.G.; Dal Bó, A.G.; Bernardin, A.M.; Peterson, M. Measurement of Apparent Sintering Activation Energy for Densification of Clays. Clay Miner. 2021, 56, 299–305. [Google Scholar] [CrossRef]
  66. Dondi, M. Technological Characterisation of Clay Materials: Experimental Methods and Data Interpretation. Int. Ceram. J. 2003, 55–59. [Google Scholar]
  67. Zaccaron, A.; de Souza Nandi, V.; Dal Bó, M.; Arcaro, S.; Bernardin, A.M. The Behavior of Different Clays Subjected to a Fast-Drying Cycle for Traditional Ceramic Manufacturing. J. King Saud Univ.-Eng. Sci. 2022; in press. [Google Scholar] [CrossRef]
Figure 1. The geographical location of the study areas, referred to as A1, A2 and A3. Universal Transverse Mercator-UTM Projection. Datum Sirgas 2000. Zone 22S. Data source: IBGE (2021).
Materials 16 06466 g001
Figure 2. Simplex plan showing the formulations analyzed using a triaxial diagram.
Materials 16 06466 g002
Figure 3. X-ray diffractogram of the studied clays.
Materials 16 06466 g003
Figure 4. Thermal characterization of raw materials using differential scanning calorimetry (DSC) and thermogravimetric analysis (TGA). (───) Mass; (----) DSC.
Materials 16 06466 g004
Figure 5. Particle-size distribution of the clays determined by laser diffraction. (—) cumulative values; (∙∙∙∙) density distribution.
Materials 16 06466 g005
Figure 6. Position of studied clays on workability chart.
Materials 16 06466 g006
Figure 7. Visual analysis of parts with defects and surface roughness.
Materials 16 06466 g007
Figure 8. Drying and firing linear thermal shrinkage of the developed formulations processed by extrusion.
Materials 16 06466 g008
Figure 9. Response surface to technological characteristics—(a) total linear thermal shrinkage ( S h ), (b) water absorption ( W A ) and (c) mechanical resistance in compression ( σ ), and (d) triaxial diagram illustrating the working limit for ceramic blocks.
Materials 16 06466 g009
Table 1. Ceramic compositions of the selected clays according to the mixture design.
FormulationsRaw Material (%)
Clay 1 (A1)Clay 2 (A2)Clay (A3)
F110000
F201000
F300100
F450500
F550050
F605050
F733.333.333.3
F866.616.716.7
F916.766.616.7
F1016.716.766.6
Table 2. Chemical composition (by XRF) of clay samples.
Oxides (%)Raw Material (Mass%)
A1A2A3
SiO257.5785.3369.08
Al2O322.517.9818.20
CaO<0.05<0.050.13
Fe2O38.951.842.95
K2O0.310.340.55
MgO0.15ND0.26
MnO0.05<0.05<0.05
Na2O<0.05<0.050.07
P2O50.10<0.05<0.05
TiO21.120.721.50
LoI9.093.677.20
ND: not detected. LoI: loss on ignition.
Table 3. The content of the phases obtained from the evaluation of XRD patterns.
ClaysPhases (%)
QuartzKaoliniteHematiteAnatase
A132.6362.263.431.68
A284.3215.68--
A355.0140.81-4.18
Table 4. Cumulative fractions (10, 50 and 90%) and average particle diameters of the clays determined using the laser diffraction technique. The coarser particles of the clays that were retained by 45 µm (325 mesh, ASTM) using a sieving technique are also shown.
ClaysDiameter (µm)Daverage (µm)Coarse Particle (%)
10%50%90%
A10.874.4524.038.8118.0
A21.1221.63293.6085.9258.0
A30.845.2920.238.135.0
Table 5. Atterberg limits of the studied clays.
ClaysLLPLPI
A1614912
A2311615
A3513120
LL: liquid limit; PL: plastic limit; PI: plasticity index.
Table 6. Results for total linear thermal shrinkage ( S h ), water absorption ( W A ) and mechanical resistance in compression ( σ ).
Formulations S h (%) W A (%) σ (MPa)
F16.46 ± 0.8440.66 ± 0.931.20 ± 0.43
F24.03 ± 0.3815.59 ± 0.511.10 ± 0.45
F310.05 ± 0.6115.46 ± 0.644.69 ± 1.87
F45.18 ± 1.0923.81 ± 0.391.5 ± 0.74
F59.41 ± 0.5523.73 ± 1.752.31 ± 0.84
F68.90 ± 0.5415.46 ± 0.542.54 ± 0.74
F78.46 ± 0.5521.30 ± 0.581.43 ± 0.36
F86.70 ± 0.3927.53 ± 0.971.61 ± 0.65
F97.87 ± 0.5418.44 ± 0.411.44 ± 0.59
F109.48 ± 0.6918.20 ± 0.611.91 ± 0.50
Table 7. Analysis of variance (ANOVA) for total linear thermal shrinkage ( S h ), water absorption ( W A ) and mechanical resistance in compression ( σ ).
( S h )
ModelFpR2
Linear934.58<0.0010.73
Quadratic71.69<0.0010.84
Special Cubic3.480.06290.84
Cubic77.44<0.0010.90
( W A )
ModelFpR2
Linear1068.30<0.0010.94
Quadratic128.82<0.0010.98
Special Cubic14.88<0.0010.98
Cubic22.35<0.0010.99
( σ )
ModelFpR2
Linear60.10<0.0010.47
Quadratic7.76<0.0010.55
Special Cubic7.210.00810.57
Cubic7.51<0.0010.61
F = F-value (statistical significance); p = p-value (confidence level); R2 = determination coefficient (adjust).
Disclaimer/Publisher’s Note: The statements, opinions and data contained in all publications are solely those of the individual author(s) and contributor(s) and not of MDPI and/or the editor(s). MDPI and/or the editor(s) disclaim responsibility for any injury to people or property resulting from any ideas, methods, instructions or products referred to in the content.

