
From Bioresources to Thermal Insulation Materials: Synthesis and Properties of Two-Component Open-Cell Spray Polyurethane Foams Based on Bio-Polyols from Used Cooking Oil
 , ,
, ,
Abstract
:1. Introduction
2. Materials and Methods
2.1. Materials
2.2. Synthesis of Epoxidized UCO
2.3. Synthesis of UCO-Based Bio-Polyol via the Epoxidation/Oxirane Ring-Opening Method
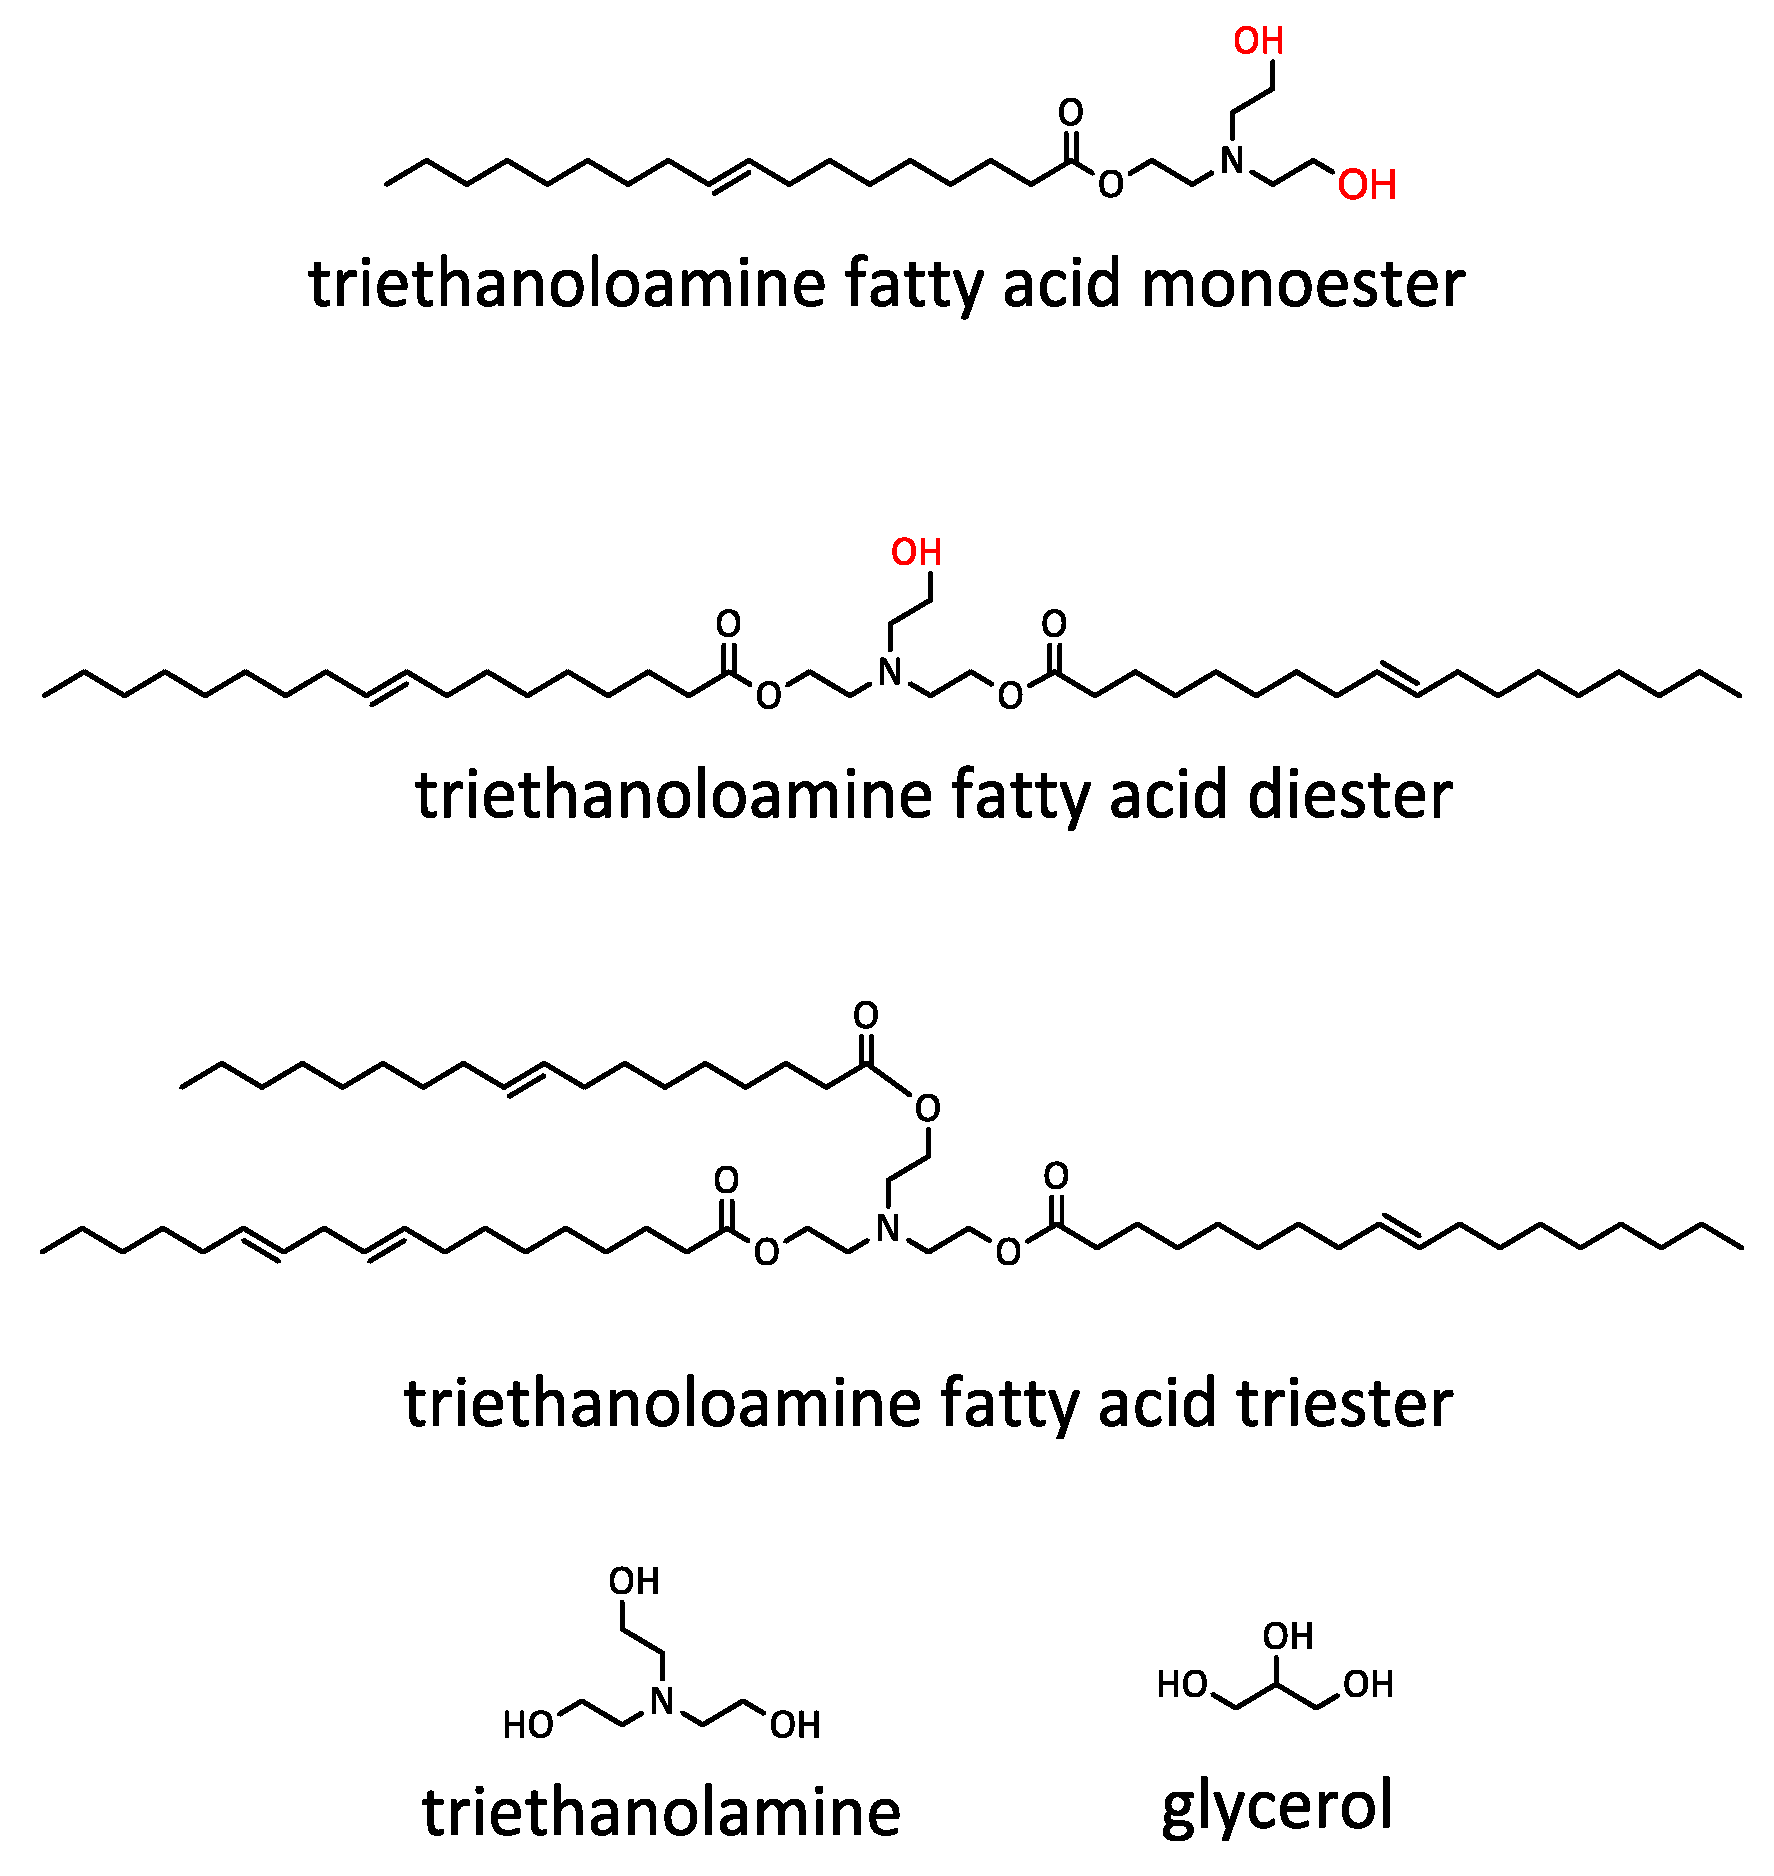
2.4. Synthesis of UCO-Based Bio-Polyol (BP_TEA) Using the Transesterification Reaction
2.5. Development of ocSPF Systems at Laboratory Scale
2.6. Manufacturing ocSPF Using a High-Pressure Spray Machine
2.7. Characterization
2.7.1. Raw Materials Analysis
2.7.2. Measurement of Polyurethane Foams Properties
3. Results and Discussion
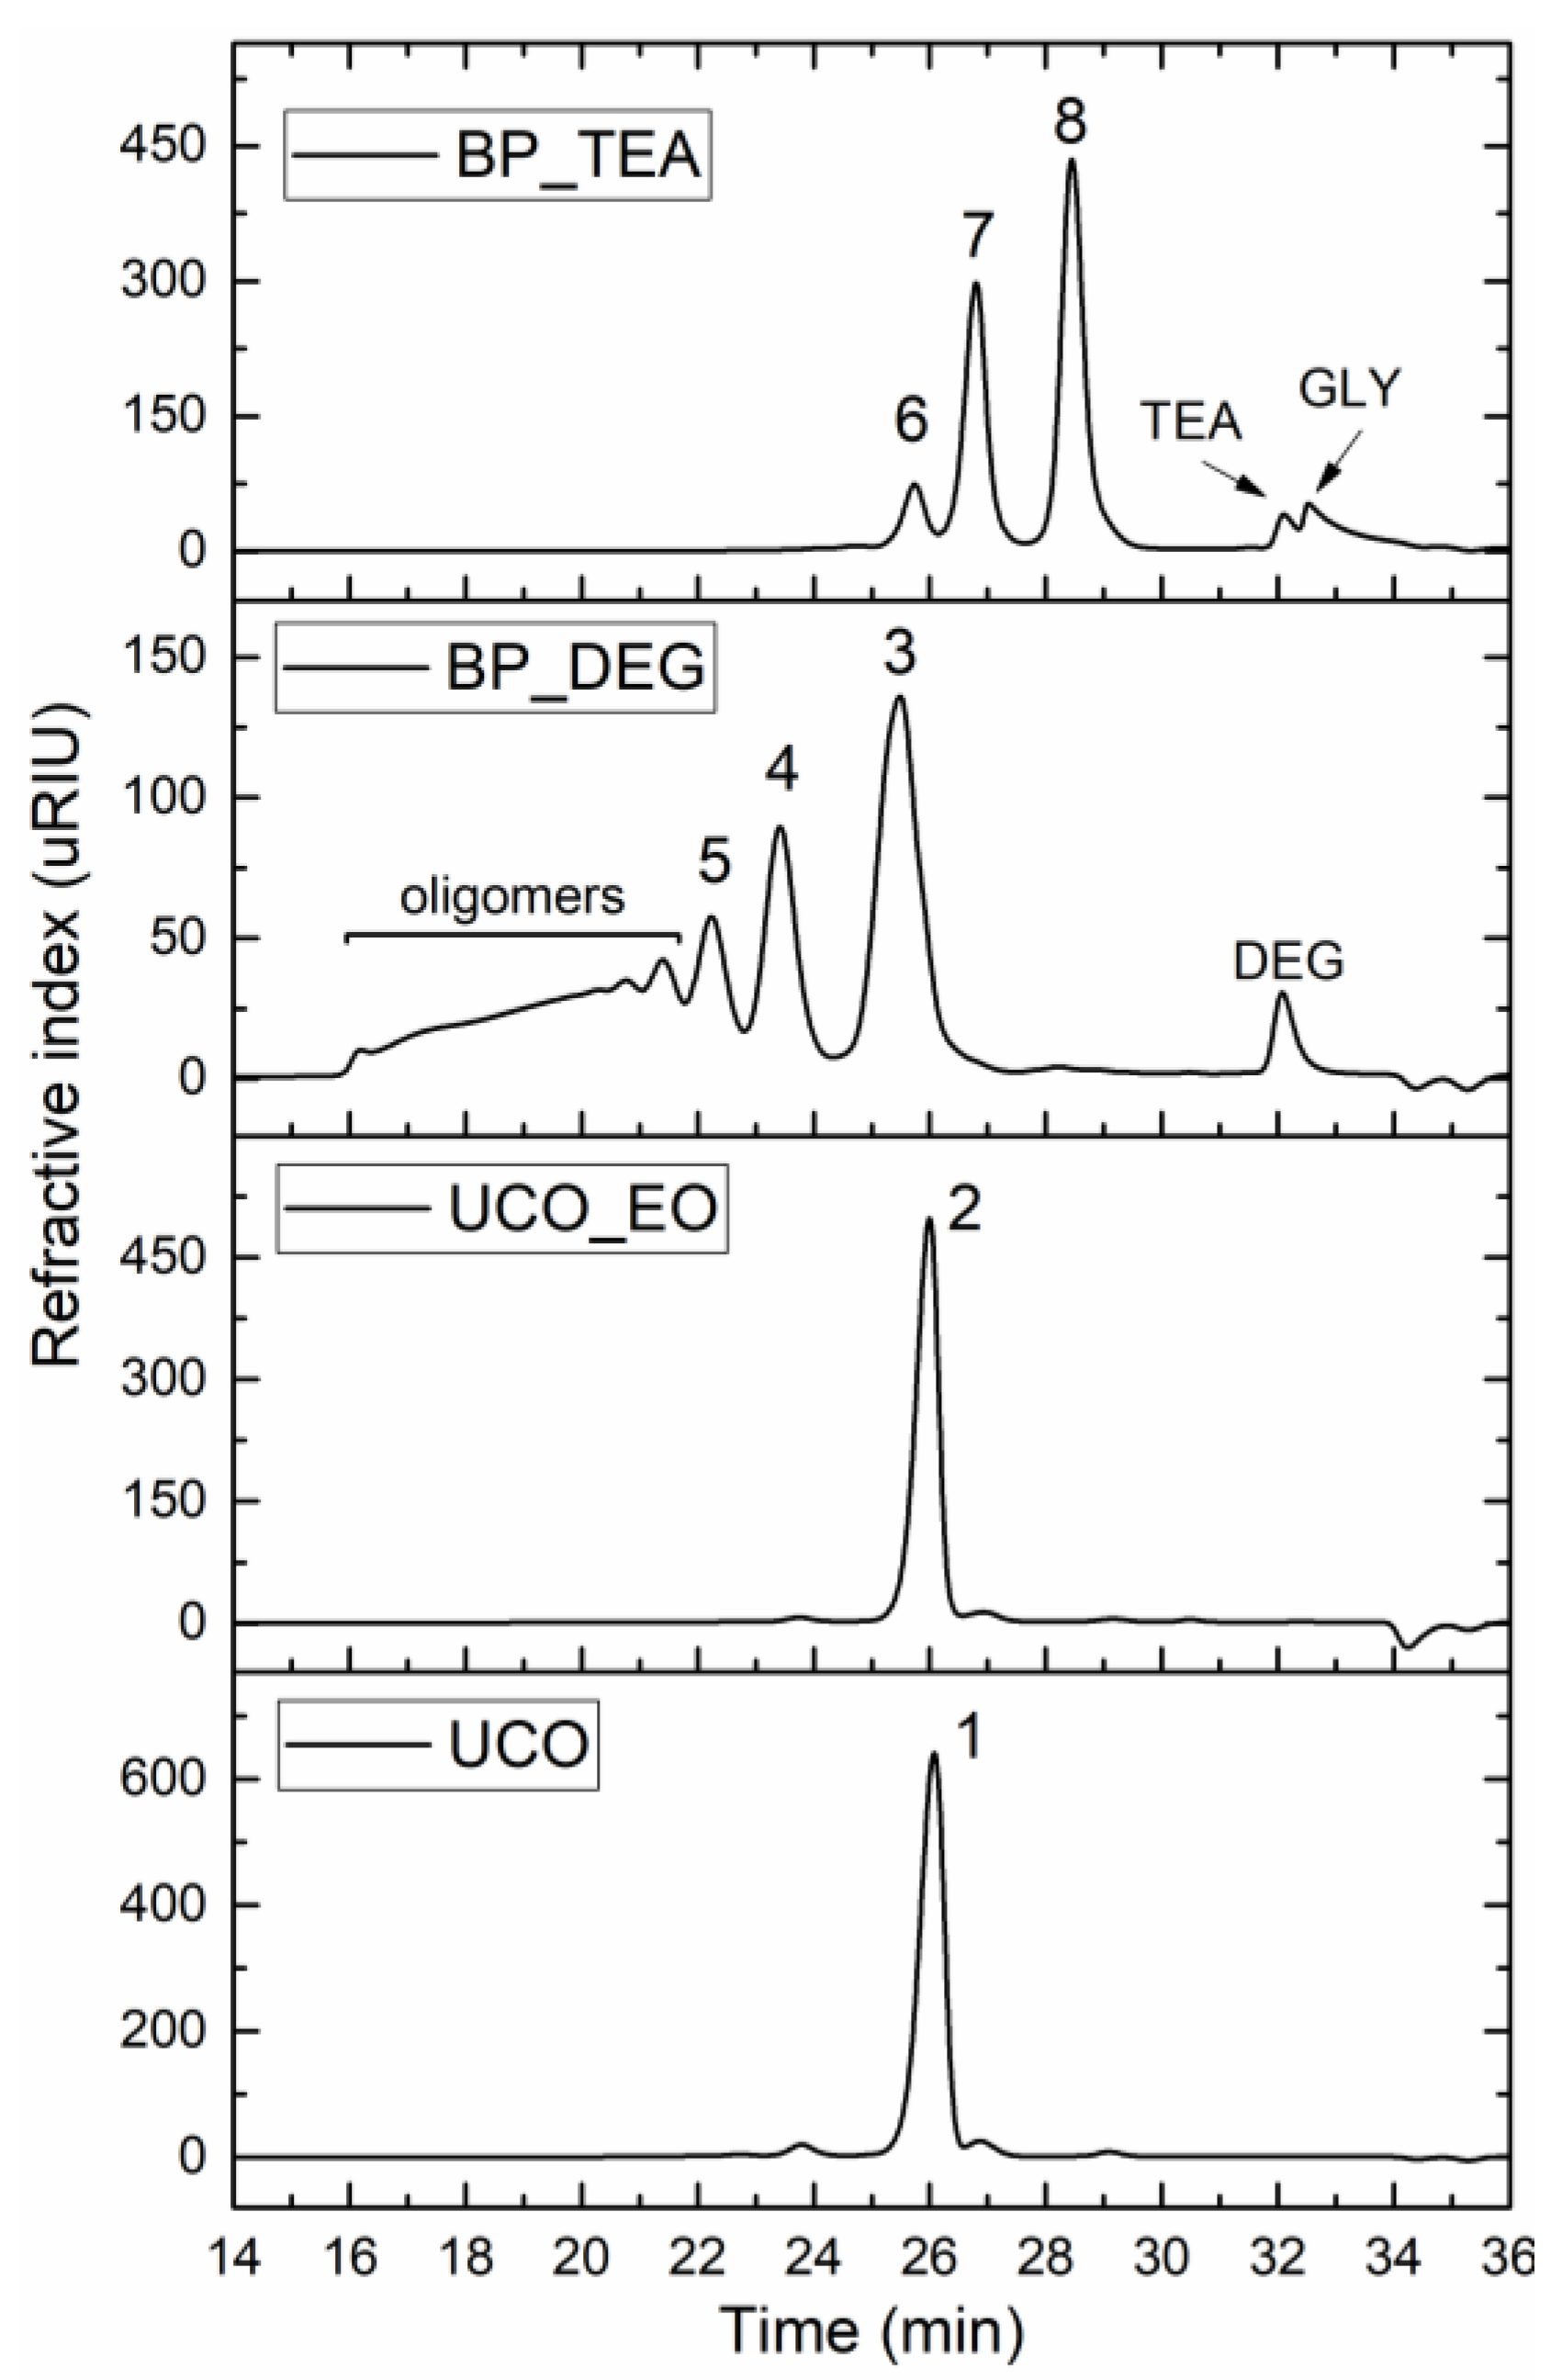
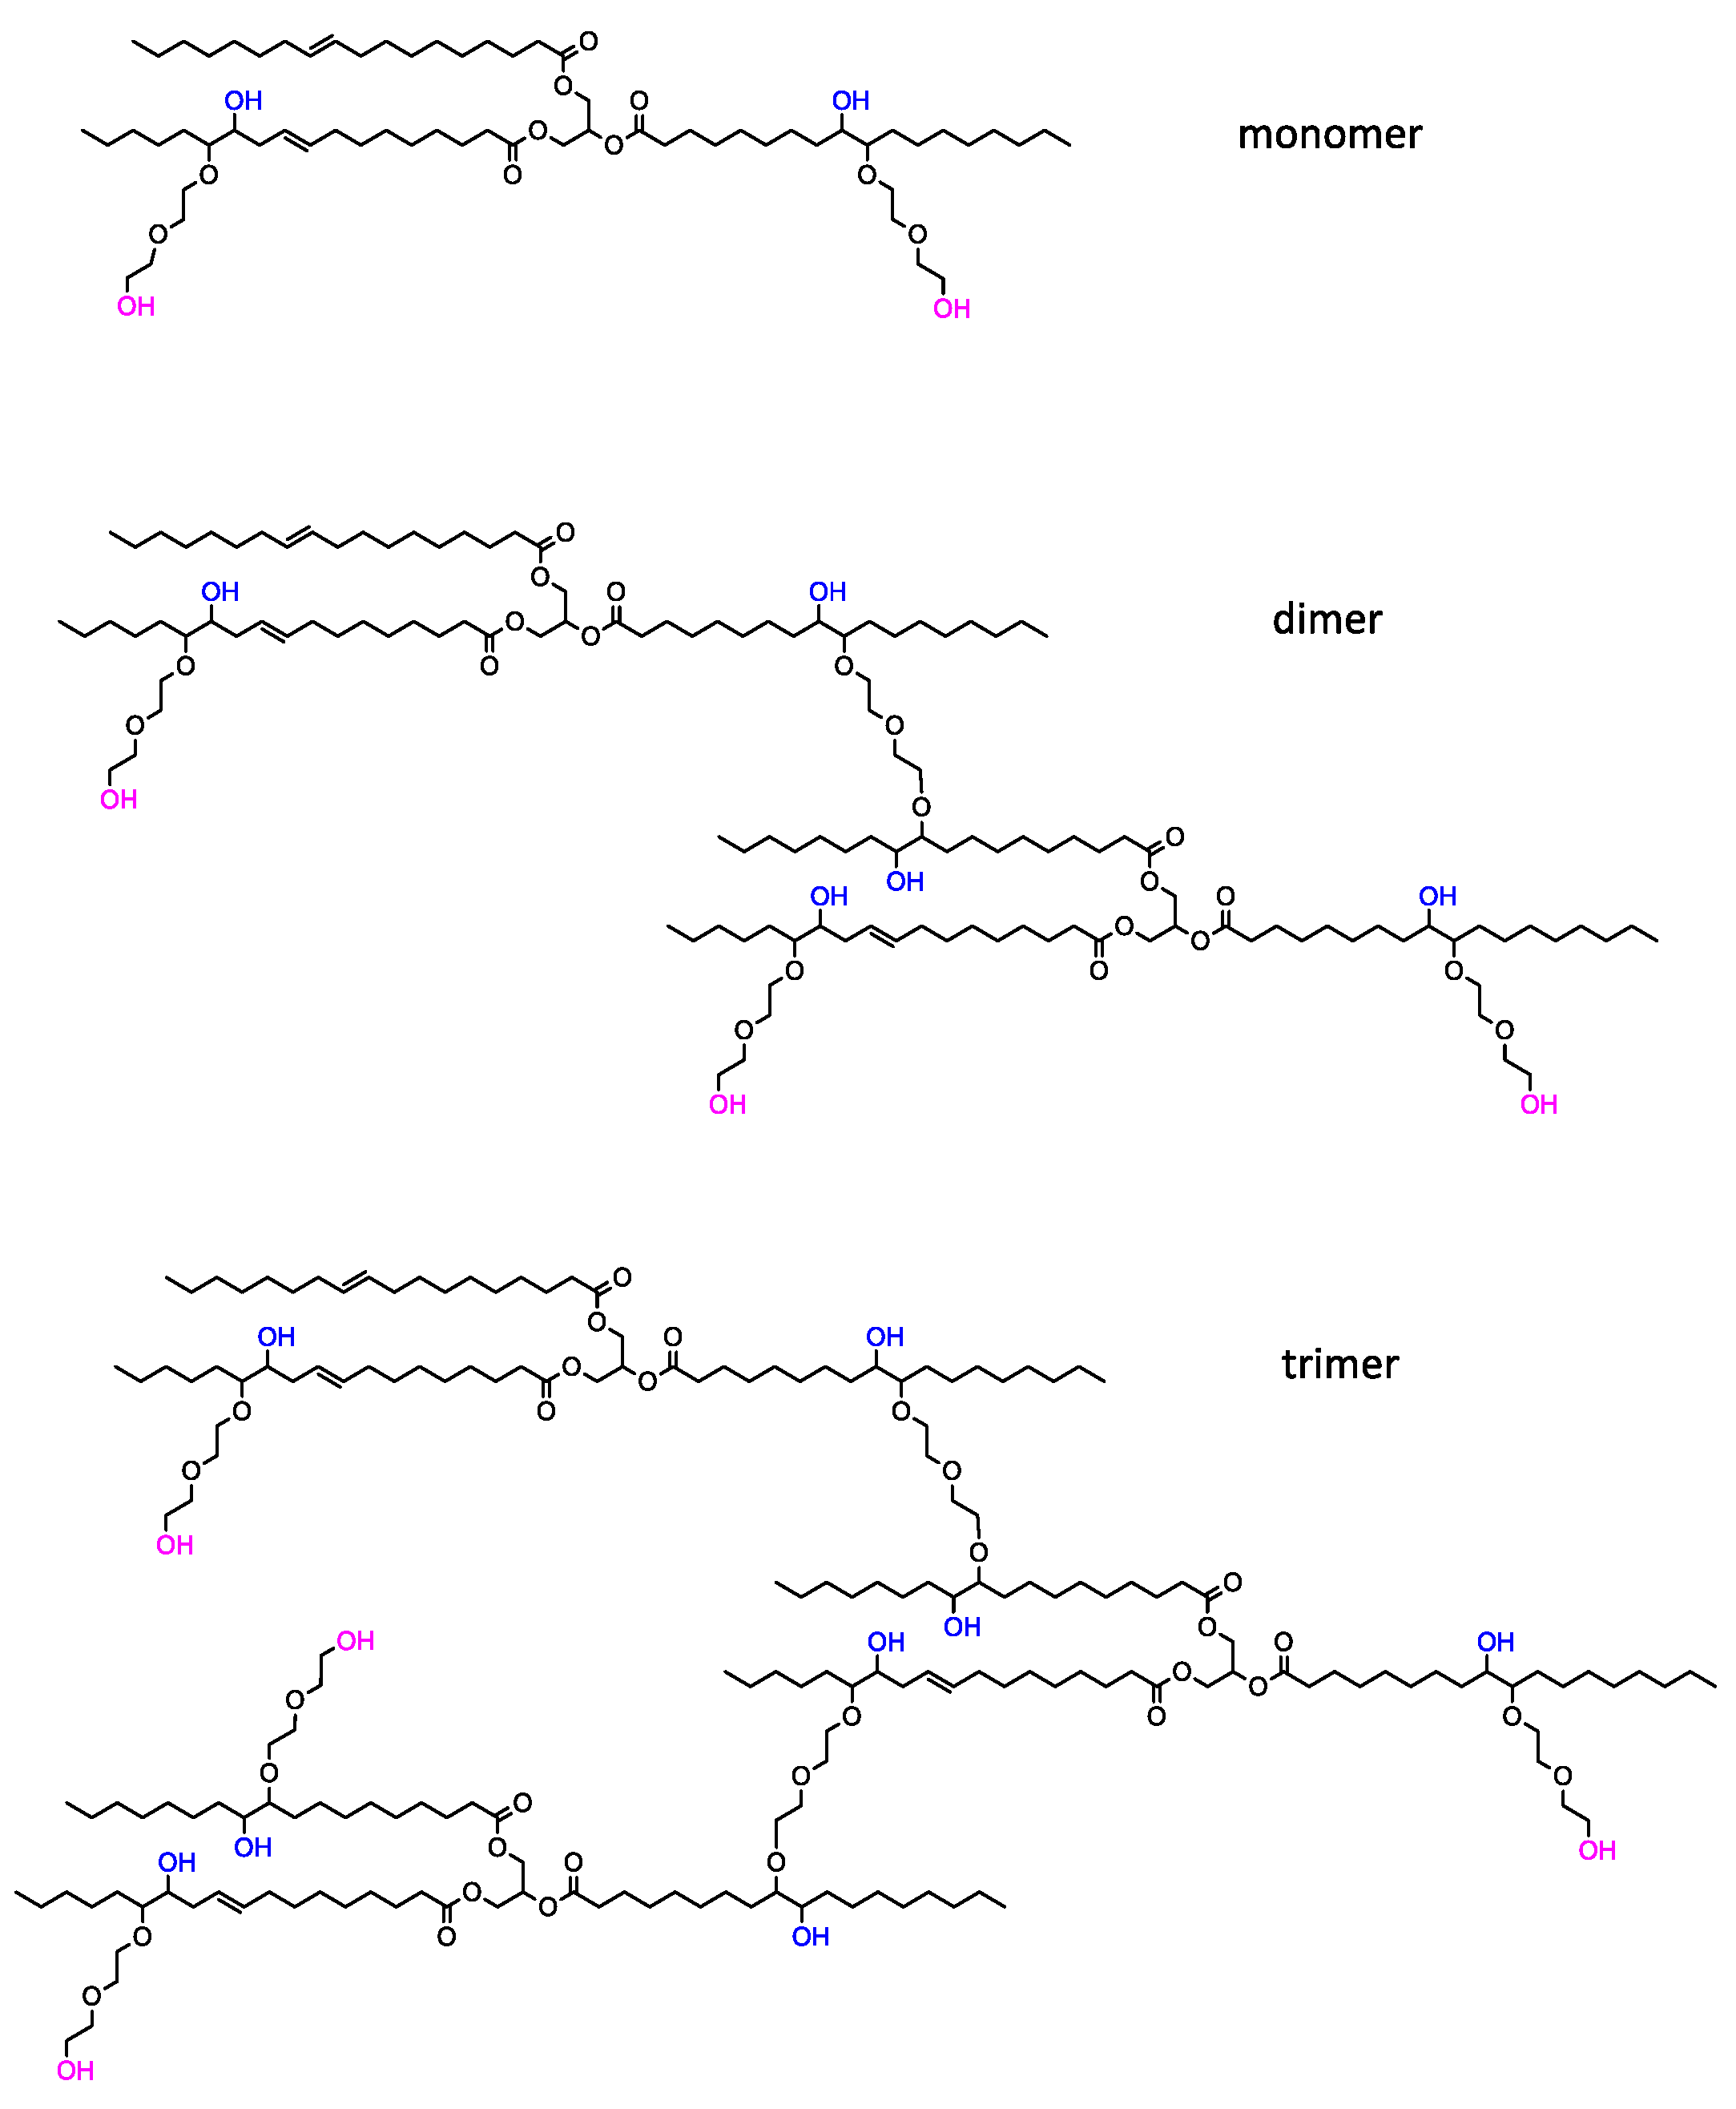
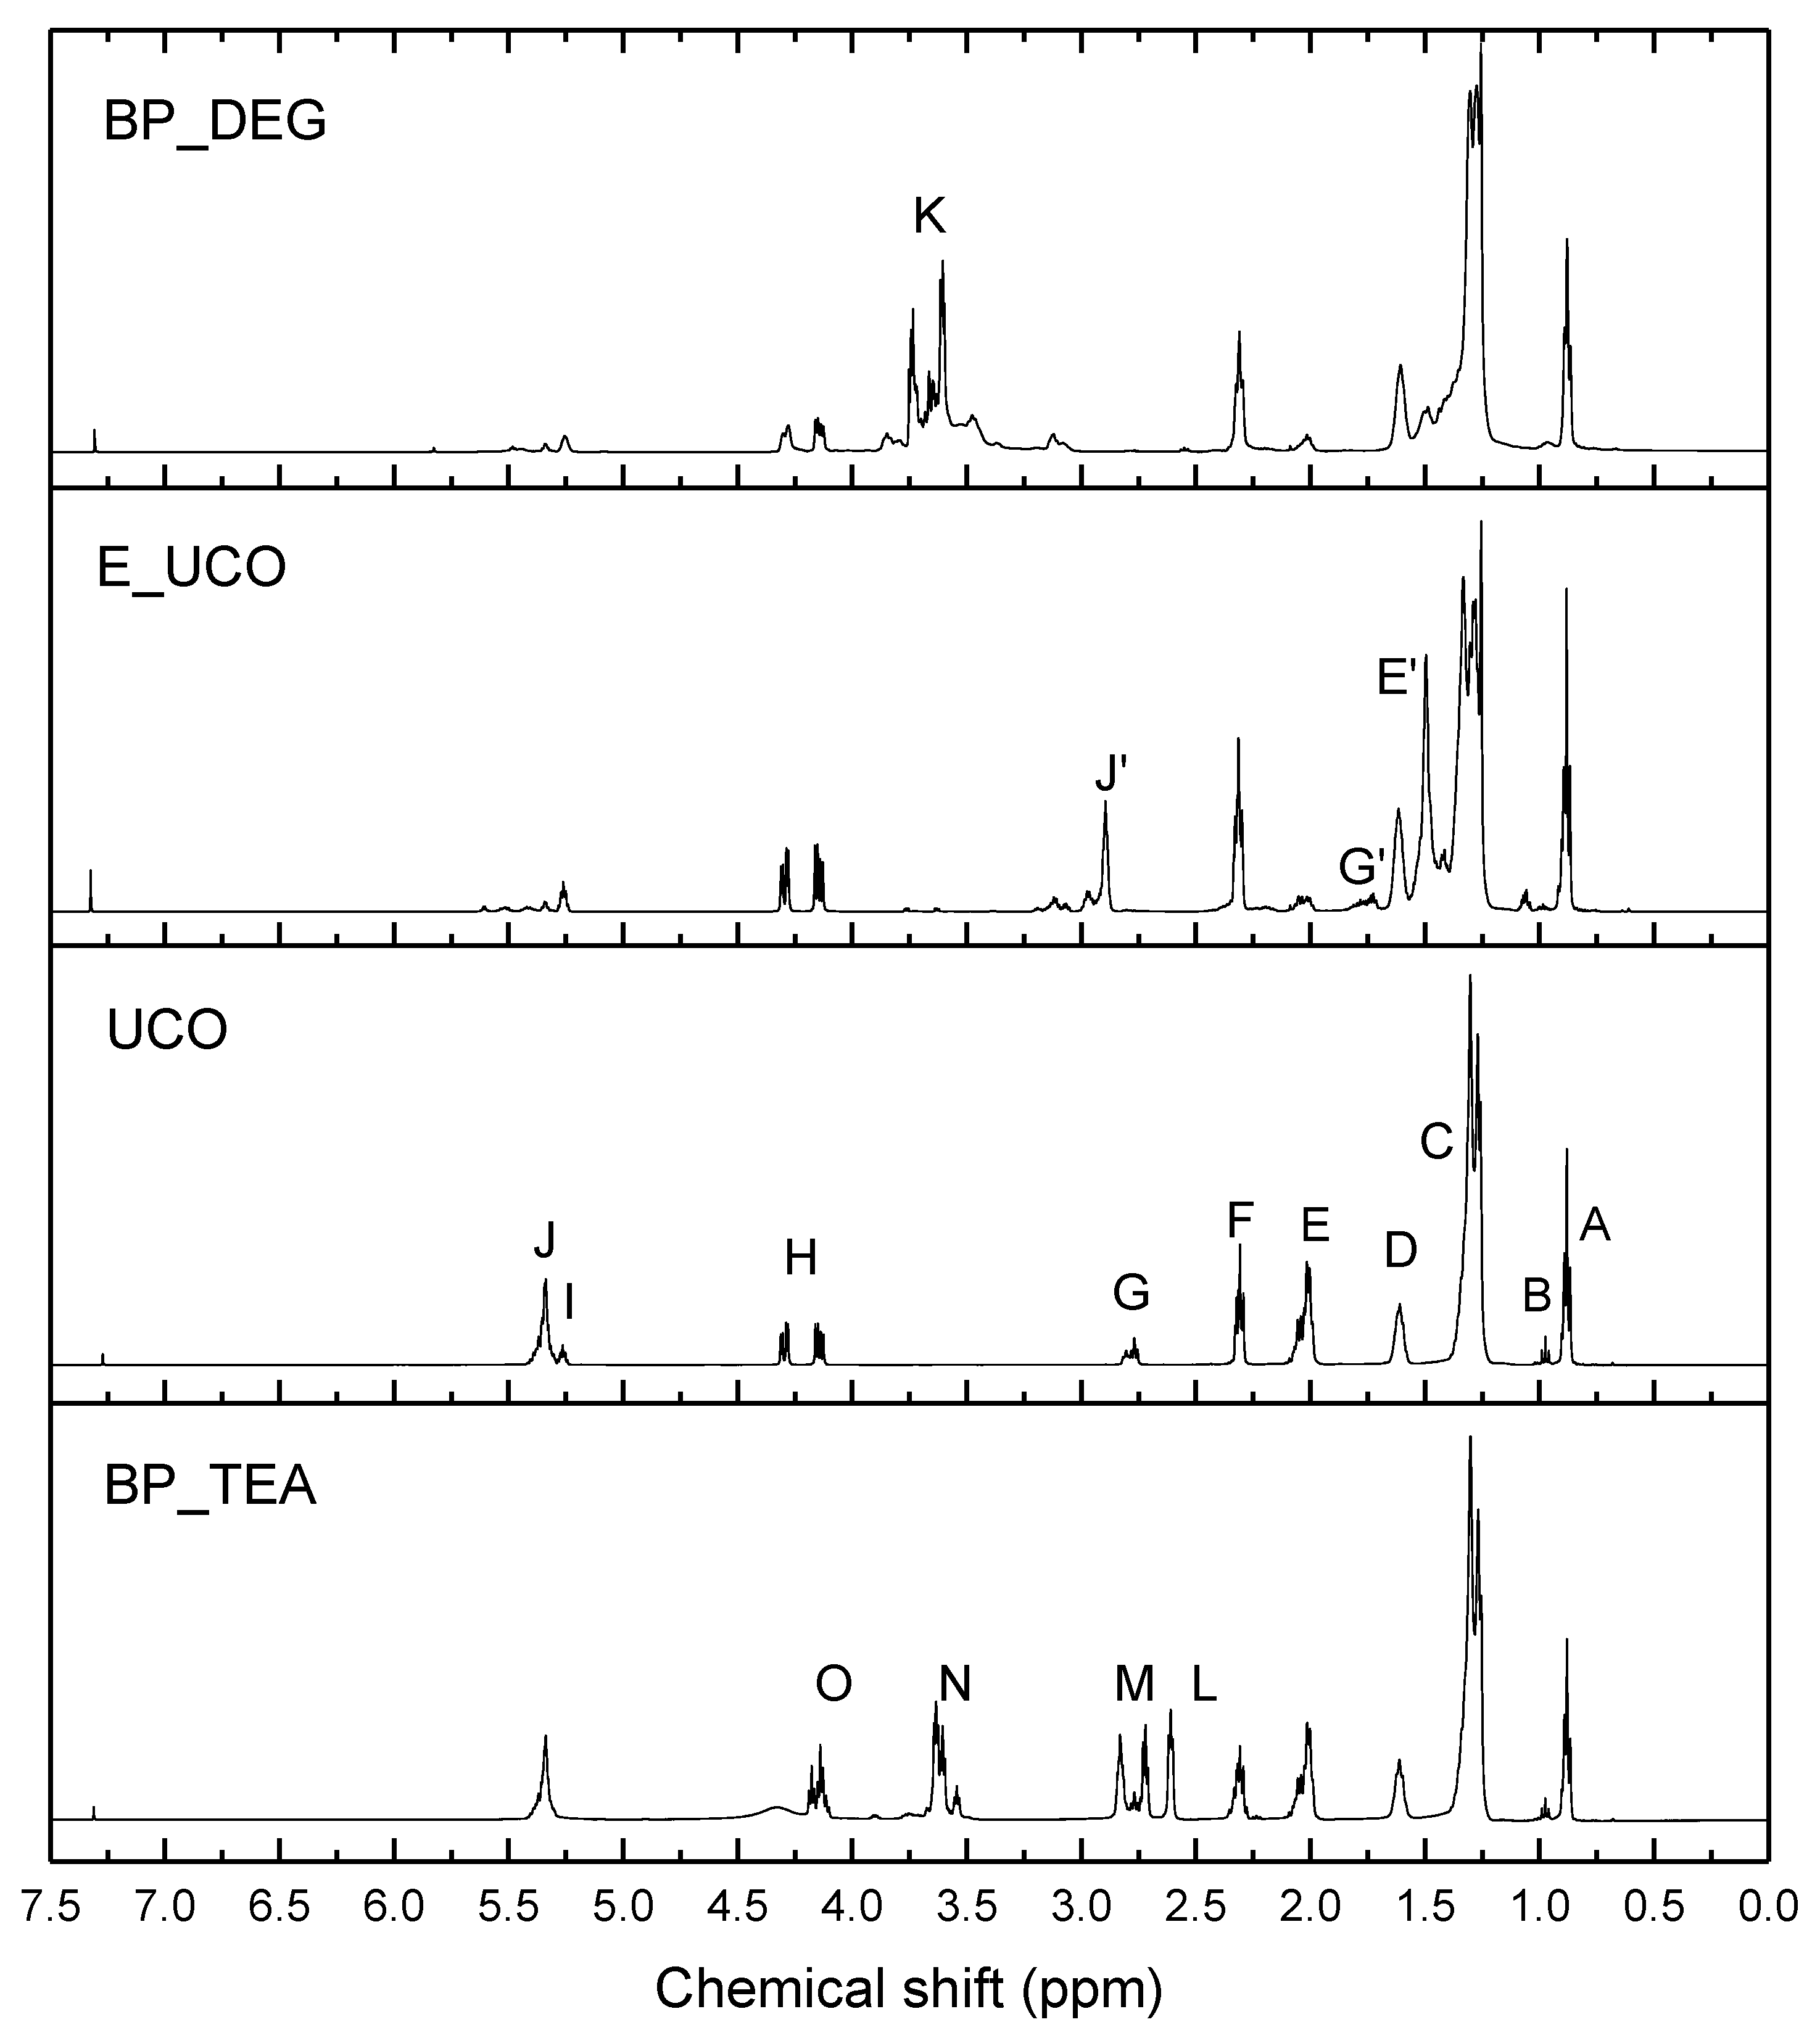
3.1. Bio-Polyol Synthesis
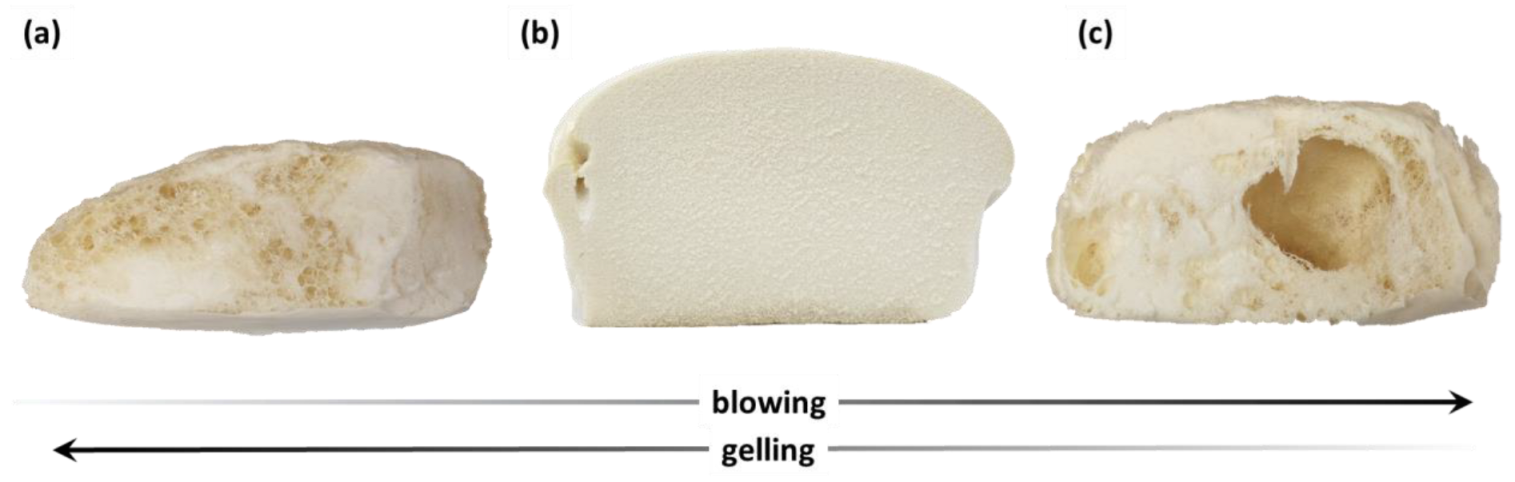
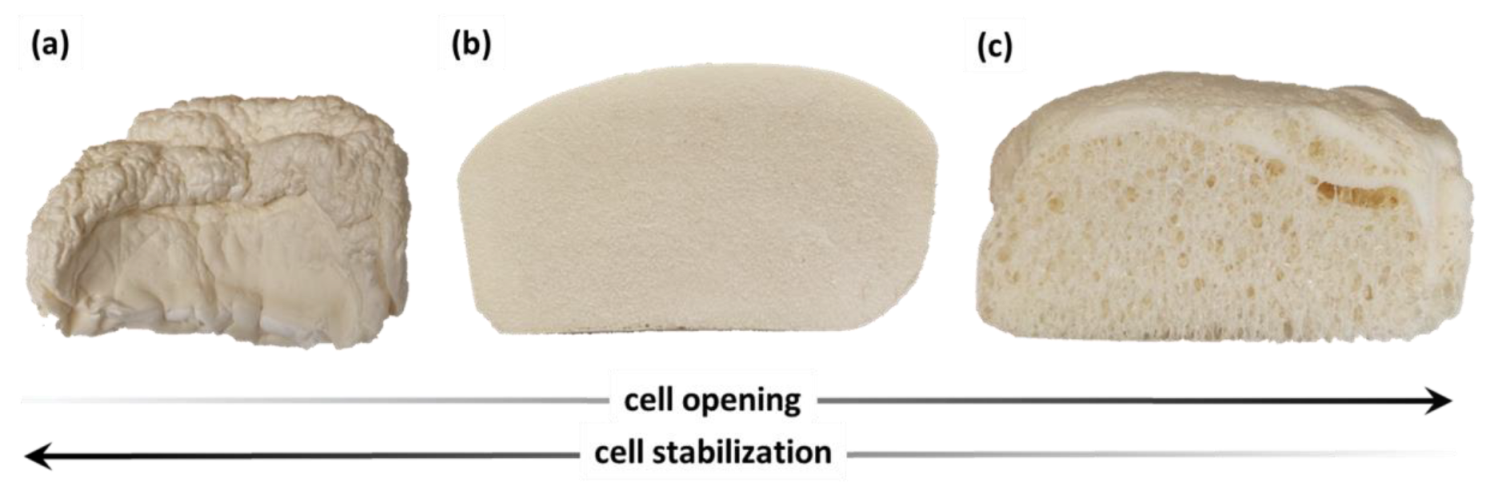
3.2. Polyurethane Foam Synthesis on Laboratory Scale
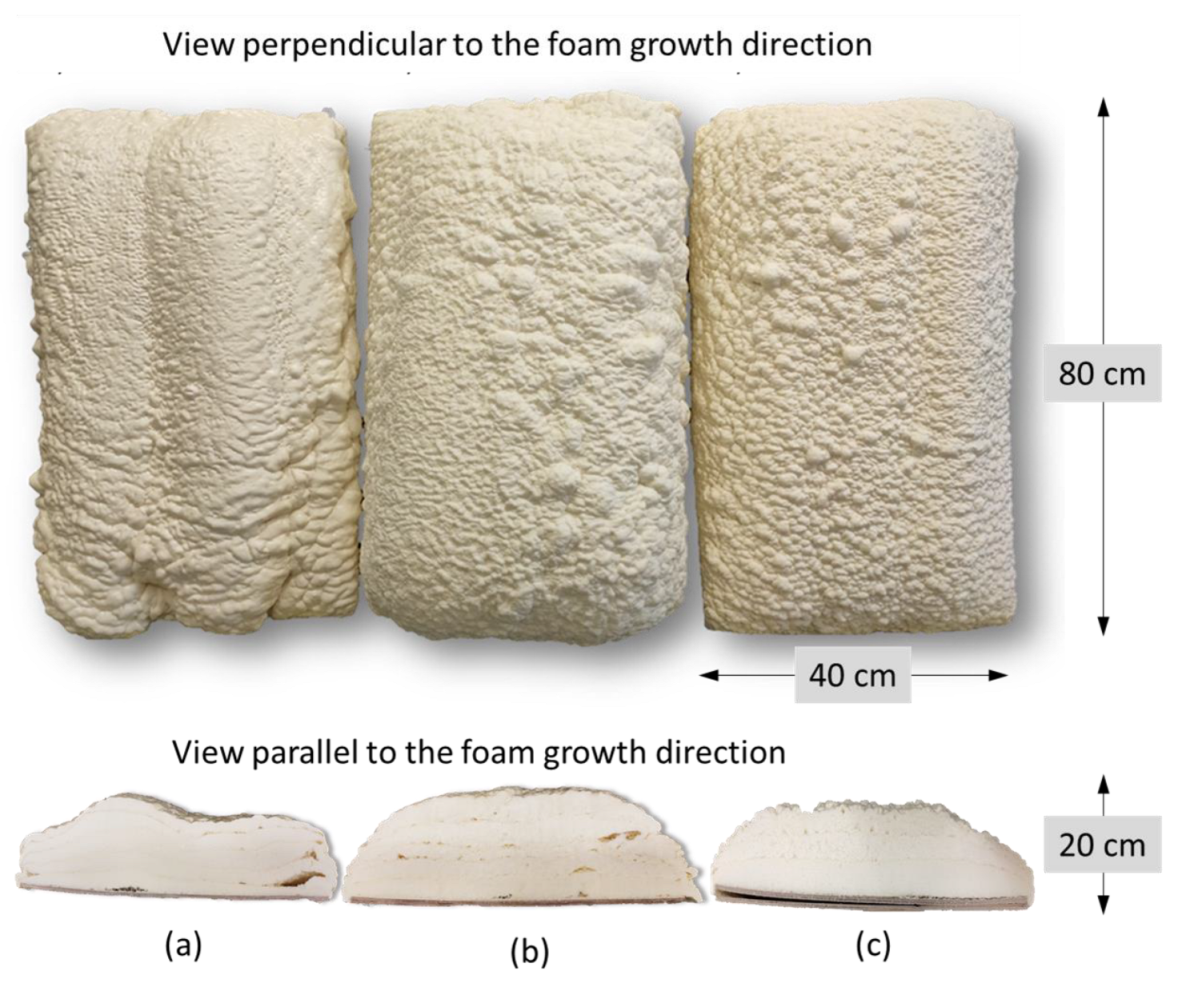
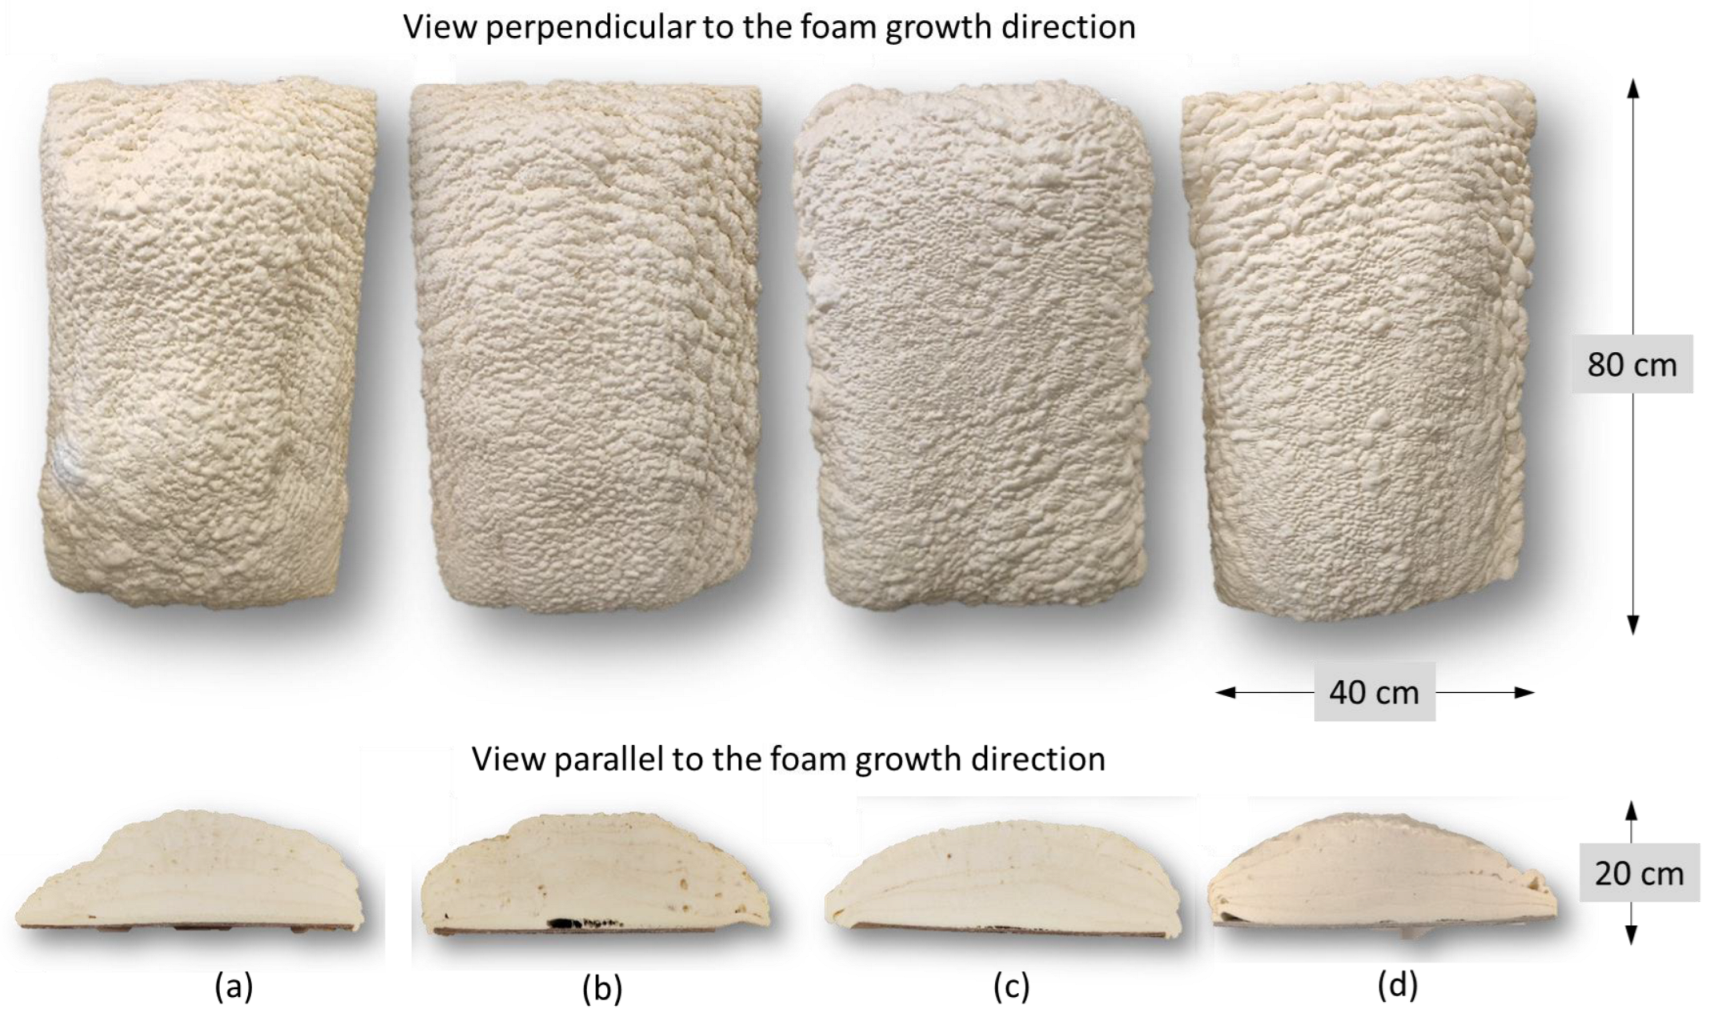
3.3. Polyurethane Foam Synthesis Using Industrial Spray Machine
4. Conclusions
Author Contributions
Funding
Institutional Review Board Statement
Informed Consent Statement
Data Availability Statement
Acknowledgments
Conflicts of Interest
References
- Wood, R.D. Center for the Polyurethanes Industry Summary of Unpublished Industrial Hygiene Studies Related to the Evaluation of Emissions of Spray Polyurethane Foam Insulation. J. Occup. Environ. Hyg. 2017, 14, 681–682. [Google Scholar] [CrossRef]
- Bello, A.; Carignan, C.C.; Xue, Y.; Stapleton, H.M.; Bello, D. Exposure to Organophosphate Flame Retardants in Spray Polyurethane Foam Applicators: Role of Dermal Exposure. Environ. Int. 2018, 113, 55–65. [Google Scholar] [CrossRef]
- ISO 8873; Rigid Cellular Plastics—Spray-Applied Polyurethane foam for Thermal Insulation. ISO (International Organization for Standardization): Geneva, Switzerland, 2016.
- ASTM Standards C1029-96; Standard Specification for Spray-Applied Rigid Cellular Polyurethane Thermal Insulation. ASTM: West Conshohocken, PA, USA, 2017.
- ASTM Standards D7425; Standard Specification for Spray Polyurethane Foam Used for Roofing Applications. ASTM: West Conshohocken, PA, USA, 2019.
- ULC-S705.1; Standard for Thermal Insulation—Spray Applied Rigid Polyurethane Foam, Medium Density, Material—Specification. ULC (Underwriters Laboratories of Canada) Standards: Ottawa, ON, Canada, 1998.
- ULC 712.1; Standard for Thermal Insulation—Light Density, Open Cell Spray Applied Semi-rigid Polyurethane. ULC (Underwriters Laboratories of Canada): Ottawa, ON, Canada, 2010.
- EN-14315; Thermal Insulating Products for Buildings—In-Situ Formed Sprayed Rigid Polyurethane (PUR) and Polyisocyanurate (PIR) foam Products. European Standards, 2013. Available online: https://standards.iteh.ai/catalog/standards/cen/da845b1d-7d84-459f-9305-b15c355c096a/en-14315-1-2013 (accessed on 23 June 2022).
- PU Europe Factsheet N°22—Closed and Open Cell Spray Polyurethane Foam, Federation of European Rigid Polyurethane Foam Association. Available online: https://www.pu-europe.eu/fileadmin/documents/Factsheets_public/Factsheet_22_Differences_between_closed-cell_and_open-cell_spray_polyurethane__PU__foam.pdf (accessed on 23 June 2022).
- ACC American Chemistry Council—Spray Foam Insulation. Available online: https://www.americanchemistry.com/content/download/5277/file/Spray-Foam-Insulation-A-Smart-Sustainable-and-Energy-Savings-Solution-for-Your-Home.pdf (accessed on 20 May 2022).
- Mirasol, S.; Blank, W. Open Cell Rigid Polyurethane Spray Foam Having Improved Fire Retardancy; WIPO: Karlsruhe, Germany, 2010. [Google Scholar]
- Ionescu, M. Chemistry and Technology of Polyols for Polyurethanes. Milhail Ionescu. Rapra Technology, Shrewsbury, UK. Polym. Int. 2007, 56, 820. [Google Scholar] [CrossRef]
- PCC Rokopol RF151 Technical Information. Available online: https://www.products.pcc.eu/en/id/8560/rokopol-rf151-4/ (accessed on 26 June 2022).
- PCC Rokopol RF152v Technical Information. Available online: https://www.products.pcc.eu/en/id/244435/rokopol-rf152v-4/ (accessed on 26 June 2022).
- PCC Technical Data Sheet—Crossin®450. Available online: https://www.products.pcc.eu/wp-content/uploads/import/broszura/2021-09-28/797b7ada-fb7f-4aaf-b210-ac8f00ded668/crossin-450-open-cell-spray-foam-spray-polyurethane-foam_broszura_en.pdf?post_id=1250051 (accessed on 5 September 2023).
- Purinova New Technology Polyester Polyols. Available online: https://purinova.com/images/upload/katalog/Purinova-New-Technology-Polyester-Polyols.pdf (accessed on 20 May 2022).
- Wolek, S.; Warren, K.; Schreiner, L. Ethoxylated Vegetable Oils in Low Density Spray Foam Formulations. Patent WO 2016186830 A1, 3 May 2016. [Google Scholar]
- PCC Rokopol RF551 Technical Information. Available online: https://www.products.pcc.eu/en/id/956/rokopol-rf551-3/ (accessed on 26 June 2022).
- PCC Rokopol GS484 Technical Information. Available online: https://www.products.pcc.eu/en/id/16778/rokopol-gs484-4/ (accessed on 26 June 2022).
- PCC SyncoPol AR 350—Technical Information. Available online: https://www.products.pcc.eu/en/id/1249582/syncopol-ar-350-3/ (accessed on 26 June 2022).
- Sardon, H.; Mecerreyes, D.; Basterretxea, A.; Avérous, L.; Jehanno, C. From Lab to Market: Current Strategies for the Production of Biobased Polyols. ACS Sustain. Chem. Eng. 2021, 9, 10664–10677. [Google Scholar] [CrossRef]
- Singh, I.; Samal, S.K.; Mohanty, S.; Nayak, S.K. Recent Advancement in Plant Oil Derived Polyol-Based Polyurethane Foam for Future Perspective: A Review. Eur. J. Lipid Sci. Technol. 2020, 122, 1–23. [Google Scholar] [CrossRef]
- Maisonneuve, L.; Chollet, G.; Grau, E.; Cramail, H. Vegetable Oils: A Source of Polyols for Polyurethane Materials. OCL Oilseeds Fats Crop. Lipids 2016, 23, D508. [Google Scholar] [CrossRef]
- Kurańska, M.; Malewska, E. Waste Cooking Oil as Starting Resource to Produce Bio-Polyol—Analysis of Transesteryfication Process Using Gel Permeation Chromatography. Ind. Crops Prod. 2021, 162, 113294. [Google Scholar] [CrossRef]
- Peyrton, J.; Chambaretaud, C.; Sarbu, A.; Avérous, L. Biobased Polyurethane Foams Based on New Polyol Architectures from Microalgae Oil. ACS Sustain. Chem. Eng. 2020, 8, 12187–12196. [Google Scholar] [CrossRef]
- Faris, A.H.; Mohamad, N.; Rahim, A. Preparation and Characterization of Lignin Polyols from the Residues of Oil Palm Empty Fruit Bunch. BioResources 2015, 10, 7339–7352. [Google Scholar] [CrossRef]
- Kirpluks, M.; Vanags, E.; Abolins, A.; Fridrihsone, A.; Cabulis, U. Chemo-Enzymatic Oxidation of Tall Oil Fatty Acids as a Precursor for Further Polyol Production. J. Clean. Prod. 2019, 215, 390–398. [Google Scholar] [CrossRef]
- Feng, G.; Hu, L.; Ma, Y.; Jia, P.; Hu, Y.; Zhang, M.; Liu, C.; Zhou, Y. An Efficient Bio-Based Plasticizer for Poly (Vinyl Chloride) from Waste Cooking Oil and Citric Acid: Synthesis and Evaluation in PVC Films. J. Clean. Prod. 2018, 189, 334–343. [Google Scholar] [CrossRef]
- Fernandes, F.C.; Kirwan, K.; Lehane, D.; Coles, S.R. Epoxy Resin Blends and Composites from Waste Vegetable Oil. Eur. Polym. J. 2017, 89, 449–460. [Google Scholar] [CrossRef]
- Mannu, A.; Garroni, S.; Porras, J.I.; Mele, A. Cooking Oil Recycling. Processes 2020, 366, 1–13. [Google Scholar]
- Huntsman Agribalance—Technical Data Sheet. Available online: https://huntsmanbuildingsolutions.com/en-US/sites/en_us/files/2022-03/20.00100AgribalanceTDS_EN_Web.pdf (accessed on 30 June 2022).
- Huntsman Heat Lok Soya Hfo—Technical Data Sheet. Available online: https://huntsmanbuildingsolutions.com/en-CA/sites/en_ca/files/2021-01/HuntsmanBuildingSolutions%28Demilec%29HeatlokSoyaHFOTechnicalDataSheet.pdf (accessed on 5 September 2023).
- Yakushin, V.; Stirna, U.; Sevastyanova, I.; Deme, L.; Zeltiņš, V. Properties of Sprayed Polyurethane and Polyisocyanurate Foams Obtained from Vegetable Oil Polyols. Mater. Sci. 2008, 14, 333–336. [Google Scholar]
- Yakushin, V.; Cabulis, U.; Fridrihsone, V.; Kravchenko, S.; Pauliks, R. Properties of Polyurethane Foam with Fourth-Generation Blowing Agent. E-Polymers 2021, 21, 763–769. [Google Scholar] [CrossRef]
- Stirna, U.; Fridrihsone-Girone, A.; Yakushin, V.; Vilsone, D. Processing and Properties of Spray-Applied, 100% Solids Polyurethane Coatings from Rapeseed Oil Polyols. J. Coat. Technol. Res. 2014, 11, 409–420. [Google Scholar] [CrossRef]
- Wada, H.; Odani, K.; Takayasu, T.; Yasuda, Y. A Method for Producing an Open Cell Rigid Polyurethane Foam; WIPO: Karlsruhe, Germany, 2021. [Google Scholar]
- Wada, H.; Odani, K.; Tanabe, T.; Yasuda, Y. A Method for Producing an Open Cell Rigid Polyurethane Foam. WO 2018/096101 A1. 2018. Available online: https://patentscope.wipo.int/search/en/detail.jsf?docId=WO2018096101 (accessed on 5 September 2023).
- Zhang, G.; Wu, Y.; Chen, W.; Han, D.; Lin, X.; Xu, G.; Zhang, Q. Open-Cell Rigid Polyurethane Foams from Peanut Shell-Derived Polyols Prepared under Different Post-Processing Conditions. Polymers 2019, 11, 1392. [Google Scholar] [CrossRef] [PubMed]
- Wang, G.; Yang, T. Preparation of Open Cell Rigid Polyurethane Foams and Modified with Organo-Kaolin. J. Cell. Plast. 2020, 56, 435–447. [Google Scholar] [CrossRef]
- Harikrishnan, G.; Patro, T.U.; Khakhar, D.V. Polyurethane Foam—Clay Nanocomposites: Nanoclays as Cell Openers. Ind. Eng. Chem. Res. 2006, 45, 7126–7134. [Google Scholar] [CrossRef]
- Khazabi, M.; Gu, R.; Sain, M. Fiber Reinforced Soy-Based Polyurethane Spray Foam Insulation. Part 1: Cell Morphologies. BioResources 2011, 6, 3757–3774. [Google Scholar] [CrossRef]
- Polaczek, K.; Kurańska, M.; Prociak, A. Open-Cell Bio-Polyurethane Foams Based on Bio-Polyols from Used Cooking Oil. J. Clean. Prod. 2022, 359, 132107. [Google Scholar] [CrossRef]
- Dutta, A.S. Polyurethane Foam Chemistry. In Recycling of Polyurethane Foams; Elsevier: Amsterdam, The Netherlands, 2018; pp. 17–27. ISBN 9780323511346. [Google Scholar]
- Ding, H.; Huang, K.; Li, S.; Xu, L.; Xia, J.; Li, M. Synthesis of a Novel Phosphorus and Nitrogen-Containing Bio-Based Polyol and Its Application in Flame Retardant Polyurethane Foam. J. Anal. Appl. Pyrolysis 2017, 128, 102–113. [Google Scholar] [CrossRef]
- Polish Standards: PN-93/C-89052.03; Polyethers for Polyurethanes. Test Methods. Determination of the Hydroxyl Number. Polish Committee for Standardization: Warsaw, Poland, 1985.
- Polish Standards: PN-87/C-89085/13; Determination of the Epoxide Number and Epoxide Equivalent. Polish Committee for Standardization: Warsaw, Poland, 1987.
- Polish Standards: PN-81/C-04959; Determining the Water Content by the Karl Fischer Method in Organic and Inorganic Products. Polish Committee for Standardization: Warsaw, Poland, 1981.
- ISO4590; Rigid Cellular Plastics—Determination of the Volume Percentage of Open Cells and of Closed Cells. ISO (International Organization for Standardization): Geneva, Switzerland, 2016.
- ISO844; Rigid Cellular Plastics—Determination of Compression Properties. ISO (International Organization for Standardization): Geneva, Switzerland, 2014.
- ISO 845; Cellular Plastics and Rubbers—Determination of Apparent Density. ISO (International Organization for Standardization): Geneva, Switzerland, 2006.
- ASTM C 421-08; Standard Test Method for Tumbling Friability of Preformed Block-Type and Preformed Pipe-Covering-Type Thermal Insulation. ASTM: West Conshohocken, PA, USA, 2014.
- Polish Standards: PN-EN 12086:2013-07; Determination of Water Vapour Transmission Properties—Cup Method. Polish Committee for Standardization: Warsaw, Poland, 2013.
- ISO 4589-2; Plastics—Determination of Burning Behaviour by Oxygen Index—Part 2: Ambient-Temperature Test. ISO (International Organization for Standardization): Geneva, Switzerland, 2017.
- Choe, E.; Min, D.B. Chemistry of Deep-Fat Frying Oils. J. Food Sci. 2007, 72, R77–R86. [Google Scholar] [CrossRef] [PubMed]
- Moser, B.R.; Cermak, S.C.; Doll, K.M.; Kenar, J.A.; Sharma, B.K. A Review of Fatty Epoxide Ring Opening Reactions: Chemistry, Recent Advances, and Applications. JAOCS J. Am. Oil Chem. Soc. 2022, 99, 801–842. [Google Scholar] [CrossRef]
- López, C.O.C.; Fejes, Z.; Viskolcz, B. Microreactor Assisted Method for Studying Isocyanate–Alcohol Reaction Kinetics. J. Flow Chem. 2019, 9, 199–204. [Google Scholar] [CrossRef]
- Le Gresley, A.; Ampem, G.; Grootveld, M.; Percival, B.C.; Naughton, D.P. Characterisation of Peroxidation Products Arising from Culinary Oils Exposed to Continuous and Discontinuous Thermal Degradation Processes. Food Funct. 2019, 10, 7952–7966. [Google Scholar] [CrossRef]
- Jebrane, M.; Cai, S.; Sandström, C.; Terziev, N. The Reactivity of Linseed and Soybean Oil with Different Epoxidation Degree towards Vinyl Acetate and Impact of the Resulting Copolymer on the Wood Durability. Express Polym. Lett. 2017, 11, 383–395. [Google Scholar] [CrossRef]
- Favero, D.; Marcon, V.R.R.; Barcellos, T.; Gómez, C.M.; Sanchis, M.J.; Carsí, M.; Figueroa, C.A.; Bianchi, O. Renewable Polyol Obtained by Microwave-Assisted Alcoholysis of Epoxidized Soybean Oil: Preparation, Thermal Properties and Relaxation Process. J. Mol. Liq. 2019, 285, 136–145. [Google Scholar] [CrossRef]
- Peyrton, J.; Avérous, L. Structure-Properties Relationships of Cellular Materials from Biobased Polyurethane Foams. Mater. Sci. Eng. R Rep. 2021, 145, 100608. [Google Scholar] [CrossRef]
- Evonic Additives for Spray Polyurethane Foam (SPF) Applications—Americas. Available online: https://explorepu.evonik.com/ (accessed on 23 August 2021).
- Naldzhiev, D.; Mumovic, D.; Strlic, M. Polyurethane Insulation and Household Products—A Systematic Review of Their Impact on Indoor Environmental Quality. Build. Environ. 2020, 169, 106559. [Google Scholar] [CrossRef]
- Poppendieck, D.; Lawson, L.; Gong, M. Lessons Learned from Spray Polyurethane Foam (SPF) Emission Testing Using Micro-Chambers. Available online: https://tsapps.nist.gov/publication/get_pdf.cfm?pub_id=921259 (accessed on 20 May 2022).
- Zhang, X.D.; Macosko, C.W.; Davis, H.T.; Nikolov, A.D.; Wasan, D.T. Role of Silicone Surfactant in Flexible Polyurethane Foam. J. Colloid Interface Sci. 1999, 215, 270–279. [Google Scholar] [CrossRef]
- Purinova Technical Data Sheet—Purios 500. Available online: https://purios.com/images/upload/product/purios-500/tds-purios-500.pdf (accessed on 11 February 2022).
- Huntsman Classic—Technical Data Sheet. Available online: https://huntsmanbuildingsolutions.com/en-CA/products/open-cell-insulation/classic (accessed on 6 August 2022).
- Wu, J.W.; Chu, H.S. Heat Transfer in Open Cell Polyurethane Foam Insulation. Heat Mass Transf. Stoffuebertragung 1998, 34, 247–254. [Google Scholar] [CrossRef]
- Choe, H.; Choi, Y.; Kim, J.H. Threshold Cell Diameter for High Thermal Insulation of Water-Blown Rigid Polyurethane Foams. J. Ind. Eng. Chem. 2019, 73, 344–350. [Google Scholar] [CrossRef]
- Alfredo Campo, E. 3 Thermal Properties of Polymeric Materials; William Andrew: Norwich, NY, USA, 2008. [Google Scholar]
- Jiang, L.; Ren, Z.; Zhao, W.; Liu, W.; Liu, H.; Zhu, C. Synthesis and Structure/Properties Characterizations of Four Polyurethane Model Hard Segments. R. Soc. Open Sci. 2018, 5, 180536. [Google Scholar] [CrossRef]
- Kabakci, E.; Sayer, G.; Suvaci, E.; Uysal, O.; Güler, İ.; Kaya, M. Processing-Structure-Property Relationship in Rigid Polyurethane Foams. J. Appl. Polym. Sci. 2017, 134, 1–13. [Google Scholar] [CrossRef]


| Catalyst | Chemical Structure |
|---|---|
| POLYCAT® 15 |  |
| POLYCAT® 140 |  |
| POLYCAT® 142 |  |
| BP_DEG-Based ocSPF | BP_TEA-Based ocSPF | |||
|---|---|---|---|---|
| Component | Share, pbw | Component | Share, pbw | |
| Bio-polyol | BP_DEG | 100 | BP_TEA | 100 |
| Catalysts | POLYCAT® 15 | 3.5 | POLYCAT® 142 | 5 |
| POLYCAT® 140 | 12 | |||
| Surfactants | TEGOSTAB® 8870 | 1.2 | TEGOSTAB® 8870 | 2 |
| TEGOSTAB® 8526 | 0.6 | TEGOSTAB® 8523 | 0.6 | |
| ORTEGOL® 500 | 0.8 | ORTEGOL® 500 | 1 | |
| Blowing agent | Water | 20 | Water | 20 |
| Flame retardant | TCPP | 30 | TEP | 20 |
| Isocyanate | pMDI | 208 * | pMDI | 186 * |
| Isocyanate index | 0.56 | 0.47 | ||
| Component A | η (25 °C), mPa∙s | η (45 °C), mPa∙s |
|---|---|---|
| DEG_ocSPF | 1233 ± 18 | 366 ± 1 |
| TEA_ocSPF | 98 ± 1 | 47 ± 1 |
| Sample | Hv, mgKOH/g | Av, mgKOH/g | Mn, g/mol | Mw, g/mol | D | f | η (25 °C), mPa∙s | %H20, wt.% |
|---|---|---|---|---|---|---|---|---|
| UCO | - | 0.93 ± 0.04 | 886 | 889 | 1.00 | - | 73 ± 1 | 0.10 ± 0.02 |
| UCO_EO | - | 1.78 ± 0,03 | 918 | 926 | 1.01 | - | 127 ± 2 | 0.24 ± 0.03 |
| BP_TEA | 349 ± 3 | 2.31 ± 0.12 | 340 | 553 | 1.62 | 2.1 | 226 ± 2 | 0.31 ± 0.04 |
| BP_DEG | 214 ± 2 | 2.92 ± 0.08 | 1874 | 4307 | 2.29 | 4.8 | 3384 ± 5 | 0.29 ± 0.03 |
| Foam Symbol | Apparent Density, kg/m3 | Closed-Cell Content, % | Thermal Conductivity Coefficient, mW/m∙K | LOI, % O2 | Compressive Strength, kPa | Brittleness, % |
|---|---|---|---|---|---|---|
| DEG_t45_lab | 12.23 ± 0.39 | 1.24 ± 1.68 | 36.96 ± 0.74 | 21.3 | 11.43 ± 0.26 | 2.73 ± 2.68 |
| TEA_t45_lab | 11.53 ± 0.11 | 2.21 ± 0.03 | 41.06 ± 0.39 | 21.5 | 12.86 ± 1.51 | 16.92 ± 6.20 |
| Foam Sample | Apparent Density, kg/m3 | Closed-Cell Content, % | Thermal Conductivity Coefficient, mW/m∙K | LOI, % O2 | Compressive Strength, kPa | Brittleness, % |
|---|---|---|---|---|---|---|
| DEG_p80_t52 | 16.22 ± 0.49 | 1.61 ± 1.40 | 37.06 ± 0.99 | 21.3 | 27.70 ± 1.45 | 4.32 ± 3.39 |
| DEG_p90_t52 | 14.36 ± 0.88 | 2.35 ± 0.20 | 36.04 ± 0.89 | 21.3 | 13.30 ± 1.06 | 0.73 ± 0.34 |
| DEG_p100_t52 | 14.16 ± 0.19 | 3.50 ± 1.24 | 35.95 ± 0.72 | 21.3 | 14.24 ± 1.18 | 0.69 ± 0.97 |
| TEA_p80_t45 | 21.49 ± 0.13 | 4.17 ± 1.39 | 34.96 ± 1.03 | 21.5 | 43.82 ± 2.74 | 10.78 ± 1.57 |
| TEA_p80_t52 | 17.59 ± 0.48 | 4.46 ± 0.07 | 36.59 ± 0.68 | 21.5 | 22.14 ± 3.37 | 8.92 ± 0.33 |
| TEA_p90_t52 | 17.09 ± 0.14 | 4.85 ± 0.42 | 36.76 ± 1.20 | 21.5 | 26.88 ± 1.58 | 7.25 ± 3.79 |
| TEA_p100_t52 | 17.38 ± 1.23 | 2.43 ± 0.03 | 36.62 ± 0.90 | 21.5 | 25.50 ± 2.00 | 7.39 ± 1.63 |
| Foam Sample | Water-Vapor Permeability δ, mg/(m*h*Pa) | Water-Vapor Diffusion Resistance Factor μ (Dimensionless) |
|---|---|---|
| DEG_p80_t52 | 0.27 ± 0.01 | 2.68 ± 0.13 |
| DEG_p90_t52 | 0.24 ± 0.02 | 2.98 ± 0.29 |
| DEG_p100_t52 | 0.14 ± 0.02 | 5.08 ± 0.55 |
| TEA_p80_t45 | 0.21 ± 0.02 | 3.38 ± 0.38 |
| TEA_p80_t52 | 0.24 ± 0.02 | 2.94 ± 0.19 |
| TEA_p90_t52 | 0.25 ± 0.01 | 2.83 ± 0.12 |
| TEA_p100_t52 | 0.26 ± 0.01 | 2.68 ± 0.09 |
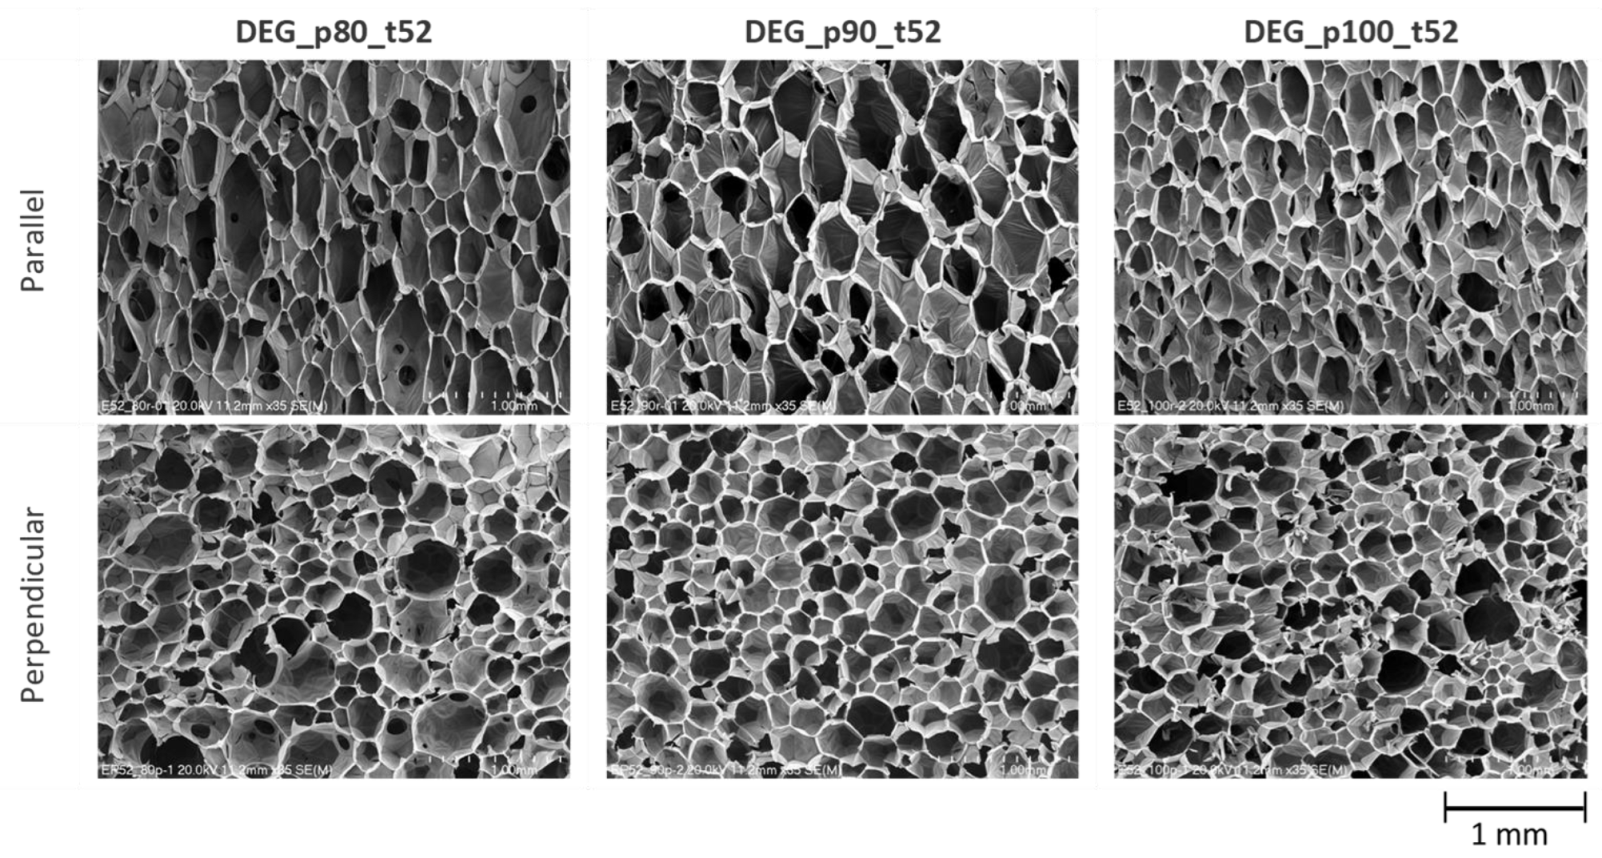
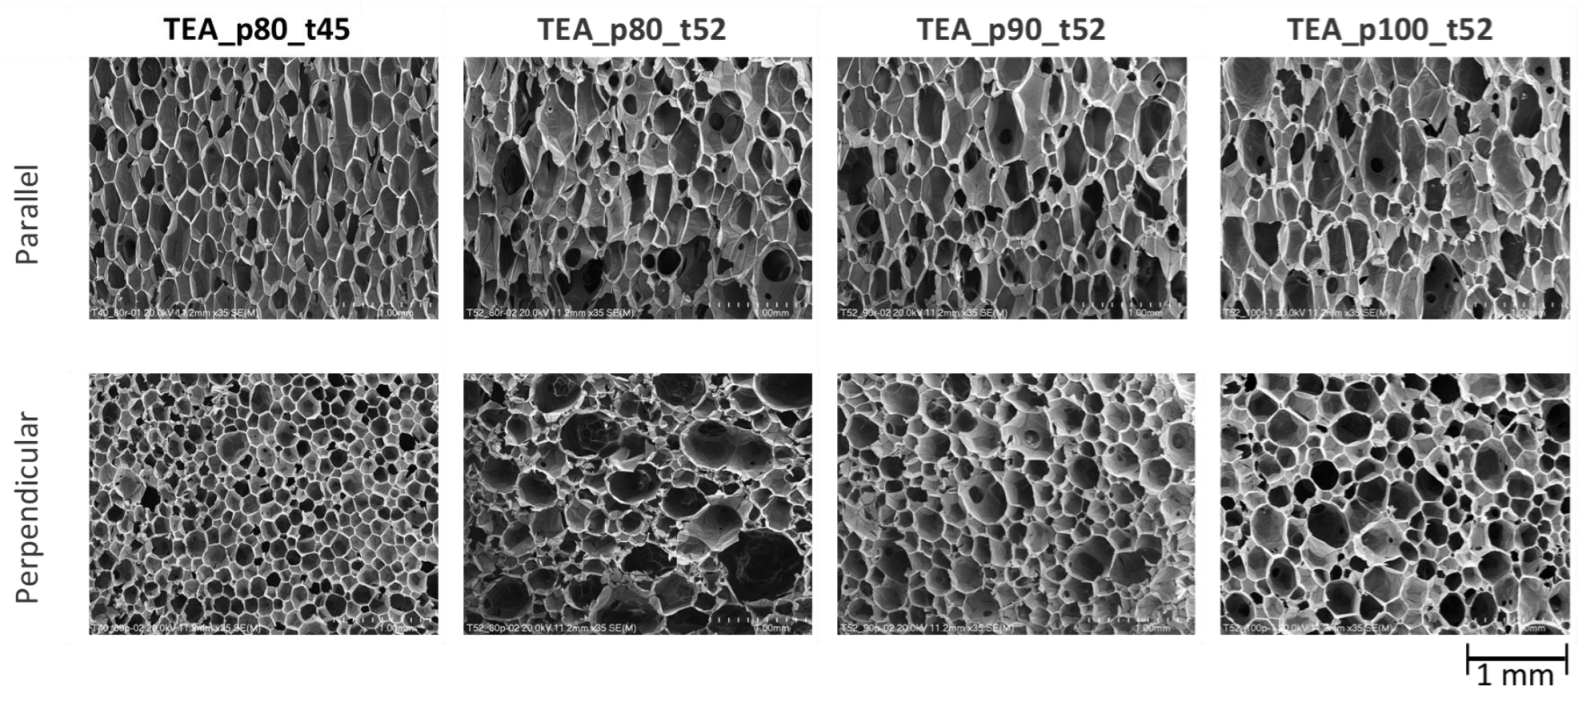
| Foam Sample | Direction of Growth | Anisotropy Index | Cross-Section Area, mm2 | Cell-Density × 103, Number of Cells/cm3 |
|---|---|---|---|---|
| DEG_p80_t52 | Parallel | 1.94 ± 0.54 | 0.071 ± 0.059 | 54.19 ± 0.65 |
| Perpendicular | 1.44 ± 0.32 | 0.044 ± 0.038 | ||
| DEG_p90_t52 | Parallel | 1.66 ± 0.44 | 0.068 ± 0.052 | 62.51 ± 2.15 |
| Perpendicular | 1.47 ± 0.41 | 0.039 ± 0.036 | ||
| DEG_p100_t52 | Parallel | 1.79 ± 0.58 | 0.049 ± 0.028 | 94.72 ± 0.11 |
| Perpendicular | 1.50 ± 0.38 | 0.031 ± 0.020 | ||
| TEA_p80_t45 | Parallel | 2.02 ± 0.59 | 0.051 ± 0.040 | 124.23 ± 0.29 |
| Perpendicular | 1.41 ± 0.31 | 0.021 ± 0.013 | ||
| TEA_p80_t52 | Parallel | 2.04 ± 0.67 | 0.082 ± 0.760 | 53.44 ± 2.85 |
| Perpendicular | 1.54 ± 0.04 | 0.040 ± 0.036 | ||
| TEA_p90_t52 | Parallel | 1.91 ± 0.60 | 0.065 ± 0.057 | 63.74 ± 0.12 |
| Perpendicular | 1.41 ± 0.32 | 0.038 ± 0.036 | ||
| TEA_p100_t52 | Parallel | 1.83 ± 0.55 | 0.078 ± 0.063 | 49.26 ± 1.13 |
| Perpendicular | 1.48 ± 0.39 | 0.046 ± 0.042 |
Disclaimer/Publisher’s Note: The statements, opinions and data contained in all publications are solely those of the individual author(s) and contributor(s) and not of MDPI and/or the editor(s). MDPI and/or the editor(s) disclaim responsibility for any injury to people or property resulting from any ideas, methods, instructions or products referred to in the content. |
© 2023 by the authors. Licensee MDPI, Basel, Switzerland. This article is an open access article distributed under the terms and conditions of the Creative Commons Attribution (CC BY) license (https://creativecommons.org/licenses/by/4.0/).
Share and Cite
Polaczek, K.; Kurańska, M.; Malewska, E.; Czerwicka-Pach, M.; Prociak, A. From Bioresources to Thermal Insulation Materials: Synthesis and Properties of Two-Component Open-Cell Spray Polyurethane Foams Based on Bio-Polyols from Used Cooking Oil. Materials 2023, 16, 6139. https://doi.org/10.3390/ma16186139
Polaczek K, Kurańska M, Malewska E, Czerwicka-Pach M, Prociak A. From Bioresources to Thermal Insulation Materials: Synthesis and Properties of Two-Component Open-Cell Spray Polyurethane Foams Based on Bio-Polyols from Used Cooking Oil. Materials. 2023; 16(18):6139. https://doi.org/10.3390/ma16186139
Chicago/Turabian StylePolaczek, Krzysztof, Maria Kurańska, Elżbieta Malewska, Małgorzata Czerwicka-Pach, and Aleksander Prociak. 2023. "From Bioresources to Thermal Insulation Materials: Synthesis and Properties of Two-Component Open-Cell Spray Polyurethane Foams Based on Bio-Polyols from Used Cooking Oil" Materials 16, no. 18: 6139. https://doi.org/10.3390/ma16186139