
Porous Structure and Fractal Dimensions of Activated Carbon Prepared from Waste Coffee Grounds
 , and
, and 
Abstract
:1. Introduction
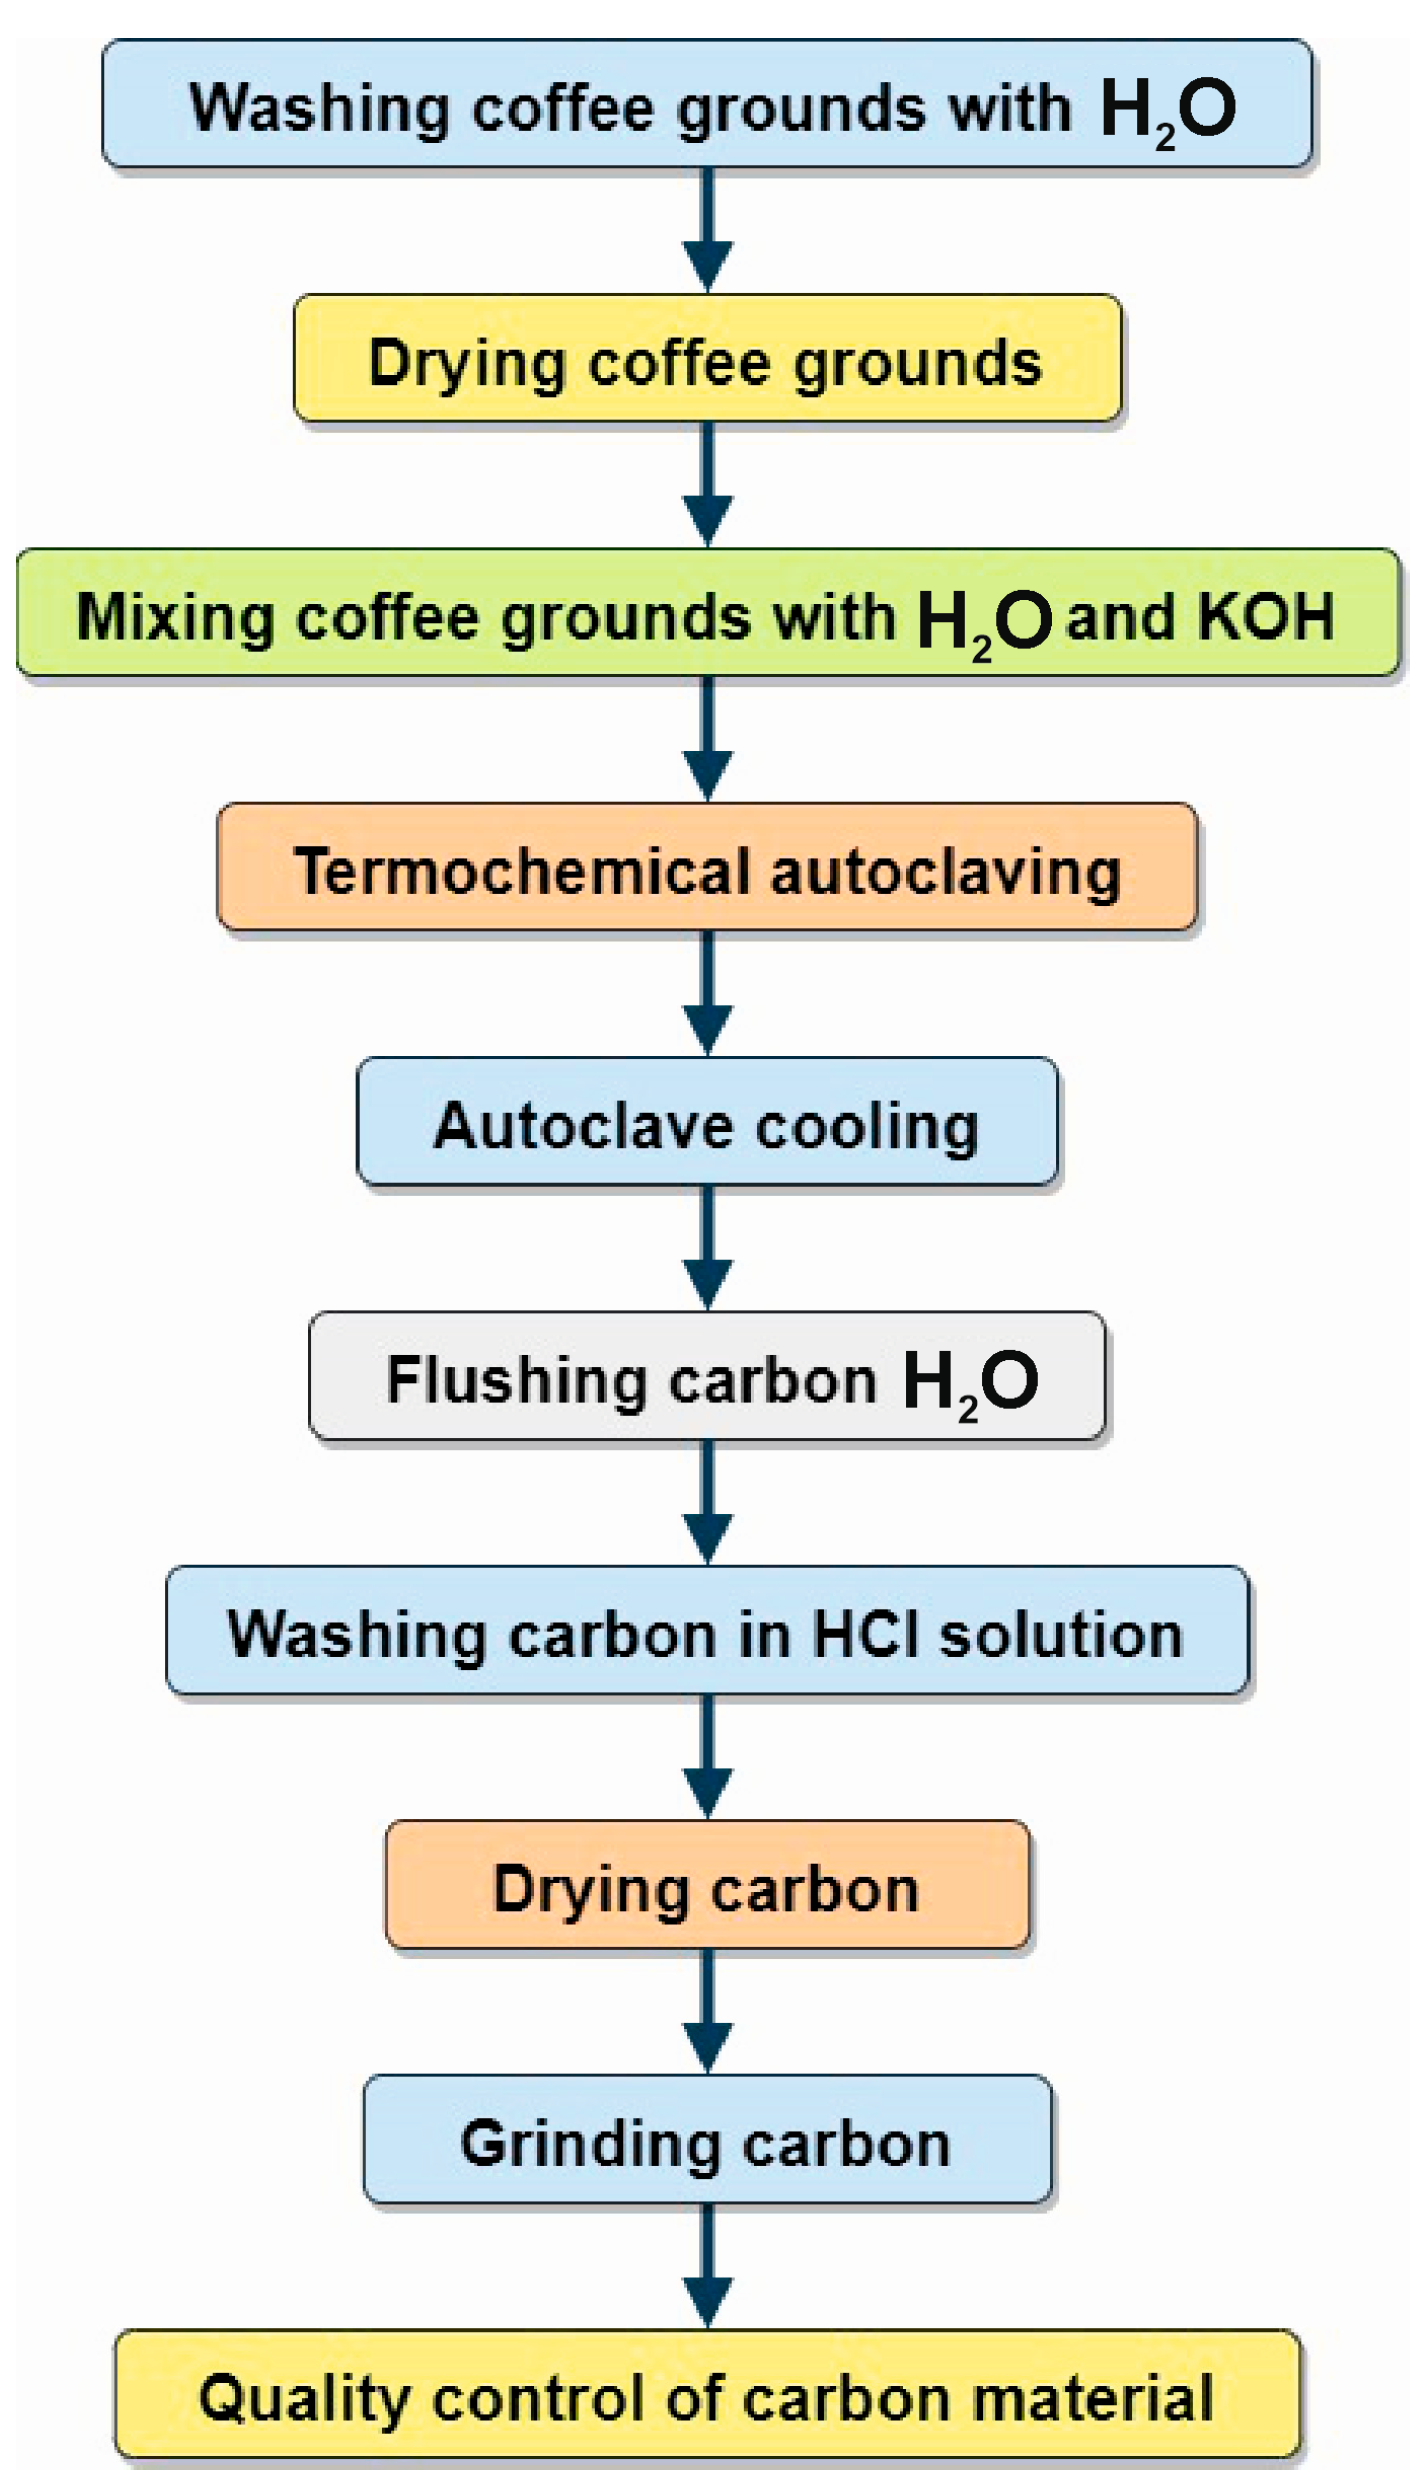
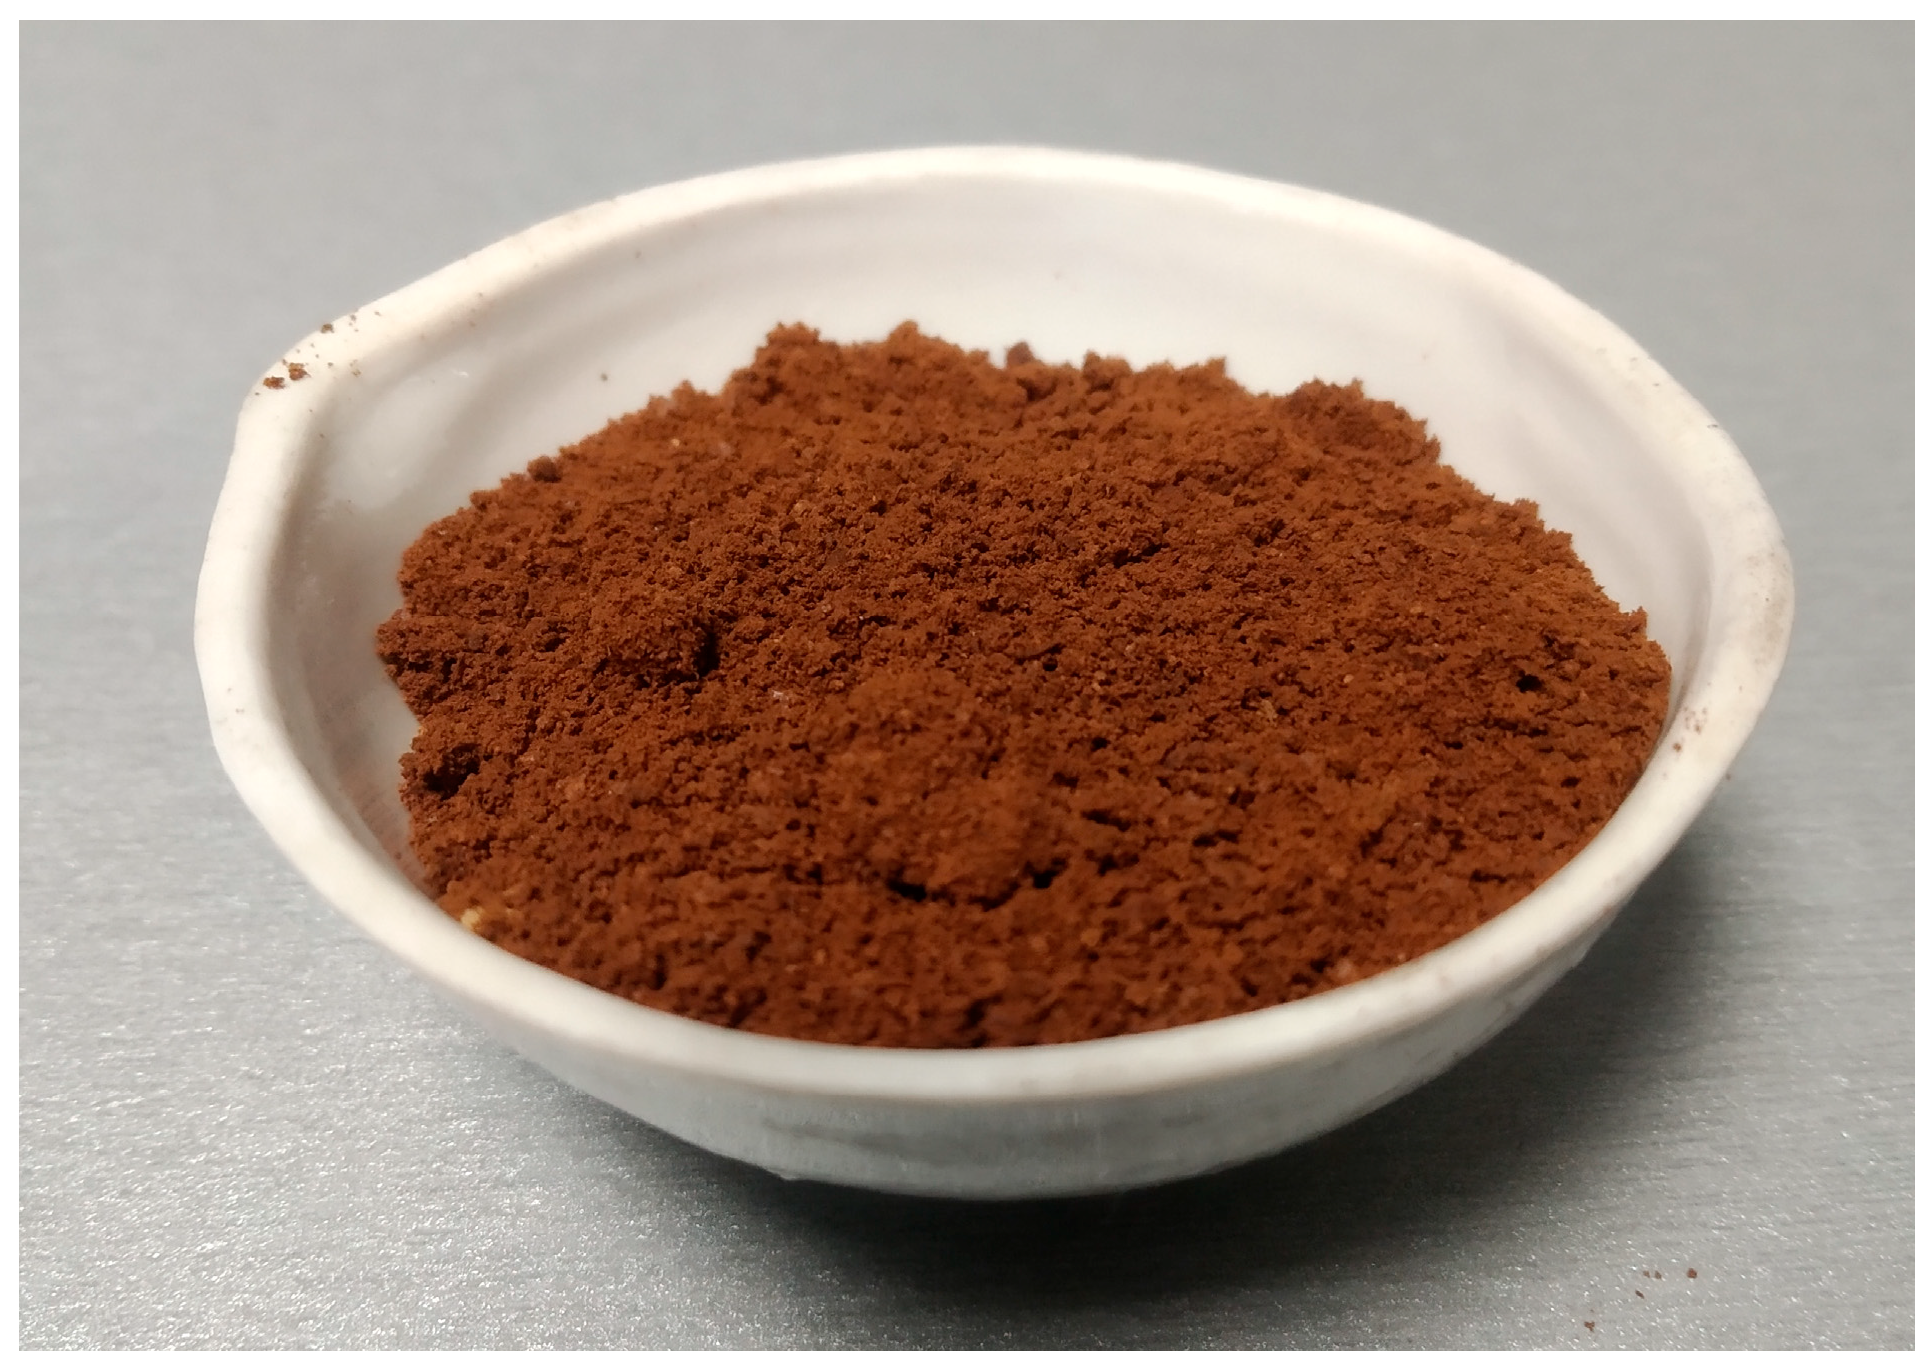
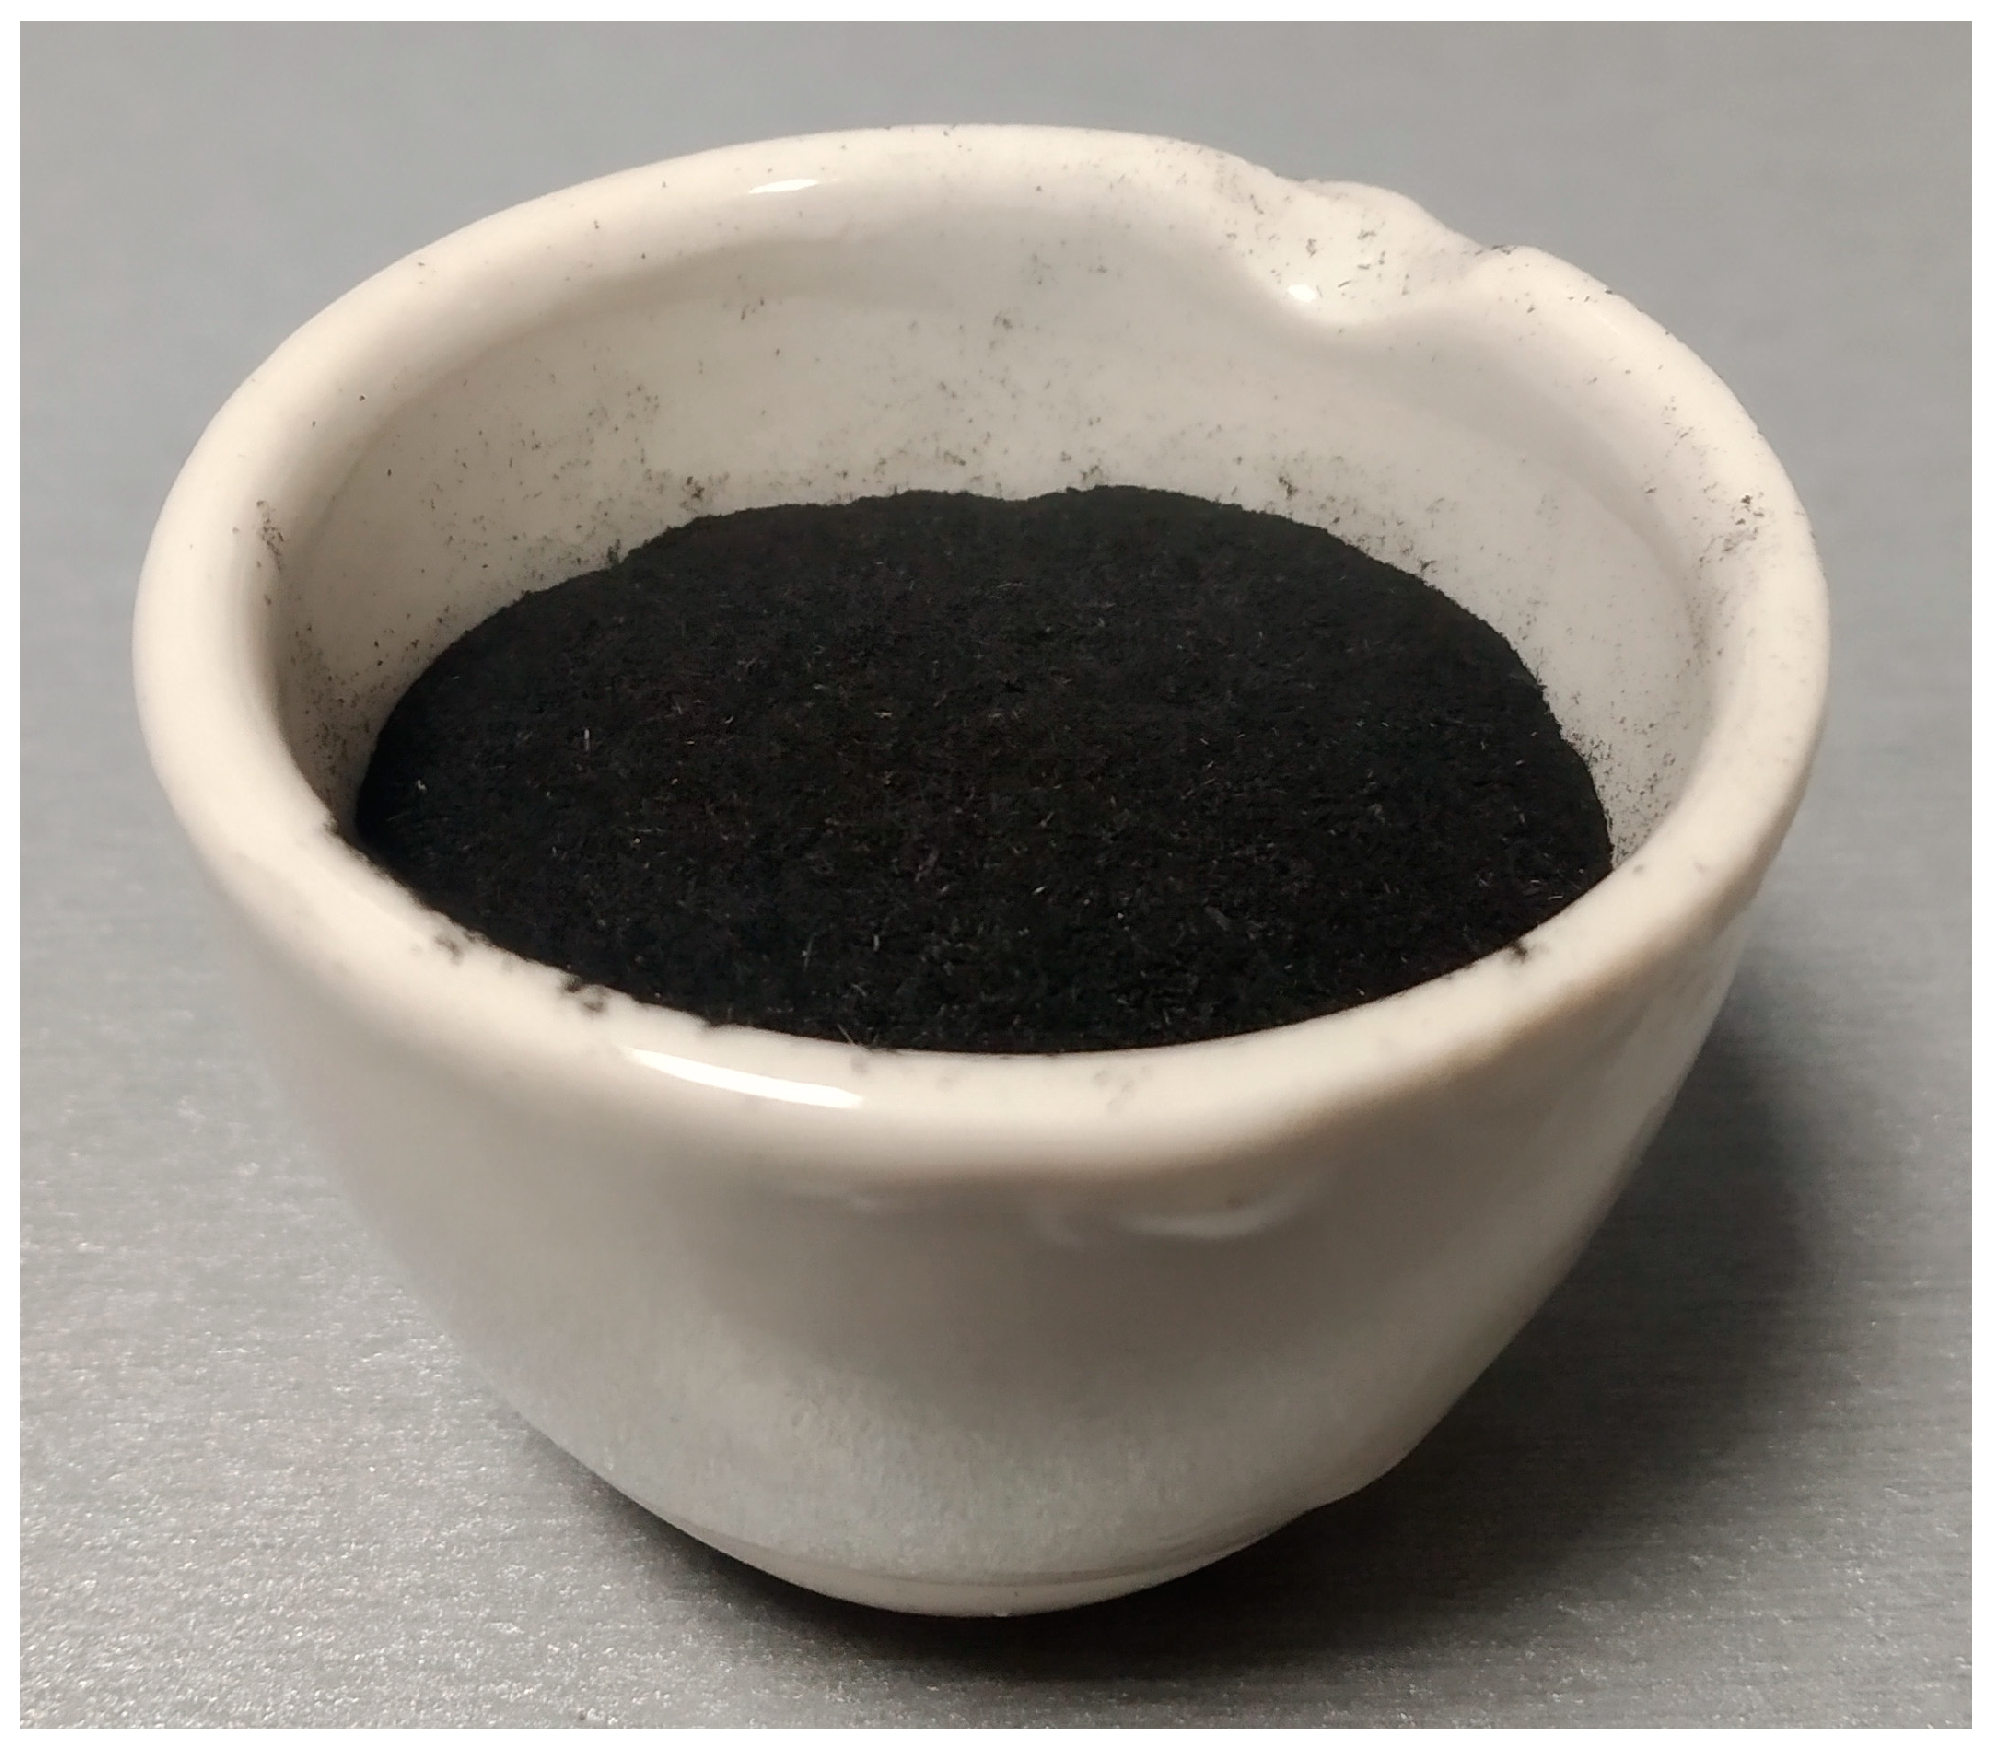
2. Materials and Methods
3. Results and Discussion
4. Conclusions
Author Contributions
Funding
Institutional Review Board Statement
Informed Consent Statement
Data Availability Statement
Acknowledgments
Conflicts of Interest
References
- Martins, F.; Felgueiras, C.; Smitkova, M.; Caetano, N. Analysis of Fossil Fuel Energy Consumption and Environmental Impacts in European Countries. Energies 2019, 12, 964. [Google Scholar] [CrossRef]
- Hirschnitz-Garbers, M.; Araujo, S.A.; Hinzmann, M. Exploring perspectives on climate-resource-nexus policies: Barriers and relevance in different world regions. J. Sustain. Dev. Energy Water Environ. Syst. 2022, 10, 1090408. [Google Scholar] [CrossRef]
- Mehdi, R.; Khoja, A.H.; Naqvi, S.R.; Gao, N.; Amin, N.A.S. A Review on Production and Surface Modifications of Biochar Materials via Biomass Pyrolysis Process for Supercapacitor Applications. Catalysts 2022, 12, 798. [Google Scholar] [CrossRef]
- IEA. World Energy Outlook; Flagship Report—2022; International Energy Agency: Paris, France, 2022. Available online: https://www.iea.org/reports/world-energy-outlook-2022 (accessed on 1 July 2023).
- Solarz, J.; Gawlik-Kobylińska, M.; Ostant, W.; Maciejewski, P. Trends in Energy Security Education with a Focus on Renewable and Nonrenewable Sources. Energies 2022, 15, 1351. [Google Scholar] [CrossRef]
- Ayoo, C. Towards Energy Security for the Twenty-First Century. In Energy Policy; IntechOpen: London, UK, 2020. [Google Scholar] [CrossRef]
- Kim, C.; Jiwon Sul, J.; Moon, J.H. Semiconductor process fabrication of multiscale porous carbon thin films for energy storage devices. Energy Storage Mater. 2023, 57, 308–315. [Google Scholar] [CrossRef]
- Bembenek, M.; Kotsyubynsky, V.; Boychuk, V.; Rachiy, B.; Budzulyak, I.; Kowalski, Ł.; Ropyak, L. Effect of Synthesis Conditions on Capacitive Properties of Porous Carbon Derived from Hemp Bast Fiber. Energies 2022, 15, 8761. [Google Scholar] [CrossRef]
- Ani, P.C.; Nzereogu, P.U.; Agbogu, A.C.; Ezema, F.I.; Nwanya, A.C. Cellulose from waste materials for electrochemical energy storage applications: A review. Appl. Surf. Sci. Adv. 2022, 11, 100298. [Google Scholar] [CrossRef]
- Hoseini, S.S.; Seyedkanani, A.; Najafi, G.; Sasmito, A.P. Abdolhamid Akbarzadeh, Multiscale architected porous materials for renewable energy conversion and storage. Energy Storage Mater. 2023, 59, 102768. [Google Scholar] [CrossRef]
- Joseph, S.; Saianand, G.; Benzigar, M.R.; Ramadass, K.; Singh, G.; Gopalan, A.-I.; Yang, J.H.; Mori, T.; Al-Muhtaseb, A.H.; Yi, J.; et al. Recent Advances in Functionalized Nanoporous Carbons Derived from Waste Resources and Their Applications in Energy and Environment. Adv. Sustain. Syst. 2021, 5, 2000169. [Google Scholar] [CrossRef]
- Reed, A.R.; Williams, P.T. Thermal processing of biomass natural fibre wastes by pyrolysis. Int. J. Energy Res. 2004, 28, 131–145. [Google Scholar] [CrossRef]
- Boychuk, V.; Kotsyubynsky, V.; Kachmar, A.; Budzulyak, S.; Budzulyak, I.; Rachiy, B.; Yablon, L. Effect of Synthesis Conditions on Pseudocapacitance Properties of Nitrogen-Doped Porous Carbon Materials. J. Nano Res. 2019, 59, 112–125. [Google Scholar] [CrossRef]
- Tudose, I.V.; Mouratis, K.; Ionescu, O.N.; Romanitan, C.; Pachiu, C.; Pricop, E.; Khomenko, V.H.; Butenko, O.; Chernysh, O.; Barsukov, V.Z. Carbon Allotropes-Based Paints and Their Composite Coatings for Electromagnetic Shielding Applications. Nanomaterials 2022, 12, 1839. [Google Scholar] [CrossRef] [PubMed]
- Melezhyk, A.V.; Yanchenko, V.V.; Sementsov, Y.I. Nanocarbon materials. In Hydrogen Materials Science and Chemistry of Carbon Nanomaterials; Veziroglu, T.N., Zaginaichenko, S.Y., Schur, D.V., Baranowski, B., Shpak, A.P., Skorokhod, V.V., Kale, A., Eds.; NATO Security through Science Series A: Chemistry and Biology; Springer: Dordrecht, The Netherlands, 2007; pp. 529–537. [Google Scholar] [CrossRef]
- Tian, W.; Zhang, H.; Duan, X.; Sun, H.; Shao, G.; Wang, S. Porous carbons: Structure-oriented design and versatile applications. Adv. Funct. Mater. 2020, 30, 1909265. [Google Scholar] [CrossRef]
- Wang, Z.; Cheng, Y.; Qi, Y.; Wang, R.; Wang, L.; Jiang, J. Experimental study of pore structure and fractal characteristics of pulverized intact coal and tectonic coal by low temperature nitrogen adsorption. Powder Technol. 2019, 350, 15–25. [Google Scholar] [CrossRef]
- Fang, L.; Chen, C.; Wang, Y. Carbon Fibers and Graphite as Pore-Forming Agents for the Obtention of Porous Alumina: Correlating Physical and Fractal Characteristics. Fractal Fract. 2022, 6, 501. [Google Scholar] [CrossRef]
- Kotsyubynsky, V.; Rachiy, B.; Boychuk, V.; Budzulyak, I.; Turovska, L.; Hodlevska, M. Correlation between structural properties and electrical conductivity of porous carbon derived from hemp bast fiber. Fuller. Nanotub. Carbon Nanostructures 2022, 30, 873–882. [Google Scholar] [CrossRef]
- Diduszko, R.; Swiatkowski, A.; Trznadel, B. On surface of micropores and fractal dimension of activated carbon determined on the basis of adsorption and SAXS investigations. Carbon 2000, 38, 1153–1162. [Google Scholar] [CrossRef]
- Tien, C.-L.; Su, S.-H.; Cheng, C.-Y.; Chang, Y.-M.; Mo, D.-H. Optical Interference Filters Combined with Thin Film Residual Stress Compensation for Image Contrast Enhancement. Coatings 2023, 13, 857. [Google Scholar] [CrossRef]
- Wasilewska, M.; Deryło-Marczewska, A. Adsorption of Non-Steroidal Anti-Inflammatory Drugs on Alginate-Carbon Composites—Equilibrium and Kinetics. Materials 2022, 15, 6049. [Google Scholar] [CrossRef]
- Li, C.; Xu, Y.; Jiang, Z.; Yu, B.; Xu, P. Fractal Analysis on the Mapping Relationship of Conductivity Properties in Porous Material. Fractal Fract. 2022, 6, 527. [Google Scholar] [CrossRef]
- Kopnov, G.; Das, S.S.; Gerber, A. Effect of Fractal Topology on the Resistivity Response of Thin Film Sensors. Sensors 2023, 23, 2409. [Google Scholar] [CrossRef] [PubMed]
- Fodchuk, I.; Kotsyubynsky, A.; Velychkovych, A.; Hutsuliak, I.; Boychuk, V.; Kotsyubynsky, V.; Ropyak, L. The Effect of Ne+ Ion Implantation on the Crystal, Magnetic, and Domain Structures of Yttrium Iron Garnet Films. Crystals 2022, 12, 1485. [Google Scholar] [CrossRef]
- Szroeder, P.; Sagalianov, I.Y.; Radchenko, T.M.; Tatarenko, V.A.; Prylutskyy, Y.I.; Strupiński, W. Effect of uniaxial stress on the electrochemical properties of graphene with point defects. Appl. Surf. Sci. 2018, 442, 185–188. [Google Scholar] [CrossRef]
- Szroeder, P.; Sahalianov, I.; Radchenko, T.; Tatarenko, V.; Prylutskyy, Y. The strain- and impurity-dependent electron states and catalytic activity of graphene in a static magnetic field. Opt. Mater. 2019, 96, 109284. [Google Scholar] [CrossRef]
- Solomenko, A.G.; Balabai, R.M.; Radchenko, T.M.; Tatarenko, V.A. Functionalization of quasi-two-dimensional materials: Chemical and strain-induced modifications. Prog. Phys. Met. 2022, 23, 147–238. [Google Scholar] [CrossRef]
- Prysyazhnyuk, P.M.; Shihab, T.A.; Panchuk, V.H. Formation of the Structure of Cr3C2–MNMts 60-20-20 Cermets. Mater. Sci. 2016, 52, 188–193. [Google Scholar] [CrossRef]
- Prysyazhnyuk, P.; Lutsak, D.; Vasylyk, A.; Shihab, T.; Burda, M. Calculation of Surface Tension and Its Temperature Dependence for Liquid Cu-20Ni-20Mn Alloy. Metall. Min. Ind. 2015, 12, 346–350. [Google Scholar]
- Prysyazhnyuk, P.; Di Tommaso, D. The thermodynamic and mechanical properties of Earth-abundant metal ternary boride Mo2(Fe,Mn)B2 solid solutions for impact- and wear-resistant alloys. Mater. Adv. 2023, 4, 3822–3838. [Google Scholar] [CrossRef]
- Liu, X.; Zhang, S.; Wen, X.; Chen, X.; Wen, Y.; Shi, X.; Mijowska, E. High yield conversion of biowaste coffee grounds into hierarchical porous carbon for superior capacitive energy storage. Sci. Rep. 2020, 10, 3518. [Google Scholar] [CrossRef]
- Yue, L.; Xia, Q.; Wang, L.; Wang, L.; DaCosta, H.; Yang, J.; Hu, X. CO2 adsorption at nitrogen-doped carbons prepared by K2CO3 activation of urea-modified coconut shell. J. Colloid Interface Sci. 2018, 511, 259–267. [Google Scholar] [CrossRef]
- Panwar, N.L.; Pawar, A. Influence of activation conditions on the physicochemical properties of activated biochar: A review. Biomass Conv. Bioref. 2022, 12, 925–947. [Google Scholar] [CrossRef]
- Pandey, K.; Jeong, H.K. Coffee waste-derived porous carbon for hydrogen and oxygen evolution reaction. Chem. Phys. Impact 2023, 6, 100175. [Google Scholar] [CrossRef]
- Prysyazhnyuk, L.; Petryshyn, I.; Dolishnii, B.; Ropyak, L. A portable calorimeter for measuring the calorific value of natural gas. Ukr. Metrol. J. 2021, 3, 58–65. [Google Scholar] [CrossRef]
- Onysko, O.; Kopei, V.; Medvid, I.; Pituley, L.; Lukan, T. Influence of the Thread Profile Accuracy on Contact Pressure in Oil and Gas Pipes Connectors. In Proceedings of the 3rd International Conference on Design, Simulation, Manufacturing: The Innovation Exchange, DSMIE 2020, Kharkiv, Ukraine, 9–12 June 2020; Lecture Notes in Mechanical Engineering. Springer: Cham, Switzerland, 2020; pp. 432–441. [Google Scholar] [CrossRef]
- Kusyi, Y.; Kuzin, O.; Kuzin, N. The dependence of intergrain damageability of casting on the technological treatment route. East.-Eur. J. Enterp. Technol. 2016, 1, 39–47. [Google Scholar] [CrossRef]
- Kusyi, Y.; Stupnytskyy, V.; Onysko, O.; Dragašius, E.; Baskutis, S.; Chatys, R. Optimization synthesis of technological parameters during manufacturing of the parts. Eksploat. I Niezawodn.—Maint. Reliab. 2022, 24, 655–667. [Google Scholar] [CrossRef]
- Shats’kyi, I.P.; Lyskanych, O.M.; Kornuta, V.A. Combined Deformation Conditions for Fatigue Damage Indicator and Well-Drilling Tool Joint. Strength Mater. 2016, 48, 469–472, 469–472. [Google Scholar] [CrossRef]
- Villarroel-Rocha, J.; Barrera, D.; Sapag, K. Introducing a self-consistent test and the corresponding modification in the Barrett, Joyner and Halenda method for pore-size determination. Microporous Mesoporous Mater. 2014, 200, 68–78. [Google Scholar] [CrossRef]
- Kupgan, G.; Liyana-Arachchi, T.P.; Colina, C.M. NLDFT pore size distribution in amorphous microporous materials. Langmuir 2017, 33, 11138–11145. [Google Scholar] [CrossRef] [PubMed]
- Taleb, F.; Ammar, M.; Mosbah, M.B.; Salem, R.B.; Moussaoui, Y. Chemical modification of lignin derived from spent coffee grounds form ethylene blue adsorption. Sci. Rep. 2020, 10, 11048. [Google Scholar] [CrossRef]
- Thommes, M.; Kaneko, K.; Neimark, A.V.; Olivier, J.P.; Rodriguez-Reinoso, F.; Rouquerol, J.; Sing, K.S.W. Physisorption of gases, with special reference to the evaluation of surface area and pore size distribution (IUPAC Technical Report). Pure Appl. Chem. 2015, 87, 1051–1069. [Google Scholar] [CrossRef]
- Hou, X.; Liu, S.; Zhu, Y.; Yang, Y. Experimental and theoretical investigation on sorption kinetics and hysteresis of nitrogen, methane, and carbon dioxide in coals. Fuel 2020, 268, 117349. [Google Scholar] [CrossRef]
- Bardestani, R.; Patience, G.S.; Kaliaguine, S. Experimental methods in chemical engineering: Specific surface area and pore size distribution measurements—BET, BJH, and DFT. Can. J. Chem. Eng. 2019, 97, 2781–2791. [Google Scholar] [CrossRef]
- Pomonis, P.J.; Tsaousi, E.T. Frenkel–Halsey–Hill equation, dimensionality of adsorption, and pore anisotropy. Langmuir 2009, 25, 9986–9994. [Google Scholar] [CrossRef] [PubMed]
- Khangar, R.G.; Mendhe, V.A.; Kamble, A.D.; Ranjan Das, P.; Shukla, P.; Bannerjee, M.; Varma, A.K. Variation in pore structure and associated fractal dimensions of Barakar and Barren measures carbon-rich gas shales of Jharia Basin, India. ACS Omega 2021, 6, 28678–28698. [Google Scholar] [CrossRef] [PubMed]
- Pfeifer, P.; Liu, K.-Y. Chapter 12. Multilayer adsorption as a tool to investigate the fractal nature of porous adsorbents. In Studies in Surface Science and Catalysis; Rudziński, W., Steele, W.A., Zgrablich, G., Eds.; Elsevier: Amsterdam, The Netherlands, 1997; Volume 104, pp. 625–677. [Google Scholar] [CrossRef]
- Mengesha, D.N.; Abebe, M.W.; Appiah-Ntiamoah, R.; Kim, H. Ground coffee waste-derived carbon for adsorptive removal of caffeine: Effect of surface chemistry and porous structure. Sci. Total Environ. 2022, 818, 151669. [Google Scholar] [CrossRef] [PubMed]
- Giraldo, L.; Moreno-Piraján, J.C. Synthesis of activated carbon mesoporous from coffee waste and its application in adsorption zinc and mercury ions from aqueous solution. J. Chem. 2012, 9, 938–948. [Google Scholar] [CrossRef]
- Zięzio, M.; Charmas, B.; Jedynak, K.; Hawryluk, M.; Kucio, K. Preparation and characterization of activated carbons obtained from the waste materials impregnated with phosphoric acid (V). Appl. Nanosci. 2020, 10, 4703–4716. [Google Scholar] [CrossRef]


| Sample | S400 | S500 | S600 | S700 | S800 | S900 |
|---|---|---|---|---|---|---|
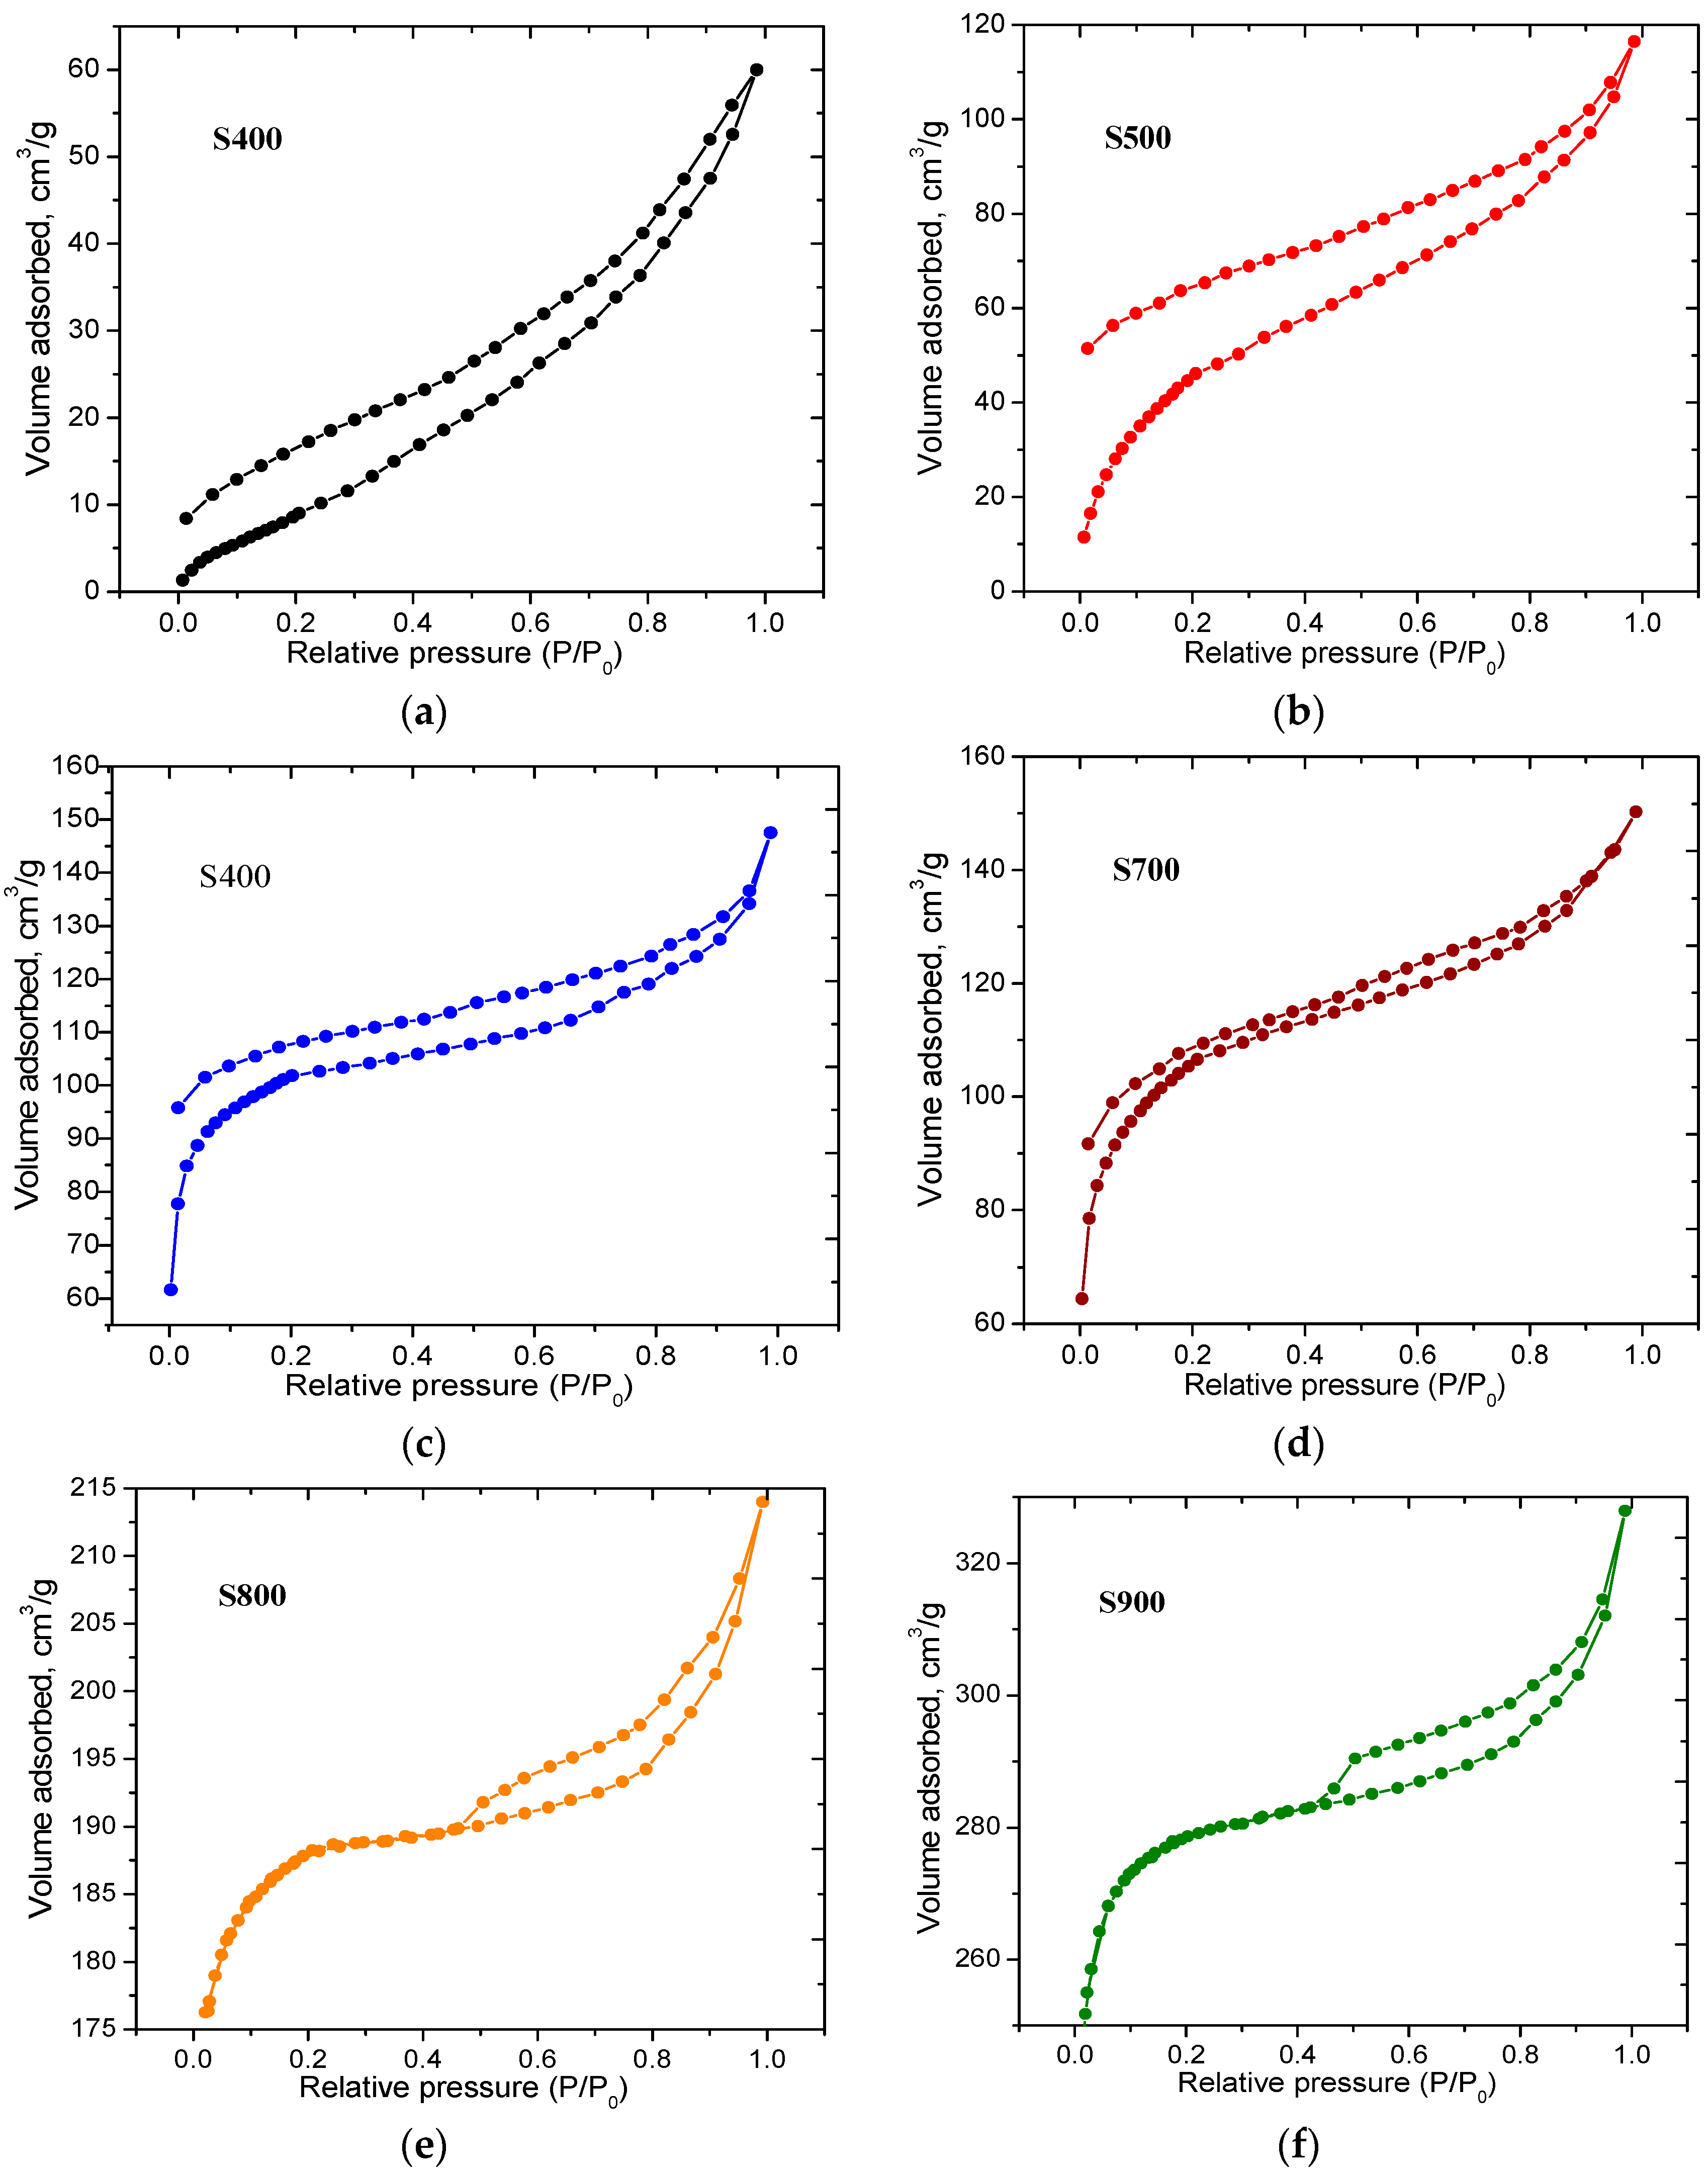
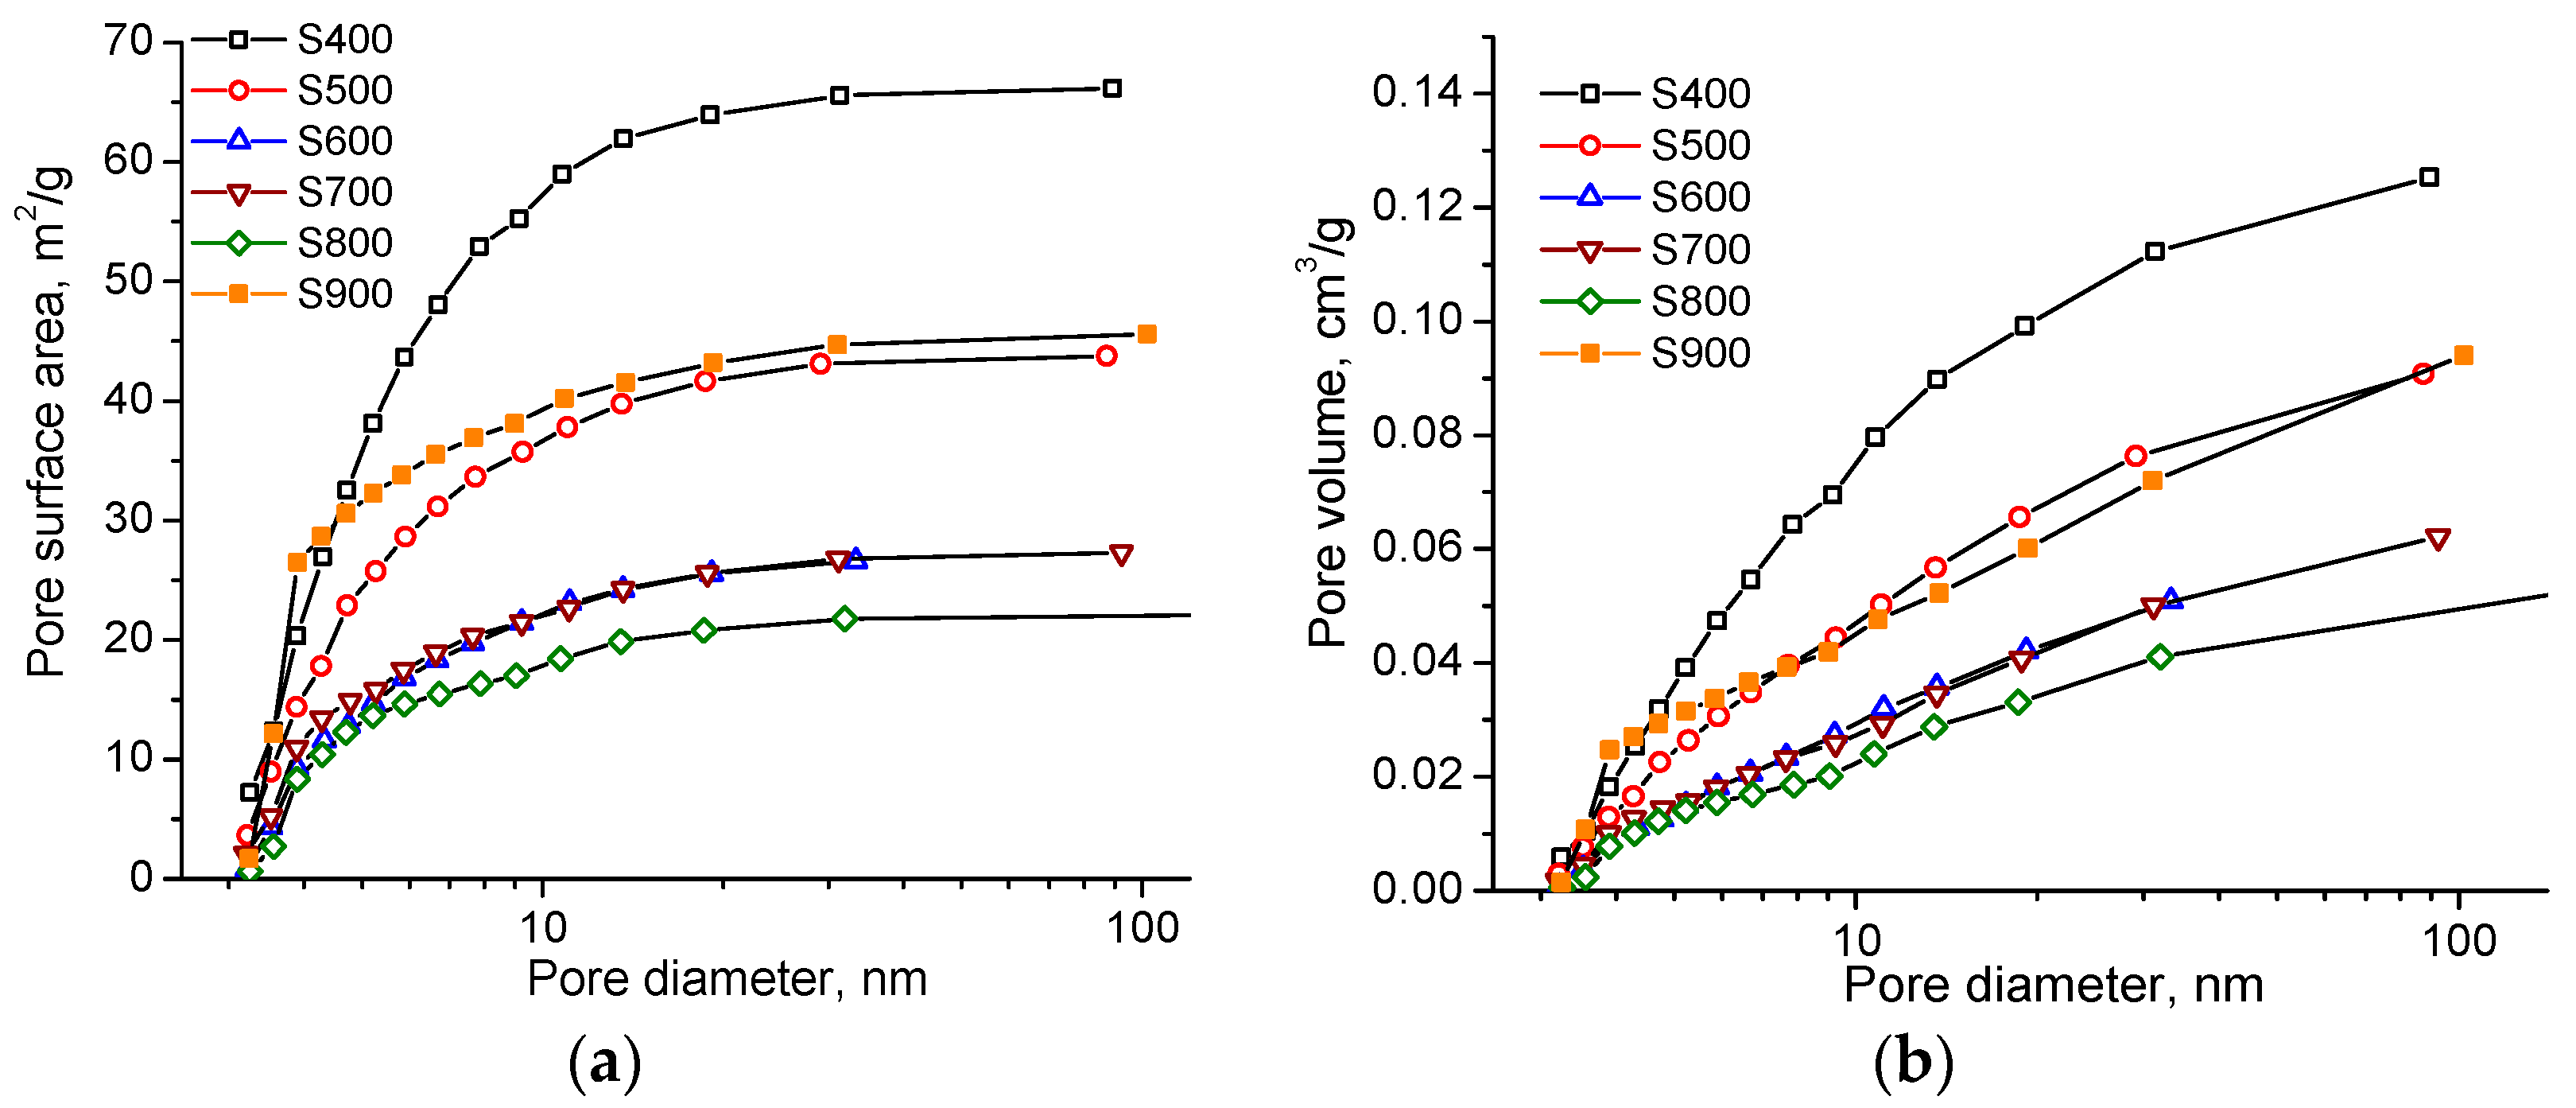
| SBET, m2/g | 31 | 172 | 374 | 446 | 703 | 1056 |
| SDFT, m2/g | 23 | 193 | 309 | 478 | 632 | 1170 |
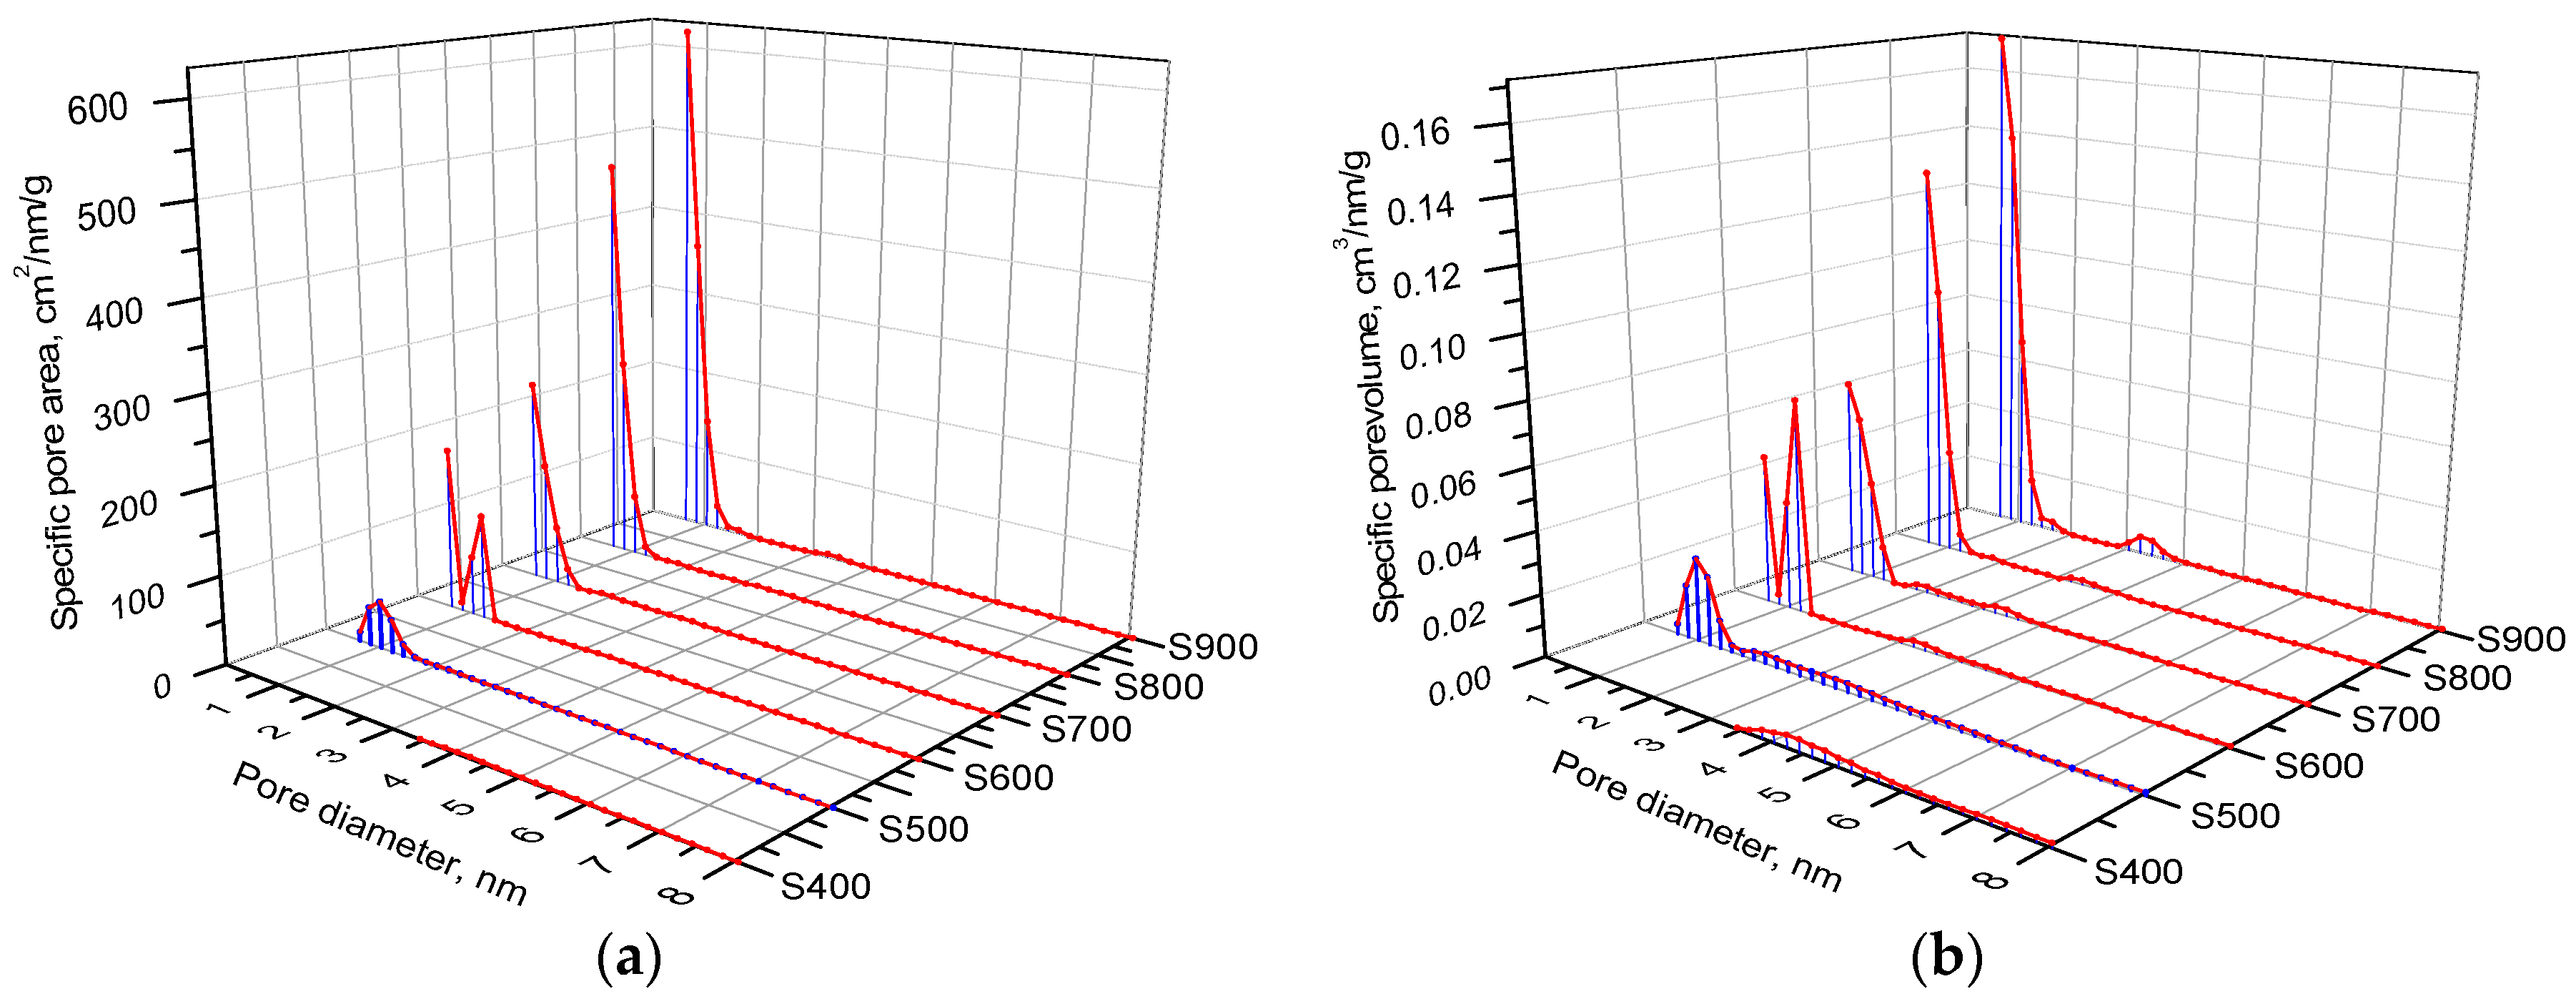
| Smeso, m2/g | 30 | 44 | 27 | 27 | 22 | 45 |
| Smicro, m2/g | – | 80 | 319 | 402 | 671 | 996 |
| Vtotal, cm3/g | 0.092 | 0.161 | 0.228 | 0.237 | 0.331 | 0.507 |
| Vmicro, cm3/g | – | 0.038 | 0.132 | 0.162 | 0.272 | 0.398 |
| Sample | Range I Single-Layer Adsorption | Range II Multilayer Adsorption | ||
|---|---|---|---|---|
| A | D = 3A + 3 | A | D = A + 3 | |
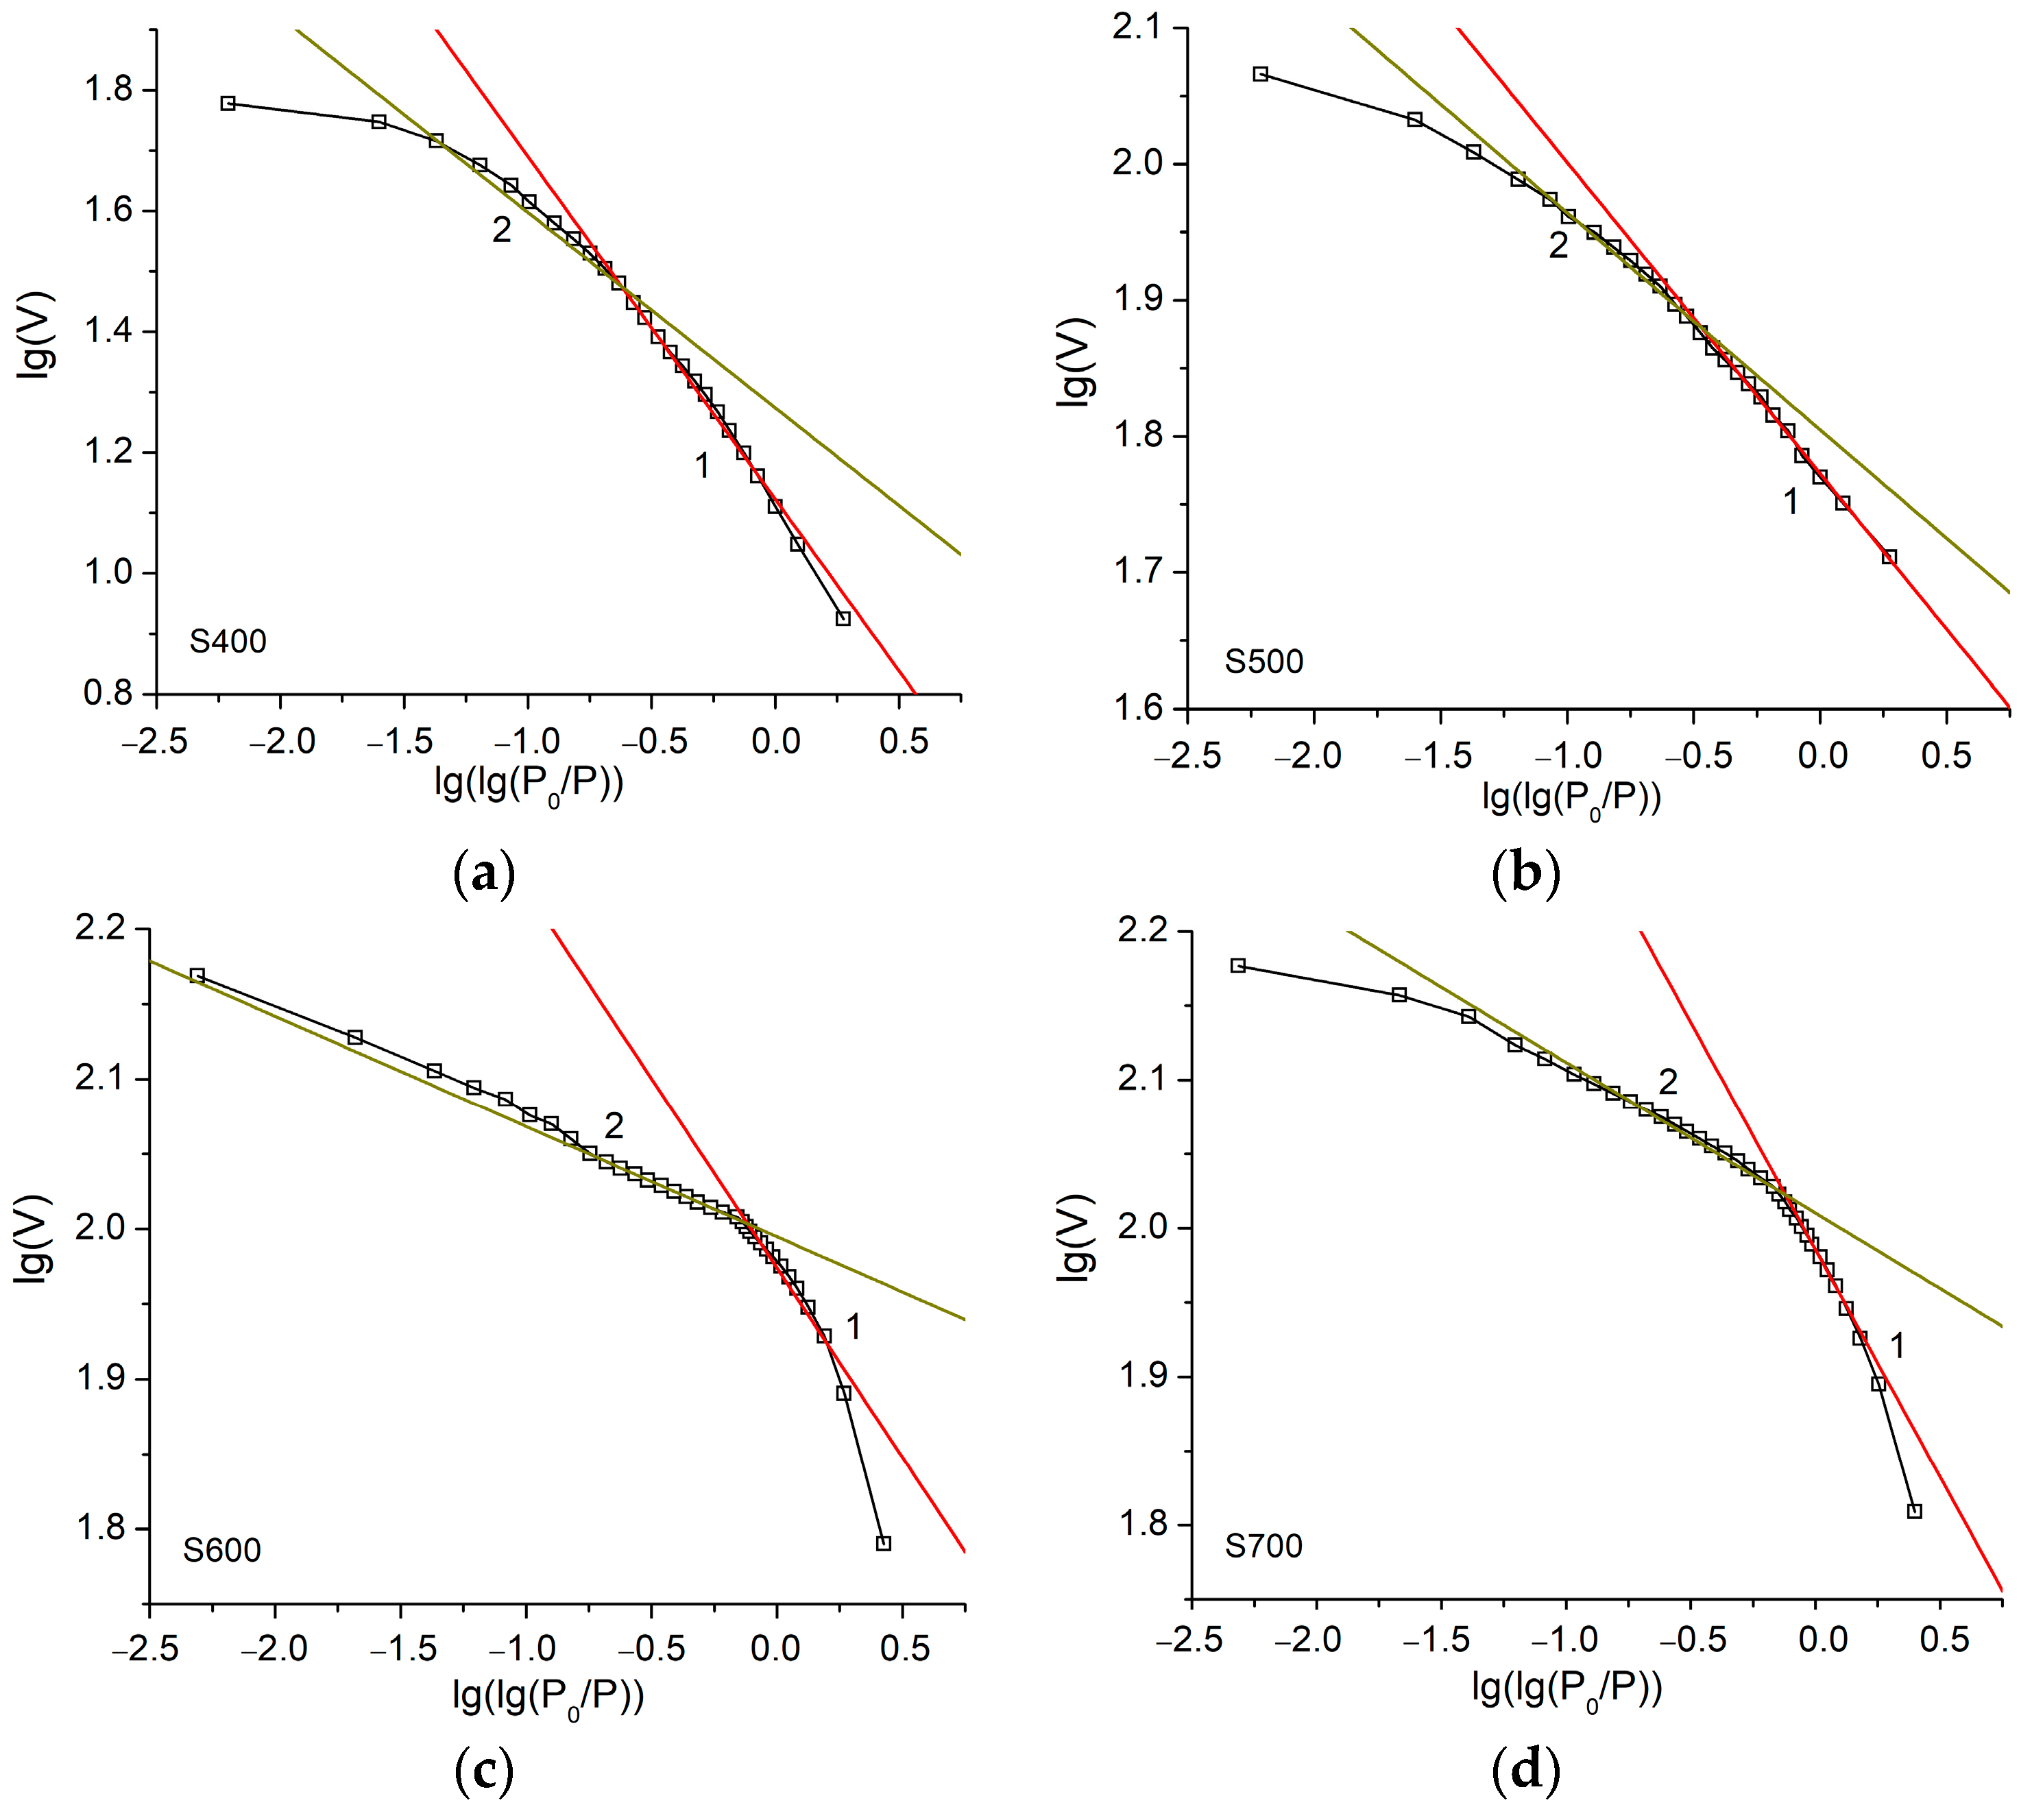
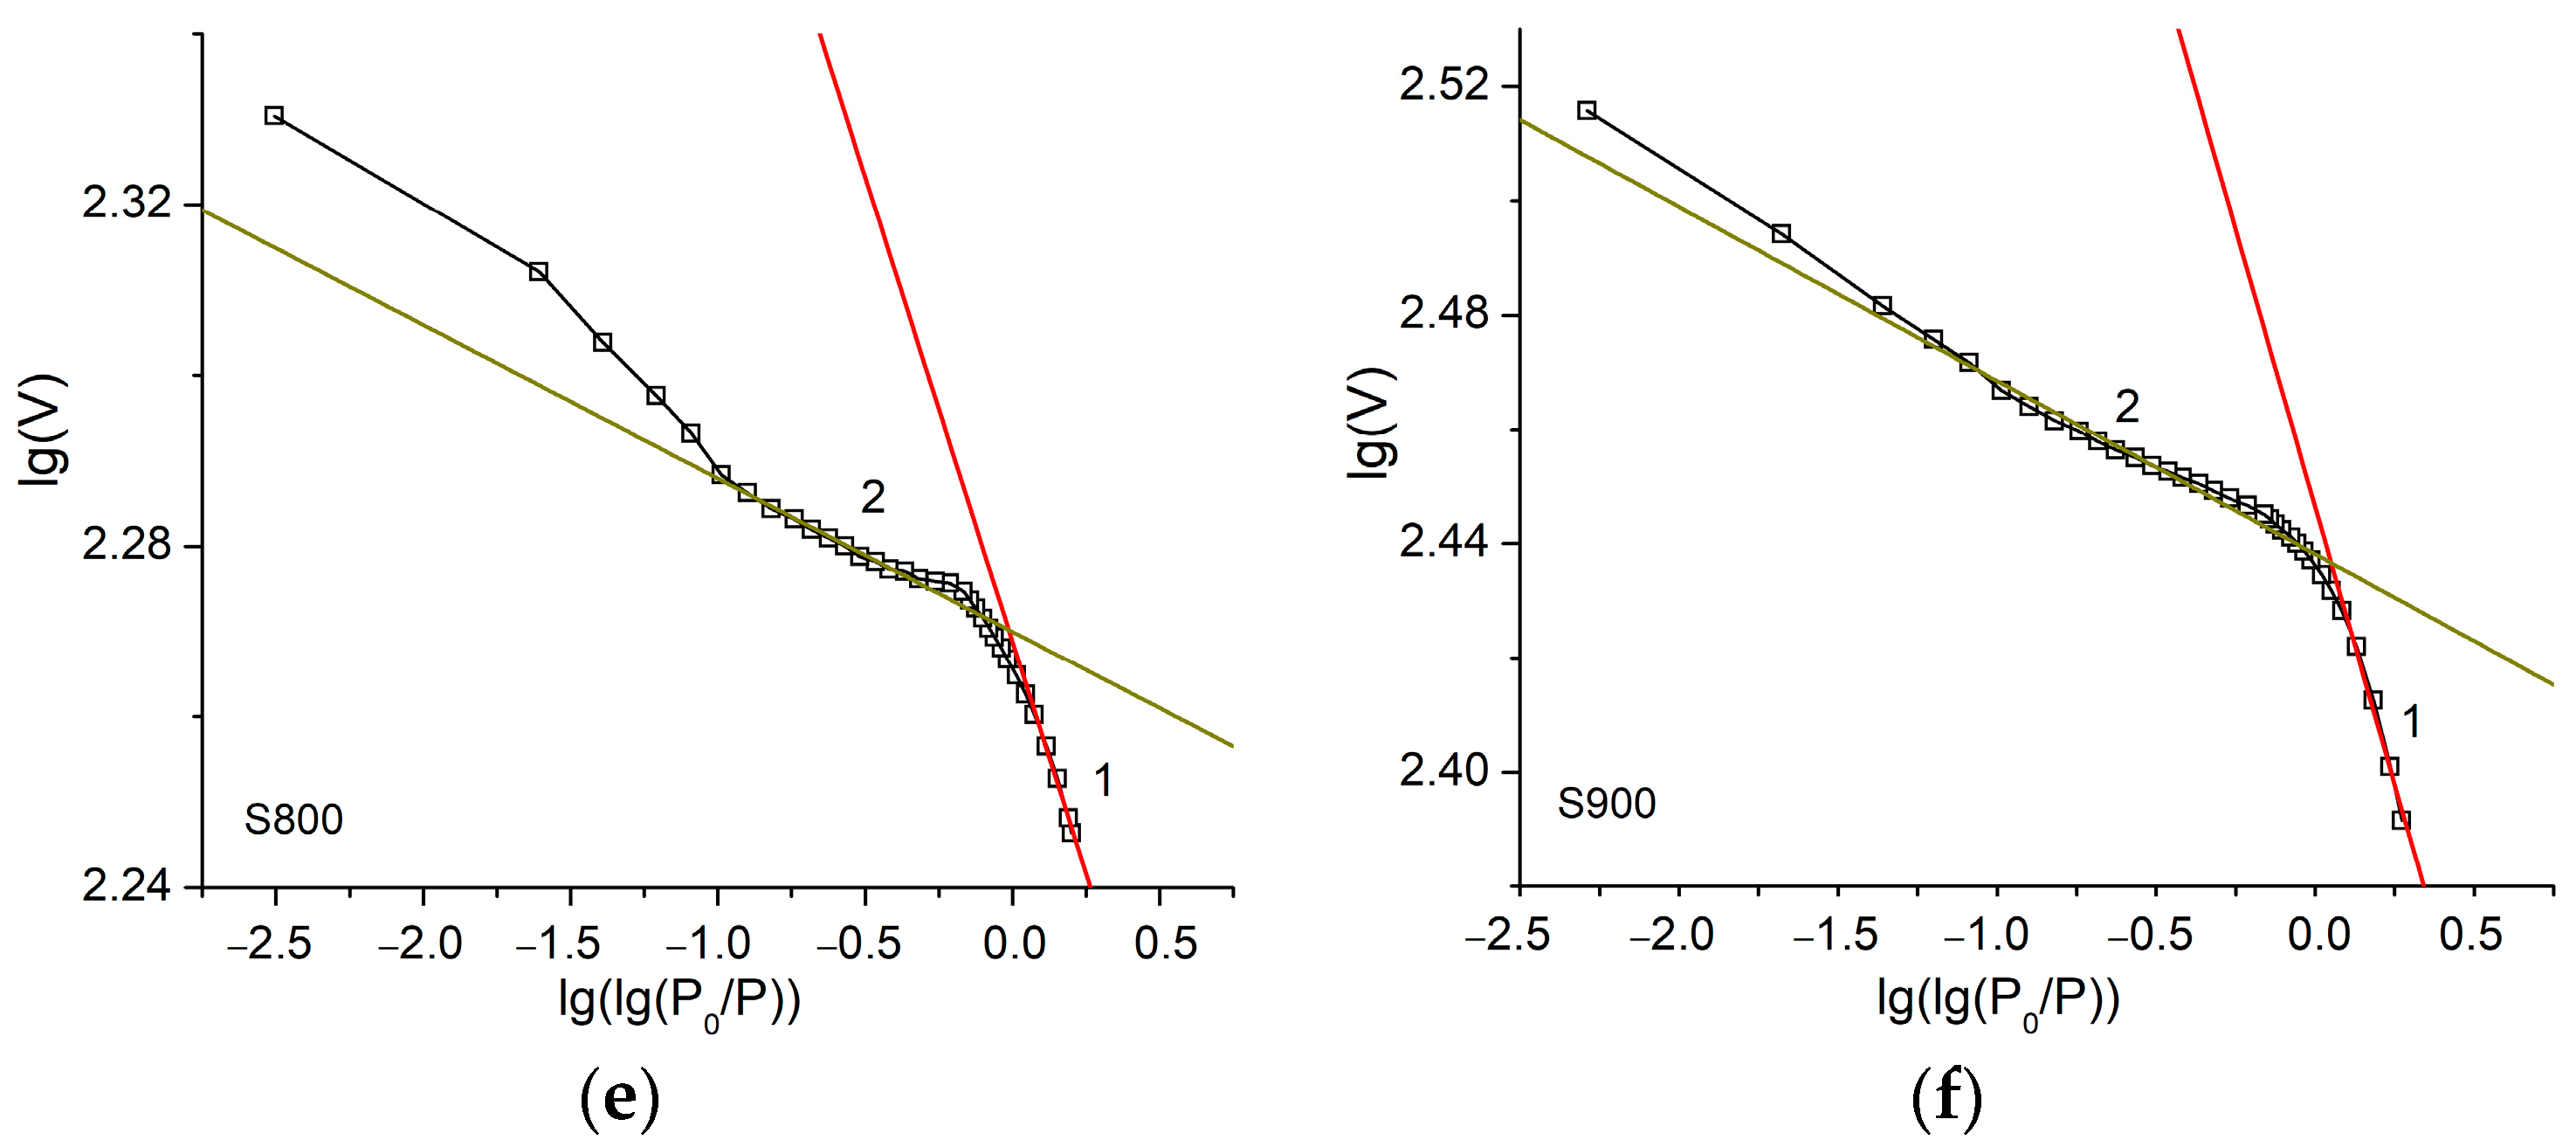
| S900 | −0.19 | 2.43 | −0.03 | 2.97 |
| S800 | −0.11 | 2.67 | −0.02 | 2.98 |
| S700 | −0.31 | 2.07 | −0.11 | 2.89 |
| S600 | −0.25 | 2.25 | −0.17 | 2.83 |
| S500 | −0.23 | 2.31 | −0.34 | 2.66 |
| S400 | −0.56 | 1.32 | −0.32 | 2.68 |
Disclaimer/Publisher’s Note: The statements, opinions and data contained in all publications are solely those of the individual author(s) and contributor(s) and not of MDPI and/or the editor(s). MDPI and/or the editor(s) disclaim responsibility for any injury to people or property resulting from any ideas, methods, instructions or products referred to in the content. |
© 2023 by the authors. Licensee MDPI, Basel, Switzerland. This article is an open access article distributed under the terms and conditions of the Creative Commons Attribution (CC BY) license (https://creativecommons.org/licenses/by/4.0/).
Share and Cite
Sklepova, S.V.; Ivanichok, N.; Kolkovskyi, P.; Kotsyubynsky, V.; Boychuk, V.; Rachiy, B.; Uhryński, A.; Bembenek, M.; Ropyak, L. Porous Structure and Fractal Dimensions of Activated Carbon Prepared from Waste Coffee Grounds. Materials 2023, 16, 6127. https://doi.org/10.3390/ma16186127
Sklepova SV, Ivanichok N, Kolkovskyi P, Kotsyubynsky V, Boychuk V, Rachiy B, Uhryński A, Bembenek M, Ropyak L. Porous Structure and Fractal Dimensions of Activated Carbon Prepared from Waste Coffee Grounds. Materials. 2023; 16(18):6127. https://doi.org/10.3390/ma16186127
Chicago/Turabian StyleSklepova, Sofiia Victoriia, Nataliia Ivanichok, Pavlo Kolkovskyi, Volodymyr Kotsyubynsky, Volodymyra Boychuk, Bogdan Rachiy, Andrzej Uhryński, Michał Bembenek, and Liubomyr Ropyak. 2023. "Porous Structure and Fractal Dimensions of Activated Carbon Prepared from Waste Coffee Grounds" Materials 16, no. 18: 6127. https://doi.org/10.3390/ma16186127