
Comparison of the Permeability of Potential Ballast Rocks from Northern Rio de Janeiro State under Different Fouling Rates after Sodium Sulfate Attack
 , and
, and
Abstract
:1. Introduction
2. Materials and Methods
3. Results
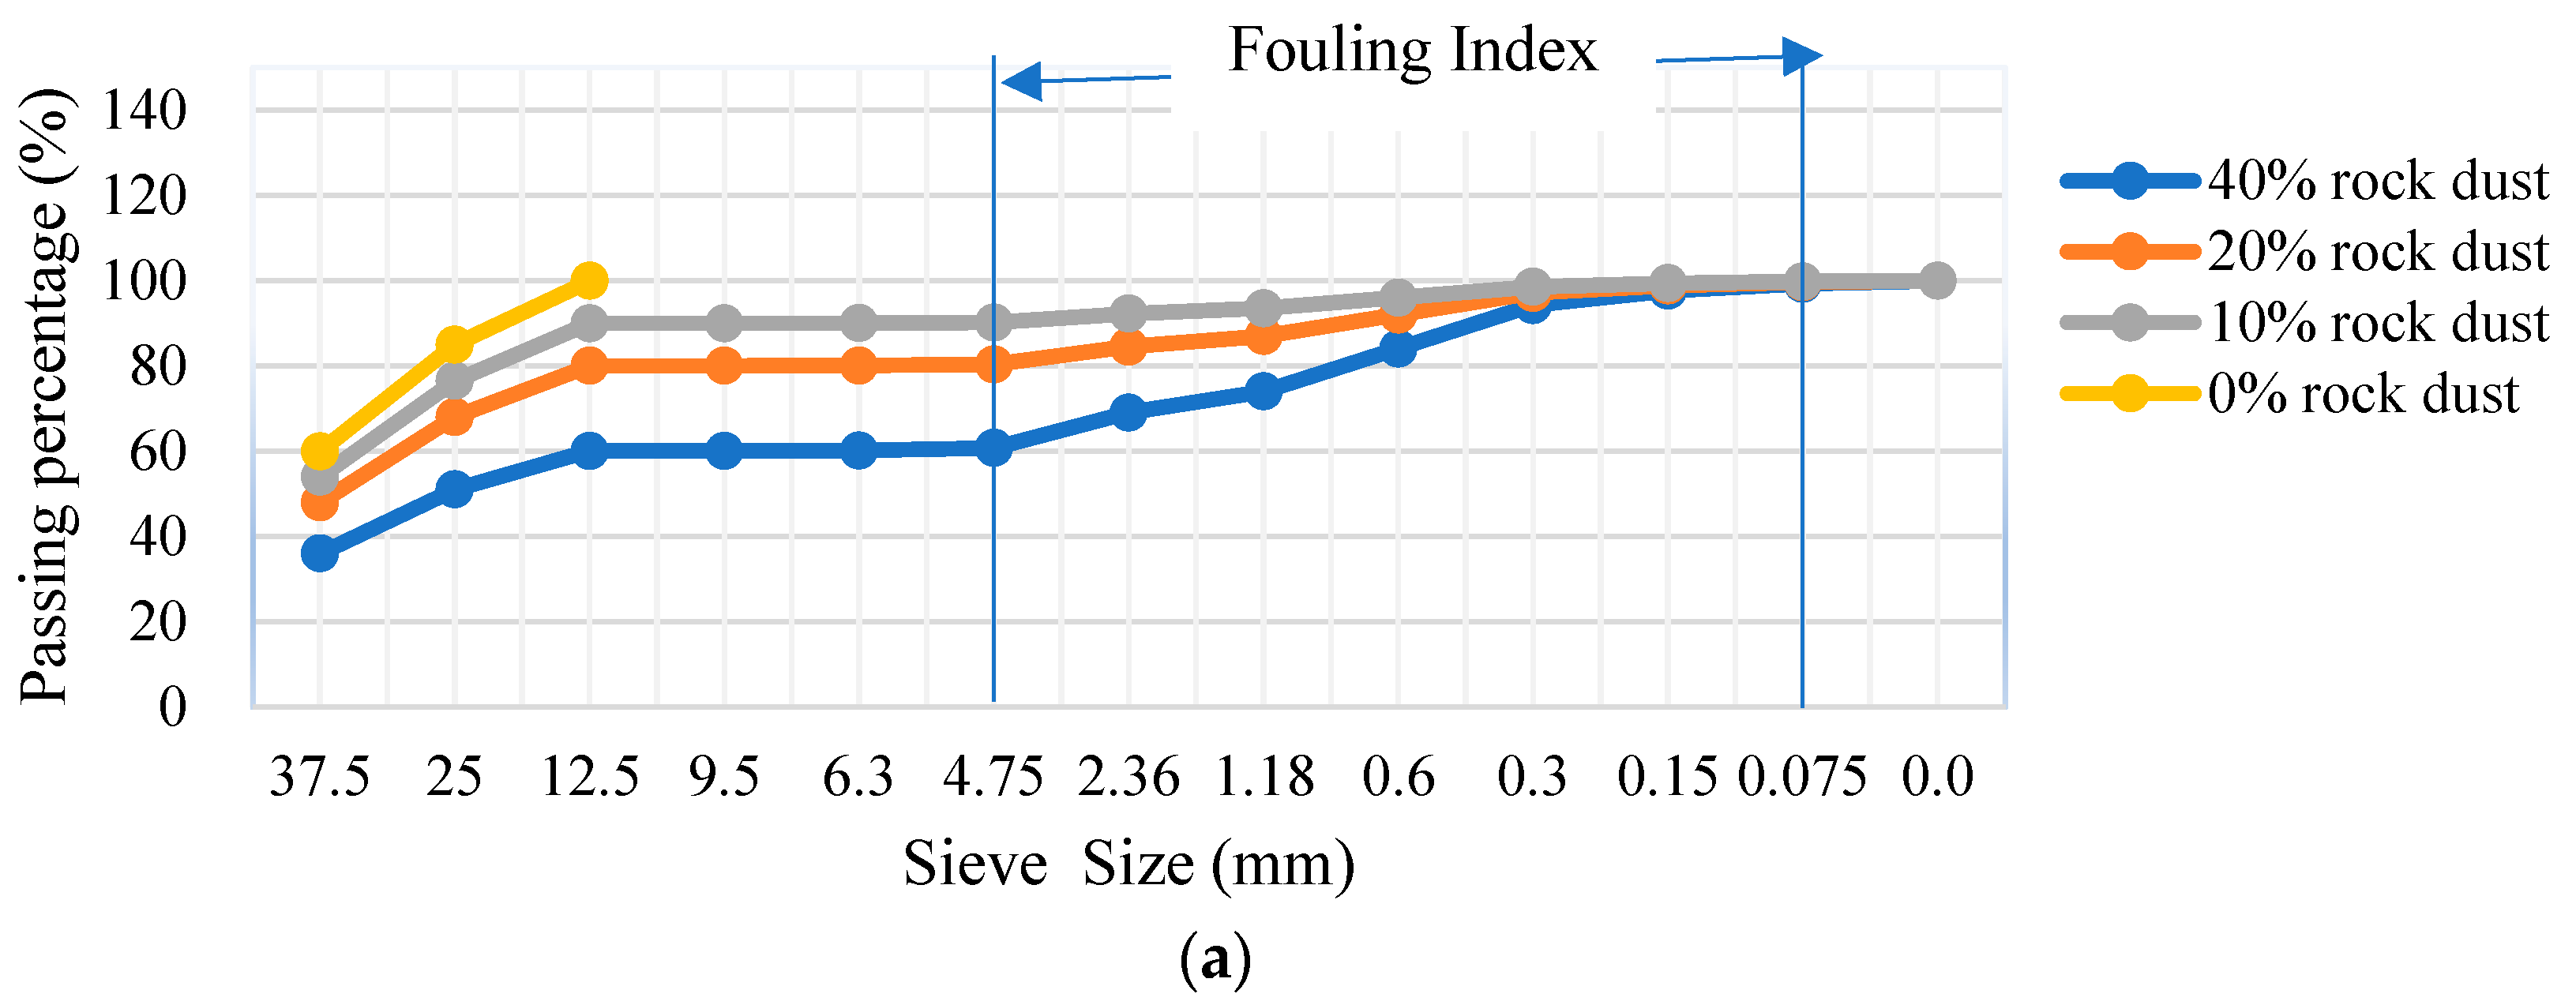
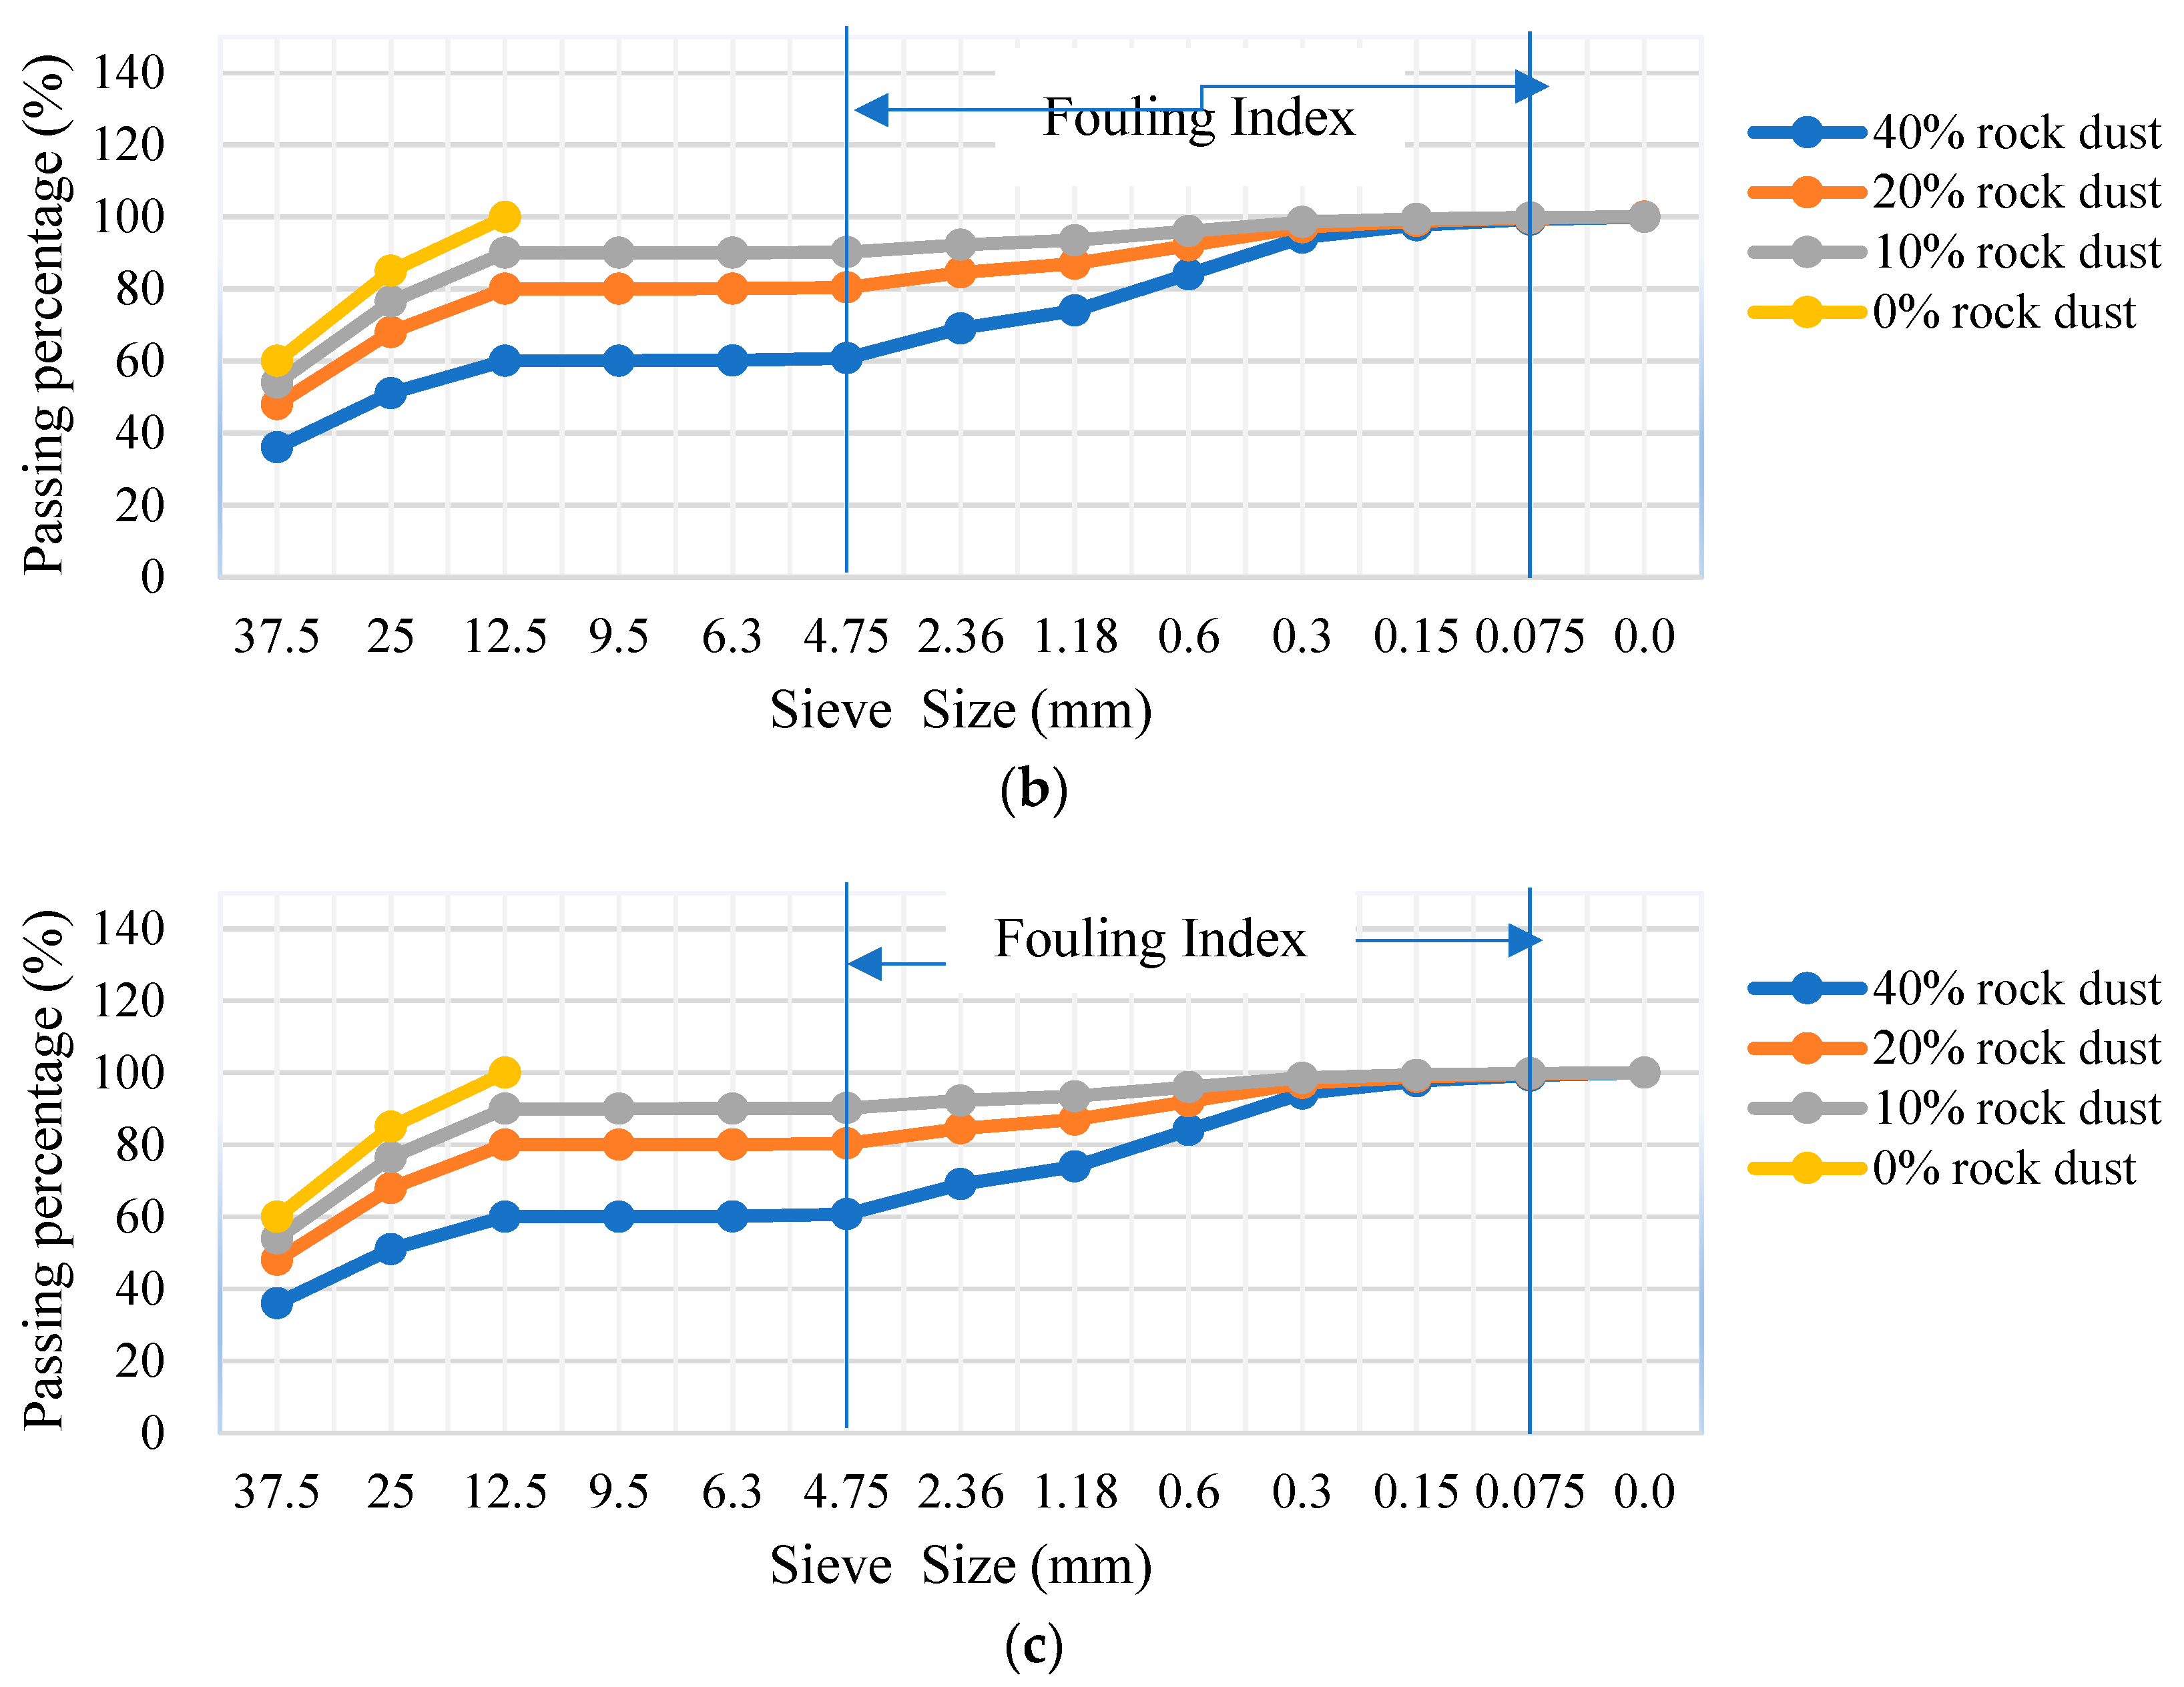
3.1. Granulometry
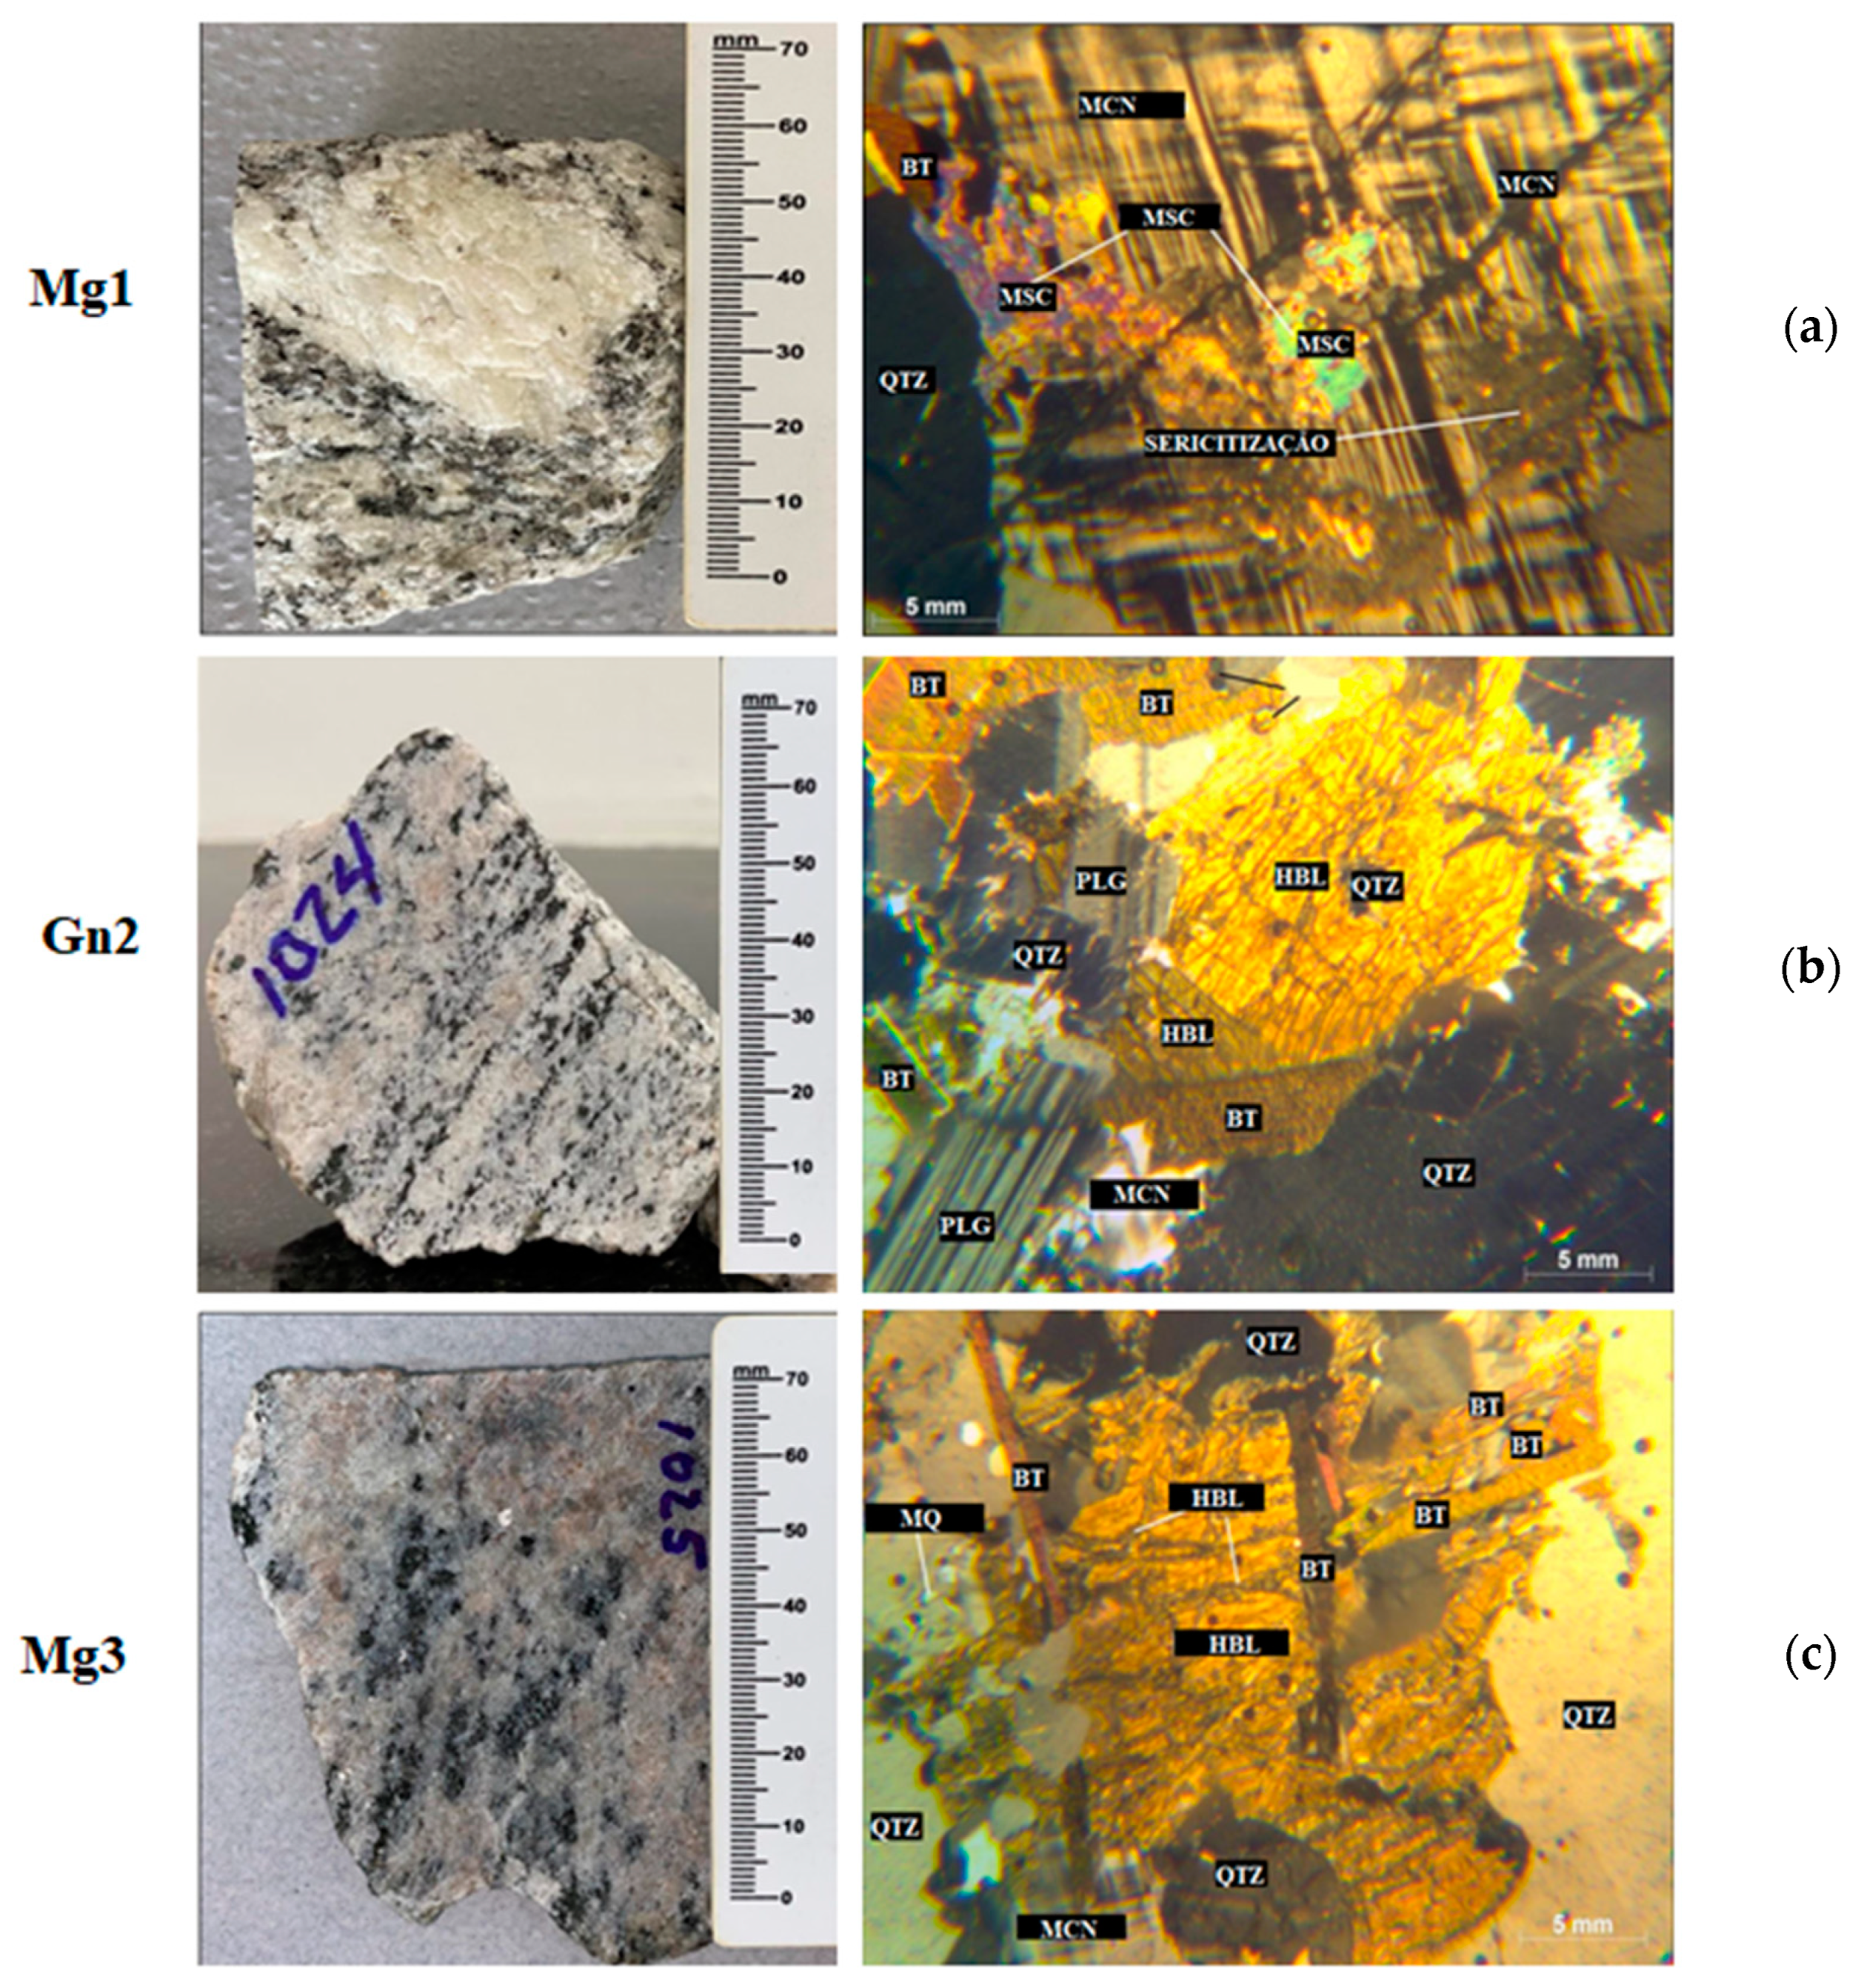
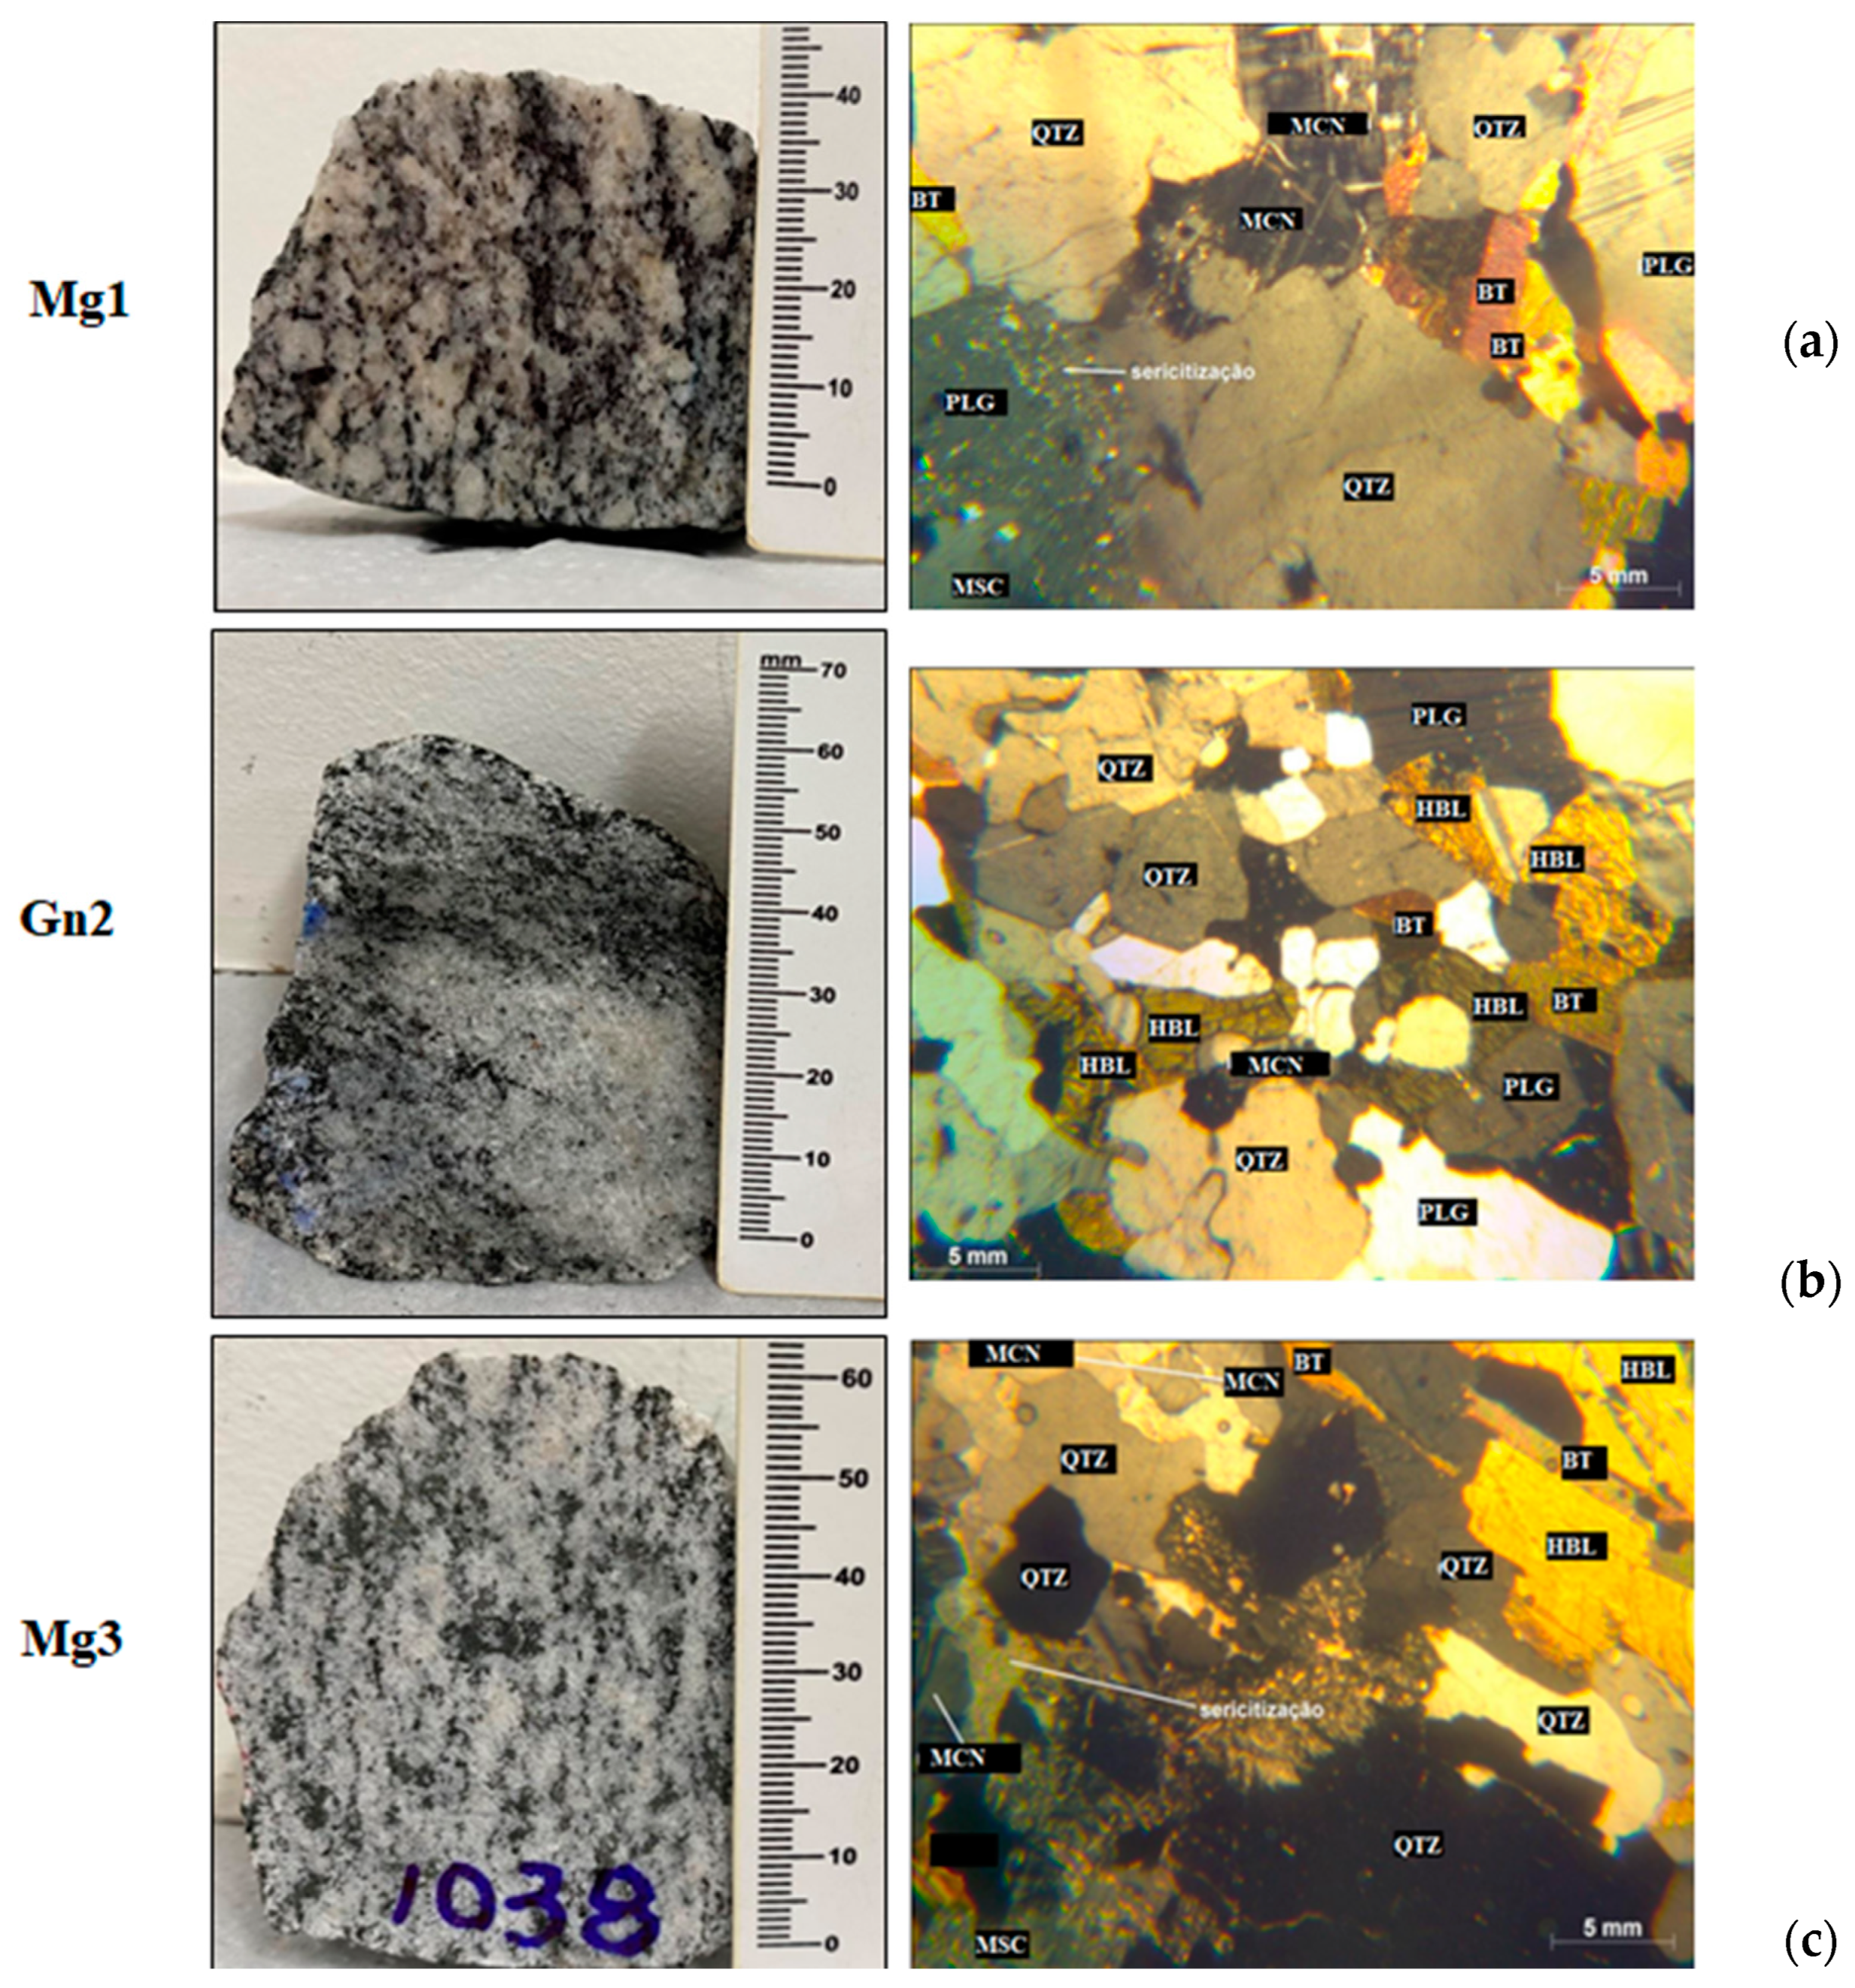
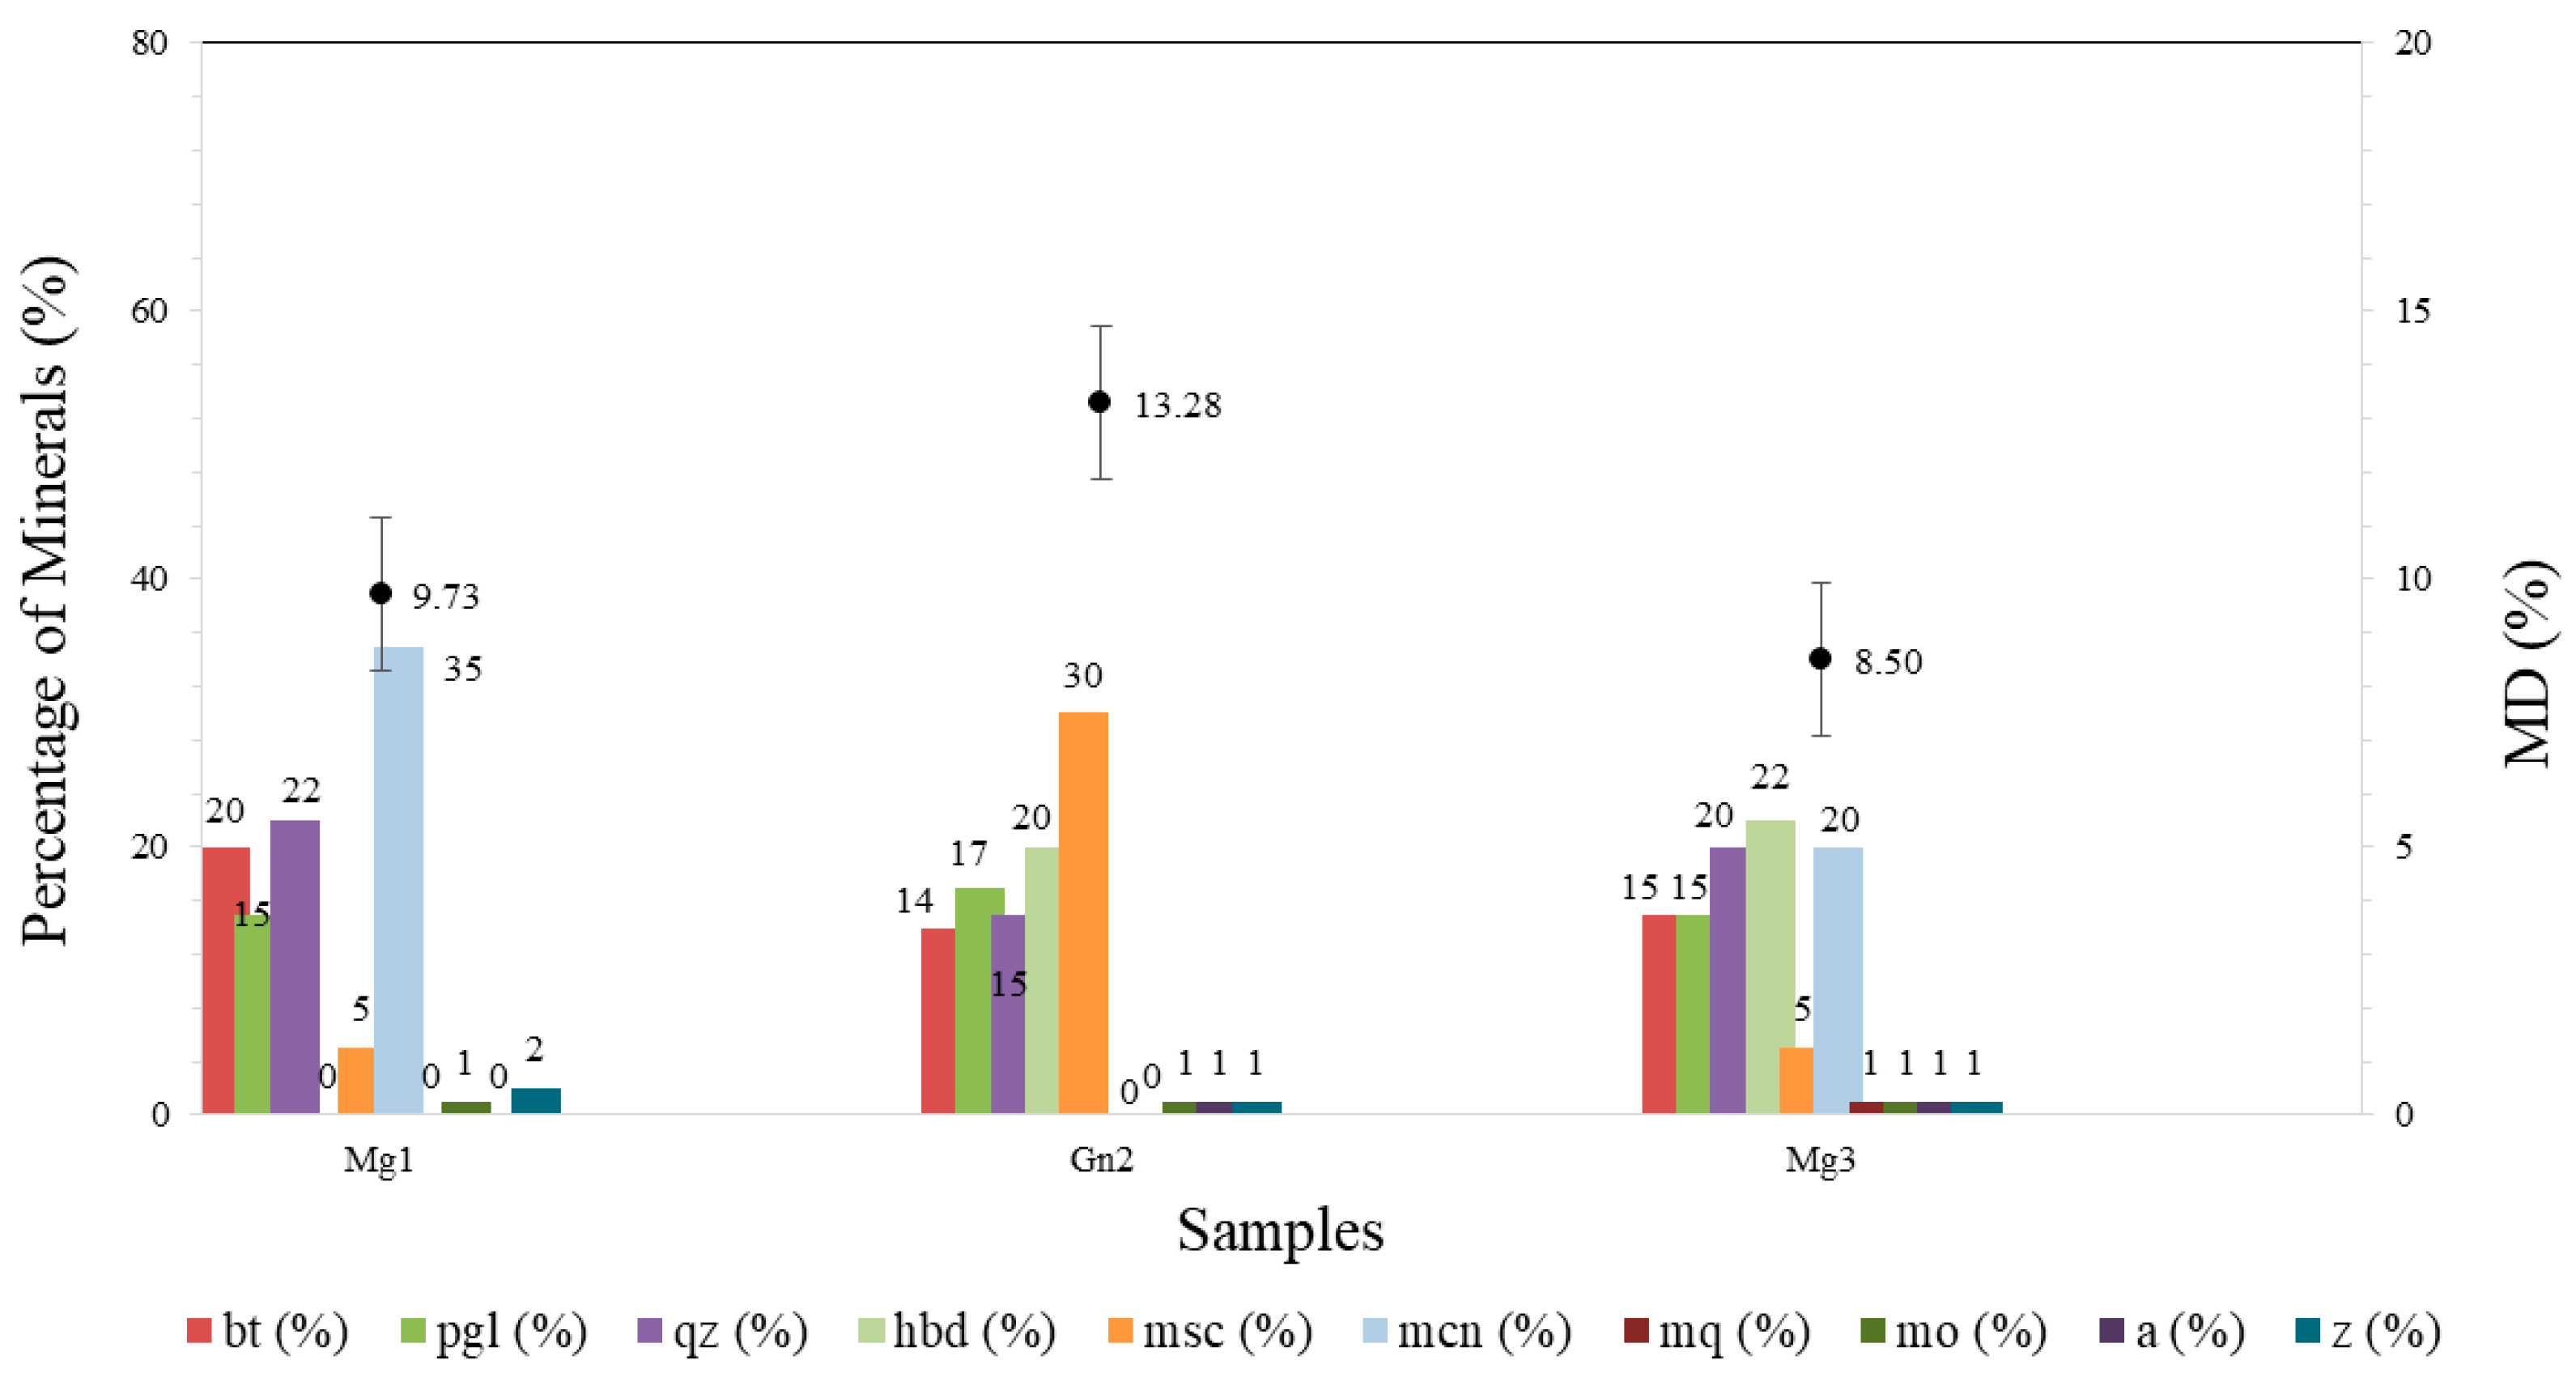
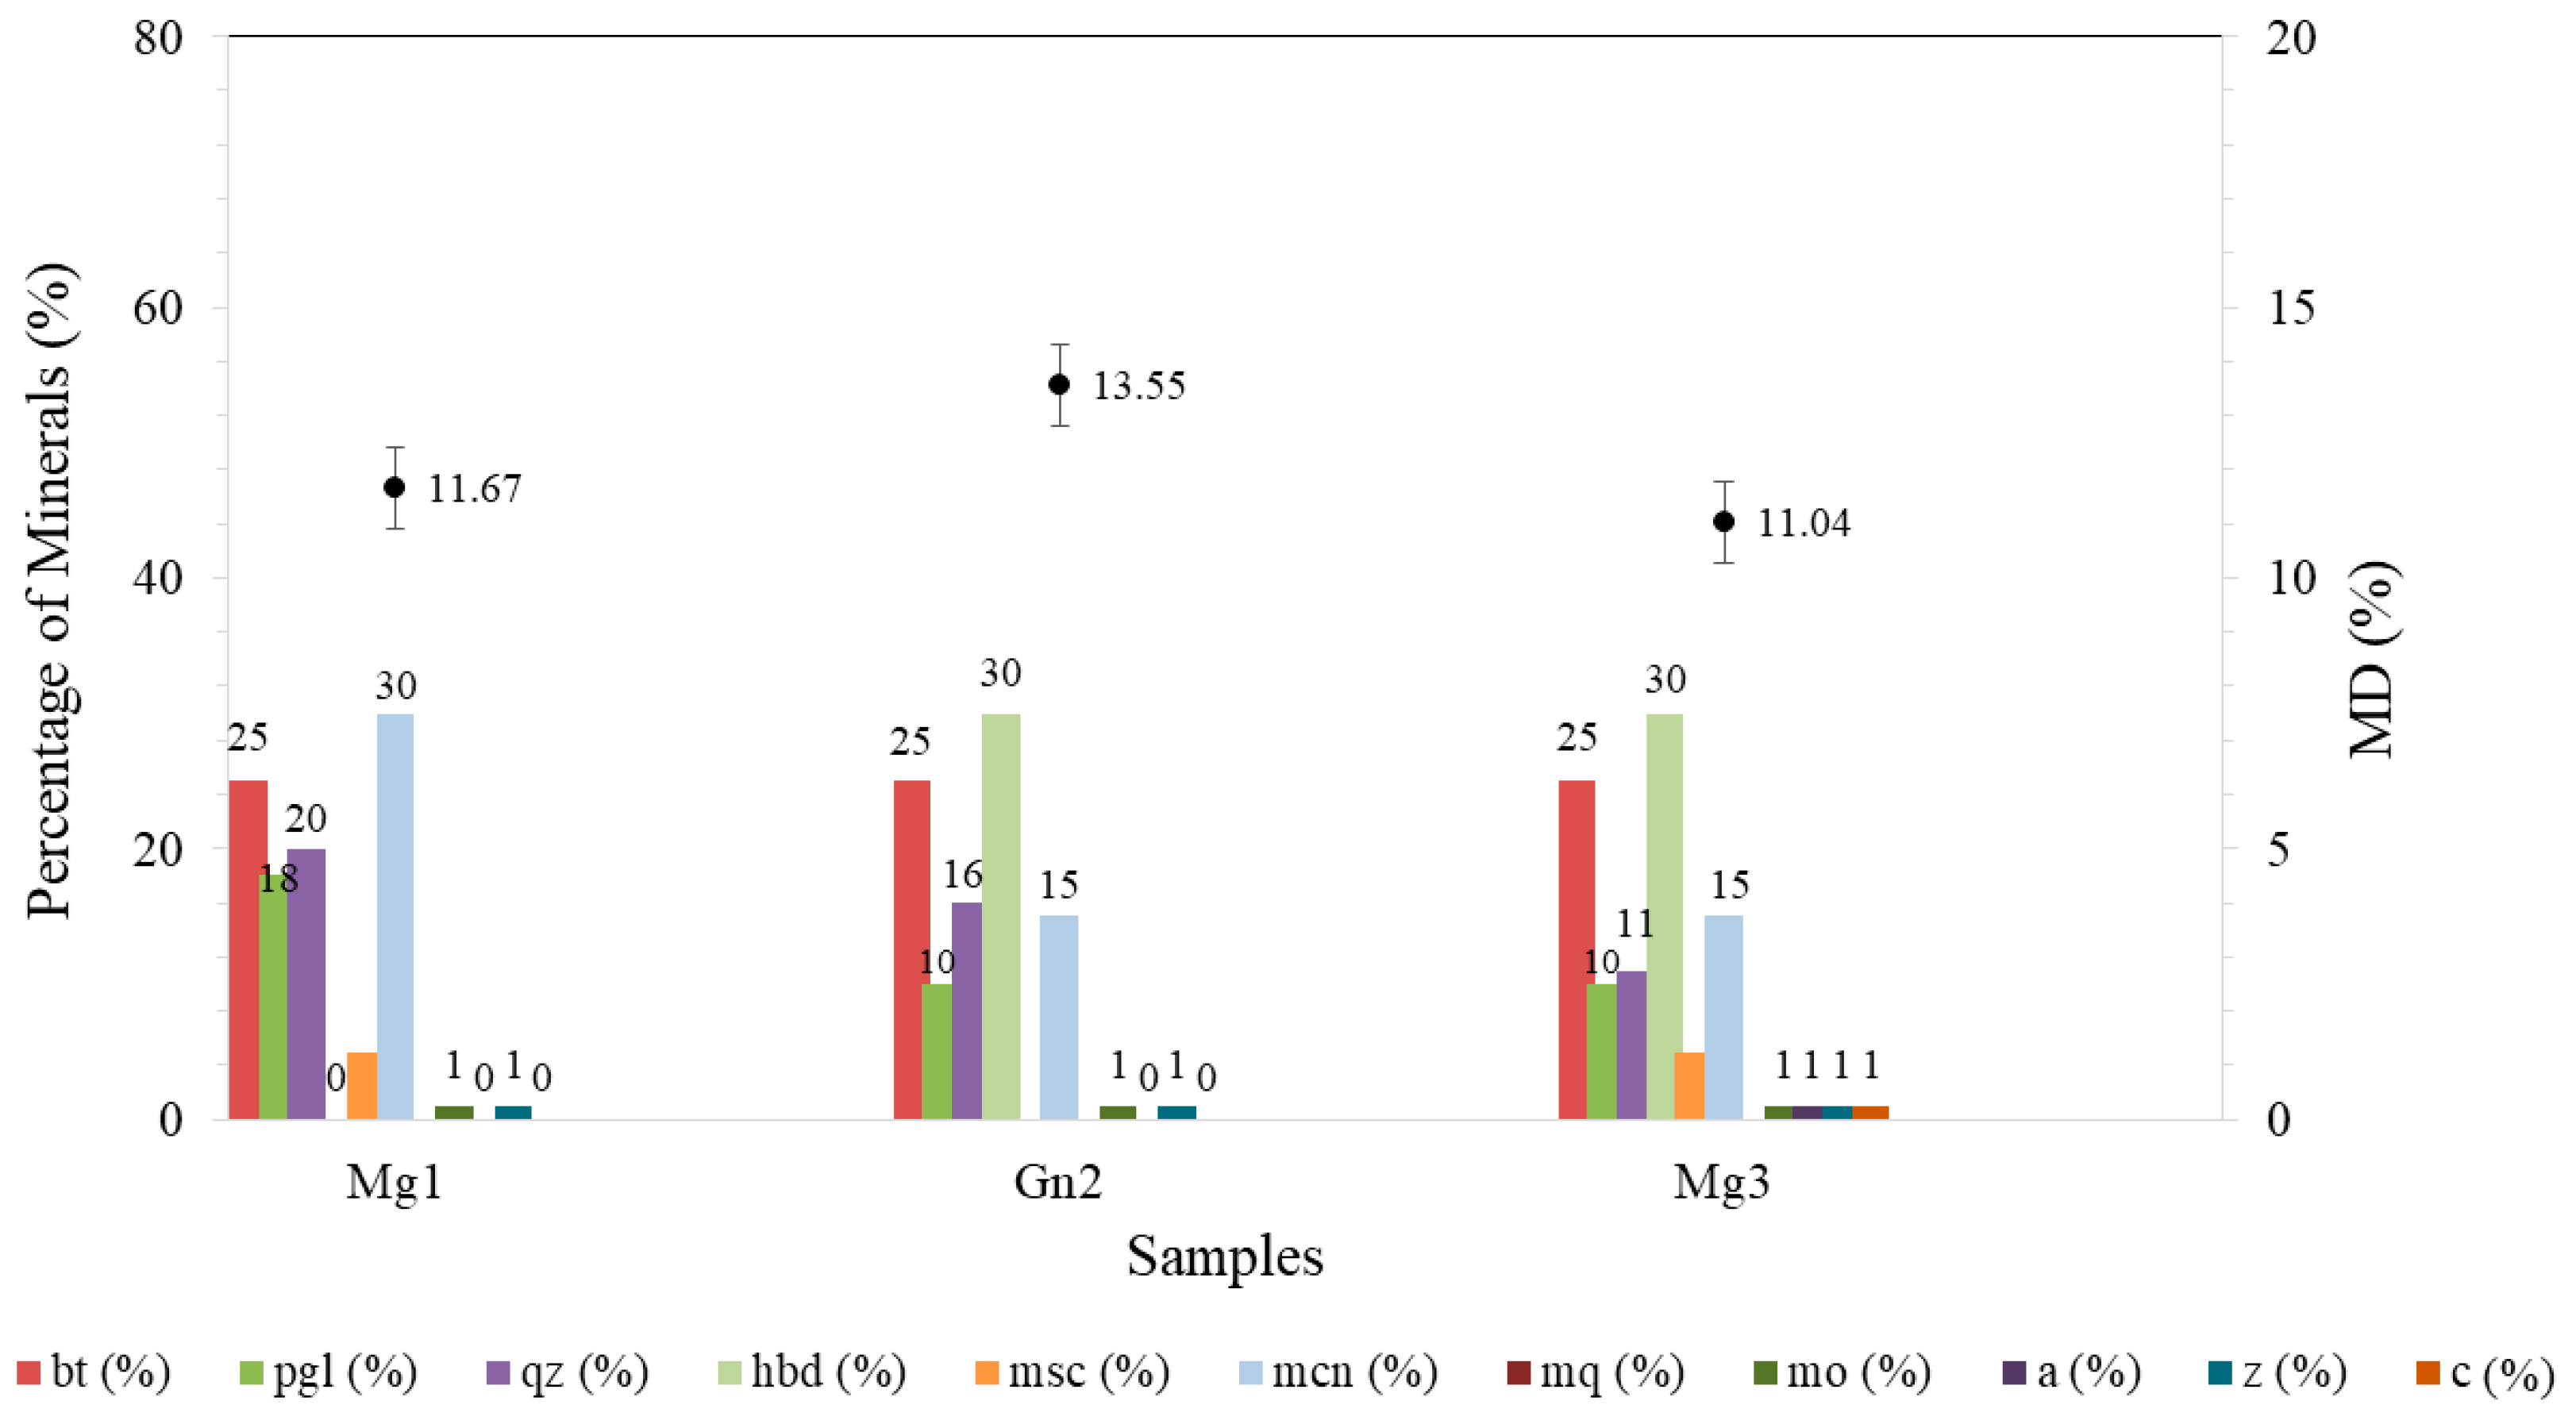
3.2. Petrography
3.3. Physical Indices
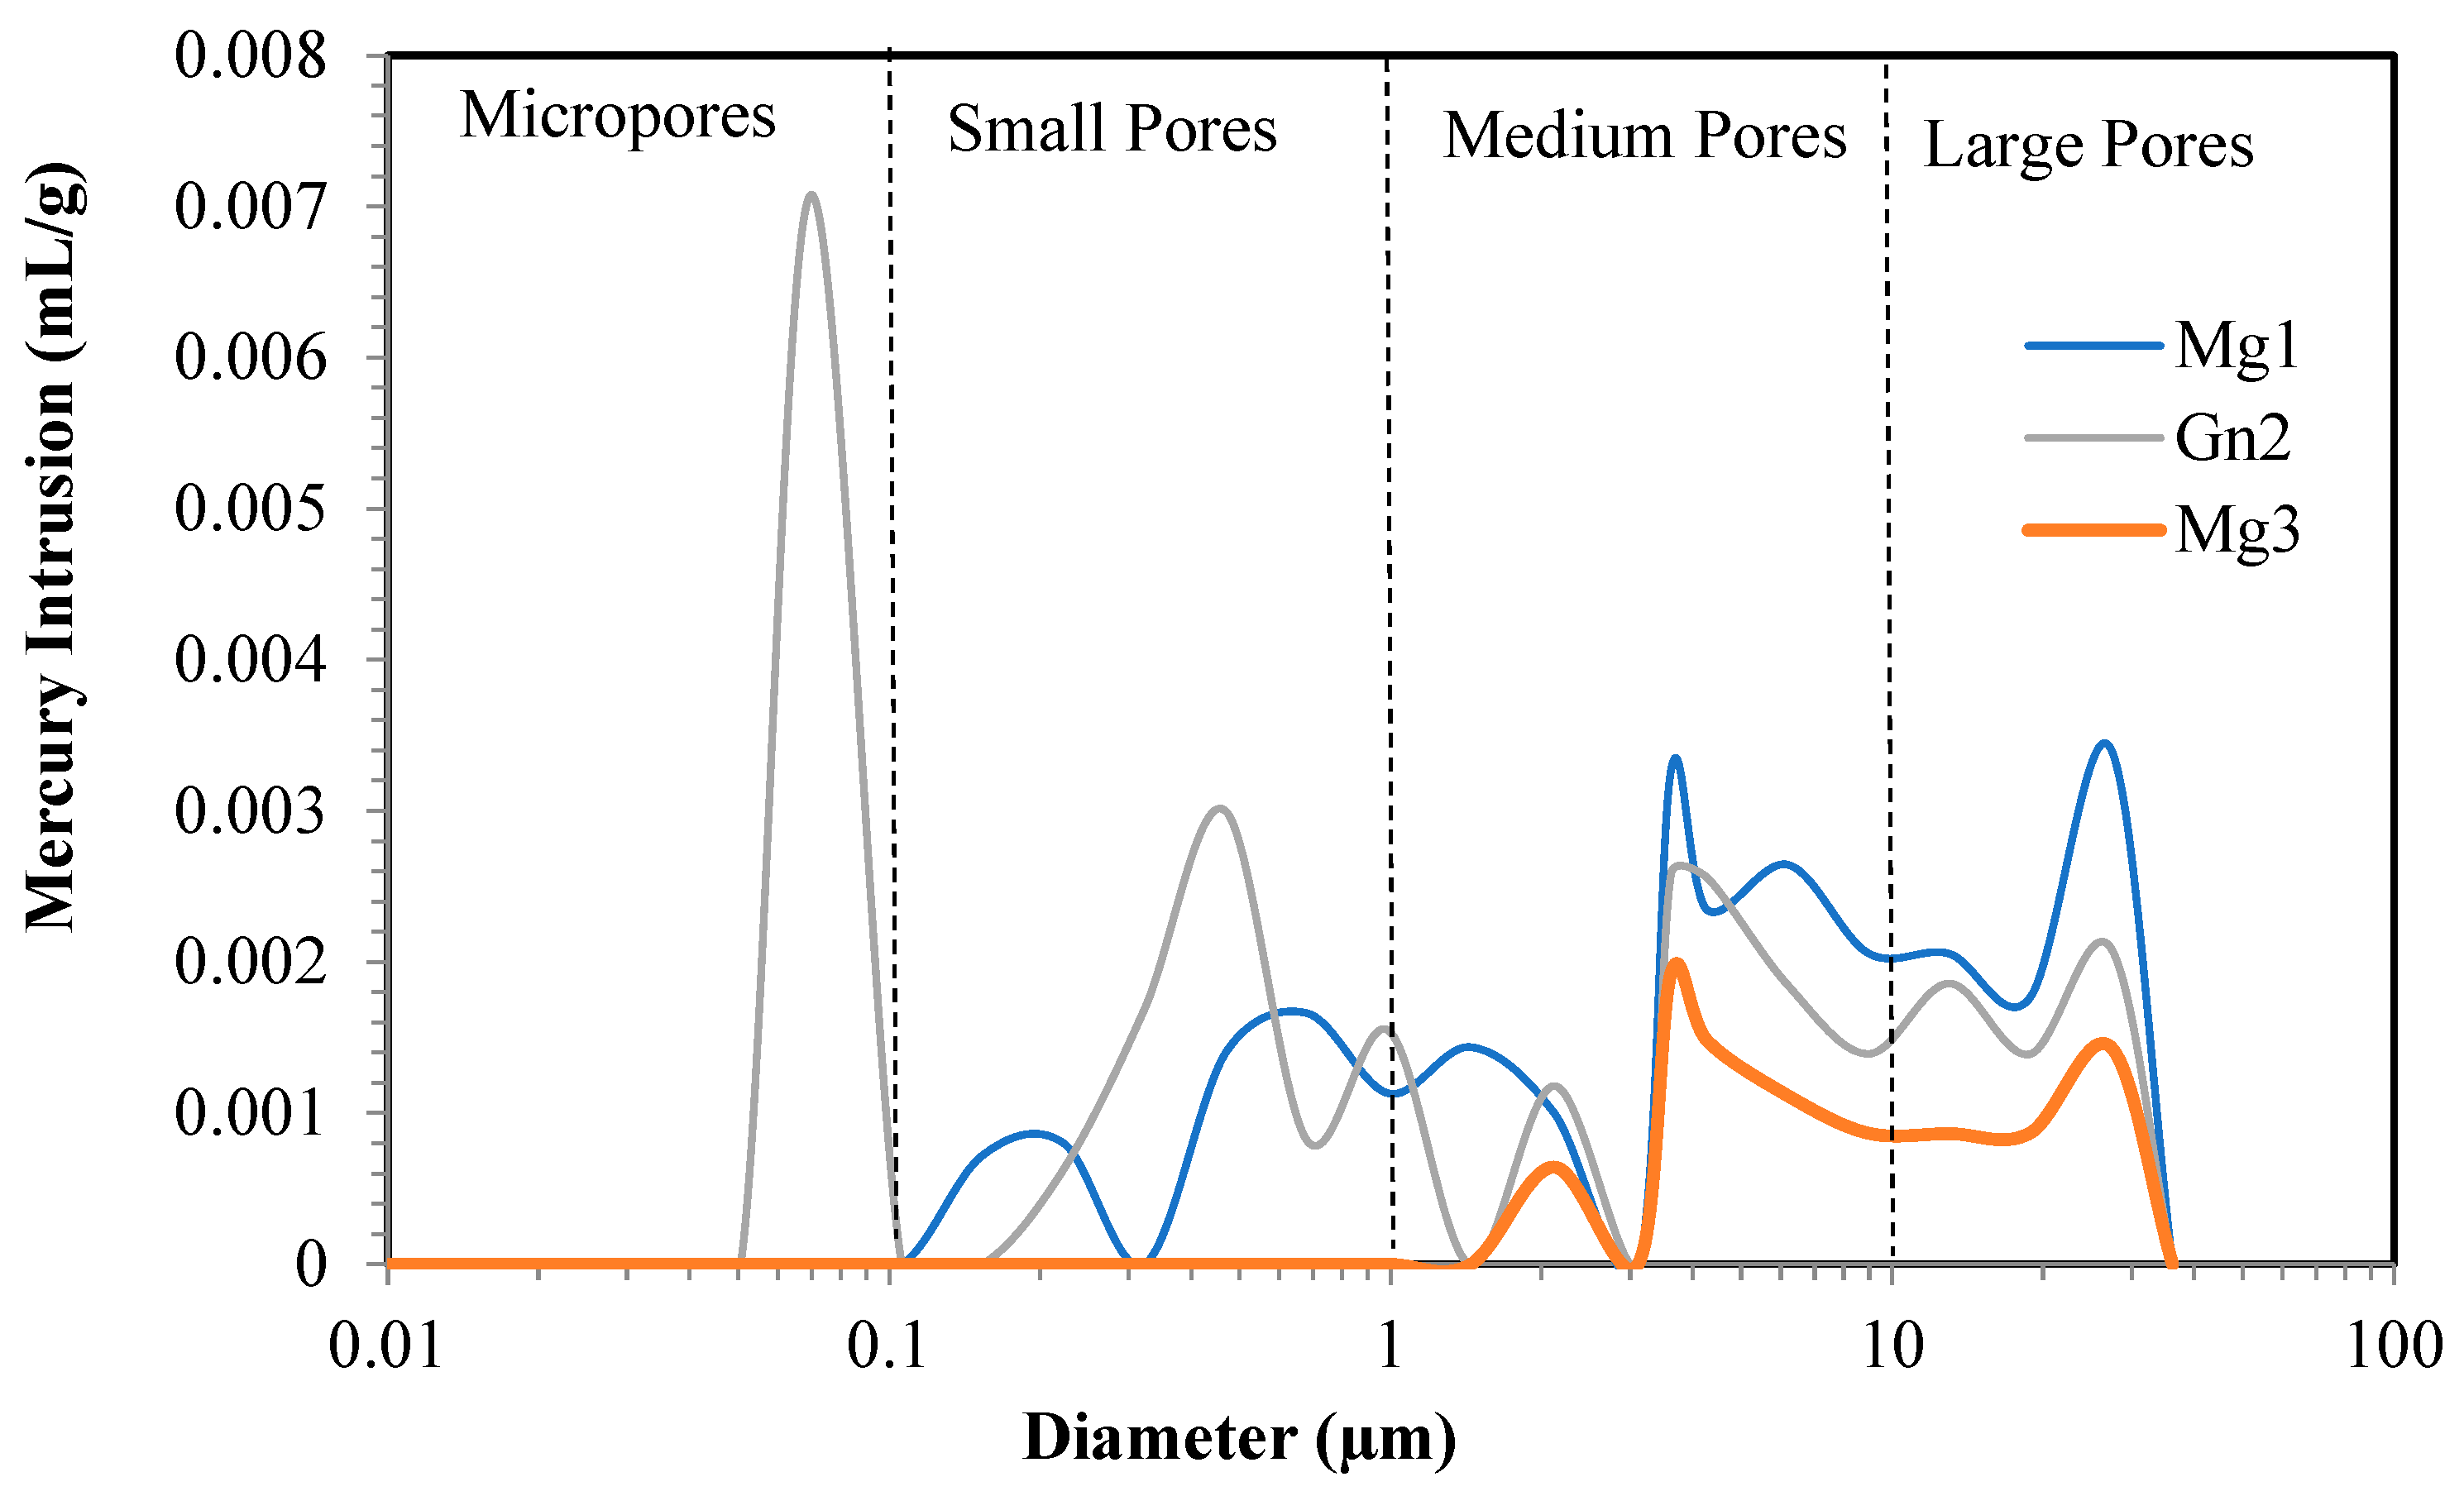
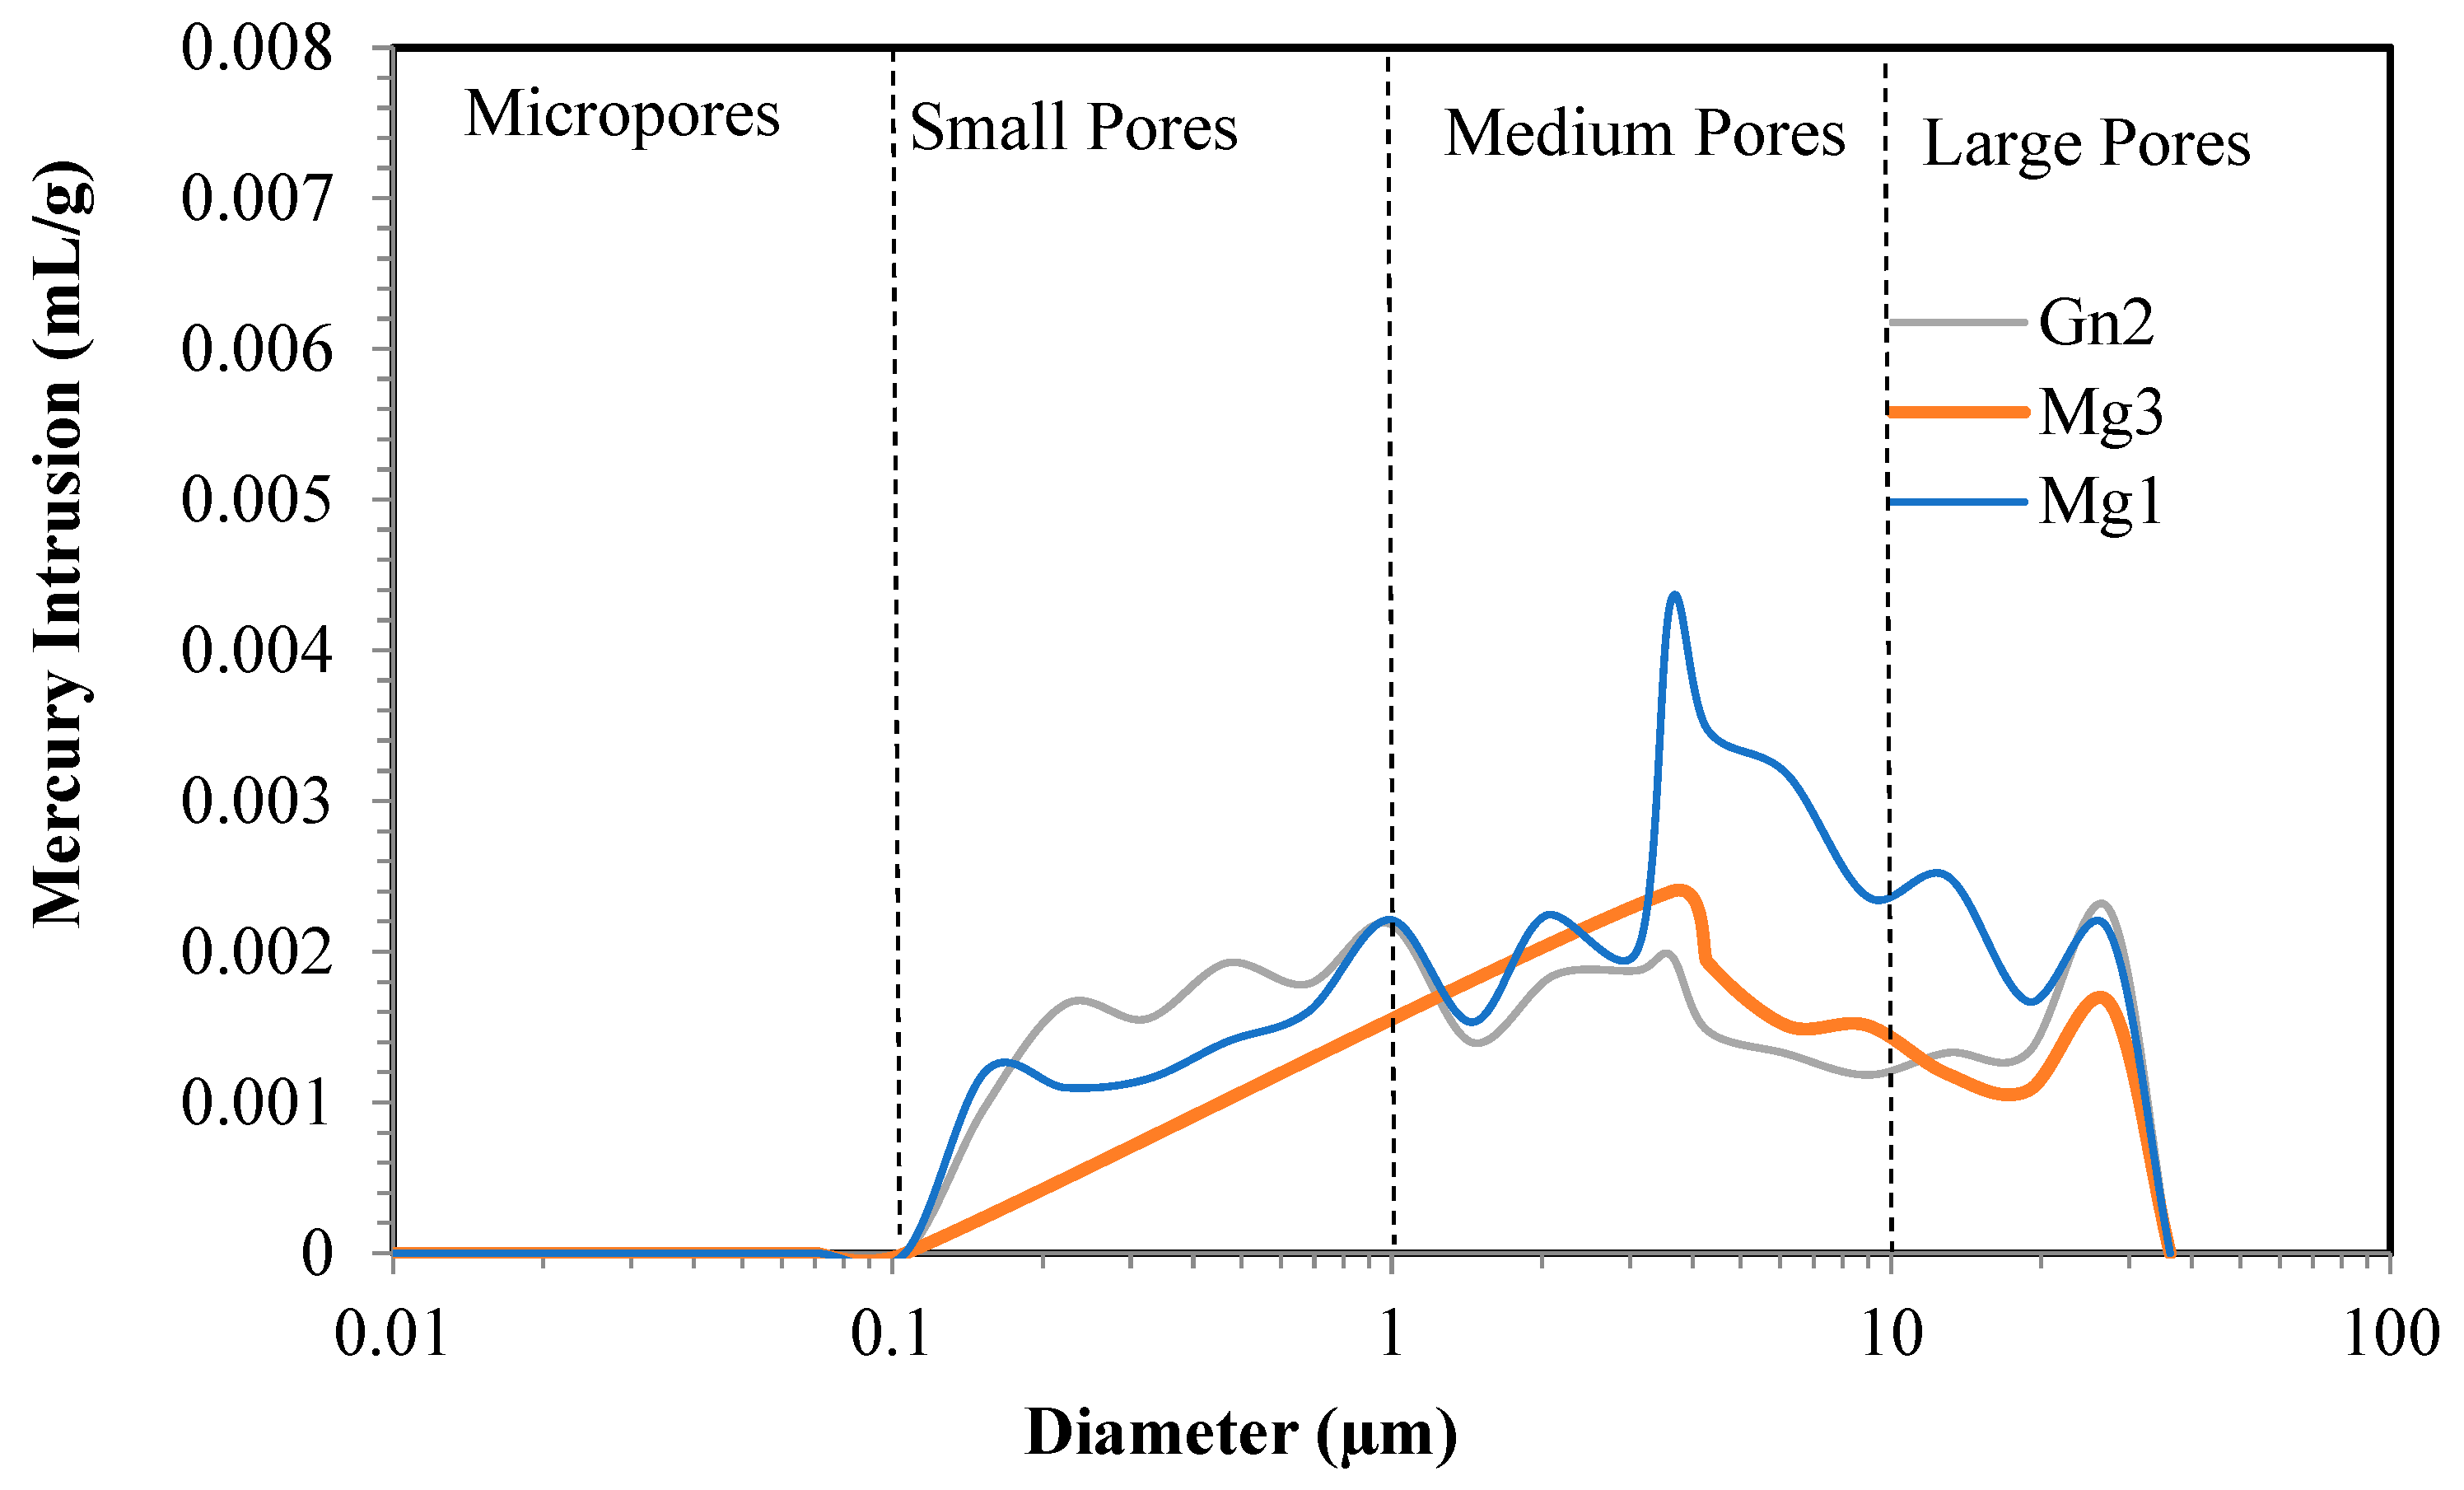
3.4. Rock Porosity–Porosimetry
3.5. Micro–Deval
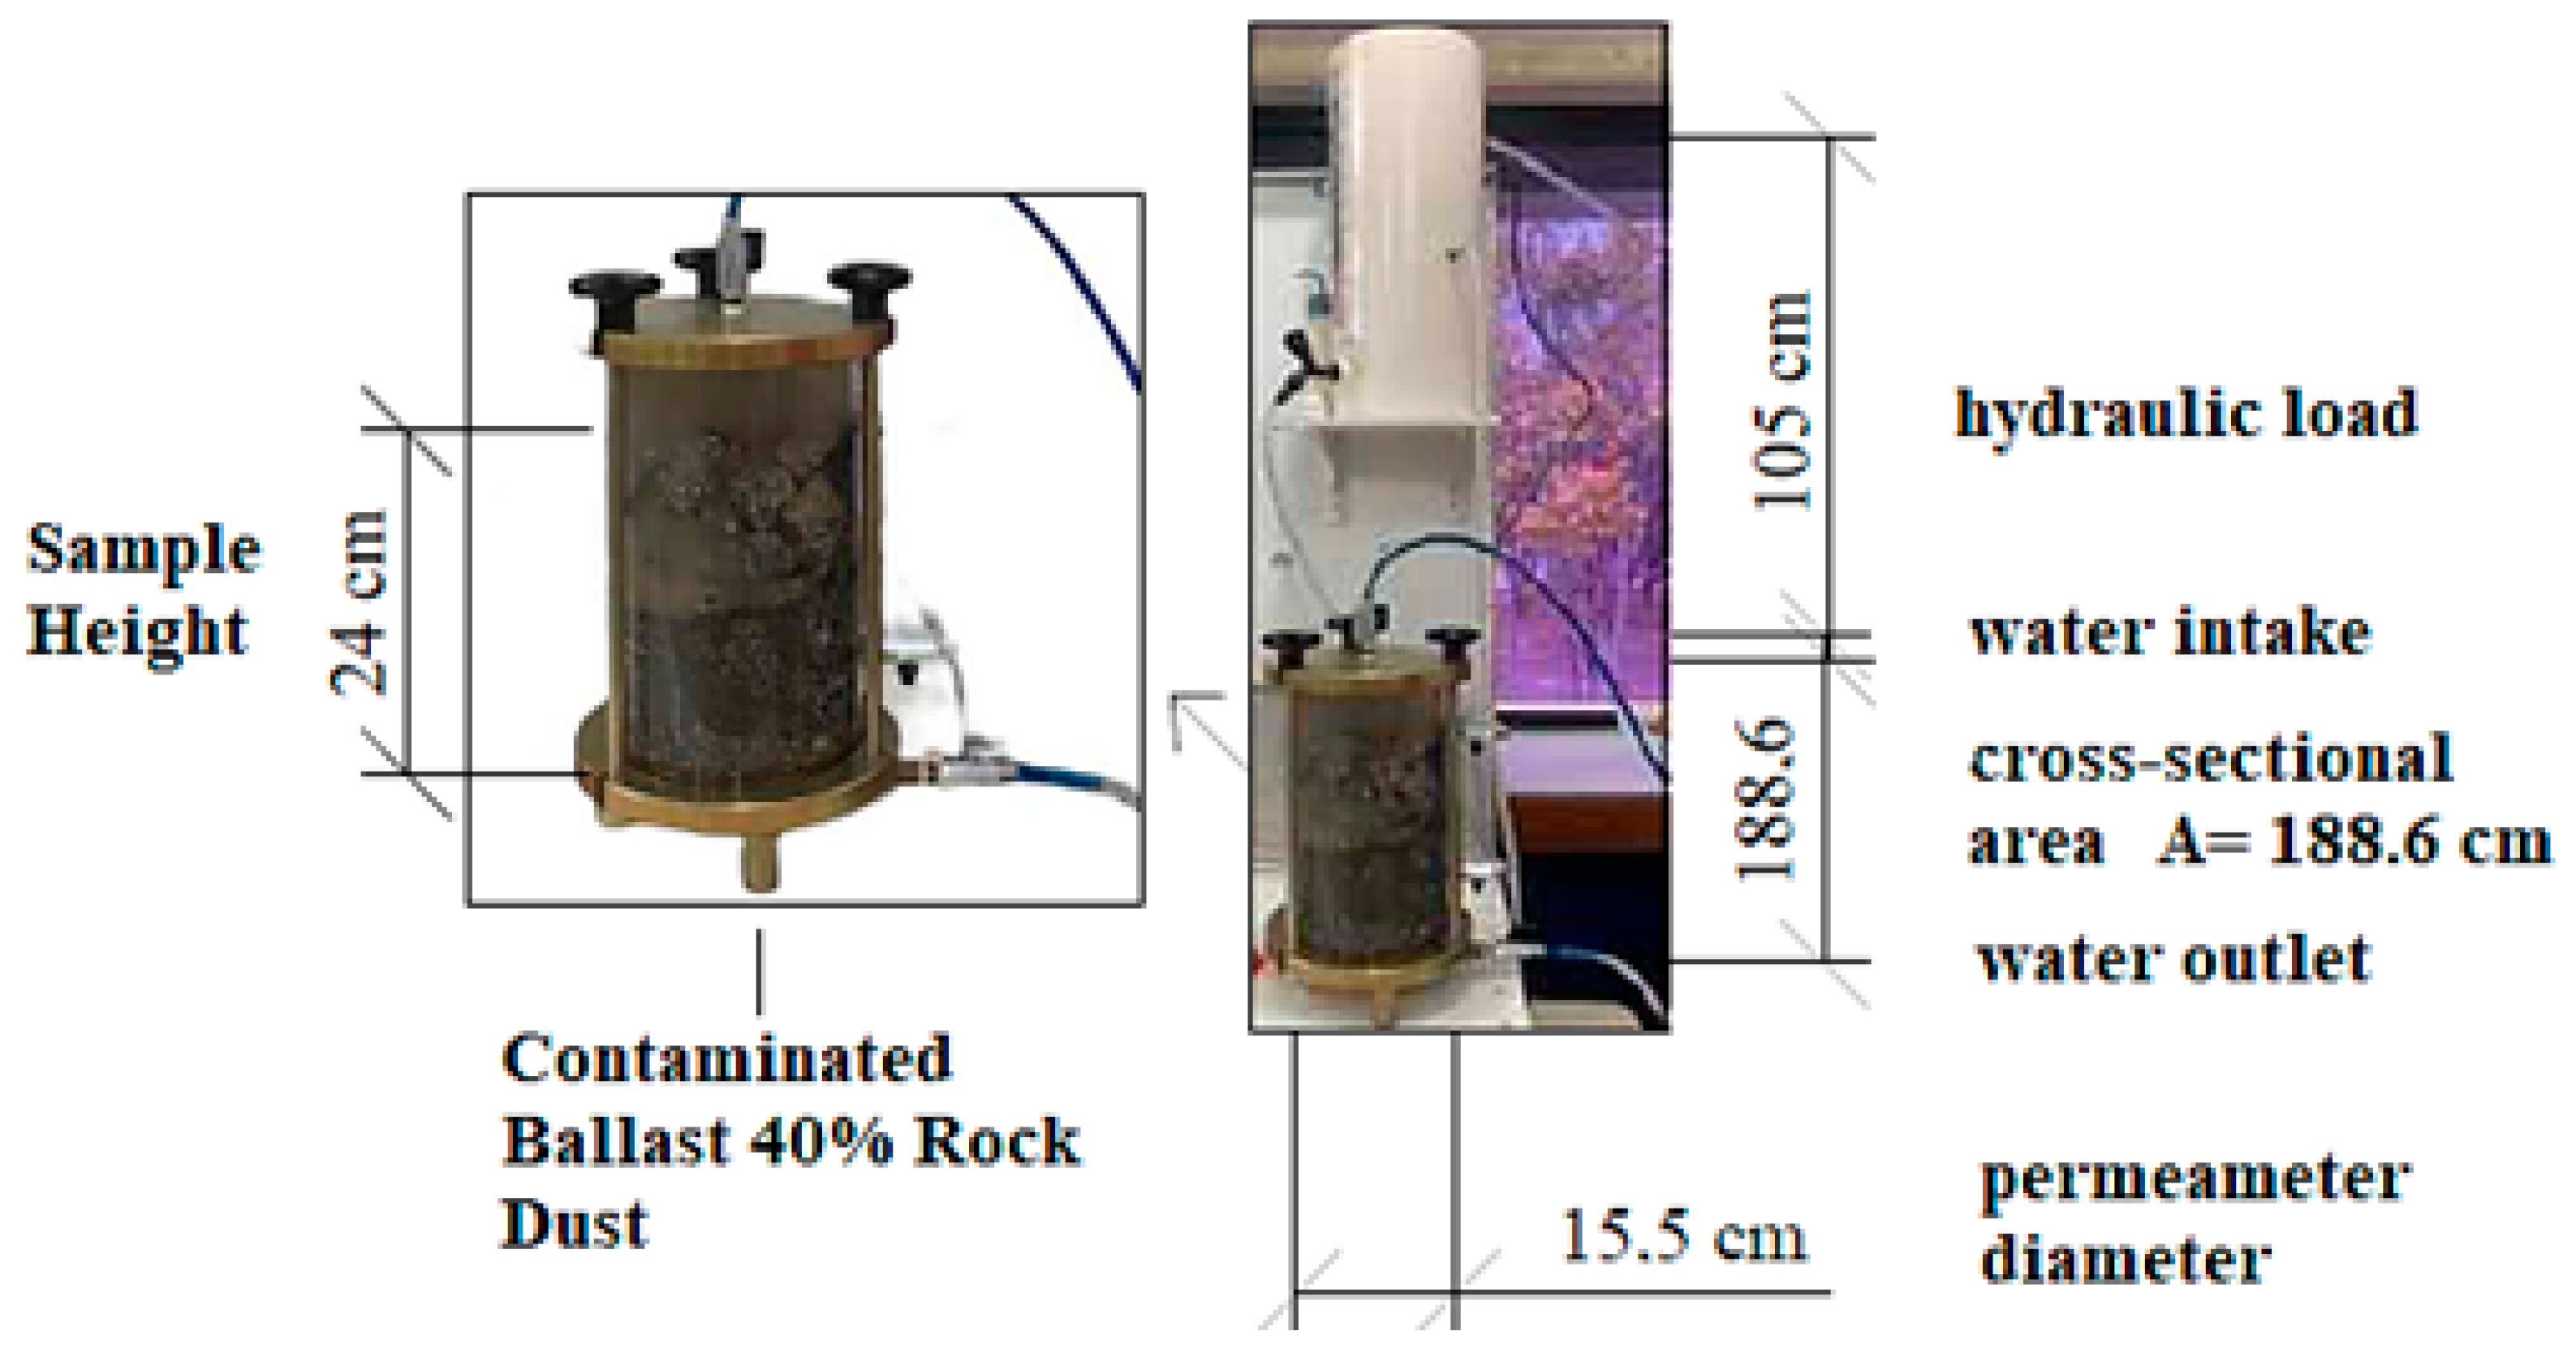
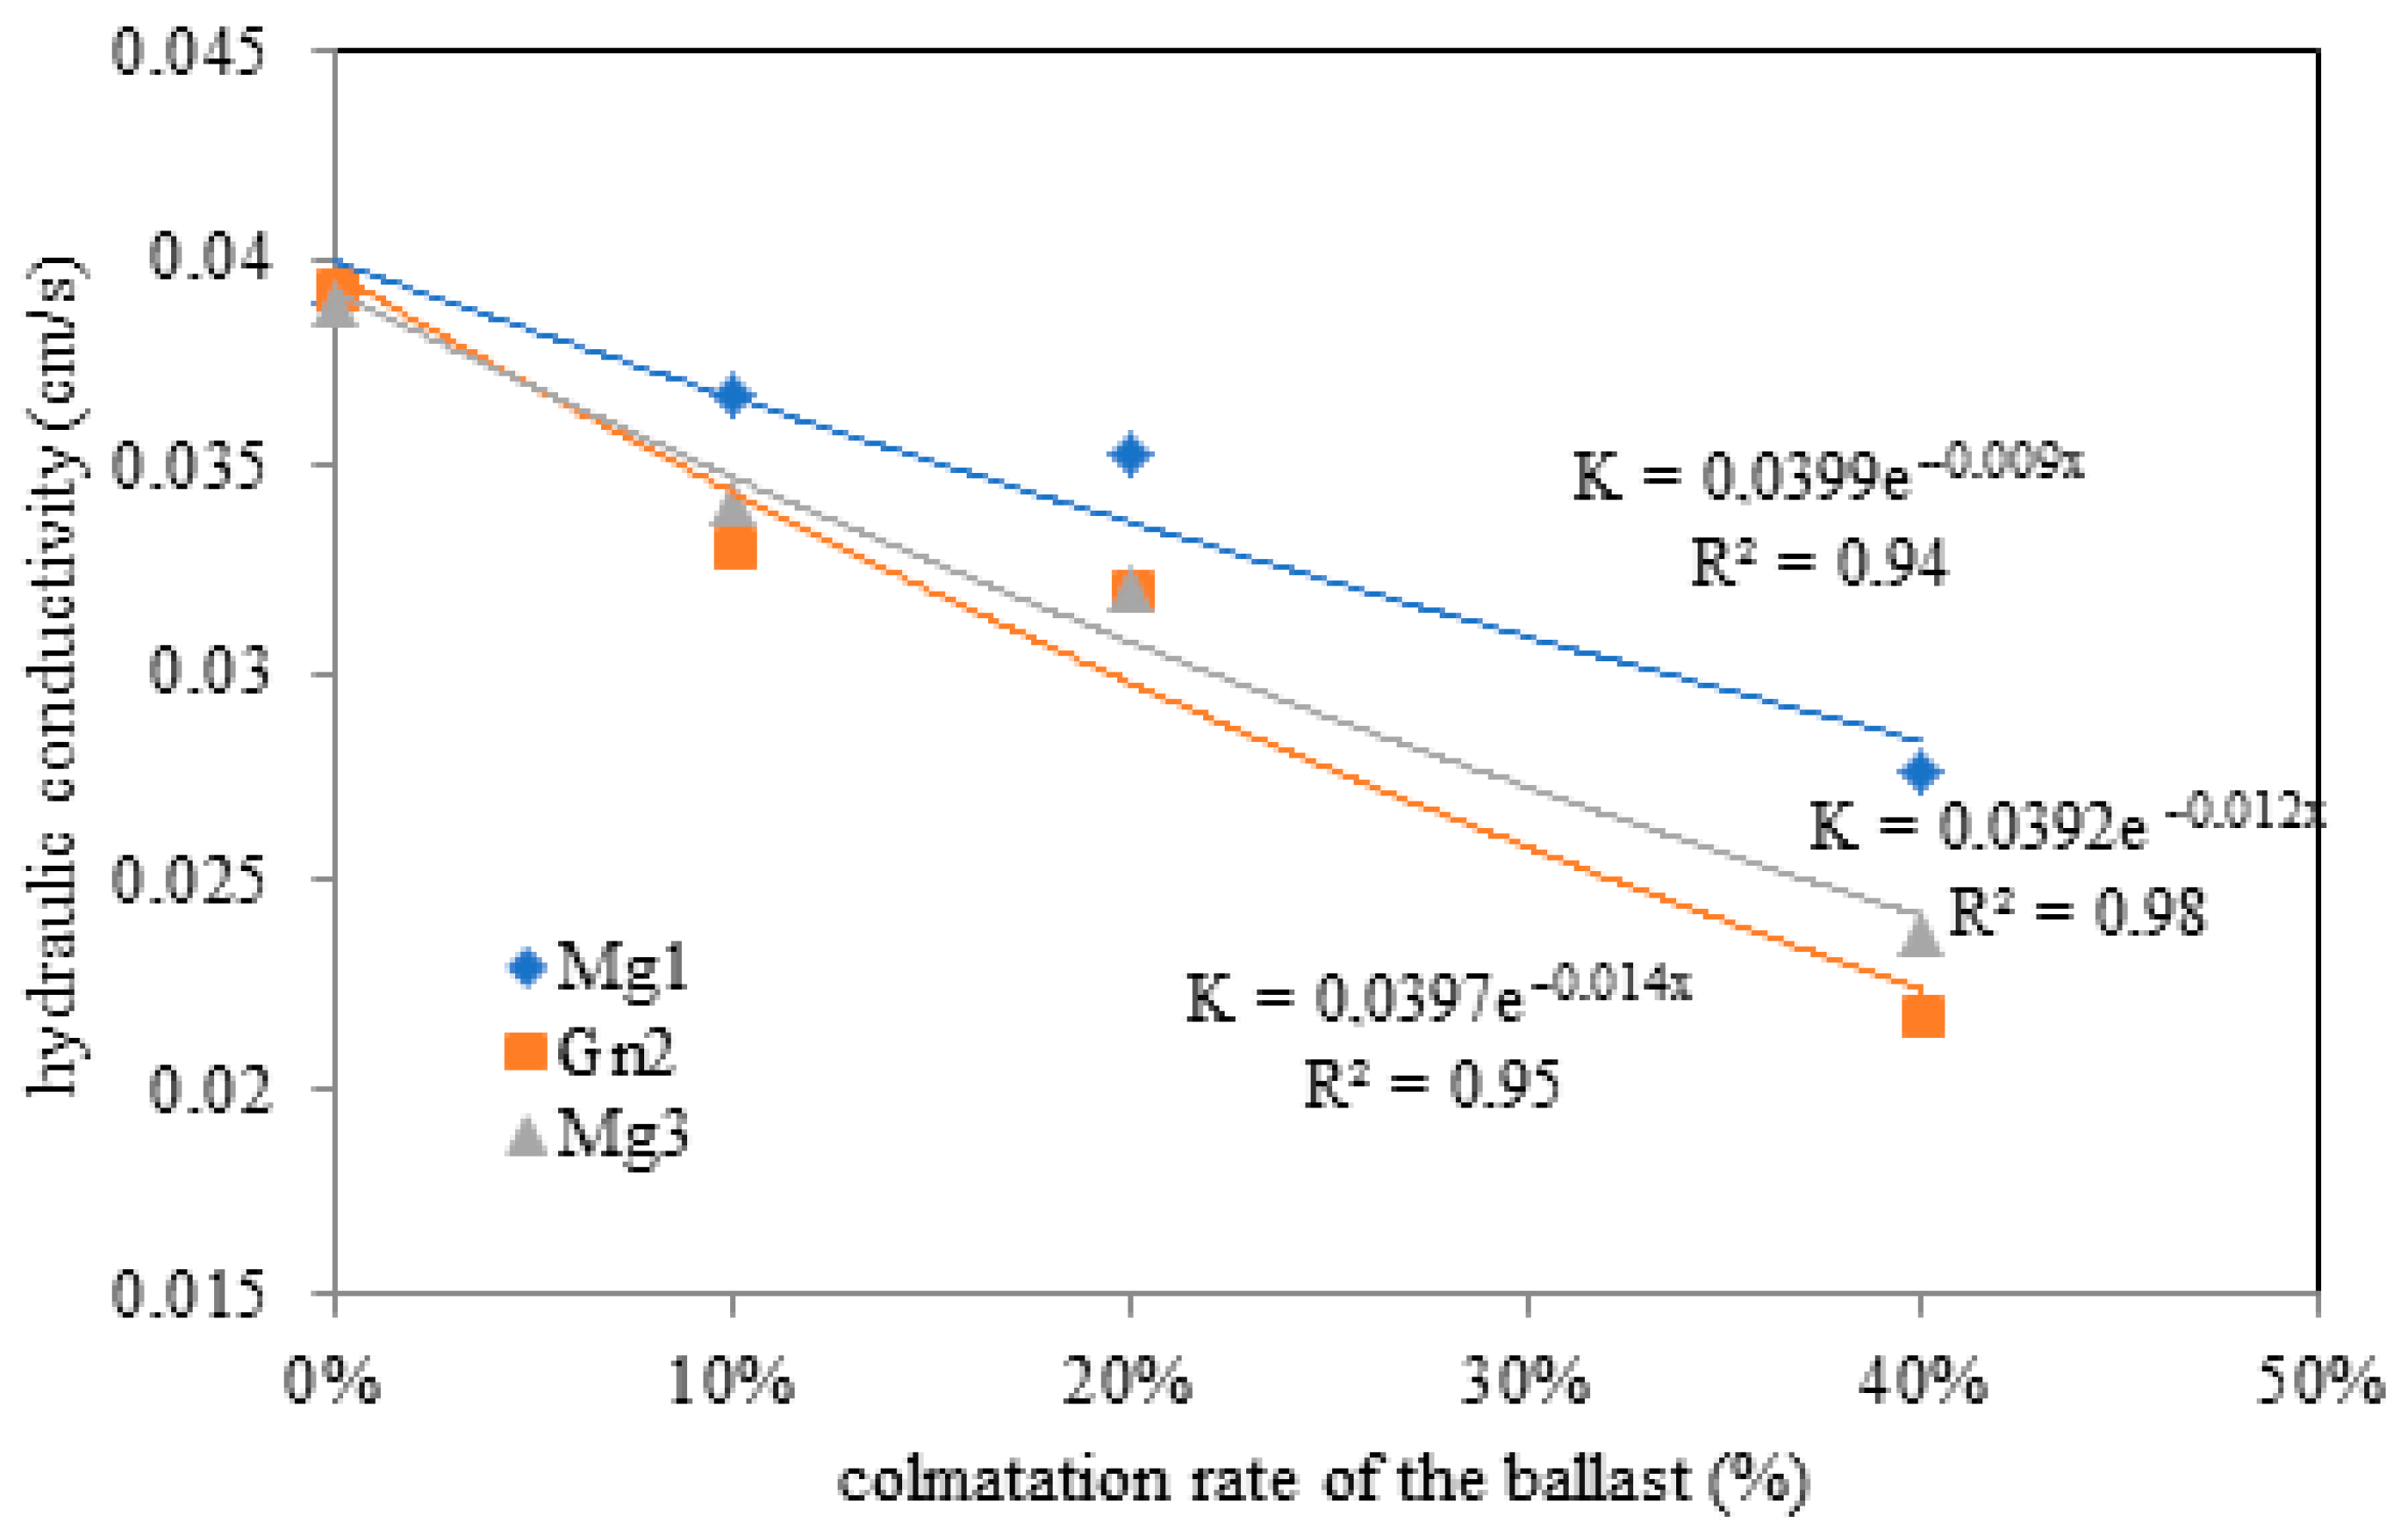
3.6. Permeability
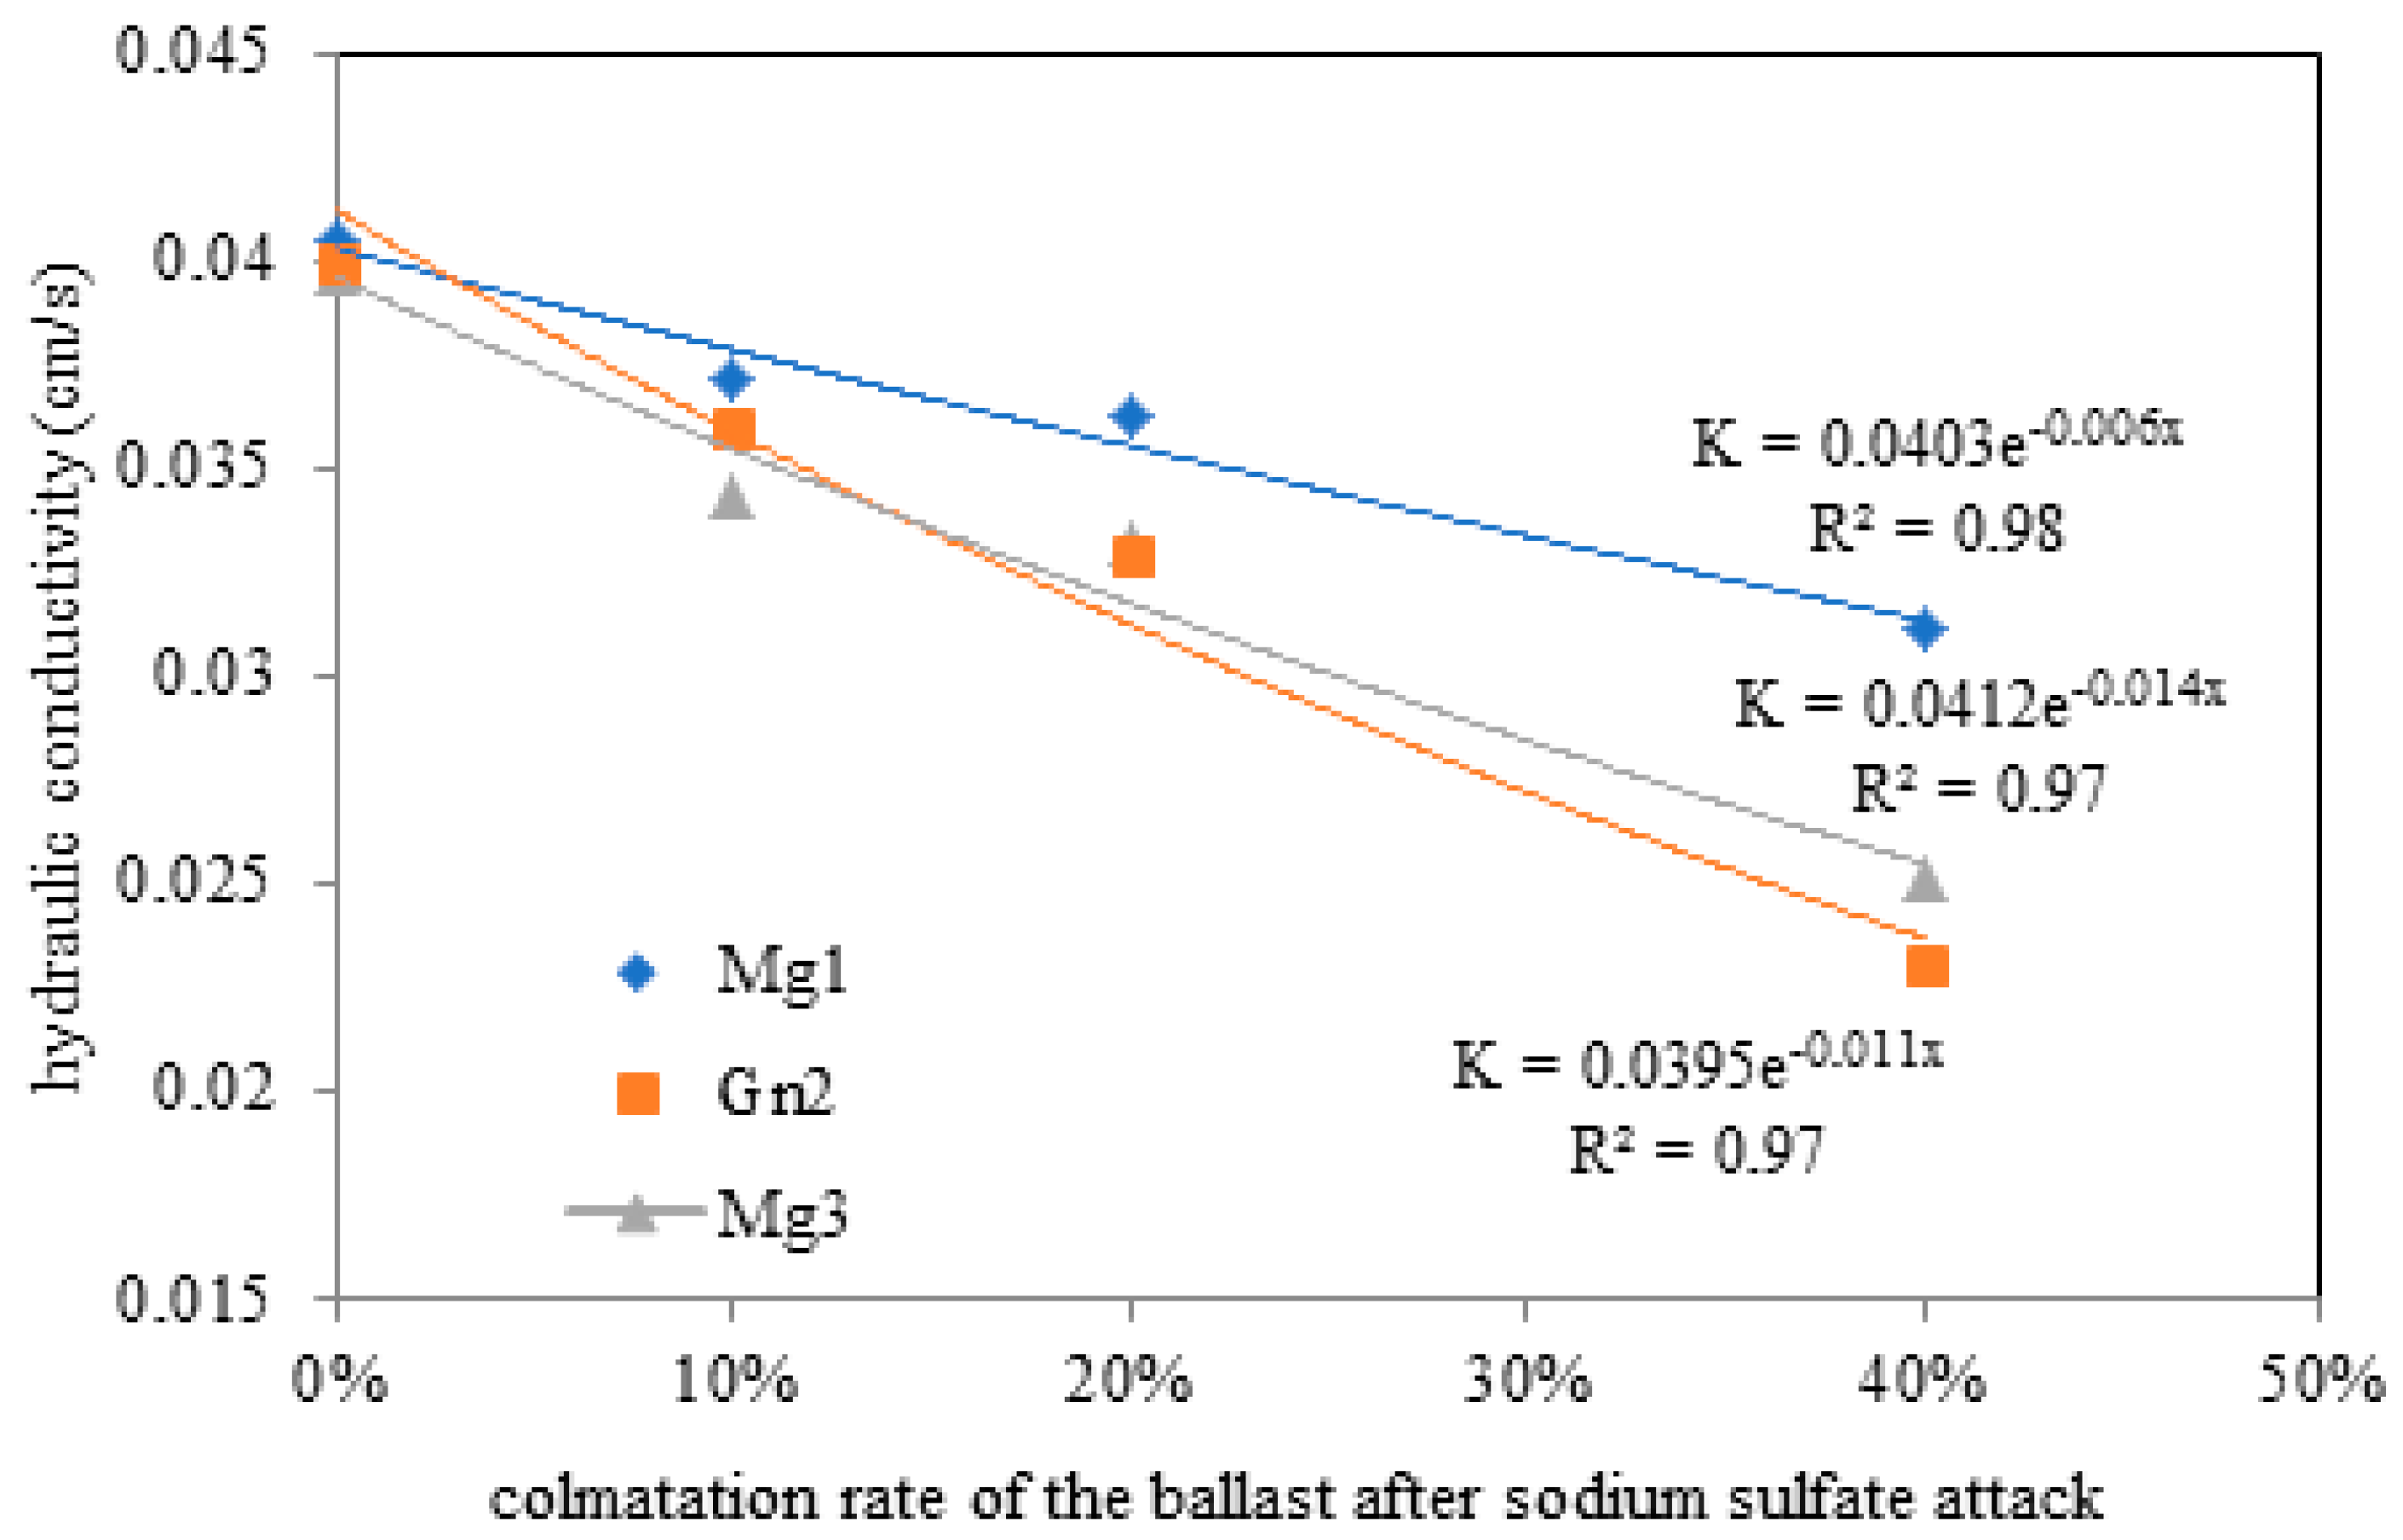
3.7. Sodium Sulfate Attack
4. Conclusions
Author Contributions
Funding
Institutional Review Board Statement
Informed Consent Statement
Data Availability Statement
Acknowledgments
Conflicts of Interest
References
- Governo Federal. Governo Federal Assina Contrato de Autorização Para Construção de Ferrovia No Rio de Janeiro. Available online: https://www.gov.br/casacivil/pt-br/assuntos/noticias/2022/fevereiro/governo-federal-assina-contrato-de-autorizacao-para-construcao-de-ferrovia-no-rio-de-janeiro (accessed on 1 February 2022).
- Paixão, A.; Fortunato, E. Abrasion Evolution of Steel Furnace Slag Aggregate for Railway Ballast: 3D Morphology Analysis of Scanned Particles by Close-Range Photogrammetry. Constr. Build. Mater. 2021, 267, 121225. [Google Scholar] [CrossRef]
- Kim, J.; Park, B.S.; Woo, S.I.; Choi, Y.T. Evaluation of Ballasted-Track Condition Based on Aggregate-Shape Characterization. Constr. Build. Mater. 2020, 232, 117082. [Google Scholar] [CrossRef]
- Guo, Y.; Markine, V.; Song, J.; Jing, G. Ballast Degradation: Effect of Particle Size and Shape Using Los Angeles Abrasion Test and Image Analysis. Constr. Build. Mater. 2018, 169, 414–424. [Google Scholar] [CrossRef]
- Xiao, J.; Zhang, D.; Wei, K.; Luo, Z. Shakedown Behaviors of Railway Ballast under Cyclic Loading. Constr. Build. Mater. 2017, 155, 1206–1214. [Google Scholar] [CrossRef]
- Paiva, C.; Ferreira, M.; Ferreira, A. Ballast Drainage in Brazilian Railway Infrastructures. Constr. Build. Mater. 2015, 92, 58–63. [Google Scholar] [CrossRef]
- Fathali, M.; Chalabii, J.; Astaraki, F.; Esmaeili, M. A New Degradation Model for Life Cycle Assessment of Railway Ballast Materials. Constr. Build. Mater. 2021, 270, 121437. [Google Scholar] [CrossRef]
- NBR 5564; Via Ferrea—Lastro Padrão. Associação Brasileira de Normas Técnicas ABNT: Sao Paulo, Brazil, 2021.
- Indraratna, B.; Salim, W.; Rujikiatkamjorn, C. Advanced Rail Geotechnology—Ballasted Tranck, 1st ed.; Routledge: London, UK, 2011; 432p. [Google Scholar]
- Selig, E.T.; Parsons, B.K.; Cole, B.E. Drainage of Railway Ballast. In Proceedings of the International Heavy Haul Conference, New York, NY, USA, March 1997. [Google Scholar]
- Qian, Y.; Boler, H.; Moaveni, M.; Tutumluer, E.; Hashash, Y.M.A.; Ghaboussi, J. Degradation-Related Changes in Ballast Gradation and Aggregate Particle Morphology. J. Geotech. Geoenviron. Eng. 2017, 143, 04017032. [Google Scholar] [CrossRef]
- Uranjek, M.; Štrukelj, A.; Lenart, S.; Peruš, I. Analysis of Influential Parameters for Accelerated Degradation of Ballast Railway Track. Constr. Build. Mater. 2020, 261, 119938. [Google Scholar] [CrossRef]
- Al-Qadi, I.L.; Xie, W.; Roberts, R. Scattering Analysis of Ground-Penetrating Radar Data to Quantify Railroad Ballast Contamination. NDT E Int. 2008, 41, 441–447. [Google Scholar] [CrossRef]
- Lichtberger, B. Track Compendium; Eurailpress Tetzlaff-Hestra GmbH Co. Publications: Hamburg, Germany, 2005; pp. 1–192. [Google Scholar]
- Indraratna, B.; Shahin, M.A.; Salim, W. Stabilisation of Granular Media and Formation Soil Using Geosynthetics with Special Reference to Railway Engineering. Ground Improv. 2007, 11, 27–43. [Google Scholar] [CrossRef]
- De Cerqueira, F.C. Hidrochemical and Natural Vulnerability to Contamination of the Ground Water in the County of São João Da Barra, RJ. Master’s Thesis, Universidade Estadual Norte Fluminense—UENF, Rio de Janeiro, Brazil, 2014. [Google Scholar]
- Menéndez, B.; Petráñová, V. Effect of Mixed vs. Single Brine Composition on Salt Weathering in Porous Carbonate Building Stones for Different Environmental Conditions. Eng. Geol. 2016, 210, 124–139. [Google Scholar] [CrossRef]
- Pellegrino, A.; Prestininzi, A. Impact of Weathering on the Geomechanical Properties of Rocks along Thermal-Metamorphic Contact Belts and Morpho-Evolutionary Processes: The Deep-Seated Gravitational Slope Deformations of Mt. Granieri-Salincriti (Calabria—Italy). Geomorphology 2007, 87, 176–195. [Google Scholar] [CrossRef]
- National Institute of Metrology, Quality and Technology. Mapa das Temperaturas Registradas Norte Fluminense. Available online: https://portal.inmet.gov.br/ (accessed on 10 January 2023).
- ABNT NBR NM 248; Análise Granulométrica. Associação Brasileira de Normas Técnicas (ABNT): Sao Paulo, Brazil, 2003; p. 6.
- ABNT NBR 15845; Rochas Para Revestimento Parte 1: Análise Petrografica. Associação Brasileira de Normas Técnicas (ABNT): Sao Paulo, Brazil, 2015.
- Cavalcanti, H.; Bessa, I.; Ibiapina, D.; Branco, V.C. Avaliação Da Degradação de Propriedades de Forma de Agregados. Matéria 2020, 25. [Google Scholar] [CrossRef]
- Wu, J.; Wang, L.; Hou, Y.; Qian, Z.; Meng, L.; Zhao, Q. Simulation on the Micro-Deval Test for the Aggregate Wear Properties Measurement. Constr. Build. Mater. 2018, 273, 121708. [Google Scholar] [CrossRef]
- ASTM D6928-17; Standard Test Method for Resistance of Coarse Aggregate to Degradation by Abrasion in the Micro-Deval Apparatus. ASTM International: West Conshohocken, PA, USA, 2017.
- Nijp, J.J.; Metselaar, K.; Limpens, J.; Gooren, H.P.A.; Van Der Zee, S.E.A.T.M. A Modification of the Constant-Head Permeameter to Measure Saturated Hydraulic Conductivity of Highly Permeable Media. MethodsX 2017, 4, 134–142. [Google Scholar] [CrossRef]
- dos Santos, R.S.; Ribeiro, R.P.; Paraguassú, A.B.; de Castro Xavier, G. Railroad Ballast of Granites and Basic Rock in Tropical Regions: Relationships between Petrography, Physical-Mechanical Properties and Alterability. Transportes 2021, 29, 2369. [Google Scholar] [CrossRef]
- Dias Filho, J.L.E.; Xavier, G.D.C.; Maia, P.C.D.A. Durability of Ornamental Gneiss Stones From Pádua, Rio De Janeiro, Brazil. J. Mater. Civ. Eng. 2020, 32, 04020176. [Google Scholar] [CrossRef]
- Remédio, M.J.; Ribeiro, R.P.; Curtis Neto, J.A. Correlations between Petrography and Technological Properties of Rocks: Application as Railway Ballast. Geociencias 2018, 37, 669–681. [Google Scholar] [CrossRef]
- Robert, M.; Brooks, M.C. Water Susceptible Properties of Silt Loam Soil in Sub grades in South West Pennsylvania. IJMER 2013, 3, 944–948. [Google Scholar]
- Verástegui-Flores, R.D.; Di Emidio, G. Impact of Sulfate Attack on Mechanical Properties and Hydraulic Conductivity of a Cement-Admixed Clay. Appl. Clay Sci. 2014, 101, 490–496. [Google Scholar] [CrossRef]
- Yu, C.; Yao, W.; Xu, Y.; Xia, K. A Dynamic Point-Load Test for Quantifying Rock Dynamic Strength Parameters. Rev. Sci. Instrum. 2017, 88, 113901. [Google Scholar] [CrossRef] [PubMed]


| Sieve Size According to the ABNT | Accumulated Mass Percentage (%) | |
|---|---|---|
| mm | Standard A | Standard B |
| 76.2 | INAPPLICABLE | 0–0 |
| 63.5 | 0–0 | 0–10 |
| 50.8 | 0–10 | INAPPLICABLE |
| 38 | 30–65 | 40–75 |
| 25.4 | 85–100 | INAPPLICABLE |
| 19 | INAPPLICABLE | 90–100 |
| 12.5 | 95–100 | 98–100 |
| Test Number | Fouling Rate | Void Ratio | Void Ratio | Void Ratio | Diameter of the Permeameter | Cross-Sectional Area | Length | Sample Height | Water Depth |
|---|---|---|---|---|---|---|---|---|---|
| (%) | (e) | (e) | (e) | (cm) | (cm2) | (h) | (cm) | (cm) | |
| 1 | 0 | 1.04 | 1.01 | 1.02 | 15.5 | 188.6 | 24 | 24 | 105 |
| 2 | 0 | 1.04 | 1.01 | 1.02 | |||||
| 3 | 10 | 0.93 | 0.90 | 0.91 | |||||
| 4 | 10 | 0.93 | 0.90 | 0.91 | |||||
| 5 | 20 | 0.83 | 0.80 | 0.81 | |||||
| 6 | 20 | 0.83 | 0.80 | 0.81 | |||||
| 7 | 40 | 0.62 | 0.60 | 0.61 | |||||
| 8 | 40 | 0.62 | 0.60 | 0.61 |
| Type | Color | Grain Size | Texture | Microcracking | Alteration | hbl | Qtz | Plg | Bt | Msc | Mcn | Mq | Mo |
|---|---|---|---|---|---|---|---|---|---|---|---|---|---|
| Mg1 | Grayish White | Fine (5%), Medium (50%) Coarse (45%) | Granoblastic | Moderate | Little | - | 22 | 15 | 20 | 5 | 35 | - | - |
| Gn2 | Whitish Gray | Fine (20%) Medium (80%) | Granolepidoblastic | Weak | Little | 20 | 15 | 17 | 14 | 30 | 15 | - | - |
| Mg3 | Pink Gray | Medium (80%) Fine (20%) | Granoblastic | Weak | Little | 22 | 20 | 15 | 15 | 5 | 20 | 1 | 1 |
| Typeo | Color | Grain size | Texture | Microcracking | Alteration | hbl | Qtz | Plg | Bt | Msc | Mcn | Mq | Mo |
|---|---|---|---|---|---|---|---|---|---|---|---|---|---|
| Mg1 | Gray | Fine (10%), Medium (70%) Coarse (20%) | Grano-lepidoblastic | Moderate | Little | - | 20 | 18 | 25 | 5 | 30 | - | 1 |
| Gn2 | Grayish White | Fine (30%) Mediium (70%) | Grano-lepidoblastic | Weak | Little | 30 | 16 | 10 | 25 | 2 | 15 | - | 1 |
| Mg3 | Gray | Medium (80%) Fine (20%) | Grano-lepidoblastic | Weak | Little | 30 | 11 | 10 | 25 | 5 | 15 | - | 1 |
| Rock | Ballast Fouling Rate (%) | Hydraulic Conductivity (cm/s) |
|---|---|---|
| Mg1 | 0 | 0.03 |
| 10 | 0.03 | |
| 20 | 0.03 | |
| 40 | 0.02 | |
| Gn2 | 0 | 0.03 |
| 10 | 0.03 | |
| 20 | 0.03 | |
| 40 | 0.02 | |
| Mg3 | 0 | 0.03 |
| 10 | 0.03 | |
| 20 | 0.03 | |
| 40 | 0.02 |
| Rock | Ballast Fouling Rate (%) | Hydraulic Conductivity (cm/s) |
|---|---|---|
| Mg1 | 0 | 0.04 |
| 10 | 0.37 | |
| 20 | 0.03 | |
| 40 | 0.03 | |
| Gn2 | 0 | 0.03 |
| 10 | 0.03 | |
| 20 | 0.03 | |
| 40 | 0.02 | |
| Mg3 | 0 | 0.03 |
| 10 | 0.03 | |
| 20 | 0.03 | |
| 40 | 0.02 |
Disclaimer/Publisher’s Note: The statements, opinions and data contained in all publications are solely those of the individual author(s) and contributor(s) and not of MDPI and/or the editor(s). MDPI and/or the editor(s) disclaim responsibility for any injury to people or property resulting from any ideas, methods, instructions or products referred to in the content. |
© 2023 by the authors. Licensee MDPI, Basel, Switzerland. This article is an open access article distributed under the terms and conditions of the Creative Commons Attribution (CC BY) license (https://creativecommons.org/licenses/by/4.0/).
Share and Cite
Souza, R.N.; de Castro Xavier, G.; da Costa, K.d.O.B.; Alexandre, J.; Ribeiro, R.P.; de Azevedo, A.R.G. Comparison of the Permeability of Potential Ballast Rocks from Northern Rio de Janeiro State under Different Fouling Rates after Sodium Sulfate Attack. Materials 2023, 16, 3806. https://doi.org/10.3390/ma16103806
Souza RN, de Castro Xavier G, da Costa KdOB, Alexandre J, Ribeiro RP, de Azevedo ARG. Comparison of the Permeability of Potential Ballast Rocks from Northern Rio de Janeiro State under Different Fouling Rates after Sodium Sulfate Attack. Materials. 2023; 16(10):3806. https://doi.org/10.3390/ma16103806
Chicago/Turabian StyleSouza, Rodolpho N., Gustavo de Castro Xavier, Kelly de Oliveira Borges da Costa, Jonas Alexandre, Rogério P. Ribeiro, and Afonso R. G. de Azevedo. 2023. "Comparison of the Permeability of Potential Ballast Rocks from Northern Rio de Janeiro State under Different Fouling Rates after Sodium Sulfate Attack" Materials 16, no. 10: 3806. https://doi.org/10.3390/ma16103806