
Compressive Strength Prediction of Rice Husk Ash Concrete Using a Hybrid Artificial Neural Network Model

1
Laboratory 3SR, CNRS UMR 5521, Grenoble Alpes University, 38000 Grenoble, France
2
Institute of Rock and Soil Mechanics, Chinese Academy of Sciences, Wuhan 430071, China
3
School of Resources and Safety Engineering, Central South University, Changsha 410083, China
*
Authors to whom correspondence should be addressed.
Materials 2023, 16(8), 3135; https://doi.org/10.3390/ma16083135
Submission received: 29 March 2023
/
Revised: 12 April 2023
/
Accepted: 14 April 2023
/
Published: 16 April 2023
(This article belongs to the Special Issue Green and Sustainable Infrastructure Construction Materials)
Abstract
:The combination of rice husk ash and common concrete both reduces carbon dioxide emission and solves the problem of agricultural waste disposal. However, the measurement of the compressive strength of rice husk ash concrete has become a new challenge. This paper proposes a novel hybrid artificial neural network model, optimized using a reptile search algorithm with circle mapping, to predict the compressive strength of RHA concrete. A total of 192 concrete data with 6 input parameters (age, cement, rice husk ash, super plasticizer, aggregate, and water) were utilized to train proposed model and compare its predictive performance with that of five other models. Four statistical indices were adopted to evaluate the predictive performance of all the developed models. The performance evaluation indicates that the proposed hybrid artificial neural network model achieved the most satisfactory prediction accuracy regarding R2 (0.9709), VAF (97.0911%), RMSE (3.4489), and MAE (2.6451). The proposed model also had better predictive accuracy than that of previously developed models on the same data. The sensitivity results show that age is the most important parameter for predicting the compressive strength of RHA concrete.
1. Introduction
Concrete is globally still one of the most highly demanded materials in construction and other industries [1]. By 2018, the production of concrete exceeded 10 billion cubic meters [2]. As a main component, the production of cement rose to 4 billion tons in 2020 [3]. Although cement provides the necessary strength for concrete, carbon dioxide (CO2) produced in the forging process is a heavy burden (approximately 7%) on the atmosphere. Considering the harm of CO2 to the environment and human beings, energy conservation and emission reduction have become normal goals in concrete application. Searching for ovel materials to replace parts of cement, namely, supplementary cementitious materials (SCMs), is one of the most effective ways to solve this problem.
Most available SCM options are derived from byproducts associated with industrial and agricultural processes, such as palm-oil fuel [4,5], olive-oil [6,7], and fly [8,9] ash, silica fume [10,11], seed shells [12], dispersed coconut fibers [13], and other types of powder [14,15,16,17,18,19,20]. Among these novel SCMs, the combination of rick husk ash (RHA) and conventional concrete has received much attention [21,22,23]. First, RHA is one of the main byproducts of agricultural production. Conventional stacking could pollute the air and groundwater [24], but adding it to concrete is a reasonable and innovative way to recycle. Second, the pozzolanic nature of RHA helps in improving the durability and strength of concrete [25]. However, the addition of RHA has an important effect on concrete performance [26], especially compressive strength, which directly affects the durability and stability of structures in construction and other industries. Madandoust et al. [27] used RHA to replace 20% of cement to study the strength of concrete. Their results showed that the short-term compressive strength of RHA concrete was reduced, but the long-term compressive strength was increased. Ahsan and Hossain [28] compared cement performance at different RHA replacement rates (10% and 20%). They found that replacing 10% of cement with RHA was optimal because the interfacial transition zone was more effectively densified with the silica content of RHA. However, Noaman et al. [29] reported that that replacing cement with 15% RHA could maximize concrete’s compressive strength. Furthermore, determining the mixing ratio of other components in concrete production with cement and RHA is complicated; thus, it is both necessary and challenging to determine the strength of concrete.
The most accurate strength measurement method of concrete is the compressive test in the laboratory. However, the production and maintenance of concrete samples is complicated and time-consuming, and wastes workers and material resources [30]. For example, a group of experiments require two to three professionals to complete. In order to improve calculation efficiency and site limitation, a method based on an empirical formula was developed to estimate compressive strength that was especially praised by field workers. Islam et al. [31] developed an empirical formular by using the least-squares approach to calculate the compressive strength of RHA concrete. Their results showed that the formular achieved good predictive performance with a correlation coefficient (R) of 0.816. Liu et al. [32] utilized six empirical equations to estimate the compressive strength of concrete containing RHA with different replacement values. However, the limitation of the empirical formula is that it cannot accurately express the complex nonlinear relationship between the considered parameters and compressive strength [33].
In recent years, artificial-intelligence methods with machine learning (ML) as a mainstream technologies have been widely used to solve the problem of concrete strength prediction [34,35,36,37,38,39,40]. Azimi-Pour et al. [41] utilized four types of support vector machine (SVM) models to predict the compressive strength of fly ash concrete. The performance results indicated that the radial basis function (RBF)-based SVM model had the highest accuracy for a coefficient of determination (R2) equal to 0.9932. Zhang et al. [42] improved the random forest (RF) model to predict the compressive strength of lightweight concrete (LWC). The extreme learning machine (ELM) model was applied for the compressive strength prediction of lightweight foamed concrete [43]. Compared with these models, an artificial neural network (ANN) model with a simple structure, and good capabilities for processing high-dimensional data and complex parameter relationships is more favored in predicting the concrete strength of RHA [44,45,46,47]. Getahun et al. [48] developed an ANN model to forecast the 28-day compressive strength of a composite concrete mixture with RHA and reclaimed asphalt pavement (RAP). The prediction results illustrated that the ANN model could accurately fit the relationship between the considered components and the strength, as evidenced by excellent performance indices: R was 0.9811 and the root mean square error (RMSE) was 0.648. To optimize the selection scheme of the ANN model on weight and bias values, and further improve model performance, many scholars modified this model using numerous optimization algorithms for predicting concrete strength, e.g., grey wolf optimization (GWO) [49,50], particle swarm optimization (PSO) [51,52], the genetic algorithm (GA) [53], the whale optimization algorithm (WOA) [54], and simulated annealing (SA) with PSO [55]. For the strength prediction of RHA concrete, Andalib et al. [56] utilized the bat algorithm (BA), PSO, and teaching–learning-based optimization (TLBO) algorithm to optimize the ANN model for predicting compressive strength. The performance results showed that all optimized ANN models achieved satisfactory prediction accuracy, especially the BA–ANN model (RMSE = 5.898); Hamidian et al. [33] proposed four hybrid ANN models to estimate the compressive strength of RHA concrete. On the basis of the results of the performance analysis of all models, the PSO-with-two differential-mutations (PSOTD)-based ANN model achieved superior performance than that of other models, indicated by the higher R2 values (0.9697). There are still many newly developed and excellent optimization-algorithm-based populations that have not been applied to the strength prediction of RHA concrete. Population initialization also needs attention to maximize the predictive potential of ANN models.
Therefore, this paper utilizes circle mapping (CM) to improve the optimization performance of the reptile search algorithm (RSA). A novel hybrid ANN model optimized with CMRSA is proposed to estimate the compressive strength of RHA concrete. The predictive accuracy of four ML models and an empirical model was compared. These ML models consisted of optimized and common models: seagull optimization algorithm (SOA)-based SVM (SOA–SVM) and RF (SOA–RF) models, an ANN model, and an ELM model. Four statistical indices, regression analysis, error comparison, and the Taylor diagram were adopted to evaluate the predictive performance of all models in order to determine the optimal model. Lastly, sensitivity analysis was performed to select the most important parameter for predicting the compressive strength of RHA concrete.
2. Data and Methods
2.1. Rice Husk Ash Concrete
RHA concrete cannot be produced without the use of other materials. For example, cement is used to provide sufficient strength for concrete, water is key to controlling concrete compactness in the mixing process, and the aggregate maintains concrete volume stability. To assess the compressive strength of RHA concrete, Iftikhar et al. [57] combined cement (kg/m3), RHA (kg/m3), a superplasticizer (kg/m3), an aggregate (kg/m3), and water (kg/m3) to produce a series of concrete samples. Freshly poured concrete needs to be cured, and its strength must be measured after a certain time. Therefore, age (days) is also an important variable in predicting concrete strength. In this paper, 192 compressive-strength data from Iftikhar et al. [57] were utilized to evaluate RHA concrete. The statistical information of these variables and the compressive strength of the target concrete samples is listed in Table 1.
For establishing the prediction model, all variables except compressive strength were taken as the input parameters. The interdependence of the input parameters must be evaluated to simplify the model and maintain prediction accuracy. The correlation coefficient is widely used to describe dependence [58,59,60]. If the correlation coefficient between any two input parameters exceeds 0.8, parameter deletion should be considered. Table 2 shows the calculation results of correlation coefficient values between input parameters. The maximal correlation coefficient value was 0.549, induced by water and the aggregate. Therefore, all input parameters could be considered for generating a prediction model for estimating the compressive strength of RHA concrete.
2.2. Reptile Search Algorithm
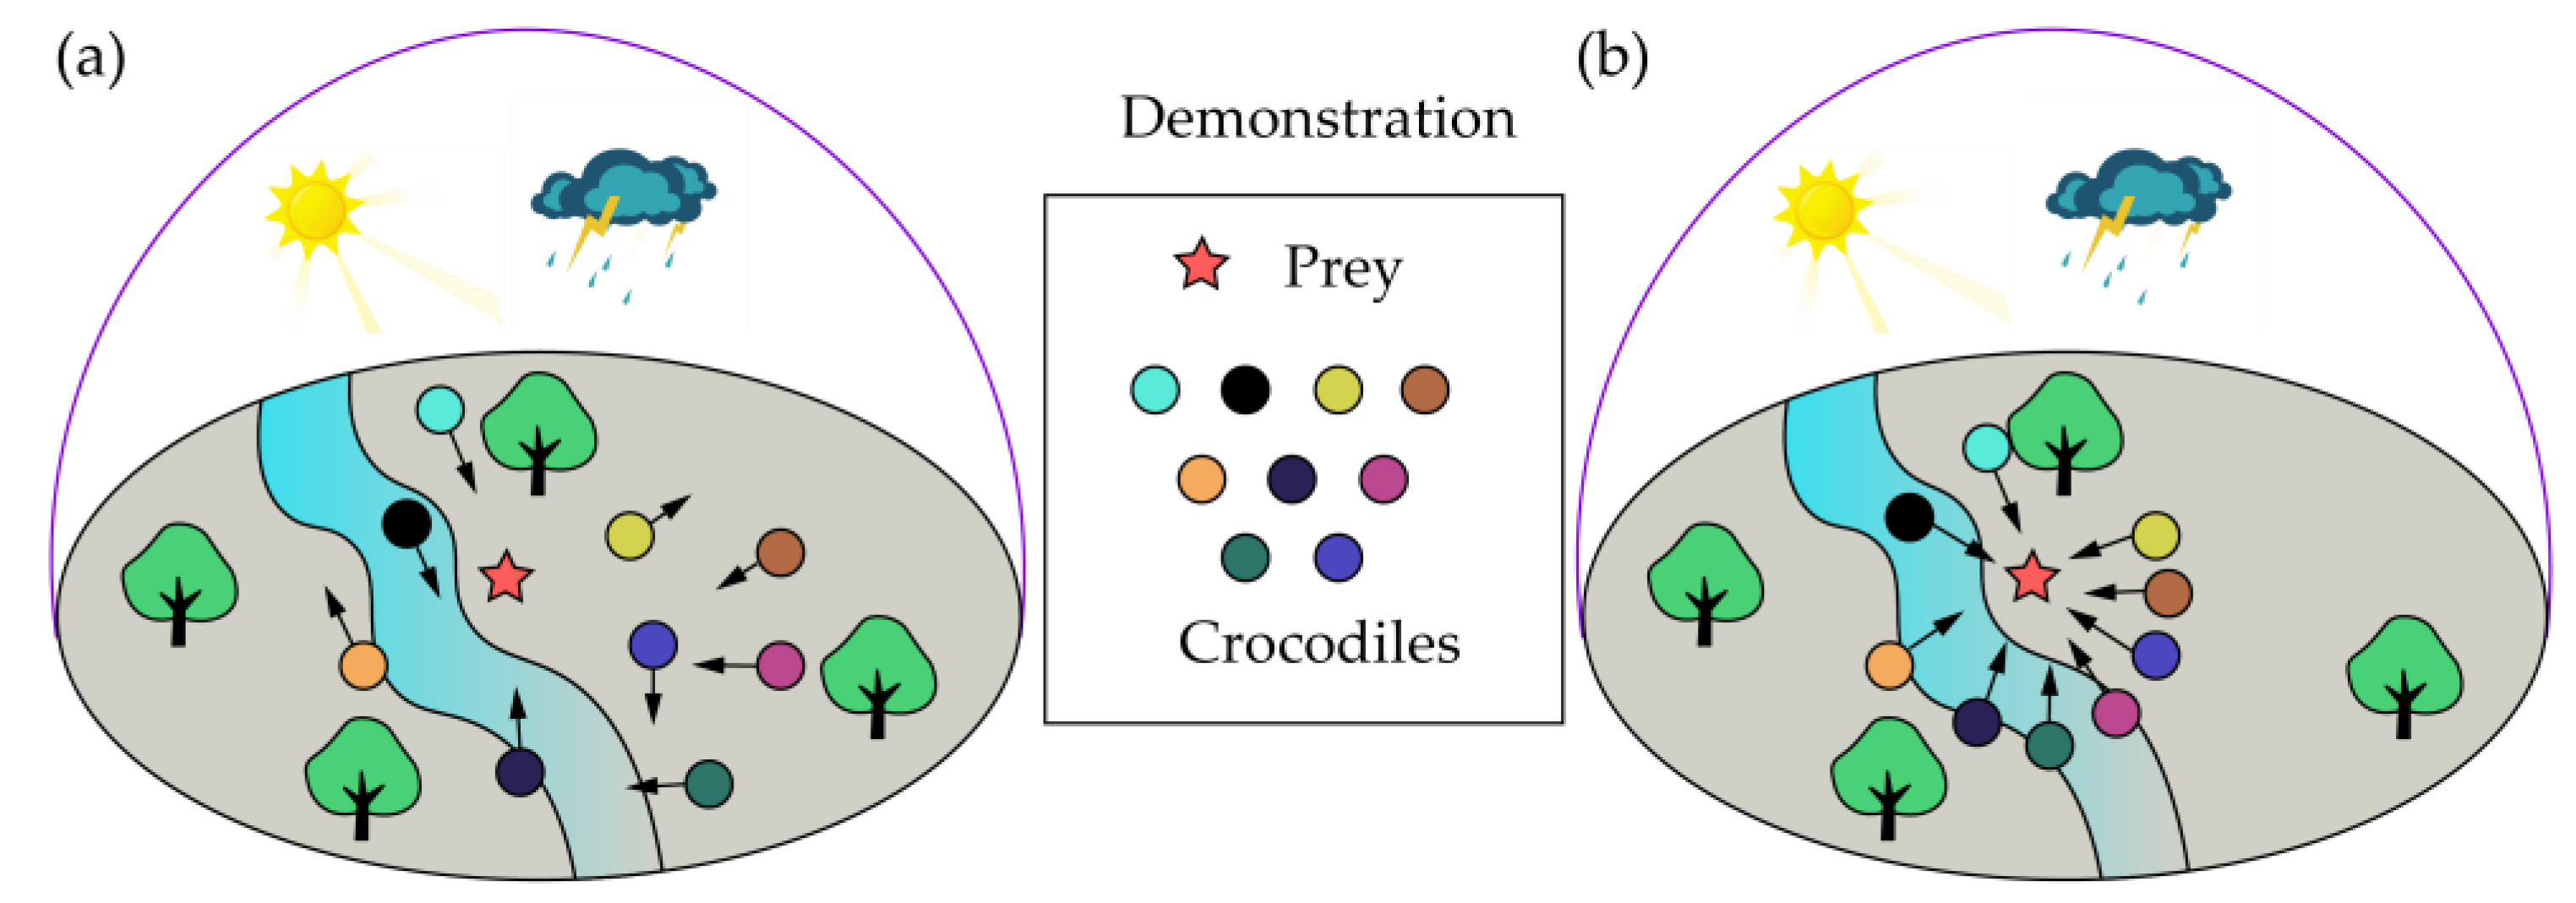
RSA is a novel metaheuristic optimization-algorithm-based algorithm proposed by Abualigah et al. [61]. This algorithm was inspired by the hunting behavior of crocodiles to solve the optimization problem. As the apex predators in amphibious environments, the behavior of crocodiles has long attracted the attention of scientists. Crocodiles are highly mobile, and can thereby quickly chase and attack prey, especially at night. The crocodile’s excellent night vision and body shape with little resistance benefit this feature [61]. Second, crocodiles are highly intelligent animals, which endows them with high recognition and high perception capabilities. For instance, crocodiles wait where prey is frequent, such as near a river. Crocodile hunting is also group behavior, and teams with a clear division of labor enable individuals to obtain enough food. Therefore, the first step in performing a hunting campaign is to initialize the population in the search space as follows:
where represents the j-th position of the i-th crocodile; and represent the upper and lower bounds of the search space, respectively; rand is a random number. The setting of rand indicates that the individual position is randomly determined to find the prey. However, population diversity and the possible search area are limited by this random initialization-method-based mechanism [62]. To solve this problem, various types of chaos mapping were combined to establish the different distributions of individuals in the search space [63,64]. In this paper, circle mapping, with the advantages of stability and coverage rate, was utilized to optimize the population initialization of RSA.
where H and G represent the externally applied frequency and strength of nonlinearity, respectively.
After determining the initial positions of individuals, the exploration command was executed to find and encircle prey in the search space (see Figure 1a). In this phase, two strategies could be selected by the crocodiles to search the entire area as much as possible. The mathematical expressions of these strategies are as follows:
where represents the j-th position of the i-th crocodile at the t + 1 iteration; T is the maximal iteration value; indicates the best position at the current (t) iteration, represents an internal parameter, namely, the hunting operator for the j-th position of the i-th crocodile at the current iteration; represents a related parameter to exploration accuracy, which was equal to 0.1 in this paper; and are the reduce function and evolutionary sense, respectively. The former is used to narrow the search in a limited space, and the latter is a probability ratio.
Once the prey is encircled by crocodiles, the hunting (i.e., exploitation, as shown in Figure 1b) can be performed, which uses two strategies, coordination and cooperation, to determine the optimal crocodile position. Two strategies in this phase are mathematically expressed as follows:
where represents the percentage difference between the best and current positions, and is a small value in RSA. In general, the aim of the combination of coordination and cooperation is to avoid falling into local optima.
3. Development of the Novel CMRSA–ANN Model
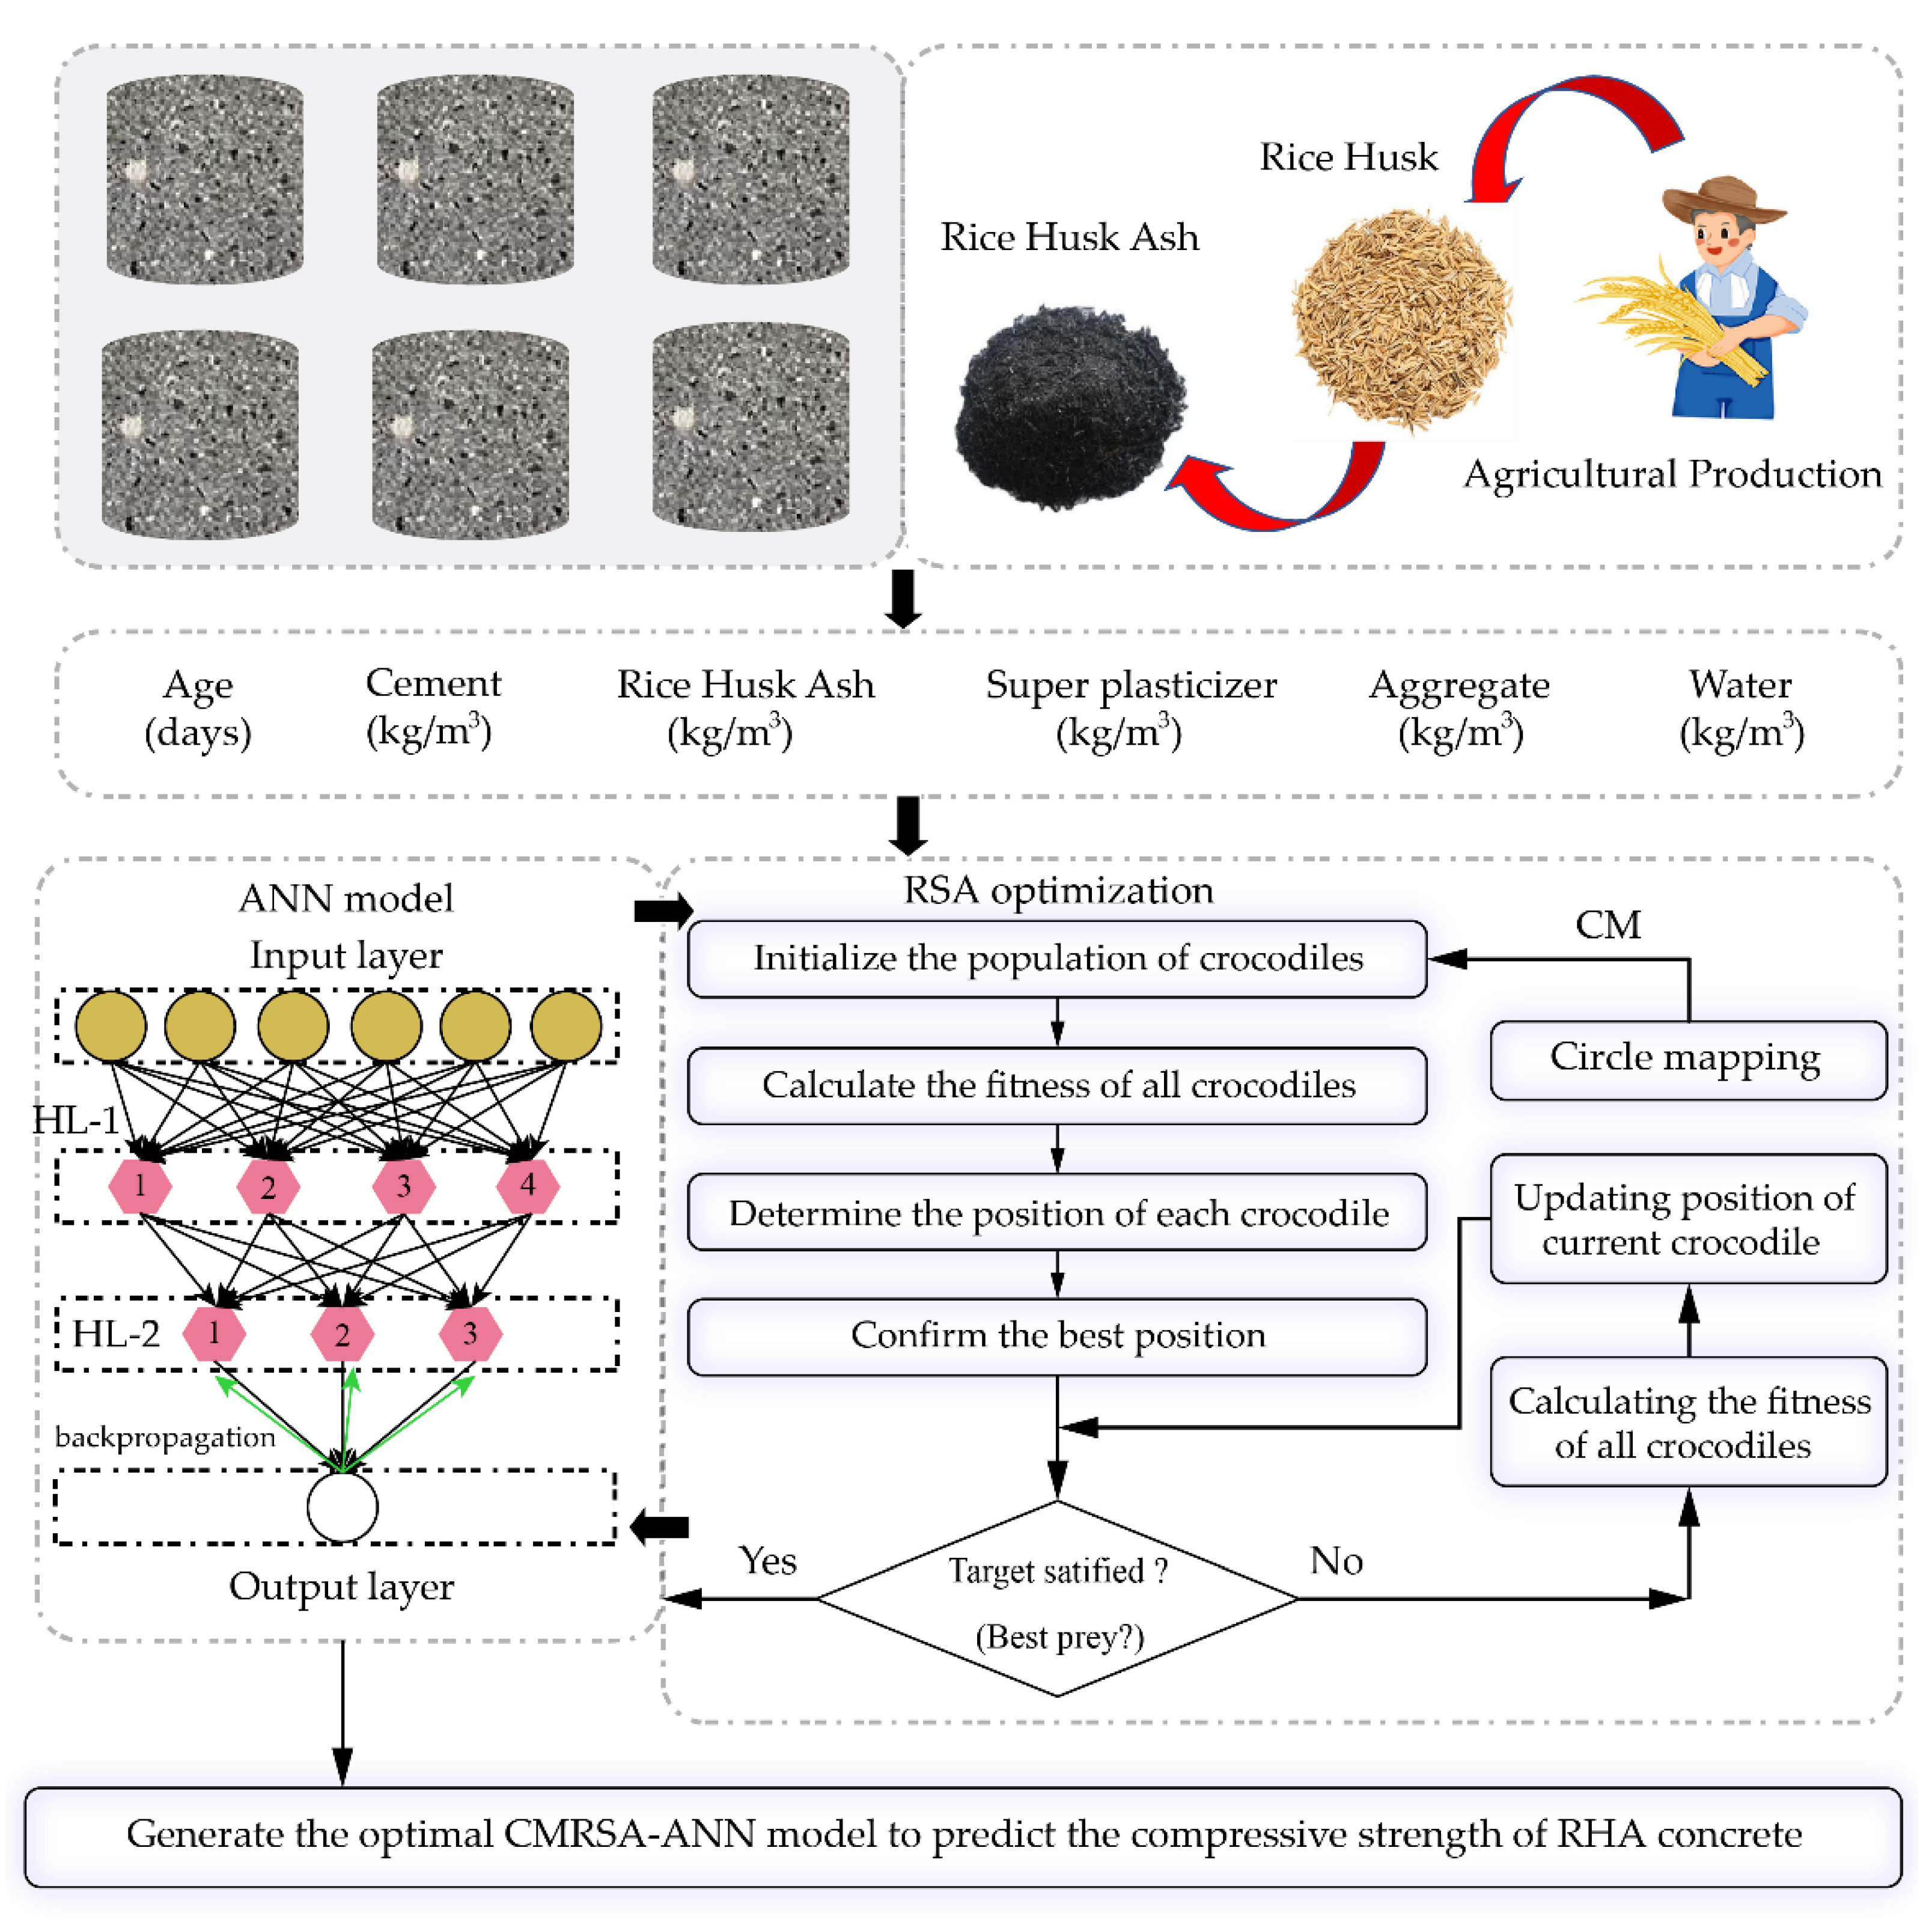
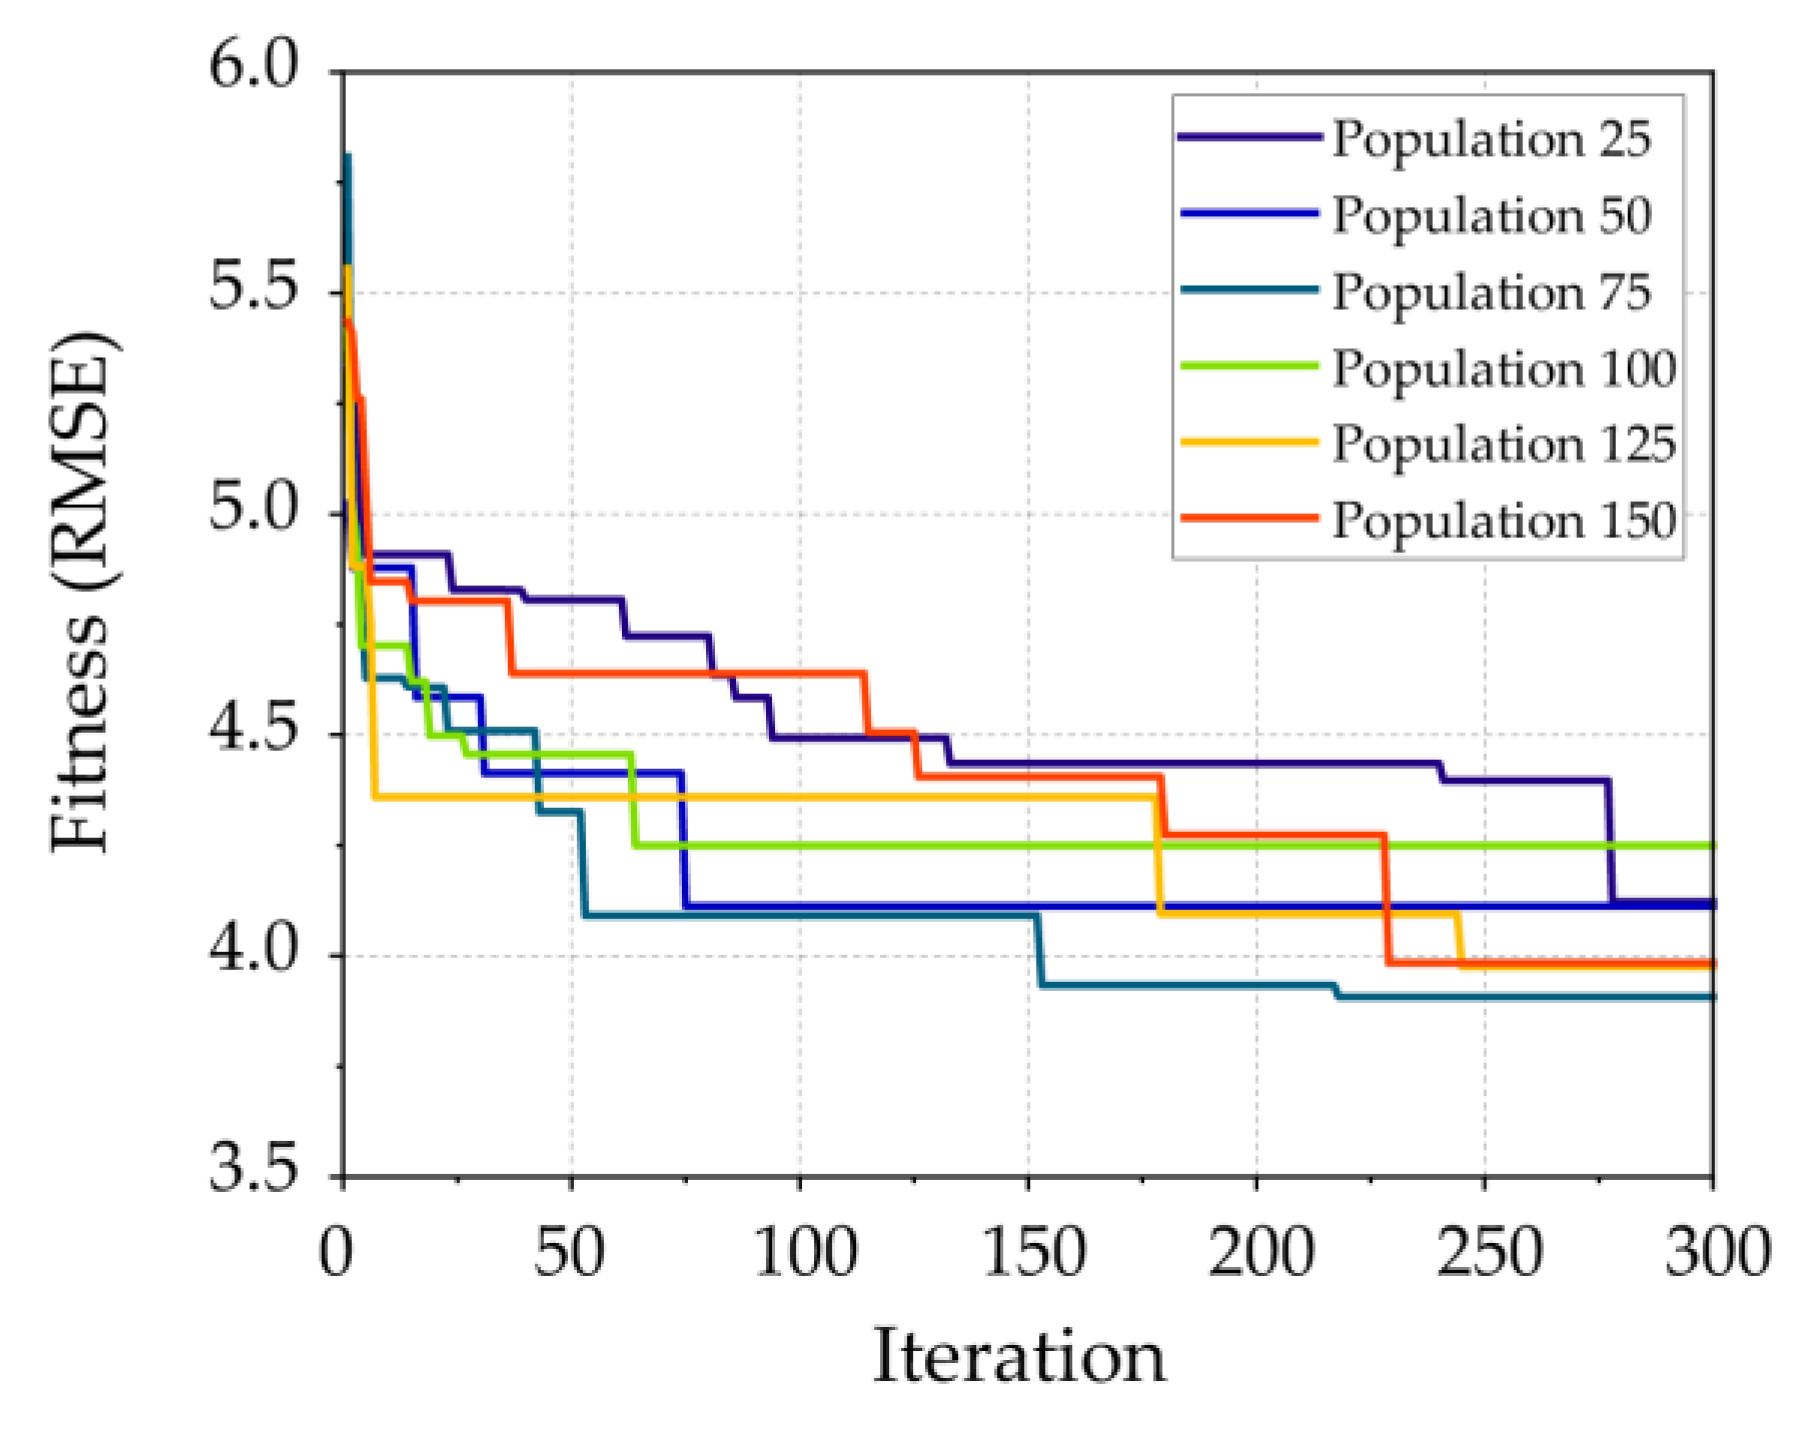
In this paper, the ANN model was generated to accurately predict the strength of RHA concrete. However, the design of an ANN structure has an important effect on predictive performance. In particular, the determination of weights and biases among the input, hidden, and output layers is difficult and challenging [65]. The improved RSA using Circle mapping (CM) was utilized to find the optimal weights and biases for the ANN model. To that end, a novel prediction model, CMRSA–ANN model, was proposed to predict the compressive strength of RHA concrete. Before running the model, a total of 192 data were randomly divided into training and test sets at a 4 to 1 ratio, i.e., 154 data were utilized to train the model, and 38 data to verify the model performance. All data can be found in the Supplementary materials. Since the units of all used parameters were different, the necessary normalization could avoid this impact on performance development. Thus, all parameters were normalized in the range from −1 to 1. For the optimization-algorithm-based population, population size is the most important internal parameter that needs to be determined during iterations [66,67,68]. To find the global optimal solution, six population sizes (25, 50, 75, 100, 125, and 150) were adopted to conduct the optimization process for the ANN model. We set up 300 iterations to ensure that the optimal solution could be found and remain stable. In general, the fitness value was utilized to represent the solution calculated with the optimization algorithm. In this paper, RMSE was used to generate a fitness function for evaluating optimization performance. The flowchart of developing CMRSA–ANN models to predict the compressive strength of RHA concrete is shown in Figure 2.
Other models (SOA–SVM, SOA–RF, ANN, ELM, and an empirical formular) were also developed to predict concrete strength, and their prediction results were compared with those of the CMRSA–ANN model. To select the best prediction model, four statistical indices were considered to evaluate the predictive performance of each model: R2, RMSE, variance accounted for (VAF), and mean absolute error (MAE). The definition of these indices can be found in the literature [69,70], and their formulars are expressed as follows:
where T is the maximal number of samples; Ct and ct are the values of the t-th measured and predicted, respectively; is the average of the measured values.
4. Prediction Model Development
Before applying the ideal proposed model to predict the compressive strength of RHA concrete, all models were developed using the same training set (80% of the database). The detailed development process of each model is shown in this section.
4.1. ANN Model
For a common ANN model, the basic structure is composed of input, hidden, and output layers. Compared with the number of hidden layers, one input layer and one output layer are fixed collocations in single-target regression tasks. Two hidden layers are often utilized to solve similar prediction problems [71,72,73]. Furthermore, the number of neurons in each hidden layer greatly impacts ANN model performance. Hence, a series of tests were carried to select the suitable ANN structure and the corresponding neurons for predicting the compressive strength of RHA concrete. In this paper, the hidden layers were 1 or 2, the range of neuron numbers was from 2 to 12, the activation function was set to sigmoid, and the backpropagation algorithm was utilized to improve the prediction accuracy. As a result, 10 tests with different ANN models were established, and their performance was represented by using R2 and RMSE, as shown in Table 3. The ANN model with two hidden layers (four neurons in the first hidden layer and three neurons in the second hidden layer) had the best performance, with a higher R2 (0.8772) and lower RMSE (5.8632) than those of other models.
4.2. CMRSA–ANN Model
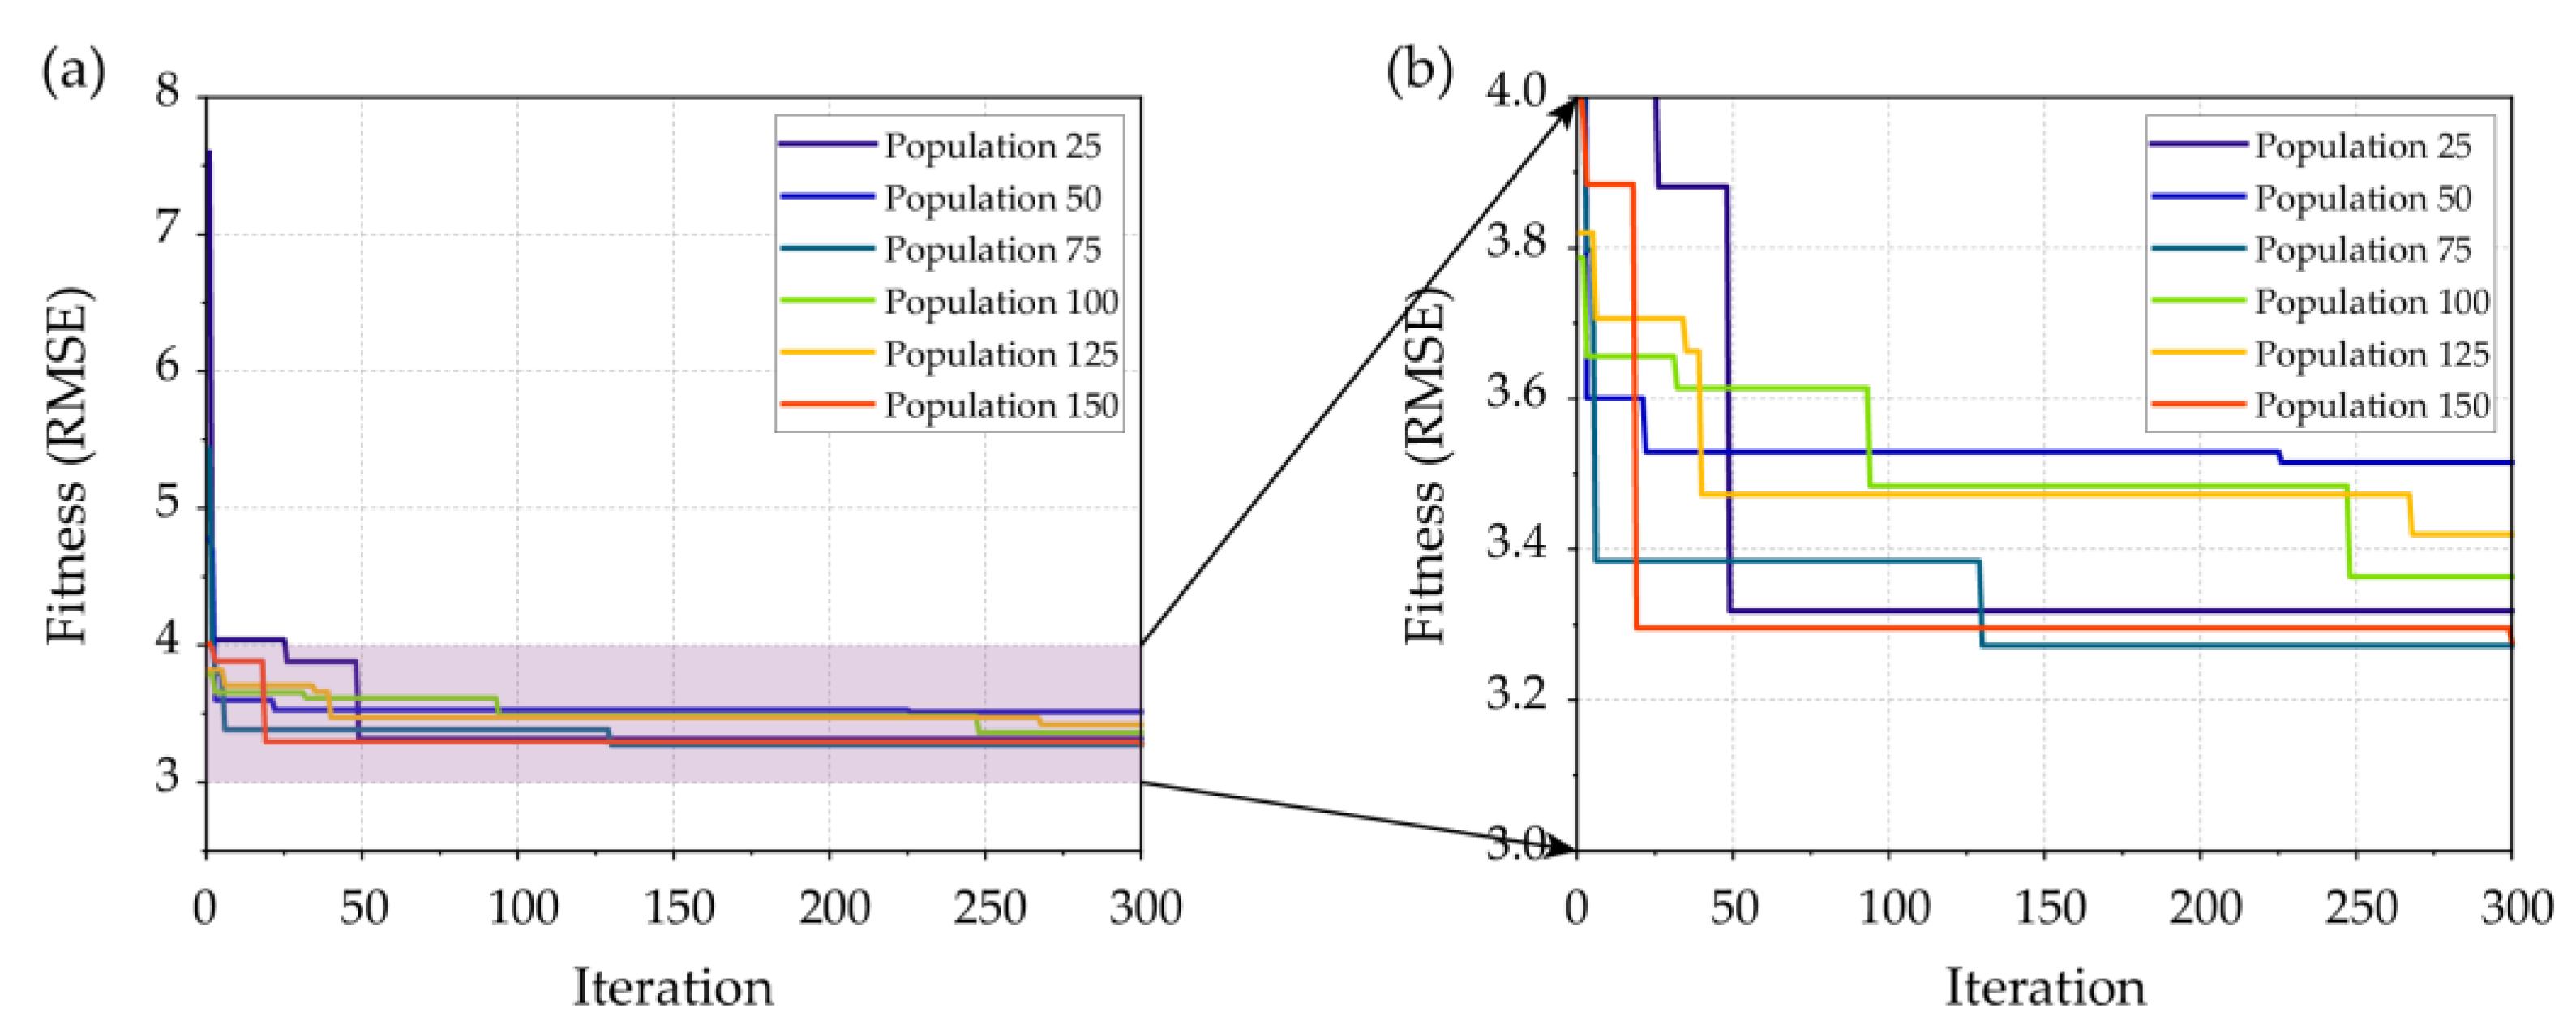
Although the best structure was determined in the ANN model development, it is difficult to choose weights and biases between layers to minimize prediction error. Therefore, the CMRSA optimization algorithm was utilized to optimize the initial ANN model with two hidden layers (four neurons in the first hidden layer and three neurons in the second hidden layer); the framework is shown in Figure 2. Six hybrid CMRSA–ANN models with different population sizes were run for 300 iterations. The iteration curve of each model is shown in Figure 3a. Figure 3b shows that the CMRSA–ANN model with a population size of 75 had the lowest fitness value among all hybrid ANN models. As a result, this model was used to predict the compressive strength of RHA concrete in this paper.
4.3. SOA–SVM Model
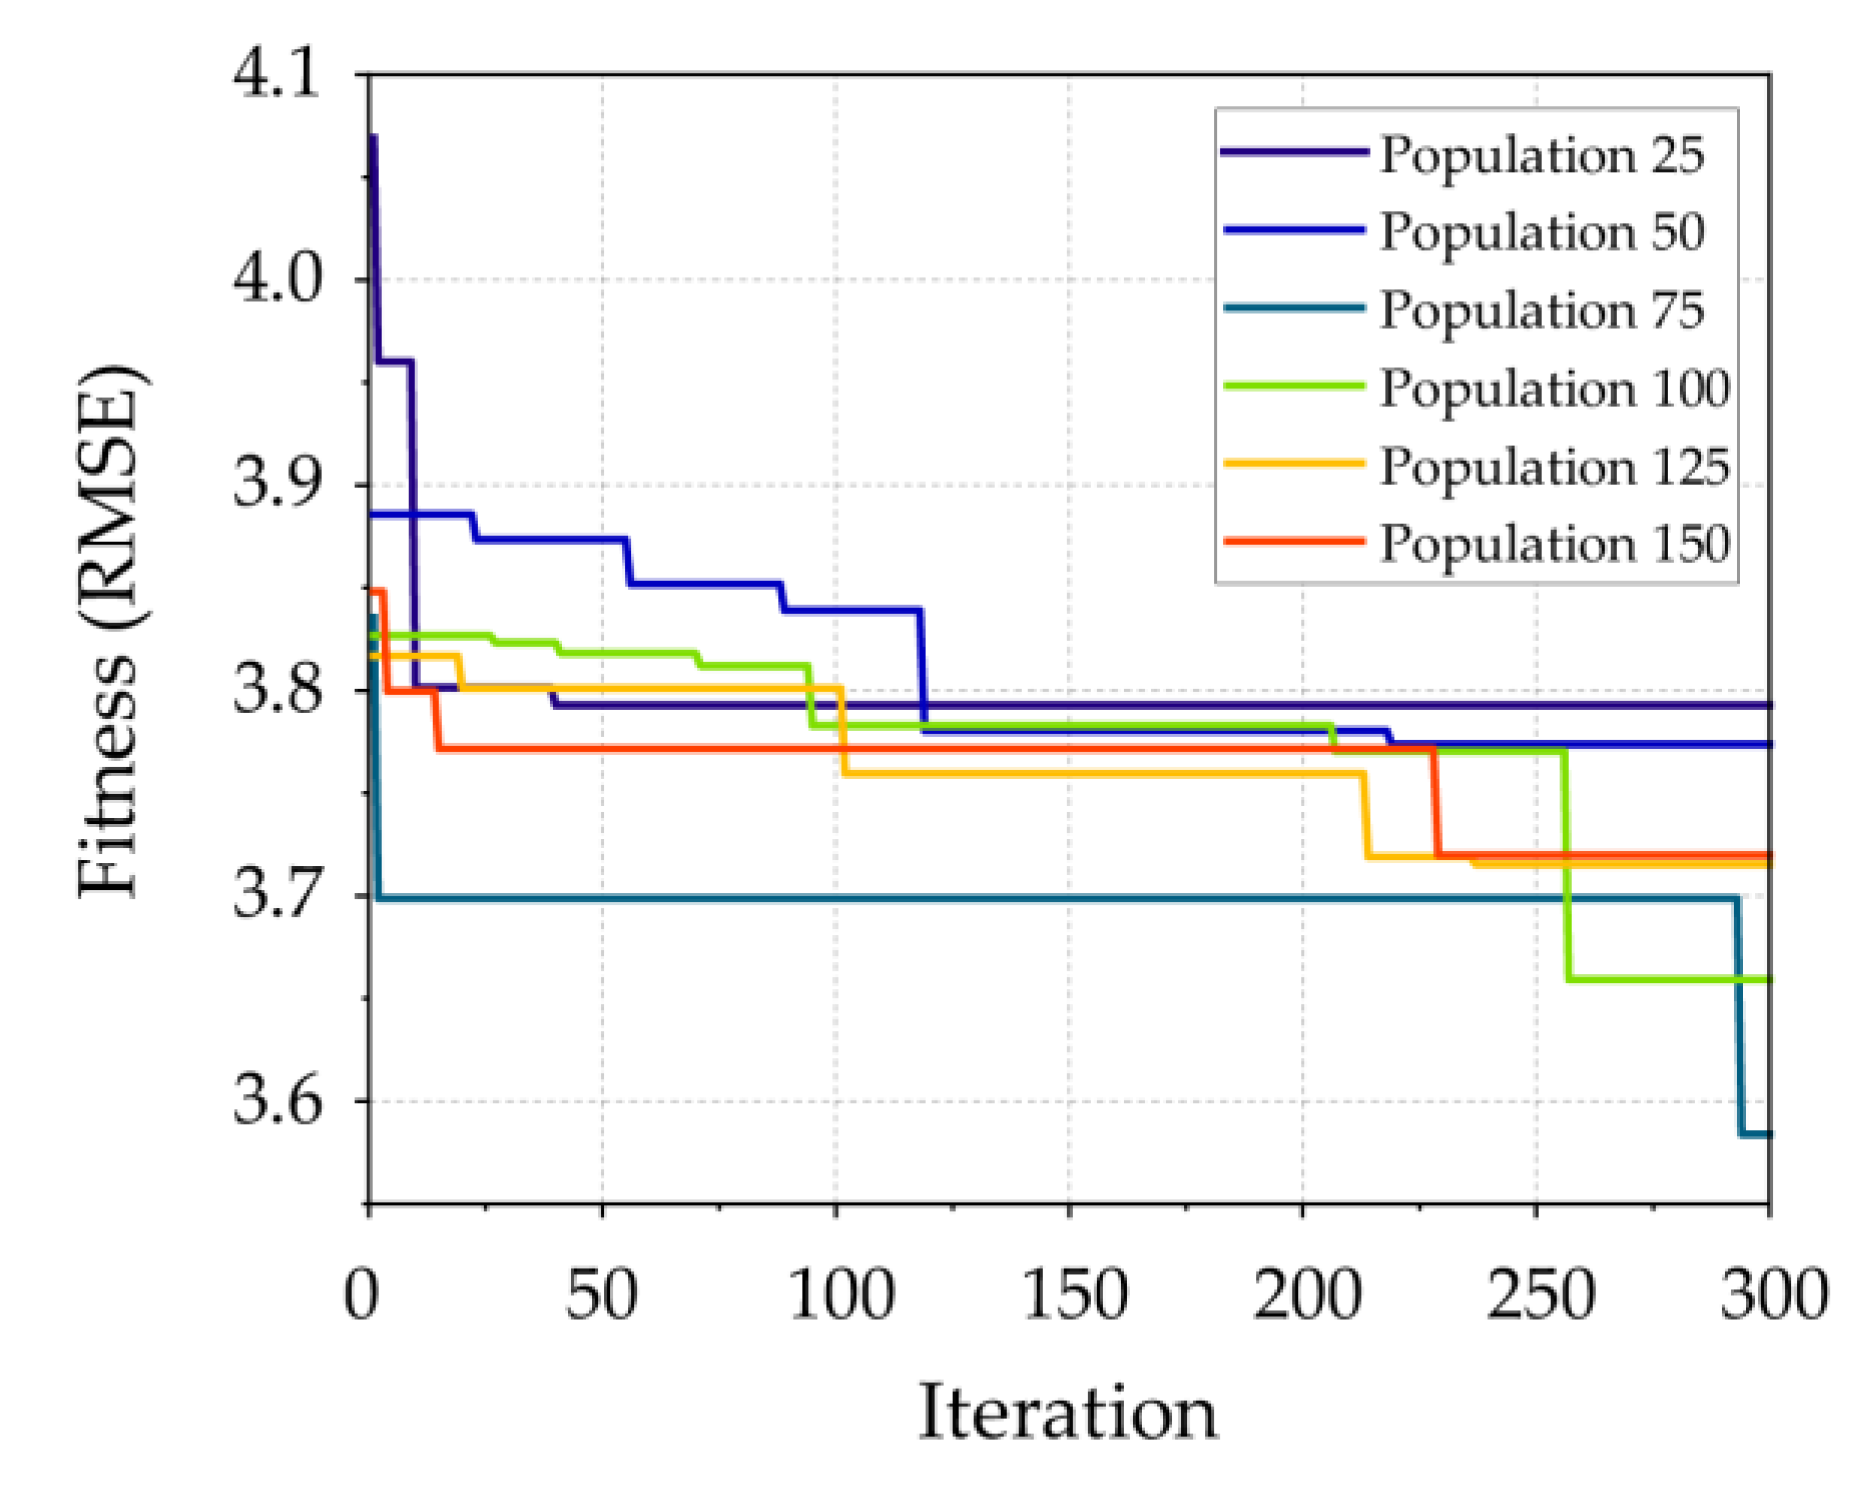
The development of the SOA–SVM model is similar to that of the CMRSA–ANN model. For the SVM model, two main hyperparameters, the regularization parameter (C) and kernel coefficient () of the used kernel function, are key players to improving the model performance [74,75]. In this paper, the popular radial basis function (RBF) was considered as the kernel function of the SVM model. To determine the optimal hyperparameter combination of the SVM model, the range of these parameters was 0 to 100. Thew population sizes and iteration number of SOA were set to be the same as those of the CMRSA. The development results of the SOA–SVM models are shown in Figure 4. The best SOA–SVM model had a population of 75 in the training phase and had a lower fitness value of RMSE than that of other models.
4.4. SOA–RF Model
Ensemble models such as the RF model could achieve good performance in solving classification and regression problems; a detailed introduction of the RF model can be found in the literature [58,76]. The unique tree structure and bootstrap sampling allow for the RF performance to be determined by all trees and resist overfitting [74]. In the development of SOA–RF models, the main purpose is to find the best hyperparameter combination of the RF model, i.e., the number of tress (Nt) and the random features (Maxdepth). In this paper, the tree-number range was from 1 to 100, and the random-feature range was from 1 to 10. Figure 5 shows the optimization results of thew SOA–RF models based on different population sizes after 300 iterations. The OA–RF model containing a population of 75 achieved the most satisfactory performance, as shown by having the lowest fitness value of RMSE. Therefore, this SOA–RF model was considered to predict the compressive strength of RHA concrete.
4.5. ELM Model
The ELM model is a special neuron network with a single hidden layer for solving regression problems. The predictive performance of the ELM model is only controlled by the selection of neuron numbers in the hidden layer. To that end, 10 ELM models with various neuron numbers in the hidden layer were generated to predict concrete strength. Table 4 lists the predictive performance of each ELM model in the training phase. ELM models with large neuron numbers achieved better performance than that of models with smaller neuron numbers. However, the best ELM model was in the 9th test, when the neurons were 100. The performance indices of this model were more reliable than those of other models, i.e., R2 is equal to 0.8932 and RMSE is equal to 5.4682.
4.6. Empirical Model
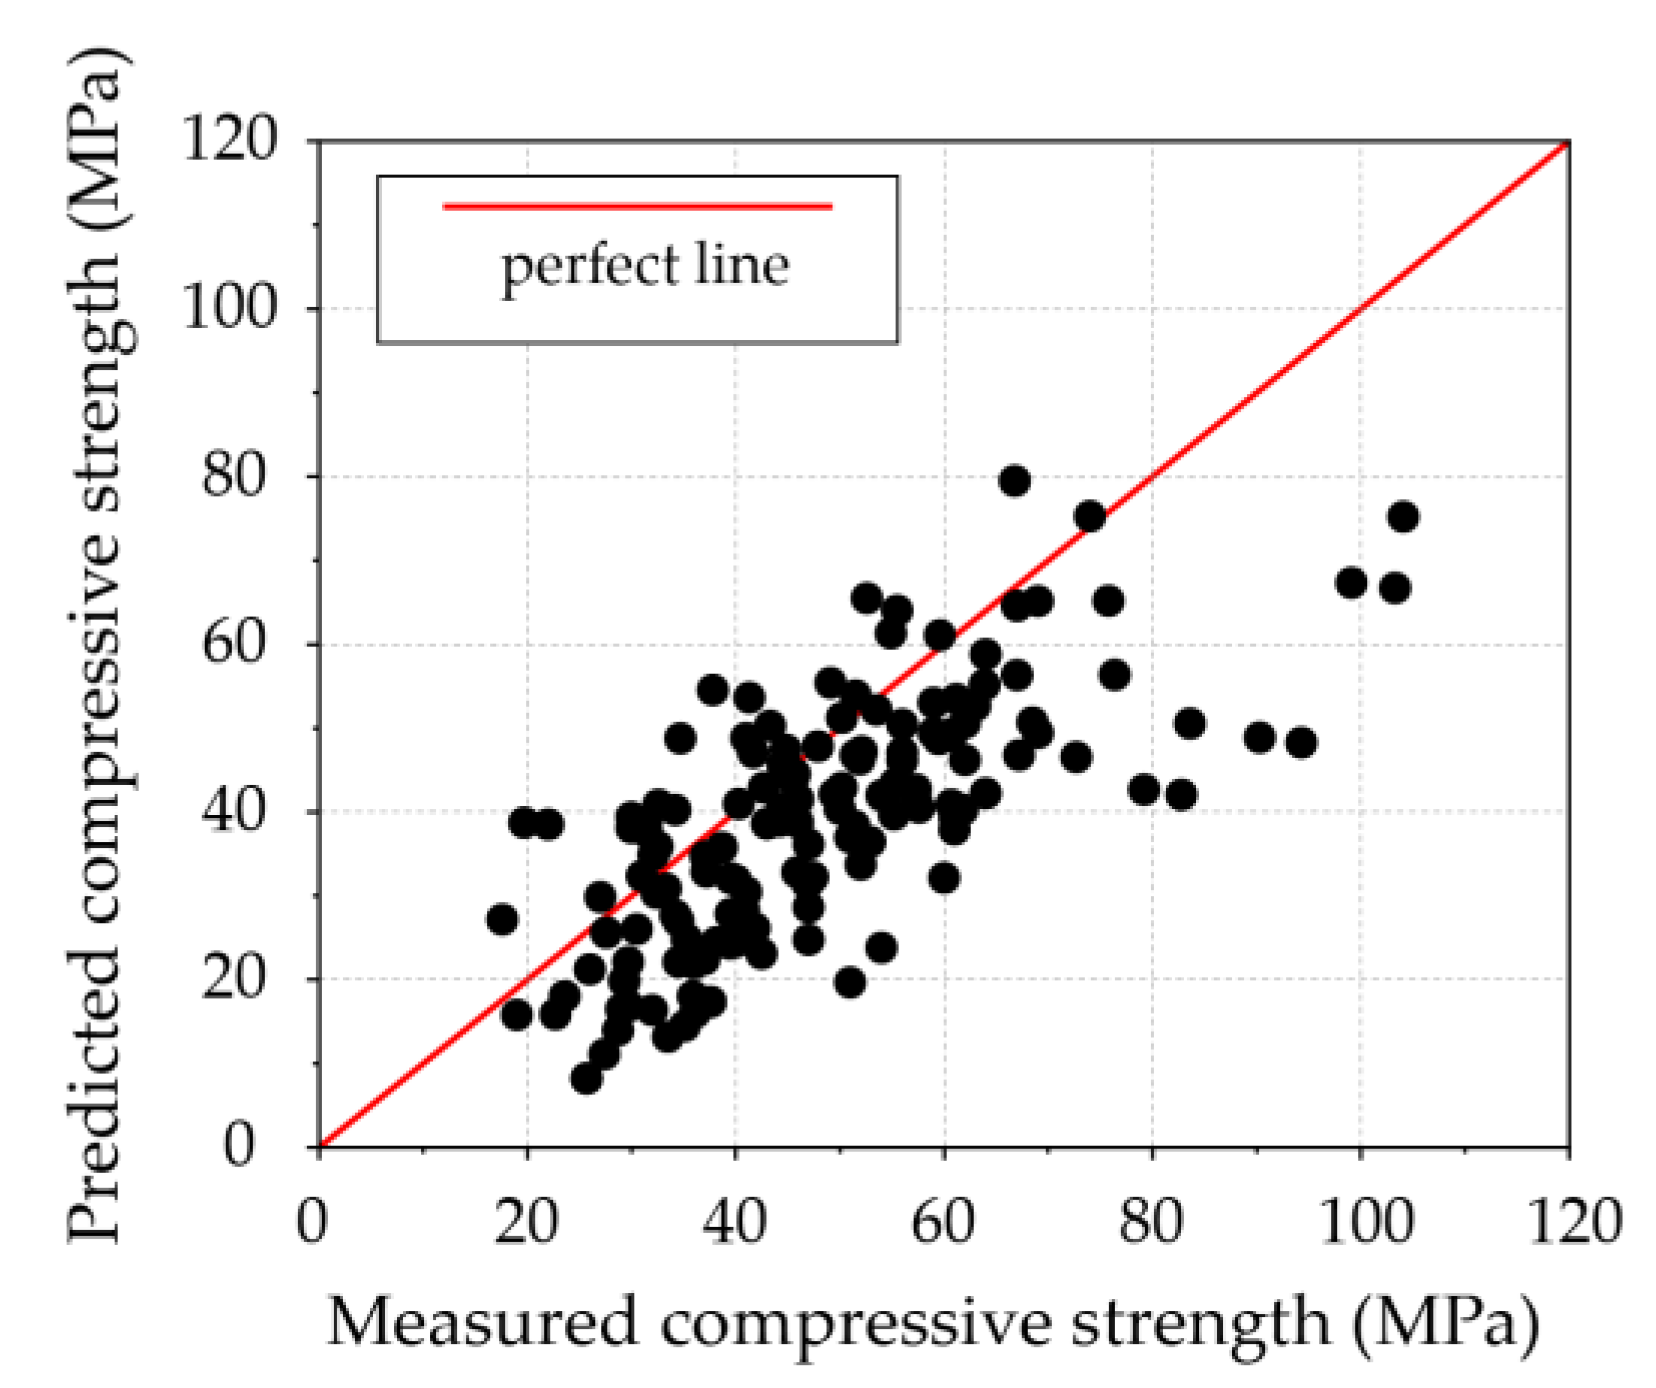
The empirical model is an effective method that uses the relevant parameters to quickly achieve the target calculations. In this paper, six input parameters were considered into the empirical formular using multivariate linear regression, as expressed in Equation (9). The training performance of the developed empirical model is shown in Figure 6.
where Y represents the compressive strength. X1–X6 represent the age, cement, RHA, water, superplasticizer, and aggregate, respectively.
5. Results and Discussion
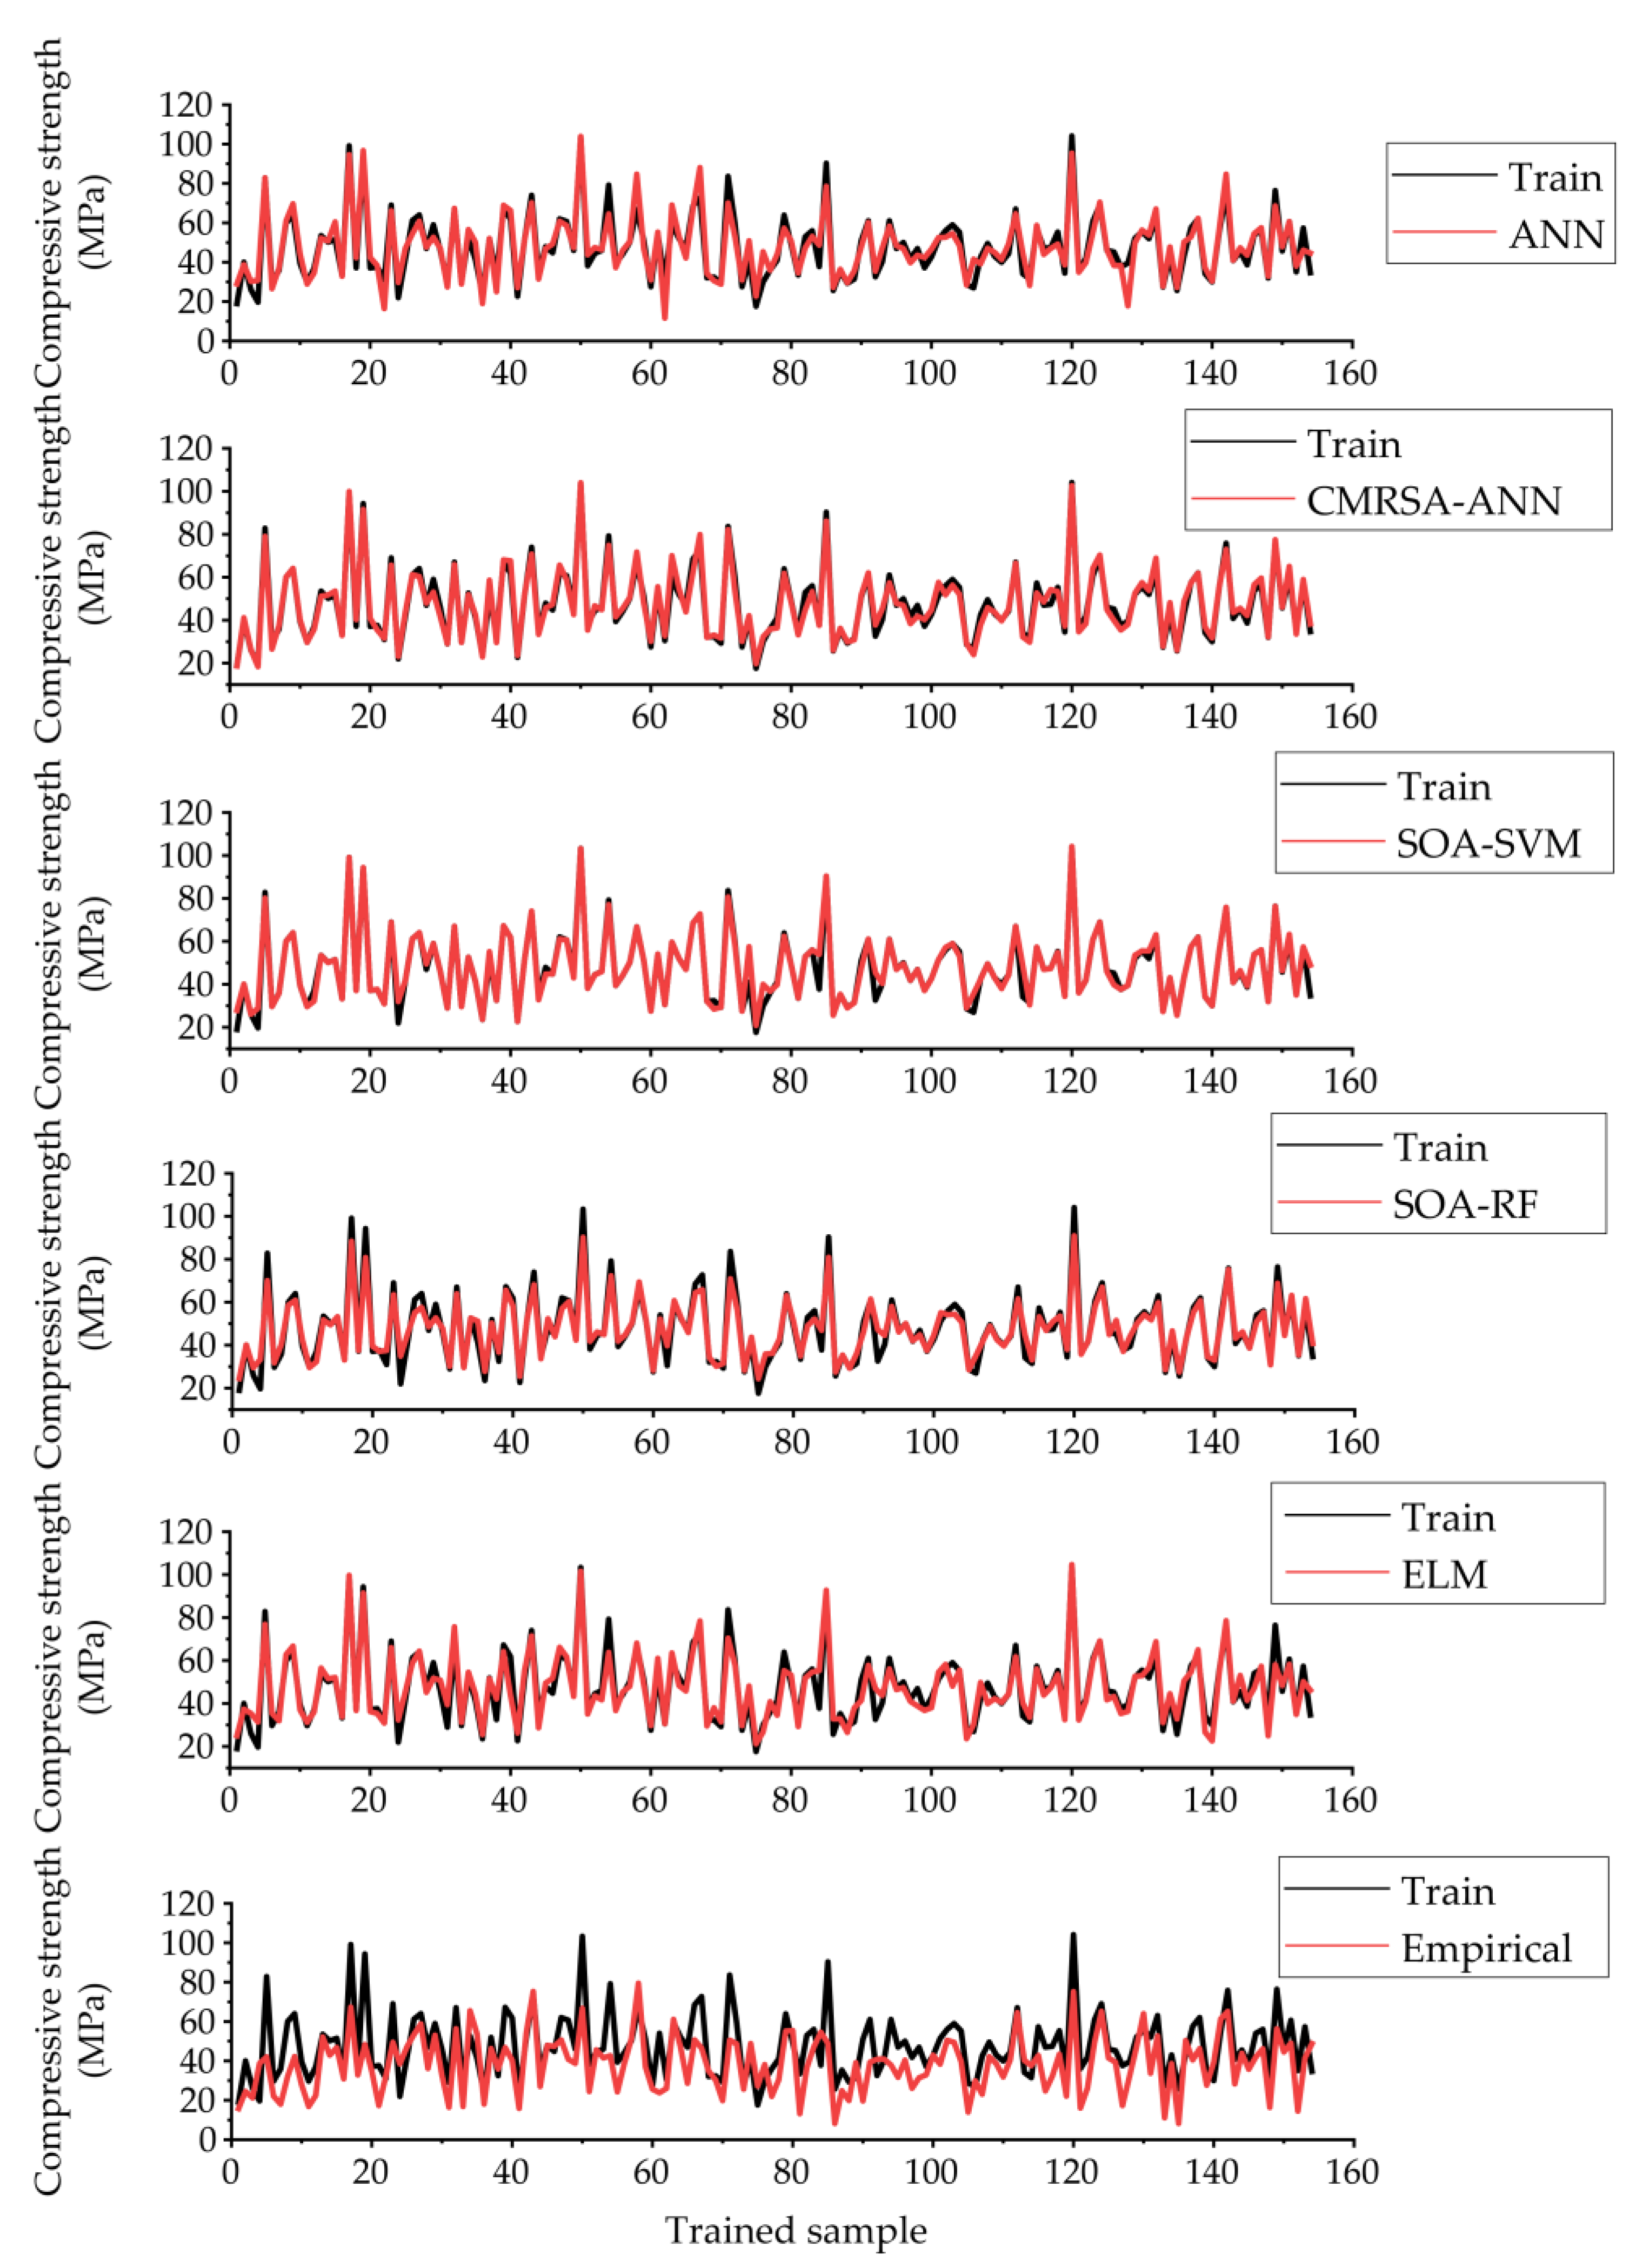
After training the proposed models, the predictive performance of each model was properly evaluated. Figure 7 shows the prediction curves of all models for estimating the compressive strength of RHA concrete in the training phase. The difference between the prediction curve of the empirical model and the training curve was the greatest among all models. The similarity between the prediction curves of three hybrid models and training was relatively higher, especially in the CMRSA–ANN model.
However, all trained models needed to be further tested to ensure the retention of the excellent predictive ability. Table 5 illustrates the evaluation results of each model using four performance indices in both the training and the testing phases. The performance results from using the training set show that the CMRSA–ANN model was the best prediction model, as it had the highest values of R2 and VAF (0.9679 and 96.7884%), and the lowest values of RMSE and MAE (2.9991 and 2.3169). Following this model, two other hybrid models (SOA–SVM and SOA–RF) also had superior predictive accuracy than that of the unoptimized ML (ANN and ELM) and empirical models. On the other hand, the proposed CMRSA–ANN model still achieved better predictive performance than that of other models, indicated by the higher values of R2 and VAF (0.9709 and 97.0911%), and the lower values of RMSE and MAE (3.4489 and 2.6451). Although the performance of the SOA–SVM and SOA–RF models in the testing phase was worse than that using the training set, they still achieved higher predictive accuracy than that of the unoptimized ML models. The ANN model achieved better performance than that of the ELM model in the testing phase, proving that the prediction accuracy of the ELM model is unstable for solving regression problems.
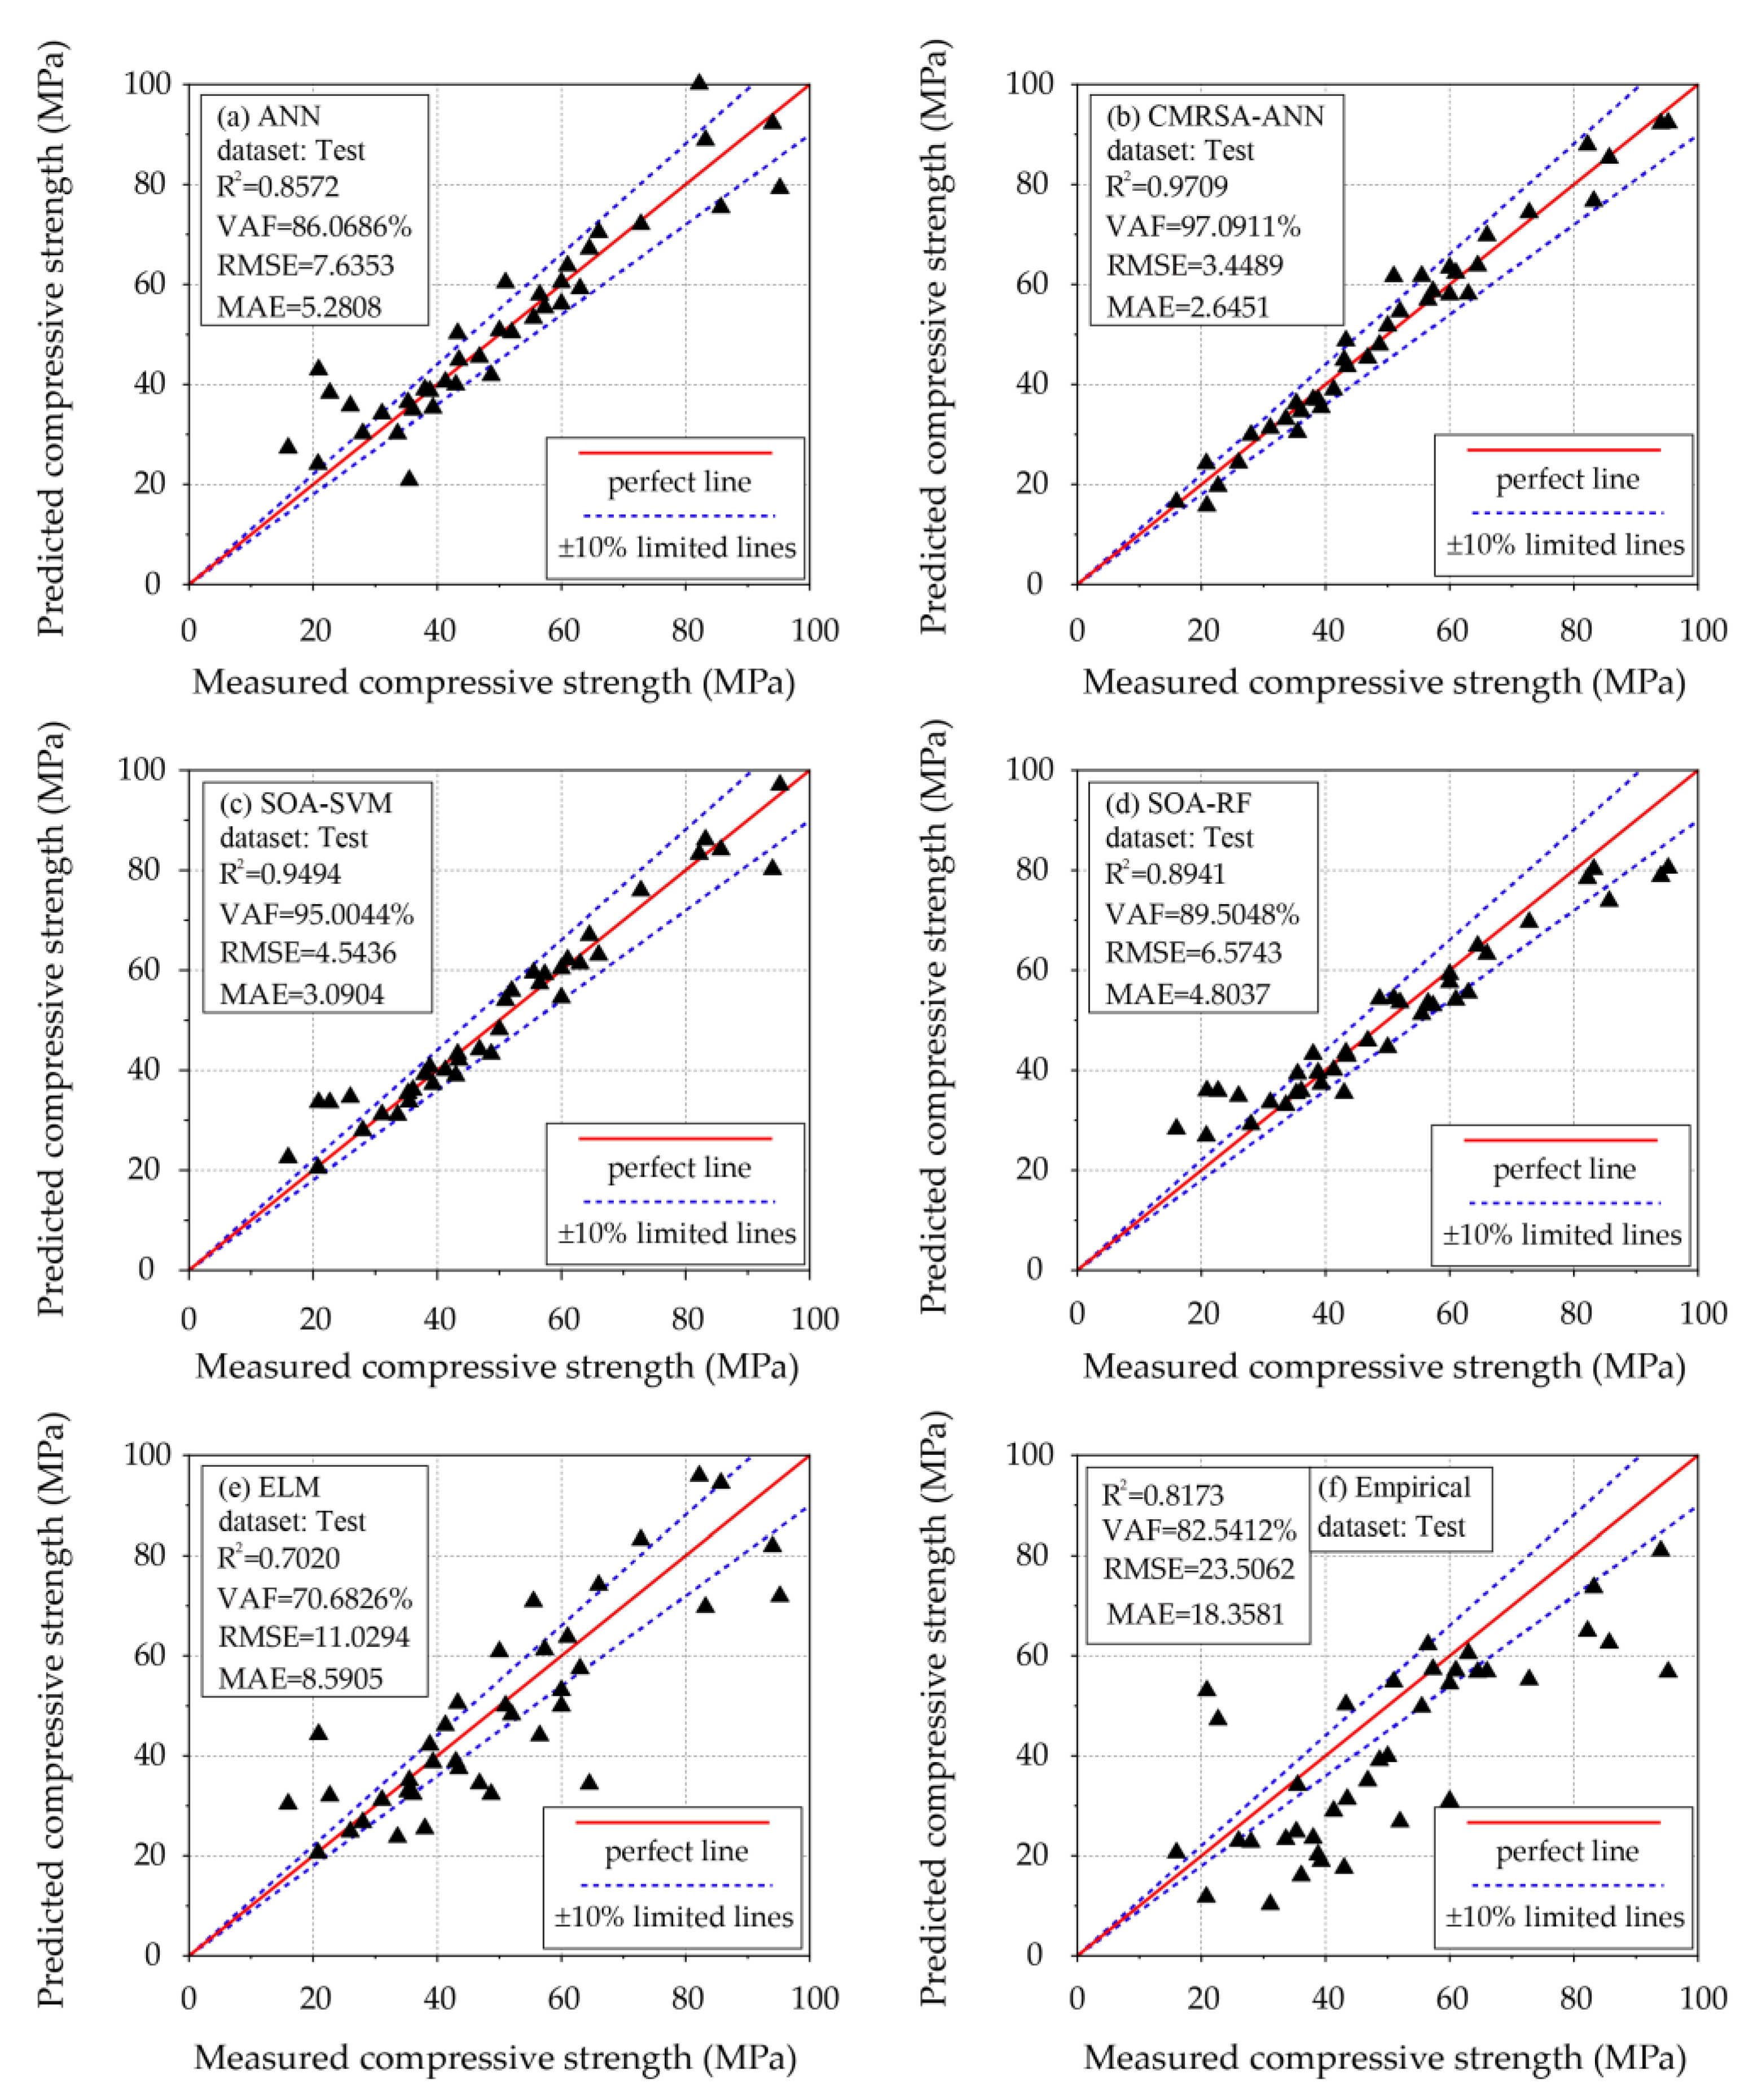
Regression relationships can also be used to evaluate and compare the predictive performance of models. Figure 8 shows the regression results of each model using the test set. In each regression plot, one perfect and two limited lines were used to evaluate the regression relationship between the values from the prediction model and the measured values. For instance, the data point determined by the best model with a prediction accuracy of 100% could lie on the perfect line. Observations based on this criterion show that the CMRSA–ANN model achieved better predictive performance than that of other models, indicated by the greater number of data points close to the perfect line and within the limited lines. Furthermore, the performance of the SOA–SVM and SOA–RF models was better than that of the ANN, ELM, and empirical models, but they could not perform accurate predictions for small values of compressive strength (less than 30 MPa).
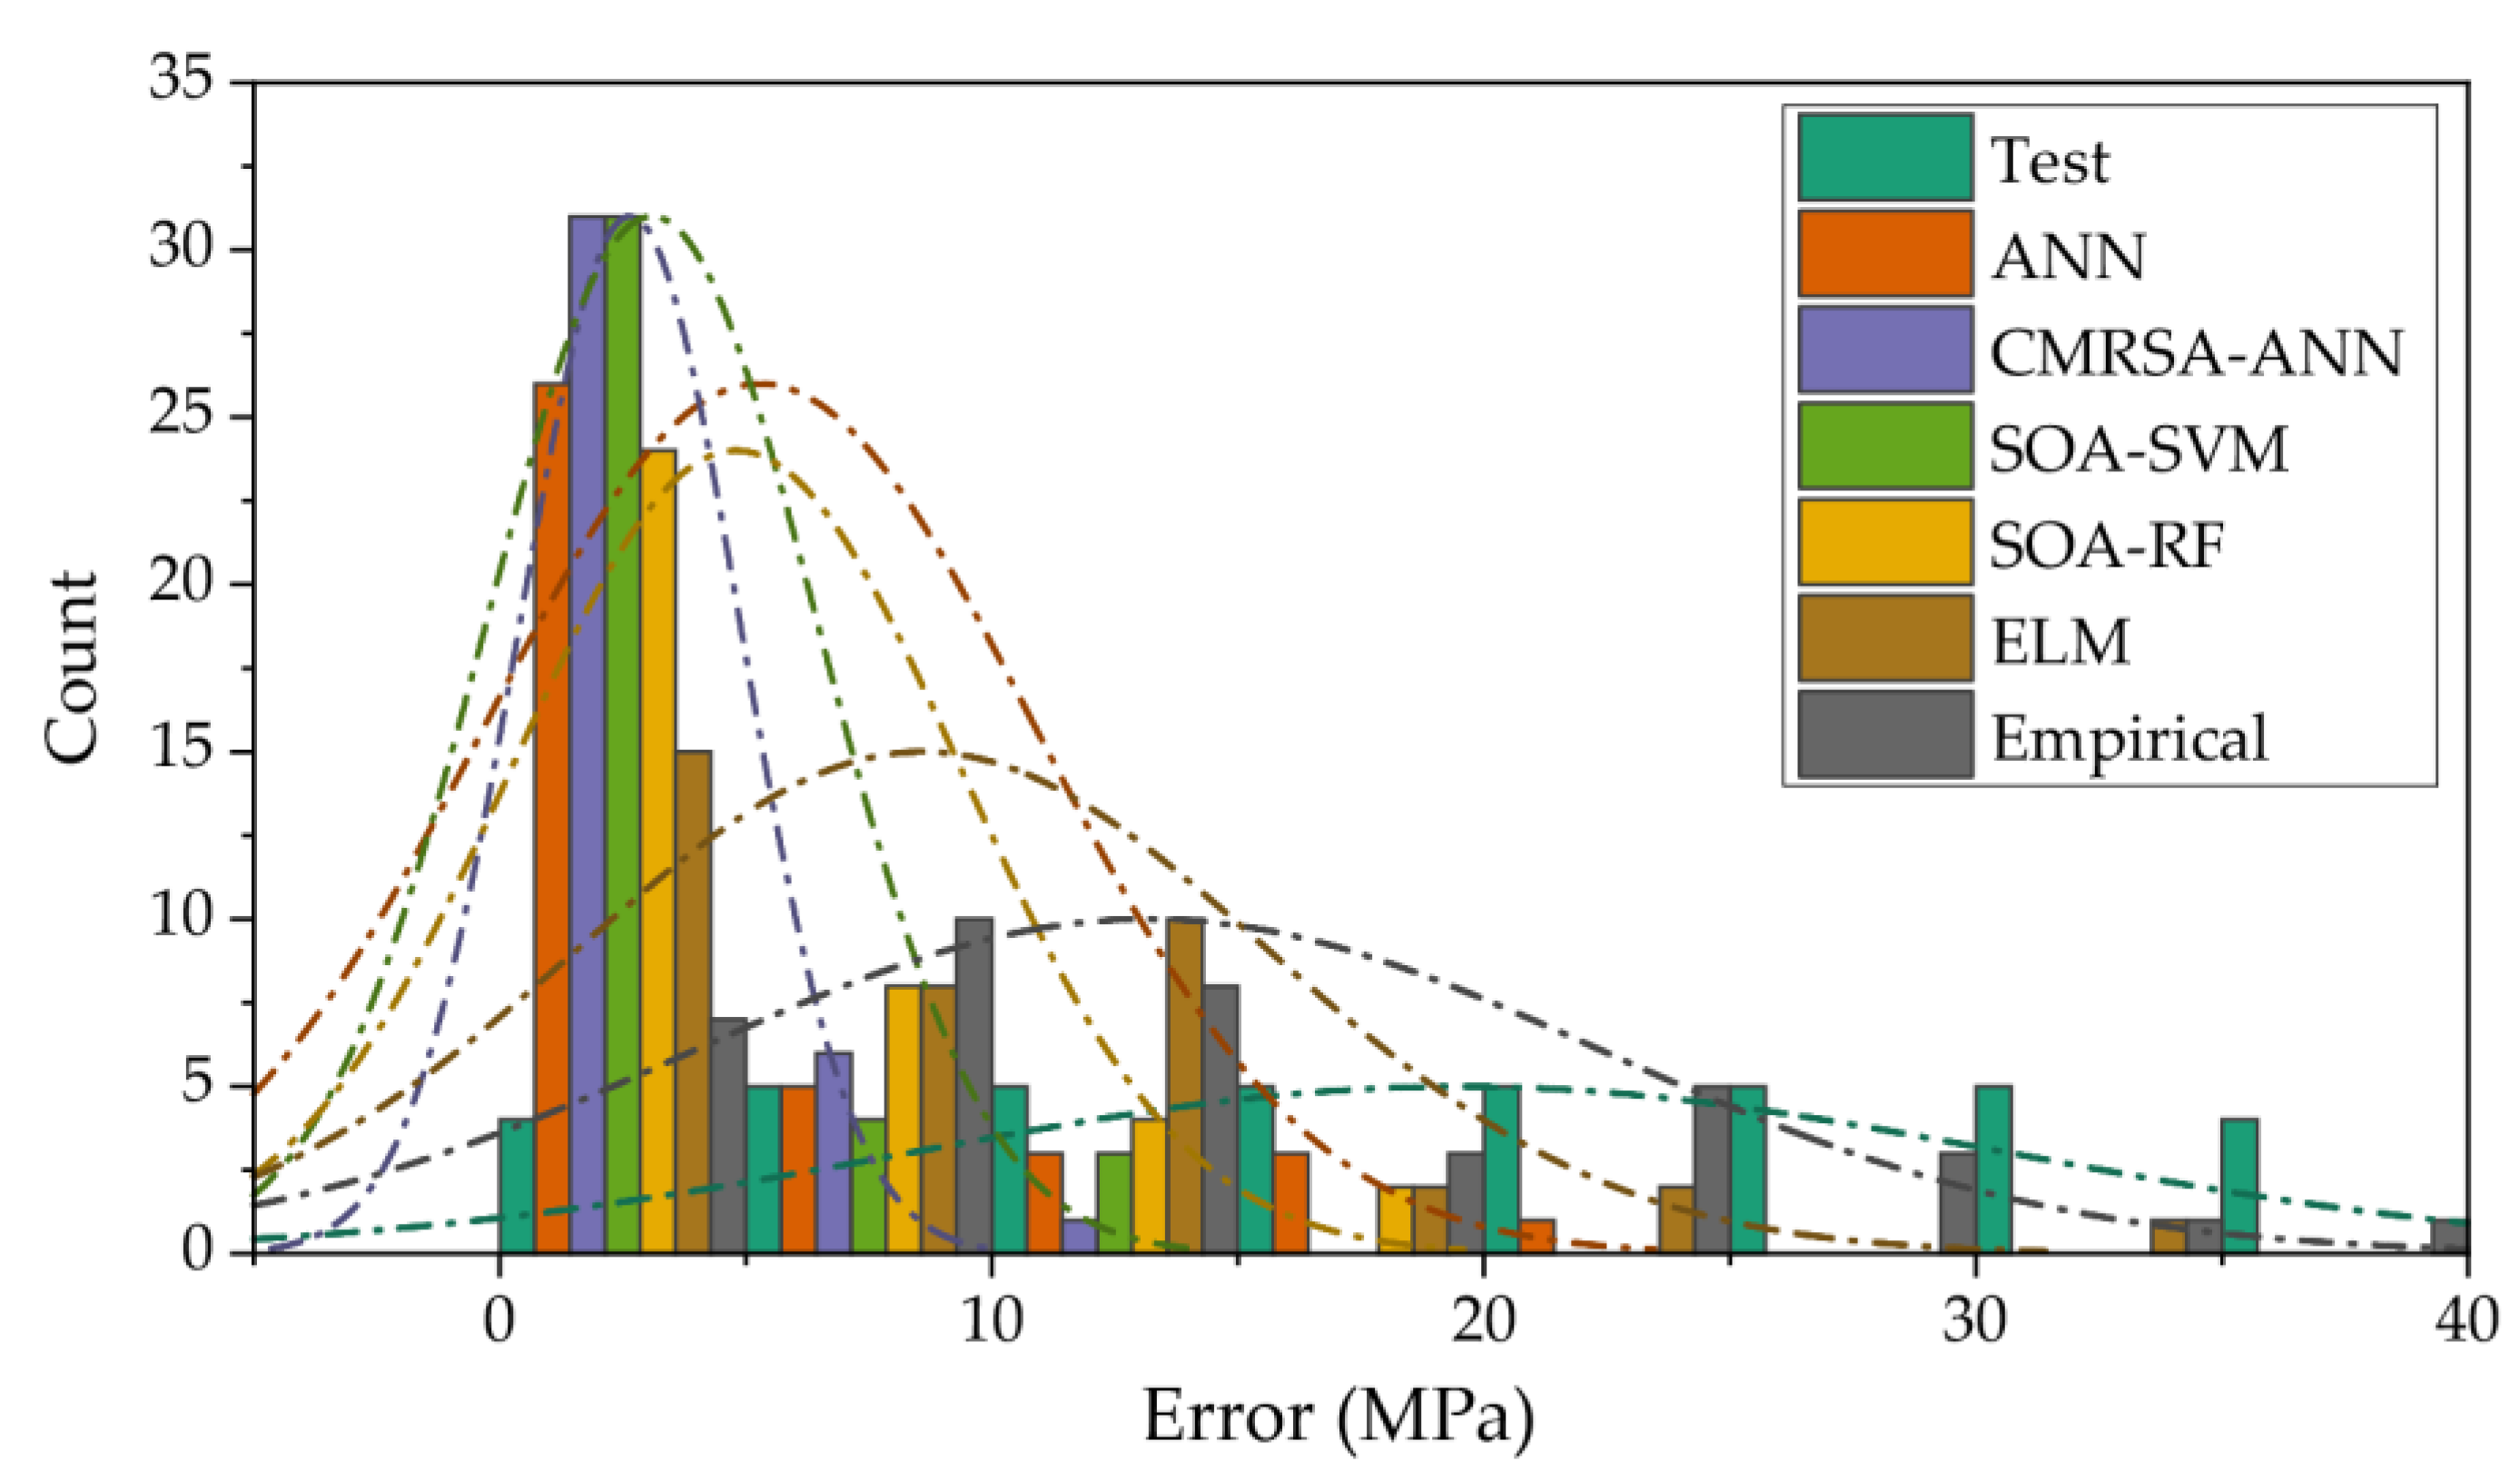
For the regression problem, the error between the predicted and measured values was one of the most concerning performance indices. Although perfect predictions rarely exist, one of the purposes of training and testing is to shrink the prediction error of each target as much as possible. The measured and predicted values of the compressive strength of RHA concrete are listed in Table 6. Figure 9 illustrates the error distribution of each prediction model in the testing phase. The error by the CMRSA–ANN model was mainly concentrated within 10 MPa and accounted for the highest proportion within 5 MPa. The error distribution of the SOA–SVM model was similar to that of the CMRSA–ANN model in a small range where the error was less than 10 MPa, while there were some larger errors between 10 and 15 MPa. The error distribution from the empirical model was undoubtedly the most unsatisfactory, as it both accounted for the lowest proportion of small errors and had many excessive errors.
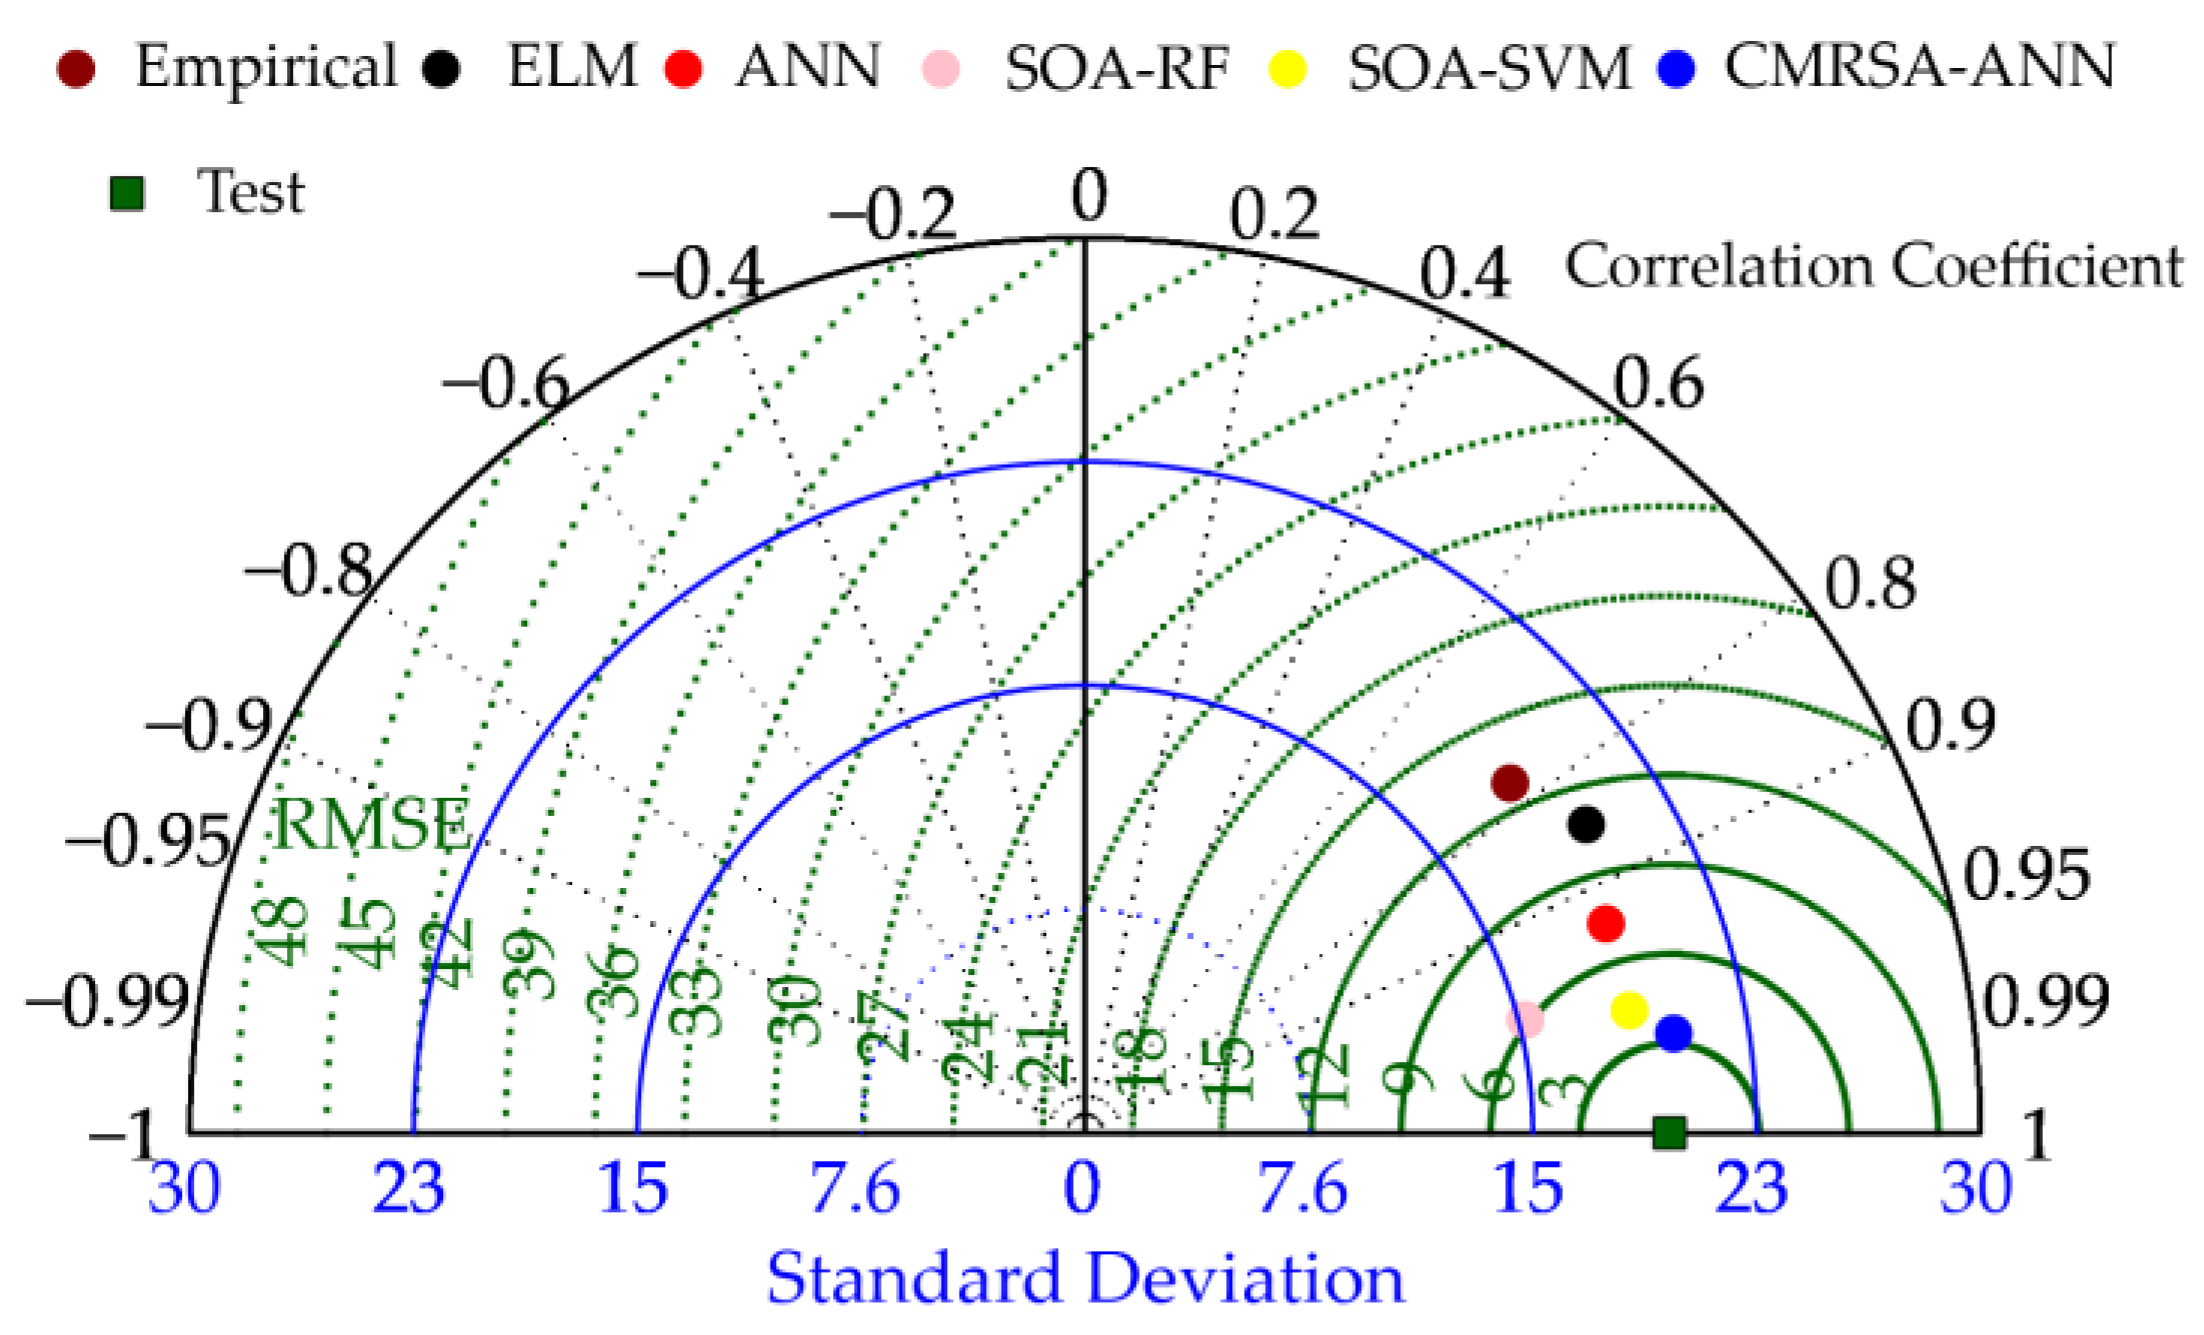
Taylor diagrams are used in visually comparing the predictive performance of multiple models. In a Taylor diagram, a model with high prediction accuracy is close to the position of the target value. The position of each model is determined with three indices, i.e., St. D., RMSE, and R. Therefore, the model performance can be evaluated and compared with multiple indices. Figure 10 displays the evaluation results of all developed models in the Taylor diagram. The CMRSA–ANN model was the closest to the position of the test set. Following this model, models sorted by distance are SOA–SVM, SOA–RF, ANN, ELM, and empirical. These results indicate that the CMRSA optimization algorithm is successful in improving the predictive performance of ANN models. The optimized SVM and RF models had better predictive accuracy than that of the unoptimized ANN and ELM models. Therefore, it is feasible to use the hybrid optimization model to predict the compressive strength of RHA concrete. CMRSA–ANN was selected as the optimal model in this paper.
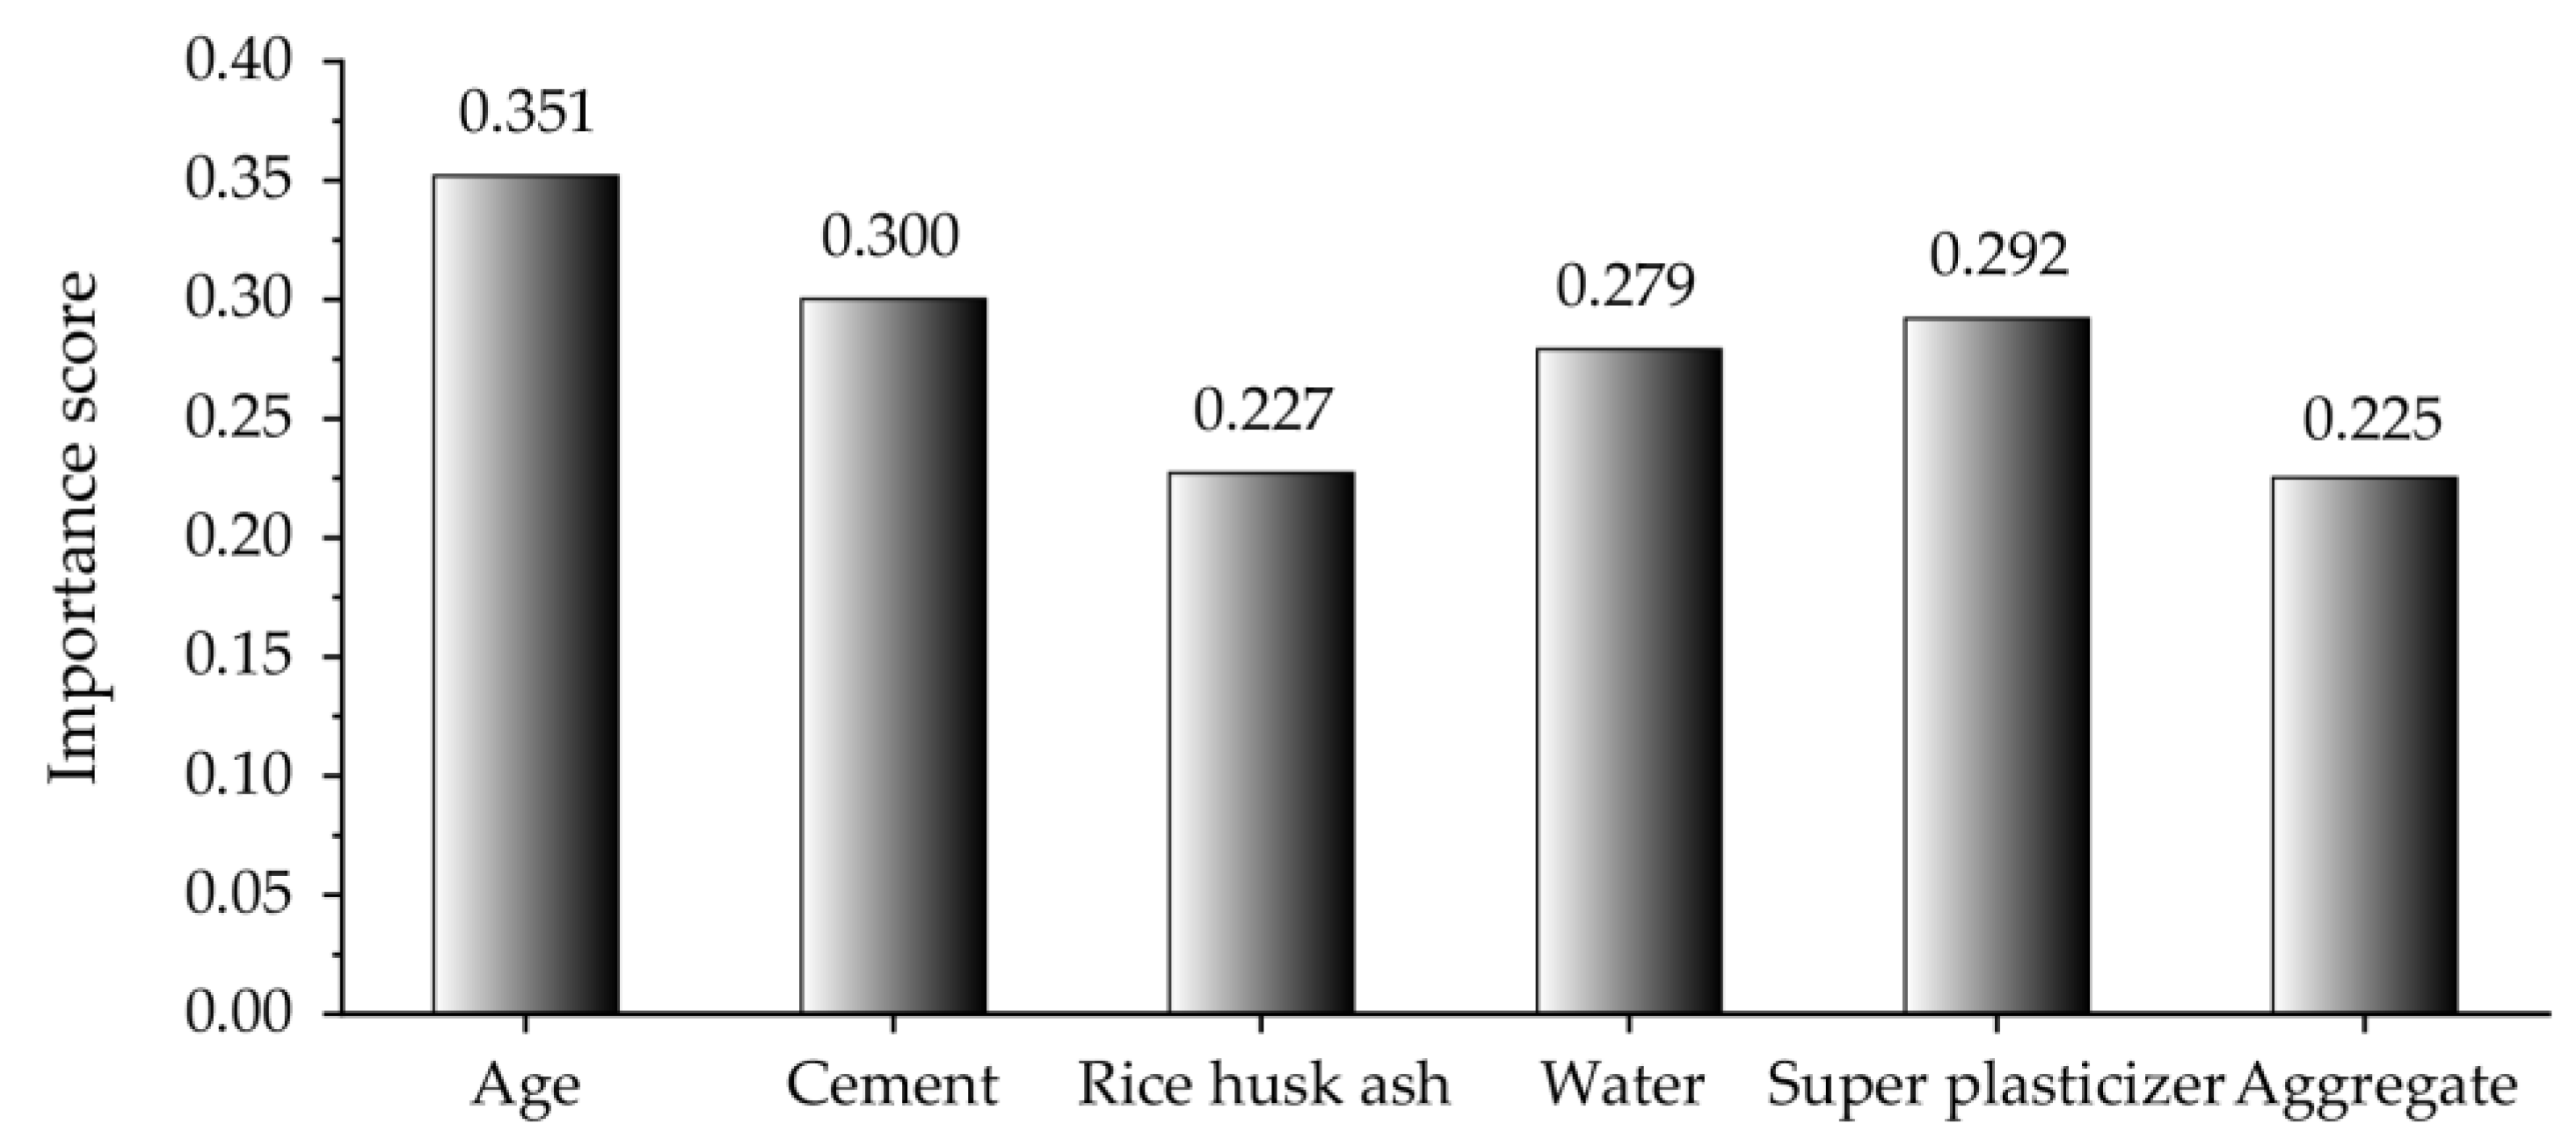
Nevertheless, the importance or sensitivity of each input parameter to the prediction of compressive strength is unknown, which is detrimental to further improving concrete properties. Therefore, sensitivity analysis was conducted to evaluate the impact of each input parameter on the output. In this paper, calculation method PAWN, proposed by Pianosi and Wagener [77,78], was adopted to calculate the importance score of the input parameters. Figure 11 illustrates the sensitivity results of the compressive strength prediction of the CMRSA–ANN model. Age was the most important parameter, with the highest score (0.351), for predicting the compressive strength of RHA concrete. After age, parameters ranked by influence are cement (0.300), the superplasticizer (0.292), water (0.279), RHA (0.227), and the aggregate (0.225). This result is consistent with that obtained by Iftikhar et al. [57].
In order to verify the effectiveness and superiority of the prediction model, the predictive performance of the other models developed using the same database was compared with that of the CMRSA–ANN model proposed in this paper, and the results are shown in Table 7. The proposed model had superior predictive performance than that of the published models, indicated by the higher R2 value. These results also indicate that the CMRSA–ANN model could better explain the relationship between the input parameters and the compressive strength of RHA concrete.
6. Conclusions
The combination of RHA and concrete not only solves the problem of carbon dioxide emissions from cement production and reduces the pressure of waste accumulation, but could also be widely used as a green building material. To evaluate the performance of RHA concrete, we proposed a novel hybrid CMRSA–ANN model to predict the compressive strength of RHA concrete. We utilized 192 concrete data to train the model and test its performance. Furthermore, four ML models and an empirical model were developed, and their prediction results were compared with those of the proposed model. The main conclusions of this paper are as follows:
(1) The proposed hybrid CMRSA–ANN model achieved the best prediction accuracy for R2 (0.9679 and 0.9709), VAF (96.7884% and 97.0911%), RMSE (2.9991 and 3.4489), and MAE (2.3169 and 2.6451) among all models in the both the training and the testing phases. The performance comparison between the proposed and optimized ANN models also indicated that the CMRSA could effectively improve the prediction ability of the ANN model.
(2) The empirical model could not better explain the relationship between the input parameters and the compressive strength of RHA concrete. Therefore, the empirical model was not suitable as a conventional means to evaluate concrete performance.
(3) The hybrid SOA–SVM and SOA–RF models achieved better performance than that of the unoptimized ANN and ELM models, indicated by a higher R2 (0.9491 and 0.8941) and VAF (95.0044% and 89.5048%), and lower RMSE (4.5436 and 6.5743) and MAE (3.0904 and 4.8037) in the testing phase. It is effective and necessary to use an optimization (such as population-based) algorithm to improve the performance of ML models.
(4) Age was the most important input parameter for predicting the compressive strength of RHA concrete. However, other input parameters with similar importance scores should also be given high priority.
The purpose of this paper was to propose a new method for predicting RHA concrete strength, and the mining of the potential relationship among the data themselves through hybrid algorithm combination and optimization. However, the limitation of this paper is that the amount of data used for training and testing the models was always insufficient. An increase in effective data could help in improving the ability of the model to learn the potential relationship between input and output parameters, and the diversification of the test data could better verify the model performance. Therefore, adding more experimental data is an effective way to further improve the prediction accuracy of the model. Combinations of other optimization algorithms and different ML models in the performance prediction of RHA concrete are also worth comparing.
Supplementary Materials
The following supporting information can be downloaded at: https://www.mdpi.com/article/10.3390/ma16083135/s1.
Author Contributions
Conceptualization: C.L. and X.M.; methodology: C.L. and J.Z.; investigation: Z.C., D.D. and J.Z.; writing—original draft preparation: C.L. and X.M.; writing—review and editing: C.L., X.M., Z.C., D.D. and J.Z.; visualization: C.L. and D.D.; funding acquisition: C.L. All authors have read and agreed to the published version of the manuscript.
Funding
The first author was funded by the China Scholarship Council (grant no. 202106370038).
Institutional Review Board Statement
Not applicable.
Informed Consent Statement
Not applicable.
Data Availability Statement
The data used in this study are from published research: Iftikhar et al. [57].
Acknowledgments
The authors want to thank all the members who give us lots of help and cooperation.
Conflicts of Interest
The authors declare no conflict of interest.
References
- Mei, X.; Cui, Z.; Sheng, Q.; Zhou, J.; Li, C. Application of the Improved POA-RF Model in Predicting the Strength and Energy Absorption Property of a Novel Aseismic Rubber-Concrete Material. Materials 2023, 16, 1286. [Google Scholar] [CrossRef] [PubMed]
- Thomas, B.S. Green concrete partially comprised of rice husk ash as a supplementary cementitious material–A comprehensive review. Renew. Sustain. Energy Rev. 2018, 82, 3913–3923. [Google Scholar] [CrossRef]
- Sheheryar, M.; Rehan, R.; Nehdi, M.L. Estimating CO2 emission savings from ultrahigh performance concrete: A system dynamics approach. Materials 2021, 14, 995. [Google Scholar] [CrossRef] [PubMed]
- Hamada, H.M.; Thomas, B.S.; Yahaya, F.M.; Muthusamy, K.; Yang, J.; Abdalla, J.A.; Hawileh, R.A. Sustainable use of palm oil fuel ash as a supplementary cementitious material: A comprehensive review. J. Build. Eng. 2021, 40, 102286. [Google Scholar] [CrossRef]
- Amran, M.; Murali, G.; Fediuk, R.; Vatin, N.; Vasilev, Y.; Abdelgader, H. Palm oil fuel ash-based eco-efficient concrete: A critical review of the short-term properties. Materials 2021, 14, 332. [Google Scholar] [CrossRef]
- Tayeh, B.A.; Hadzima-Nyarko, M.; Zeyad, A.M.; Al-Harazin, S.Z. Properties and durability of concrete with olive waste ash as a partial cement replacement. Adv. Concr. Constr. 2021, 11, 59–71. [Google Scholar]
- Hakeem, I.Y.; Agwa, I.S.; Tayeh, B.A.; Abd-Elrahman, M.H. Effect of using a combination of rice husk and olive waste ashes on high-strength concrete properties. Case Stud. Constr. Mater. 2022, 17, e01486. [Google Scholar] [CrossRef]
- Herath, C.; Gunasekara, C.; Law, D.W.; Setunge, S. Performance of high volume fly ash concrete incorporating additives: A systematic literature review. Constr. Build. Mater. 2020, 258, 120606. [Google Scholar] [CrossRef]
- Teixeira, E.R.; Camões, A.; Branco, F.G. Synergetic effect of biomass fly ash on improvement of high-volume coal fly ash concrete properties. Constr. Build. Mater. 2022, 314, 125680. [Google Scholar] [CrossRef]
- Mehta, A.; Ashish, D.K. Silica fume and waste glass in cement concrete production: A review. J. Build. Eng. 2020, 29, 100888. [Google Scholar] [CrossRef]
- Khan, M.; Ali, M. Improvement in concrete behavior with fly ash, silica-fume and coconut fibres. Constr. Build. Mater. 2019, 203, 174–187. [Google Scholar] [CrossRef]
- Beskopylny, A.N.; Shcherban, E.M.; Stel’makh, S.A.; Meskhi, B.; Shilov, A.A.; Varavka, V.; Özkılıç, Y.O.; Aksoylu, C.; Karalar, M. Composition Component Influence on Concrete Properties with the Additive of Rubber Tree Seed Shells. Appl. Sci. 2022, 12, 11744. [Google Scholar] [CrossRef]
- Shcherban, E.M.; Stel’makh, S.A.; Beskopylny, A.N.; Mailyan, L.R.; Meskhi, B.; Shilov, A.A.; Chernil’nik, A.; Özkılıç, Y.O.; Aksoylu, C. Normal-Weight Concrete with Improved Stress–Strain Characteristics Reinforced with Dispersed Coconut Fibers. Appl. Sci. 2022, 12, 11734. [Google Scholar] [CrossRef]
- Zeybek, Ö.; Özkılıç, Y.O.; Karalar, M.; Çelik, A.İ.; Qaidi, S.; Ahmad, J.; Burduhos-Nergis, D.D.; Burduhos-Nergis, D.P. Influence of replacing cement with waste glass on mechanical properties of concrete. Materials 2022, 15, 7513. [Google Scholar] [CrossRef] [PubMed]
- Karalar, M.; Bilir, T.; Çavuşlu, M.; Özkiliç, Y.O.; Sabri Sabri, M.M. Use of recycled coal bottom ash in reinforced concrete beams as replacement for aggregate. Front. Mater. 2022, 9, 1064604. [Google Scholar] [CrossRef]
- Qaidi, S.; Najm, H.M.; Abed, S.M.; Özkılıç, Y.O.; Al Dughaishi, H.; Alosta, M.; Sabri, M.M.S.; Alkhatib, F.; Milad, A. Concrete containing waste glass as an environmentally friendly aggregate: A review on fresh and mechanical characteristics. Materials 2022, 15, 6222. [Google Scholar] [CrossRef] [PubMed]
- Çelik, A.İ.; Özkılıç, Y.O.; Zeybek, Ö.; Karalar, M.; Qaidi, S.; Ahmad, J.; Burduhos-Nergis, D.D.; Bejinariu, C. Mechanical Behavior of Crushed Waste Glass as Replacement of Aggregates. Materials 2022, 15, 8093. [Google Scholar] [CrossRef] [PubMed]
- Karalar, M.; Özkılıç, Y.O.; Aksoylu, C.; Sabri MM, S.; Beskopylny, A.N.; Stel’makh, S.A.; Shcherban, E.M. Flexural behavior of reinforced concrete beams using waste marble powder towards application of sustainable concrete. Front. Mater. 2022, 9, 1068791. [Google Scholar] [CrossRef]
- Çelik, A.L.İ.; Özkılıç, Y. Geopolymer concrete with high strength, workability and setting time using recycled steel wires and basalt powder. Steel Compos. Struct. 2023, 46, 689–707. [Google Scholar]
- Acar, M.C.; Çelik, A.İ.; Kayabaşı, R.; Şener, A.; Özdöner, N.; Özkılıç, Y. Production of perlite-based-aerated geopolymer using hydrogen peroxide as eco-friendly material for energy-efficient buildings. J. Mater. Res. Technol. 2023, 24, 81–99. [Google Scholar] [CrossRef]
- Santhosh, K.G.; Subhani, S.M.; Bahurudeen, A. Recycling of palm oil fuel ash and rice husk ash in the cleaner production of concrete-A review. J. Clean. Prod. 2022, 354, 131736. [Google Scholar] [CrossRef]
- Amin, M.N.; Ahmad, W.; Khan, K.; Sayed, M.M. Mapping research knowledge on rice husk ash application in concrete: A scientometric review. Materials 2022, 15, 3431. [Google Scholar] [CrossRef] [PubMed]
- Li, Q.; Song, Z. Prediction of compressive strength of rice husk ash concrete based on stacking ensemble learning model. J. Clean. Prod. 2023, 382, 135279. [Google Scholar] [CrossRef]
- Ihedioha, J.N.; Ukoha, P.O.; Ekere, N.R. Ecological and human health risk assessment of heavy metal contamination in soil of a municipal solid waste dump in Uyo, Nigeria. Environ. Geochem. Health 2017, 39, 497–515. [Google Scholar] [CrossRef] [PubMed]
- He, Z.H.; Yang, Y.; Yuan, Q.; Shi, J.Y.; Liu, B.J.; Liang, C.F.; Du, S.G. Recycling hazardous water treatment sludge in cement-based construction materials: Mechanical properties, drying shrinkage, and nano-scale characteristics. J. Clean. Prod. 2021, 290, 125832. [Google Scholar] [CrossRef]
- Paris, J.M.; Roessler, J.G.; Ferraro, C.C.; DeFord, H.D.; Townsend, T.G. A review of waste products utilized as supplements to Portland cement in concrete. J. Clean. Prod. 2016, 121, 1–18. [Google Scholar] [CrossRef]
- Madandoust, R.; Ranjbar, M.M.; Moghadam, H.A.; Mousavi, S.Y. Mechanical properties and durability assessment of rice husk ash concrete. Biosyst. Eng. 2011, 110, 144–152. [Google Scholar] [CrossRef]
- Ahsan, M.B.; Hossain, Z. Supplemental use of rice husk ash (RHA) as a cementitious material in concrete industry. Constr. Build. Mater. 2018, 178, 1–9. [Google Scholar] [CrossRef]
- Noaman, M.A.; Karim, M.R.; Islam, M.N. Comparative study of pozzolanic and filler effect of rice husk ash on the mechanical properties and microstructure of brick aggregate concrete. Heliyon 2019, 5, e01926. [Google Scholar] [CrossRef]
- Mei, X.; Li, C.; Sheng, Q.; Cui, Z.; Zhou, J.; Dias, D. Development of a hybrid artificial intelligence model to predict the uniaxial compressive strength of a new aseismic layer made of rubber-sand concrete. Mech. Adv. Mater. Struct. 2022, 1–18. [Google Scholar] [CrossRef]
- Islam, M.N.; Mohd Zain, M.F.; Jamil, M. Prediction of strength and slump of rice husk ash incorporated high-performance concrete. J. Civ. Eng. Manag. 2012, 18, 310–317. [Google Scholar] [CrossRef]
- Liu, C.; Zhang, W.; Liu, H.; Lin, X.; Zhang, R. A compressive strength prediction model based on the hydration reaction of cement paste by rice husk ash. Constr. Build. Mater. 2022, 340, 127841. [Google Scholar] [CrossRef]
- Hamidian, P.; Alidoust, P.; Golafshani, E.M.; Niavol, K.P.; Behnood, A. Introduction of a novel evolutionary neural network for evaluating the compressive strength of concretes: A case of Rice Husk Ash concrete. J. Build. Eng. 2022, 61, 105293. [Google Scholar] [CrossRef]
- Ozcan, G.; Kocak, Y.; Gulbandilar, E. Estimation of compressive strength of BFS and WTRP blended cement mortars with machine learning models. Comput. Concr 2017, 19, 275–282. [Google Scholar] [CrossRef]
- Deshpande, N.; Londhe, S.; Kulkarni, S. Modeling compressive strength of recycled aggregate concrete by Artificial Neural Network, Model Tree and Non-linear Regression. Int. J. Sustain. Built Environ. 2014, 3, 187–198. [Google Scholar] [CrossRef]
- Saha, P.; Debnath, P.; Thomas, P. Prediction of fresh and hardened properties of self-compacting concrete using support vector regression approach. Neural Comput. Appl. 2020, 32, 7995–8010. [Google Scholar] [CrossRef]
- Dao, D.V.; Ly, H.B.; Vu HL, T.; Le, T.T.; Pham, B.T. Investigation and optimization of the C-ANN structure in predicting the compressive strength of foamed concrete. Materials 2020, 13, 1072. [Google Scholar] [CrossRef]
- Bai, C.; Nguyen, H.; Asteris, P.G.; Nguyen-Thoi, T.; Zhou, J. A refreshing view of soft computing models for predicting the deflection of reinforced concrete beams. Appl. Soft Comput. 2020, 97, 106831. [Google Scholar] [CrossRef]
- Yaman, M.A.; Abd Elaty, M.; Taman, M. Predicting the ingredients of self compacting concrete using artificial neural network. Alex. Eng. J. 2017, 56, 523–532. [Google Scholar] [CrossRef]
- Han, Q.; Gui, C.; Xu, J.; Lacidogna, G. A generalized method to predict the compressive strength of high-performance concrete by improved random forest algorithm. Constr. Build. Mater. 2019, 226, 734–742. [Google Scholar] [CrossRef]
- Azimi-Pour, M.; Eskandari-Naddaf, H.; Pakzad, A. Linear and non-linear SVM prediction for fresh properties and compressive strength of high volume fly ash self-compacting concrete. Constr. Build. Mater. 2020, 230, 117021. [Google Scholar] [CrossRef]
- Zhang, J.; Ma, G.; Huang, Y.; Aslani, F.; Nener, B. Modelling uniaxial compressive strength of lightweight self-compacting concrete using random forest regression. Constr. Build. Mater. 2019, 210, 713–719. [Google Scholar] [CrossRef]
- Yaseen, Z.M.; Deo, R.C.; Hilal, A.; Abd, A.M.; Bueno, L.C.; Salcedo-Sanz, S.; Nehdi, M.L. Predicting compressive strength of lightweight foamed concrete using extreme learning machine model. Adv. Eng. Softw. 2018, 115, 112–125. [Google Scholar] [CrossRef]
- Iqtidar, A.; Bahadur Khan, N.; Kashif-ur-Rehman, S.; Faisal Javed, M.; Aslam, F.; Alyousef, R.; Alabduljabbar, H.; Mosavi, A. Prediction of compressive strength of rice husk ash concrete through different machine learning processes. Crystals 2021, 11, 352. [Google Scholar] [CrossRef]
- Amin, M.N.; Iqtidar, A.; Khan, K.; Javed, M.F.; Shalabi, F.I.; Qadir, M.G. Comparison of machine learning approaches with traditional methods for predicting the compressive strength of rice husk ash concrete. Crystals 2021, 11, 779. [Google Scholar] [CrossRef]
- Shaik, S.B.; Karthikeyan, J.; Jayabalan, P. Influence of using agro-waste as a partial replacement in cement on the compressive strength of concrete–A statistical approach. Constr. Build. Mater. 2020, 250, 118746. [Google Scholar] [CrossRef]
- Asteris, P.G.; Kolovos, K.G. Self-compacting concrete strength prediction using surrogate models. Neural Comput. Appl. 2019, 31 (Suppl. S1), 409–424. [Google Scholar] [CrossRef]
- Getahun, M.A.; Shitote, S.M.; Gariy, Z.C.A. Artificial neural network based modelling approach for strength prediction of concrete incorporating agricultural and construction wastes. Constr. Build. Mater. 2018, 190, 517–525. [Google Scholar] [CrossRef]
- Behnood, A.; Golafshani, E.M. Predicting the compressive strength of silica fume concrete using hybrid artificial neural network with multi-objective grey wolves. J. Clean. Prod. 2018, 202, 54–64. [Google Scholar] [CrossRef]
- Golafshani, E.M.; Behnood, A.; Arashpour, M. Predicting the compressive strength of normal and High-Performance Concretes using ANN and ANFIS hybridized with Grey Wolf Optimizer. Constr. Build. Mater. 2020, 232, 117266. [Google Scholar] [CrossRef]
- Shariati, M.; Mafipour, M.S.; Mehrabi, P.; Bahadori, A.; Zandi, Y.; Salih, M.N.; Nguyen, H.; Dou, J.; Song, X.; Poi-Ngian, S. Application of a hybrid artificial neural network-particle swarm optimization (ANN-PSO) model in behavior prediction of channel shear connectors embedded in normal and high-strength concrete. Appl. Sci. 2019, 9, 5534. [Google Scholar] [CrossRef]
- Han, B.; Wu, Y.; Liu, L. Prediction and uncertainty quantification of compressive strength of high-strength concrete using optimized machine learning algorithms. Struct. Concr. 2022, 23, 3772–3785. [Google Scholar] [CrossRef]
- Yan, F.; Lin, Z.; Wang, X.; Azarmi, F.; Sobolev, K. Evaluation and prediction of bond strength of GFRP-bar reinforced concrete using artificial neural network optimized with genetic algorithm. Compos. Struct. 2017, 161, 441–452. [Google Scholar] [CrossRef]
- Tien Bui, D.; Abdullahi MA, M.; Ghareh, S.; Moayedi, H.; Nguyen, H. Fine-tuning of neural computing using whale optimization algorithm for predicting compressive strength of concrete. Eng. Comput. 2021, 37, 701–712. [Google Scholar] [CrossRef]
- Huang, X.Y.; Wu, K.Y.; Wang, S.; Lu, T.; Lu, Y.F.; Deng, W.C.; Li, H.M. Compressive Strength Prediction of Rubber Concrete Based on Artificial Neural Network Model with Hybrid Particle Swarm Optimization Algorithm. Materials 2022, 15, 3934. [Google Scholar] [CrossRef]
- Andalib, A.; Aminnejad, B.; Lork, A. Compressive Strength Prediction of Self-Compacting Concrete-A Bat Optimization Algorithm Based ANNs. Adv. Mater. Sci. Eng. 2022, 2022, 8404774. [Google Scholar] [CrossRef]
- Iftikhar, B.; Alih, S.C.; Vafaei, M.; Elkotb, M.A.; Shutaywi, M.; Javed, M.F.; Deebani, W.; Khan, M.I.; Aslam, F. Predictive modeling of compressive strength of sustainable rice husk ash concrete: Ensemble learner optimization and comparison. J. Clean. Prod. 2022, 348, 131285. [Google Scholar] [CrossRef]
- Li, C.; Dias, D. Assessment of the Rock Elasticity Modulus Using Four Hybrid RF Models: A Combination of Data-Driven and Soft Techniques. Appl. Sci. 2023, 13, 2373. [Google Scholar] [CrossRef]
- Li, J.; Li, C.; Zhang, S. Application of Six Metaheuristic Optimization Algorithms and Random Forest in the uniaxial compressive strength of rock prediction. Appl. Soft Comput. 2022, 131, 109729. [Google Scholar] [CrossRef]
- Zhou, J.; Li, C.; Asteris, P.G.; Shi, X.; Armaghani, D.J. Chart-Based Granular Slope Stability Assessment Using the Modified Mohr–Coulomb Criterion. Arab. J. Sci. Eng. 2022, 48, 5549–5569. [Google Scholar] [CrossRef]
- Abualigah, L.; Abd Elaziz, M.; Sumari, P.; Geem, Z.W.; Gandomi, A.H. Reptile Search Algorithm (RSA): A nature-inspired meta-heuristic optimizer. Expert Syst. Appl. 2022, 191, 116158. [Google Scholar] [CrossRef]
- Zhou, J.; Dai, Y.; Du, K.; Khandelwal, M.; Li, C.; Qiu, Y. COSMA-RF: New intelligent model based on chaos optimized slime mould algorithm and random forest for estimating the peak cutting force of conical picks. Transp. Geotech. 2022, 36, 100806. [Google Scholar] [CrossRef]
- Zawbaa, H.M.; Emary, E.; Grosan, C. Feature selection via chaotic antlion optimization. PLoS ONE 2016, 11, e0150652. [Google Scholar] [CrossRef] [PubMed]
- Varol Altay, E.; Alatas, B. Bird swarm algorithms with chaotic mapping. Artif. Intell. Rev. 2020, 53, 1373–1414. [Google Scholar] [CrossRef]
- Li, C.; Zhou, J.; Armaghani, D.J.; Li, X. Stability analysis of underground mine hard rock pillars via combination of finite difference methods, neural networks, and Monte Carlo simulation techniques. Undergr. Space 2021, 6, 379–395. [Google Scholar] [CrossRef]
- Li, C.; Zhou, J.; Khandelwal, M.; Zhang, X.; Monjezi, M.; Qiu, Y. Six novel hybrid extreme learning machine–swarm intelligence optimization (ELM–SIO) models for predicting backbreak in open-pit blasting. Nat. Resour. Res. 2022, 31, 3017–3039. [Google Scholar] [CrossRef]
- Li, C.; Zhou, J.; Tao, M.; Du, K.; Wang, S.; Armaghani, D.J.; Mohamad, E.T. Developing hybrid ELM-ALO, ELM-LSO and ELM-SOA models for predicting advance rate of TBM. Transp. Geotech. 2022, 36, 100819. [Google Scholar] [CrossRef]
- Zhou, J.; Dai, Y.; Huang, S.; Armaghani, D.J.; Qiu, Y. Proposing several hybrid SSA—Machine learning techniques for estimating rock cuttability by conical pick with relieved cutting modes. Acta Geotechnica 2022, 18, 1431–1446. [Google Scholar] [CrossRef]
- Zhao, Y.; Hu, H.; Song, C.; Wang, Z. Predicting compressive strength of manufactured-sand concrete using conventional and metaheuristic-tuned artificial neural network. Measurement 2022, 194, 110993. [Google Scholar] [CrossRef]
- Tipu, R.K.; Panchal, V.R.; Pandya, K.S. An ensemble approach to improve BPNN model precision for predicting compressive strength of high-performance concrete. In Structures; Elsevier: Amsterdam, The Netherlands, 2022; Volume 45, pp. 500–508. [Google Scholar]
- Zhang, J.; Dias, D.; An, L.; Li, C. Applying a novel slime mould algorithm-based artificial neural network to predict the settlement of a single footing on a soft soil reinforced by rigid inclusions. Mech. Adv. Mater. Struct. 2022, 1–16. [Google Scholar] [CrossRef]
- Abdalla, A.; Mohammed, A.S. Hybrid MARS-, MEP-, and ANN-based prediction for modeling the compressive strength of cement mortar with various sand size and clay mineral metakaolin content. Arch. Civ. Mech. Eng. 2022, 22, 194. [Google Scholar] [CrossRef]
- Gupta, T.; Rao, M.C. Prediction of compressive strength of geopolymer concrete using machine learning techniques. Struct. Concr. 2022, 23, 3073–3090. [Google Scholar] [CrossRef]
- Nasir, V.; Dibaji, S.; Alaswad, K.; Cool, J. Tool wear monitoring by ensemble learning and sensor fusion using power, sound, vibration, and AE signals. Manuf. Lett. 2021, 30, 32–38. [Google Scholar] [CrossRef]
- Zhou, J.; Qiu, Y.; Zhu, S.; Armaghani, D.J.; Li, C.; Nguyen, H.; Yagiz, S. Optimization of support vector machine through the use of metaheuristic algorithms in forecasting TBM advance rate. Eng. Appl. Artif. Intell. 2021, 97, 104015. [Google Scholar] [CrossRef]
- Nasir, V.; Kooshkbaghi, M.; Cool, J.; Sassani, F. Cutting tool temperature monitoring in circular sawing: Measurement and multi-sensor feature fusion-based prediction. Int. J. Adv. Manuf. Technol. 2021, 112, 2413–2424. [Google Scholar] [CrossRef]
- Pianosi, F.; Wagener, T. A simple and efficient method for global sensitivity analysis based on cumulative distribution functions. Environ. Model. Softw. 2015, 67, 1–11. [Google Scholar] [CrossRef]
- Pianosi, F.; Wagener, T. Distribution-based sensitivity analysis from a generic input-output sample. Environ. Model. Softw. 2018, 108, 197–207. [Google Scholar] [CrossRef]
- Amin, M.N.; Iftikhar, B.; Khan, K.; Javed, M.F.; AbuArab, A.M.; Rehman, M.F. Prediction model for rice husk ash concrete using AI approach: Boosting and bagging algorithms. In Structures; Elsevier: Amsterdam, The Netherlands, 2023; Volume 50, pp. 745–757. [Google Scholar]
Figure 1.
Illustration of hunting behavior for RSA proposed by Abualigah et al. [61]: (a) exploration; (b) exploitation.
Figure 1.
Illustration of hunting behavior for RSA proposed by Abualigah et al. [61]: (a) exploration; (b) exploitation.

Figure 2.
Flowchart of generating CMRSA–ANN model to predict the compressive strength of RHA concrete.
Figure 2.
Flowchart of generating CMRSA–ANN model to predict the compressive strength of RHA concrete.

Figure 3.
CMRSA–ANN model development: (a) iteration curves; (b) local comparison.

Figure 4.
SOA–SVM model development.

Figure 5.
SOA–RF model development.

Figure 6.
Performance of the empirical model using the training set.

Figure 7.
Prediction curves of the developed models using the training set.

Figure 8.
Regression results of all developed models using the test set.

Figure 9.
Error distribution of each prediction model in the testing phase.

Figure 10.
Performance comparison between prediction models using a Taylor diagram.

Figure 11.
Importance score of each parameter based on the CMRSA-ANN model.


Table 1.
Statistical information on each variable for predicting RHA concrete strength.
| Variables | Statistical Indices | ||||
|---|---|---|---|---|---|
| Min | Max | Mean | Median | St. D | |
| Cement | 249.0 | 783.0 | 409.02 | 400.00 | 105.47 |
| RHA | 0.0 | 171.0 | 62.33 | 57.00 | 41.55 |
| Superplasticizer | 0.0 | 11.3 | 3.34 | 1.85 | 3.52 |
| Aggregate | 1040.0 | 1970.0 | 1621.51 | 1725.00 | 267.77 |
| Water | 120.0 | 238.0 | 193.54 | 203.00 | 31.93 |
| Age | 1.0 | 90.0 | 34.57 | 28.00 | 33.52 |
| Compressive strength | 16.0 | 104.1 | 48.14 | 45.95 | 17.54 |
Note: Min, minimal values; Max, maximal values; St. D, standard deviation.
Table 2.
Correlation coefficient values between all considered parameters.
| Variables | Cement | RHA | Superplasticizer | Aggregate | Water | Age | Compressive Strength |
|---|---|---|---|---|---|---|---|
| Cement | 1 | −0.219 | 0.253 | −0.238 | 0.083 | −0.106 | 0.370 |
| RHA | 1 | −0.021 | −0.139 | 0.136 | −0.033 | −0.023 | |
| Superplasticizer | 1 | −0.205 | 0.268 | −0.000 | 0.301 | ||
| Aggregate | 1 | −0.549 | −0.063 | 0.147 | |||
| Water | 1 | 0.011 | −0.244 | ||||
| Age | 1 | 0.495 | |||||
| Compressive strength | 1 |
Table 3.
Performance of the ANN model with different hidden layers and neuron numbers.
| Tests | Structure | Performance | ||
|---|---|---|---|---|
| HL-1 | HL-2 | R2 | RMSE | |
| 1 | 2 | / | 0.8322 | 6.8525 |
| 2 | 4 | / | 0.7839 | 7.7690 |
| 3 | 6 | / | 0.8100 | 7.2921 |
| 4 | 8 | / | 0.8225 | 7.0476 |
| 5 | 10 | / | 0.8554 | 6.3611 |
| 6 | 4 | 3 | 0.8772 | 5.8632 |
| 7 | 4 | 6 | 0.8312 | 6.8726 |
| 8 | 6 | 8 | 0.8025 | 7.4350 |
| 9 | 8 | 10 | 0.8143 | 7.2101 |
| 10 | 10 | 12 | 0.8338 | 6.8193 |
Note: HL-1, first hidden layer; HL-2, second hidden layer.
Table 4.
Performance of an ELM model with different neuron numbers.
| Tests | Neuron Numbers | Performance | |
|---|---|---|---|
| R2 | RMSE | ||
| 1 | 20 | 0.5268 | 11.5078 |
| 2 | 30 | 0.6460 | 9.9534 |
| 3 | 40 | 0.7327 | 8.6492 |
| 4 | 50 | 0.7595 | 8.2046 |
| 5 | 60 | 0.7851 | 7.7555 |
| 6 | 70 | 0.7997 | 7.4873 |
| 7 | 80 | 0.8589 | 6.2835 |
| 8 | 90 | 0.8373 | 6.7479 |
| 9 | 100 | 0.8932 | 5.4682 |
| 10 | 110 | 0.8788 | 5.8235 |
Table 5.
Performance evaluation of prediction models using training and test sets.
| Model | Performance (Training Set) | Model | Performance (Test Set) | ||||||
|---|---|---|---|---|---|---|---|---|---|
| R2 | VAF % | RMSE | MAE | R2 | VAF % | RMSE | MAE | ||
| ANN | 0.8772 | 87.7619 | 5.8632 | 4.1423 | ANN | 0.8572 | 86.0686 | 7.6353 | 5.2808 |
| CMRSA–ANN | 0.9679 | 96.7884 | 2.9991 | 2.3169 | CMRSA–ANN | 0.9709 | 97.0911 | 3.4489 | 2.6451 |
| SOA–SVM | 0.9595 | 96.0957 | 3.3651 | 1.2528 | SOA–SVM | 0.9494 | 95.0044 | 4.5436 | 3.0904 |
| SOA–RF | 0.9224 | 92.2384 | 4.6610 | 3.2359 | SOA–RF | 0.8941 | 89.5048 | 6.5743 | 4.8037 |
| ELM | 0.8932 | 89.3163 | 5.4682 | 4.0644 | ELM | 0.7020 | 70.6826 | 11.0294 | 8.5905 |
| Empirical | 0.2023 | 50.0783 | 14.9418 | 12.0202 | Empirical | 0.3716 | 57.3263 | 16.0169 | 13.1709 |
Table 6.
Prediction results of the compressive strength of RHA concrete using the developed models.
| No. | Measured | Predicted | |||||
|---|---|---|---|---|---|---|---|
| ANN | CMRSA–ANN | SOA–SVM | SOA–RF | ELM | Empirical | ||
| 1 | 82.20 | 100.09 | 87.90 | 83.20 | 78.36 | 95.91 | 64.96 |
| 2 | 72.80 | 72.04 | 74.38 | 75.93 | 69.61 | 83.15 | 55.26 |
| 3 | 43.50 | 44.85 | 43.59 | 42.07 | 42.81 | 37.48 | 31.36 |
| 4 | 48.70 | 41.82 | 47.91 | 43.25 | 54.26 | 32.36 | 39.11 |
| 5 | 16.00 | 27.32 | 16.50 | 22.53 | 28.28 | 30.40 | 20.62 |
| 6 | 85.70 | 75.39 | 85.31 | 84.08 | 73.81 | 94.46 | 62.58 |
| 7 | 43.00 | 39.93 | 44.88 | 38.92 | 35.43 | 38.80 | 17.57 |
| 8 | 33.60 | 30.16 | 33.05 | 31.06 | 33.00 | 23.74 | 23.33 |
| 9 | 94.00 | 92.21 | 92.18 | 80.18 | 78.79 | 81.86 | 81.00 |
| 10 | 31.10 | 34.15 | 31.28 | 31.15 | 33.57 | 31.17 | 10.31 |
| 11 | 57.30 | 55.35 | 58.61 | 59.18 | 52.92 | 61.25 | 57.31 |
| 12 | 41.30 | 40.49 | 38.96 | 39.98 | 40.03 | 46.12 | 28.98 |
| 13 | 20.80 | 24.08 | 24.19 | 20.48 | 26.86 | 20.58 | 11.78 |
| 14 | 22.70 | 38.28 | 19.66 | 33.55 | 35.84 | 32.02 | 47.24 |
| 15 | 38.80 | 38.68 | 36.91 | 40.64 | 39.48 | 42.21 | 20.21 |
| 16 | 60.00 | 60.42 | 63.35 | 54.54 | 59.20 | 49.98 | 54.46 |
| 17 | 55.50 | 53.28 | 61.66 | 59.50 | 51.22 | 70.86 | 49.78 |
| 18 | 61.00 | 63.75 | 62.30 | 62.09 | 54.07 | 63.77 | 57.04 |
| 19 | 63.00 | 59.20 | 58.12 | 61.35 | 55.48 | 57.46 | 60.53 |
| 20 | 66.00 | 70.44 | 69.78 | 63.07 | 63.24 | 74.16 | 56.84 |
| 21 | 52.00 | 50.39 | 54.58 | 55.85 | 53.52 | 48.25 | 26.83 |
| 22 | 43.30 | 50.25 | 48.77 | 43.25 | 43.49 | 50.56 | 50.28 |
| 23 | 26.00 | 35.75 | 24.35 | 34.61 | 34.82 | 24.83 | 22.97 |
| 24 | 64.50 | 67.10 | 63.77 | 66.99 | 64.85 | 34.38 | 56.76 |
| 25 | 35.30 | 36.41 | 36.21 | 35.36 | 35.36 | 32.85 | 24.82 |
| 26 | 83.20 | 88.88 | 76.67 | 86.11 | 80.21 | 69.73 | 73.68 |
| 27 | 50.00 | 50.77 | 51.73 | 48.15 | 44.58 | 60.87 | 39.90 |
| 28 | 56.50 | 57.93 | 56.92 | 57.31 | 53.43 | 44.06 | 62.27 |
| 29 | 35.50 | 20.85 | 30.46 | 33.68 | 39.28 | 35.10 | 34.13 |
| 30 | 36.10 | 34.92 | 34.59 | 36.03 | 35.78 | 32.35 | 16.05 |
| 31 | 20.90 | 42.96 | 15.75 | 33.59 | 35.93 | 44.32 | 53.03 |
| 32 | 51.00 | 60.39 | 61.63 | 54.00 | 54.33 | 50.00 | 54.81 |
| 33 | 95.20 | 79.24 | 92.32 | 97.05 | 80.43 | 71.92 | 56.78 |
| 34 | 28.00 | 30.20 | 29.90 | 27.95 | 29.14 | 26.68 | 22.74 |
| 35 | 60.00 | 56.15 | 57.96 | 60.36 | 57.60 | 53.10 | 30.99 |
| 36 | 46.80 | 45.49 | 45.32 | 44.13 | 45.88 | 34.48 | 35.04 |
| 37 | 39.30 | 35.34 | 35.41 | 37.21 | 37.24 | 38.70 | 18.93 |
| 38 | 38.00 | 38.96 | 36.98 | 39.21 | 43.23 | 25.48 | 23.56 |
Table 7.
Performance comparison of previous works and the proposed model.
| Reference | Model | Performance (R2) |
|---|---|---|
| Iftikhar et al. [57] | GEP | 0.9670 |
| RFR | 0.9130 | |
| Amin et al. [79] | DT | 0.8900 |
| BgR | 0.9200 | |
| ADB | 0.9100 | |
| This paper | CMRSA–ANN | 0.9709 |
Note: GEP, gene expression programming; RFR, random forest regression; DT, decision trees; BgR, bagging regressors; ADB, AdaBoost regressors.
Disclaimer/Publisher’s Note: The statements, opinions and data contained in all publications are solely those of the individual author(s) and contributor(s) and not of MDPI and/or the editor(s). MDPI and/or the editor(s) disclaim responsibility for any injury to people or property resulting from any ideas, methods, instructions or products referred to in the content. |
© 2023 by the authors. Licensee MDPI, Basel, Switzerland. This article is an open access article distributed under the terms and conditions of the Creative Commons Attribution (CC BY) license (https://creativecommons.org/licenses/by/4.0/).
Share and Cite
MDPI and ACS Style
Li, C.; Mei, X.; Dias, D.; Cui, Z.; Zhou, J. Compressive Strength Prediction of Rice Husk Ash Concrete Using a Hybrid Artificial Neural Network Model. Materials 2023, 16, 3135. https://doi.org/10.3390/ma16083135
AMA Style
Li C, Mei X, Dias D, Cui Z, Zhou J. Compressive Strength Prediction of Rice Husk Ash Concrete Using a Hybrid Artificial Neural Network Model. Materials. 2023; 16(8):3135. https://doi.org/10.3390/ma16083135
Chicago/Turabian StyleLi, Chuanqi, Xiancheng Mei, Daniel Dias, Zhen Cui, and Jian Zhou. 2023. "Compressive Strength Prediction of Rice Husk Ash Concrete Using a Hybrid Artificial Neural Network Model" Materials 16, no. 8: 3135. https://doi.org/10.3390/ma16083135
Note that from the first issue of 2016, this journal uses article numbers instead of page numbers. See further details here.