
Synthesis of Gold Nanoparticles from Gold Coatings Recovered from E-Waste Processors
by

Javier Su-Gallegos
1, 
Lorena Magallón-Cacho
2,
Jeannete Ramírez-Aparicio
2 and
Edgar Borja-Arco
1,*
1
Department of Theoretical Physics and Chemestry, Faculty of Chemistry, National Autonomous University of Mexico, Mexico City 04510, Mexico
2
National Council of Science and Technology (CONACYT), Mexico City 03940, Mexico
*
Author to whom correspondence should be addressed.
Materials 2022, 15(20), 7307; https://doi.org/10.3390/ma15207307
Submission received: 23 September 2022
/
Revised: 8 October 2022
/
Accepted: 17 October 2022
/
Published: 19 October 2022
(This article belongs to the Special Issue Conventional and Unconventional Methods of Metal Nanoparticle Synthesis, Analysis and Applications)
Abstract
:This work presents the synthesis of Au nanoparticles from gold coatings recovered from processor pins with minimal waste generation. The process consisted of four main steps: (1) physical recovery of pins, (2) recovery of gold coatings by acid digestion, (3) synthesis of HAuCl4 under mild conditions and, (4) synthesis of Au nanoparticles by the Turkevich method. The small dimensions of Au coatings allowed the synthesis of HAuCl4 with lower amounts of HClconc and HNO3conc than those used with aqua regia. This method has significant advantages, such as lower NO2(g) emission, easy post-treatment and purification, low synthesis cost and high yields. Gold nanoparticles synthesized from HAuCl4 were characterized by transmission electron microscopy (TEM) and UV-Vis spectroscopy. Size distribution analysis showed particles 14.23 nm in length and 12.05 nm in width, while absorption spectra showed a surface plasmon located at 523 nm; these characteristics were very similar to those observed with Au nanoparticles obtained with Aldrich’s reagent. It is suggested that recycling procedures can be improved by taking into account the size and shape of the metals to be recovered, thus introducing a new field of research known as hydronanometallurgy.
1. Introduction
Over the last decade, e-waste worldwide has been steadily increasing. Its negative impact on the environment has posed new challenges for waste management and current recycling processes [1,2,3,4]. Traditionally, this type of waste is processed by hydrometallurgy and pyrometallurgy [2,4,5]. However, these practices continue to produce toxic waste and the emission of harmful agents, which may endanger public and environmental health [4,6,7]. For all these reasons, the development of new recycling methodologies with environmental approaches has become one of the most studied topics in the world. Some of the main goals are: (1) reduce waste generation or reuse it to avoid landfilling, (2) optimize the collection system to reduce the environmental impact due to its transfer, (3) integrate a recycling chain with chemical and physical methods that optimize the process, (4) reduce the use of leaching agents or use less toxic reagents, and (5) optimize the current recycling processes [2,3,4]. These changes would minimize the environmental impact of waste and contribute to the United Nations Sustainable Development Goals (SDGs), such as “clean water and sanitation”, “sustainable cities and communities” and “responsible production and consumption” (goals 6, 11 and 12, respectively) [8].
Overall, recycling processes focus on concentrating the metals of interest (Au, Ag, Cu, Pd and others) in solution or in an ingot for selective separation [6,9,10,11]. Leaching agents such as thioureas, halides, cyanides and aqua regia are commonly used to separate the gold. Although they are considerably toxic with a significant environmental impact, their use is still justified by their yields [12,13,14].
Most research does not consider the size and shape of the Au to be recovered in the design of new methodologies [11,12,13,15,16,17,18,19]. However, other factors such as the size and shape of the gold to be recovered must be taken into account. These factors may be relevant because the chemical properties of gold change when it has smaller dimensions, becoming more reactive than in macroscopic dimension [20,21]. This property could be exploited for the design of new recycling methodologies. Understanding how these factors influence gold recovery could lead to improvements in recycling methods and a significant reduction in environmental impact.
Hydrometallurgical recycling methodologies recover gold in its oxidized form (HAuCl4), which is subsequently purified [9,12,22]. This acid has been produced for centuries by reacting metallic gold with aqua regia (a 3:1 mixture of concentrated hydrochloric and nitric acids, respectively); during this reaction, HNO3 oxidizes metallic gold to produce Au3+ ions, which will then form tetrachloroaurate (III) anions with the chloride ions. The continuous formation of the gold complex drives the reaction and generates H2O and NO as byproducts, the latter combining with ambient oxygen to generate NO2. Some studies have suggested that HNO3 may not be the only oxidizing agent in the reaction, as chlorine gas and nitrosyl chloride (produced during the reaction with aqua regia) can also oxidize small amounts of gold [23,24,25].
Although good yields are available, it has prompted the exploration of alternative synthesis methods, as the aqua regia method involves the use of concentrated acids and many steps for HAuCl4 purification, in addition to the environmental impact. For example, Shirin R. King et al. [26] propose a simple procedure using chlorine gas in a vessel with gold pellets and water (Equation (1)), where the authors report synthesis times ranging from 12 to 125 h depending on the temperature (room temperature, 50, 60 and 70 °C) and the size of gold pellets (spherical pellets and spherical pellets flattening at 1 mm thicknesses). The tetrachloroauric acid obtained with this method is stable and has a high purity, since the manganese used during the chlorine production process does not leach into the final HAuCl4 solution. However, some aspects must be taken into account: (1) the metallic gold used must have a high degree of purity, (2) the presence of chlorine gas implies special equipment for industrial use and (3) if the chlorine gas is synthesized in situ, more reagents and filters are needed to avoid contamination of HAuCl4.
2Au0(s) + 3Cl2(g) + 2HCl(aq) → 2HAuCl4(aq)
Another example is reported by Masashi Hojo et al. [23,24] who dissolve gold plates (0.1 mm × 2 mm × 5 mm) and gold wires (0.1, 0.25, and 0.5 mm diameter) in a 2 mol L−1 HNO3 solution, to which they add different salts (LiCl, NaCl, KCl, MgCl2, CaCl2 and AlCl3) at different concentrations (from 0.1 mol L−1 to 9 mol L−1). The dissolution times of the plates and gold wires ranged from 35 h to 30 min depending on the reaction conditions and temperature used (15–80 °C). In addition, it is necessary to implement a purification system to obtain HAuCl4 with high purity, which is not desired. On the other hand, reaction times can be very long under certain conditions, resulting in low yields. Dissolution of gold using a “dilute aqua regia” solution (a mixture of HNO3 and HCl, both at 1.0 mol L−1) is also proposed. According to their results, this solution can dissolve a gold wire at 60 °C in 35 h, but when salts are added to the system, time is reduced. However, as in the previous case, the use of salts and long-lasting reactions are not desirable.
The main reason for finding green or better methodologies to synthesize HAuCl4 lies in the fact that this acid is used for the synthesis of gold nanoparticles, which have a wide range of applications such as the transport of therapeutic agents, photodynamic therapy, as sensors and probes, or in medical treatments. Therefore, the development of new synthesis routes and the use of different precursors are of great interest. However, the synthesis of gold nanoparticles depends on many factors such as pH, concentration, temperature and stabilizing agent, among others; for example, contamination of a pipette tip could add foreign material, which could lead to changes in the size and shape of the nanoparticles [20].
Although there are many methodologies for the synthesis of gold nanoparticles, this work focused only on the use of the Turkevich method, as it is a widely used methodology [20]. Nevertheless, the precursor (HAuCl4) obtained in this work could be used in other synthesis methodologies. Thus, this work shows a methodology for the synthesis of tetrachloroauric acid from gold coatings obtained from electronic waste processors, which is subsequently used for the synthesis of gold nanoparticles. First, a method is proposed to separate gold coatings from e-waste processors by acid digestion with HNO3. This strategy focuses on the separation of gold rather than its dissolution and subsequent selective chemical separation, so the method includes physical pretreatment of the processors to improve recovery, as well as the use of gas traps to eliminate the emission of toxic compounds. Secondly, the dissolution conditions for the synthesis of tetrachloroauric acid are studied. In this study, HCl was used as the complexing agent and HNO3 as the oxidizing agent. Although these acids are used in the procedure with aqua regia mentioned above, the amounts and concentrations used in this work represent an improvement in the gold oxidation process since they decrease the production of toxic agents and facilitate the purification of the products. Finally, gold nanoparticles were synthesized with HAuCl4 obtained from gold coatings using the Turkevich method.
2. Materials and Methods
2.1. Recovery of Pins from E-Waste Processors
Intel Pentium 4 processors from a local recycling center were used to recover the gold coatings. The pins were cut from the processor boards and then washed in an ultrasonic bath (Cole-Parmer Model 08895-21, Vernon Hills, IL, USA) for 15 min with deionized water (H2ODI, 2.0 × 10⁻⁶ Ω−1 cm−1 Meyer, Ciudad de México, Mexico) and isopropyl alcohol (≥99.5% Meyer, Ciudad de México, Mexico) at a 1:1 ratio. Finally, the pins were dried at room temperature.
Cu, Ni, Fe and Au were quantified by energy dispersive X-ray spectrometry (EDS) using a Bruker-Quantax 200 energy dispersive x-ray spectrometer with a FE-SEM S-5500 microscope (Hitachi, London, UK). Three components of the pins were examined: the base, the coating and the inner body (using a colloidal silver sample preparation for the latter).
The morphology of the pins was characterized by scanning electron microscopy (SEM) using a JEOL-5600LV microscope (Japan Electron Optics Laboratory, Tokyo, Japan) at 20 kV, with secondary electrons, spot size of 500 and Working Distance (WD) of 8.5 mm.
Cu, Ni, Fe and Au were also quantified by microwave plasma atomic emission spectrometry (MP-AES) on an MP-AES 420 spectrometer (Agilent, Santa Clara, CA, USA) with a Multi-wave PRO microwave oven (Anton Paar, NSW, AU). For this purpose, 478 pins were dissolved in 10 mL of aqua regia (36.5–38.0% HClconc, 68.0–70.0% HNO3conc, both Meyer, Ciudad de México, Mexico).
2.2. Recovery of Gold Coatings from Pins
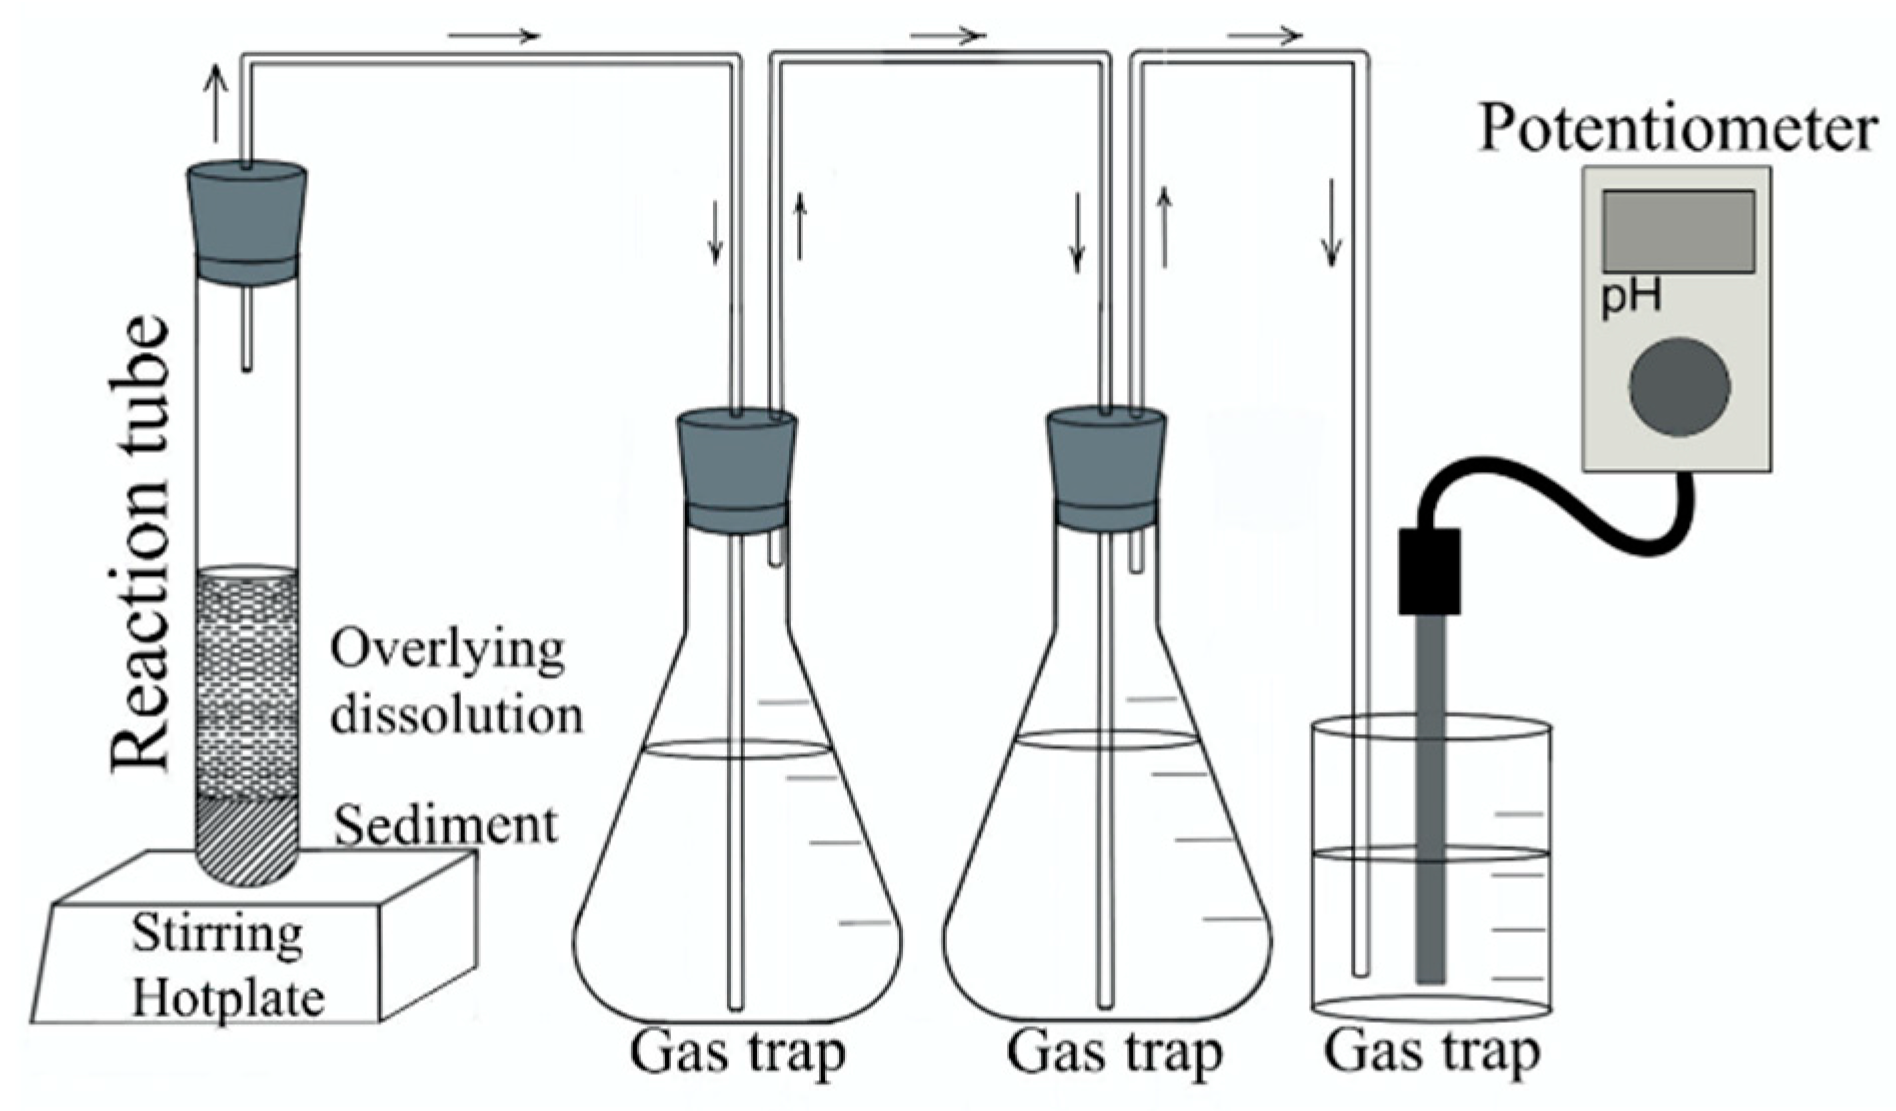
Gold coatings from three different batches of processors (each with 1434 pins which are equivalent to three processors) were separated by acid digestion with HNO3conc using the experimental setup showed in Figure 1. The mass of the pins (uncertainties are indicated in parentheses) used for batches 1, 2, and 3 were 2.5119 (0.0004) g, 2.5392 (0.0004) g and 2.6118 (0.0002) g, respectively [27]. The volume of HNO3conc was calculated using Equation (2), under the assumption that the pins were pure Cu. The reaction was started by placing the reaction tube on a hotplate stirrer (Cole-Parmer model JZ-03407-10, Vernon Hills, IL, USA) at 80 °C with three gas traps containing 50 mL of 50% v/v hydrogen peroxide (29.0–32.0% H2O2, High Purity, Ciudad de México, Mexico) in water [28,29,30]. Once the reaction was started, the hotplate was turned off and only agitation was maintained. To ensure the proper functioning of the gas traps, the initial and final pH was measured throughout the procedure, using a ROSS Ultra pH/ATC Triode (Thermo scientific model Orion 8107UWMMD, Waltham, MA, USA) and an Orion star potentiometer (Thermo scientific model A325, Waltham, MA, USA).
For Batch 1, a total of 9 mL of HNO3conc was used by adding it 1 mL at a time into the reaction tube. Once the reaction was completed, 8 mL of H2ODI was added (also 1 mL at a time) to improve the solubility of the products. While for Batch 2, a total of 8 mL of HNO3conc was added into the reaction tube in three portions: (1) 5 mL at the beginning of the reaction, (2) 1 mL at the middle and (3) 2 mL at the end. In contrast to the first batch, in which water was added at the end of the reaction, for Batch 2, a total of 2 mL of H2ODI was added halfway through the reaction. A lower amount of HNO3conc was used for this second batch because it was previously observed that the reaction had already finished before the last milliliter of HNO3conc was added (i.e., no NO2(g) evolution was observed). For Batch 3, only 10 mL of HNO3conc were added from the beginning of the reaction and no H2ODI was added.
After completion of the acid digestion, the gold coatings were separated from the overlying dissolution with a pipette and rinsed with deionized water. The SnO2 formed (Equation (3)) and some plastic remainders were filtered and separated, which were subsequently weighed. Then, NaOH pellets (≥98% Sigma-Aldrich, St. Louis, MO, USA) were added to the filtered solution to generate the corresponding Cu(OH)2 according to Equation (4), which was finally heated to obtain the corresponding CuO according to Equation (5). This oxide was filtered and weighed. All solids obtained (Au coating, SnO2 and CuO) were characterized by X-ray Diffraction (XRD) using a Bruker AXS-D8 Advance Davinci X-ray diffractometer Theta-Theta configuration (Bruker Mexicana, Ciudad de México, Mexico) and SEM (Hitachi FE-SEM S-5500 microscope).
Cu(s) + 4HNO3(aq) → Cu(NO3)2(aq) + 2NO2(g) +2H2O(l)
Sn(s) + 4HNO3(aq) → SnO2(s) + 4NO2(g) + 2H2O(l)
Cu(NO3)2(aq) + 2NaOH(s) → Cu(OH)2(aq) + 2NaNO3(aq)
Cu(OH)2(aq) + heat → CuO(s) + H2O(aq)
Another batch with three processors was treated similarly, but now only the remaining solutions after nitric acid digestion, i.e., the one with the mixture of Cu(NO3)2 and SnO2, and that obtained after CuO formation, were characterized by MP-AES to quantify the remaining Cu, Ni and Fe ions.
2.3. Synthesis of Tetrachoroauric Acid (HAuCl4)
The synthesis of HAuCl4 was carried out in duplicate on a hotplate stirrer at 125 °C in a borosilicate glass tube covered with a stopper by reacting 2 mg of Au coatings with 10 mL of 10% v/v HCl (1.21 mol L−1) and 50 μL of HNO3conc (final concentration 0.08 mol L−1). For each synthesis, a control tube with the reaction media devoid of Au coatings was used. The solutions obtained were characterized by MP-AES, cyclic voltammetry (CV) using an AFP2 Bipotentiostat (PINE Wavedriver, Durham, NC, USA) and by UV-Vis with a calibration curve (CARY UV-Vis-NIR Spectrophotometer, model 5E, Ciudad de México, Mexico).
CV was performed in a cell with a three-electrode configuration: saturated Calomel electrode (Radiometer analytical, type XR100, VC, FR) as reference electrode; graphite rod as counter electrode; and glassy carbon disk (PINE modelAFE3T050GC, A = 0.1964 cm2, Durham, NC, USA) as work electrode. Potential sweeps were performed between −0.27 and 1.1 V vs. SCE at 50 mV s−1. To identify the electrochemical signals in the cyclic voltammograms, three 1 mM HAuCl4 solutions were prepared with Aldrich’s reagent (HAuCl4⋅3H2O, 99.9%, Sigma-Aldrich, MO, USA) at pH = 0.5, adjusted with HCl. To the first one, 7 aliquots of 200 µL of a 1 mM CuCl2 solution (CuCl2⋅2H2O, 98% Fisher Scientific, Waltham, MA, USA) at pH = 3.09 were added; to the second one, 2 aliquots of 200 µL of a 1 mM NiCl2 solution (NiCl2⋅6H2O, 90–100% Mallinckrodt Baker, DE) at pH = 3.64 were added; and to the latter, 5 aliquots of 200 µL and then 14 aliquots of 0.5 mL of a 1 mM FeCl3 solution (FeCl3⋅6H2O, 97% Sigma-Aldrich, St. Louis, MO, USA) at pH = 2.66 were added. In all cases, 8 mL of HAuCl4 was used and cyclic voltammetry was performed between each added aliquot, in addition to measuring the final pH in each solution.
2.4. Synthesis of Gold Nanoparticles
Once HAuCl4 was synthesized from gold coatings, the solution was evaporated to approximately 1 mL, and then 10 mL of H2ODI was added, the evaporation process was repeated in triplicate, and in this last step the 1 mL of HAuCl4 obtained was transferred to a 10 mL volumetric flask and diluted to volume with H2ODI. Au, Ni, Fe and Cu were quantified by MPAES before and after each evaporation cycle. From the latter solution, gold nanoparticles were synthesized by the Turkevich method by mixing 5 mL of the HAuCl4 solution with 0.5 mL of 38.8 mM sodium citrate (C6H5Na3O7⋅2H2O, 100.1%, J.T. Baker, QC, Canada), and the solution was filtered through 7µm filter paper (Whatman grade 52, UK). As a comparison, gold nanoparticles were synthesized with Aldrich HAuCl4 reagent by mixing 250 mL of 1 mM HAuCl4 (also evaporated in triplicate) with 25 mL of 38.8 mM sodium citrate.
Both batches were characterized by TEM (Jeol model JEM2010 FEG, Tokyo, Japan) and UV-Vis spectroscopy to obtain the particle size distribution, and the absorption spectra to find the Localized Surface Plasmon (LSP).
3. Results and Discussion
3.1. Pin Recovery from E-Waste Processors
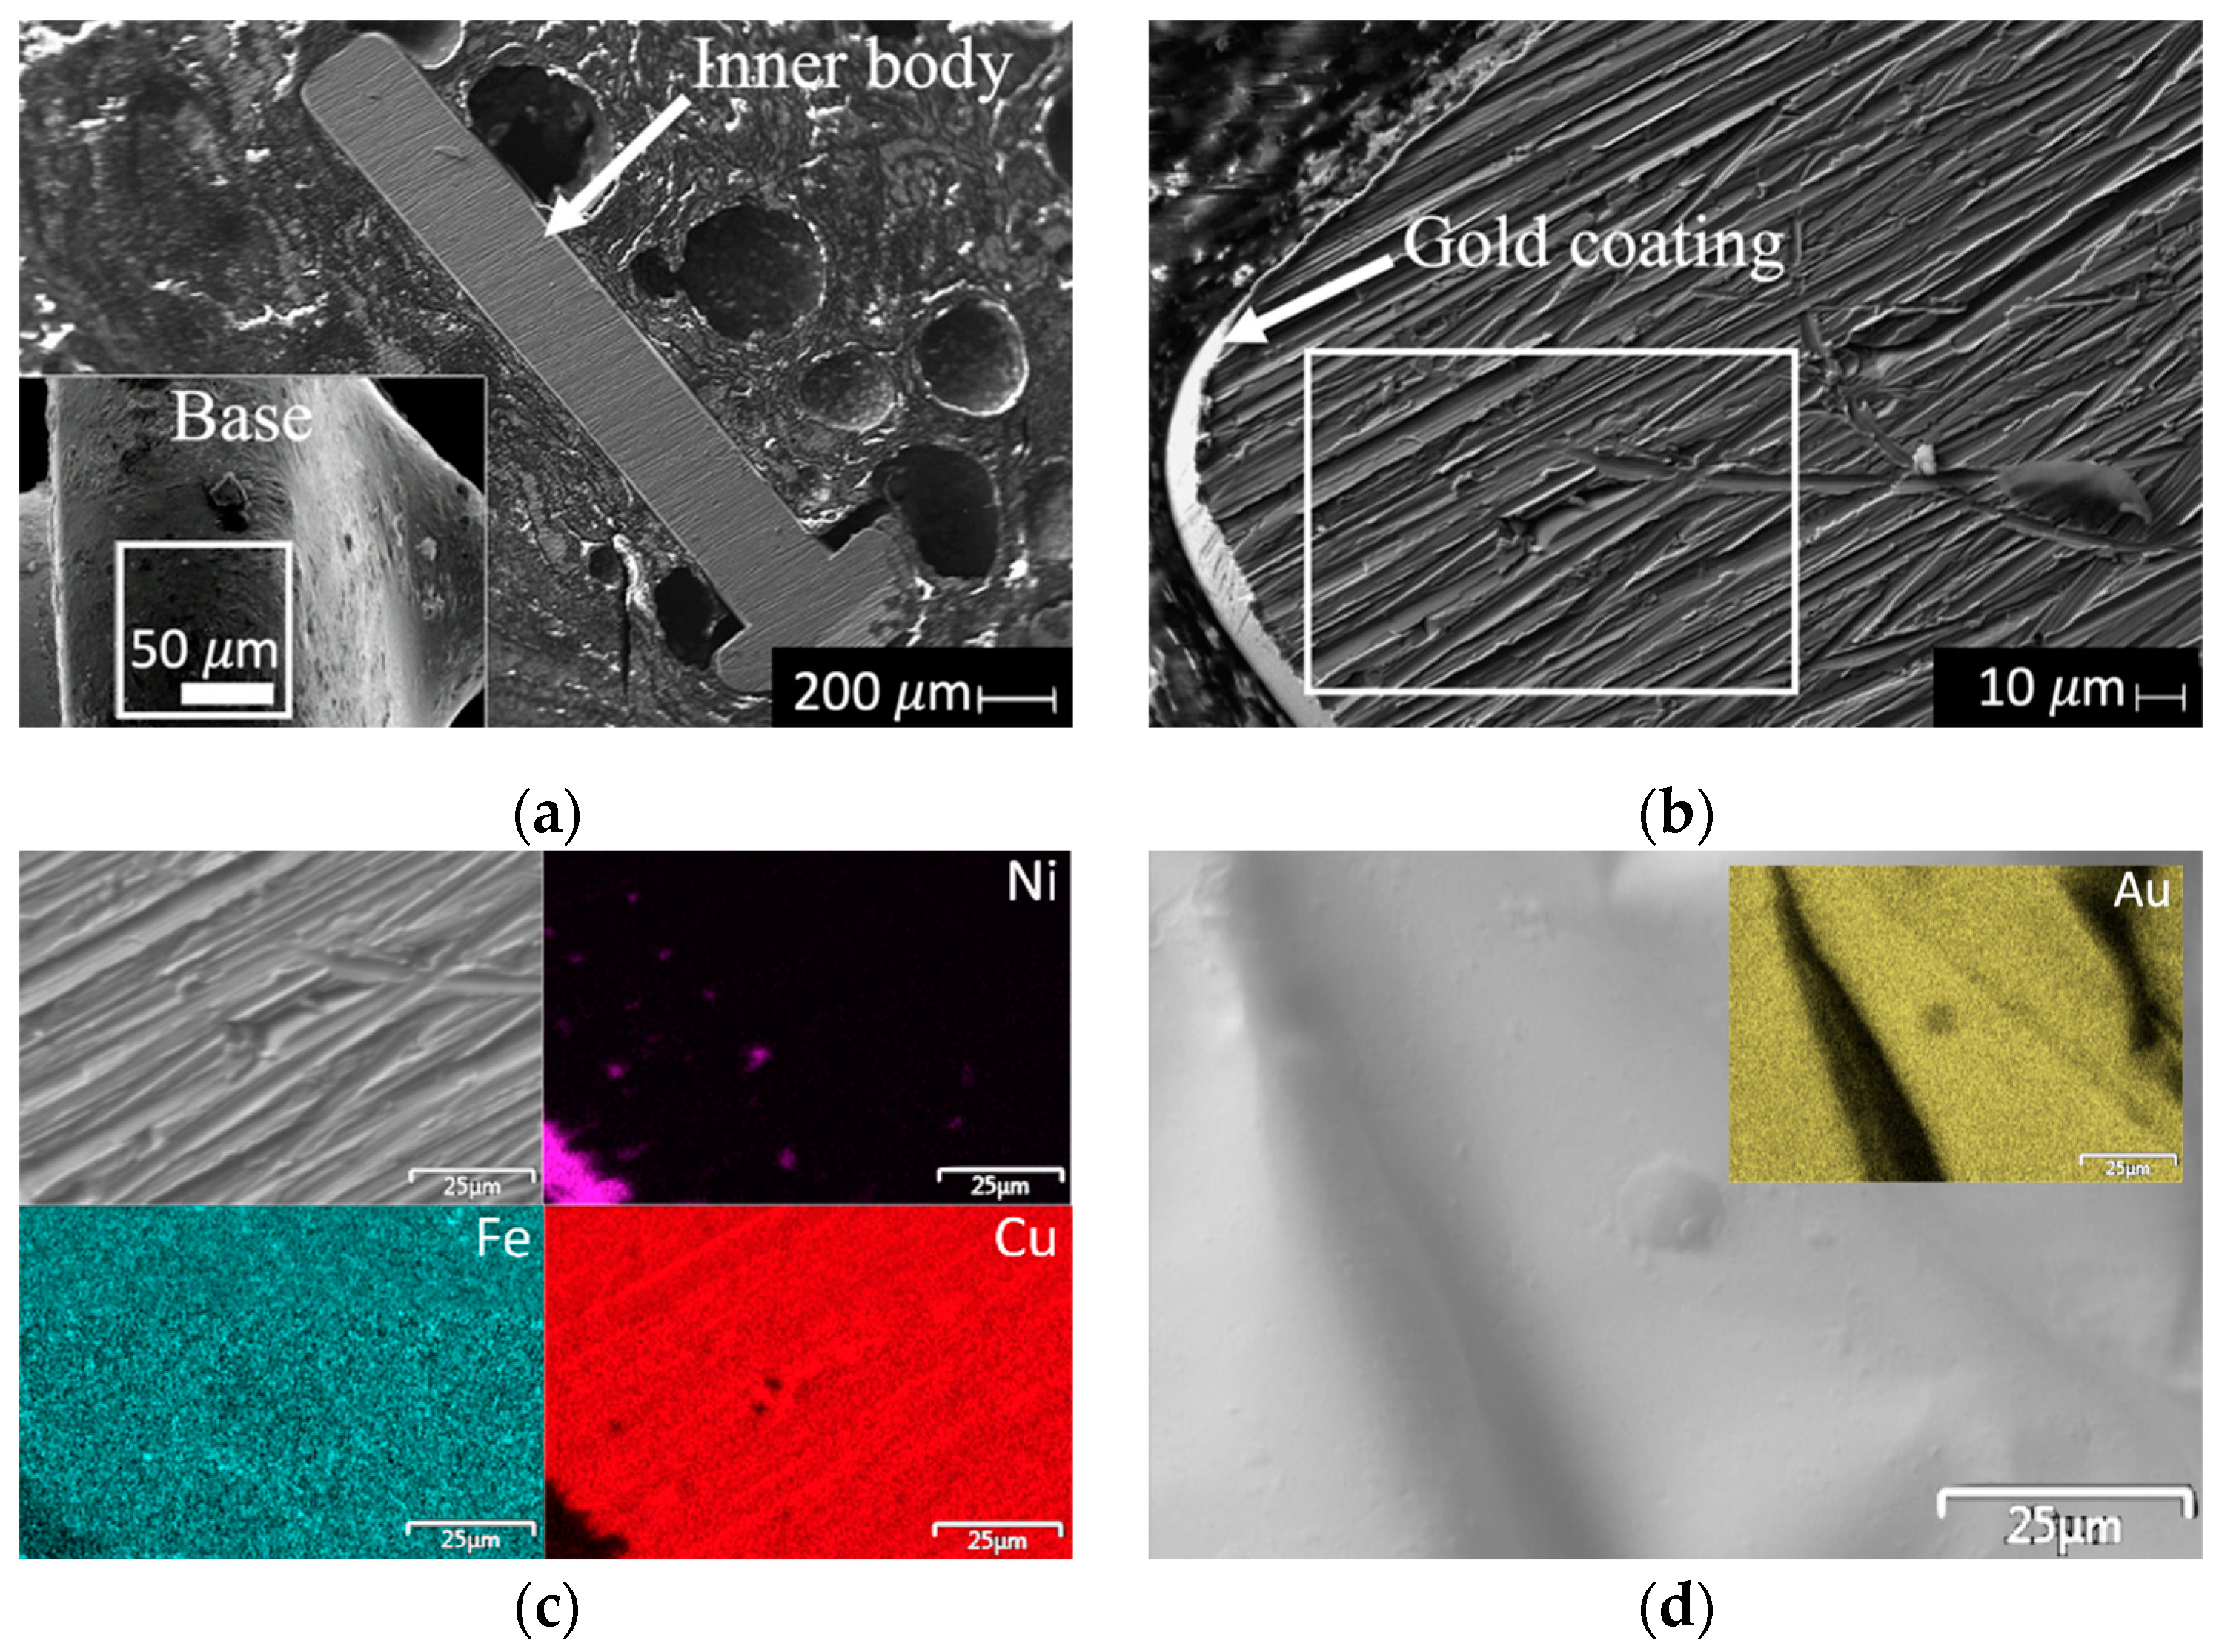
Figure 2 shows SEM images of the inner body and base of a single pin, as well as elemental maps of the gold coating and a near-coated section inside the inner body of the pin. The inner body of the pins is composed of a homogeneous Cu/Fe phase coated with Ni. This composition becomes evident in Figure 2c, where the area close to the coating shows an isolated zone of Ni (purple map), while the areas away from this point show a mixture of Cu and Fe (red and blue maps, respectively). In addition, Figure 2d shows the elemental map obtained from a gold coating after the separation process. In this case, Au is the only element present in this part of the pin.
The presence of Fe and Cu in the inner body was expected, as the pins exhibited magnetism and reacted with HNO3conc to produce a green-colored solution at the beginning and a blue-colored solution at the end of the reaction, which are related to the presence of Ni2+ and Cu2+ ions, respectively. Although there are technical reports on the processors, they may not include all the information on the elements present in these devices. For example, for Intel Pentium 4 processors, the technical report mentions the presence of Au, Ni and Cu, but there is no information on the presence of Fe [31].
Table 1 shows the EDS results with standard deviations in parentheses for the inner body, gold coating and pin base. The results obtained inside the inner body correspond to three different acquisition zones (top, middle and bottom zones in Figure 2a). The inner body of the pin contains 96.05% of Cu, while Ni (1.72%) and Fe (2.23%) are present in lower amounts. For the gold coating, only one signal associated with Au was detected, while only Sn was detected at the base.
On the other hand, the MP-AES results of the digestion in aqua regia of 478 pins are shown in Table 2. It can be observed that only the wt% Cu is close to that obtained by EDS (Table 1), and that Ni and Fe still represent approximately 5% of the total mass of the pins (excluding Sn). Furthermore, these results show that the quantity of Au represents only 0.9% of the total mass. Considering the manufacturer’s pin geometry information (r = 0.0306 cm and h = 0.1381 cm), and the mass of Au reported in Table 2, the thickness of the gold coatings was estimated to be 250 nm. This thickness is outside the 100-nm limit typically considered for the nanoscale. Therefore, a difference in their chemical properties would be expected.
With this information, an acid digestion using a low volume of HNO3conc was proposed, since all the elements except Au react with this acid, which would favor the coating separation procedure. The difference between the method proposed in this work and the hydrometallurgical and pyrometallurgical methods lies in the fact that our method focuses on the direct separation of gold coatings, while in the other two methods the gold is dissolved or melted with other elements to be selectively separated, which directly affects the purity of the Au obtained and the yield of the process.
3.2. Recovery of Gold Coatings from Pins
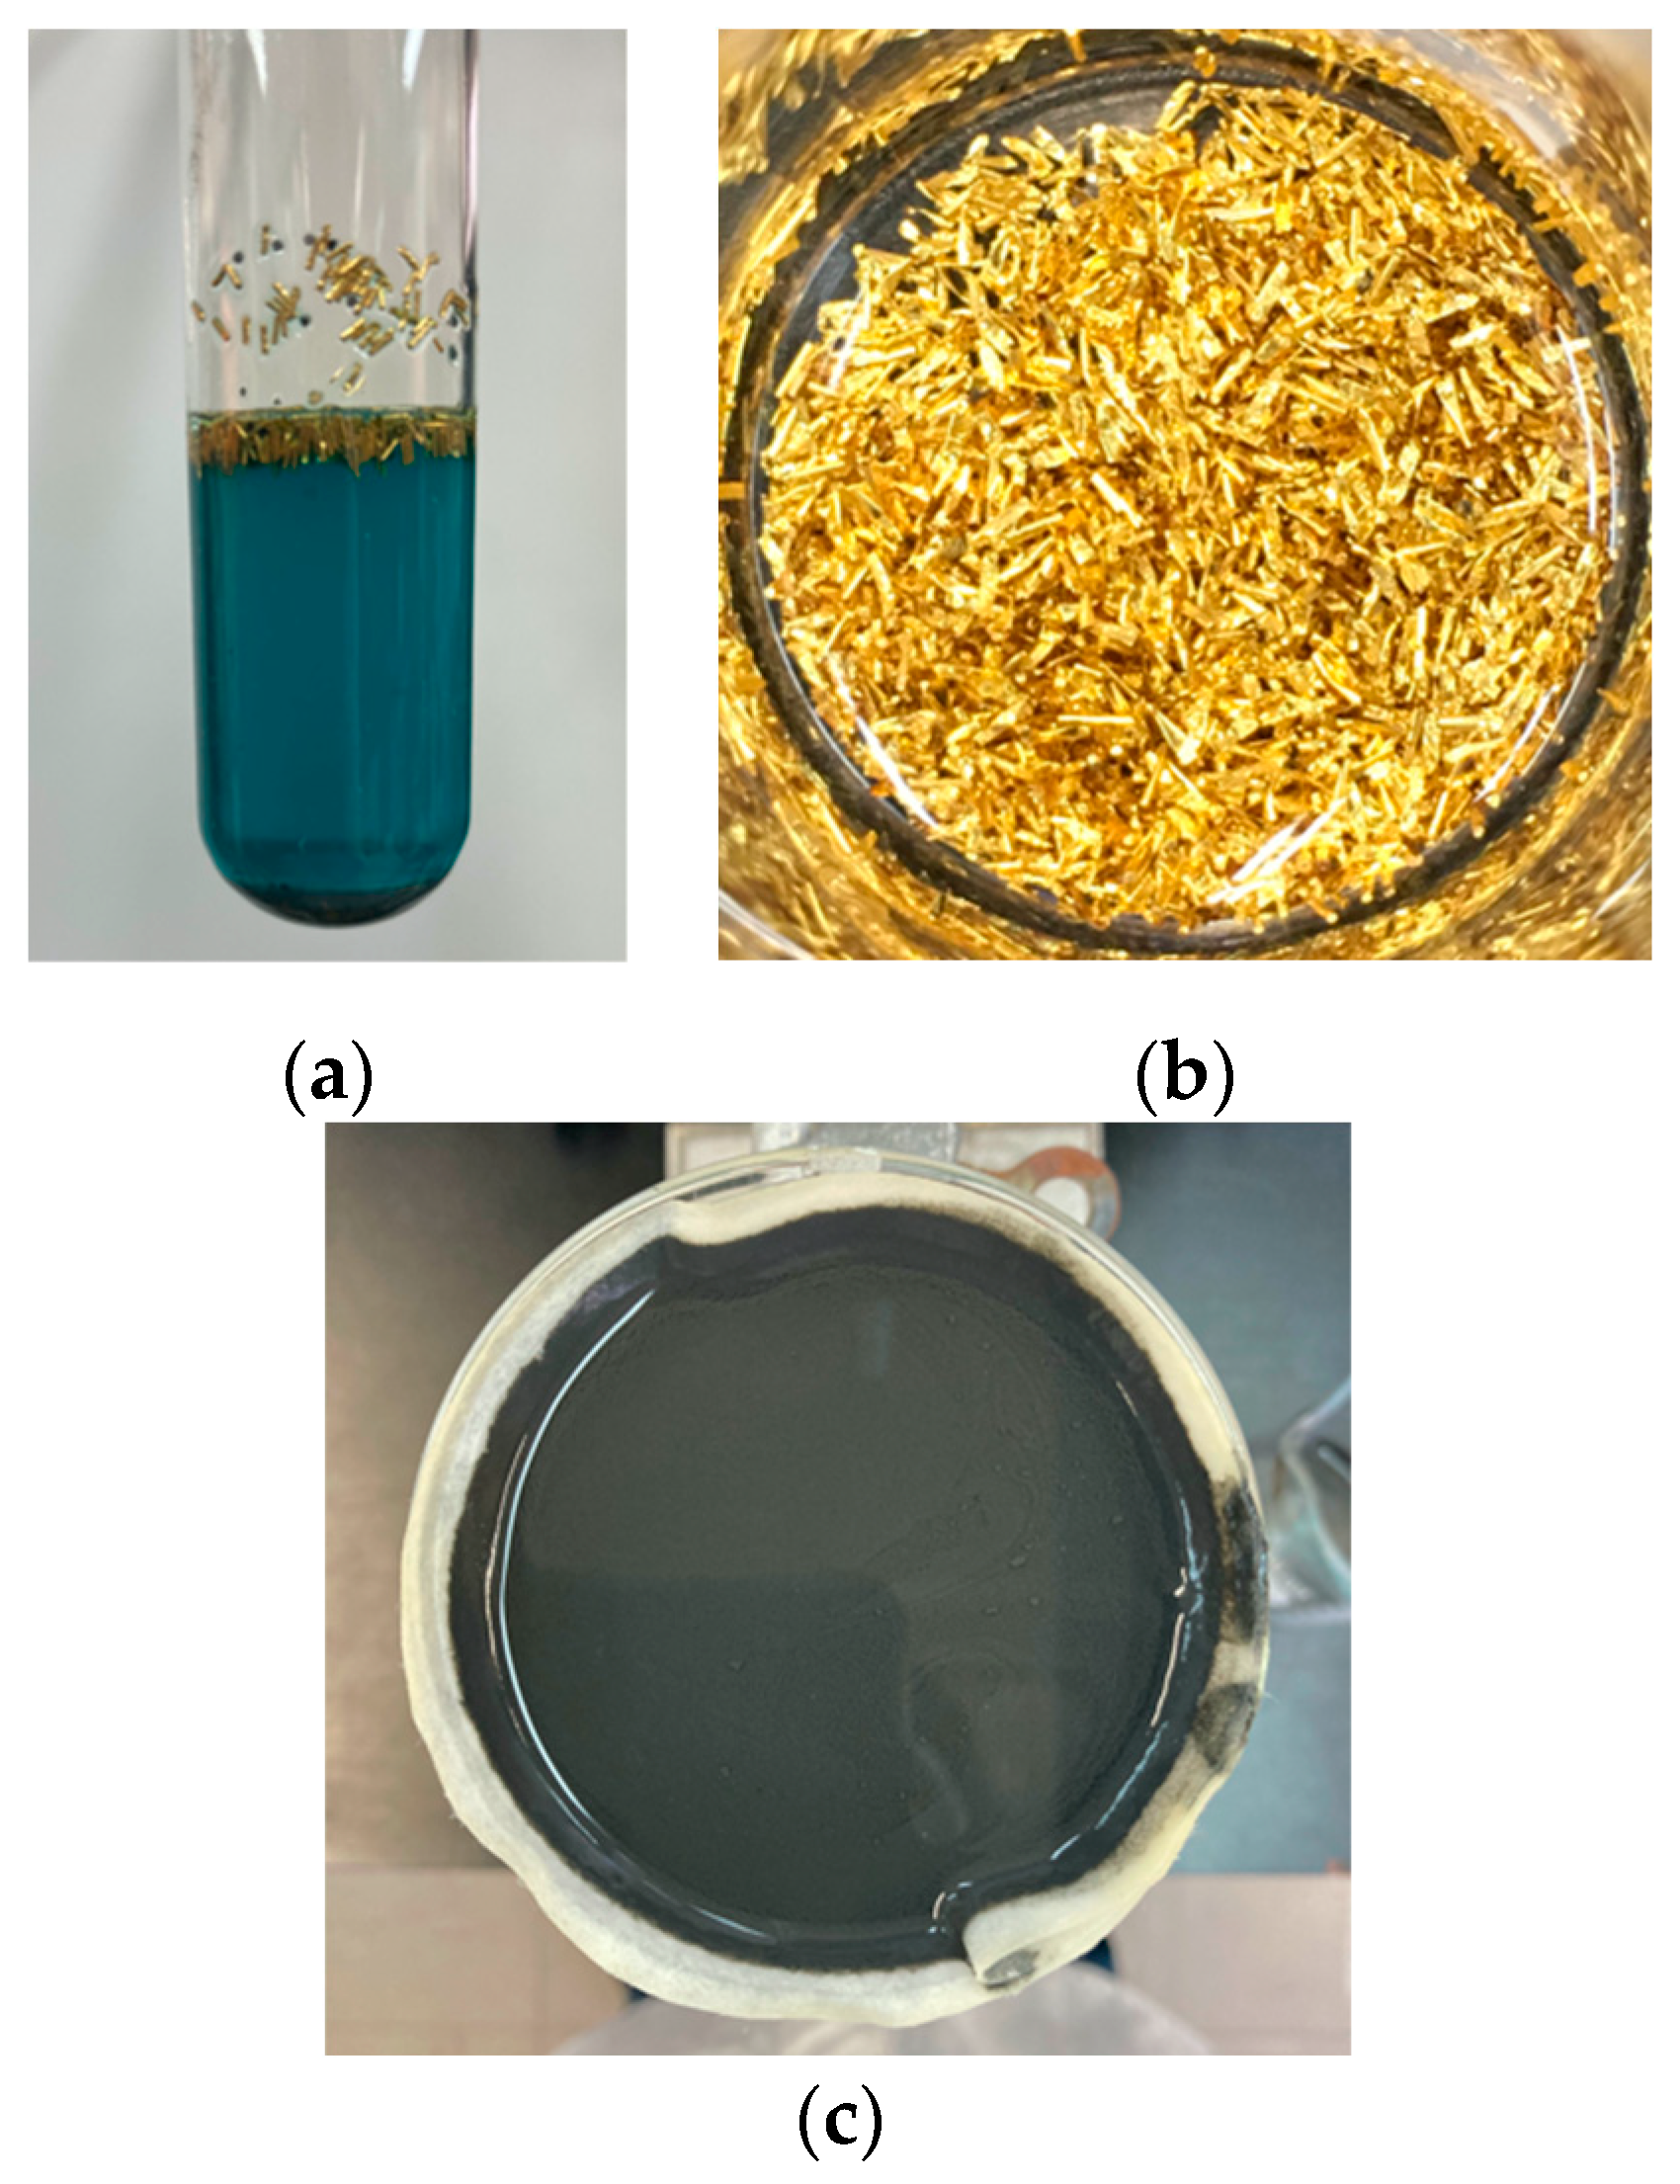
Figure 3a shows the reaction tube with the formation of Cu(NO3)2, Ni(NO3)2 and Fe(NO3)3 (blue solution), as well as SnO2 (gray precipitate at the bottom of the tube) and gold coatings (at the top), after acid digestion of the pins. Since the amounts of Ni and Fe are much lower than those of Cu, the solution was assumed to be composed of Cu(NO3)2 with a purity of 95% (Table 2). Similar behavior was observed in all three batches, allowing the gold coatings to be separated quickly and easily (Figure 3b). Au coatings and SnO2 were weighed and stored, while the Cu(NO3)2 was reacted with NaOH under heat to produce the corresponding CuO (Figure 3c). It was decided to obtain CuO to calculate the mass efficiency of the process. The solution with Cu(NO3)2, Ni(NO3)2 and Fe(NO3)3 obtained after acid digestion could be treated by another method to separate and recover Cu, Ni and Fe.
On the other hand, pH was observed to decrease in each of the NO2(g) traps. For each of the batches, the gas traps started at pH = 3.14 and at the end of the reaction the measured values were 0.85, 2.43 and 3.06 for the first, second and third traps, respectively, meaning that the traps reacted with NO2(g) to produce HNO3. The pH of the first trap decreased significantly, which is not surprising since it is the first to receive NO2(g). To confirm the presence of HNO3 (according to Equation (2)), a test was performed with a Cu wire and an aliquot with the solution of the first trap, obtaining Cu(NO)3 as reaction product.
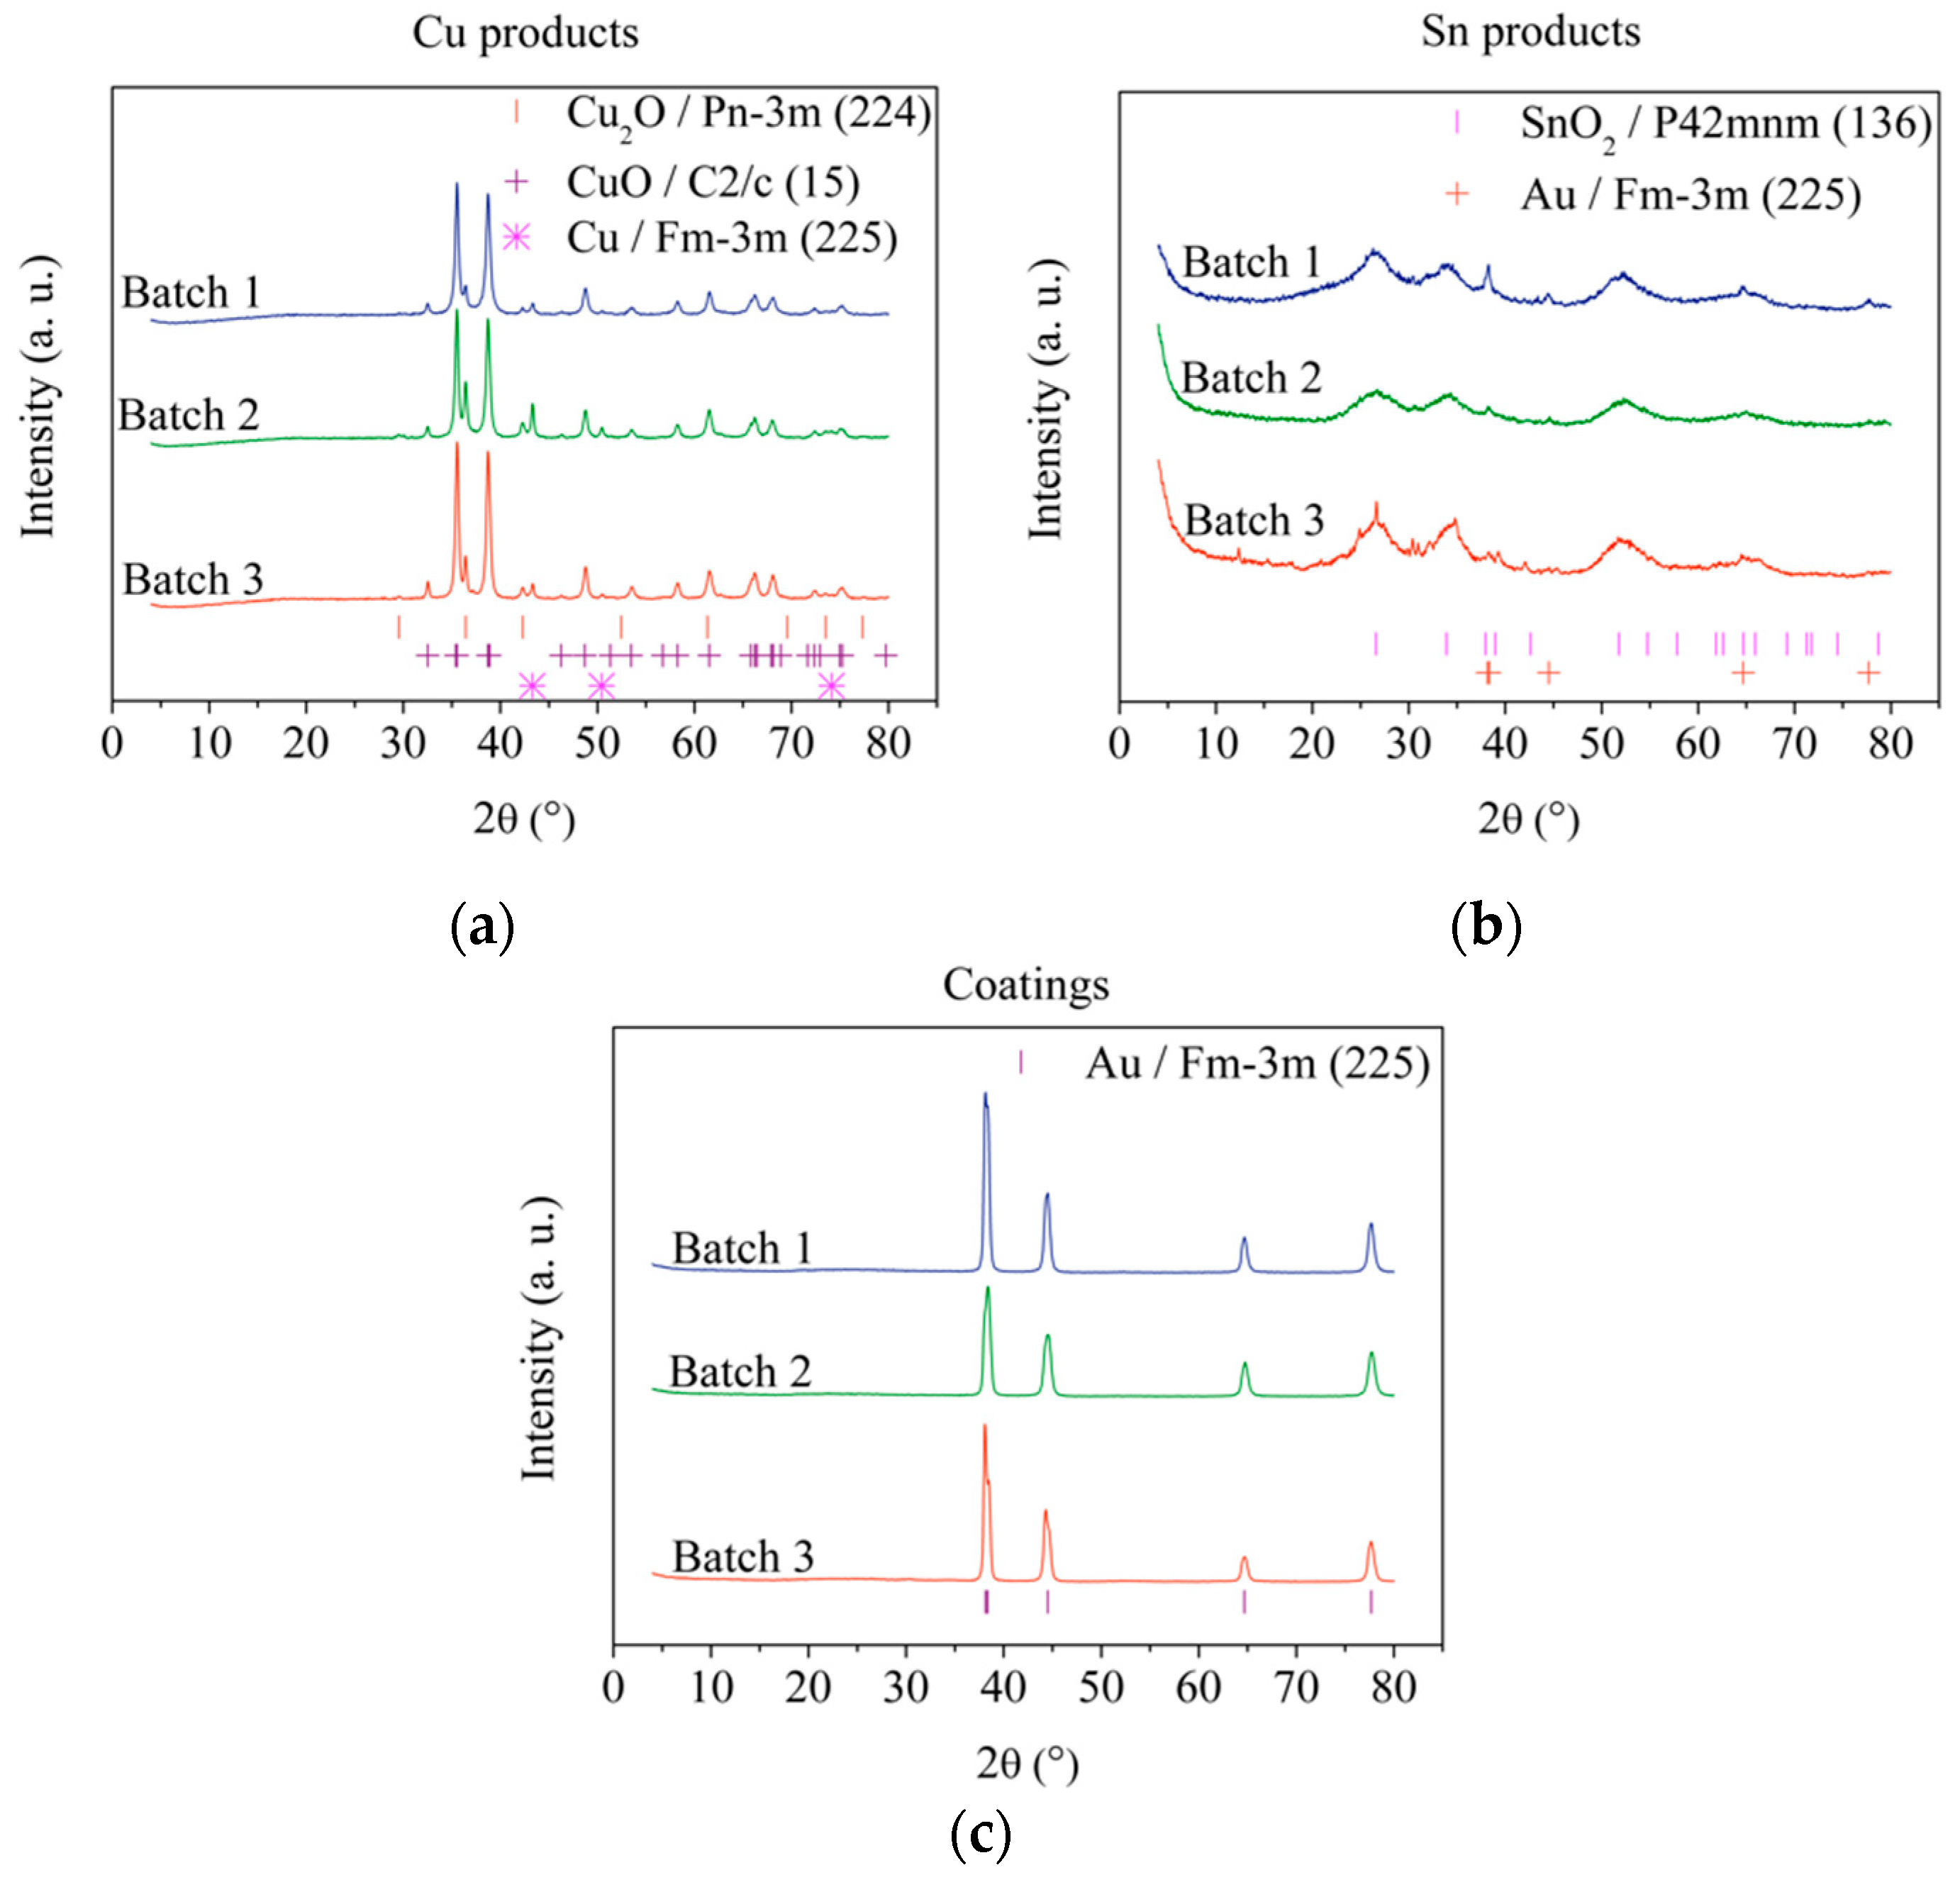
The products obtained during the gold recovery process were analyzed by X-ray diffraction; thus, Figure 4 shows the X-ray diffraction patterns of CuO, SnO2 and the Au coatings recovered from batches 1, 2 and 3, as well as the Bragg positions of the phases found. All X-ray patterns show similar profiles and intensities.
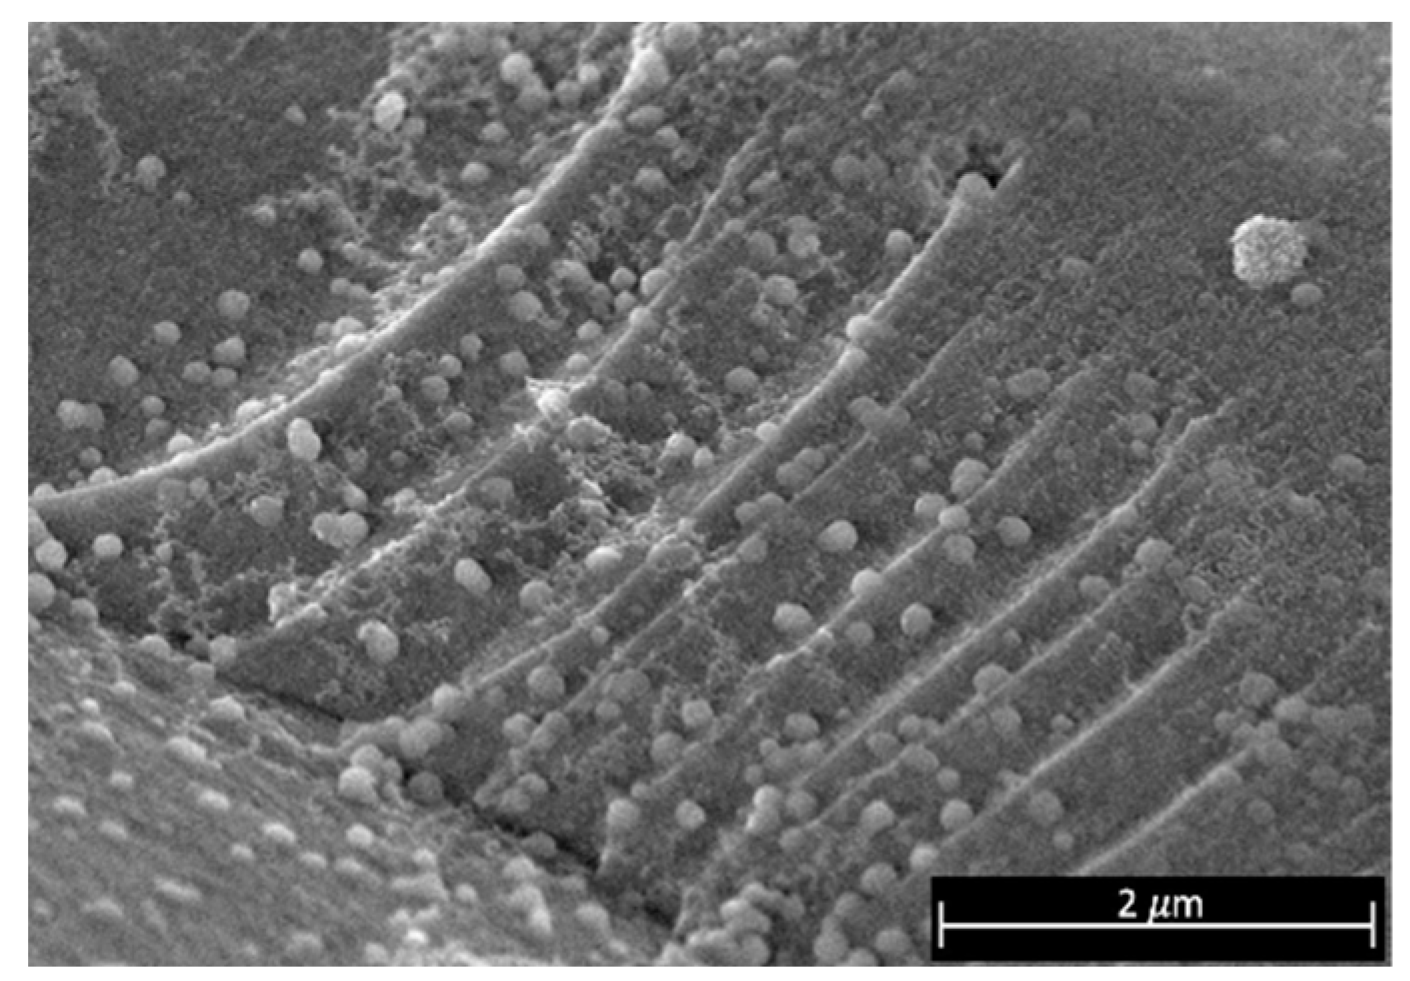
The phases found in Figure 4a correspond to Cu, Cu2O and CuO. For efficiency calculations, it can be assumed that this product is composed entirely of CuO, since the CuO signals are more intense compared to Cu and Cu2O signals. No signals associated with any Ni or Fe phase were found due to the low amount of these elements. On the other hand, SnO2 and Au phases are observed in Figure 4b; according to morphological analysis (Figure 5), these Au particles are supported on SnO2. Due to the shape and size of the Au coatings, the support of the gold particles on SnO2 could be explained by the oxidation of a small portion of the Au coatings when HNO3conc is added during their recovery, which is subsequently reduced when Sn is oxidized and finally deposited on the formed SnO2. Thus, for efficiency estimates, the precipitate was assumed to be 100% SnO2. Finally, the diffractograms of the gold coatings are shown in Figure 4c, where only signals associated with Au crystalline phases are observed, thus confirming the results obtained by EDS (Table 2) and indicating that the coatings consist only of Au with a high degree of purity.
Table 3 summarizes the masses of Au, Cu and Sn recovered from the pins, as well as the batch efficiencies based on the recovered masses and the results obtained by MP-AES, along with their associated uncertainties in parentheses [27]. Batch 1 shows the highest total mass (mT) and MP-AES efficiencies (96.8 and 89.0%, respectively), meaning that adding H2ODI to the reaction medium (in an amount similar to that of HNO3conc) improves the yield, which could be due to an improvement in the solubility of Cu(NO3)2 (Equation (2)). Thus, for the other batches with lower H2ODI volumes, the efficiencies were between 73–82%.
MP-AES analysis of a second sample (treated as Batch 1) shows that, after acid digestion, the mass of Cu, Ni and Fe is similar to that reported in the pretreatment section (Table 2 and Table 3). Thus, the procedure was able to dissolve approximately 99% of the pins (the other 1% corresponds to Au). Moreover, MP-AES analysis of the solution after complexation and oxidation shows the presence of Cu and Fe in small amounts (0.05341 and 0.00126 mg, respectively), meaning that the conditions for these reactions should be optimized. Based on these results, it can be established that the methodology fulfills the purpose of not generating waste during the separation of the gold coatings (which does not occur in most of the separation procedures mentioned above). In addition, the byproducts obtained can be treated to recover the original elements (Fe, Cu, Ni and Sn), while the solutions used in the gas traps can be treated to recover the HNO3 again.
The methodology used in this work could be optimized by evaluating the separation of gold coatings at different concentrations, times, volumes and temperatures, which would improve costs and reduce the environmental impact.
3.3. Synthesis of Tetrachloroauric Acid (HAuCl4)
Figure 6 shows the UV-Vis calibration curves obtained between 310 and 320 nm in triplicate, which were used to determine the concentration of the two synthesized HAuCl4 samples (labeled 1.1 and 1.2, respectively). These results were compared with the chemical analysis by MP-AES. In this way, Table 4 shows the results obtained from the calibration curve with their uncertainties in parenthesis [27] and the chemical analysis obtained by MP-AES. When comparing the Au concentrations obtained by UV-VIS and MP-AES, values very close to each other are observed, as is a complete dissolution of Au coatings in both samples, i.e., the percentages of dissolved Au are close to 100%.
The ability of the HCl/HNO3 mixture used in this work to dissolve Au coatings at much lower concentrations than that of aqua regia could be explained by taking into account its thickness. Thus, the estimated thickness of the gold coating was 250 nm, which cannot be considered at the nanoscale because the sample must be smaller than 100 nm; however, the results obtained in this work indicate that the dimensions of the coatings are small enough to affect the chemical properties of Au. These effects may be due to a low concentration of near-neighboring Au atoms at the edges, allowing gold atoms to have greater freedom to vibrate and oxidize, which confers to them significant chemical reactivity [21]. According to the different conditions for Au dissolution in the works shown above, none of them have focused on the effect of the size of their Au samples, which would imply one more variable to be contemplated.
The results obtained by MP-AES shown in Table 4 indicate that HAuCl4 synthesized by the conventional method has a purity (2–6 ppm trace metals) similar to that of Aldrich reagent (trace metals ≤ 1000 ppm, Product number: 520918, Batch: MKCJ4933). The synthesized HAuCl4 could also contain traces of Fe and other undetected elements (from water, HCl and HNO3 used during synthesis). However, even if all trace amounts present are considered, the number of traces will not exceed 1000 ppm.
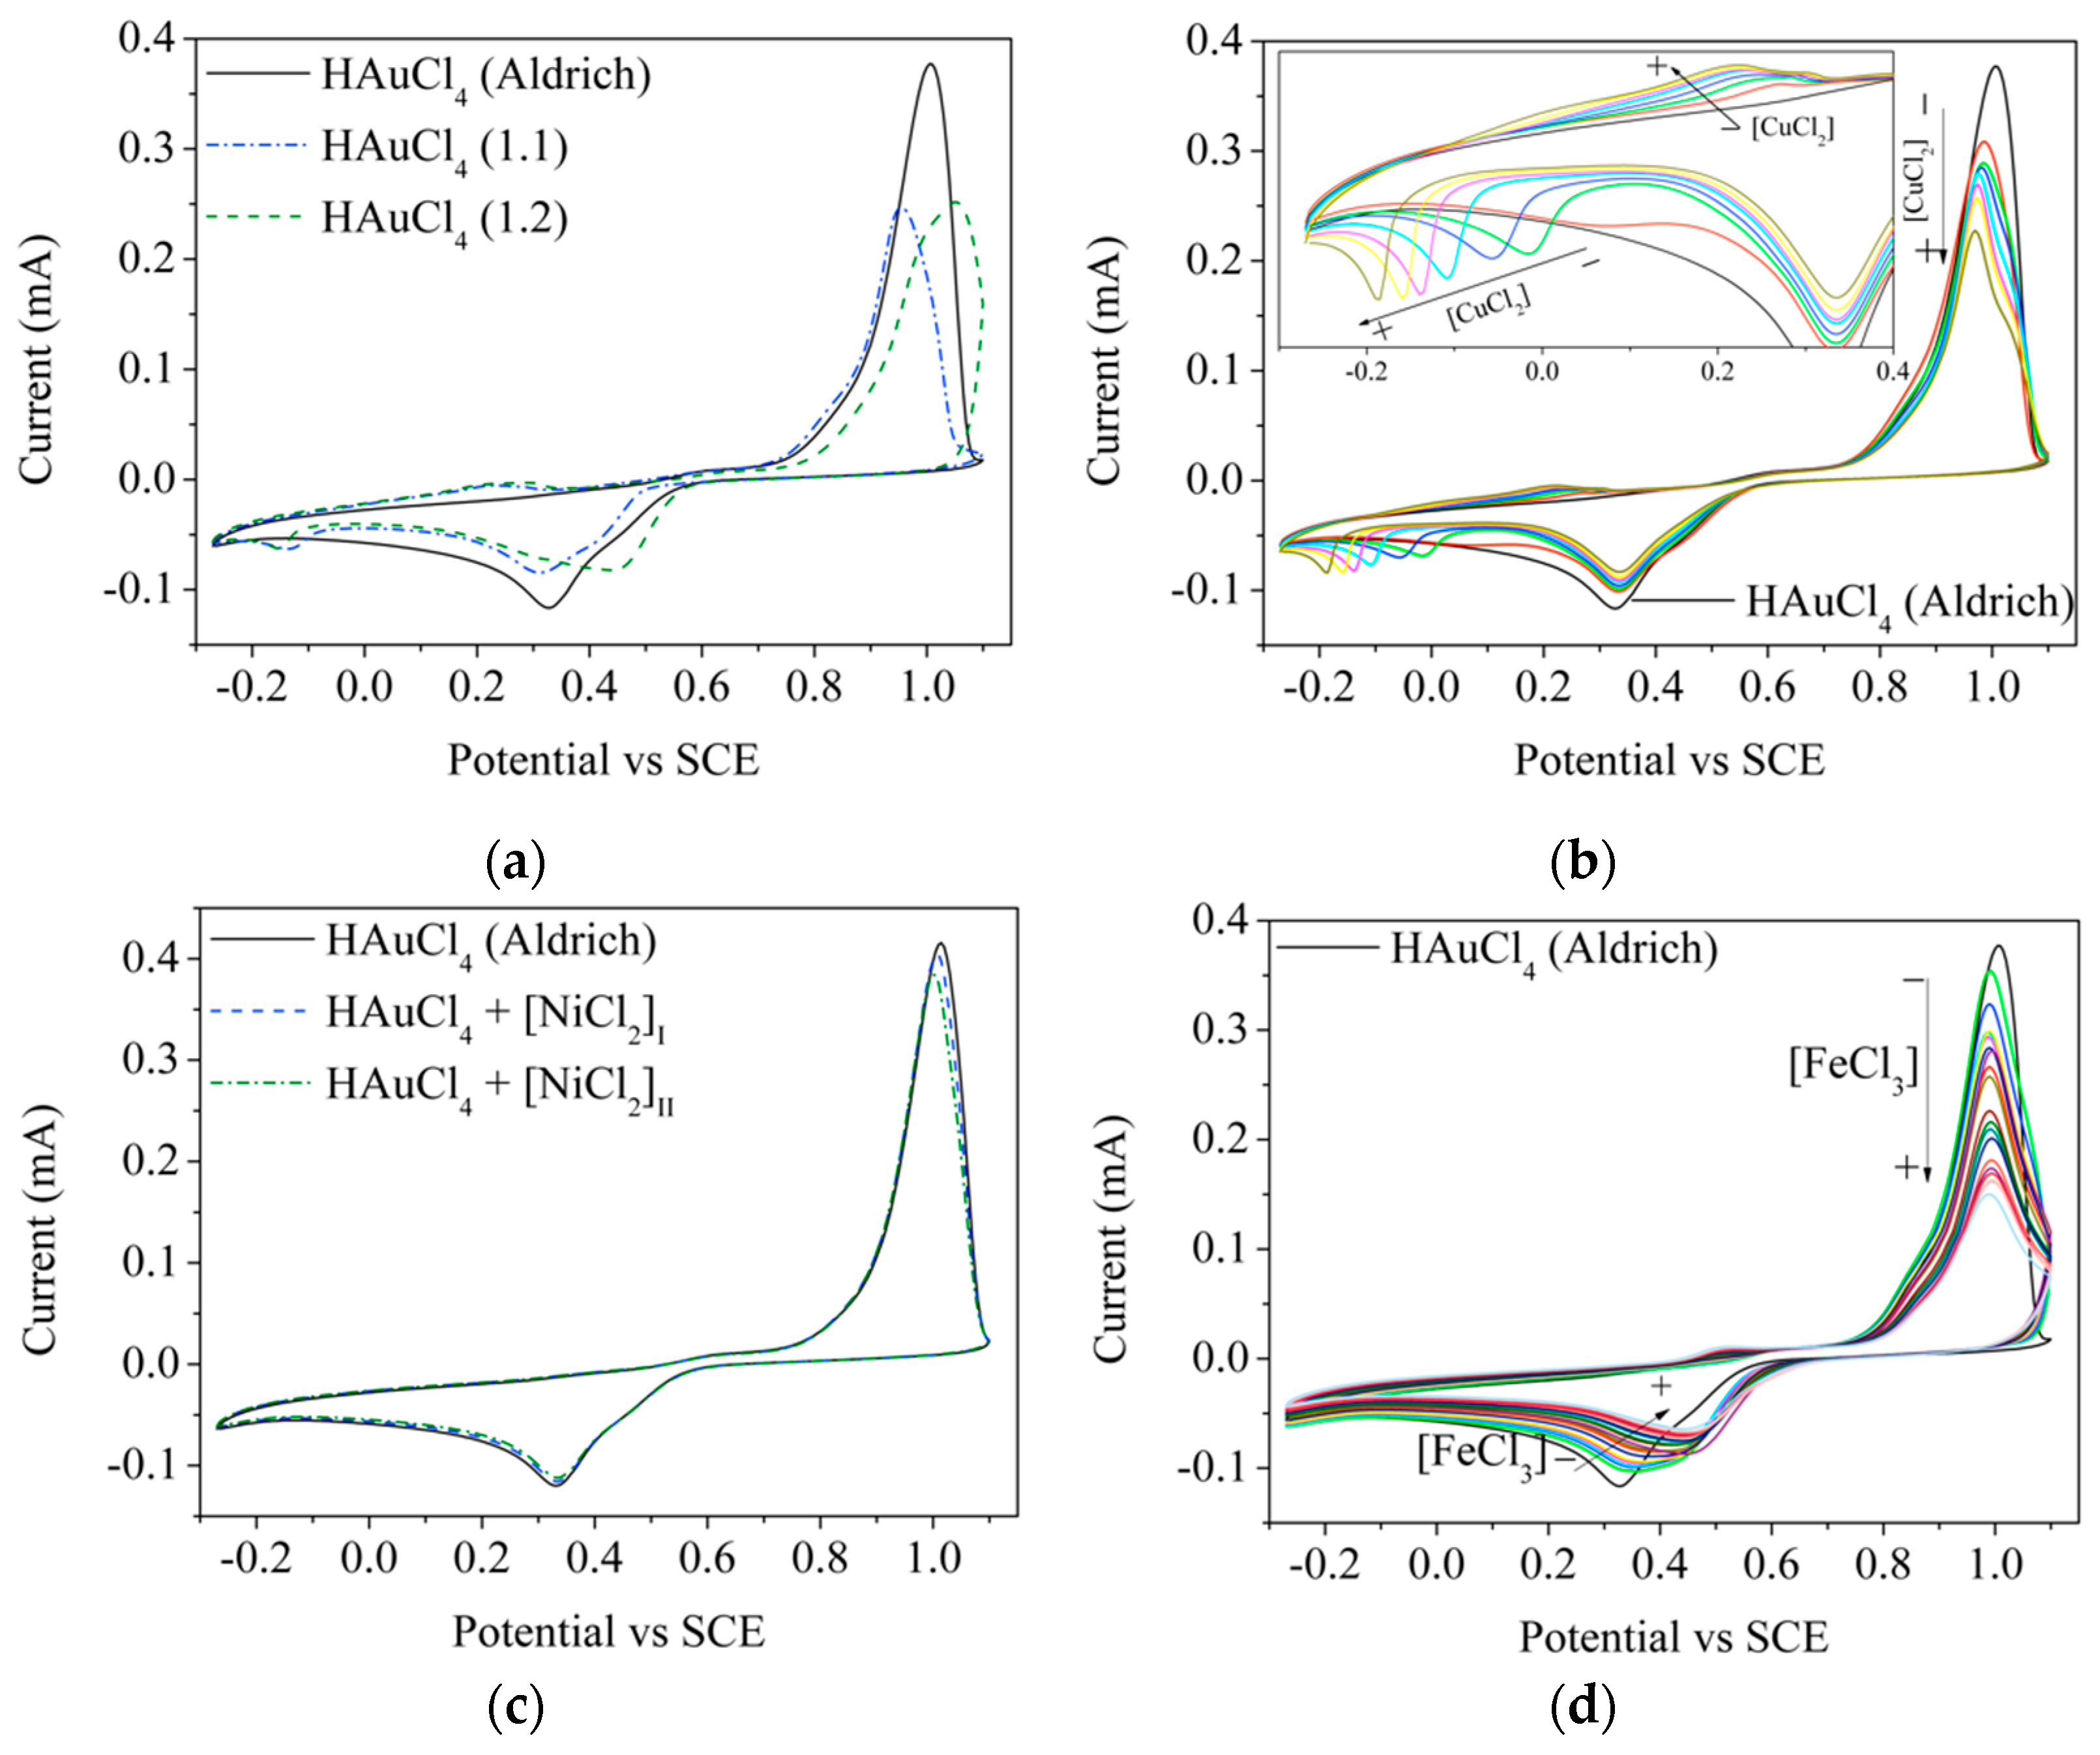
Since the presence of Fe could not be determined by MP-AES analysis, the electrochemical technique of cyclic voltammetry was used for its determination. In this way, Figure 7 shows the cyclic voltammograms of different 1 mM HAuCl4 solutions used: from Aldrich (black solid lines) in the absence and presence of different salts (CuCl2, NiCl2 and FeCl3); and HAuCl4 synthesized (blue dotted line for 1.1, and green dotted line for 1.2).
Two peaks at 1.00 and 0.325 V/SCE are observed for all Aldrich HAuCl4 solutions, which are affected by the presence of CuCl2 and FeCl3 (Figure 7b,d, respectively), while the presence of NiCl2 does not affect these peaks (Figure 7c). The presence of CuCl2 (Figure 7b) results in a decrease in the currents for both peaks as the salt concentration increases, and another peak is observed between −0.2 and 0.25 V/SCE; these shift to more negative potentials as the CuCl2 concentration increases. A similar behavior is observed in the presence of FeCl3 (Figure 7d), i.e., as the concentration of the iron salt increases the currents in both peaks decrease, in addition to the peak at 0.325 V/SCE shifting towards more positive potentials.
Thus, for HAuCl4 1.1 and 1.2, the presence of Cu is confirmed by the peak between −0.2 and 0 V/SCE, while the presence of Fe is observed only for HAuCl4 1.2, as the peak at 0.325 V/SCE is shifted towards more positive potentials (0.47 V/SCE) (behavior observed in Figure 7b).
3.4. Synthesis of Gold Nanoparticles by the Turkevich Method
Table 5 shows the MP-AES results of the HAuCl4 solution before and after the evaporation cycles. It can be observed that the evaporation cycles do not contribute to improving the purity of the solution; in fact, these cycles did the opposite since the amounts of Fe and Cu increased while the concentration of HAuCl4 decreased by 41%.
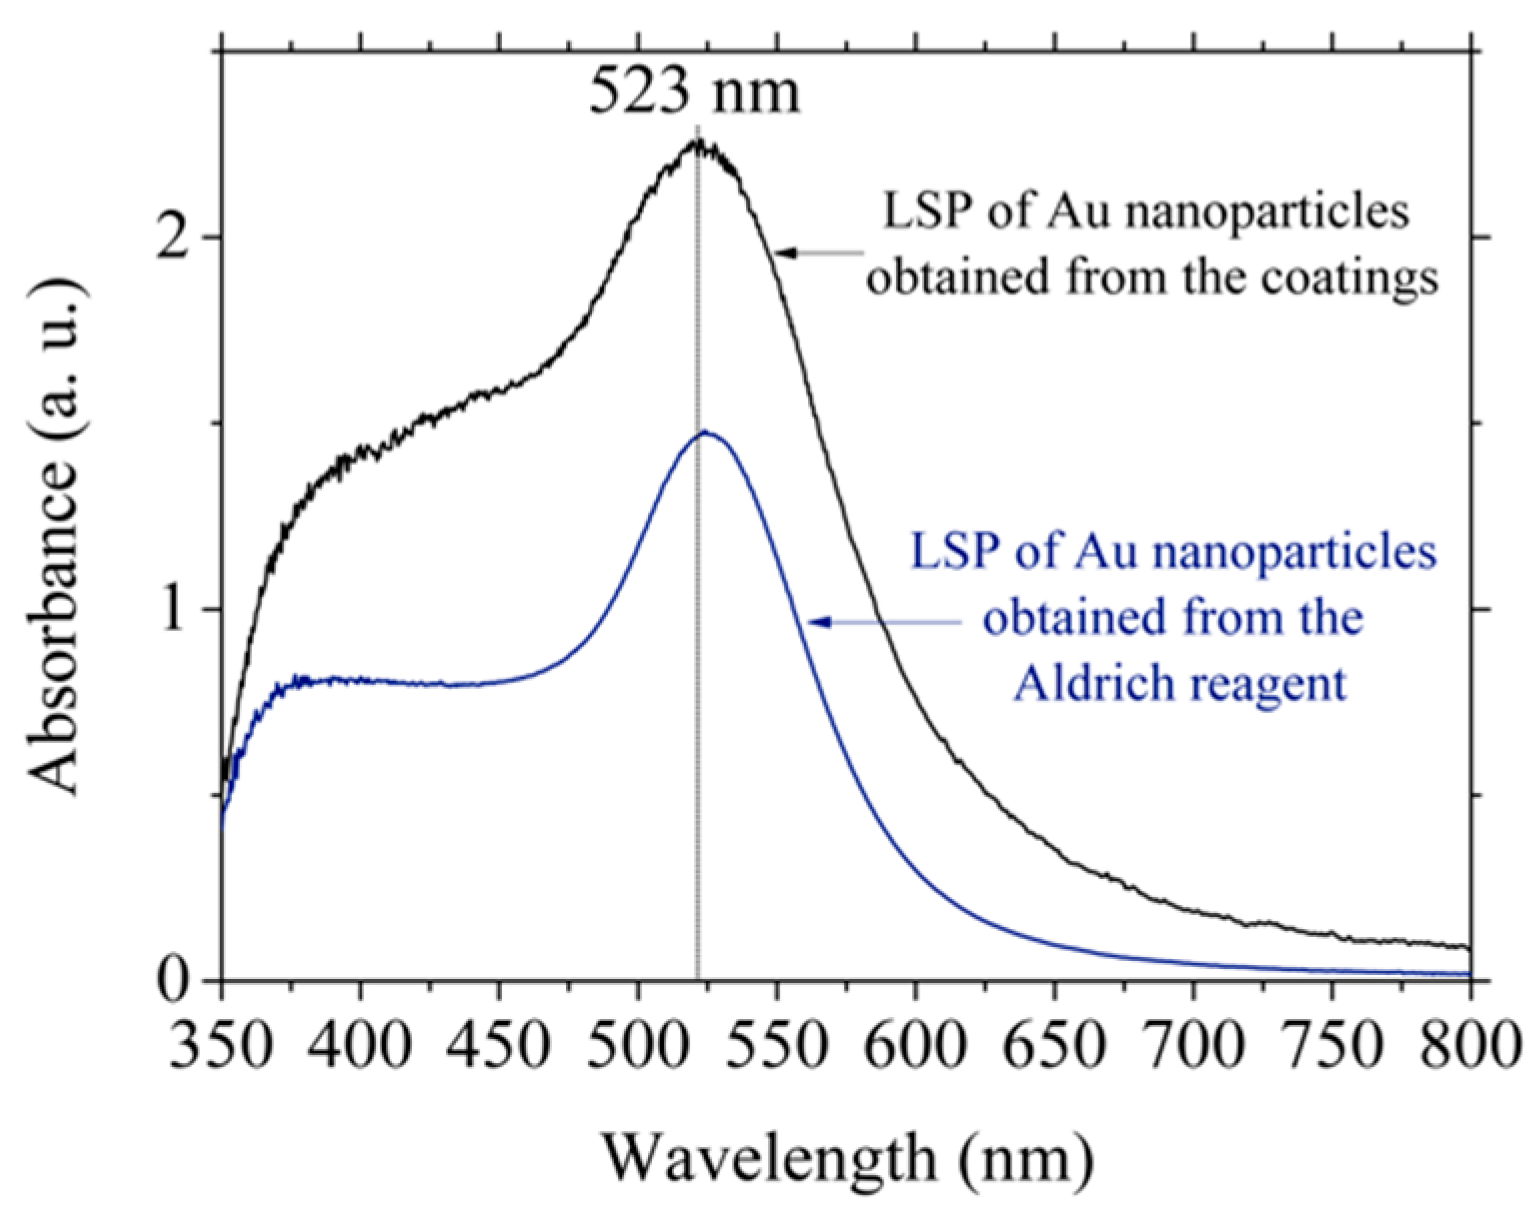
Gold nanoparticles were synthesized by the Turkevich method using HAuCl4 from Aldrich and that obtained after evaporation cycles. In this way, two wine-colored solutions were obtained at the end of synthesis, which confirmed the presence of Au nanoparticles. Figure 8 shows the absorption spectra of both solutions; the presence of a maximum at 523 nm related to the LSP can be observed in both batches. The absorbance recorded for Au nanoparticles obtained from the coatings was higher than those obtained from Aldrich’s reagent. Based on the position of the peaks, a particle size between 15 and 20 nm was assumed [32], which was congruent with the synthesis methodology.
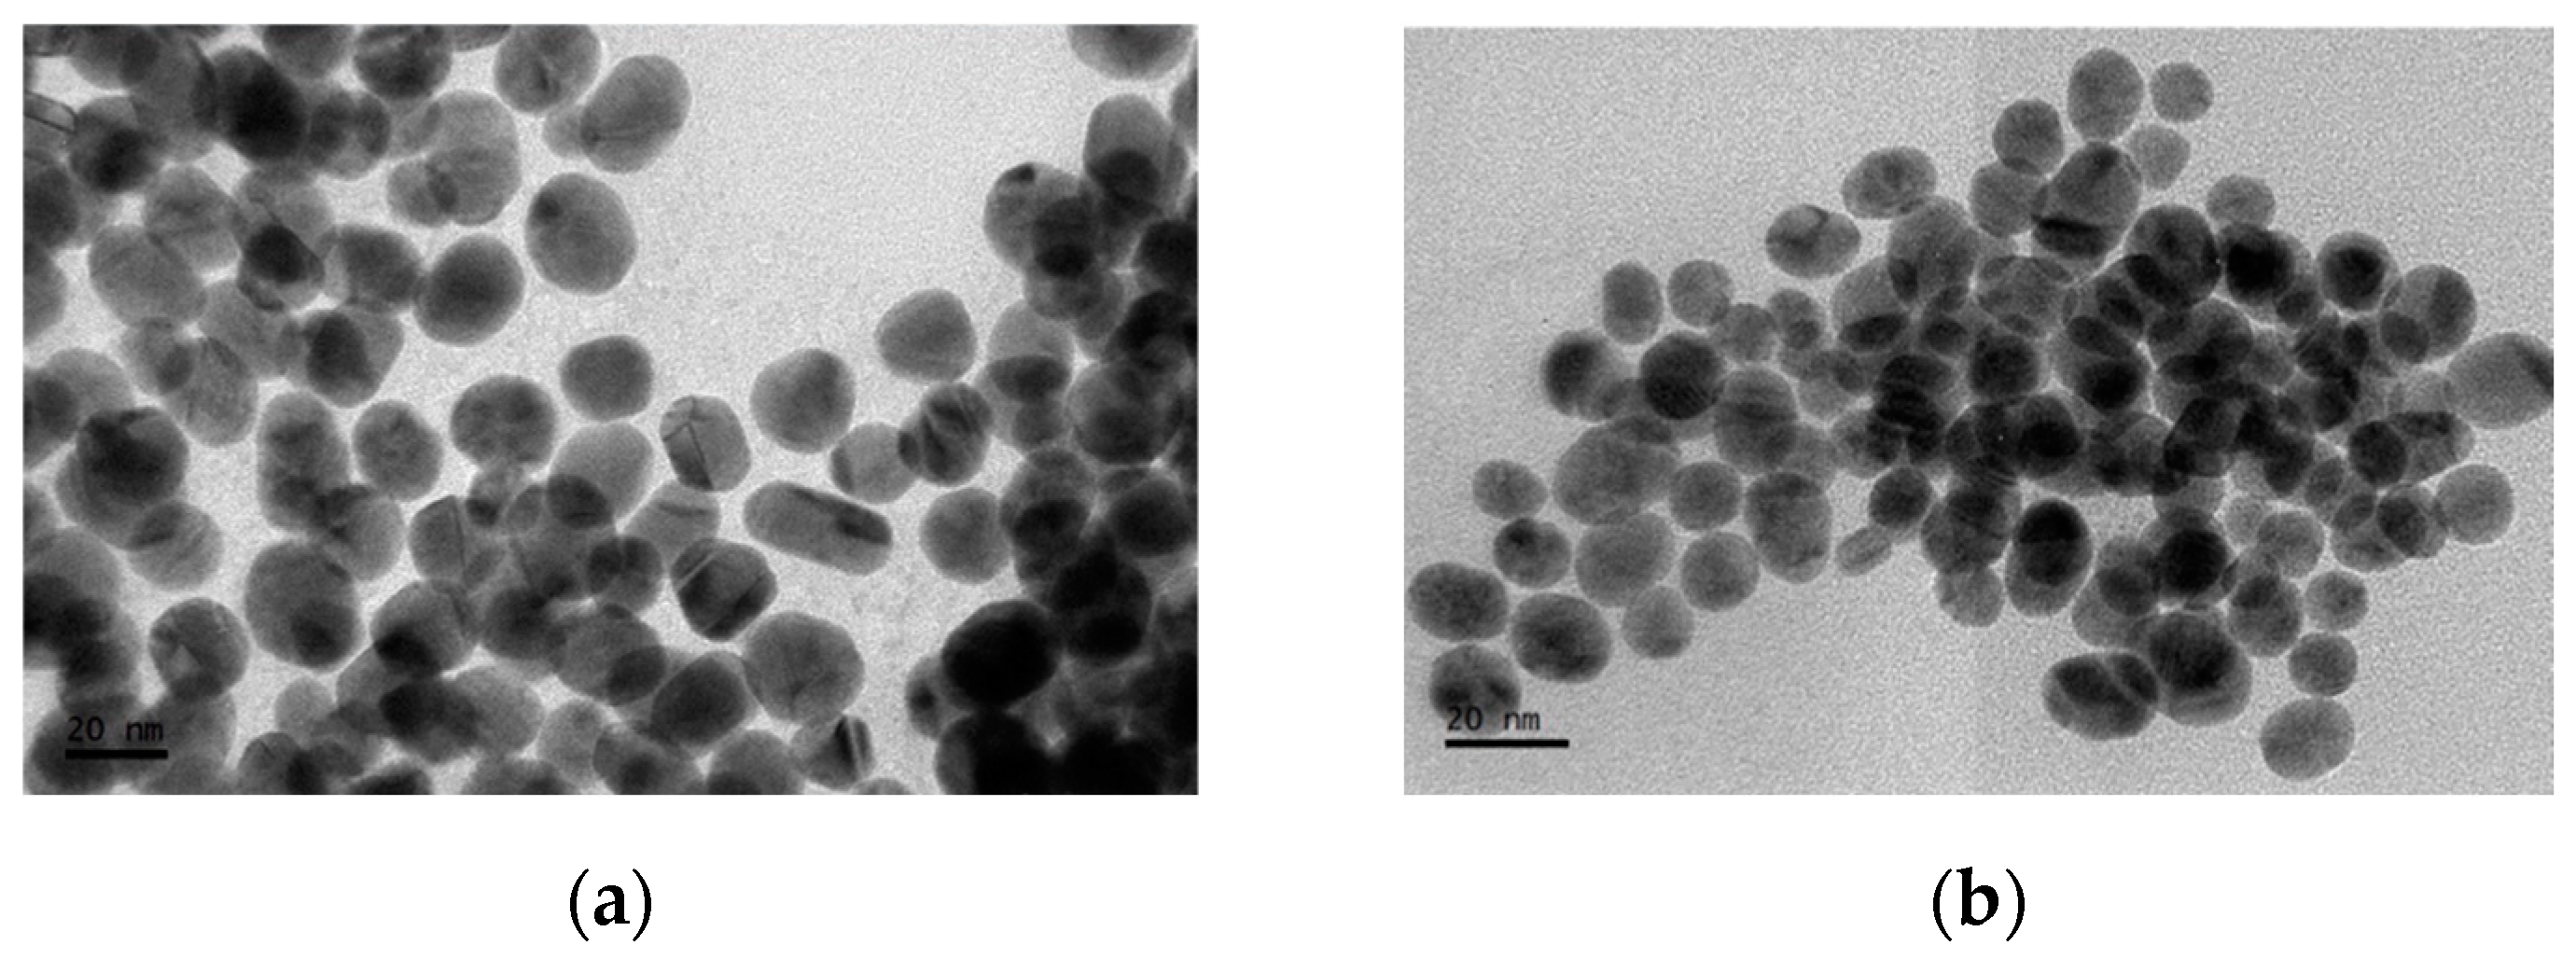
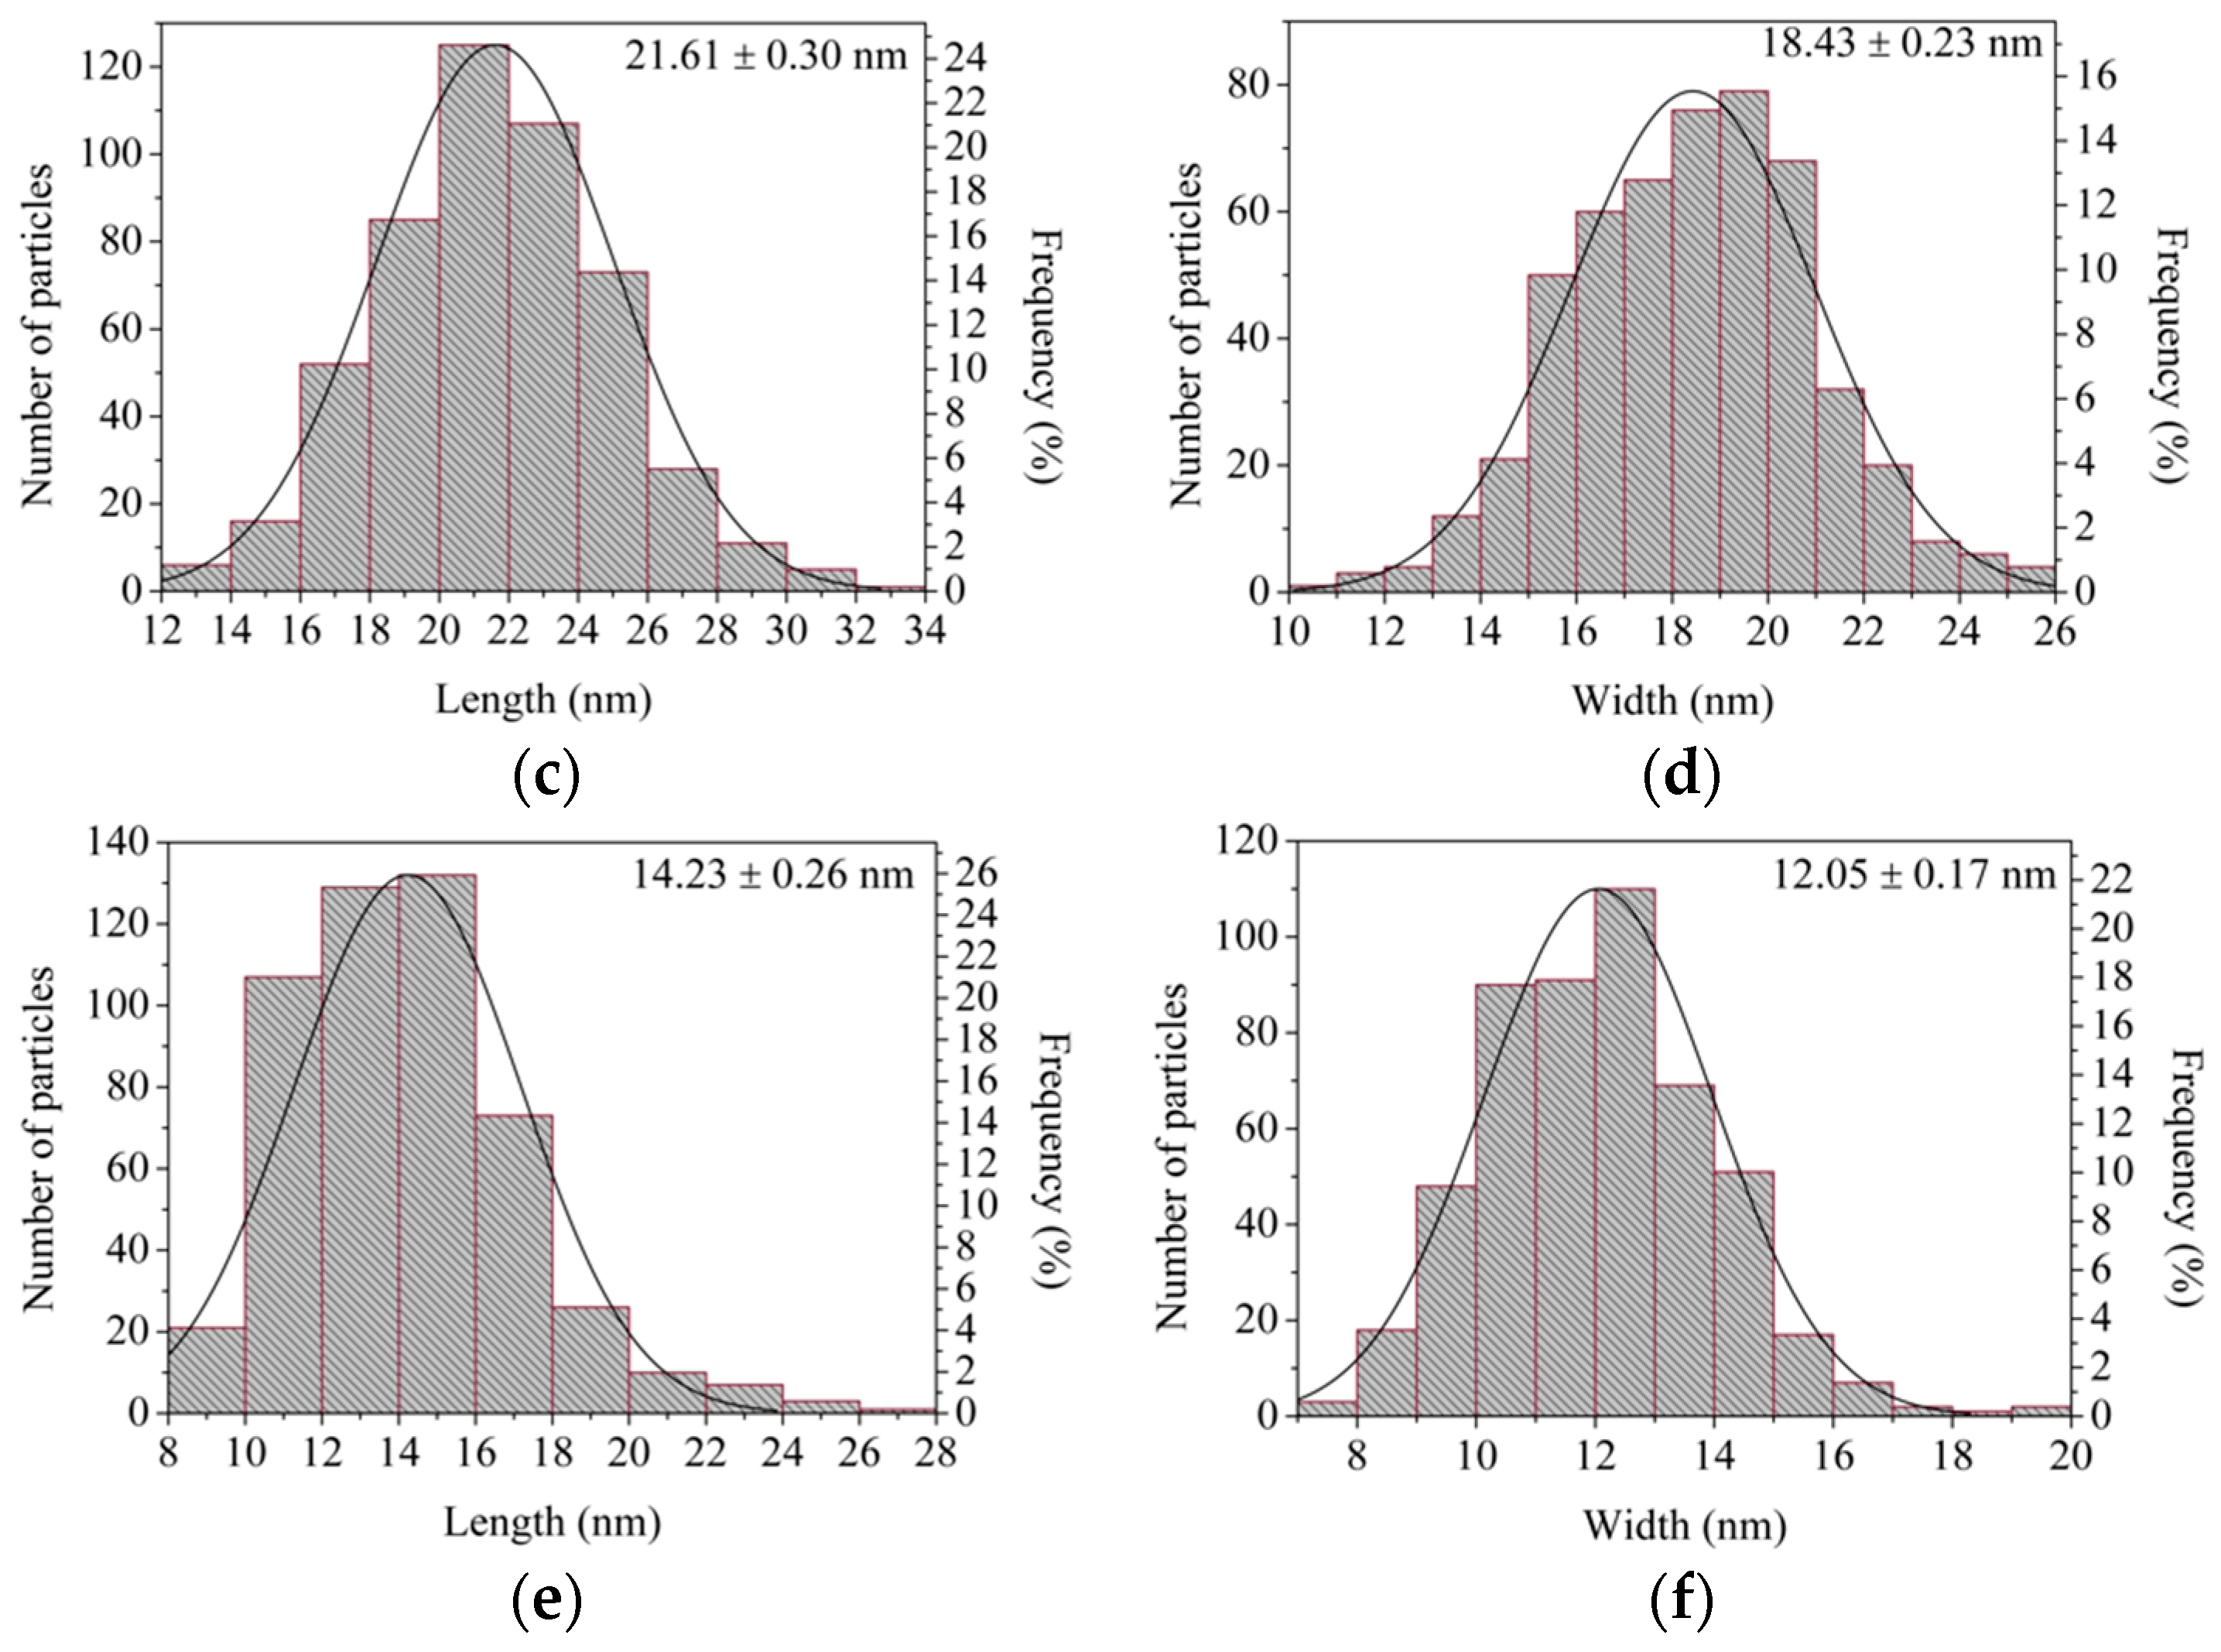
Figure 9 shows the transmission electron micrographs of Au nanoparticles obtained from Aldrich’s reagent and those obtained from gold coatings, as well as size distribution analysis (509 particles were measured for each using ImageJ software for the analysis [33]). The latter showed that the Aldrich nanoparticles (length = 21.61 ± 0.30 nm, width = 18.43 ± 0.23 nm, and equivalent circular diameter = 20.30 ± 0.24 nm) were larger in size than the Au nanoparticles obtained from the coatings (length = 14.23 ± 0.26 nm, width = 12.05 ± 0.17 nm, and equivalent circular diameter = 13.24 ± 0.21 nm). In both cases, uniform sizes were observed and no particular symmetries were observed. The size difference could be due to the fact that the HAuCl4 solution obtained from the coatings had a lower concentration than the Aldrich solution.
The particle size obtained with the HAuCl4 synthesized in this work is very similar to that reported by Turkevich, and by other authors [20], who used this synthesis method or some variant and obtained particle sizes between 10 to 20 nm. With other methodologies such as Brust–Schiffrin, synthesis with NaBH4 with/without citrate, synthesis with ascorbic acid, Seeding-Growth, and Green synthesis, it is possible to obtain similar particle sizes by modifying the concentration of the precursors [20]. Although other synthesis methodologies were not tested in the present work, the purity of the HAuCl4 obtained is sufficient to use in these methodologies.
These results indicate that HAuCl4 obtained from gold coatings recovered from e-waste processors has the purity required for use in nanoparticle synthesis, as the sizes and other properties are similar to those observed in Aldrich Au nanoparticles.
4. Conclusions
It is possible to dissolve 2 mg of Au coatings recovered from Intel Pentium-4 processors using only 10 mL of HCl 10 % v/v (1.21 mol L−1) and 50 μL of HNO3conc (0.08 mol L−1) by a conventional heating method. The size and shape of the gold affect the conditions for dissolution of gold coatings. The low amounts of acids used has several advantages over the methods with aqua regia, chlorine gas and HNO3 with different salts mentioned above, e.g., (1) zero NO2(g) emissions due to H2O2 traps, which allows the recovery of HNO3; (2) easy separation of gold coatings due to its density; (3) the possible use of Cu(NO3)2 in other processes; (4) the recovery of Sn as an oxide, which can be used as a semiconductor; and (5) this process does not generate waste. In addition, the HAuCl4 synthesized in this work shows the purity necessary for the synthesis of gold nanoparticles, with sizes and shapes similar to those obtained with Aldrich HAuCl4, which could contribute to the development of this area.
Although the method proposed in this work requires further studies for its industrial application, the results obtained can serve as a basis for developing a better e-waste recycling process.
Author Contributions
Conceptualization, J.S.-G.; methodology, J.S.-G.; software, J.S.-G.; validation, J.S.-G.; formal analysis, J.S.-G.; investigation, J.S.-G.; resources, L.M.-C., J.R.-A. and E.B.-A.; data curation, J.S.-G.; writing—original draft preparation, J.S.-G.; writing—review and editing, J.S.-G., L.M.-C. and J.R.-A.; visualization, J.S.-G.; supervision, E.B.-A.; project administration, E.B.-A.; funding acquisition, L.M.-C., J.R.-A. and E.B.-A. All authors have read and agreed to the published version of the manuscript.
Funding
This research received no external funding.
Institutional Review Board Statement
Not applicable.
Informed Consent Statement
Not applicable.
Data Availability Statement
The data presented in this study are available on request from the corresponding author.
Acknowledgments
The authors thank CONACYT for J. Su Gallegos’ PhD fellowship, technician Pablo López Arriaga for assistance with sample preparation, and Rebeca Méndez Hernández for English language assistance. This work was supported by UNAM project PAIP-5000-9014.
Conflicts of Interest
The authors declare no conflict of interest.
References
- Forti, V.; Baldé, C.P.; Kuehr, R.; Bel, G. The Global E-Waste Monitor 2020; International Telecommunication Union (ITU): Geneva, Switzerland; International Solid Waste Association (ISWA): Rotterdam, The Netherlands, 2020; ISBN 9789280891140. [Google Scholar]
- Ahirwar, R.; Tripathi, A.K. E-Waste Management: A Review of Recycling Process, Environmental and Occupational Health Hazards, and Potential Solutions. Environ. Nanotechnol. Monit. Manag. 2021, 15, 100409. [Google Scholar] [CrossRef]
- Xue, M.; Kendall, A.; Xu, Z.; Schoenung, J.M. Waste Management of Printed Wiring Boards: A Life Cycle Assessment of the Metals Recycling Chain from Liberation through Refining. Environ. Sci. Technol. 2015, 49, 940–947. [Google Scholar] [CrossRef] [PubMed]
- Ilankoon, I.M.S.K.; Ghorbani, Y.; Chong, M.N.; Herath, G.; Moyo, T.; Petersen, J. E-Waste in the International Context—A Review of Trade Flows, Regulations, Hazards, Waste Management Strategies and Technologies for Value Recovery. Waste Manag. 2018, 82, 258–275. [Google Scholar] [CrossRef] [PubMed]
- Oliveira, J.S.S.; Hacha, R.R.; D’almeida, F.S.; Almeida, C.A.; Moura, F.J.; Brocchi, E.A.; Souza, R.F.M. Electronic Waste Low-Temperature Processing: An Alternative Thermochemical Pretreatment to Improve Component Separation. Materials 2021, 14, 6228. [Google Scholar] [CrossRef]
- Kapoor, N.; Sulke, P.; Badiye, A. E-Waste Forensics: An Overview. Forensic Sci. Int. Anim. Environ. 2021, 1, 100034. [Google Scholar] [CrossRef]
- Li, J.; Gao, X.; He, Y.; Wang, L.; Wang, Y.; Zeng, L. Elevated Emissions of Melamine and Its Derivatives in the Indoor Environments of Typical E-Waste Recycling Facilities and Adjacent Communities and Implications for Human Exposure. J. Hazard. Mater. 2022, 432, 128652. [Google Scholar] [CrossRef]
- The United Nations Sustainable Development Goals. Available online: https://www.undp.org/sustainable-development-goals (accessed on 30 August 2022).
- Abdelbasir, S.M.; Hassan, S.S.M.; Kamel, A.H.; El-Nasr, R.S. Status of Electronic Waste Recycling Techniques: A Review. Environ. Sci. Pollut. Res. 2018, 25, 16533–16547. [Google Scholar] [CrossRef]
- Alzate, A.; López, M.E.; Serna, C. Recovery of Gold from Waste Electrical and Electronic Equipment (WEEE) Using Ammonium Persulfate. Waste Manag. 2016, 57, 113–120. [Google Scholar] [CrossRef]
- Cerecedo-Sáenz, E.; Cárdenas-Reyes, E.A.; Rojas-Calva, A.H.; Reyes-Valderrama, M.I.; Rodríguez-Lugo, V.; Toro, N.; Gálvez, E.; Acevedo-Sandoval, O.A.; Hernández-ávila, J.; Salinas-Rodríguez, E. Use of the O2-Thiosemicarbazide System, for the Leaching of: Gold and Copper from WEEE & Silver Contained in Mining Wastes. Materials 2021, 14, 7329. [Google Scholar] [CrossRef]
- Islam, A.; Ahmed, T.; Awual, M.R.; Rahman, A.; Sultana, M.; Aziz, A.A.; Monir, M.U.; Teo, S.H.; Hasan, M. Advances in Sustainable Approaches to Recover Metals from E-Waste-A Review. J. Clean. Prod. 2020, 244, 118815. [Google Scholar] [CrossRef]
- Wang, J.; Lu, Y.; Xu, Z. Identifying Extraction Technology of Gold from Solid Waste in Terms of Environmental Friendliness. ACS Sustain. Chem. Eng. 2019, 7, 7260–7267. [Google Scholar] [CrossRef]
- Sabir, S. The Recovery of Gold from Secondary Sources; Syed, S., Simpson, M., Eds.; Imperial College Press: Riyadh, Saudi Arabia, 2016; ISBN 9781783269907. [Google Scholar]
- Feng, F.; Liu, J.; Zhao, M.; Yu, L.; Wang, H.; Lu, C.; Zhang, Q.; Zhao, J.; Sun, Y.; Cen, J.; et al. Study of an Environmentally Friendly Method for the Dissolution of Precious Metal with Ionic Liquid and Iodoalkane. Metals 2021, 11, 919. [Google Scholar] [CrossRef]
- Wang, J.; Zeng, B.; Lv, J.; Lu, Y.; Chen, H. Environmentally Friendly Technology for Separating Gold from Waste Printed Circuit Boards: A Combination of Suspension Electrolysis and a Chlorination Process. ACS Sustain. Chem. Eng. 2020, 8, 16952–16959. [Google Scholar] [CrossRef]
- Yue, C.; Sun, H.; Liu, W.-J.; Guan, B.; Deng, X.; Zhang, X.; Yang, P. Environmentally Benign, Rapid, and Selective Extraction of Gold from Ores and Waste Electronic Materials. Angew. Chem. 2017, 129, 9459–9463. [Google Scholar] [CrossRef]
- Paclawski, K.; Fitzner, K. Kinetics of Gold (III) Chloride Complex Reduction Using Sulfur (IV). Metall. Mater. Trans. B 2004, 35, 1071–1085. [Google Scholar] [CrossRef]
- Doidge, E.D.; Carson, I.; Tasker, P.A.; Ellis, R.J.; Morrison, C.A.; Love, J.B. A Simple Primary Amide for the Selective Recovery of Gold from Secondary Resources. Angew. Chem.-Int. Ed. 2016, 55, 12436–12439. [Google Scholar] [CrossRef] [Green Version]
- Daruich De Souza, C.; Ribeiro Nogueira, B.; Rostelato, M.E.C.M. Review of the Methodologies Used in the Synthesis Gold Nanoparticles by Chemical Reduction. J. Alloy. Compd. 2019, 798, 714–740. [Google Scholar] [CrossRef]
- Louis, C.; Pluchery, O. Gold Nanoparticles for Physics, Chemistry and Biology, 1st ed.; Imperial College Press: Paris, France, 2012; ISBN 978-1-84816-806-0. [Google Scholar]
- Barragan, J.A.; Castro, J.R.A.; Peregrina-Lucano, A.A.; Sánchez-Amaya, M.; Rivero, E.P.; Larios-Durán, E.R. Leaching of Metals from E-Waste: From Its Thermodynamic Analysis and Design to Its Implementation and Optimization. ACS Omega 2021, 6, 12063–12071. [Google Scholar] [CrossRef]
- Hojo, M.; Uji-Yie, Y.; Tsubota, S.; Tamura, M.; Yamamoto, M.; Okamura, K.; Isshiki, K. Can Pure Gold Be Dissolved in Seawater Mixed with Aqueous Nitric Acid? J. Mol. Liq. 2014, 194, 68–76. [Google Scholar] [CrossRef]
- Hojo, M.; Yamamoto, M.; Okamura, K. Dilute Nitric or Nitrous Acid Solution Containing Halide Ions as Effective Media for Pure Gold Dissolution. Phys. Chem. Chem. Phys. 2015, 17, 19948–19956. [Google Scholar] [CrossRef]
- Hojo, M. Mechanism of Enhanced Oxidation Ability of Dilute Nitric Acid and Dissolution of Pure Gold in Seawater with Nitric Acid. Kharkiv Univ. Bull. Chem. Ser. 2019, 33, 6–22. [Google Scholar] [CrossRef] [Green Version]
- King, S.R.; Massicot, J.; McDonagh, A.M. A Straightforward Route to Tetrachloroauric Acid from Gold Metal and Molecular Chlorine for Nanoparticle Synthesis. Metals 2015, 5, 1454–1461. [Google Scholar] [CrossRef] [Green Version]
- EURACHEM; CITAC. Quantifying Uncertainty in Analytical Measurement, 2nd ed.; EURACHEM: Gembloux, Belgium, 2000. [Google Scholar]
- Liémans, I.; Alban, B.; Tranier, J.P.; Thomas, D. SOx and NOx Absorption Based Removal into Acidic Conditions for the Flue Gas Treatment in Oxy-Fuel Combustion. Energy Procedia 2011, 4, 2847–2854. [Google Scholar] [CrossRef] [Green Version]
- Liu, Y.; Wang, Q.; Pan, J. Novel Process of Simultaneous Removal of Nitric Oxide and Sulfur Dioxide Using a Vacuum Ultraviolet (Vuv)-Activated O2/H2O/H2O2 System in a Wet Vuv−spraying Reactor. Environ. Sci. Technol. 2016, 50, 12966–12975. [Google Scholar] [CrossRef] [PubMed]
- Ding, J.; Zhong, Q.; Zhang, S.; Song, F.; Bu, Y. Simultaneous Removal of NOX and SO2 from Coal-Fired Flue Gas by Catalytic Oxidation-Removal Process with H2O2. Chem. Eng. J. 2014, 243, 176–182. [Google Scholar] [CrossRef]
- Intel. Intel® Pentium® 4 Processor with 512-KB L2 Cache on 0.13 Micron Process and Intel® Pentium® 4 Processor Extreme Edition Supporting Hyper-Threading Technology; Intel Corp.: Santa Clara, CA, USA, 2004; pp. 1–85. [Google Scholar]
- Aldrich Gold Nanoparticles: Properties and Applications. Available online: https://www.sigmaaldrich.com/MX/es/technical-documents/technical-article/materials-science-and-engineering/biosensors-and-imaging/gold-nanoparticles (accessed on 6 September 2022).
- Schneider, C.A.; Rasband, W.S.; Eliceiri, K.W. NIH Image to ImageJ: 25 Years of Image Analysis. Nat. Methods 2012, 9, 671–675. [Google Scholar] [CrossRef] [PubMed]
Figure 1.
Experimental setup for the recovery of gold coatings from e-waste processor pins.

Figure 2.
Scanning electron micrographs of: (a) inner body and base of a pin at 40× and 500× magnification, respectively; (b) inner body at 500× magnification (c) elemental maps of a section close to the coating inside the inner body of the pin; and (d) elemental map of the gold coating. The white box on the right indicates the area where elemental mapping was performed, and the box on the left shows where the chemical analysis of the base was performed.

Figure 3.
(a) Reaction tube after acid digestion with HNO3conc, (b) recovered gold coatings and (c) CuO filtration after complexing and precipitation reactions.
Figure 3.
(a) Reaction tube after acid digestion with HNO3conc, (b) recovered gold coatings and (c) CuO filtration after complexing and precipitation reactions.

Figure 4.
X-ray diffraction patterns of (a) Cu products (JCPDS files: 04-0836, 05-0667 and 48-1548 for Cu, Cu2O and CuO, respectively), (b) Sn products (JCPDS file: 41-1445 for SnO2) and (c) Au coatings recovered from batches 1, 2 and 3 (JCPDS file: 04-0836 for Au).
Figure 4.
X-ray diffraction patterns of (a) Cu products (JCPDS files: 04-0836, 05-0667 and 48-1548 for Cu, Cu2O and CuO, respectively), (b) Sn products (JCPDS file: 41-1445 for SnO2) and (c) Au coatings recovered from batches 1, 2 and 3 (JCPDS file: 04-0836 for Au).

Figure 5.
Scanning electron micrograph of SnO2 with Au particles on its surface.

Figure 6.
UV-Vis calibration curves between 310 and 320 nm.

Figure 7.
Cyclic voltammograms of (a) HAuCl4 synthesized compared to Aldrich’s reagent (pH1.1 = 0.60, pH1.2 = 0.78 and pHAldrich = 0.5), (b) Aldrich HAuCl4 with and without the presence of CuCl2 (pH = 0.69), (c) Aldrich HAuCl4 with and without the presence of NiCl2 (pH = 0.74) and (d) Aldrich HAuCl4 with and without the presence of FeCl3 (pH = 0.77).

Figure 8.
Absorption spectra of Au nanoparticles obtained from the coatings (black line) and from Aldrich’s reagent (blue line).
Figure 8.
Absorption spectra of Au nanoparticles obtained from the coatings (black line) and from Aldrich’s reagent (blue line).

Figure 9.
Transmission electron micrograph of gold nanoparticles obtained from (a) Aldrich reagent and (b) gold coatings; (c) length and (d) width of Au nanoparticles from Aldrich, and (e) length and (f) width of Au nanoparticles obtained from coatings.
Figure 9.
Transmission electron micrograph of gold nanoparticles obtained from (a) Aldrich reagent and (b) gold coatings; (c) length and (d) width of Au nanoparticles from Aldrich, and (e) length and (f) width of Au nanoparticles obtained from coatings.


Table 1.
Chemical composition of the single pin by EDS analysis of the inner body, gold coating and base. Standard deviation is shown in parentheses.
Table 1.
Chemical composition of the single pin by EDS analysis of the inner body, gold coating and base. Standard deviation is shown in parentheses.
| Elements/Inner Body | Wt% |
|---|---|
| Cu | 96.05 (2.98) |
| Ni * | 1.72 (0.00) |
| Fe | 2.23 (0.04) |
| Elements/gold coating | Wt% |
| Au | 100 (0.0) |
| Elements/base | Wt% |
| Sn | 100 (0.0) |
* Detected in one point near the surface.
Table 2.
Chemical composition by MP-AES analysis of the digestion of 478 pins with aqua regia.
| Element | Au | Ni | Fe | Cu |
|---|---|---|---|---|
| Mass contained (g) | 0.0199 | 0.1050 | 0.0019 | 2.0611 |
| Percent (Wt%) | 0.9 | 4.8 | 0.1 | 94.2 |
Table 3.
Mass and MP-AES efficiencies of the products obtained in batches 1, 2 and 3.
| Variables | Batch 1 | Batch 2 | Batch 3 |
|---|---|---|---|
| Pins mass (g) | 2.5119 (0.0004) | 2.5392 (0.0004) | 2.6118 (0.0002) |
| Au recovered (g) | 0.0164 (0.0002) | 0.0151 (0.0002) | 0.0204 (0.0002) |
| Cu recovered (g) | 1.9318 (0.0004) | 1.7865 (0.0002) | 1.6611 (0.0002) |
| Sn recovered (g) | 0.4834 (0.0008) | 0.0976 (0.0002) | 0.2485 (0.0004) |
| mT recovered (g) | 2.4316 (0.0008) | 1.8992 (0.0004) | 1.9300 (0.0005) |
| mT efficiency (%) | 96.80 (1.48) | 74.79 (1.24) | 73.90 (0.72) |
| MP-AES efficiency * (%) | 89.05 (0.02) | 82.35 (0.02) | 76.86 (0.02) |
* Only Au and Cu masses and their uncertainties were considered [27].
Table 4.
Concentration of Au, Ni and Cu obtained by MP-AES, and concentration of HAuCl4 obtained by the calibration curve of products 1.1 and 1.2.
Table 4.
Concentration of Au, Ni and Cu obtained by MP-AES, and concentration of HAuCl4 obtained by the calibration curve of products 1.1 and 1.2.
| Variables | Synthesis 1.1 | Synthesis 1.2 |
|---|---|---|
| [HAuCl4] (mM) * | 1.04 (0.03) | 0.96 (0.03) |
| Au dissolved percent (%) | 101.9 (17.1) | 105.2 (21.1) |
| [Au]MP-AES (mM) * | 1.04 | 0.95 |
| [Ni]MP-AES | 0.08 μM * (0.48 ppm) | 0.12 μM * (0.73 ppm) |
| [Cu]MP-AES | 0.32μM * (2.03 ppm) | 0.87 μM * (5.51 ppm) |
* mM = mol L−1 × 10⁻³ and μM = mol L−1 × 10⁻⁶.
Table 5.
Chemical composition by MP-AES analysis of the HAuCl4 before and after the evaporation cycles.
Table 5.
Chemical composition by MP-AES analysis of the HAuCl4 before and after the evaporation cycles.
| Element | Au | Ni | Fe | Cu |
|---|---|---|---|---|
| Concentration before | 1.07 mM * | ND | ND | 0.25 ppm |
| Concentration after | 0.63 mM * | ND | 2.5 ppm | 1.25 ppm |
* mM = mol L−1 × 10⁻³.
Publisher’s Note: MDPI stays neutral with regard to jurisdictional claims in published maps and institutional affiliations. |
© 2022 by the authors. Licensee MDPI, Basel, Switzerland. This article is an open access article distributed under the terms and conditions of the Creative Commons Attribution (CC BY) license (https://creativecommons.org/licenses/by/4.0/).
Share and Cite
MDPI and ACS Style
Su-Gallegos, J.; Magallón-Cacho, L.; Ramírez-Aparicio, J.; Borja-Arco, E. Synthesis of Gold Nanoparticles from Gold Coatings Recovered from E-Waste Processors. Materials 2022, 15, 7307. https://doi.org/10.3390/ma15207307
AMA Style
Su-Gallegos J, Magallón-Cacho L, Ramírez-Aparicio J, Borja-Arco E. Synthesis of Gold Nanoparticles from Gold Coatings Recovered from E-Waste Processors. Materials. 2022; 15(20):7307. https://doi.org/10.3390/ma15207307
Chicago/Turabian StyleSu-Gallegos, Javier, Lorena Magallón-Cacho, Jeannete Ramírez-Aparicio, and Edgar Borja-Arco. 2022. "Synthesis of Gold Nanoparticles from Gold Coatings Recovered from E-Waste Processors" Materials 15, no. 20: 7307. https://doi.org/10.3390/ma15207307
Note that from the first issue of 2016, this journal uses article numbers instead of page numbers. See further details here.