Article

Optimized XGBoost Model with Small Dataset for Predicting Relative Density of Ti-6Al-4V Parts Manufactured by Selective Laser Melting

1
School of Aeronautical Manufacturing Engineering, Nanchang Hangkong University, Nanchang 330063, China
2
Department of Materials Science, Shenzhen MSU-BIT University, Shenzhen 518172, China
3
School of Aircraft Engineering, Nanchang Hangkong University, Nanchang 330063, China
*
Author to whom correspondence should be addressed.
Materials 2022, 15(15), 5298; https://doi.org/10.3390/ma15155298
Submission received: 17 June 2022 / Revised: 20 July 2022 / Accepted: 27 July 2022 / Published: 1 August 2022

Abstract

:
Determining the quality of Ti-6Al-4V parts fabricated by selective laser melting (SLM) remains a challenge due to the high cost of SLM and the need for expertise in processes and materials. In order to understand the correspondence of the relative density of SLMed Ti-6Al-4V parts with process parameters, an optimized extreme gradient boosting (XGBoost) decision tree model was developed in the present paper using hyperparameter optimization with the GridsearchCV method. In particular, the effect of the size of the dataset for model training and testing on model prediction accuracy was examined. The results show that with the reduction in dataset size, the prediction accuracy of the proposed model decreases, but the overall accuracy can be maintained within a relatively high accuracy range, showing good agreement with the experimental results. Based on a small dataset, the prediction accuracy of the optimized XGBoost model was also compared with that of artificial neural network (ANN) and support vector regression (SVR) models, and it was found that the optimized XGBoost model has better evaluation indicators such as mean absolute error, root mean square error, and the coefficient of determination. In addition, the optimized XGBoost model can be easily extended to the prediction of mechanical properties of more metal materials manufactured by SLM processes.

1. Introduction

The Ti-6Al-4V titanium alloy is widely used in chemical, aviation, and medical fields due to its excellent mechanical properties such as high strength and high toughness, as well as its low elastic modulus and corrosion resistance [1]. However, the high cost and challenging machinability of complex components of the Ti-6Al-4V alloy restrict its applications when fabricated by traditional fabrication methods such as casting and forging [2]. Additive manufacturing (AM) is gaining increasing attention from both academia and industry due to its unique advantages over traditional isomaterial and subtractive manufacturing.
Selective laser melting (SLM) is an attractive manufacturing process for defense and other industries due to its advantages in energy utilization, absorption rate, vacuum protection, and production efficiency [1,3,4]. At present, the SLM process has been widely used in the manufacturing of Ti-6Al-4V alloys [5,6]. With the SLM process, many parameters including the laser scanning speed, laser power, hatch distance, and powder layer thickness, etc., may affect the final quality of printed products [7,8,9,10], and the ranges of these parameters are quite wide, making experiments for data collection more time-consuming and tedious. Numerous studies have reported the fabrication of high-density Ti-6Al-4V parts via SLM with different process parameters [11,12,13], and their results showed differences in the parts’ density.
Many authors have attempted to optimize SLM process parameters using various algorithms, such as direct optimization [14] and Doehlert matrix design [15]. Clearly, it is not appropriate to study process parameters independently, as the performance of the printed parts is a function of several interacting key process parameters.
In recent decades, machine learning (ML) technology has made great strides and has gone beyond the scope of computer science because it can provide a new approach to solving traditional engineering problems [16]. Dataset-based ML methods have some unique applications in the field of additive manufacturing [17,18] because of their unique advantages in data processing with high accuracy in data prediction [19].
Extreme Gradient Boosting (XGBoost), a machine learning technique, first proposed by Chen and Guestrin [20], has performed well in numerous data mining competitions due to its ability to analyze certain important parameters in the model and easily interpret the predicted output. The XGBoost-based model is a massively parallel boosted tree mode, and is currently the fastest and best boosted tree model. It is more than 10 times faster than ordinary models and has been widely used in many fields.
Some studies [21,22] have shown that XGBoost is superior to other algorithms in handling tabular datasets, such as artificial neural networks (ANN) and support vector regression (SVR), which usually require large-scale datasets in the form of pictures or videos. More recently, Duan et al. [23] used XGBoost, ANN, and SVR to predict the compressive strength of recycled aggregate concrete, and they indicated that XGBoost is better than other algorithms and the XGBoost decision tree algorithm has a very good ability to solve nonlinear regression problems.
Prominent applications of XGBoost decision trees can be found in Dong et al. [24] at the material level and Lim and Chi [25] at the structural level. Because of the recognized accuracy, XGBoost has also been used in the field of additive manufacturing in recent years. For example, Zhang et al. [26] combined XGBoost and long short-term memory (LSTM) to accurately predict the temperature in a molten pool. Through the XGBoost method, Peng et al. [27] constructed relationship mapping between the physical characteristics of defects and fatigue life of AM parts.
Conventional ML methods rely on big data [28,29], but the acquisition of big data is difficult and costly, so building ML methods for small data is particularly necessary. Yu et al. [30] developed a deep neural network (DNN) to accurately predict the tensile strength of aluminum alloys as a function of the chemical composition and process parameters with a small dataset. Normally in ML models, it is difficult to describe features with few eigenvalues, but in Yu’s work, many eigenvalues were involved [30], meaning more features were required in the manufacturing processes, and thus increasing the difficulty of obtaining the data.
For practicality and generality, this paper developed an optimized XGBoost regression tree algorithm based on supervised learning to predict the relative density of SLMed Ti-6Al-4V parts with a small dataset using hyperparameter optimization with the GridsearchCV method. Four key SLM process parameters, including the laser scanning speed, laser power, hatch distance, and powder layer thickness for regression, were used to predict the relative density of SLMed Ti-6Al-4V parts. The prediction accuracy of the proposed optimized XGBoost method was evaluated in terms of evaluation indicators such as the mean absolute error (MAE), root mean squared error (RMSE), and coefficient of determination ( R 2 ) and was then compared with other conventional ML algorithms such as DNN [30] and SVR [31]. Determining the quality of SLMed Ti-6Al-4V parts remains a challenge due to the high cost of SLM and the need for expertise in processes and materials, which is aptly addressed by this work. The proposed optimized XGBoost model provides an alternative solution to accurately predict the relative density of SLMed Ti-6Al-4V parts with only four SLM process parameters based on a small dataset. Although this paper only discussed the application of the XGBoost model in predicting the relative density of SLMed Ti-6Al-4V parts, the optimized XGBoost model proposed in this paper can be easily extended to predict the mechanical properties of many more metallic materials fabricated by the SLM process. Therefore, the machine learning model proposed in this paper can be widely applied in the metal SLM industry.

2. Method

2.1. Experimental Dataset
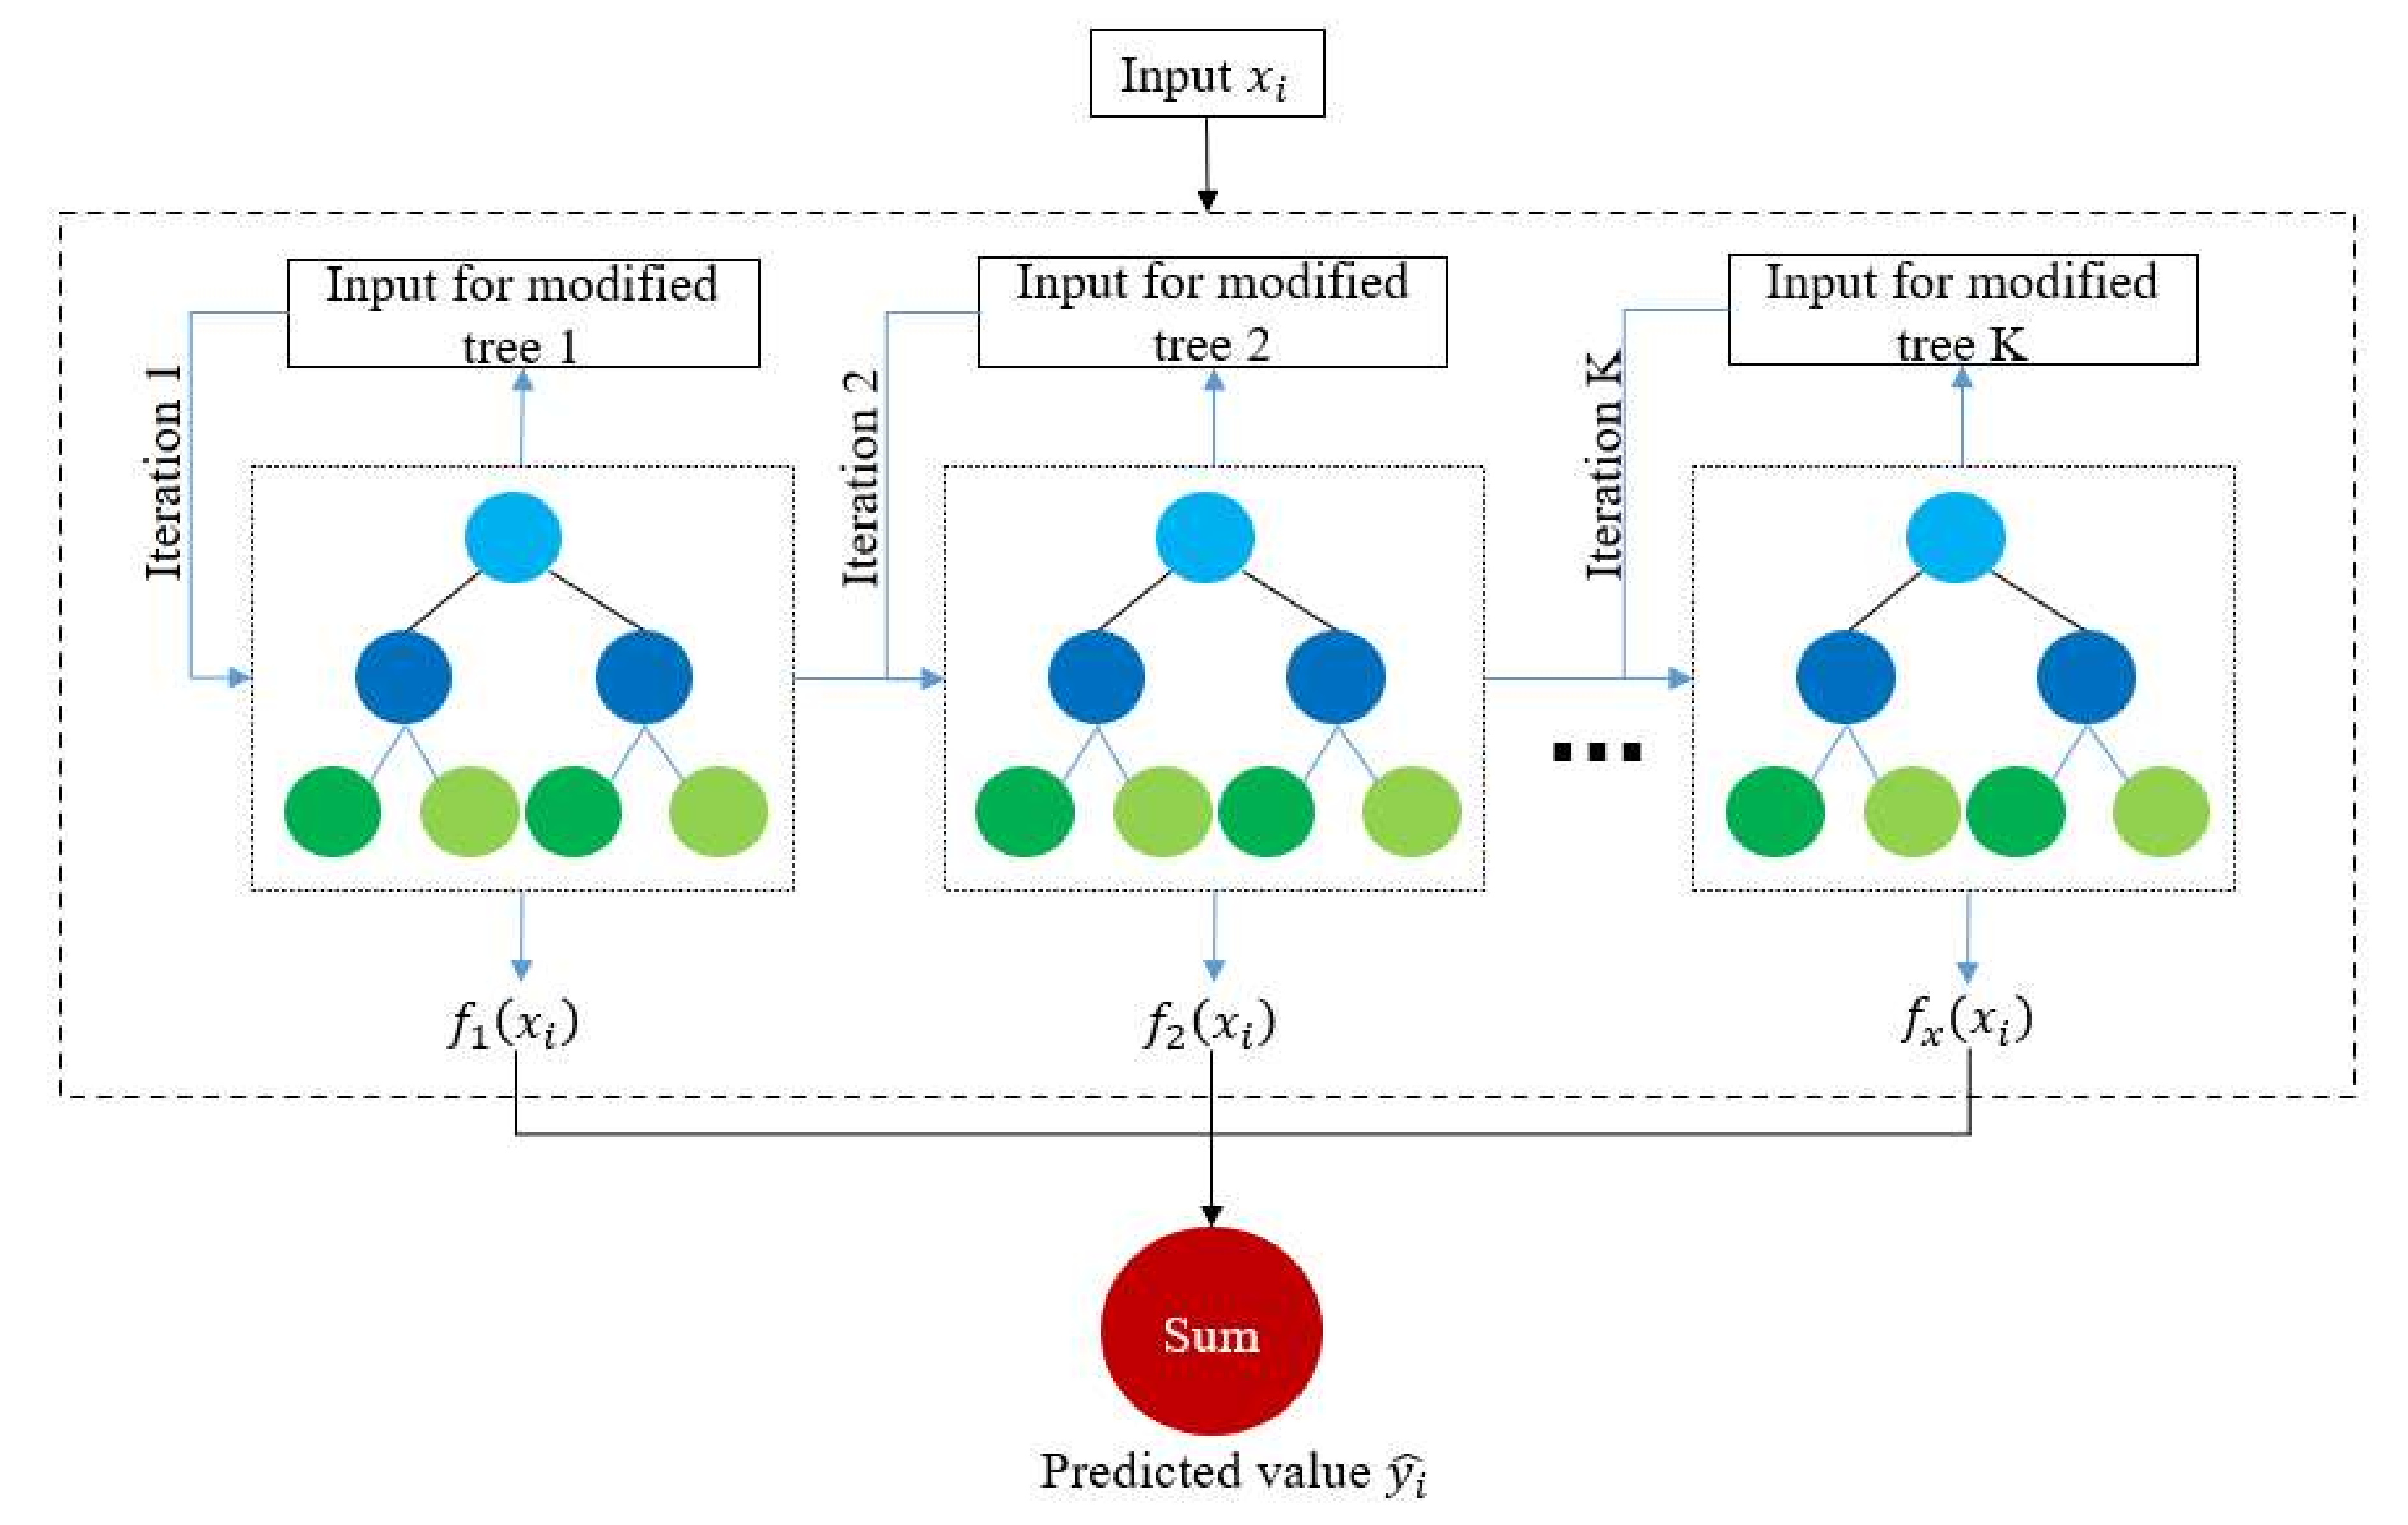
The material for this study is the titanium-alloy Ti-6Al-4V ELI, which is supplied in powder form. The specific composition of Ti-6Al-4V ELI is listed in Table 1.
Choosing which experimental test dataset to use is very important to the machine learning process. The experimental dataset must be broad enough and representative of the question being studied [32]. Nguyen et al. [29] extended the original test data of 2048 sets to obtain 54,054 sets of relative density data of Ti-6Al-4V parts corresponding to the SLM process parameters. The same method was used here to obtain 54,054 sets of relative density data with the values of the laser scanning speed, laser power, hatch distance, and power layer thickness as eigenvalues via the neural network method using python programming language and the TensorFlow library. The ranges for each parameter chosen based on experience and certain references [33,34,35] are listed in Table 2.

2.2. XGBoost Model

The XGBoost algorithm utilizes many classification and regression trees (CARTs) to solve regression and classification problems. In this study, the prediction of the relative density of SLMed Ti-6Al-4V parts is a logistic regression problem. The XGBoost model is a strong regressor fused by many CART regression tree models. As shown in Figure 1, the structure of XGBoost includes multiple root nodes, internal nodes, leaf nodes, and branches. In this structure, the i-th parameter x i is input and passed to all root nodes of all CARTs to make the original decisions. Then, the internal nodes make subsequent decisions, the branch points point directly to the decision to be made, and the leaf nodes represent the prediction results of a single CART. Finally, the results of all leaf-pointing nodes are combined to obtain the prediction results of the XGBoost model [36].
As an example, in the i-th set x i , y i ( x i is the input data with multiple features, y i is the real value of the trial), the XGBoost regression tree model is expressed mathematically as [20]
y i ^ = α k = 1 K f k x i
where y i   ^ is the predicted value corresponding to input x i , α is the learning rate of the individual regression tree, K is the total number of CARTs being used, and f k is the output of the k-th regression tree. Equation (1) shows that the predicted score y i ^ is the sum of all f k values.
After obtaining the prediction result, the objective function L was used to evaluate the quality of the obtained results, denoted as [37]
  L = i n l ( y i , y i ^ ) + k = 1 K Ω f x
The objective function consists of two parts: (1) The loss function l, measuring the loss between y i ^ and y i and (2) the regularization item Ω, determining the complexity of the regression tree structure. For a CART, Ω was expressed as
Ω f = γ T + 1 2 λ j = 1 T ω j 2
where T is the total number of leaf nodes of CARTs, ω j represents the predicted value of the j-th leaf node, and γ and λ are controlling factors employed to avoid overfitting.
To optimize the objective function and obtain the best prediction results, the XGBoost model was trained, and the optimization process was carried out step-by-step. In each step, the objective function was further reduced by generating new CART from the existing CARTs. The existing CARTs were first replaced by the constant c, and the equation was then subjected to second-order Taylor expansion. Based on the L t 1 obtained in the previous step, the objective function L t for the t-th step was calculated as
L t = i n [ l ( y i , y i ^ t 1 + g i f t x i + 1 2 h i f t 2 x i ) ] + Ω f t + c
where
  g i = l y i , y i ^ t 1 y i ^ t 1
h i = 2 l y i , y i ^ t 1 y i ^ t 1 2
In this study, the loss function chooses the residual standard error (RSE). Each input variable x i was mapped to a leaf node of a CART, so f k x i was expressed as
f k x i = ω q x i , ω R T , q x i : R d 1 , 2 , T
where   ω is the value of this specific leaf node, q x i is the index of a specific leaf node, d is the eigenvalue of the input x i , R T represents a T-dimensional vector, and R d represents a d-dimensional vector. The first derivative was calculated by substituting Equations (3) and (5)–(7) into Equation (4).
Letting G j = i I j g i and   H j = i I j h i , when   ω j = G j H j + λ ,   L m i n was written as,
L m i n = 1 2 j = 1 T G j 2 H j + λ + γ T + c
Therefore, the optimal value of the objective function L was the predicted value displayed on the leaf nodes, and in order to find the optimal structure for each CART, a greedy algorithm was used to optimize the regression tree structure [38].

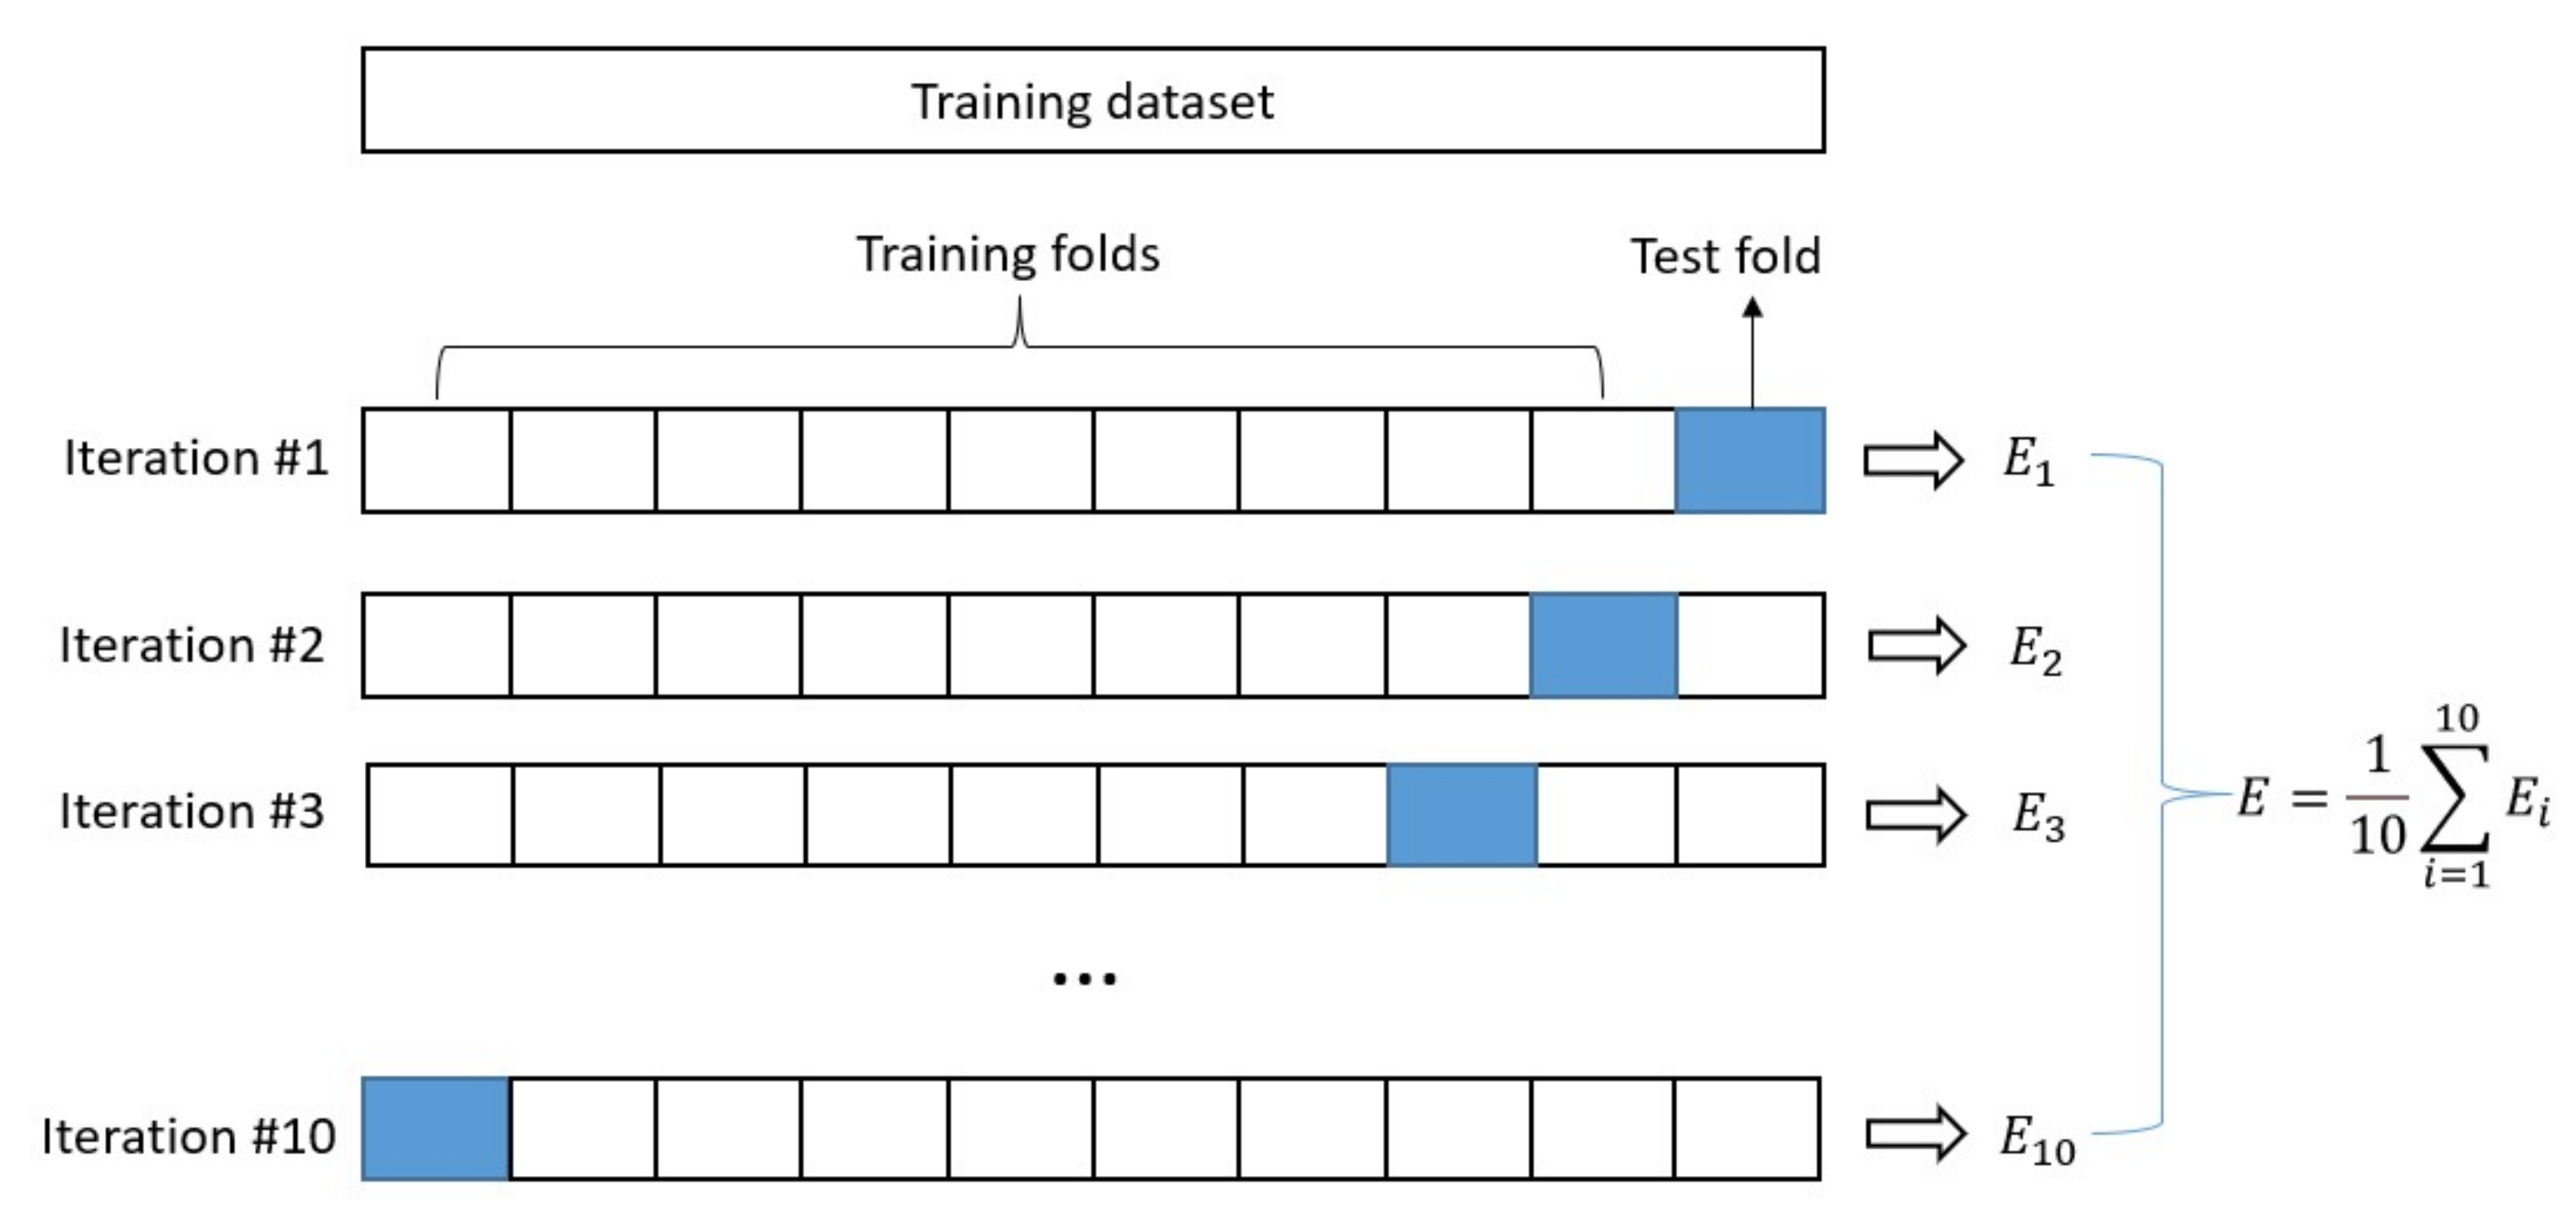
2.3. Hyperparameter Optimization with GridsearchCV Method

According to the principle of XGBoost, certain hyperparameters, including the maximum tree depth d m a x   ( e . g . ,   d m a x = 3 in Figure 1), α in Equation (1), K in Equation (1), γ in Equation (3), and λ in Equation (3), play a crucial role in the pros and cons of the XGBoost algorithm. The random initial values of these hyperparameters in this paper were given as follows:   d m a x = 3 , α = 0.3 ,   K = 300 ,   and   γ = λ = 0 .
Figure 2 shows the ten-fold cross-validation used to evaluate the model. Once the values of the hyperparameter set are brought into the XGBoost model, the corresponding model is generated based on the training dataset. In this work, a ten-fold cross-validation approach was employed to improve the training accuracy by randomly dividing the training dataset into ten different subsets. The established XGBoost model was then trained and evaluated ten times, each time selecting nine subsets for training and another for evaluation. Finally, an array of ten evaluation scores (E) and their averages were obtained.
After the model was constructed, the accuracy of the established XGBoost model was evaluated based on the basic evaluation indicators of the three regression tasks, such as MAE, RMSE, and R 2 , which were defined as
MAE y , y ^ = 1 n i = 1 n y i y i ^
RMSE y , y ^ = 1 n i = 1 n y i y i ^ 2
R 2 y , y ^ = 1 i = 1 n y i y i ^ 2 i = 1 n y i y i ¯ 2
where y represents the experimental values, y ^   represents the values predicted by the model, and y ¯ represents the average values across the dataset.
The initial XGBoost model was established and the hyperparameters were fine-tuned using the GridsearchCV method. GridsearchCV is divided into a grid search (GridSearch) and cross-validation (CV). GridSearch is used to search for hyperparameters, that is, within the specified parameter range, and adjusts the hyperparameters in turn by step size, trains the estimator with the adjusted hyperparameters, and finds the hyperparameters with the highest accuracy in the datasets of all hyperparameters through continuous testing. The ten-fold cross-validation shown in Figure 2 was used in the CV method.
To narrow the search range and improve the efficiency of fine-tuning, a broad range of hyperparameters with different tolerances was first roughly searched on the basis of the original values, and then a fuzzy range was determined for each hyperparameter, where the tolerance ensured the accuracy of the search. Finally, all possible hyperparameter combinations were evaluated. The ranges of hyperparameters and common differences for model fine-tuning are listed in Table 3.
We combined the GridsearchCV method with the XGBoost algorithm and optimized five hyperparameters including the maximum depth d m a x   of the tree, the learning rate α , the total number K of CARTs being used, the regression coefficient γ, and the weight coefficient λ by using the ten-fold cross-validation approach. Then, the test dataset was applied to the determined optimized model to evaluate its prediction accuracy and obtain the final best estimator and its hyperparameter.

3. Results and Discussion

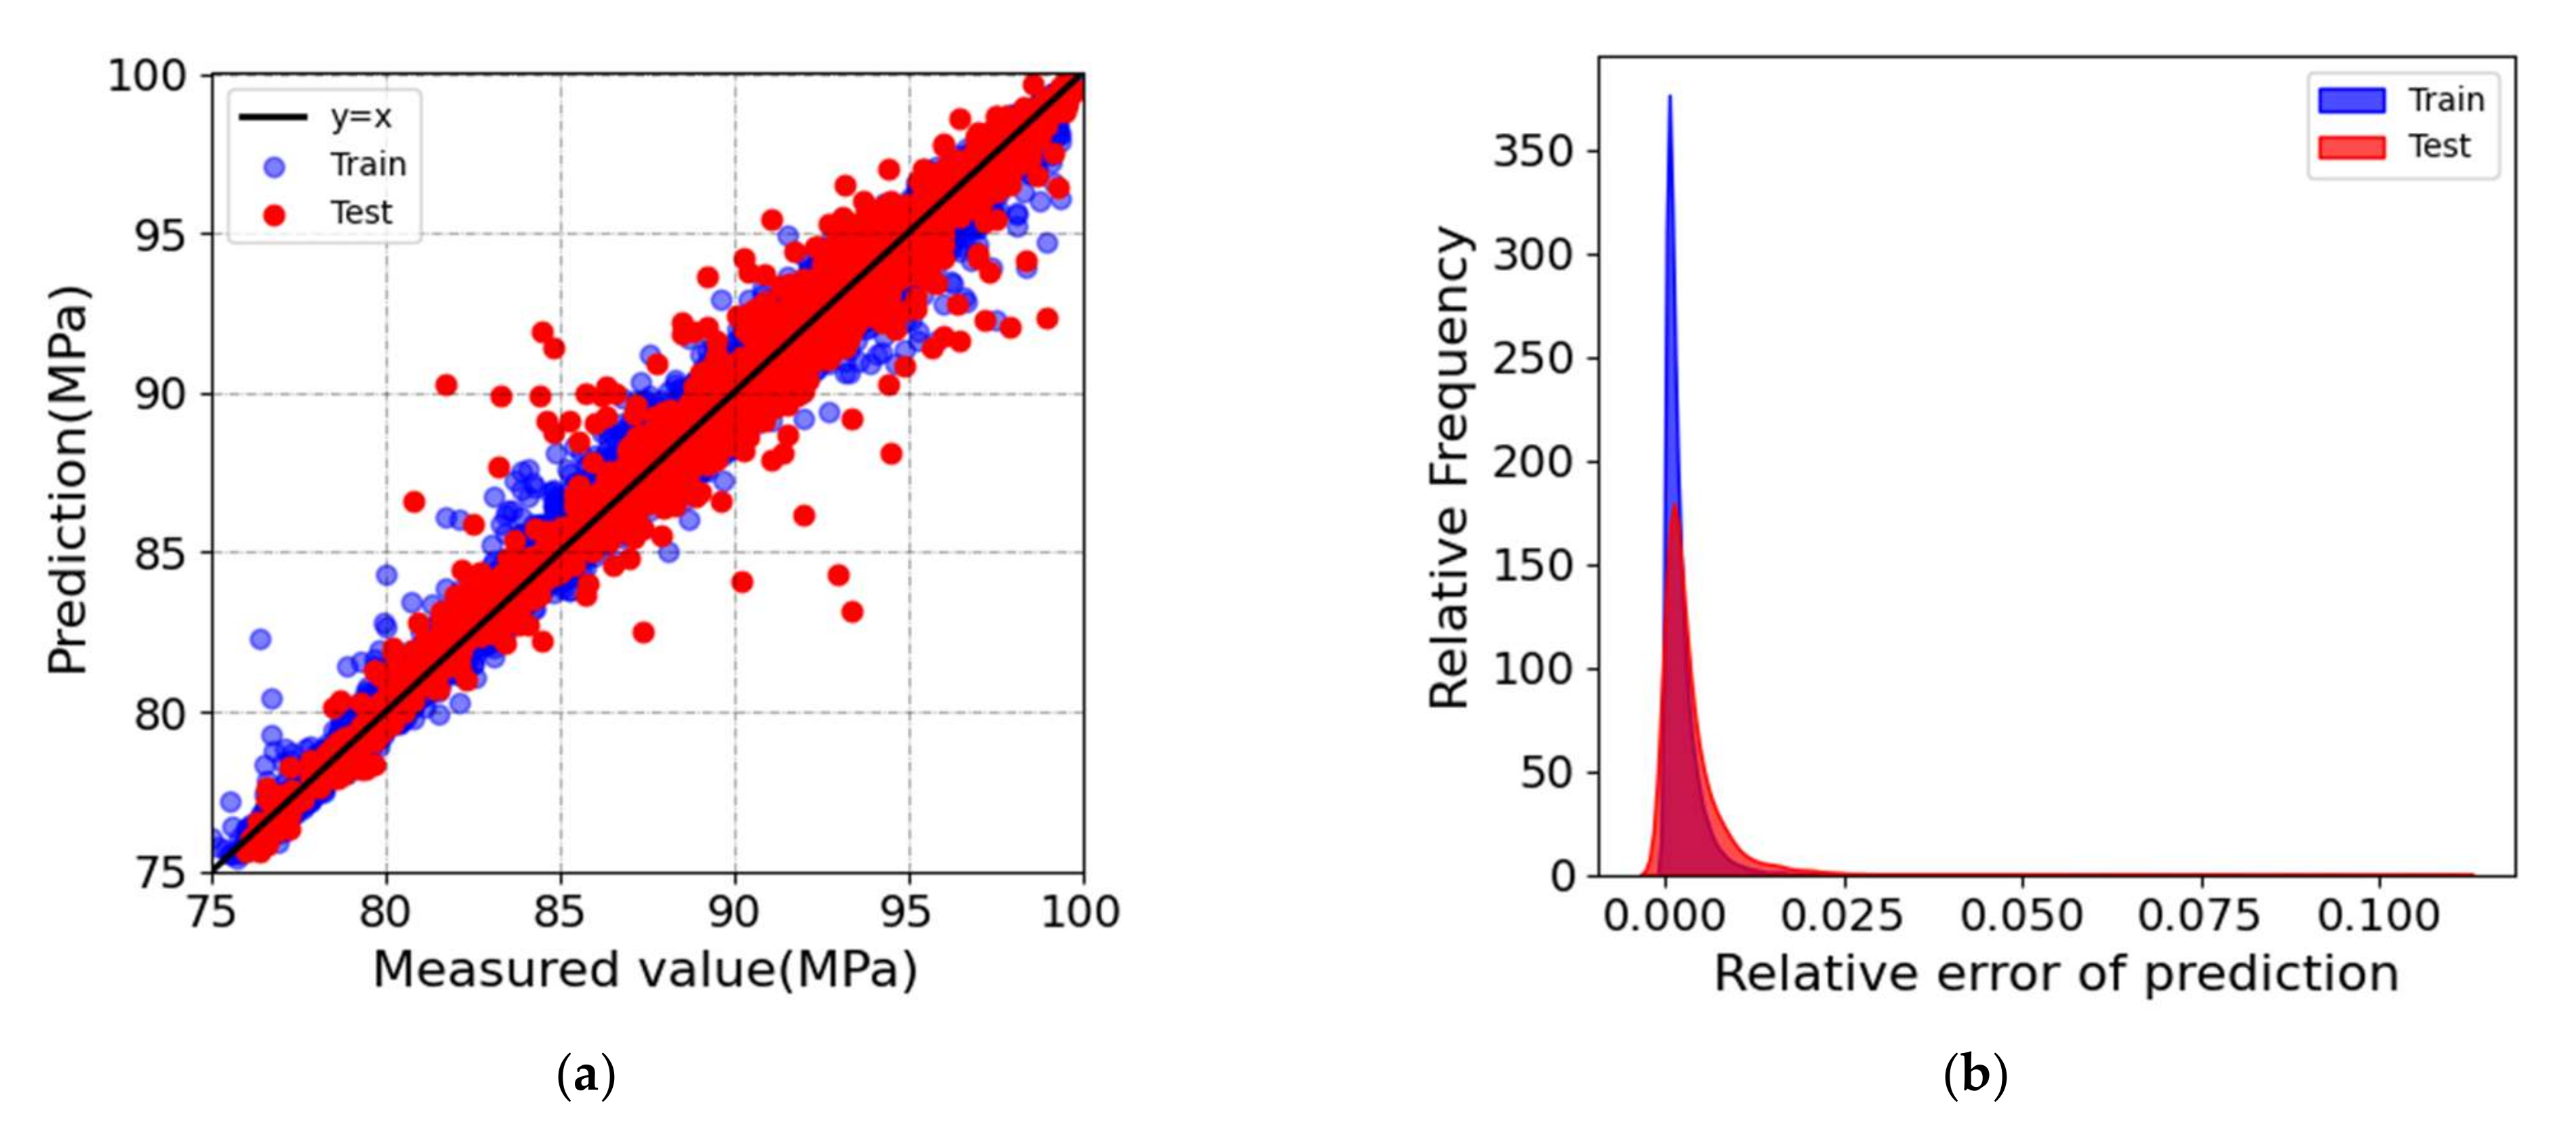
3.1. Performance of the Optimized XGBoost Model

The best-estimated model was achieved once the best combination of hyperparameters was determined. It was then evaluated on the training and the test dataset, respectively. A dataset of 54,054 sets was generated using a Python script, which was randomly divided into training and test parts with a ratio of 8:2. Using the dataset, the depth of the XGBoost decision tree model was adjusted to 8, the learning rate was adjusted to 0.05, and the XGBoost model was trained using an ensemble of 300 regression trees. Figure 3 shows the prediction accuracy of the trained XGBoost model on the training dataset and unseen test dataset, with a total dataset size of 54,054. As shown in Figure 3a, most of the predicted points were distributed close to the straight line of y = x. Figure 3b plots the relative error distribution of the model on the training dataset and the unseen test dataset, indicating that the relative errors of the model in the training set and the test set were relatively small, and the overall prediction results were satisfactory. It could be concluded that the trained optimized XGBoost model can effectively provide an accurate relationship map between the relative density of the SLMed Ti-6Al-4V parts and the process parameters.

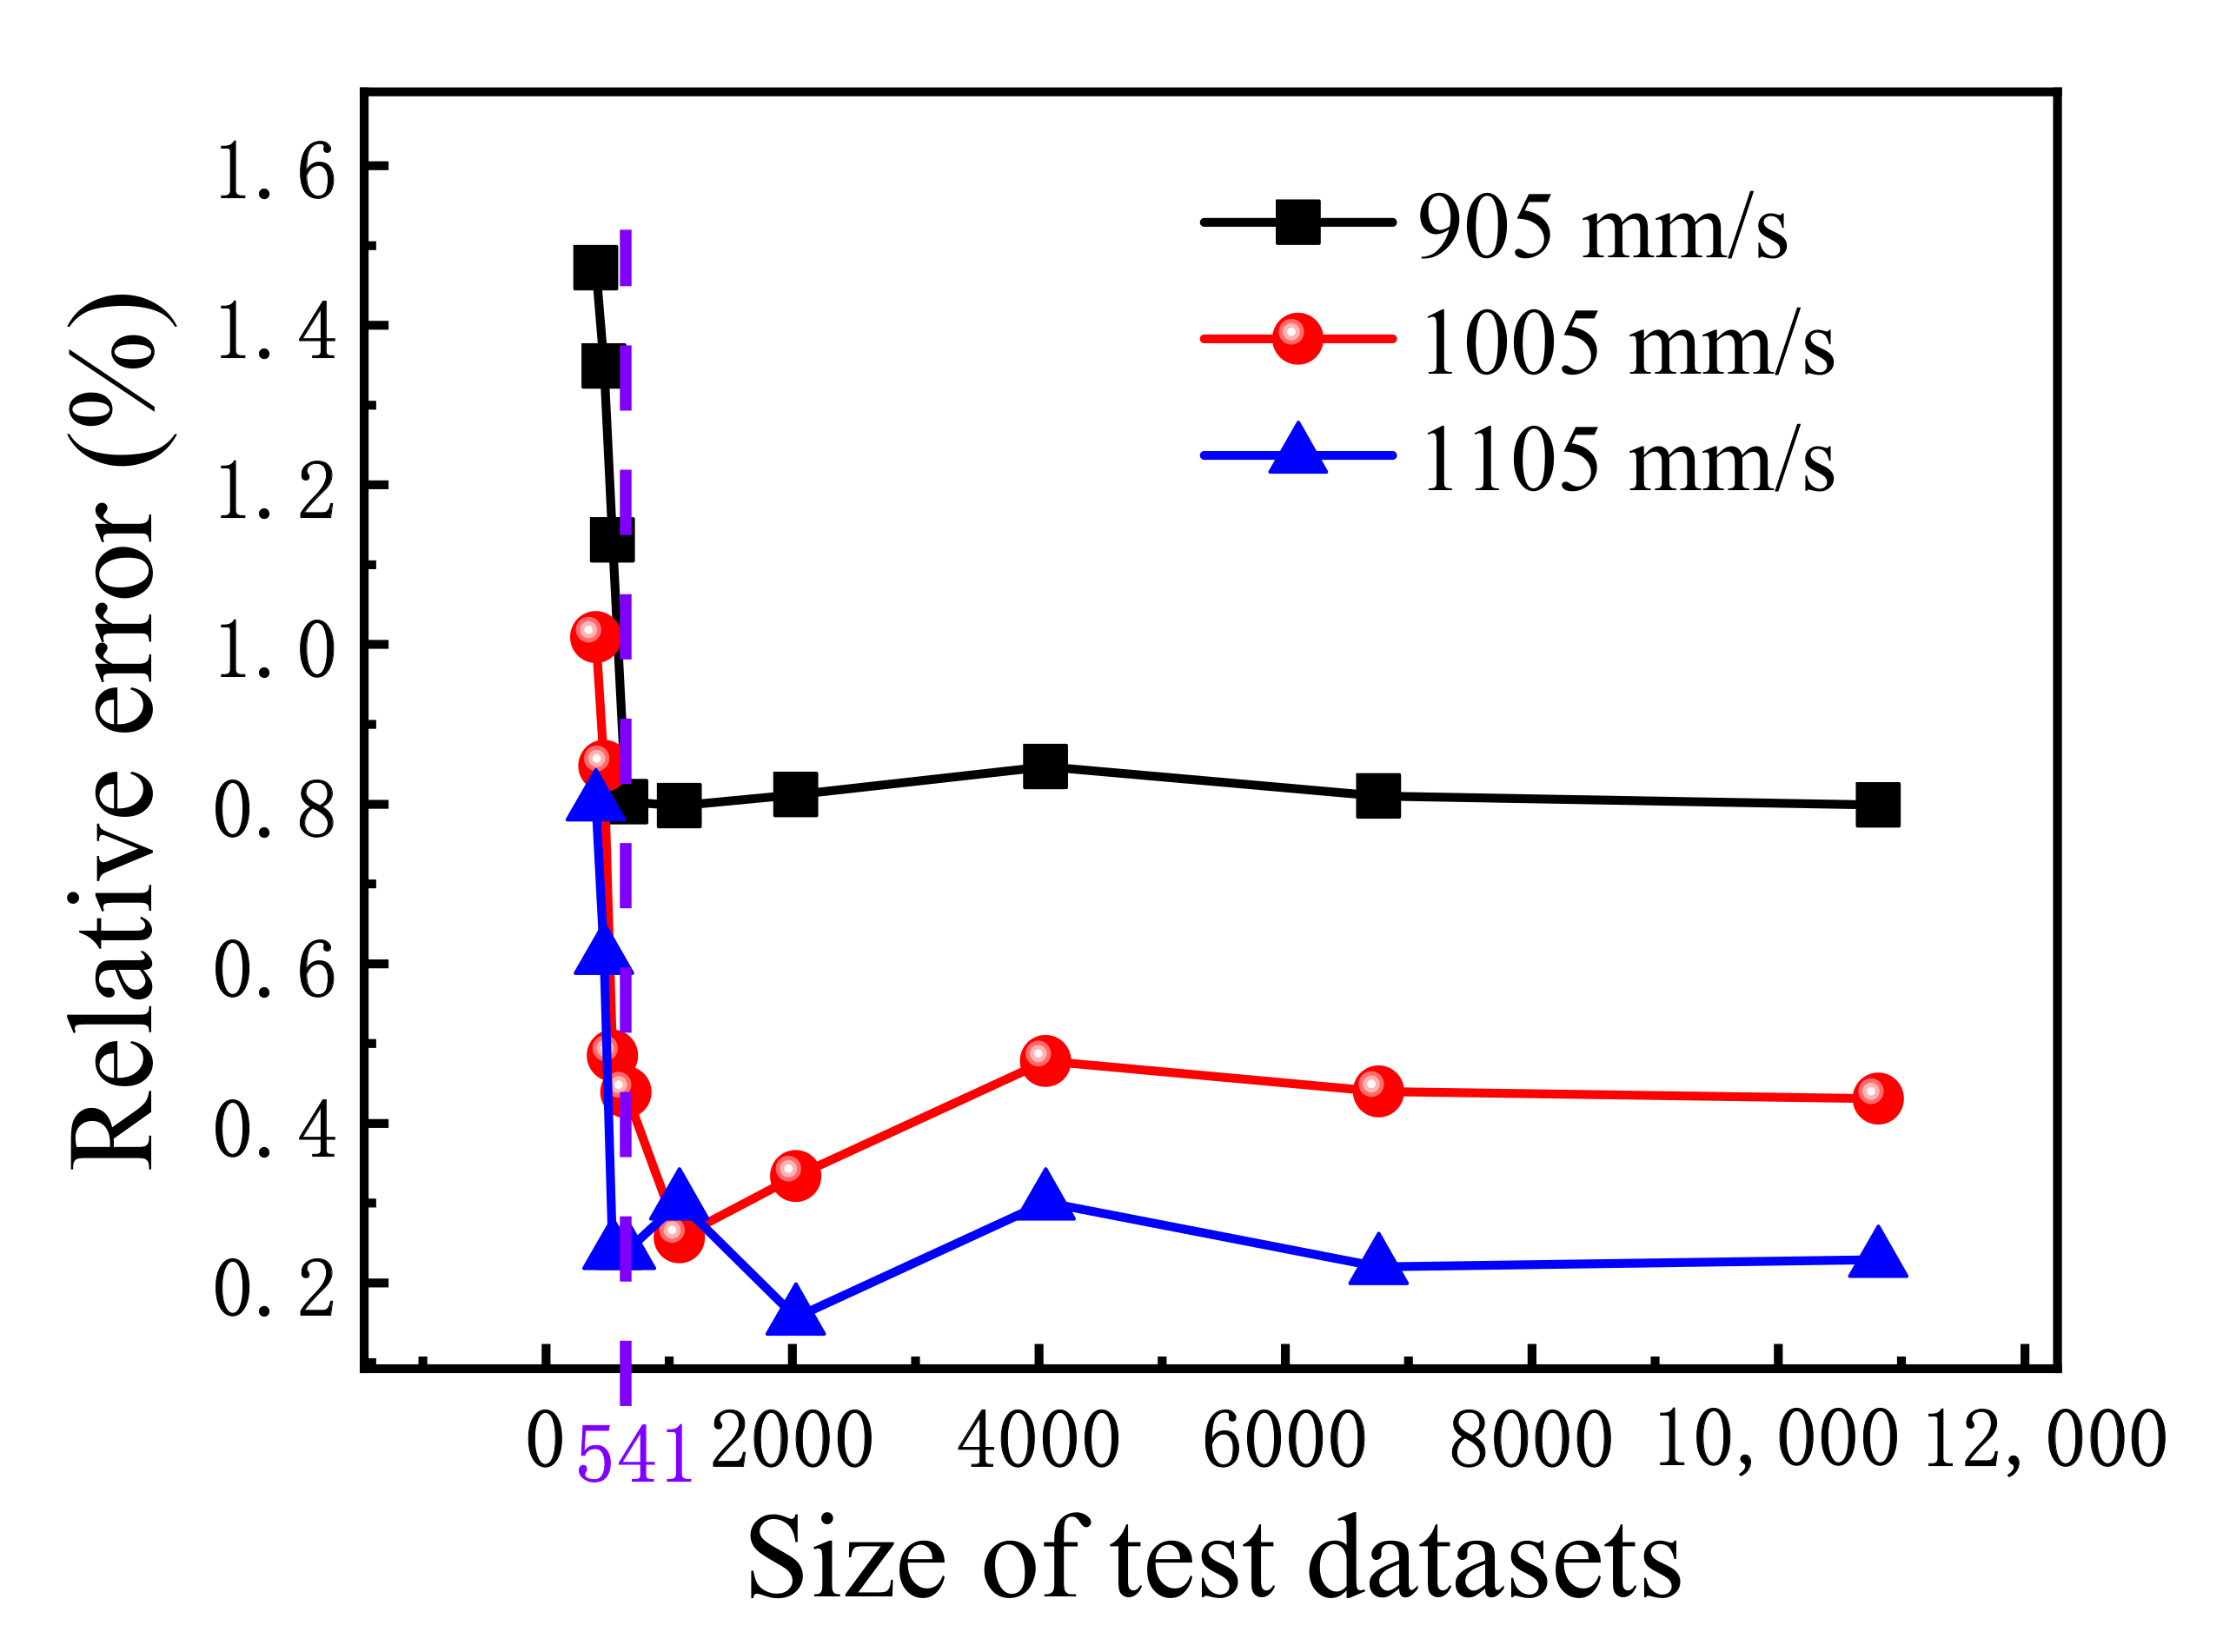
3.2. Influence of Dataset Sizes

To evaluate the generalization performance of the proposed model, the optimized XGBoost model was trained with datasets of different sizes, where all the datasets were randomly extracted from both the training part and the testing part with a ratio of 8:2. Table 4 lists the three evaluation indicators (MAE, RMSE, and R2) of the model on the unseen test set of data with different dataset sizes. Table 4 indicates that the XGBoost model proposed in this paper has superior accuracy and generalization performance in predicting Ti-6Al-4V part density when the dataset size is large. When the size of the dataset is reduced, the prediction accuracy drops but is still acceptable. For example, when the size of the test dataset is greater than 649, the coefficient of determination R2 is greater than 0.9. Even when the size of the training dataset drops to 122, the value of the coefficient for determination R2 can still reach 0.7632.
In order to verify the practicability of the model, the relative densities of SLMed Ti-6Al-4V parts were predicted by the optimized XGBoost model with different sizes of datasets proposed in this paper and were compared with the experimental measurement results of Jiang et al. [39]. The input SLM process parameters in the XGBoost model were set by the laser power of 125 W, the powder layer thickness of 20 μm, the hatch distance of 80 μm, and the laser scanning speeds of 905 mm/s, 1005 mm/s, and 1105 mm/s, respectively, which were consistent with the experimental process parameters of Jiang et al. [39]. It should be noted that the experimental data of Jiang et al. [39] were not included in our XGBoost model dataset.
Figure 4 shows the predicted relative errors from experimental values as a function of dataset size used in the optimized XGBoost model, which clearly indicates that as the dataset size decreases, when the size of the test dataset is larger than 541, the prediction accuracy changes slightly, but when the size of the test dataset is smaller than 541, the prediction accuracy drops sharply, at which it indicates that the model has lost its predictive ability. As also shown in Figure 4, the higher the scanning speed, the smaller the relative error of the model when the other three processing parameters and the dataset size are the same.

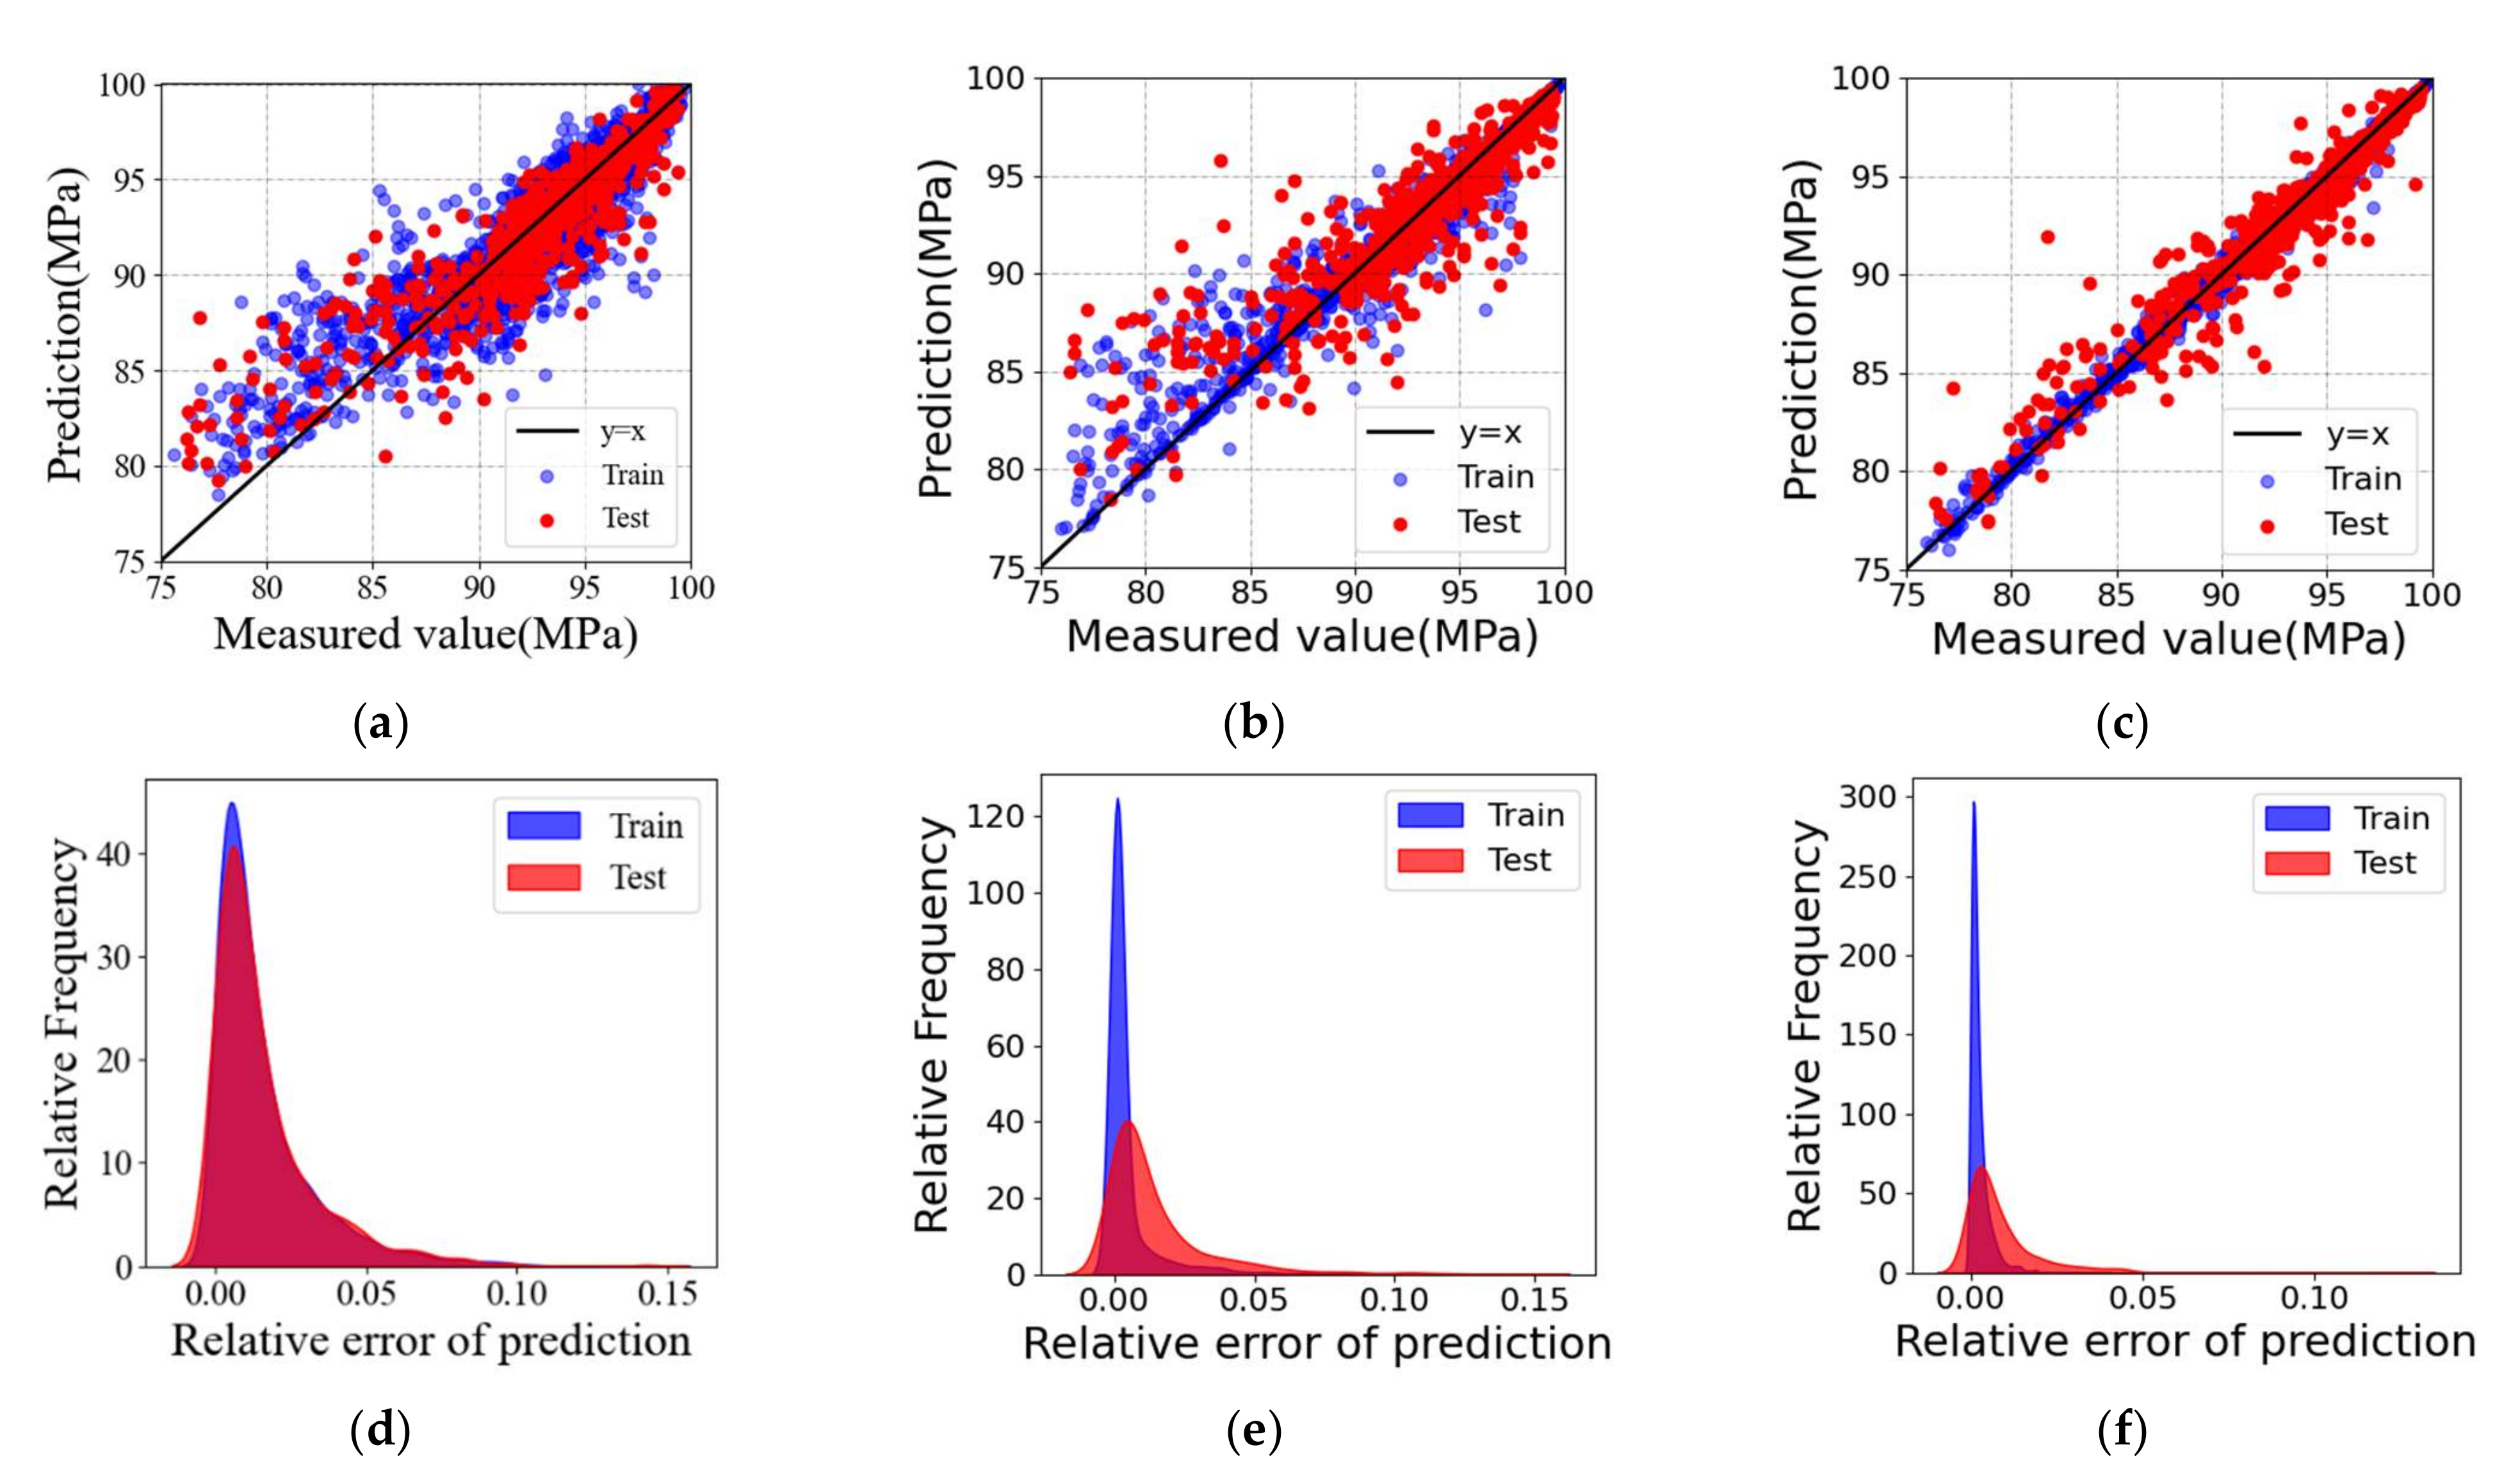
3.3. Comparing the Predictive Ability with That of Other ML Models under Small Dataset

In this study, a good ML model must guarantee high prediction accuracy and generalization ability under small datasets. For comparison, the SVR and DNN models were coded and trained here. We chose the test dataset of 649 sets listed in Table 4 to compare the prediction accuracy of the optimized XGBoost model with that of the SVR and DNN models.
Figure 5 shows the results of the regression analysis on the training dataset and the unseen test dataset by the trained ML models including DNN, SVR, and the present optimized XGBoost model under a small test dataset of 649 sets. The evaluation indicators, such as MAE, RMSE, and R2, of the unseen test dataset are also listed in Table 5. Both Figure 5 and Table 5 show that the optimized XGBoost model outperforms the other two models in accuracy and generality in predicting the relative density of SLMed Ti-6Al-4V parts under a small dataset. The optimized XGBoost model can effectively provide accurate correspondence between the relative density of Ti-6Al-4V parts and SLM process parameters.

4. Conclusions

In this study, the GridsearchCV method was used to fine-tune the hyperparameters of the XGBoost model with a small dataset to predict the correspondence between process parameters and relative densities of SLMed Ti-6Al-4V parts. The following conclusions are drawn:
(1)
The trained optimized XGBoost model can effectively provide accurate correspondence between the relative density of the SLMed Ti-6Al-4V parts by SLM and the processing parameters.
(2)
As the dataset size decreases, when the size of the test dataset is larger than 541, the prediction accuracy changes slightly, but when the size of the test dataset is smaller than 541, the prediction accuracy drops sharply, at which point the model has lost its predictive ability.
(3)
The present optimized XGBoost model outperforms the ANN and SVR models with respect to the accuracy and generality in predicting the relative density of the SLMed Ti-6Al-4V parts under a small dataset.
(4)
The optimized XGBoost model has strong practicability under a small dataset. Using this method, the SLM operators can accurately estimate the relative density of the products based on the input processing parameters before printing, without spending a great deal of experience and time.
Although the application of the XGBoost model in predicting the relative density of SLMed Ti-6Al-4V parts only was discussed here, the optimized XGBoost model proposed in this paper can be easily extended to the prediction of mechanical properties of more metal materials manufactured by SLM processes. In future work, we will further modify the model to predict the corresponding processing parameters according to the specified mechanical properties of the printed parts desired by the user.

Author Contributions

Conceptualization, W.-G.J. and M.Z.; methodology, M.Z.; software, M.Z. and Y.-C.L.; validation, W.-G.J. and M.Z.; formal analysis, Q.-H.Q. and M.-L.L.; data curation, W.-G.J. and M.Z.; writing—original draft preparation, W.-G.J. and M.Z.; writing—review and editing, M.Z., W.-G.J. and Q.-H.Q.; visualization, M.Z. and Y.-C.L.; funding acquisition, W.-G.J. All authors have read and agreed to the published version of the manuscript.

Funding

This work was supported by the National Natural Science Foundation of China under Grant Nos. 12062016; 11772204.

Institutional Review Board Statement

Not applicable.

Informed Consent Statement

Not applicable.

Acknowledgments

W.-G.J. appreciates the support from the National Natural Science Foundation of China (Grant Nos. 12062016; 11772204).

Conflicts of Interest

The authors declare no conflict of interest.

References

  1. Wei, Y.C.; Tian, M.J.; Huang, C.Y.; Wang, S.W.; Li, X.; Hu, Q.R.; Yuan, M.Q. Topological study about failure behavior and energy absorption of honeycomb structures under various strain rates. Def. Technol. 2022, Online. [Google Scholar] [CrossRef]
  2. Tan, F.B.; Song, J.L.; Wang, C.; Fan, Y.B.; Dai, H.W. Titanium clasp fabricated by selective laser melting, CNC milling, and conventional casting: A comparative in vitro in vitro study. J. Prosthodont. Res. 2019, 63, 58–65. [Google Scholar] [CrossRef] [PubMed]
  3. Jafari, D.; Wits, W.W. The utilization of selective laser melting technology on heat transfer devices for thermal energy conversion applications: A review. Renew. Sustain. Energy. Rev. 2018, 91, 420–442. [Google Scholar] [CrossRef]
  4. Ataee, A.; Li, Y.; Brandt, M.; Wen, C. Ultrahigh-strength titanium gyroid scaffolds manufactured by selective laser melting (SLM) for bone implant applications. Acta Mater. 2018, 158, 354–368. [Google Scholar] [CrossRef]
  5. Van Hooreweder, B.; Apers, Y.; Lietaert, K.; Kruth, J.P. Improving the fatigue performance of porous metallic biomaterials produced by Selective Laser Melting. Acta Biomater. 2017, 47, 193–202. [Google Scholar] [CrossRef]
  6. Gogolewski, D.; Kozior, T.; Zmarzły, P.; Mathia, T.G. Morphology of Models Manufactured by SLM Technology and the Ti6Al4V Titanium Alloy Designed for Medical Applications. Materials 2021, 14, 6249. [Google Scholar] [CrossRef]
  7. Liu, Q.C.; Elambasseril, J.; Sun, S.J.; Leary, M.; Brandt, M.; Sharp, P.K. The effect of manufacturing defects on the fatigue behaviour of Ti-6Al-4V specimens fabricated using selective laser melting. Adv. Mater. Res. 2014, 891, 1519–1524. [Google Scholar] [CrossRef]
  8. Kempen, K.; Vrancken, B.; Buls, S.; Thijs, L.; Humbeeck, J.V.; Kruth, J.P. Selective laser melting of crack-free high density M2 high speed steel parts by baseplate preheating. J. Manuf. Sci. Eng. 2014, 136, 061026. [Google Scholar] [CrossRef]
  9. Li, R.; Liu, J.; Shi, Y.; Wang, L.; Jiang, W. Balling behavior of stainless steel and nickel powder during selective laser melting process. Int. J. Adv. Manuf. Technol. 2012, 59, 1025–1035. [Google Scholar] [CrossRef]
  10. Furumoto, T.; Ogura, R.; Hishida, K.; Hosokawa, A.; Koyano, T.; Abe, S.; Ueda, T. Study on deformation restraining of metal structure fabricated by selective laser melting. J. Mater. Process. Technol. 2017, 245, 207–214. [Google Scholar] [CrossRef]
  11. Zhao, X.; Li, S.; Zhang, M.; Liu, Y.; Sercombe, T.B.; Wang, S.; Hao, Y.; Yang, R.; Murr, L.E. Comparison of the microstructures and mechanical properties of Ti-6Al-4V fabricated by selective laser melting and electron beam melting. Mater. Des. 2016, 95, 21–31. [Google Scholar] [CrossRef]
  12. Cunningham, R.; Narra, S.P.; Montgomery, C.; Beuth, J.; Rollett, A.D. Synchrotron-based X-ray microtomography characterization of the effect of processing variables on porosity formation in laser power-bed additive manufacturing of Ti-6Al-4V. JOM 2017, 69, 479–484. [Google Scholar] [CrossRef]
  13. Han, J.; Yang, J.; Yu, H.; Yin, J.; Gao, M.; Wang, Z.; Zeng, X. Microstructure and mechanical property of selective laser melted Ti6Al4V dependence on laser energy density. Rapid Prototyp. J. 2017, 23, 217–226. [Google Scholar] [CrossRef]
  14. Yang, Y.; Lu, J.B.; Luo, Z.Y.; Wang, D. Accuracy and density optimization in directly fabricating customized orthodontic production by selective laser melting. Rapid Prototyp. J. 2012, 18, 482–489. [Google Scholar] [CrossRef]
  15. Perevoshchikova, N.; Rigaud, J.; Sha, Y.; Heilmaier, M.; Finnin, B.; Labelle, E.; Wu, X. Optimisation of selective laser melting parameters for the Ni-based superalloy IN-738 LC using Doehlert’s design. Rapid Prototyp. J. 2017, 23, 881–892. [Google Scholar] [CrossRef] [Green Version]
  16. Tang, S.; Zhang, G.; Yang, H.; Li, Y.; Liu, W.K.; Guo, X. MAP123: A data-driven approach to use 1D data for 3D nonlinear elastic materials modeling. Comput. Method. Appl. M 2019, 357, 112587. [Google Scholar] [CrossRef]
  17. Xie, X.; Bennett, J.; Saha, S.; Lu, Y.; Cao, J.; Liu, W.K.; Gan, Z. Mechanistic data-driven prediction of as-built mechanical properties in metal additive manufacturing. NPJ. Comput. Mater. 2021, 7, 1–12. [Google Scholar] [CrossRef]
  18. Qi, X.; Chen, G.; Li, Y.; Cheng, X.; Li, C. Applying neural-network-based machine learning to additive manufacturing: Current applications, challenges, and future perspectives. Engineering 2019, 5, 721–729. [Google Scholar] [CrossRef]
  19. Ye, S.; Huang, W.Z.; Li, M.; Feng, X.Q. Deep learning method for determining the surface elastic moduli of microstructured solids. Extreme Mech. Lett. 2021, 44, 101226. [Google Scholar] [CrossRef]
  20. Chen, T.; Guestrin, C. XGBoost: A scalable tree boosting system. In KDD’16, Proceedings of the 22nd ACM SIGKDD International Conference on Knowledge Discovery and Data Mining, San Francisco, CA, USA, 13–17 August 2016; Association for Computing Machinery: New York, NY, USA, 2016; pp. 785–794. ISBN 978-1-4503-4232-2. [Google Scholar]
  21. Chakraborty, D.; Elzarka, H. Advanced machine learning techniques for building performance simulation: A comparative analysis. J. Build. Perform. Simul. 2019, 12, 193–207. [Google Scholar] [CrossRef]
  22. Wang, W.; Shi, Y.; Lyu, G.; Deng, W. Electricity consumption prediction using XGBoost based on discrete wavelet transform. In Proceedings of the 2nd International Conference on Artificial Intelligence and Engineering Applications (AIEA 2017), Guilin, China, 23 September 2017. [Google Scholar]
  23. Duan, J.; Asteris, P.G.; Nguyen, H.; Bui, X.N.; Moayedi, H. A novel artificial intelligence technique to predict compressive strength of recycled aggregate concrete using ICA-XGBoost model. Eng. Comput.-Ger. 2021, 37, 3329–3346. [Google Scholar] [CrossRef]
  24. Dong, W.; Huang, Y.; Lehane, B.; Ma, G. XGBoost algorithm-based prediction of concrete electrical resistivity for structural health monitoring. Autom. Constr. 2020, 114, 103155. [Google Scholar] [CrossRef]
  25. Lim, S.; Chi, S. Xgboost application on bridge management systems for proactive damage estimation. Adv. Eng. Inf. 2019, 41, 100922. [Google Scholar] [CrossRef]
  26. Zhang, Z.; Liu, Z.; Wu, D. Prediction of melt pool temperature in directed energy deposition using machine learning. Addit. Manuf. 2021, 37, 101692. [Google Scholar] [CrossRef]
  27. Peng, X.; Wu, S.; Qian, W.; Bao, J.; Hu, Y.; Zhan, Z.; Guo, G.; Withers, P.J. The potency of defects on fatigue of additively manufactured metals. Int. J. Mech. Sci. 2022, 221, 107185. [Google Scholar] [CrossRef]
  28. Ye, S.; Li, B.; Li, Q.; Zhao, H.P.; Feng, X.Q. Deep neural network method for predicting the mechanical properties of composites. Appl. Phys. Lett. 2019, 115, 161901. [Google Scholar] [CrossRef]
  29. Nguyen, D.S.; Park, H.S.; Lee, C.M. Optimization of selective laser melting process parameters for Ti-6Al-4V alloy manufacturing using deep learning. J. Manuf. Process. 2020, 55, 230–235. [Google Scholar] [CrossRef]
  30. Yu, Z.; Ye, S.; Sun, Y.; Zhao, H.; Feng, X.Q. Deep learning method for predicting the mechanical properties of aluminum alloys with small data sets. Mater. Today Commun. 2021, 28, 102570. [Google Scholar] [CrossRef]
  31. Smola, A.J.; Schölkopf, B. A tutorial on support vector regression. Stat. Comput. 2004, 14, 199–222. [Google Scholar] [CrossRef] [Green Version]
  32. Alonso, J.M.; Alvarruiz, F.; Desantes, J.M.; Hernández, L.; Hernández, V.; Moltó, G. Combining neural networks and genetic algorithms to predict and reduce diesel engine emissions. IEEE. Trans. Evol. Comput. 2007, 11, 46–55. [Google Scholar] [CrossRef]
  33. Shi, X.; Ma, S.; Liu, C.; Chen, C.; Wu, Q.; Chen, X.; Lu, J. Performance of high layer thickness in selective laser melting of Ti6Al4V. Materials 2016, 9, 975. [Google Scholar] [CrossRef] [PubMed] [Green Version]
  34. Ma, M.; Wang, Z.; Gao, M.; Zeng, X. Layer thickness dependence of performance in high-power selective laser melting of 1Cr18Ni9Ti stainless steel. J. Mater. Process. Technol. 2015, 215, 142–150. [Google Scholar] [CrossRef]
  35. Dadbakhsh, S.; Hao, L. Effect of layer thickness in selective laser melting on microstructure of Al/5 wt.% powder consolidated parts. Transfus. Apher. Sci. 2014, 2014, 106129. [Google Scholar]
  36. Butler, K.T.; Davies, D.W.; Cartwright, H.; Isayev, O.; Walsh, A. Machine learning for molecular and materials science. Nature 2018, 559, 547–555. [Google Scholar] [CrossRef] [PubMed]
  37. Nielsen, D. Tree Boosting with XGBoost-Why Does XGBoost Win “Every” Machine Learning Competition? Master Thesis, Norwegian University of Science and Technology, Trondheim, Norway, 2016. [Google Scholar]
  38. Friedman, J.H. Greedy Function Approximation: A Gradient Boosting Machine. Ann. Stat. 2001, 29, 1189–1232. [Google Scholar] [CrossRef]
  39. Jiang, X.Y.; Xia, W.L.; Lou, D.J.; Ren, X.P.; Shao, S.; Li, H.Q.; Liu, S.Y.; Fang, X.Y. Effect of scanning speed on internal defects and mechanical properties of Ti-6A1-4V alloy processed by selective laser melting. Mater. Mech. Eng. 2020, 44, 41–45. (In Chinese) [Google Scholar] [CrossRef]
Figure 1. Schematic diagram of the XGBoost regression tree model.
Materials 15 05298 g001
Figure 2. Schematic diagram of ten-fold cross-validation.
Materials 15 05298 g002
Figure 3. Regression analysis on the training dataset and the unseen test dataset by the trained XGBoost model. (a) The experimental measurement and the numerical prediction of the relative density. The solid line y = x is the identity line for reference. (b) Distribution plot of relative error for the training dataset and the unseen test dataset.
Materials 15 05298 g003
Figure 4. The predicted relative errors from experimental values as a function of dataset size used in the optimized XGBoost model.
Materials 15 05298 g004
Figure 5. Regression analysis on the training dataset and the unseen test dataset by the trained ML models using a small dataset. The experimental measurements and the numerical predictions predicted by (a) DNN, (b) SVR, and (c) the present model. Distribution plot of relative error for the training dataset and the unseen test dataset evaluated in (d) DNN, (e) SVR, and (f) the present optimized XGBoost model.
Materials 15 05298 g005
Table 1. Specific composition of Ti-6Al-4V ELI alloy powder.
ElementAlVFeCNOHTiOthers
wt. %5.50–6.503.50–4.500.250.080.030.130.0125Balance0.50
Table 2. SLM process parameters and their ranges used to generate data.
Process ParametersUnitValue
Laser scanning speedmm/s800, 900, 1000, 1200, 1300, 1400, 1500, 1600, 1700, 1800, 1900, 2000, 2100, 2200, 2300, 2400, 2500
Laser powerW80, 90, 95, 100, 105, 110, 115, 120, 130, 135, 140, 145, 150, 155, 160, 165, 170, 175, 180
Hatch distanceμm30, 35, 40, 45, 50, 55, 60, 65, 70, 75, 80, 85, 90, 95, 100
Power layer thicknessμm20, 25, 30, 35, 40, 45, 50, 55, 60, 65, 70, 75, 80
Table 3. Hyperparameter ranges for model fine-tuning.
ItemRange of ValuesTolerance
d m a x 1–101
α 0.01–0.30.02
K100–60050
γ 0–0.050.01
λ 0–10.1
Table 4. Comparison of evaluation indicators of the proposed models with different sizes of dataset on unseen test dataset.
Training Dataset (Set)Test Dataset
(Set)
MAERMSE R 2
48,64810,8110.47680.62450.9699
27,02767570.48150.63440.9696
16,21640550.51940.71790.9643
810820280.60010.99170.9513
432410820.68711.17970.9428
25946490.80111.71710.9184
21625410.88892.14950.8930
16214060.98702.27070.8840
4861221.55775.14050.7632
Table 5. Comparison of prediction results of SVR, DNN, and optimized XGBoost models on the unseen test set.
TestSVRDNNOptimized XGBoost
MAE1.33440.85760.8011
RMSE4.86461.73161.7171
R 2 0.76870.78490.9184
Publisher’s Note: MDPI stays neutral with regard to jurisdictional claims in published maps and institutional affiliations.

