Article

Cu and As(V) Adsorption and Desorption on/from Different Soils and Bio-Adsorbents

by
Raquel Cela-Dablanca
1,*,
Ana Barreiro
1,
Gustavo Ferreira-Coelho
1,
Claudia Campillo-Cora
2,
Paula Pérez-Rodríguez
2,
Manuel Arias-Estévez
2,
Avelino Núñez-Delgado
1,
Esperanza Álvarez-Rodríguez
1 and
María J. Fernández-Sanjurjo
1
1
Department of Soil Science and Agricultural Chemistry, Engineering Polytechnic School, University of Santiago de Compostela, 27002 Lugo, Spain
2
Soil Science and Agricultural Chemistry, Faculty of Sciences, University of Vigo, 32004 Ourense, Spain
*
Author to whom correspondence should be addressed.
Materials 2022, 15(14), 5023; https://doi.org/10.3390/ma15145023
Submission received: 2 June 2022 / Revised: 11 July 2022 / Accepted: 18 July 2022 / Published: 19 July 2022

Abstract

:
This research is concerned with the adsorption and desorption of Cu and As(V) on/from different soils and by-products. Both contaminants may reach soils by the spreading of manure/slurries, wastewater, sewage sludge, or pesticides, and also due to pollution caused by mining and industrial activities. Different crop soils were sampled in A Limia (AL) and Sarria (S) (Galicia, NW Spain). Three low-cost by-products were selected to evaluate their bio-adsorbent potential: pine bark, oak ash, and mussel shell. The adsorption/desorption studies were carried out by means of batch-type experiments, adding increasing and individual concentrations of Cu and As(V). The fit of the adsorption data to the Langmuir, Freundlich, and Temkin models was assessed, with good results in some cases, but with high estimation errors in others. Cu retention was higher in soils with high organic matter and/or pH, reaching almost 100%, while the desorption was less than 15%. The As(V) adsorption percentage clearly decreased for higher As doses, especially in S soils, from 60–100% to 10–40%. The As(V) desorption was closely related to soil acidity, being higher for soils with higher pH values (S soils), in which up to 66% of the As(V) previously adsorbed can be desorbed. The three by-products showed high Cu adsorption, especially oak ash, which adsorbed all the Cu added in a rather irreversible manner. Oak ash also adsorbed a high amount of As(V) (>80%) in a rather non-reversible way, while mussel shell adsorbed between 7 and 33% of the added As(V), and pine bark adsorbed less than 12%, with both by-products reaching 35% desorption. Based on the adsorption and desorption data, oak ash performed as an excellent adsorbent for both Cu and As(V), a fact favored by its high pH and the presence of non-crystalline minerals and different oxides and carbonates. Overall, the results of this research can be relevant when designing strategies to prevent Cu and As(V) pollution affecting soils, waterbodies, and plants, and therefore have repercussions on public health and the environment.

1. Introduction

The increasing spreading of metals and metalloids included in the group of the so-called “heavy metals” into the soil through fertilizers, manure/slurry, sewage sludge, irrigation with wastewater, pesticides, or mining and industrial activities has given rise to concerns about their impact on the environment in general and human health in particular [1,2,3,4]. These substances enter various environmental compartments (soil, water, and air), and affect different living beings (microbial, plant, and animal communities) and may have adverse effects on individual biological receptors and populations [5]. Their toxicity is affected by the difficulties of organisms to achieve their excretion, with a tendency to bio-accumulate, and, even in cases where they do not have high concentrations in specific environments, they can reach harmful levels after passing through the food chain [6,7].
Arsenic is naturally present in certain minerals, but its presence as a pollutant in the environment can also be caused by certain human activities, such as mining, use of fossil fuels, pesticides, and herbicides. It is a semimetal or metalloid that can occur in inorganic form, with the As(III) species being the most frequent in reducing conditions, and As(V) in well-aerated media, while the organic forms (with As included in organic molecules) are quantitatively less important [8]. This element causes special concern due to its high toxicity, and it can be mobilized in the most frequent groundwater pH values, thus threatening drinking water resources [9]. It has associated chronic toxic effects, increasing the risks of developing cancers affecting the skin, lung, kidney, and liver [10,11]. Details regarding the effects of arsenic on toxicity and human health have been extensively documented in previous papers [12,13,14,15,16].
As regards Cu, it is an essential micronutrient for human beings and for plant development, but it is toxic when present at high concentrations [17,18]. It is less mobile than As, but high Cu concentrations can alter cell division in some plants, affect microbial activity, microorganism diversity, and soil ecosystem services [19,20,21,22], and cause damage to detritivore populations [23]. As regards the effects of Cu on human health, extensive reviews have been carried out in previous publications [24,25,26,27].
Soils can act as a sink for these pollutants and reduce their toxicity through adsorption, precipitation, or occlusion processes, mainly affected by soil organic matter, low crystallinity minerals, and acid–base and redox conditions [28,29].
The retention capacity of the soil can be an important factor in mitigating the toxic effects of these metals/metalloids, but, in the long term, soil adsorbent surfaces could be saturated, increasing the risk of passage to plants, water, and the food chain. To minimize this problem, different remediation strategies have been developed, mainly aimed at acting on the mobility of the pollutants [30], including the use of bio-adsorbent materials. In this regard, studies focusing on bio-adsorbents are of growing interest, as an efficient and low-cost alternative to retain the different contaminants present in soils and water. Generally, materials that are low cost and locally available in large quantities are considered a good choice to be assessed regarding their effectivity [31]. The food and agroforestry industries produce large amounts of waste and by-products, such as mussel shell, biomass combustion ash, and pine bark, which could be used for this purpose. Specifically, previous studies on pollutant retention onto biomass ash showed promising results in investigations focused on As [32,33] as well as on Cu [34,35].
In this view, the objective of this work is to study the retention of Cu and As(V) in cultivated soils with different characteristics, as well as the capacity of different by-products (oak ash, pine bark, and mussel shell) to immobilize these contaminants. The results of the research could be useful in program-appropriate practices to manage soils and low-cost by-products in order to reduce the risks of environmental contamination associated with the spreading of materials that contain both pollutants.

2. Materials and Methods

2.1. Soils and By-Products

For this research, six crop soils were selected, which were previously sampled at two areas of Galicia (NW Spain) subjected to intensive farming: S soils (sampled at Sarria, Lugo province) and AL soils (sampled at A-Limia, Ourense province). The samples were taken from the surface layer (0–20 cm), with each one being the result of combining 10 sub-samples collected in a zig-zag manner for each soil. These soils have been previously studied and described [36].
The forest by-products used in this study were oak ash from a local boiler at Lugo (Spain), pine bark (fraction less than 0.63 mm), a commercial product provided by Geolia (Madrid, Spain), and un-calcined mussel shell (<1 mm in diameter), supplied by Abonomar S.L. (Illa de Arousa, Pontevedra province, Spain). A more complete description was previously published [37].
The methods used for the characterization of soils and by-products were the following: pH in water and 0.1 M KCl (soil:solution ratio 1:2.5), using a pH-meter (pH-model 2001 Crison, Spain); C and N by elemental analysis (CHNS Truspec, Leco, St. Joseph, MI, USA); available P by the Olsen method [38]; exchangeable cations, extracted with 1 M NH4Cl [39] and quantified by atomic absorption/emission spectrometry; the effective cation exchange capacity (eCEC) was calculated as the sum of exchangeable Ca, Mg, Na, K, and Al; non-crystalline Al and Fe (Alo, Feo) were extracted with ammonium oxalate acidified at pH 3. All determinations were performed in triplicate.
Table 1 and Table 2 show the main characteristics of the soils and the three by-products used, respectively.
Table S1 (Supplementary Materials) shows data on BET surface areas for the six soils studied, evidencing that the values were higher for S soils. Of note, although higher surface area facilitates achieving higher adsorption of a variety of substances onto soils, other factors could be of even higher relevance, as previously stated for different pollutants [40].
In addition, Table S2 (Supplementary Materials) shows data on BET surface areas for the three by-products, evidencing that the highest value corresponded to oak ash (1.3336 m2 g1), followed by mussel shell (1.1318 m2 g−1), and being much lower for pine bark (0.3320 m2 g−1).

2.2. Adsorption and Desorption Experiments

To perform adsorption studies, batch-type experiments were carried out, stirring 1 g of each soil or by-product for 24 h with 40 mL of 0.005 M CaCl2 and with different concentrations of Cu or As(V) (100, 200, 400, 800, and 1000 μmol L−1), with each pollutant added individually. The solutions were prepared from analytical grade Cu(NO3)2.3H2O and Na2HAsO4 (Panreac, Barcelona, Spain). After 24 h of agitation, the samples were centrifuged (at 4000 rpm) and filtered. In the equilibrium solution, the dissolved organic carbon (DOC) was determined by means of UV-1201 spectroscopy (Shimadzu, Kyoto, Japan), the pH using a glass electrode (Crison, Madrid, Spain), and the concentrations of Cu or As using an ICP-MS equipment (Varian 820-NS, Palo Alto, CA, USA). The amount of Cu or As adsorbed was calculated by the difference between the added concentration and that remaining in the equilibrium solution.
Regarding desorption experiments, 40 mL of 0.005 M CaCl2 was added to each of the samples used in the previous adsorption tests, then stirring for 24 h, centrifuging, filtering and quantifying Cu or As(V) in the equilibrium solution, following the same methodology indicated above.

2.3. Data Analysis and Statistical Treatment

The experimental adsorption data were checked as regards their fitting to the Freundlich (Equation (1)), Langmuir (Equation (2)), and Temkin (Equation (3)) models:
q a = K F C e q n
q a = K F C e q n
qa = β ln KT + β ln Ceq
where qa is the amount of Cu or As(V) adsorbed in equilibrium (μmol kg−1); Ceq is the concentration of Cu or As(V) present in the solution in the equilibrium (μmol L−1); KF is the Freundlich affinity parameter (Ln µmol1−n kg−1); n is the Freundlich linearity parameter (dimensionless); KL is a Langmuir parameter related to the adsorption energy (L μmol−1), and qm is the Langmuir’s maximum adsorption capacity (μmol kg−1). In addition, β is calculated as RT/bt; bt is the Temkin isotherm constant; T is Temperature (K = 298°) (25 °C); R is the universal gas constant (8314 Pa m3/mol K); and KT is the Temkin isotherm equilibrium binding constant (L g−1).
Desorption was expressed as the amount of Cu or As(V) desorbed (in μmol kg−1, and also as percentage) with respect to the amount previously adsorbed.
The statistical software R version 3.1.3 and the nlstools package for R [41] were used to check the fittings to the adsorption models. The SPSS 15.0 software was used to carry out bivariate Pearson correlations between adsorption and desorption data and characteristics of the sorbent materials, and multiple linear regression analyses.

3. Results

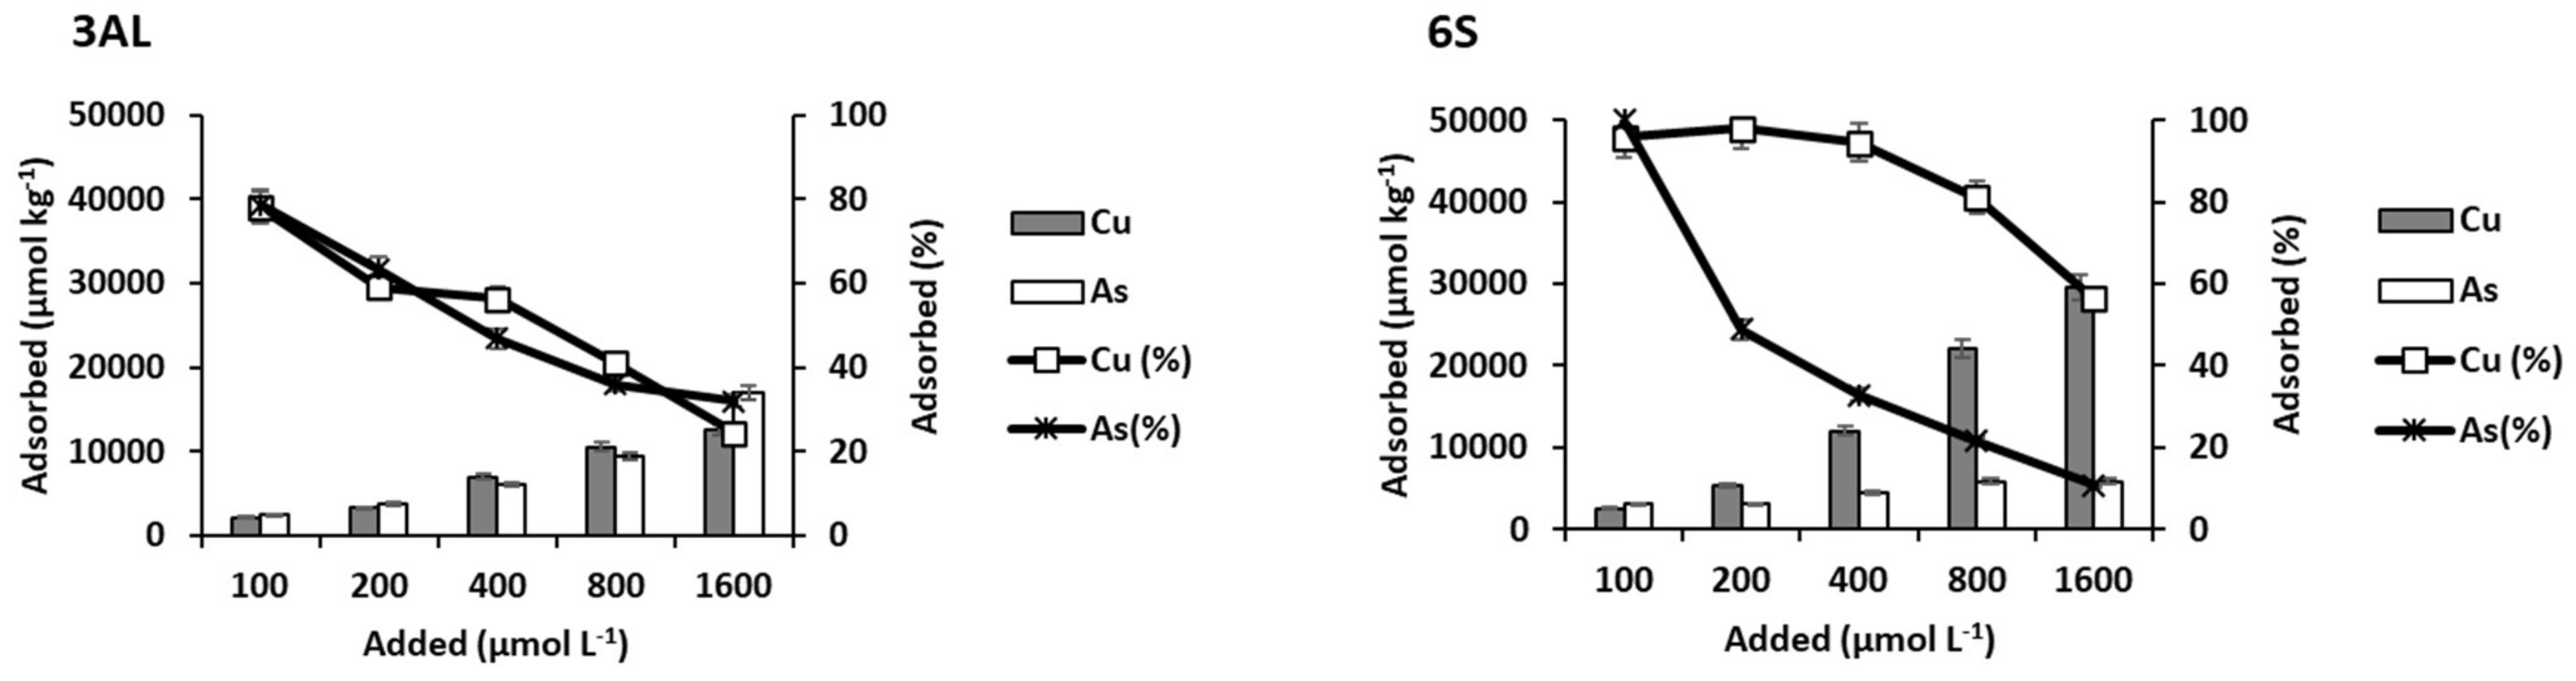
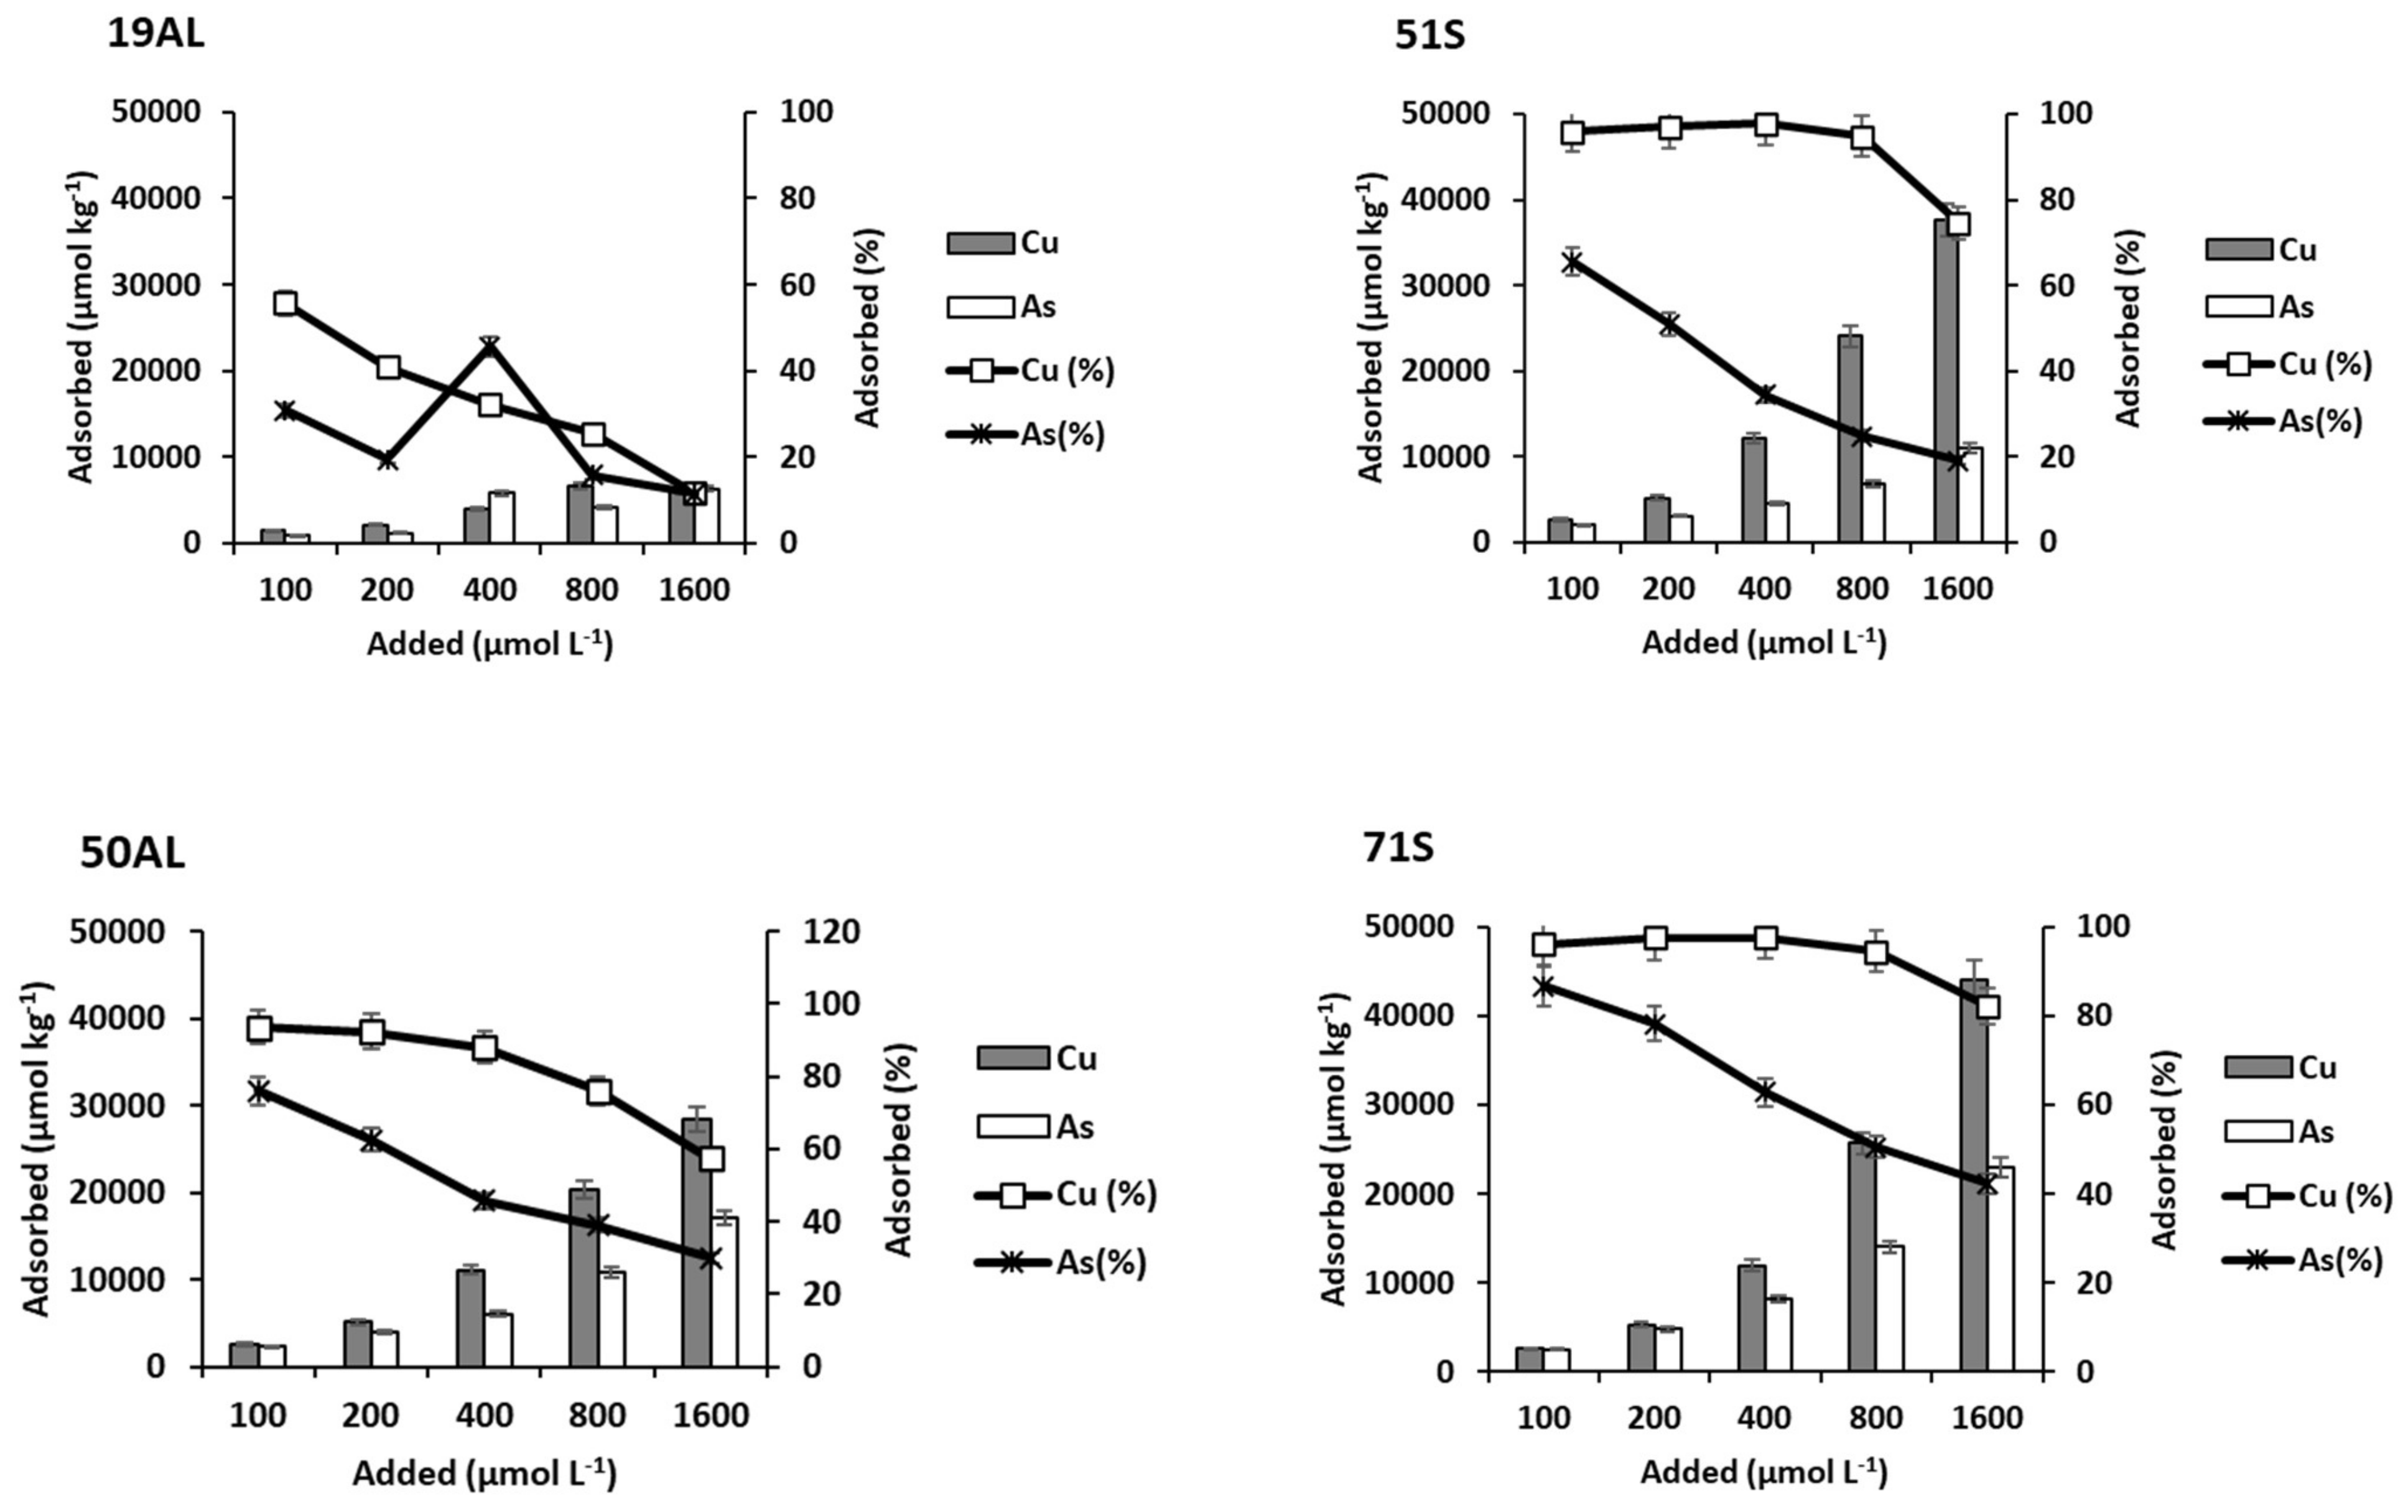
3.1. Cu and As(V) Adsorption onto Soils

The adsorption curves for the soils and bio-adsorbents studied are shown in Figure 1 and Figure 2, respectively.
Figure 1 shows a variety of shapes in the adsorption curves, with differences between the AL and S soils. In fact, these curves show that overall Cu adsorption was higher for S soils (which have higher surface area) than for AL soils, while As(V) adsorption was similar for both kinds of soils.
Figure 2 shows that Cu and As(V) adsorption results were clearly higher for oak ash as compared to pine bark and mussel shell.
Figure 3 shows the results corresponding to Cu and As(V) adsorption onto the different soils (both in absolute value and percentage) as a function of the concentration added. Considering the absolute values, it is clear that the higher the Cu or As(V) concentrations added, the higher the adsorption for all soils, while the adsorbed percentage shows a decreasing trend. Adsorption was generally higher for Cu than for As, especially in S soils.
When the highest Cu or As(V) concentrations (1600 µmol L−1) were added, Cu maximum adsorption values were reached in soils 51S and 71S (37,687 µmol kg−1 and 44,019 µmol kg−1, respectively), while for As(V), the highest scores corresponded to soils 50AL and 71S (17,076 µmol kg−1 and 22,980 µmol kg−1, respectively) (Figure 3). In contrast, the minimum Cu adsorption corresponded to soils 19AL and 3AL (5963 µmol kg−1 and 12,523 µmol kg−1, respectively), while for As(V), the minima were for soils 19AL and 6S (6290 µmol kg−1 and 5868 µmol kg−1, respectively).
Regarding percentage adsorption, within AL soils, the one with the highest organic matter content (soil 50AL, Table 1) adsorbed about 90% of Cu for the three lowest doses added, while this percentage dropped to 57% for the highest dose; however, for soil 19AL (the one with the lowest organic matter content), Cu adsorption never exceeded 56%, being less than 12% for the highest dose. The progressive decrease in the adsorption rate affecting these three AL soils could be related to a saturation of the adsorption sites, many of which would be functional groups in organic compounds, and that decrease would be more pronounced for those soils with a lower organic matter content. In S soils, the adsorption was close to 100% for the three lowest doses of Cu added, decreasing to 82% in the soil with the highest organic matter content (soil 71S) and to 56% in soil 6S when the maximum Cu dose was added, again due to the saturation of the functional groups involved in adsorption, many of which lie in organic matter.
Table 3 shows data corresponding to Cu and As(V) adsorption for the various initial concentrations added of both pollutants to the soils studied, in parallel to data corresponding to pH and DOC values in the equilibrium solution.

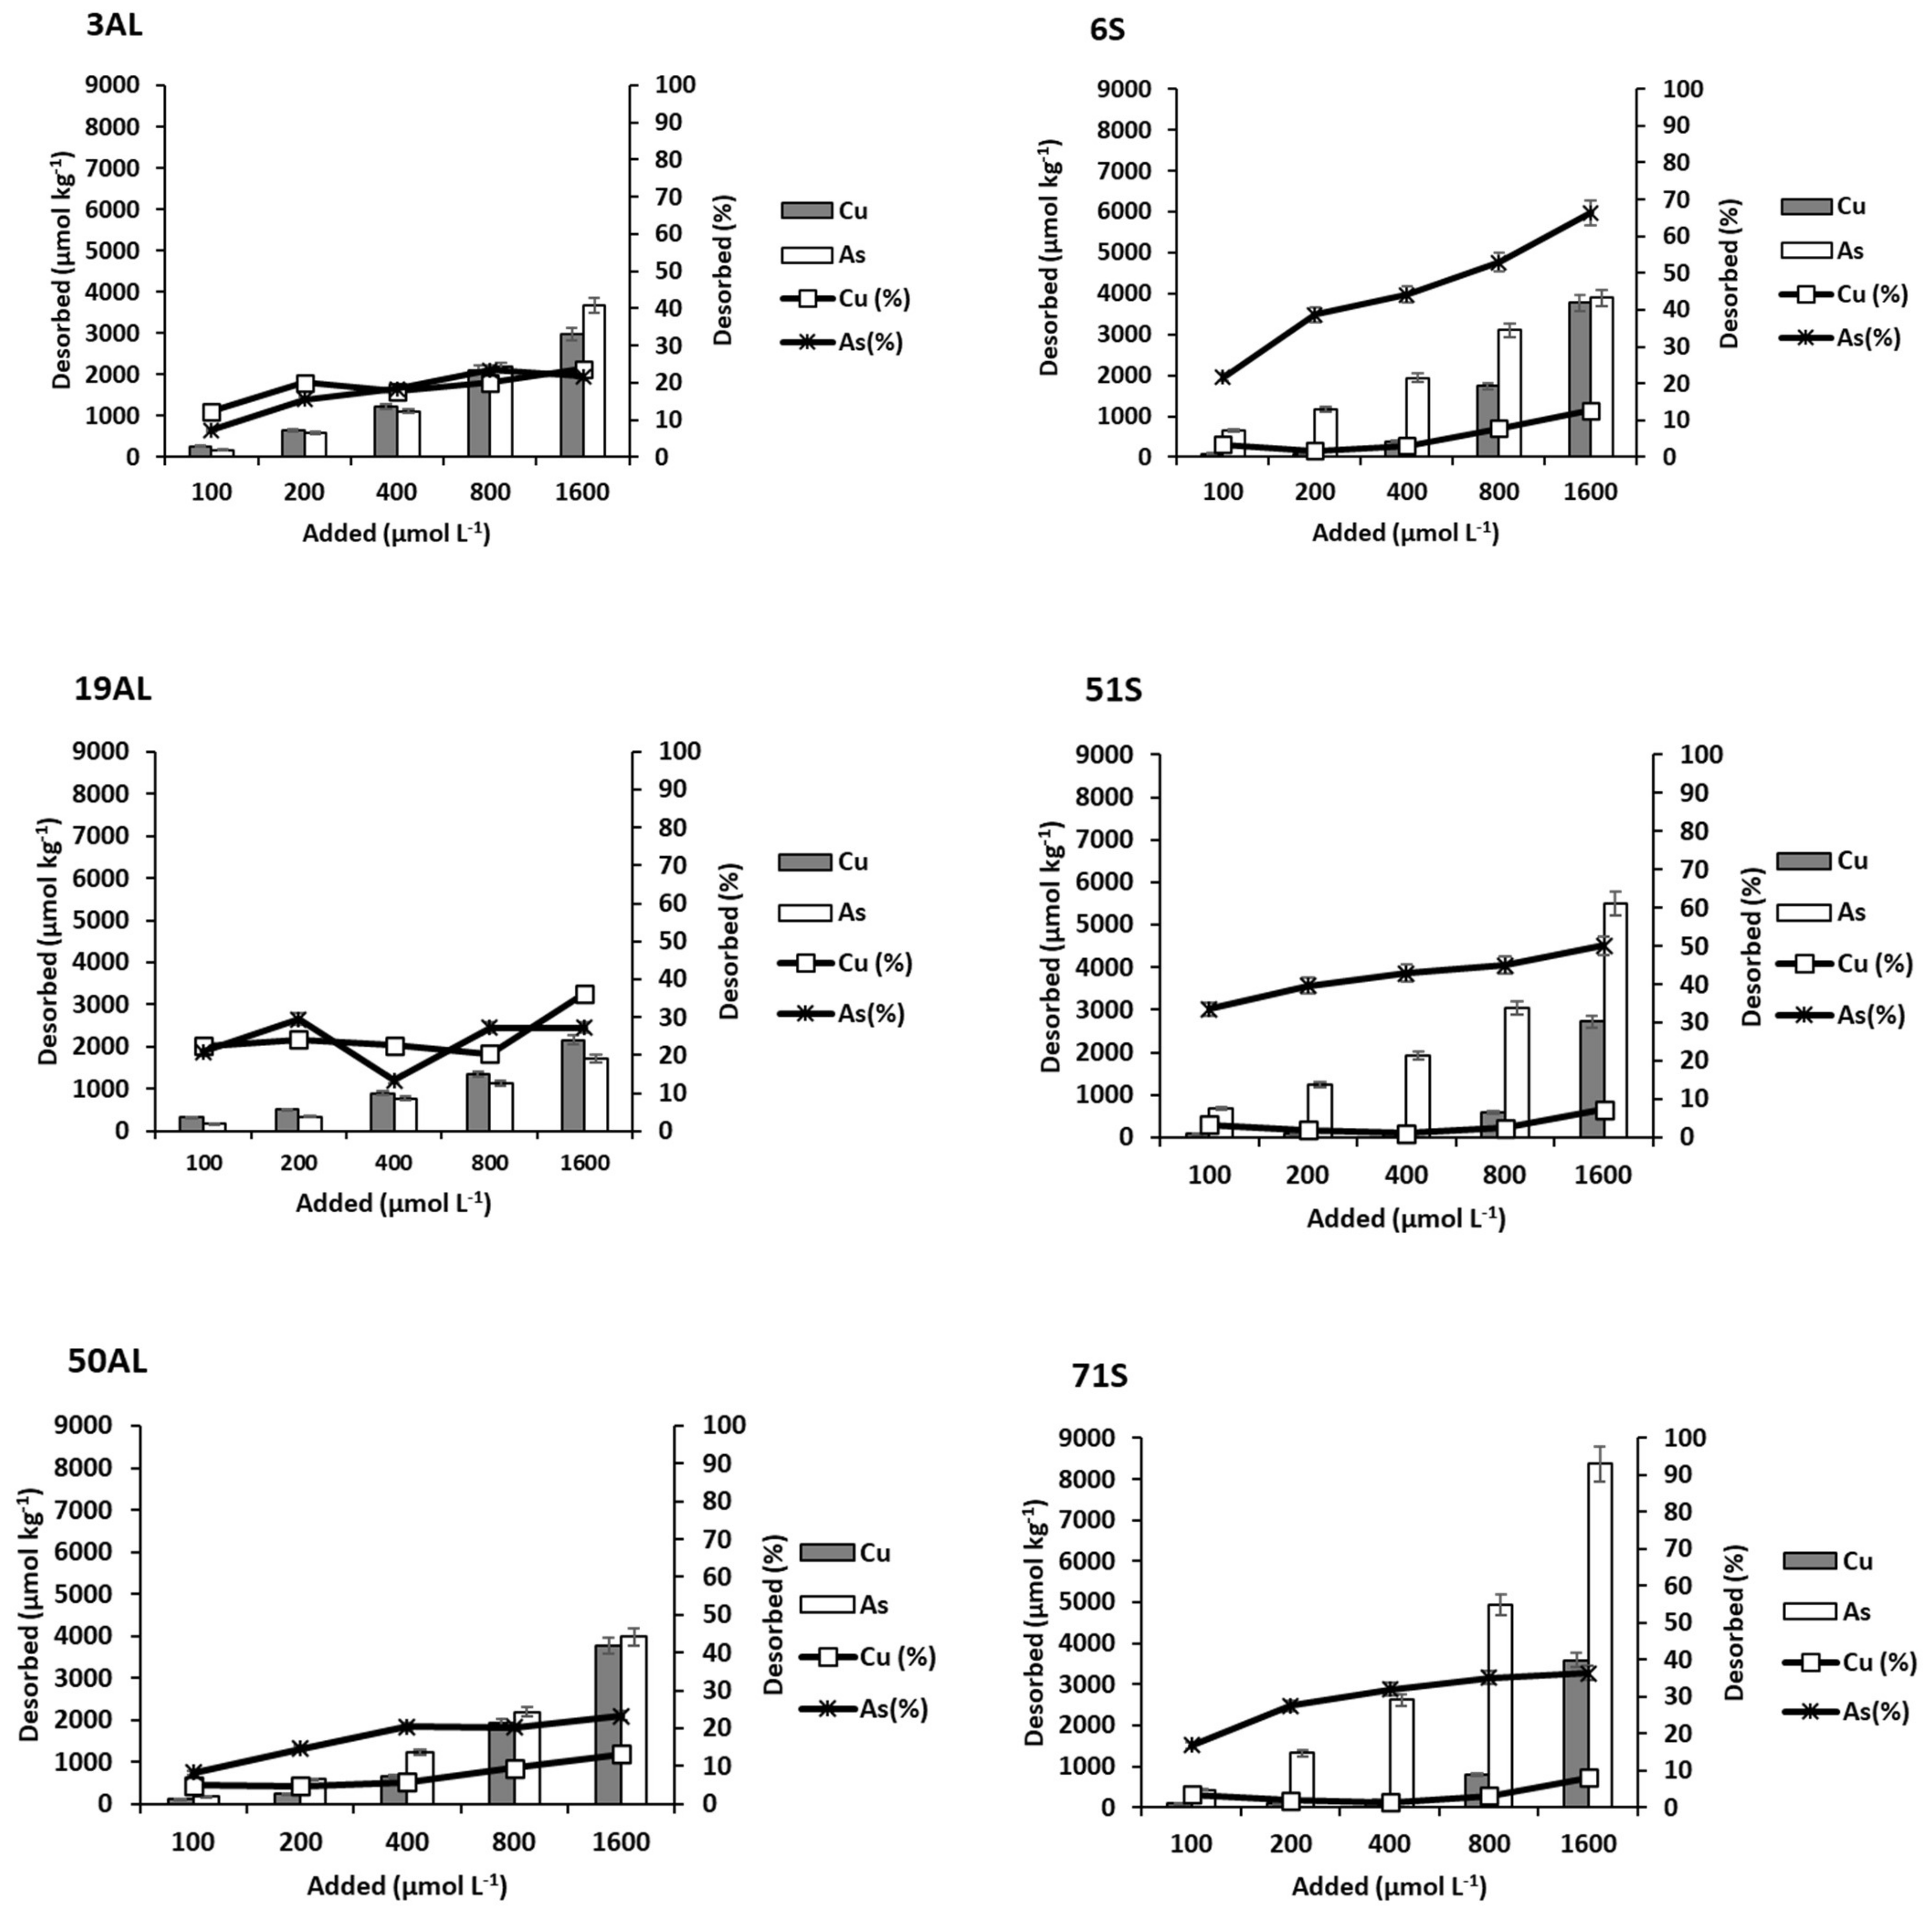
3.2. Cu and As(V) Desorption from Soils

Figure 4 shows the amounts of Cu and As(V) desorbed from the soils as a function of the concentrations added. As the added dose of each element increased, both the amount and the percentage desorbed were higher. All AL soils had a similar desorption of both elements, while S-zone soils (with higher pH) desorbed much more As than Cu (Figure 4).
In relation to Cu, desorption was much higher from AL soils than from S soils (the latter having a higher surface area). The maximum percentage values for AL soils were between 39% of the soil with less organic matter (19AL) and 12% of the one containing most organic matter (soil 50AL), while the range for the S zone was narrower: between 15% (soil 6S) and 5% (soils 51S and 71S). In general, soils with low desorption values match those with high adsorption scores.

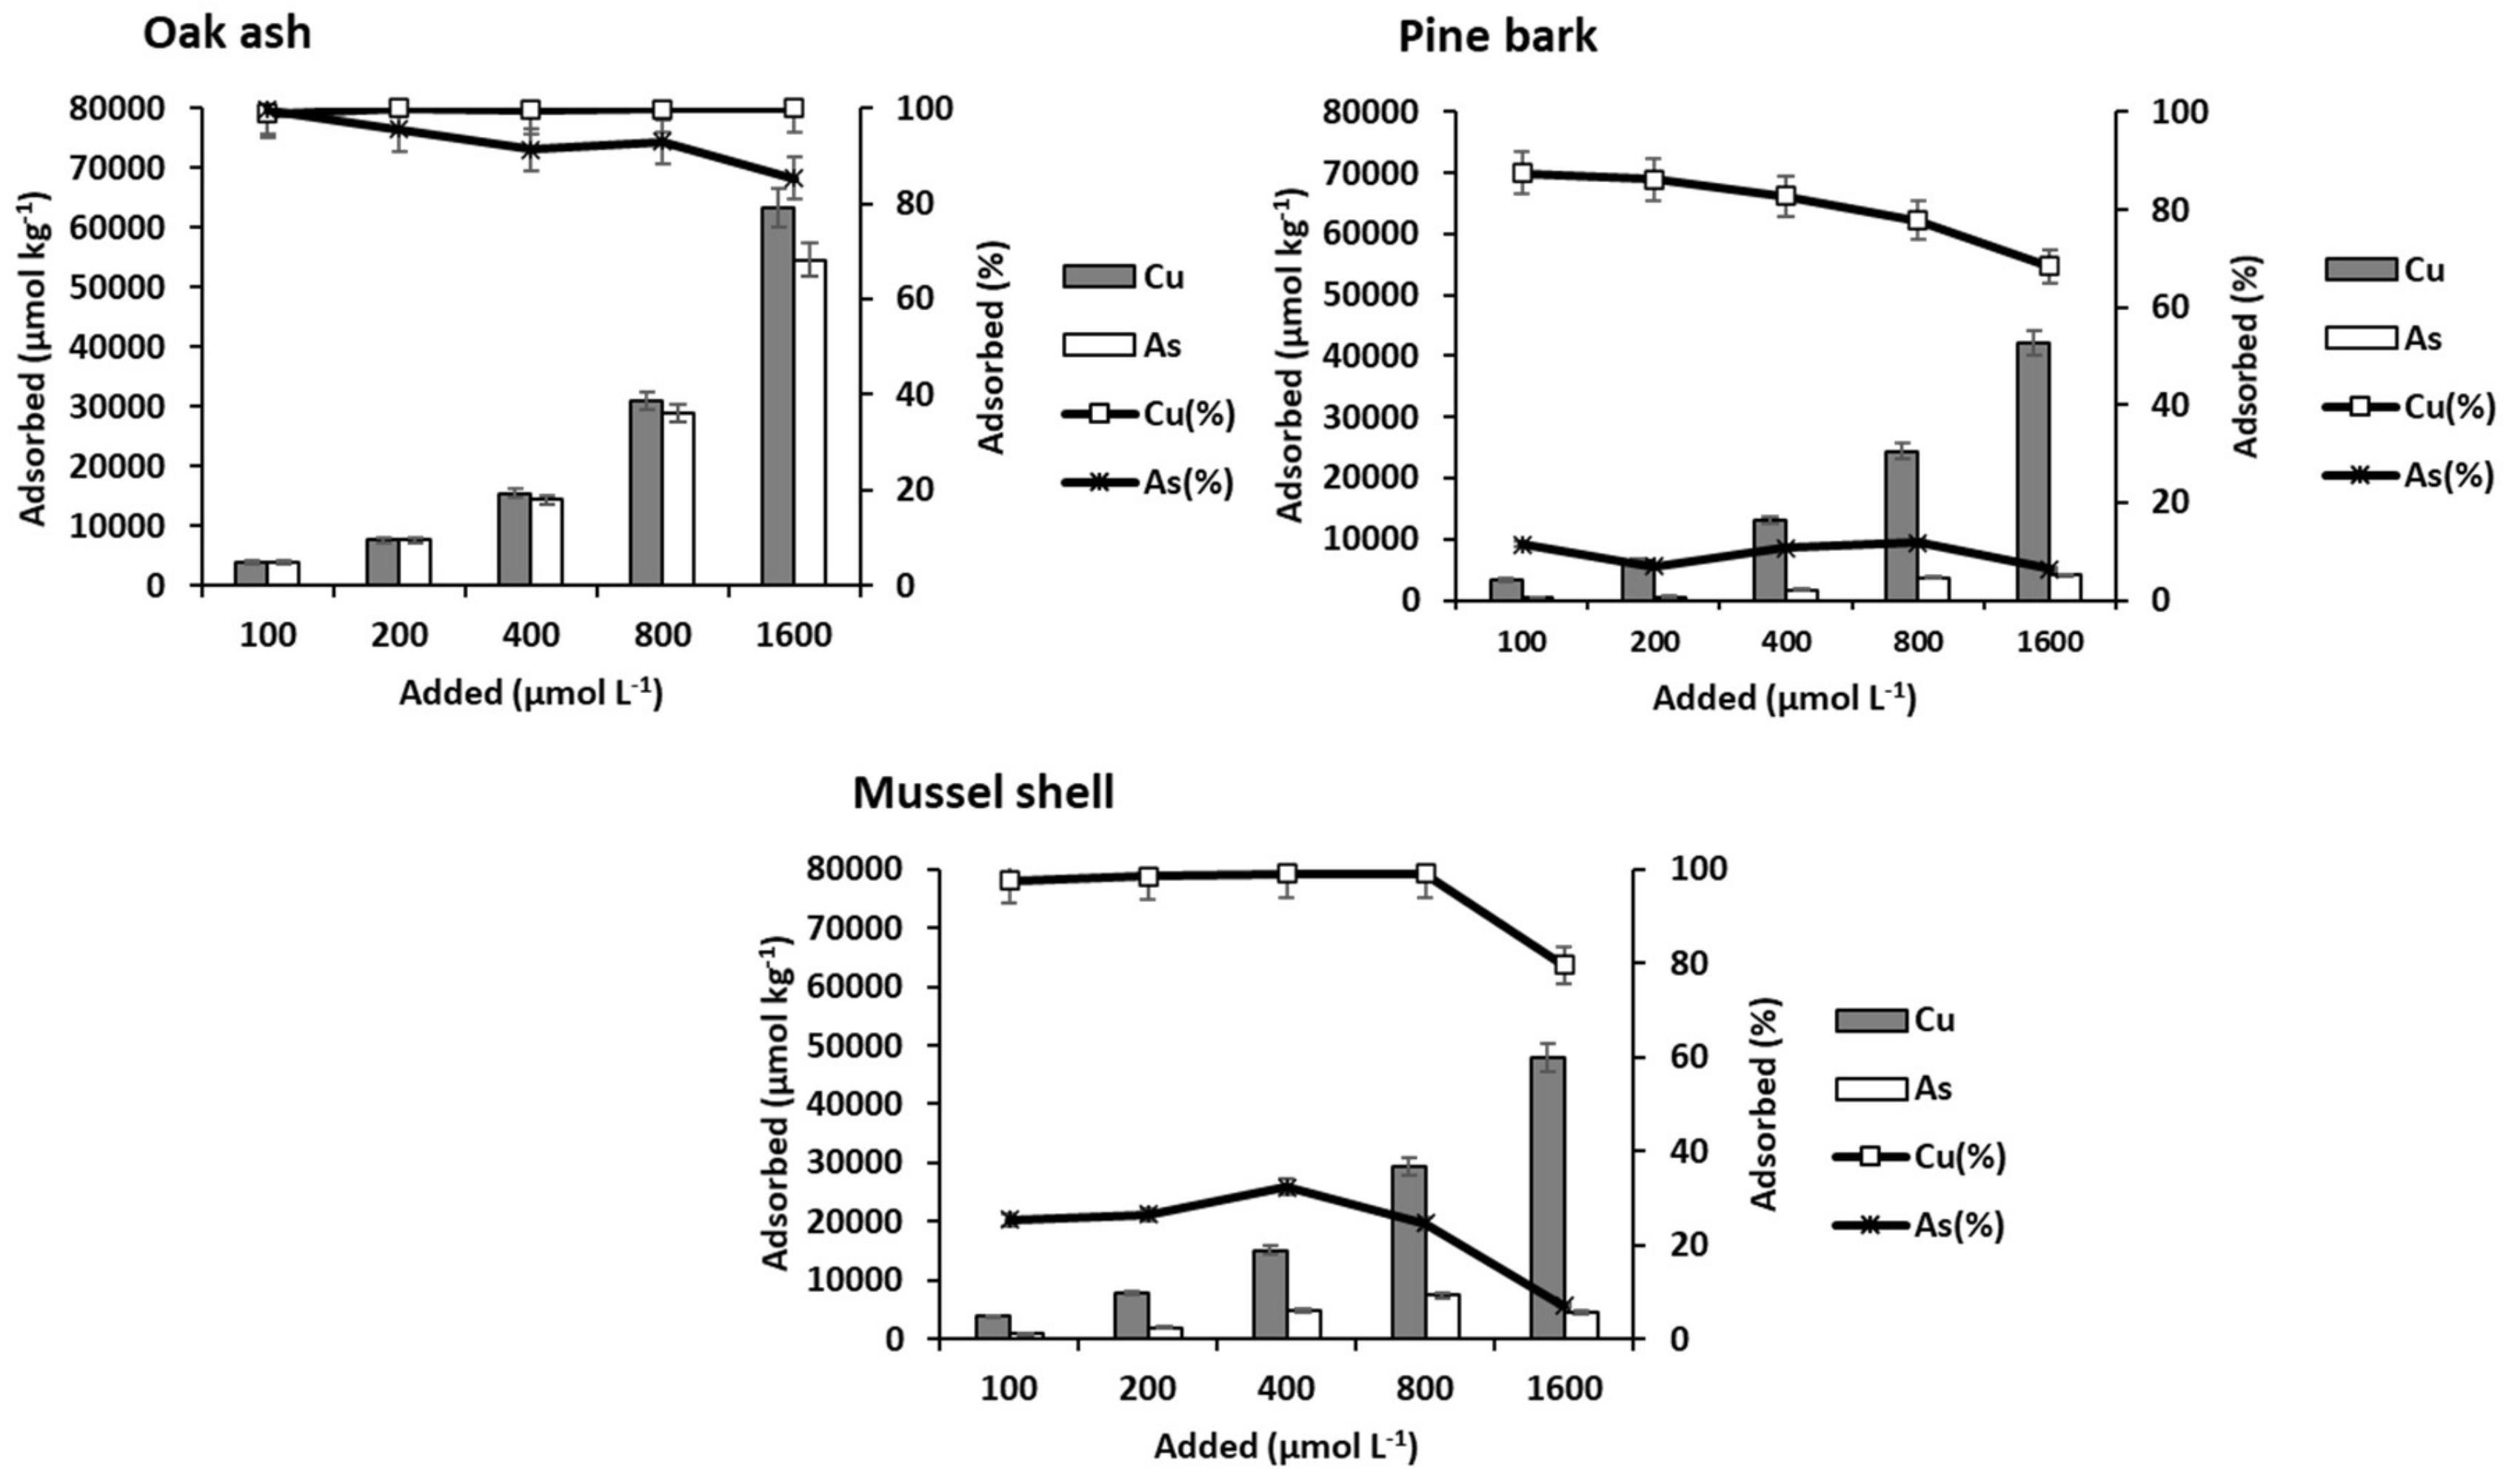
3.3. Cu and As(V) Adsorption onto the Three By-Products

Figure 5 shows Cu and As(V) adsorption onto the three by-products as a function of the concentration added. Adsorption was always much higher for Cu than for As(V), especially for pine bark and mussel shell, while for oak ash, the differences were clearly smaller, although becoming more evident as the added dose increased.
In relation to Cu, its adsorption increased in all cases as a function of the concentration of Cu added. At high doses of the pollutants, the differences among the by-products were more apparent, with the highest adsorption corresponding to oak ash, followed by mussel shell and pine bark. Mussel shell and especially oak ash have a pH clearly higher than that of pine bark (Table 2), which may influence the different adsorption on the three by-products. As the pH increases, the negative charge in the variable charge colloids rises, favoring cationic retention, as mentioned above for soils. In this sense, non-crystalline minerals, which provide a high variable charge, were much more abundant in oak ash than in mussel shell, which could explain why oak ash adsorbed more Cu.

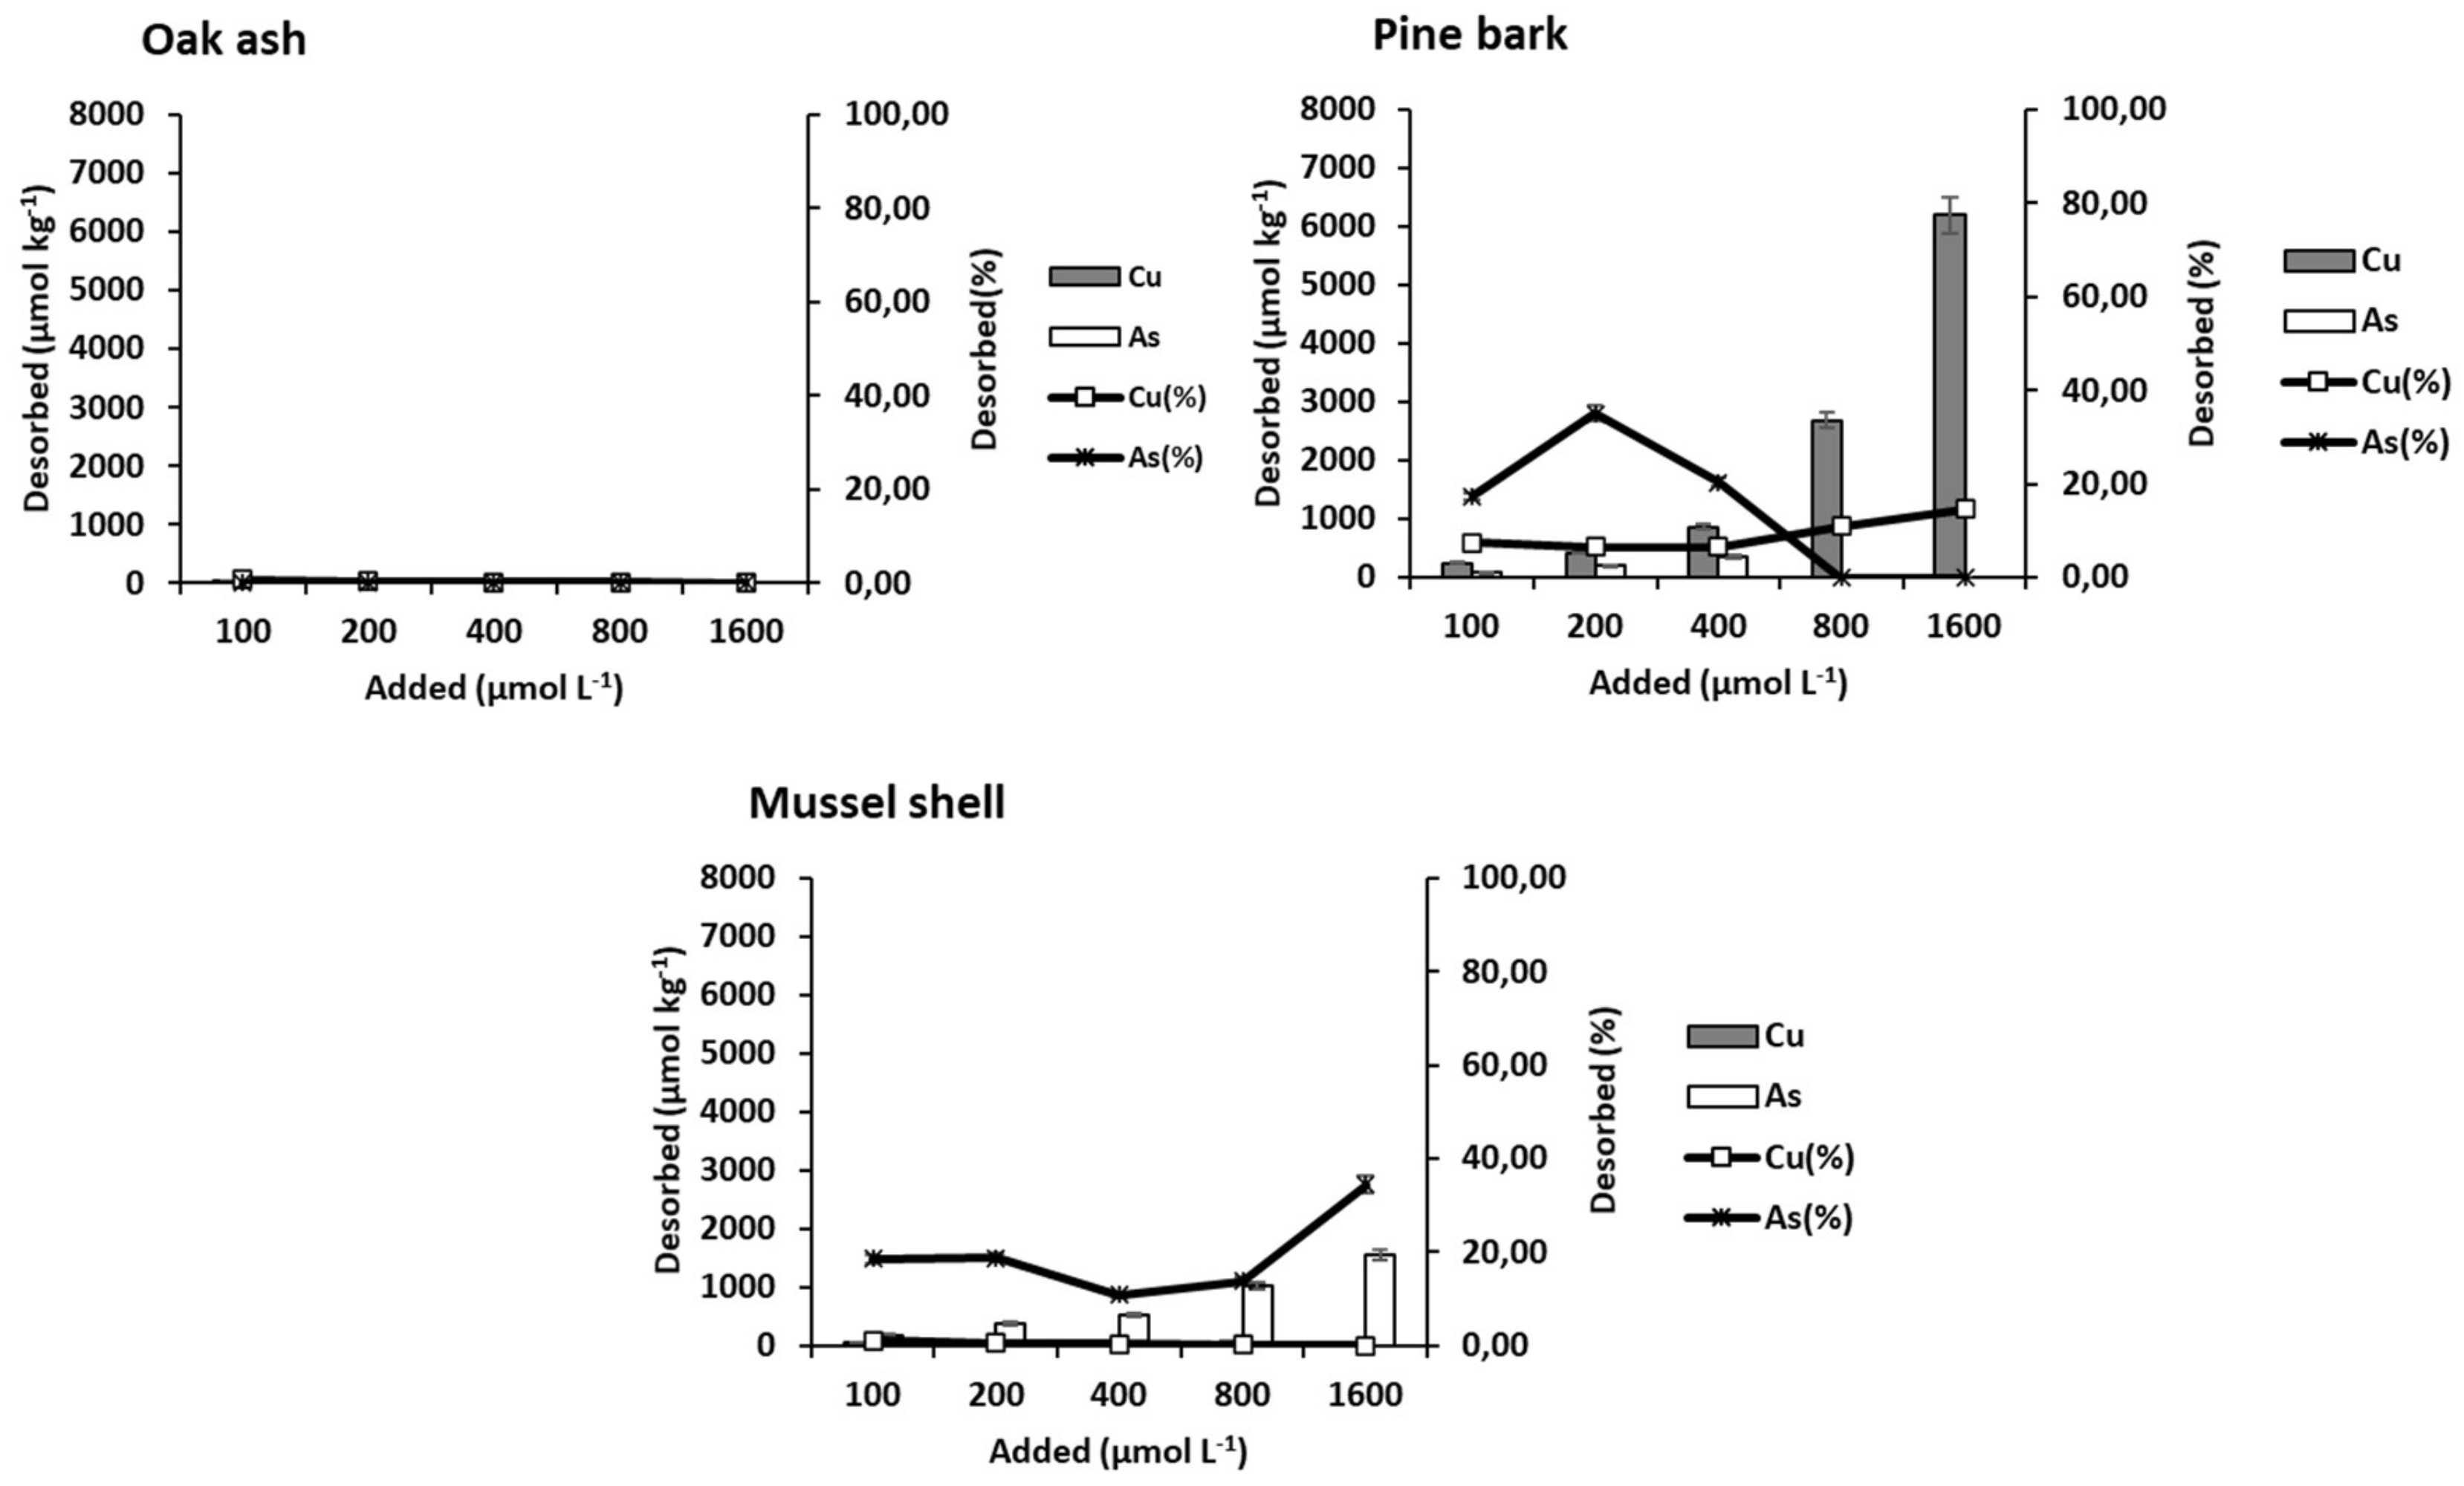
3.4. Cu and As(V) Desorption from the Three By-Products

Figure 6 shows data corresponding to Cu and As(V) desorption from oak ash, pine bark, and mussel shell. For Cu, the desorption sequence was: pine bark > mussel shell ≥ oak ash (inverse to that of adsorption). Cu desorption was low from oak ash and mussel shell, with the maximum desorption value being 30.5 µmol kg−1 for oak ash and 70.16 µmol kg−1 for mussel shell. For pine bark, desorption rose remarkably when increasing the concentration of added Cu, with the minimum value being 246.66 µmol kg−1 and the maximum reaching 6188.55 µmol kg−1. This by-product has a very high concentration of organic C, clearly higher than those of oak ash and mussel shell, with organic matter being responsible for retaining much of the Cu added.

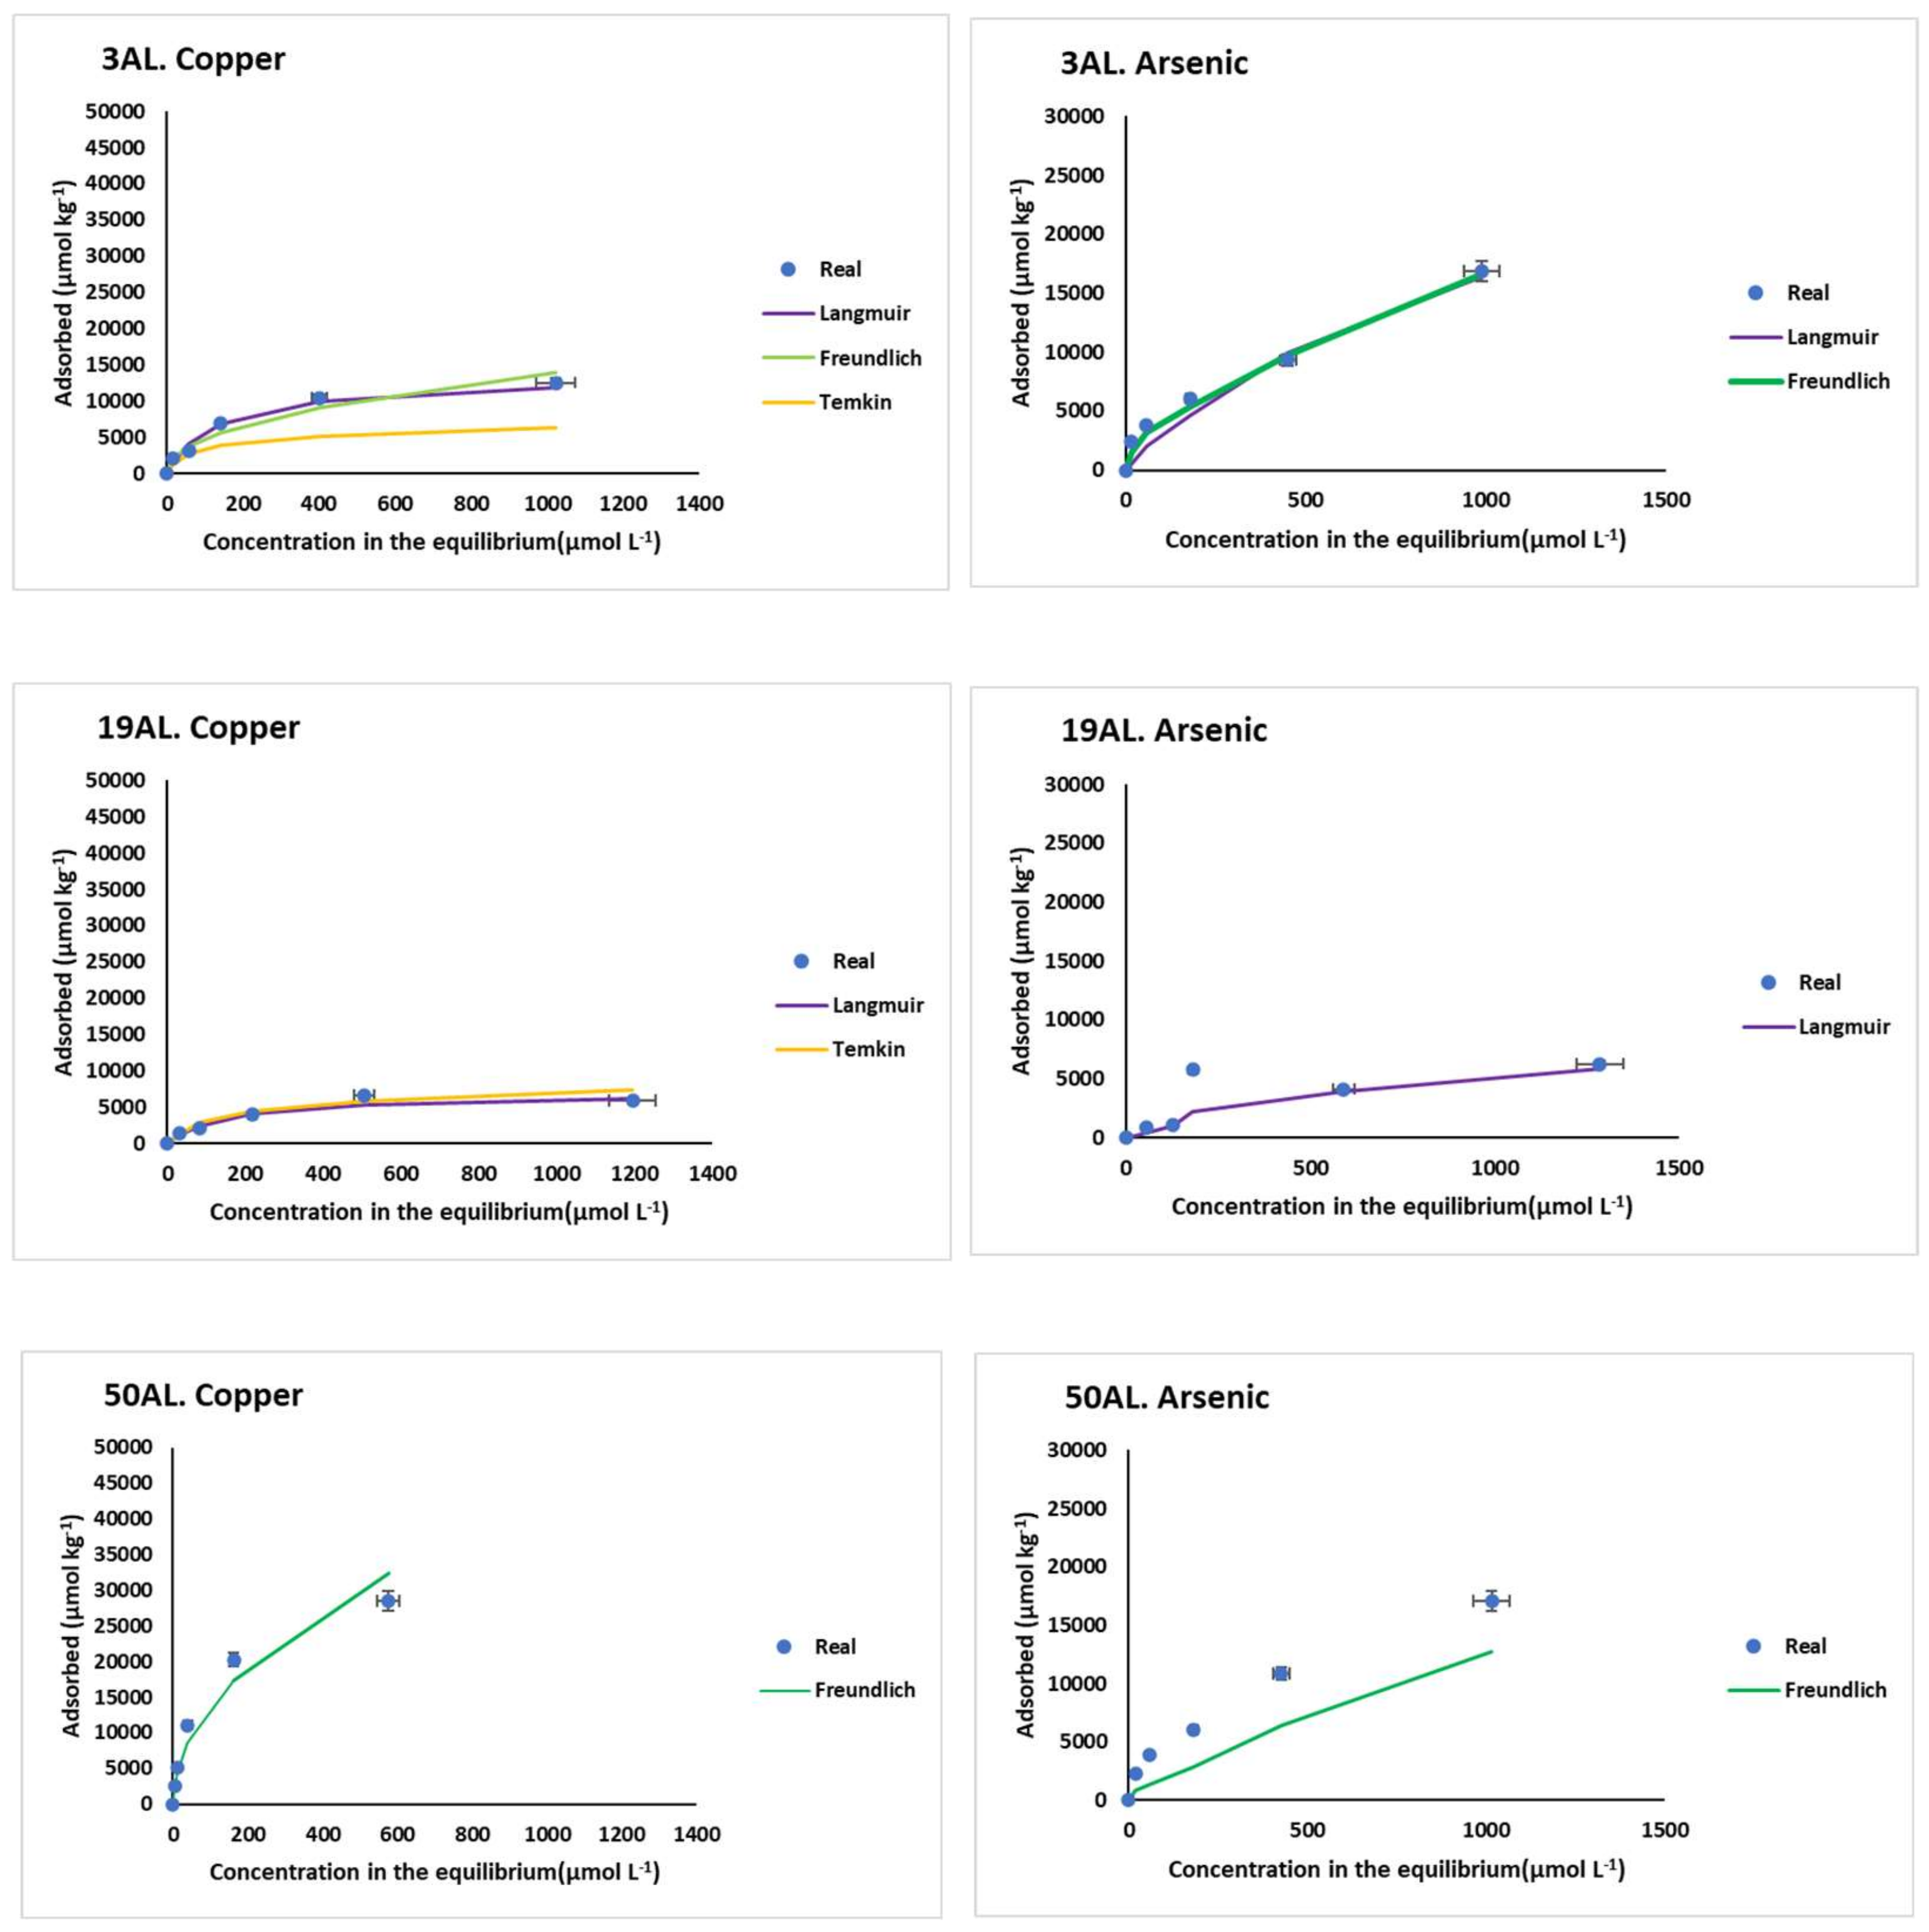
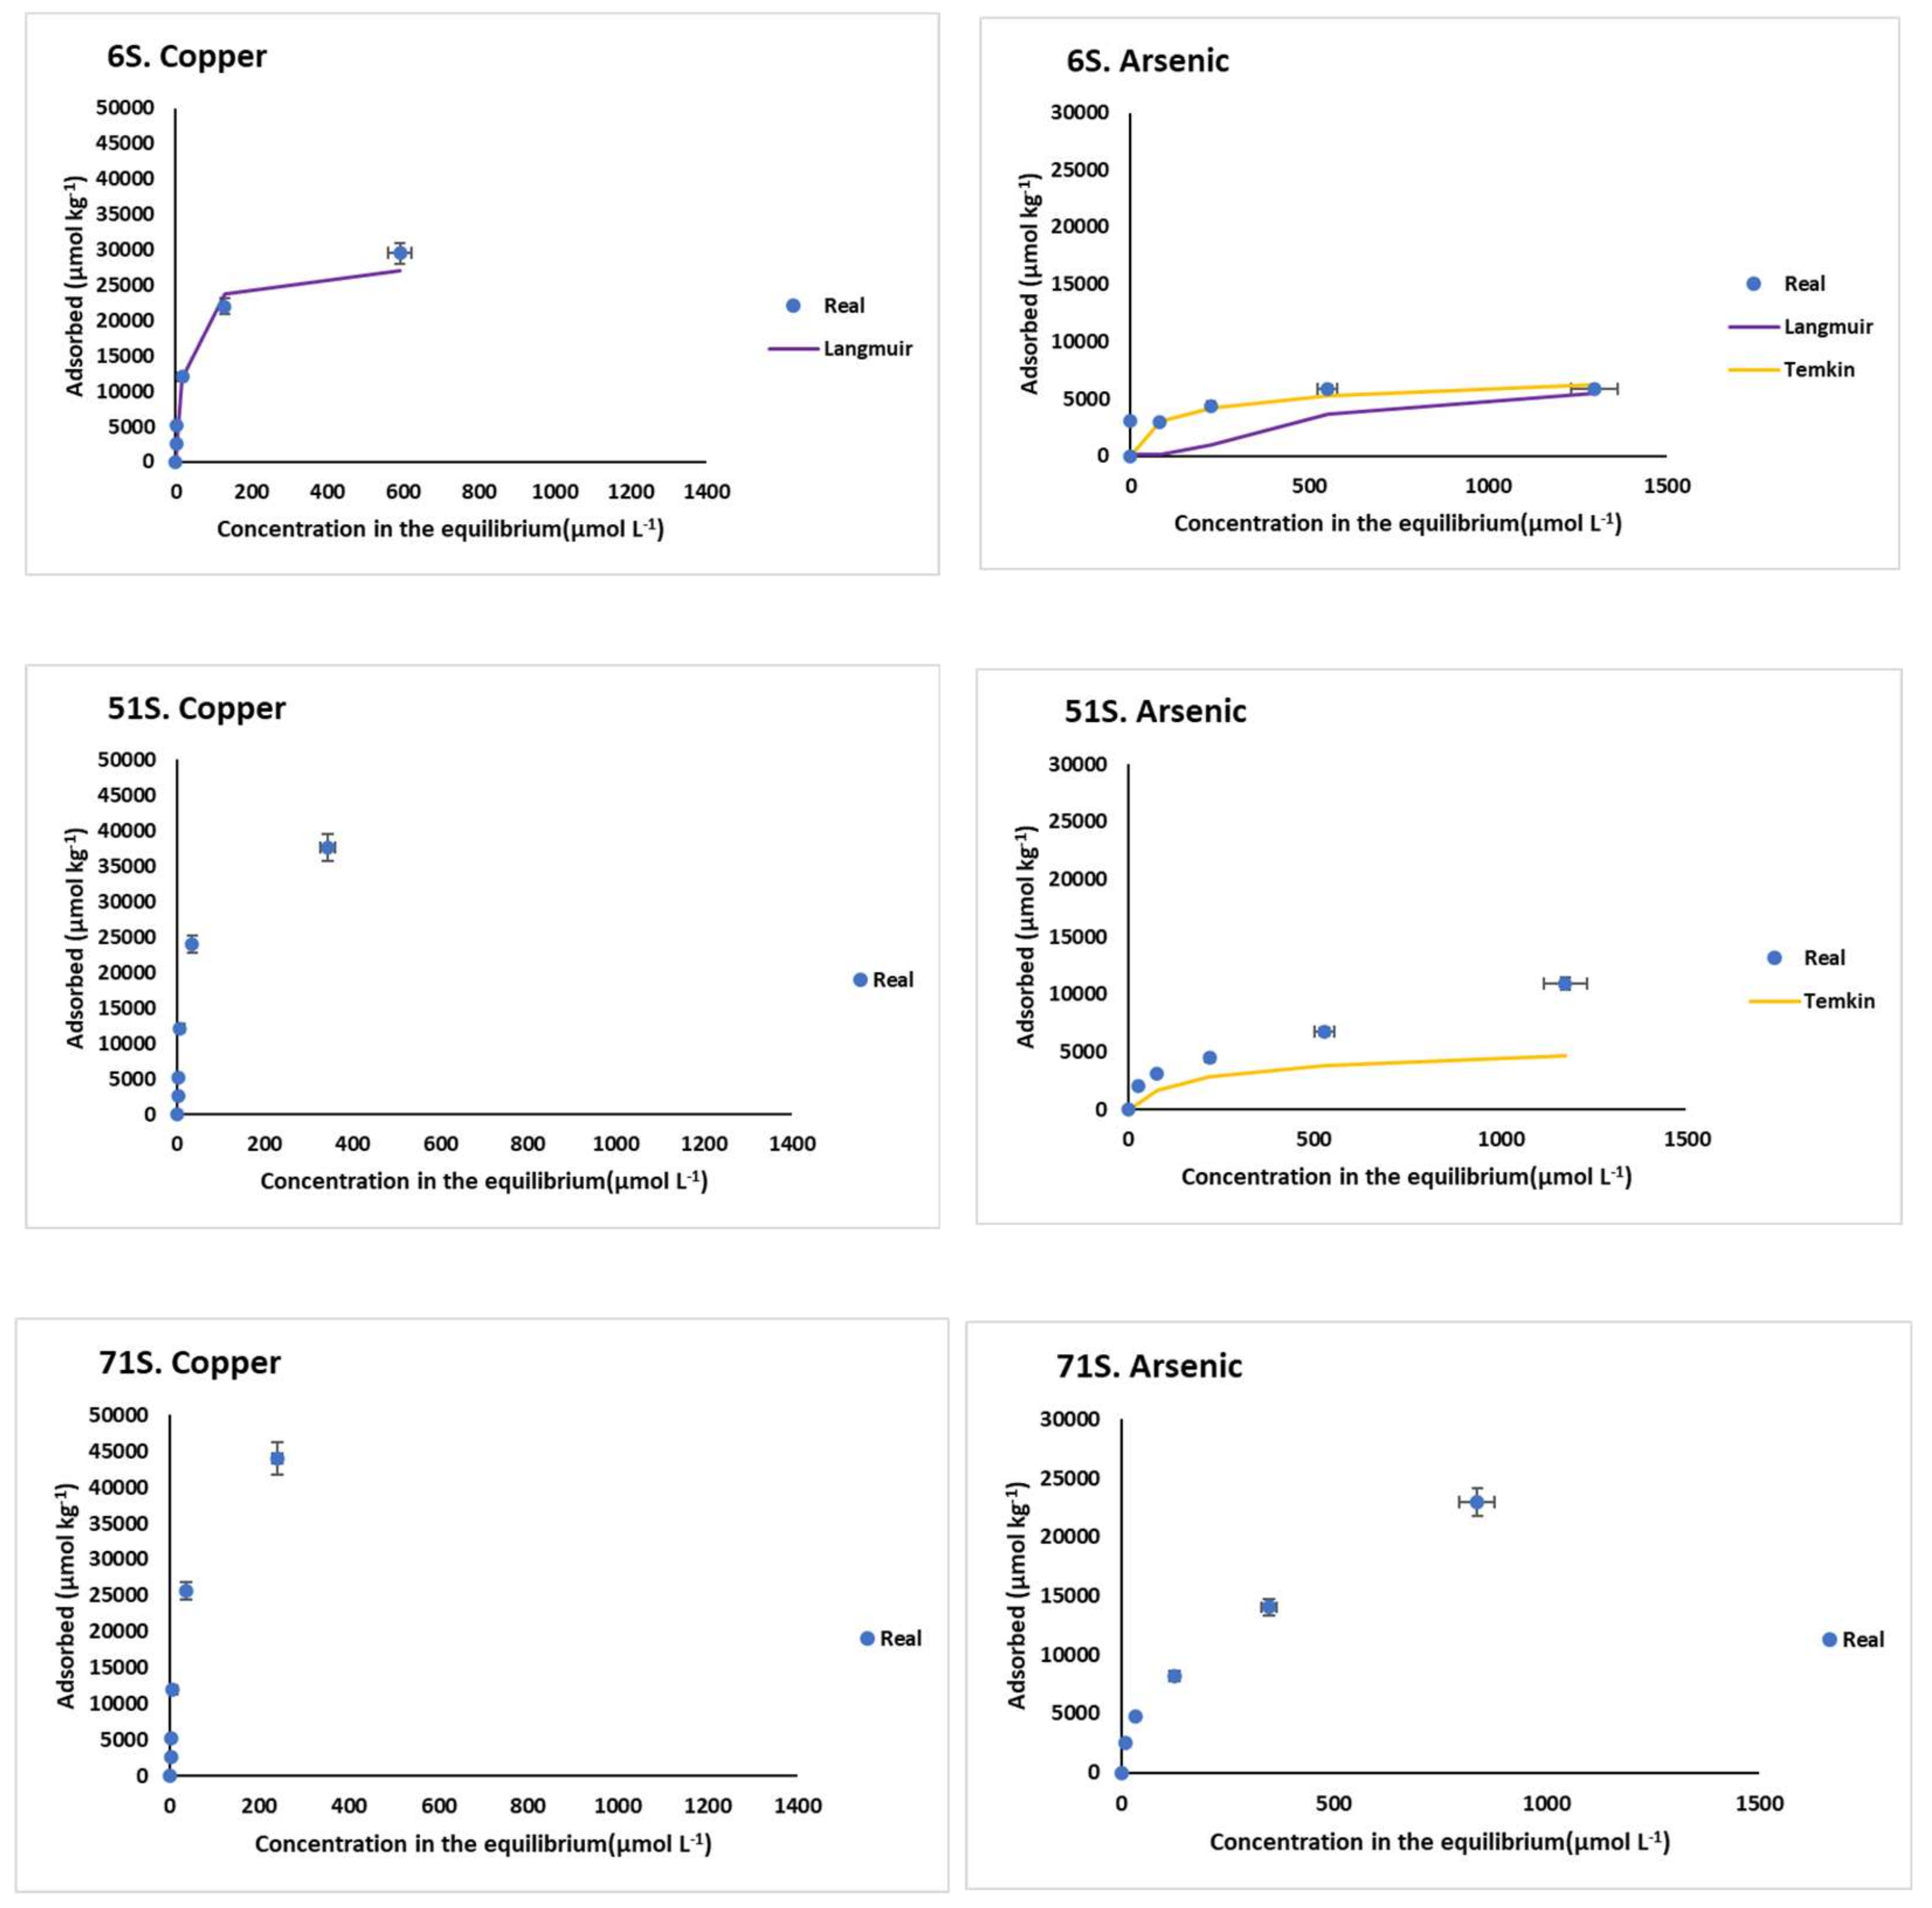
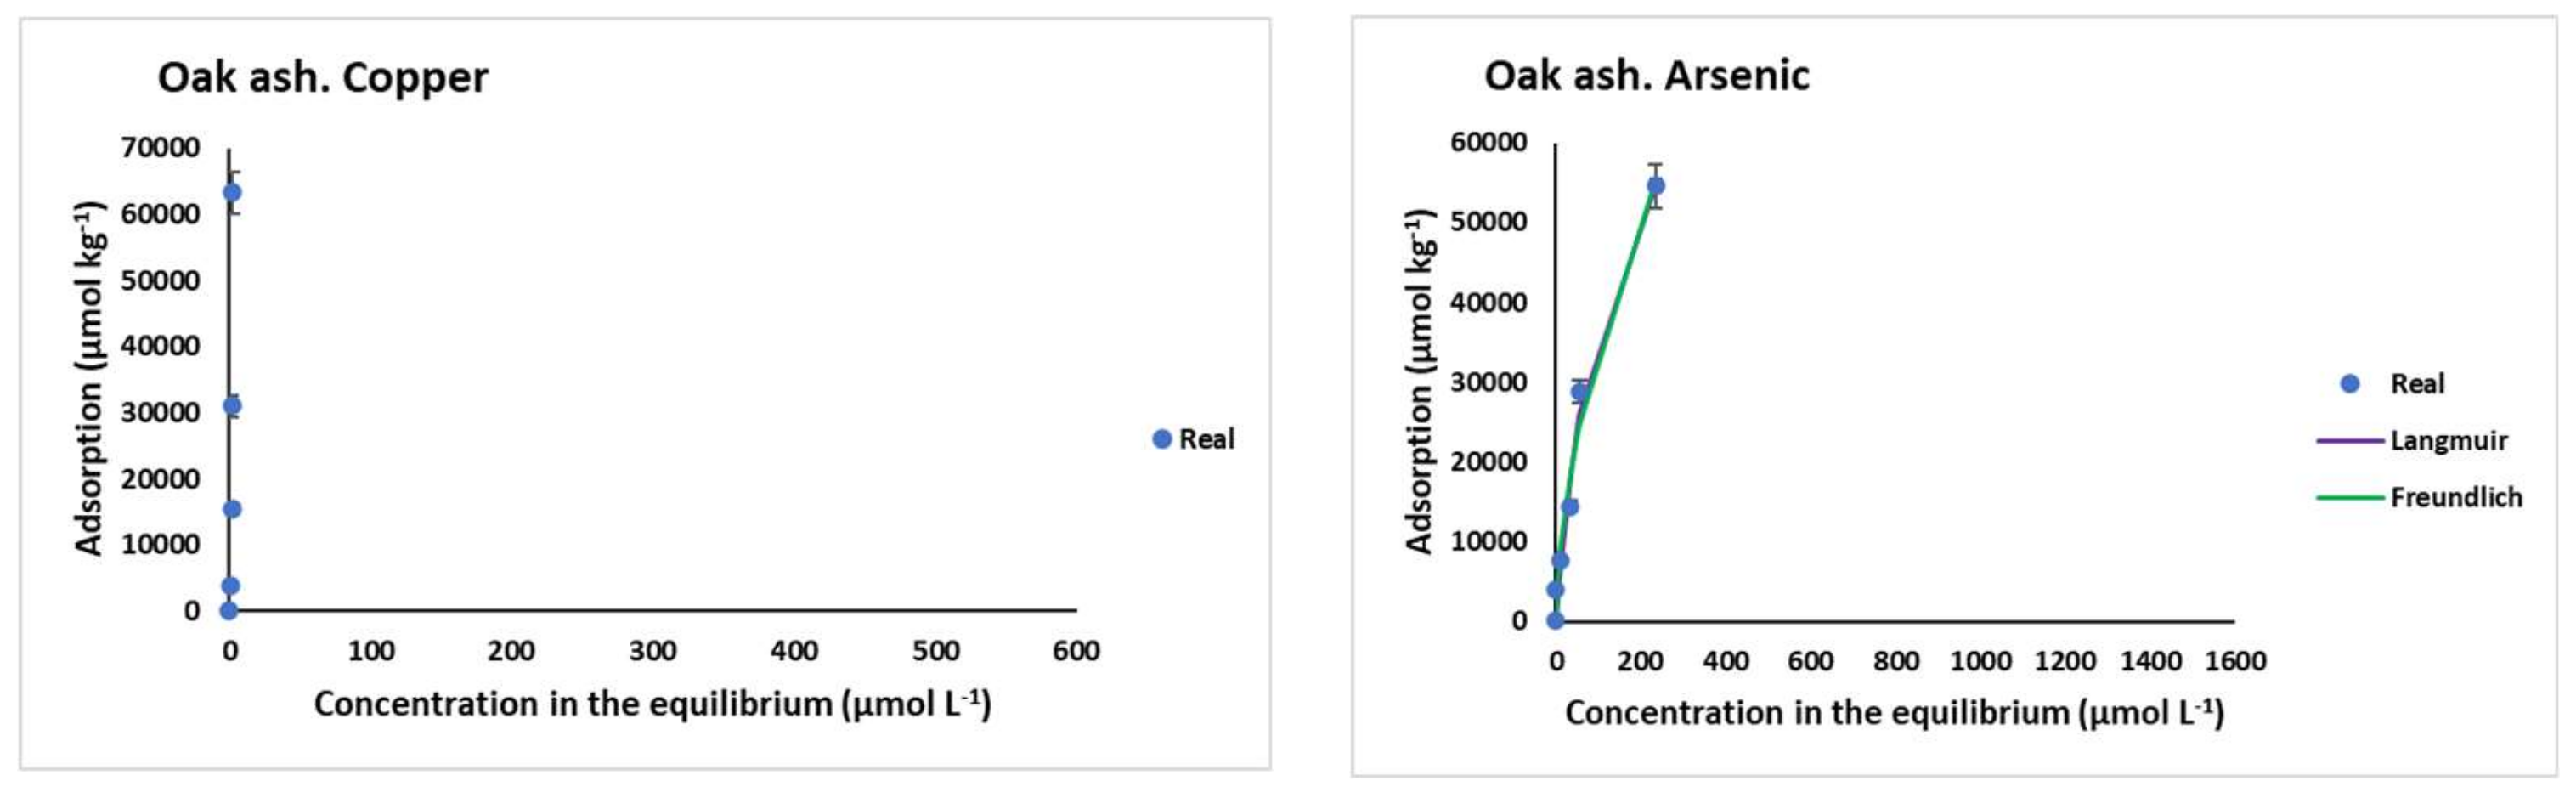
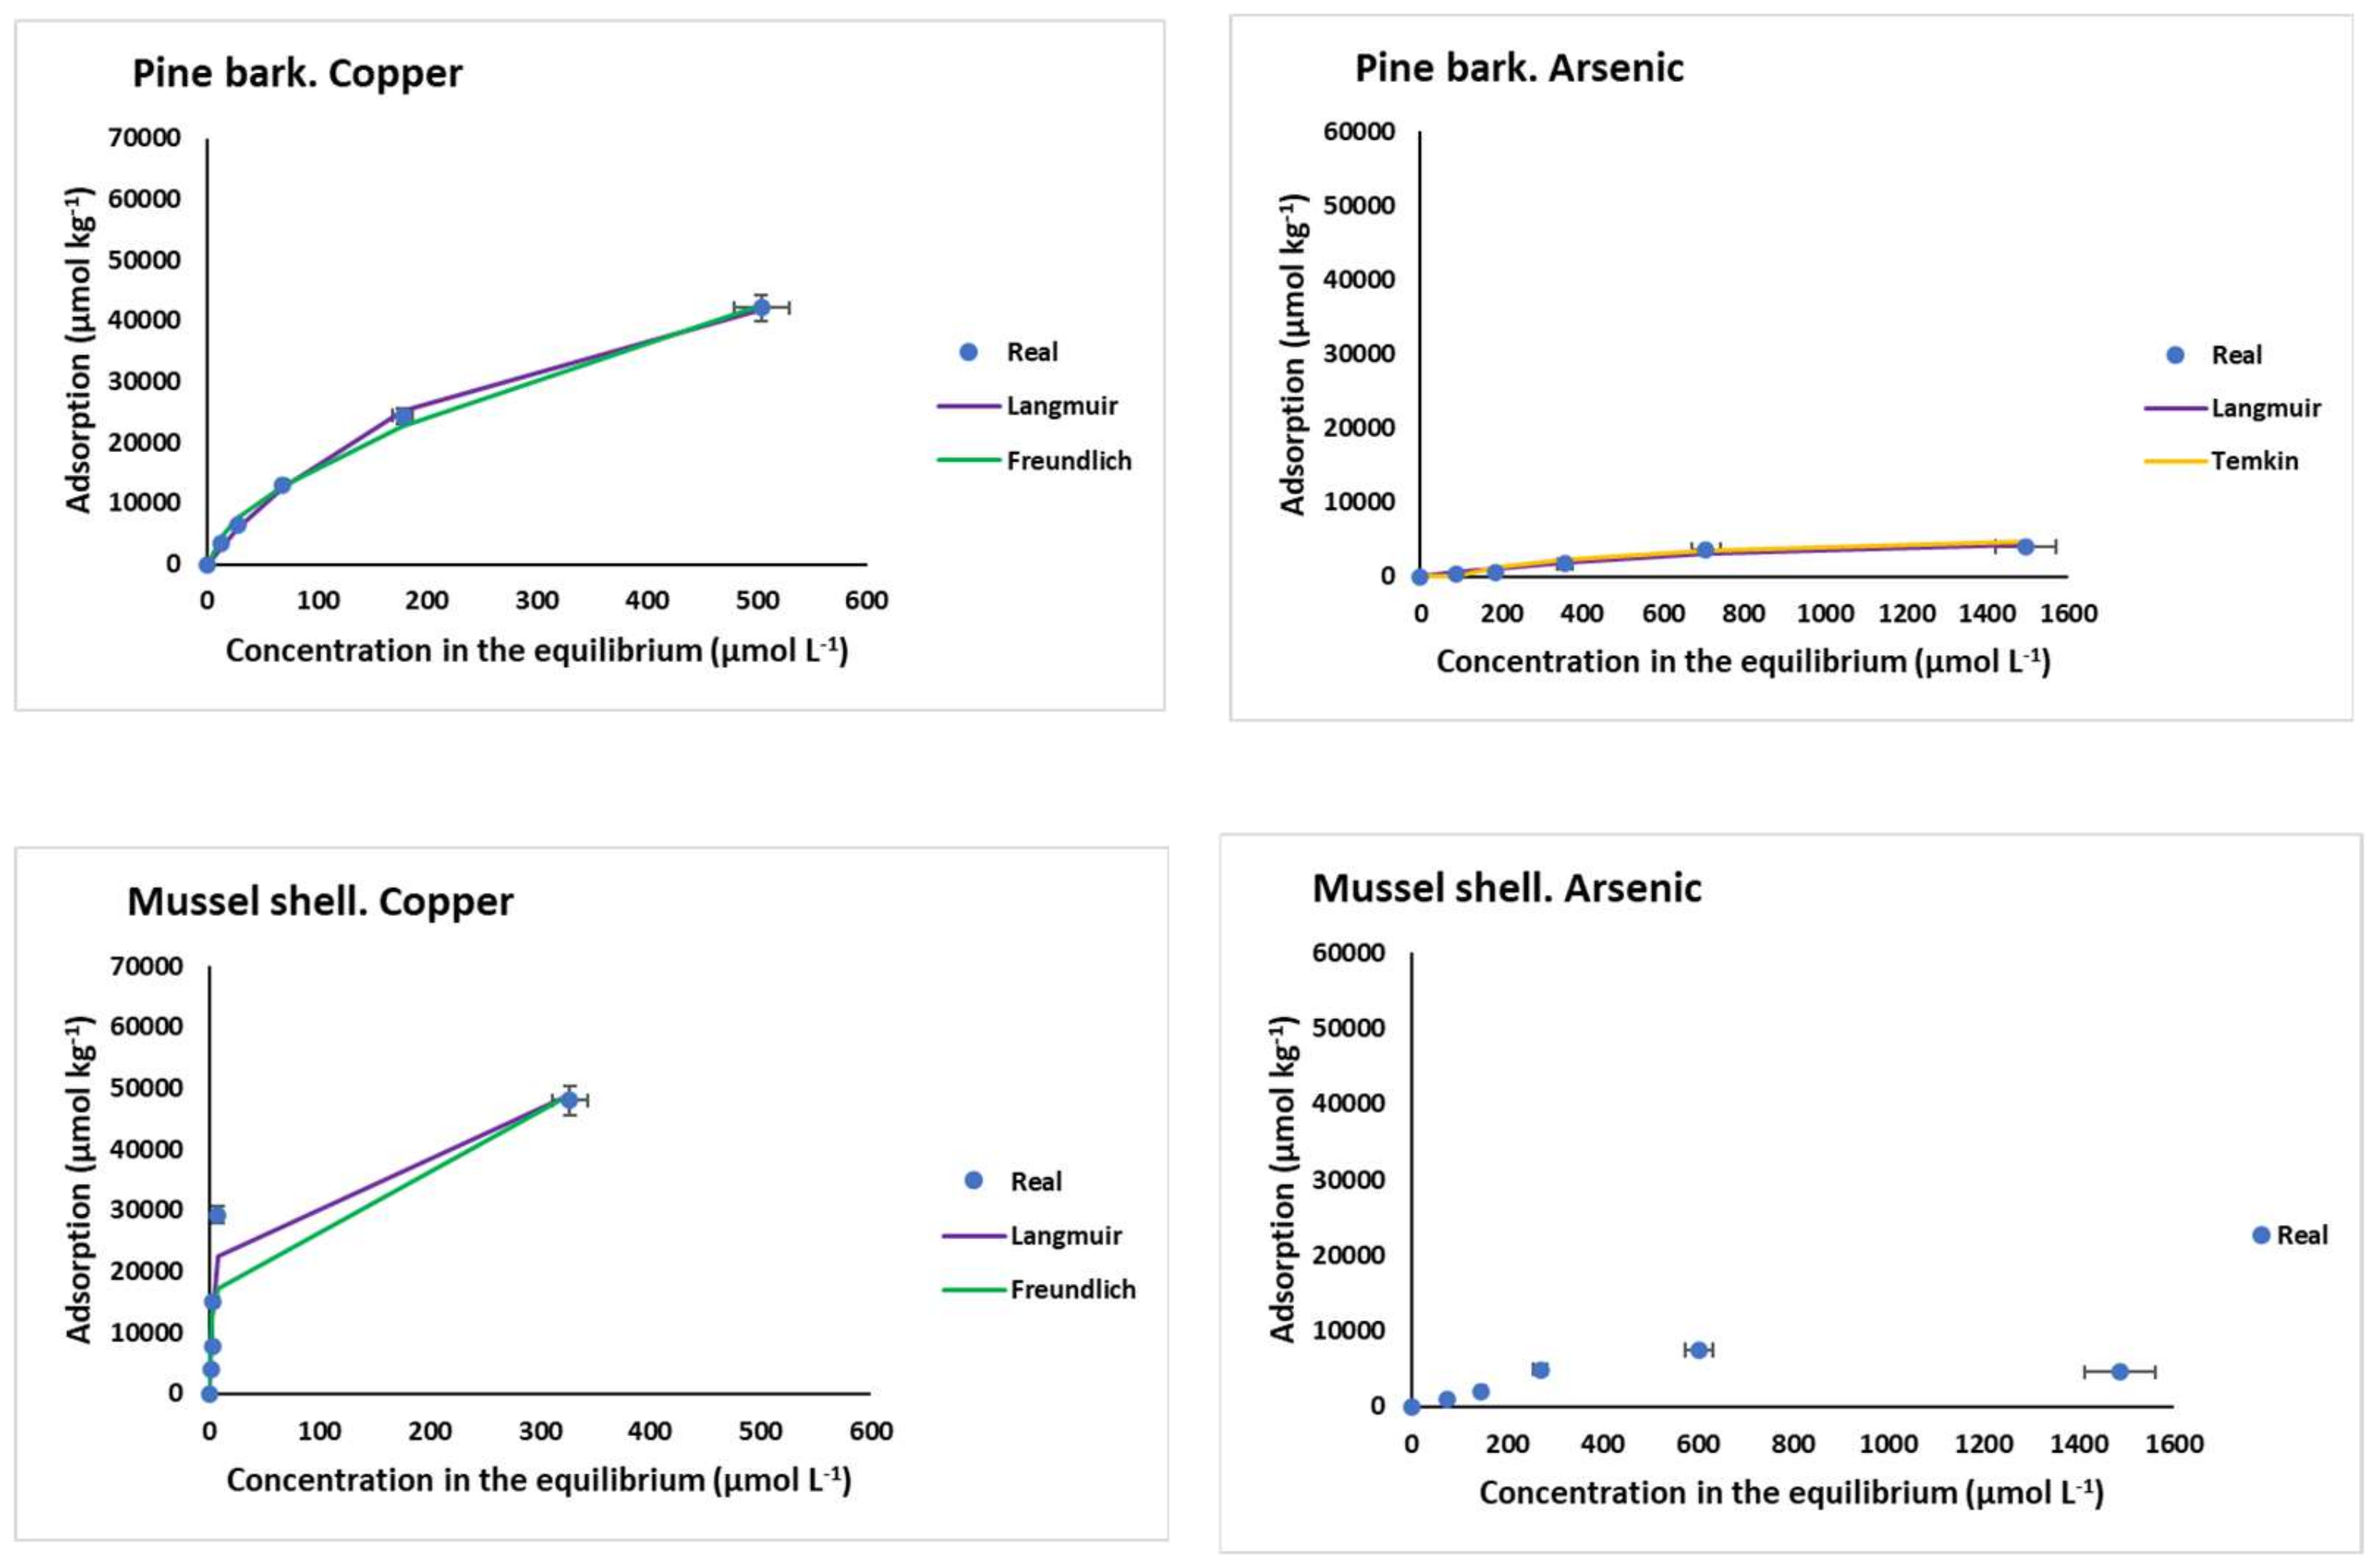
3.5. Fitting of Cu and As(V) Experimental Data to Different Adsorption Models

Cu and As(V) adsorption can be partially fitted to the Langmuir (Table 4), Freundlich (Table 5), and Temkin (Table 6) models. The three models for both elements have R2 values ranging between 0.784 and 0.999 for Langmuir, 0.845–0.999 for Freundlich, and 0.732–0.999 for Temkin.

4. Discussion

4.1. Cu and As(V) Adsorption onto Soils

The influence of organic groups on Cu adsorption shown in the current research has already been pointed out by other authors [42], and, in the current study, it is supported by the significant and positive correlation obtained between Cu adsorption (when the maximum dose is added) and soil organic matter content (r = 0.53, p < 0.05). However, there are other factors that influence adsorption, as indicated by the fact that both the amount and the percentage of Cu adsorbed were always higher in S soils (which are those that have higher pH values, as well as a higher surface area) compared to AL soils. This would indicate that adsorption is a pH-dependent process and is related to the influence of this parameter on the solubility of metal ions and also on the ionization state of functional groups of adsorbent surfaces (variable charge components) [43,44]. In this sense, soils with a higher pH have more negative charges in the variable charge components, mainly in organic matter, but also in non-crystalline components, which are also much more abundant in S soils (Table 1).
The effect of non-crystalline Fe and Al minerals on Cu adsorption has been reported by several authors [45,46] and attributed to Cu-specific complexation and adsorption reactions onto non-crystalline oxy-hydroxides. Supporting the latter, in the present study, a significant (p < 0.05) and positive correlation was obtained between Cu adsorption and Feo (r = 0.812), and also with the sum of Feo and Alo (r = 0.819), parameters that estimate the content of non-crystalline minerals. A significant and positive correlation was also found between Cu adsorption and eCEC (p < 0.01, r = 0.946). In addition, performing a successive steps regression, it was obtained that eCEC (in which organic matter and non-crystalline minerals are of great importance) explains 87% of Cu adsorption. This clear influence of eCEC is indicative of the importance of charges present in soil colloids for adsorption. It is also worth noting the decrease in pH in the equilibrium solution as the adsorption of Cu increases (Table 3), finding a significant and negative correlation between both parameters, with p < 0.01 for soils 51S (r = −0.99), 71S (r = −0.99), and 19AL (r = −0.96), and with p < 0.05 for soils 3AL (r = −0.94), 50AL (r = −0.96), and 6S (r = −0.897), which could be related to the proton exchange taking place in the Cu adsorption process.
Regarding As(V), differences in adsorption were no so clear for S and AL soils (Figure 3). This would indicate that soil pH does not have such an obvious effect on As adsorption, compared to Cu. Several authors indicate that As(V) can be adsorbed over a wide range of pH. Specifically, Stanić et al. [47], using zeolite as adsorbent, reported a range between 4.0 and 11.0, and Mamindy-Pajany et al. [48] found 100% adsorption for As on hematite in a pH range between 2 and 11. However, other authors have reported ranges not as wide, such as 6–8 for alumina impregnated with La3+ and Y3+, or a range of 2–4 for molybdenum-impregnated chitosan [49,50]. Recently, Yusof et al. [51] reported a range of 3–7 using palm oil combustion ash. It should be noted that, under oxidizing conditions and at a low pH, arsenate is dominant, mainly as H2AsO4, while as the pH increases the predominant species would be HAsO42− [52,53,54]. In acid soils, such as those in the AL zone of the current study, the H2AsO4 species would be adsorbed on variable-charge colloids, which would be positively charged due to protonation taking place at that low pH prevailing, and then adsorption could take place by means of electrostatic attraction. Within these colloids would be non-crystalline minerals [53], which are more abundant in soils 3AL and 50AL compared to 19AL, coinciding with the highest adsorption taking place in the former (Table 1 and Figure 3). Several authors have found that arsenates are strongly adsorbed to these kinds of Al (and especially Fe) compounds, and the adsorbed amounts can be significant even with low concentrations of As present in the liquid phase [55,56]. In the current study, the zone S soils have high concentrations of non-crystalline minerals of Fe and Al compounds (mainly oxy-hydroxide), and, although these soils have higher pH values than those of zone AL, it is below the pH of the zero point of charge (zpc) of these minerals (between 8.7 and 9.1) [57], with which these colloids would be positively charged, and adsorption could also occur by electrostatic attraction. Other colloids would present a negative charge at pH around 6, as would happen with soil organic matter. In these cases, adsorption can be performed through a cationic bridge and/or by ligand exchange. In relation to the latter, significant and positive correlations were found between the pH in the equilibrium solution and As adsorption in soils 3AL, 50AL, and 51S (r = 0.987, 0.992, and 0.997, respectively, p < 0.01) and in soil 71S (r = 0.978, p < 0.05) (Table 3). This increase in the equilibrium pH in the adsorption process is in line with findings previously reported [53,58], which would be justified by an exchange of ligands between the species H2AsO4 or HAsO42− and OH groups, which are released in the solution.
In addition, the influence of organic matter on the adsorption of As is also present. In the S zone, adsorption was higher in the soil with the highest organic matter content (soil 71S), compared with the other two (soils 51S and 6S). However, this influence is not as obvious as for Cu, since both 50AL and 3AL soils (with very different concentrations of organic C, Table 1) have a similar As adsorption capacity (Figure 1). As mentioned above, expressing As(V) adsorption as a percentage (Figure 3), a decrease is observed when the concentration added rises, which is due to the afore-mentioned saturation of the adsorbent surfaces. In AL soils, the As(V) adsorption percentage dropped from 75–80% to 30% (for soils 3AL and 50AL), and from 30–40% to 11% for the one with less organic matter content (19AL). In S soils, the largest decrease in the As(V) adsorption percentage, due to the rise in the concentration added, took place for soil 6S (from 100% to 10%).

4.2. Cu and As(V) Desorption from Soils

It should be borne in mind that different soil factors can influence the desorption of metals and metalloids. Several authors highlight the influence of pH on the desorption of heavy metals from soils [59,60], since, with increasing pH, Cu desorption would decrease linearly, which in the present study could explain, in part, the differences observed between the soils of the two zones. Liang et al. [61], studying Cu desorption in rice-growing soils, attributed the decrease in desorption to the rise in soil eCEC, and this influence of eCEC was again pointed out by Zhanget al. [62]. This coincides with that obtained for the soils of the present study, since those with higher eCEC (S Soils) (Table 1) are those that desorbed less Cu (Figure 4).
Regarding As(V) (Figure 4), the high desorption taking place for all S soils (which are in the range of 3800–8400 µmol kg−1 for the maximum dose added) contrasts with the lower desorption found for AL soils (between 424 and 676 µmol kg−1). This represents a percentage of desorption that did not exceed 40% in the AL zone, while in the S zone, the desorbed proportion reached maxima between 40 and 67%. Again, the soils showing the highest As desorption are those that adsorbed the least (Figure 3 and Figure 4). By conducting a bivariate correlation study to find out how different soil parameters influence As(V) desorption, a significant (p < 0.05) and positive correlation was obtained with soil pH (r = 0.837) and non-crystalline Fe and Al compounds (r = 0.848). There is also a significant (p < 0.05), but negative (r = −0.875), correlation with the available phosphorus content. These results support the importance of pH in the desorption processes. As the pH increases, the positive charges on the colloidal surfaces (including those of the non-crystalline Fe and Al compounds) become negative, hindering the adsorption of As(V) in anionic form, causing the bonds to be more labile, while the opposite happens when acidity increases. This would explain the greater desorption of As(V) from S soils, with higher pH. A negative correlation with available P could indicate that arsenate ions compete with phosphate ions (which are often found bound to non-crystalline Fe and Al compounds with different adsorption energies), resulting in an increase in available P and an adsorption of As(V) with different holding forces. Results similar to these were found by Rahman et al. [63] studying the adsorption and release of As in contaminated soils, observing higher As(V) release as the pH increased, attributing it to electrostatic repulsion. These authors also pointed to the strong competition of arsenate with phosphate, which is much higher than with sulfate.

4.3. Cu and As(V) Adsorption onto the Three By-Products

According to Boim et al. [64], the decrease in Cu mobility as pH increases is due to the formation of insoluble complexes, and they also highlight the importance of non-crystalline Fe and Al oxy-hydroxides in the adsorption of Cu2+. In a study carried out on vineyard soils amended with mussel shell [65], a decrease in the available Cu was observed, which was related to the increase in soil pH, although it could also be affected by the direct adsorption of Cu onto the added mussel shell [66]. Pine bark, the most acidic material among the three by-products, has abundant organic matter with different functional groups, some of which may have a negative charge even at pH values < 3 [67], which would explain the adsorption values of Cu being just slightly lower than those corresponding to mussel shell. These reactive functional groups present in pine bark are progressively saturated as the added Cu dose rises, as indicated by the decrease in the percentage of Cu adsorbed (decreasing from 87% to 68%) (Figure 5).
In contrast, oak ash and mussel shell adsorbed 100% of the amounts of contaminants added, except for the highest dose, where adsorption decreased to 79% for mussel shell. Furthermore, Table 7 shows that pH in the equilibrium solution decreased with the increasing concentration of adsorbed Cu, as mentioned for soils, obtaining a significant and negative correlation between both parameters, with r = −0.964 (p < 0.01) for oak ash and r = −0.840 (p < 0.05) for mussel shell. Šoštarić et al. [68] also found a decrease in pH after the adsorption of different metals onto apricot peels, which was caused by the release of H+ due to strong competition with cationic metals, suggesting the intervention of ion exchange processes.
Table 7 also shows that, regarding the values of dissolved organic carbon (DOC), they tend to decrease for oak ash and pine bark when Cu adsorption rises. In fact, for pine bark, a significant negative correlation is obtained between DOC and adsorption (r = −0.844 and p < 0.05). This could be related to the high affinity between Cu and organic matter, forming organometallic complexes, which could move to the solid phase [69], this being another mechanism for Cu retention.
Regarding As(V), Figure 5 shows that oak ash is also the material with the highest adsorption, which increases as the concentration added rises. As(V) adsorption is much lower on mussel shell, and especially on pine bark. Given the high pH values corresponding to oak ash and mussel shell (Table 2), the predominant As species will be HAsO42− [52], and non-crystalline components will be negatively charged, meaning that the bond between the anionic As and these surfaces could take place by means of a cationic bridge. Oak ash contains, in addition to carbonates, oxides of Ca, Fe, and other elements, and these oxides would contribute to As(V) adsorption either by physical mechanisms or by chemical reactions [63]. As discussed above, the presence of a high concentration of oxalate-extractable Al and Fe (non-crystalline Fe and Al compounds) (Table 2) could also explain the high adsorption taking place on oak ash.
A variety of authors have found that arsenates are strongly adsorbed to these compounds (especially to non-crystalline Fe), and the amounts adsorbed can be relevant, even when low As concentrations are present in the liquid phase [55,56]. Furthermore, for oak ash and pine bark, the pH of the equilibrium solution shows a tendency to decrease as As(V) adsorption rises (Table 7), while pH increases in the case of mussel shell, with no significant correlation for any of the three by-products. Several studies have reported an increase in the equilibrium pH for As(V) adsorption due to exchange with OH groups, as explained above. The fact that in some cases this does not occur would indicate that other anions (SO42−, PO43−, or organic anions) are released, or that other mechanisms are involved in As adsorption, such as adsorption on calcite and Van der Waals forces, where OH groups are not released [70].
The good results regarding the retention of both pollutants in oak ash could also be reltated to its higher BET surface area (Table S1, Supplementary Materials), as previously pointed out for tetracycline antibiotics using the same three bio-adsorbents [71].
Other authors carried out studies using low-cost sorbents including ash, but some of them were clearly different materials compared to the oak ash used in the current work. As an example, Tsang et al. [72] found good results for coal fly ash as regards As stabilisation, although not successful for Cu retention. Mitchell et al. [73] found a reduction in soluble As and Cu by means of cementitious aggregation of wood ashes, although the authors indicate that the extent is metal(loid)-specific when amended to soils. Park et al. [74] studied fly and bottom ash from wood pellet thermal power plants, finding that these by-products have a high potential for heavy metal removal, although the authors focused specifically on Cd. In addition, the quality of the bio-adsorbents is relevant, as shown by Lucchini et al. [75] working with ash derived from Cu-based preservative-treated wood, where the authors reported that these by-products can lead to extremely high Cu concentrations in soil and negatively affect plant growth.
In view of the layout of some of the isotherm graphs, it could be considered that the concentrations of some of the sorbents and/or the concentration range of the sorbates were not optimal, influencing the accuracy of the fitting of various models. In this regard, we have published previous papers dealing with these and other aspects related to Cu and As adsorption/desorption studies, using similar values to those of the current work for molar concentrations of these pollutants, which facilitates the easier comparison of retention efficacy, although other concentrations and ranges would be cleary interesting for future investigation, to shed further and more specific light on the overall processes. As examples, the references [76,77,78] correspond to some of these papers.

4.4. Cu and As(V) Desorption from the Three By-Products

According to [79], Cu binds to OC occupying high-affinity sites when Cu activity is low, but if that activity increases, Cu would also occupy low-affinity sites, which would facilitate desorption, and this could explain the obvious increase in desorption taking place only in pine bark as the concentration of Cu added rises. In relation to the percentage desorbed (Figure 6), a gradual increase is observed for pine bark as the dose of Cu added rises, reaching a maximum value of 15%. For oak ash and mussel shell, desorption rates were very low, not exceeding 2% in any case.
Regarding As(V), the desorption sequence was: mussel shell ≥ pine bark> oak ash. For mussel shell, As(V) desorption increases as the added concentration rises (Figure 6), ranging from 186.25 to 1556.26 µmol kg−1, which corresponds to a value of 34% as maximum desorption. For pine bark, desorption reaches 35%, while for oak ash As(V) desorption was practically zero, probably due to the strong adsorption taking place at its high pH values, especially adsorption on the Fe and Al oxy-hydroxides very abundant in this by-product (Table 2), as indicated above. This shows the excellent adsorption capacity of oak ash for both Cu and As(V).

4.5. Fitting of Cu and As(V) Experimental Data to Different Adsorption Models

Table 4 shows that the Langmuir qm parameter, related to adsorption capacity, is generally higher for Cu than for As(V), and for soils and by-products having higher pH values. In addition, among the most acidic soils and sorbents, qm is higher for those with higher organic matter content, which will be the ones requiring higher concentrations of these elements to become saturated [80]. The qm values obtained for Cu are significantly correlated with the N content (r = 0.838, p < 0.01), N being related to organic matter, which corroborates the role of organic substances in Cu adsorption. Regarding As(V), qm values are significantly and positively correlated with the cation exchange capacity (r = 0.905), Ca (r = 0.864), K (r = 0.913), and pHKCl (r = 0.71), which could suggest that the As adsorbed is in anionic form, with adsorption taking place through a cationic bridge on the negatively charged components of variable charge (mainly organic matter and non-crystalline minerals).
As regards the Langmuir KL parameter, its value was higher for Cu than for As(V), which suggests a higher adsorption energy for Cu [81]. KL is significantly and positively correlated with pH in water (r = 0.95, p < 0.01, for Cu, and r= 0.74, p < 0.05, for As), indicating an increase in the retention energy with increasing negative soil charge.
The values of the Freundlich parameter KF parameter, related to the multilayer adsorption capacity of a given adsorbent [82], were also much higher for Cu than for As(V) (Table 5). In general, the highest KF values were found in those soils and by-products having higher pH, with a significant correlation (p < 0.01) between KF and pHH2O (r = 0.941 and 0.85 for Cu and As, respectively) and also between KF and a parameter closely related to soil pH, especially in soils with variable charge, which is eCEC (r = 0.89 and 0.88 for Cu and As, respectively). The n Freundlich parameter indicates the reactivity and heterogeneity of the active sites of the adsorbent, with Table 5 showing that the n value is always lower than 1 (specifically, it varies between 0.219 and 0.649), except for Cu adsorption on oak ash. This indicates the existence of non-linear and concave adsorption curves, with heterogeneous adsorption surfaces, which leads to a decrease in adsorption sites as the added metal/metalloid concentration increases [83], which coincides with the decrease in the adsorbed percentage as the dose of Cu and As added increases.
Temkin’s model is related to the adsorption energy and is characterized by a uniform distribution of binding energies up to a maximum level [84]. It is also assumed that this energy decreases linearly with surface coverage due to adsorbent–adsorbate interactions. The Temkin parameters in the current study show R2 values generally >0.80. According to [85], values of the Temkin constant (bt) lower than 20 KJ mol−1 would indicate the existence of physical adsorption processes. Table 4 shows that, in general, bt values are always higher, which would justify the presence of chemisorption reactions [84]. According to [86], these high bt values would indicate a high degree of interaction between both pollutants (As and Cu) and the adsorbents used in the present study.

5. Conclusions

In the soils and by-products used in this study, adsorption was higher for Cu than for As(V). In the soils, pH and organic matter content were the most influential factors as regards Cu adsorption, which increased with both parameters. In addition, Cu in cationic form would be adsorbed by binding to the negatively charged sites generated by raising the pH in the variable charge components (mainly organic matter and low-crystallinity minerals). Regarding As(V) adsorption, the influence of pH and organic matter was not so clear, since, at a low pH, As in anionic form binds to the positively charged colloids, while at higher pHs, other mechanisms intervene, such as cationic bridges or ligand exchange. For As(V) and, to a lesser extent, for Cu, the percentage of adsorption decreases with increasing dose of the added pollutant, indicating the saturation of the adsorption sites. Regarding desorption, in soils with more acidic pH (AL soils), Cu and As desorption were similar, while in soils with higher pH (S soils), more As is desorbed. Overall, oak ash performed as an excellent Cu and As(V) adsorbent and could be used in soil and water decontamination processes, possibly due to its high pH and content of carbonates, oxides, and non-crystalline minerals. Mussel shell and pine bark could also be used to retain Cu, but its capacity to adsorb As was low and its desorption was high. The adsorption data for both elements can be partially fitted to the Langmuir, Freundlich, and Temkin models. The values of the different parameters of the equations indicate a higher adsorption energy for Cu onto the sorbent surfaces, compared to As(V), and the existence of heterogeneous adsorbent surfaces with the gradual saturation of the adsorption sites, as well as the predominance of chemisorption reactions. In addition, the high correlations obtained among the different parameters of the equations and parameters of the sorbents support the influence of pH, exchange cations, as well as organic matter and non-crystalline Fe and Al oxy-hydroxides in Cu and As(V) adsorption. These results can be considered relevant to program an appropriate management of soils affected by Cu and As(V) pollution, as well as the use of low-cost bio-adsorbents, such as those tested in this study. In future research, soils with different characteristics could be evaluated, as well as other bio-adsorbents and/or study conditions, and on the other hand, complementary studies could be designed in order to advance the elucidation of the mechanisms that intervene in the adsorption processes of both contaminants in the sorbent materials under consideration.

Supplementary Materials

The following supporting information can be downloaded at: https://www.mdpi.com/article/10.3390/ma15145023/s1, Table S1: Data corresponding to the BET surface area results for the six soils studied. Mean values (n = 3) with coefficients of variation always <5%; Table S2. Data corresponding to the BET surface area results for the three bio-adsorbent materials studied. Mean values (n = 3) with coefficients of variation always <5%.

Author Contributions

Conceptualization, M.J.F.-S., E.Á.-R., A.N.-D., M.A.-E. and P.P.-R.; methodology, M.J.F.-S., E.Á.-R., A.N.-D., M.A.-E. and P.P.-R.; software, R.C.-D., A.B., G.F.-C. and C.C.-C.; validation, M.A.-E., A.N.-D., E.Á.-R., A.N.-D. and M.J.F.-S.; formal analysis, R.C.-D.; investigation, R.C.-D., A.B., G.F.-C. and C.C.-C.; resources, E.Á.-R., M.J.F.-S. and M.A.-E.; data curation, R.C.-D., A.B., M.J.F.-S. and E.Á.-R.; writing—original draft preparation, R.C.-D., A.B., M.J.F.-S. and E.Á.-R.; writing—review and editing, A.N.-D.; visualization, R.C.-D., A.B., G.F.-C., C.C.-C., P.P.-R., M.A.-E., A.N.-D., E.Á.-R. and M.J.F.-S.; supervision, M.J.F.-S.; project administration, E.Á.-R., M.J.F.-S. and M.A.-E.; funding acquisition, E.Á.-R., M.J.F.-S. and M.A.-E. All authors have read and agreed to the published version of the manuscript.

Funding

This work was supported by the Spanish Ministry of Economy and Competitiveness (grant numbers RTI2018-099574-B-C21 and RTI2018-099574-B-C22), with European Regional Development Funds (FEDER in Spain).

Institutional Review Board Statement

Not applicable.

Informed Consent Statement

Not applicable.

Data Availability Statement

Not applicable.

Conflicts of Interest

The authors declare no conflict of interest. The funders had no role in the design of the study; in the collection, analyses, or interpretation of data; in the writing of the manuscript, or in the decision to publish the results.

References

  1. Coelho, G.F.; GonÇalves, A.C.; Nóvoa-Muñoz, J.C.; Fernández-Calviño, D.; Arias-Estévez, M.; Fernández-Sanjurjo, M.J.; Álvarez-Rodríguez, E.; Núñez-Delgado, A. Competitive and non-competitive cadmium, copper and lead sorption/desorption on wheat straw af-fecting sustainability in vineyards. J. Clean. Prod. 2016, 139, 1496–1503. [Google Scholar] [CrossRef]
  2. Qin, F.; Shan, X.; Wei, B. Effects of low-molecular-weight organic acids and resi-dence time on desorption of Cu, Cd, and Pb from soils. Chemosphere 2004, 57, 253–263. [Google Scholar] [CrossRef] [PubMed]
  3. Keshavarzi, A.; Kumar, V. Spatial distribution and potential ecological risk assess-ment of heavy metals in agricultural soils of Northeastern Iran. Geol. Ecol. Landsc. 2019, 4, 87–103. [Google Scholar] [CrossRef] [Green Version]
  4. Baltas, H.; Sirin, M.; Gokbayrak, E.; Ozcelik, A.E. A case study on pollution and a human health risk assessment of heavy metals in agricultural soils around Sinop province, Turkey. Chemosphere 2020, 241, 125015–125025. [Google Scholar] [CrossRef]
  5. Komárek, M.; Vaněk, A.; Ettler, V. Chemical stabilization of metals and arsenic in contaminated soils using oxides—A review. Environ. Pollut. 2013, 172, 9–22. [Google Scholar] [CrossRef]
  6. Delgadillo-López, A.E.; González-Ramírez, C.A.; Prieto-García, F.; Villagómez-Ibarra, J.R.; Acevedo-Sandoval, O. Fitorremediación: Una alternativa para eliminar la contaminación. Trop. Subtrop. Agroecosyst. 2011, 14, 597–612. [Google Scholar]
  7. Zaynab, M.; Al-Yahyai, R.; Ameen, A.; Sharif, Y.; Ali, L.; Fatina, M.; Khan, K.A.; Li, S. Health and environmental effects of Heavy metals. J. King Saud Univ. Sci. 2022, 34, 101653–101661. [Google Scholar] [CrossRef]
  8. Doušová, B.; Grygar, T.; Martaus, A.; Fuitová, L.; Koloušek, D.; Machovič, V. Sorption of AsV on aluminosilicates treated with FeII nanoparticles. J. Colloid Interface Sci. 2006, 302, 424–431. [Google Scholar] [CrossRef]
  9. Podgorski, J.; Berg, M. Global threat of arsenic in groundwater. Science 2020, 368, 845–850. [Google Scholar] [CrossRef]
  10. Smedley, P.L.; Kinninburgh, D.G. A review of the source, behaviour and distribution of arsenic in natural waters. Appl. Geochem. 2002, 17, 517–568. [Google Scholar] [CrossRef] [Green Version]
  11. Sharma, A.K.; Tjell, J.C.; Sloth, J.J.; Holm, P.E. Review of arsenic contamination, exposure through water and food and low cost mitigation options for rural areas. Appl. Geochem. 2014, 41, 11–33. [Google Scholar] [CrossRef]
  12. Martín-Peinado, F.J.; Romero Freire, A.; Arco Lázaro, E.; Sierra Aragón, M.; Ortiz-Bernad, I.; Abbaslou, H. Assessment of arsenic toxicity in spiked soils and water solutions by the use of bioassays. Span. J. Soil Sci. 2012, 2, 45–56. [Google Scholar] [CrossRef]
  13. Abdul, K.S.M.; Jayasinghe, S.S.; Chandana, E.P.S.; Jayasumana, C.; De Silva, P.M.C.S. Arsenic and human health effects: A review. Environ. Toxicol. Pharmacol. 2015, 40, 828–846. [Google Scholar] [CrossRef]
  14. Bhowmick, S.; Pramanik, S.; Singh, P.; Mondal, P.; Chatterjee, D.; Nriagu, J. Arsenic in groundwater of West Bengal, India: A review of human health risks and assessment of possible intervention options. Sci. Total Environ. 2018, 612, 148–169. [Google Scholar] [CrossRef]
  15. Majumder, S.; Banik, P. Geographical variation of arsenic distribution in paddy soil, rice and rice-based products: A meta-analytic approach and implications to human health. J. Environ. Manag. 2019, 233, 184–199. [Google Scholar] [CrossRef]
  16. Fatoki, J.O.; Badmus, J.A. Arsenic as an environmental and human health antagonist: A review of its toxicity and disease initiation. J. Hazard. Mater. Adv. 2022, 5, 100052–100063. [Google Scholar] [CrossRef]
  17. Gómez-Armesto, A.; Carballeira-Díaz, J.; Pérez-Rodríguez, P.; Fernández-Calviño, D.; Arias-Estévez, M.; Nóvoa-Muñoz, J.C.; Álvarez-Rodriguez, E.; Fernández-Sanjurjo, M.J.; Núñez-Delgado, A. Copper content and distribution in vineyard soils from Betanzos (A Coruña, Spain). Span. J. Soil Sci. 2015, 5, 60–71. [Google Scholar] [CrossRef]
  18. Okereafor, U.; Makhatha, M.; Mekuto, L.; Uche-Okereafor, N.; Sebola, T.; Mavumengwana, V. Toxic Metal Implications on Agricultural Soils, Plants, Animals, Aquatic life and Human Health. Int. J. Environ. Res. Public Health 2020, 17, 2204. [Google Scholar] [CrossRef] [Green Version]
  19. Díaz-Raviña, M.; Calvo de Anta, R.; Bååth, E. Tolerance (PICT) of the bacterial communities to copper in vineyard soils from Spain. J. Environ. Qual. 2007, 36, 1760–1764. [Google Scholar] [CrossRef]
  20. Fernández-Calviño, D.; Soler-Rovira, P.; Polo, A.; Díaz-Raviña, M.; Arias-Estévez, M.; Plaza, C. Enzyme activities in vineyard soils long-term treated with copper based fungicides. Soil Biol. Biochem. 2010, 42, 2119–2127. [Google Scholar] [CrossRef]
  21. Fernández-Calviño, D.; Martín, A.; Arias-Estévez, M.; Bååth, E.; Díaz-Raviña, M. Microbial community structure of vineyards soils with different pH and copper content. Appl. Soil Ecol. 2010, 46, 276–282. [Google Scholar] [CrossRef]
  22. Kumar, A.; Tripti; Maleva, M.; Kiseleva, I.; Maiti, S.K.; Morozova, M. Toxic metal(loid)s contamination and potential human health risk assessment in the vicinity of century-old copper smelter, Karabash, Russia. Environ. Geochem. Health 2020, 42, 4113–4124. [Google Scholar] [CrossRef]
  23. Daoust, C.M.; Bastien, C.; Deschênes, L. Influence of soil properties and aging on the toxicity of copper on compost worm and barley. J. Environ. Qual. 2006, 35, 558–567. [Google Scholar] [CrossRef] [PubMed]
  24. Stern, B.R. Essentiality and Toxicity in Copper Health Risk Assessment: Overview, Update and Regulatory Considerations. J. Toxicol. Environ. Health—Part A 2010, 73, 114–127. [Google Scholar] [CrossRef] [PubMed]
  25. Taylor, A.A.; Tsuji, J.S.; Garry, M.R.; McArdle, M.E.; Goodfellow, W.L., Jr.; Adams, W.J.; Menzie, C.A. Critical Review of Exposure and Effects: Implications for Setting Regulatory Health Criteria for Ingested Copper. Environ. Manag. 2020, 65, 131–159. [Google Scholar] [CrossRef] [PubMed] [Green Version]
  26. Boudebbouz, A.; Boudalia, S.; Bousbia, A.; Habila, S.; Boussadia, M.I.; Gueroui, Y. Heavy metals levels in raw cow milk and health risk assessment across the globe: A systematic review. Sci. Total Environ. 2021, 751, 141830–141845. [Google Scholar] [CrossRef] [PubMed]
  27. Pereira-Covre, W.; Ramos, S.J.; Pereira, W.V.S.; Souza, E.S.; Martins, G.C.; Teixeira, O.M.M.; Amarante, C.B.; Nunes-Dias, Y.; Rodrigues-Fernandes, A. Impact of copper mining wastes in the Amazon: Properties and risks to environment and human health. J. Hazard. Mater. 2022, 421, 126688–126701. [Google Scholar] [CrossRef] [PubMed]
  28. Bigalke, M.; Weyer, S.; Wilcke, W. Copper isotope fractionation during complexation with insolubilized humic acid. Environ. Sci. Technol. 2010, 44, 5496–5502. [Google Scholar] [CrossRef]
  29. Caporale, A.G.; Violante, A. Chemical Processes Affecting the Mobility of Heavy Metals and Metalloids in Soil Environments. Curr. Pollut. Rep. 2016, 2, 15–27. [Google Scholar] [CrossRef] [Green Version]
  30. Kumar, M.; Seth, A.; Singh, A.K.; Rajput, M.S.; Sikandar, M. Remediation strategies for heavy metals contaminated ecosystem: A review. Environ. Sustain. Indic. 2021, 12, 100155–100168. [Google Scholar] [CrossRef]
  31. Cutillas-Barreiro, L.; Ansias-Manso, L.; Fernández-Calviño, D.; Arias-Estévez, M.; Nóvoa-Muñoz, J.C.; Fernández-Sanjurjo, M.J.; Álvarez-Rodríguez, E.; Núñez-Delgado, A. Pine Bark as bio-adsorbent for Cd, Cu, Ni, Pb and Zn: Batch-type and stirred flow chamber experiments. J. Environ. Manag. 2014, 114, 258–264. [Google Scholar] [CrossRef]
  32. Rivas-Pérez, I.M.; Paradelo-Núñez, R.; Nóvoa-Muñoz, J.C.; Arias-Estévez, M.; Fernández-Sanjurjo, M.J.; Álvarez-Rodríguez, E.; Núñez-Delgado, A. As(V) and P Competitive Sorption on Soils, By-Products and Waste Materials. Int. J. Environ. Res. Public Health 2015, 12, 15706–15715. [Google Scholar] [CrossRef] [Green Version]
  33. Seco-Reigosa, N.; Bermúdez-Couso, A.; Garrido-Rodríguez, B.; Arias-Estévez, M.; Fernández-Sanjurjo, M.J.; Álvarez-Rodríguez, E.; Núñez-Delgado, A. As(V) retention on soils and forest by-products and other waste materials. Environ. Sci. Pollut. Res. 2013, 20, 6574–6583. [Google Scholar] [CrossRef]
  34. Rajfur, M.; Kłos, A.; Wacławek, M. Sorption of copper(II) ions in the biomass of alga Spirogyra sp. Bioelectrochemistry 2012, 87, 65–70. [Google Scholar] [CrossRef]
  35. Xu, L.; Cui, H.; Zheng, X.; Liang, J.; Xing, X.; Yao, L.; Chen, Z.; Zhou, J. Adsorption of Cu2+ to biomass ash and its modified product. Water Sci. Technol. 2017, 1, 115–125. [Google Scholar] [CrossRef]
  36. Conde-Cid, M.; Álvarez-Esmorís, C.; Paradelo-Núñez, R.; Nóvoa-Muñoz, J.C.; Arias-Estévez, M.; Álvarez-Rodríguez, E.; Fernández-Sanjurjo, M.J.; Núñez-Delgado, A. Occurrence of tetracyclines and sulfonamides in manures, agricultural soils and crops from different areas in Galicia (NW Spain). J. Clean. Prod. 2018, 197, 491–500. [Google Scholar] [CrossRef]
  37. Conde-Cid, M.; Fernández-Calviño, D.; Nóvoa-Muñoz, J.C.; Núñez-Delgado, A.; Fernández-Sanjurjo, M.J.; Arias-Estévez, M.; Álvarez-Rodríguez, E. Experimental data and model prediction of tetracycline adsorption and desorption in agricultural soils. Environ. Res. 2019, 177, 108607–108620. [Google Scholar] [CrossRef]
  38. Olsen, S.R.; Sommers, L.E. Phosphorus. Methods of soil analysis, Part 2. In Chemical and Microbiological Properties; Page, A.L., Miller, R.H., Keeney, D.R., Eds.; EEUU: Madison, WI, USA, 1982. [Google Scholar]
  39. Peech, L.; Alexander, L.T.; Dean, L.A. Methods of Soil Analysis for Soil-Fertility Investigations; Cir. Nº 757; USDA: Washington, DC, USA, 1947. [Google Scholar]
  40. Álvarez-Esmorís, C.; Conde-Cid, M.; Fernández-Sanjurjo, M.J.; Núñez-Delgado, A.; Álvarez-Rodríguez, E.; Arias-Estévez, M. Environmental relevance of adsorption of doxycycline, enrofloxacin, and sulfamethoxypyridazine before and after the removal of organic matter from soils. J. Environ. Manag. 2021, 287, 112354–112364. [Google Scholar] [CrossRef]
  41. Baty, F.; Ritz, C.; Charles, S.; Brutsche, M.; Flandrois, J.-P.; Delignette-Muller, M.-L. Toolbox for Nonlinear Regression in R: The Package nlstools. J. Stat. Softw. 2015, 66, 1–21. [Google Scholar] [CrossRef] [Green Version]
  42. Shaheen, S.M.; Shams, M.S.; Khalifa, M.R.; El-Daly, M.A.; Rinklebe, J. Various soil amendments and wastes affect the (im)mobilization and phytoavailability of potentially toxic elements in a sewage effluent irrigated sandy soil. Ecotoxicol. Environ. Saf. 2017, 142, 375–387. [Google Scholar] [CrossRef]
  43. Tunali, S.; Ahmet, Ç.; Tamer, A. Removal of lead and copper ions from aqueous solutions by bacterial strain isolated from soil. Chem. Eng. J. 2006, 115, 203–211. [Google Scholar] [CrossRef]
  44. Patra, A.S.; Ghorai, S.; Sarkar, D.; Das, R.; Sarkar, S.; Pal, S. Anionically functionalized guar gum embedded with silica nanoparticles: An efficient nanocomposite adsorbent for rapid adsorptive removal of toxic cationic dyes and metal ions. Bioresour. Technol. 2017, 225, 367–376. [Google Scholar] [CrossRef] [PubMed]
  45. Agbenin, J.O.; Olojo, L.A. Competitive adsorption of copper and zinc by a Bt horizon of a savanna Alfisol as affected by pH and selective removal of hydrous oxides and organic matter. Geoderma 2004, 119, 85–95. [Google Scholar] [CrossRef]
  46. Palleiro, L.; Patinha, C.; Rodríguez-Blanco, M.L.; Tableda-Castro, M.M.; Tableda-Castro, M.T. Metal fractionation in topsoils and bed sediments in the Mero River rural basin: Bioavailability and relationship with soil and sediment properties. Catena 2016, 144, 34–44. [Google Scholar] [CrossRef]
  47. Stanić, T.; Daković, A.; Živanović, A.; Tomašević-Čanović, M.; Dondur, V.; Milićević, S. Adsorption of arsenic (V) by iron (III)-modified natural zeolitic tuff. Environ. Chem. Lett. 2009, 7, 161–166. [Google Scholar] [CrossRef]
  48. Mamindy-Pajany, Y.; Hurel, C.; Marmier, N.; Roméo, M. Arsenic (V) adsorption from aqueous solution onto goethite, hematite, magnetite and zero-valent iron: Effects of pH, concentration and reversibility. Desalination 2011, 281, 93–99. [Google Scholar] [CrossRef]
  49. Wasay, S.A.; Tokunaga, S.; Park, S. Removal of Hazardous Anions from Aqueous Solutions by La(lll)- and Y(lll)-lmpregnated Alumina. Sep. Sci. Technol. 1996, 31, 1501–1514. [Google Scholar] [CrossRef]
  50. Dambies, L.; Guibal, E.; Roze, A. Arsenic(V) sorption on molybdate-impregnated chitosan beads. Colloids Surf. A Physicochem. Eng. Asp. 2000, 170, 19–31. [Google Scholar] [CrossRef]
  51. Yusof, M.S.M.; Othman, M.H.D.; Wahab, R.A.; Jumbri, K.; Razak, F.I.A.; Kurniawan, T.A.; Samh, R.A.; Mustafa, A.; Rahman, M.A.; Jaafar, J.; et al. Arsenic adsorption mechanism on palm oil fuel ash (POFA) powder suspension. J. Hazard. Mater. 2020, 383, 121214–121224. [Google Scholar] [CrossRef]
  52. Rakhunde, R.; Jasudkar, D.; Deshpande, L.; Juneja, H.D.; Labhasetwar, P. Health effects and significance of arsenic speciation in water. Int. J. Environ. Sci. Res. 2012, 1, 92–96. [Google Scholar]
  53. Inchaurrondo, N.; Di Luca, C.; Mori, F.; Pintar, A.; Žerjav, G.; Valiente, M.; Palet, C. Synthesis and adsorption behavior of mesoporous alumina and Fe-doped alumina for the removal of dominant arsenic species in contaminated waters. J. Environ. Chem. Eng. 2019, 7, 102901–102915. [Google Scholar] [CrossRef]
  54. Das, T.K.; Bezbaruah, A.N. Comparative study of arsenic removal by iron-based nanomaterials: Potential candidates for field applications. Sci. Total Environ. 2021, 764, 142914. [Google Scholar] [CrossRef]
  55. Hiemstra, T.; Van Riemsdijk, W.H. A surface structural approach to ion adsorption: The charge distribution. The charge distribution model. J. Colloid Interface Sci. 1996, 179, 488–508. [Google Scholar] [CrossRef]
  56. Tabelin, C.B.; Corpuz, R.D.; Igarashi, T.; Villacorte-Tabelin, M.; Alorro, R.D.; Yoo, K.; Raval, S.; Ito, M.; Hiroyoshi, N. Acid mine drainage formation and arsenic mobility under strongly acidic conditions: Importance of soluble phases, iron oxyhydroxides/oxides and nature of oxidation layer on pyrite. J. Hazard. Mater. 2020, 399, 122844–122860. [Google Scholar] [CrossRef]
  57. Ewbank, J.L.; Kovarik, L.; Kenvin, C.C.; Sievers, C. Effect of preparation methods on the performance of Co/Al2O3 catalysts for dry reforming of methane. Green Chem. 2014, 16, 885–896. [Google Scholar] [CrossRef]
  58. Yasinta, J.; Victor Emery, D.; Mmereki, D. A Comparative Study on Removal of Hazardous Anions from Water by Adsorption: A Review. Int. J. Chem. Eng. 2018, 2018, 3975948. [Google Scholar] [CrossRef] [Green Version]
  59. Ören, A.H.; Kaya, A. Factors affecting adsorption characteristics of Zn2+ on two natural zeolites. J. Hazard. Mater. 2006, 131, 59–65. [Google Scholar] [CrossRef]
  60. Korchagin, J.; Moterle, D.F.; Escosteguy, P.A.V.; Bortoluzzi, E.C. Distribution of copper and zinc fractions in a Regosol profile under centenary vineyard. Environ. Earth Sci. 2020, 79, 439. [Google Scholar] [CrossRef]
  61. Liang, M.; Renkou, X.; Jun, J. Adsorption and desorption of Cu(II) and Pb(II) in paddy soils cultivated for various years in the subtropical China. J. Environ. Sci. 2010, 22, 689–695. [Google Scholar] [CrossRef]
  62. Zhang, J.; Liu, Y.; Sun, Y.; Wang, H.; Cao, X.; Li, X. Effect of soil type on heavy metals removal in bioelectrochemical system. Bioelectrochemistry 2020, 136, 107596–107605. [Google Scholar] [CrossRef]
  63. Rahman, M.S.; Clark, M.W.; Yee, L.H.; Comarmond, M.J.; Payne, T.E.; Burton, E.D. Effects of pH, competing ions and aging on arsenic(V) sorption and isotopic exchange in contaminated soils. Appl. Geochem. 2019, 105, 114–124. [Google Scholar] [CrossRef]
  64. Boim, A.G.; Rodrigues, S.M.; dos Santos-Araújo, S.N.; Pereira, E.; Alleoni, L.R. Pedotransfer functions of potentially toxic elements in tropical soils cultivated with vegetable crops. Environ. Sci. Pollut. Res. 2018, 25, 12702–12712. [Google Scholar] [CrossRef]
  65. Fernández-Calviño, D.; Cutillas-Barreiro, L.; Núñez-Delgado, A.; Fernández-Sanjurjo, M.J.; Álvarez-Rodríguez, E.; Nóvoa-Muñoz, J.C.; Arias-Estévez, M. Cu Immobilization and Lolium perenne Development in an Acid Vineyard Soil Amended with Crushed Mussel Shell. Land Degrad. Dev. 2017, 28, 762–772. [Google Scholar] [CrossRef]
  66. Farouq, R.; Yousef, N.S. Equilibrium and kinetics studies of adsorption of copper (II) ions on natural biosorbent. Int. J. Chem. Eng. Appl. 2015, 6, 319–324. [Google Scholar] [CrossRef] [Green Version]
  67. Kosmulski, M. pH-dependent surface charging and points of zero charge. IV. Update and new approach. J. Colloid Interface Sci. 2009, 337, 439–448. [Google Scholar] [CrossRef]
  68. Šoštarić, T.D.; Petrović, M.S.; Pastor, F.T.; Lončarević, D.R.; Petrović, J.T.; Milojković, J.V.; Milojković, J.V.; Stojanović, M.D. Study of heavy metals biosorption on native and alkali-treated apricot shells and its application in wastewater treatment. J. Mol. Liq. 2018, 259, 340–349. [Google Scholar] [CrossRef] [Green Version]
  69. Vítková, M.; Komárek, M.; Tejnecký, V.; Šillerová, H. Interactions of nano-oxides with low-molecular-weight organic acids in a contaminated soil. J. Hazard. Mater. 2015, 293, 7–14. [Google Scholar] [CrossRef]
  70. Boddu, V.M.; Abburi, K.; Talbott, J.L.; Smith, E.D. Removal of hexavalentchromium from waste water using a new composite chitosan biosorbent. Environ. Sci. Technol. 2003, 37, 4449–4456. [Google Scholar] [CrossRef]
  71. Conde-Cid, M.; Fernández-Sanjurjo, M.J.; Ferreira-Coelho, G.; Fernández-Calviño, D.; Arias-Estevez, M.; Núñez-Delgado, A.; Álvarez-Rodríguez, E. Competitive adsorption and desorption of three tetracycline antibiotics on bio-sorbent materials in binary systems. Environ. Res. 2020, 190, 110003. [Google Scholar] [CrossRef]
  72. Tsang, D.C.W.; Yip, A.C.K.; Olds, W.E.; Weber, P.A. Arsenic and copper stabilisation in a contaminated soil by coal fly ash and green waste compost. Environ. Sci. Pollut. Res. 2014, 21, 10194–10204. [Google Scholar] [CrossRef]
  73. Mitchell, K.; Moreno-Jimenez, E.; Jones, R.; Zheng, L.; Trakal, L.; Hough, R.; Beesley, L. Mobility of arsenic, chromium and copper arising from soil application of stabilised aggregates made from contaminated wood ash. J. Hazard. Mater. 2020, 393, 122479. [Google Scholar] [CrossRef] [PubMed]
  74. Park, J.H.; Eom, J.H.; Lee, S.L.; Hwang, S.W.; Kim, S.H.; Kang, S.W.; Yun, J.J.; Cho, J.S.; Lee, Y.H.; Seo, D.C. Exploration of the potential capacity of fly ash and bottom ash derived from wood pellet-based thermal power plant for heavy metal removal. Sci. Total Environ. 2020, 740, 140205. [Google Scholar] [CrossRef] [PubMed]
  75. Lucchini, P.; Quilliam, R.; DeLuca, T.; Vamerali, T.; Jones, D.L. Increased bioavailability of metals in two contrasting agricultural soils treated with waste wood-derived biochar and ash. Environ. Sci. Pollut. Res. 2014, 21, 3230–3240. [Google Scholar] [CrossRef] [PubMed]
  76. Seco-Reigosa, N.; Cutillas-Barreiro, L.; Nóvoa-Muñoz, J.C.; Arias-Estévez, M.; Fernández-Sanjurjo, M.J.; Álvarez-Rodríguez, E.; Núñez-Delgado, A. Mixtures including wastes from the mussel shell processing industry: Retention of arsenic, chromium and mercury. J. Clean. Prod. 2014, 84, 680–690. [Google Scholar] [CrossRef]
  77. Ramírez-Pérez, A.M.; Paradelo, M.; Nóvoa-Muñoz, J.C.; Arias-Estévez, M.; Fernández-Sanjurjo, M.J.; Álvarez-Rodríguez, E.; Núñez-Delgado, A. Heavy metal retention in copper mine soil treated with mussel shells: Batch and column experiments. J. Hazard. Mat. 2013, 248–249, 122–130. [Google Scholar] [CrossRef] [PubMed]
  78. Osorio-López, C.; Seco-Reigosa, N.; Garrido-Rodríguez, B.; Cutillas-Barreiro, L.; Arias-Estévez, M.; Fernández-Sanjurjo, M.J.; Álvarez-Rodríguez, E.; Núñez-Delgado, A. As(V) adsorption on forest and vineyard soils and pyritic material with or without mussel shell: Kinetics and fractionation. J. Taiwan Inst. Chem. Eng. 2014, 45, 1007–1014. [Google Scholar] [CrossRef]
  79. Amery, F.; Degryse, F.; Van Moorleghem, C.; Duyck, M.; Smolders, E. The dissociation kinetics of Cu-dissolved organic matter complexes from soil and soil amendments. Anal. Chim. Acta 2010, 670, 24–32. [Google Scholar] [CrossRef]
  80. Febrianto, J.; Kosasih, A.N.; Sunarso, J.; Ju, Y.; Indraswati, N.; Ismadji, S. Equilibrium and kinetic studies in adsorption of heavy metals using biosorbent: A summary of recent studies. J. Hazard. Mater. 2009, 162, 616–645. [Google Scholar] [CrossRef]
  81. Khezami, L.; Capart, R. Removal of chromium(VI) from aqueous solution by activated carbons: Kinetic and equilibrium studies. J. Hazard. Mater. 2005, 123, 223–231. [Google Scholar] [CrossRef]
  82. Bhaumik, R.; Mondal, N.K.; Das, B.; Roy, P.; Pal, K.C.; Das, C.; Banerjee, A.; Datta, K. Eggshell Powder as an Adsorbent for Removal of Fluoride from Aqueous Solution: Equilibrium, Kinetic and Thermodynamic Studies. E-J. Chem. 2012, 9, 1457–1480. [Google Scholar] [CrossRef] [Green Version]
  83. Sukul, P.; Lamshöft, M.; Zühlke, S.; Spiteller, M. Sorption and desorption of sulfadiazine in soil and soil-manure systems. Chemosphere 2008, 73, 1344–1350. [Google Scholar] [CrossRef]
  84. Vijayalakshmi, K.; Devi, B.M.; Latha, S.; Gomathi, T.; Sudha, P.N.; Venkatesan, J.; Anil, S. Batch adsorption and desorption studies on the removal of lead (II) from aqueous solution using nanochitosan/sodium alginate/microcrystalline cellulose beads. Int. J. Biol. Macromol. 2017, 104, 1483–1494. [Google Scholar] [CrossRef]
  85. Eftekhari, M.; Gheibi, M.; Azizi-Toupkanloo, H.; Hossein-Abadi, Z.; Khraisheh, M.; Fathollahi-Fard, A.M.; Tian, G. Statistical optimization, soft computing prediction, mechanistic and empirical evaluation for fundamental appraisal of copper, lead and malachite green adsorption. J. Ind. Inf. Integr. 2021, 23, 100219–100240. [Google Scholar] [CrossRef]
  86. Uchechukwu, O.F.; Azubuike, O.S.; Okan, E.N. Biosorption of Cd2+, Ni2+ and Pb2+ by the shell of pentaclethra macrophylla: Equilibrium isotherm studies. J. Sci. Technol. Environ. Inform. 2015, 13, 26–35. [Google Scholar] [CrossRef]
Figure 1. Cu and As(V) adsorption curves and selected graphical fittings to the various adsorption models for the six soils studied. Error bars represent twice the standard deviation of the mean (n = 3). When bars are not visible, they are smaller than the symbols.
Materials 15 05023 g001aMaterials 15 05023 g001b
Figure 2. Cu and As adsorption curves and selected graphical fittings to the various adsorption models for the three bio-adsorbents studied. Error bars represent twice the standard deviation of the mean (n = 3). When bars are not visible, they are smaller than the symbols.
Materials 15 05023 g002aMaterials 15 05023 g002b
Figure 3. Cu and As (V) adsorption, expressed in µmol kg−1 and as percentage, for the soils studied, as a function of the pollutant concentrations added. Error bars represent twice the standard deviation of the mean (n = 3). When bars are not visible, they are smaller than the symbols.
Materials 15 05023 g003aMaterials 15 05023 g003b
Figure 4. Cu and As (V) desorption, expressed in µmol kg−1 and as percentage, for the soils studied, as a function of the pollutant concentrations added. Error bars represent twice the standard deviation of the mean (n = 3). When bars are not visible, they are smaller than the symbols.
Materials 15 05023 g004
Figure 5. Cu and As (V) adsorption, expressed in µmol kg−1 and as percentage, for the three bio-adsorbents studied, as a function of the pollutant concentrations added. Error bars represent twice the standard deviation of the mean (n = 3). When bars are not visible, they are smaller than the symbols.
Materials 15 05023 g005
Figure 6. Cu and As (V) desorption, expressed in µmol kg−1 and as percentage, for the three bio-adsorbents studied, as a function of the pollutant concentrations added. Error bars represent twice the standard deviation of the mean (n = 3). When bars are not visible, they are smaller than the symbols.
Materials 15 05023 g006
Table 1. Main characteristics of the six soils studied. Average values (n = 3) with coefficients of variation always lower than 5%.
ParameterUnitsSoil
3AL19AL50AL6S51S71S
pHH2O 4.744.804.496.337.066.24
pHKCl 4.304.254.005.866.395.44
Caecmolc kg−12.241.535.9412.869.8912.79
Mgecmolc kg−10.640.411.481.130.972.88
Naecmolc kg−10.350.250.420.360.280.41
Kecmolc kg−11.001.271.140.611.401.20
Alecmolc kg−11.680.612.660.000.010.11
eCECcmolc kg−15.924.0811.6414.9612.5417.38
Al saturation%28.4315.0022.830.000.050.06
Pmg kg−1117.90225.43135.9071.42120.0396.77
N%0.310.090.840.230.190.48
C%3.391.0710.921.981.756.88
OM%5.841.8418.833.413.0211.86
C/N 10.9411.8913.008.449.0514.21
Sand%54.7264.7258.7229.2827.2861.28
Silt%26.0014.0016.0049.2851.2823.28
Clay%19.2821.2825.2821.4421.4415.44
Alomg kg−15040.0855.02995.018,377.515,755.750,593.5
Feomg kg−12585.01150.01430.056,423.842377.473,095.9
Cae, Mge, Nae, Ke, and Ale = exchangeable concentrations of the elements; Alo and Feo = Al and Fe concentration after extraction with ammonium oxalate.
Table 2. Main characteristics of the three by-products used. Average values (n = 3) with coefficients of variation always lower than 5%.
ParameterUnitOak AshPine BarkMussel Shell
C%13.2348.7011.43
N%0.220.080.21
C/N 60.13608.7555.65
pHH2O 11.313.999.39
pHKCl 13.483.429.04
Caecmolc kg−195.005.3824.75
Mgecmolc kg−13.262.700.72
Naecmolc kg−112.170.464.37
Kecmolc kg−1250.654.600.38
Alecmolc kg−10.071.780.03
Al saturation%0.0211.910.11
eCECcmolc kg−1361.1714.9230.25
P-Olsenmg kg−1462.8370.4554.17
Alomg kg−18323.00315.00178.33
Feomg kg−14233.0074.00171.00
Cae, Mge, Nae, Ke, and Ale = exchangeable concentrations of the elements; Alo and Feo = Al and Fe concentration after extraction with ammonium oxalate.
Table 3. Values of Cu and As(V) adsorption (Q) as well of pH and DOC in the equilibrium solution for the various Cu and As(V) initial concentrations (C0) added to the soils.
CuAs(V)
SoilC0 µmol L−1Q µmol kg−1pHDOC mg L−1Q µmol kg−1pHDOC mg L−1
3AL0.000.004.750.080.004.760.19
1002127.044.640.202394.394.780.19
2003225.974.460.133764.034.970.23
4006951.044.430.136037.215.170.16
80010,467.994.250.129344.485.370.17
160012,523.804.100.1016,882.195.920.16
19AL0.000.004.710.200.005.000.08
1001433.704.570.13888.395.190.14
2002088.814.450.191153.995.330.21
4003969.434.340.295778.185.740.09
8006659.334.270.174126.556.110.12
16005963.304.070.286290.396.600.09
50AL0.000.004.270.260.004.500.13
1002524.264.240.192272.594.370.18
2005106.614.130.263939.784.380.20
40011,086.254.030.286058.324.450.28
80020,244.493.790.3410,856.874.660.23
160028,481.453.690.2317,075.784.890.22
6S0.000.005.610.200.005.880.19
1002558.335.660.193048.255.870.12
2005253.626.260.133015.266.330.08
40012,030.505.570.154393.796.440.09
80022,000.775.070.135849.586.730.09
160029,540.604.750.175866.526.880.06
51S0.000.006.040.160.006.610.15
1002615.996.090.182016.286.800.14
2005202.906.060.193091.306.830.12
40012,205.875.930.144485.696.850.09
80024,061.915.550.136775.336.960.12
160037,687.915.090.1110,962.177.180.08
71S0.000.005.490.290.006.000.11
1002618.825.530.202516.395.850.09
2005282.885.490.194786.285.840.13
40011,962.355.360.168174.645.840.14
80025,655.795.130.1814,047.815.920.13
160044,019.574.690.1522,979.856.070.13
Table 4. Fitting to the Langmuir model of experimental data corresponding to Cu and As(V) adsorption onto the soils and bio-adsorbents used.
Soil/Bio-Adsorbent Langmuir Parameter
qm (µmol kg−1)Error-1KL (L µmol−1)Error-2R2
3ALCu13,400.093292.030.00750.0030.935
As(V)27,759.879142.350.00140.00090.967
19ALCu7020.961227.600.00650.0030.958
As(V)9102.936017.420.00150.0060.837
50ALCu27,463.772525.400.0210.0030.992
As(V)25,379.964566.650.0020.0010.985
6SCu28,242.776241.050.0410.0150.945
As(V)6457.63295.590.0100.0020.992
51SCu44,100.5511,594.770.0280.0100.950
As(V)14,417.563161.040.0020.0010.962
71SCu49,174.352524.460.0330.0050.996
As(V)32,341.866030.630.0030.0010.982
Oak ashCu-----
As(V)83,740.1213,748.450.0080.0030.987
Pine barkCu65,560.703016.860.00350.00030.999
As(V)7298.802723.540.00100.00070.958
Mussel shellCu50,467.876290.400.10210.03640.959
As(V)6925.852393.08--0.784
qm: maximum adsorption capacity; KL: constant related to the intensity of interaction adsorbent/adsorbate; R2: coefficient of determination; -: error too high for fitting.
Table 5. Fitting to the Freundlich model of experimental data corresponding to Cu and As(V) adsorption onto the soils and bio-adsorbents used.
Soil/Bio-Adsorbent Freundlich Parameter
KF (Ln µmol1−n kg−1)Error-1nError-2R2
3ALCu605.97161.970.4530.0510.970
As(V)317.97123.290.5710.0590.991
19ALCu--0.3540.1140.902
As(V)-----
50ALCu1420.25290.320.4920.0470.969
As(V)396.3571.490.5460.0280.997
6SCu4334.211250.350.3080.0510.975
As(V)1302.36548.870.2190.0660.938
51SCu2042.58750.210.5270.1030.845
As(V)332.7477.000.4910.0350.996
71SCu4695.401535.830.4130.0650.977
As(V)679.5074.580.5220.0170.999
Oak ashCu-----
As(V)2481.83963.550.5680.0760.986
Pine barkCu1013.92204.180.6010.03420.997
As(V)--0.6490.18430.933
Mussel shellCu9586.924114.710.2820.0840.899
As(V)-----
KF: parameter related to the adsorption capacity; n: parameter related to adsorbent heterogeneity; R2: coefficient of determination; -: error too high for fitting.
Table 6. Fitting to the Temkin model of experimental data corresponding to Cu and As(V) adsorption onto the soils and bio-adsorbents used.
Soil/Bio-Adsorbent Temkin Parameters
btError-1Kt (L/g)Error-2R2
3ALCu1249.03329.440.160.080.915
As(V)-----
19ALCu1667.41318.400.070.050.947
As(V)1574.12721.31--0.764
50ALCu--0.380.0580.979
As(V)--0.060.0340.941
6SCu--0.630.120.946
As(V)1163.51187.130.170.100.975
51SCu--0.490.0280.988
As(V)1111.30457.700.060.0340.942
71SCu272.31174.110.500.030.999
As(V)--0.100.060.944
Oak ashCu-----
As(V)-----
Pine barkCu--0.080.020.970
As(V)1690.37258.540.010.000.956
Mussel shellCu-----
As(V)1565.52849.08--0.732
bt: Temkin isotherm constant; Kt: Temkin isotherm equilibrium binding constant; R2: coefficient of determination.
Table 7. Values of Cu and As(V) adsorption (Q, in µmol kg−1) as well of of pH and DOC (in mg L−1) in the equilibrium solution for the various Cu and As(V) initial concentrations (C0, in µmol L−1) added to the three by-products.
CuAs(V)
SorbentC0QpHDOCQpHDOC
Oak ash0.000.0012.210.370.0011.990.40
1003953.6512.190.423945.0712.000.40
2007619.0512.220.457639.9412.050.41
40015,455.8012.180.3614,451.2212.090.82
80031,008.1212.160.3628,892.2012.050.49
160063,284.5712.090.3354,610.4511.960.50
Pine bark0.000.004.580.5260.005.940.28
1003300.953.910.46442.895.690.31
2006564.223.90.52556.305.630.33
40013,112.663.820.431725.855.450.34
80024,405.273.770.443669.515.470.37
160042,152.963.610.394036.645.170.30
Mussel shell0.000.007.440.120.007.050.08
1003903.027.500.161003.367.630.24
2007797.857.530.182025.127.900.16
40015,088.637.500.184889.318.130.19
80029,335.287.420.197427.298.200.16
160048,033.566.180.154515.328.330.11
Publisher’s Note: MDPI stays neutral with regard to jurisdictional claims in published maps and institutional affiliations.

