
Effects of Fiber Orientation on the Coefficient of Thermal Expansion of Fiber-Filled Polymer Systems in Large Format Polymer Extrusion-Based Additive Manufacturing

 ,
,  and
and
Abstract
:1. Introduction
2. Experimental
2.1. Materials
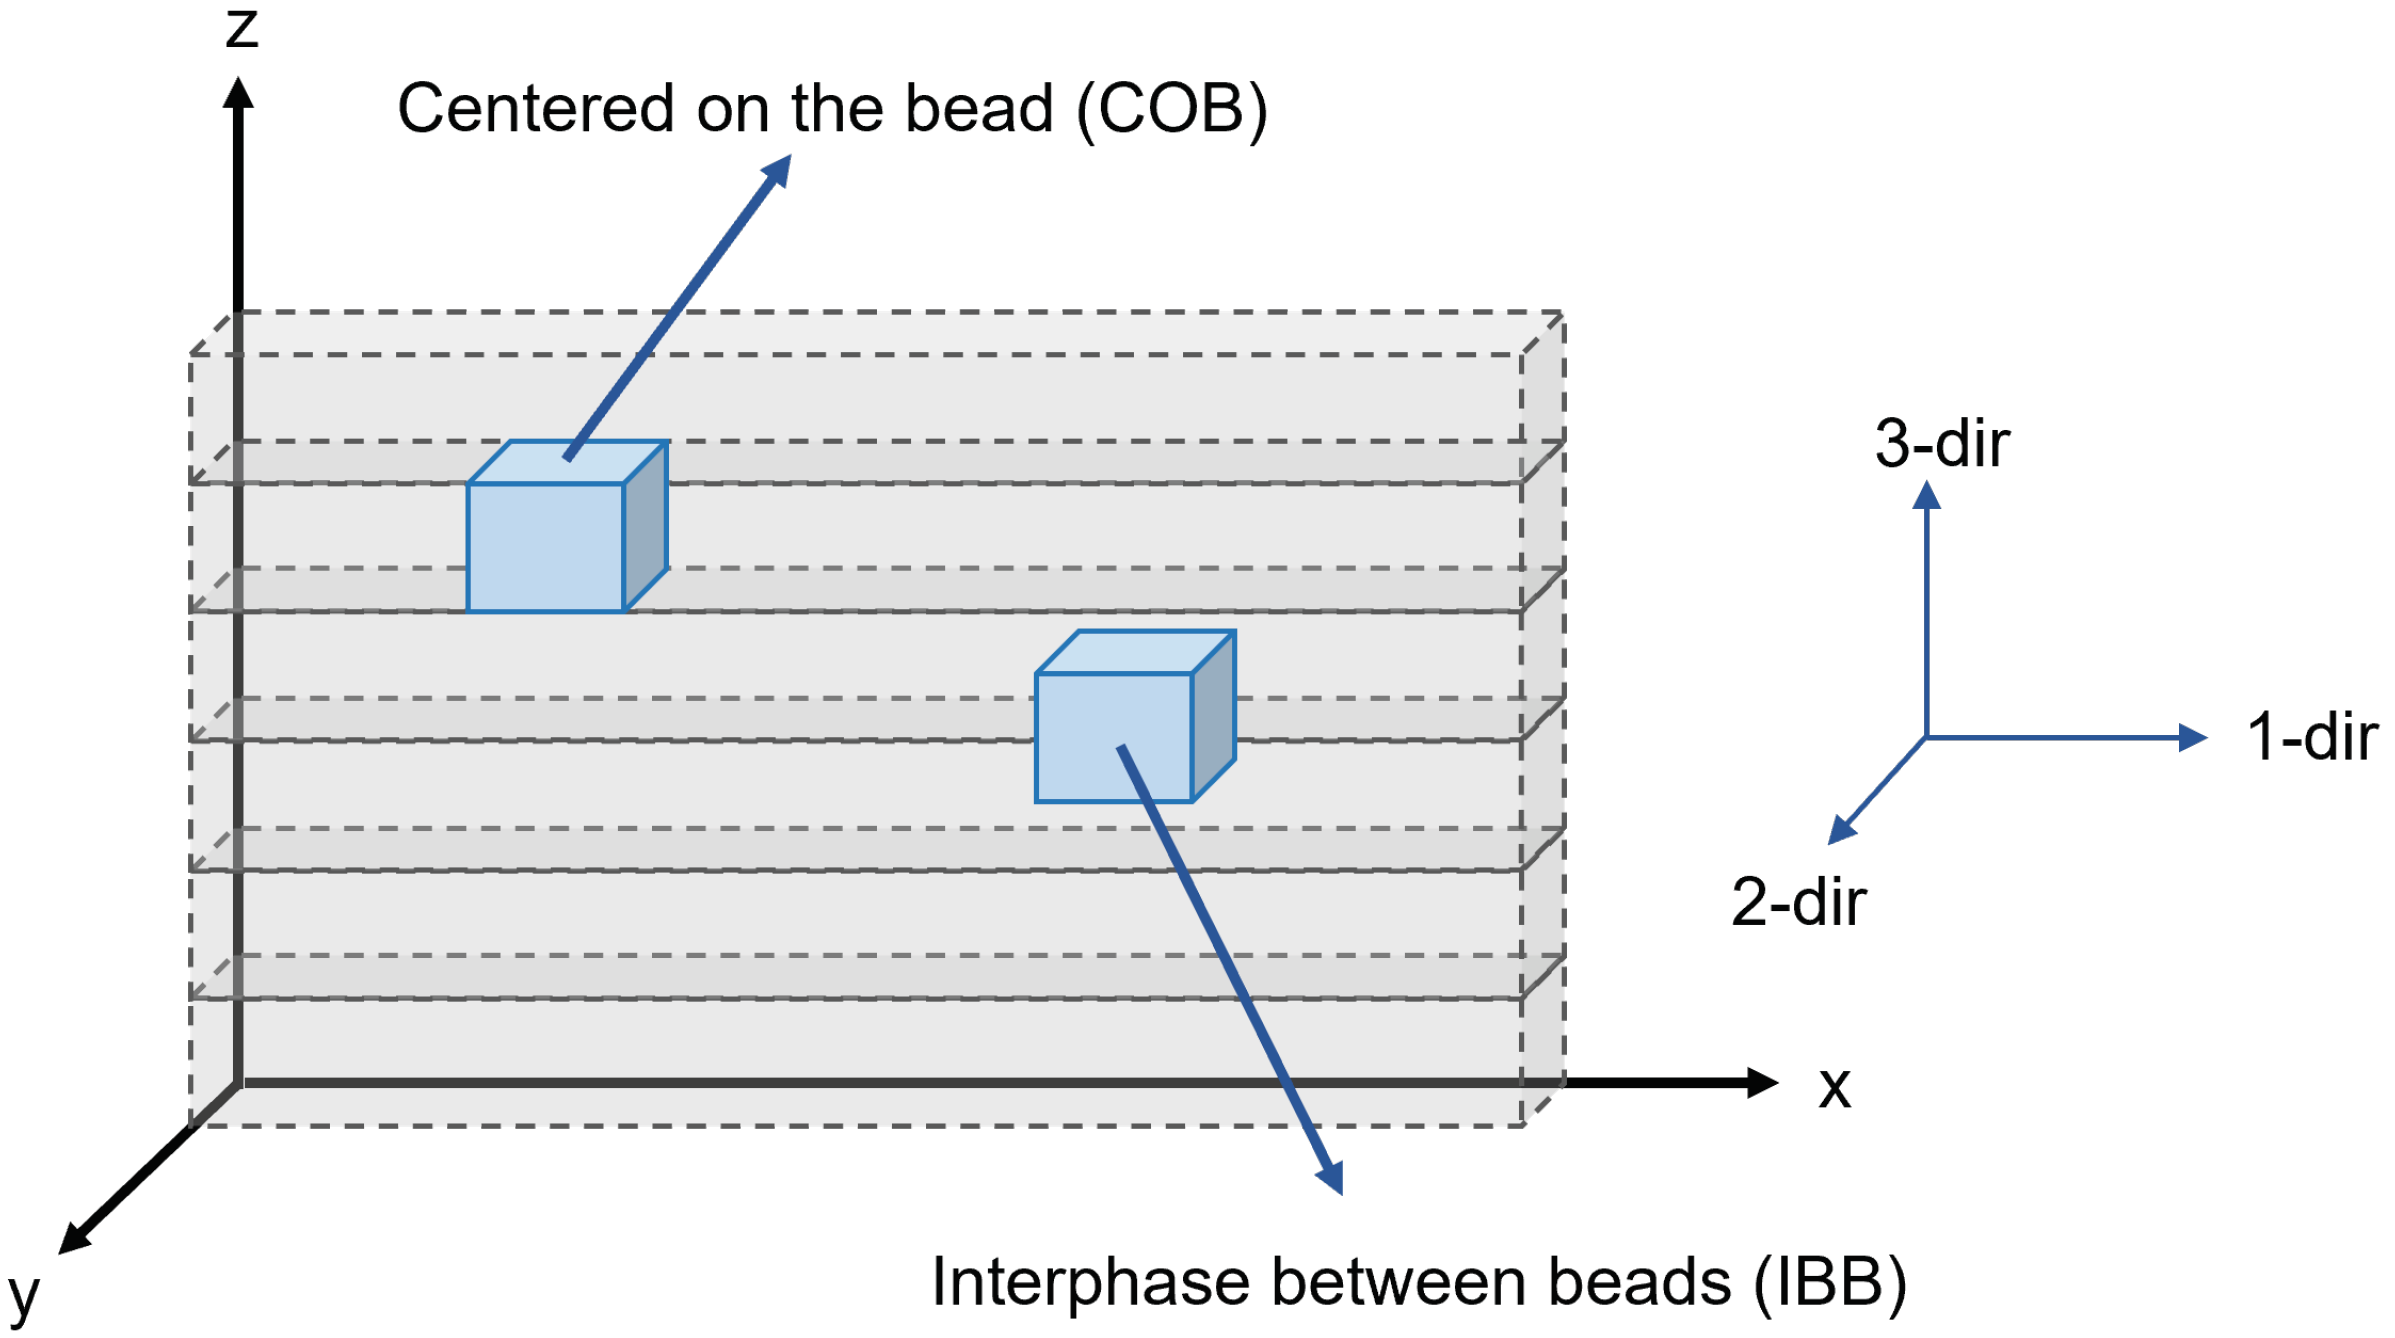
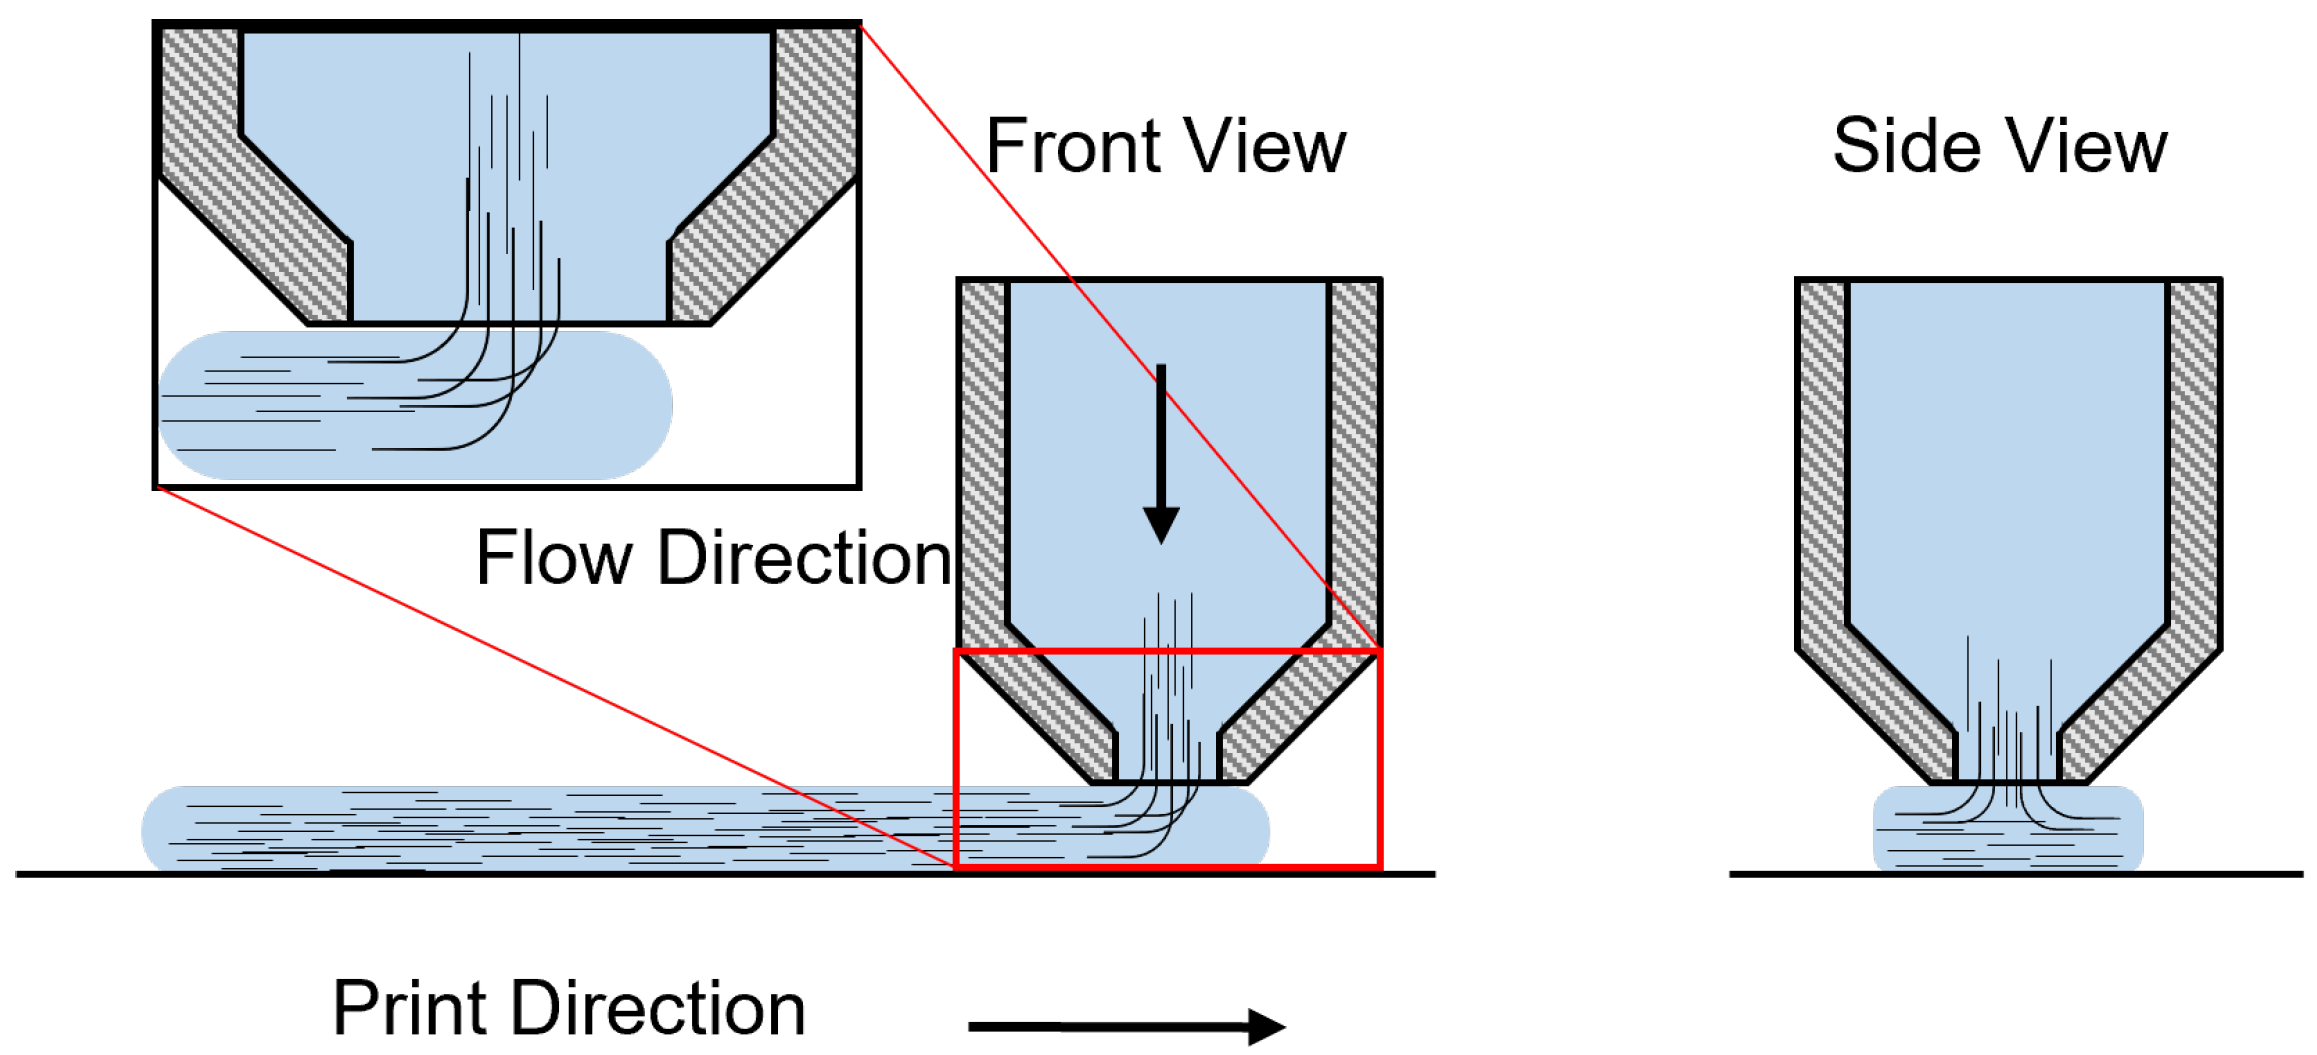
2.1.1. Manufacturing and Sample Preparation
2.2. Material Characterization Method
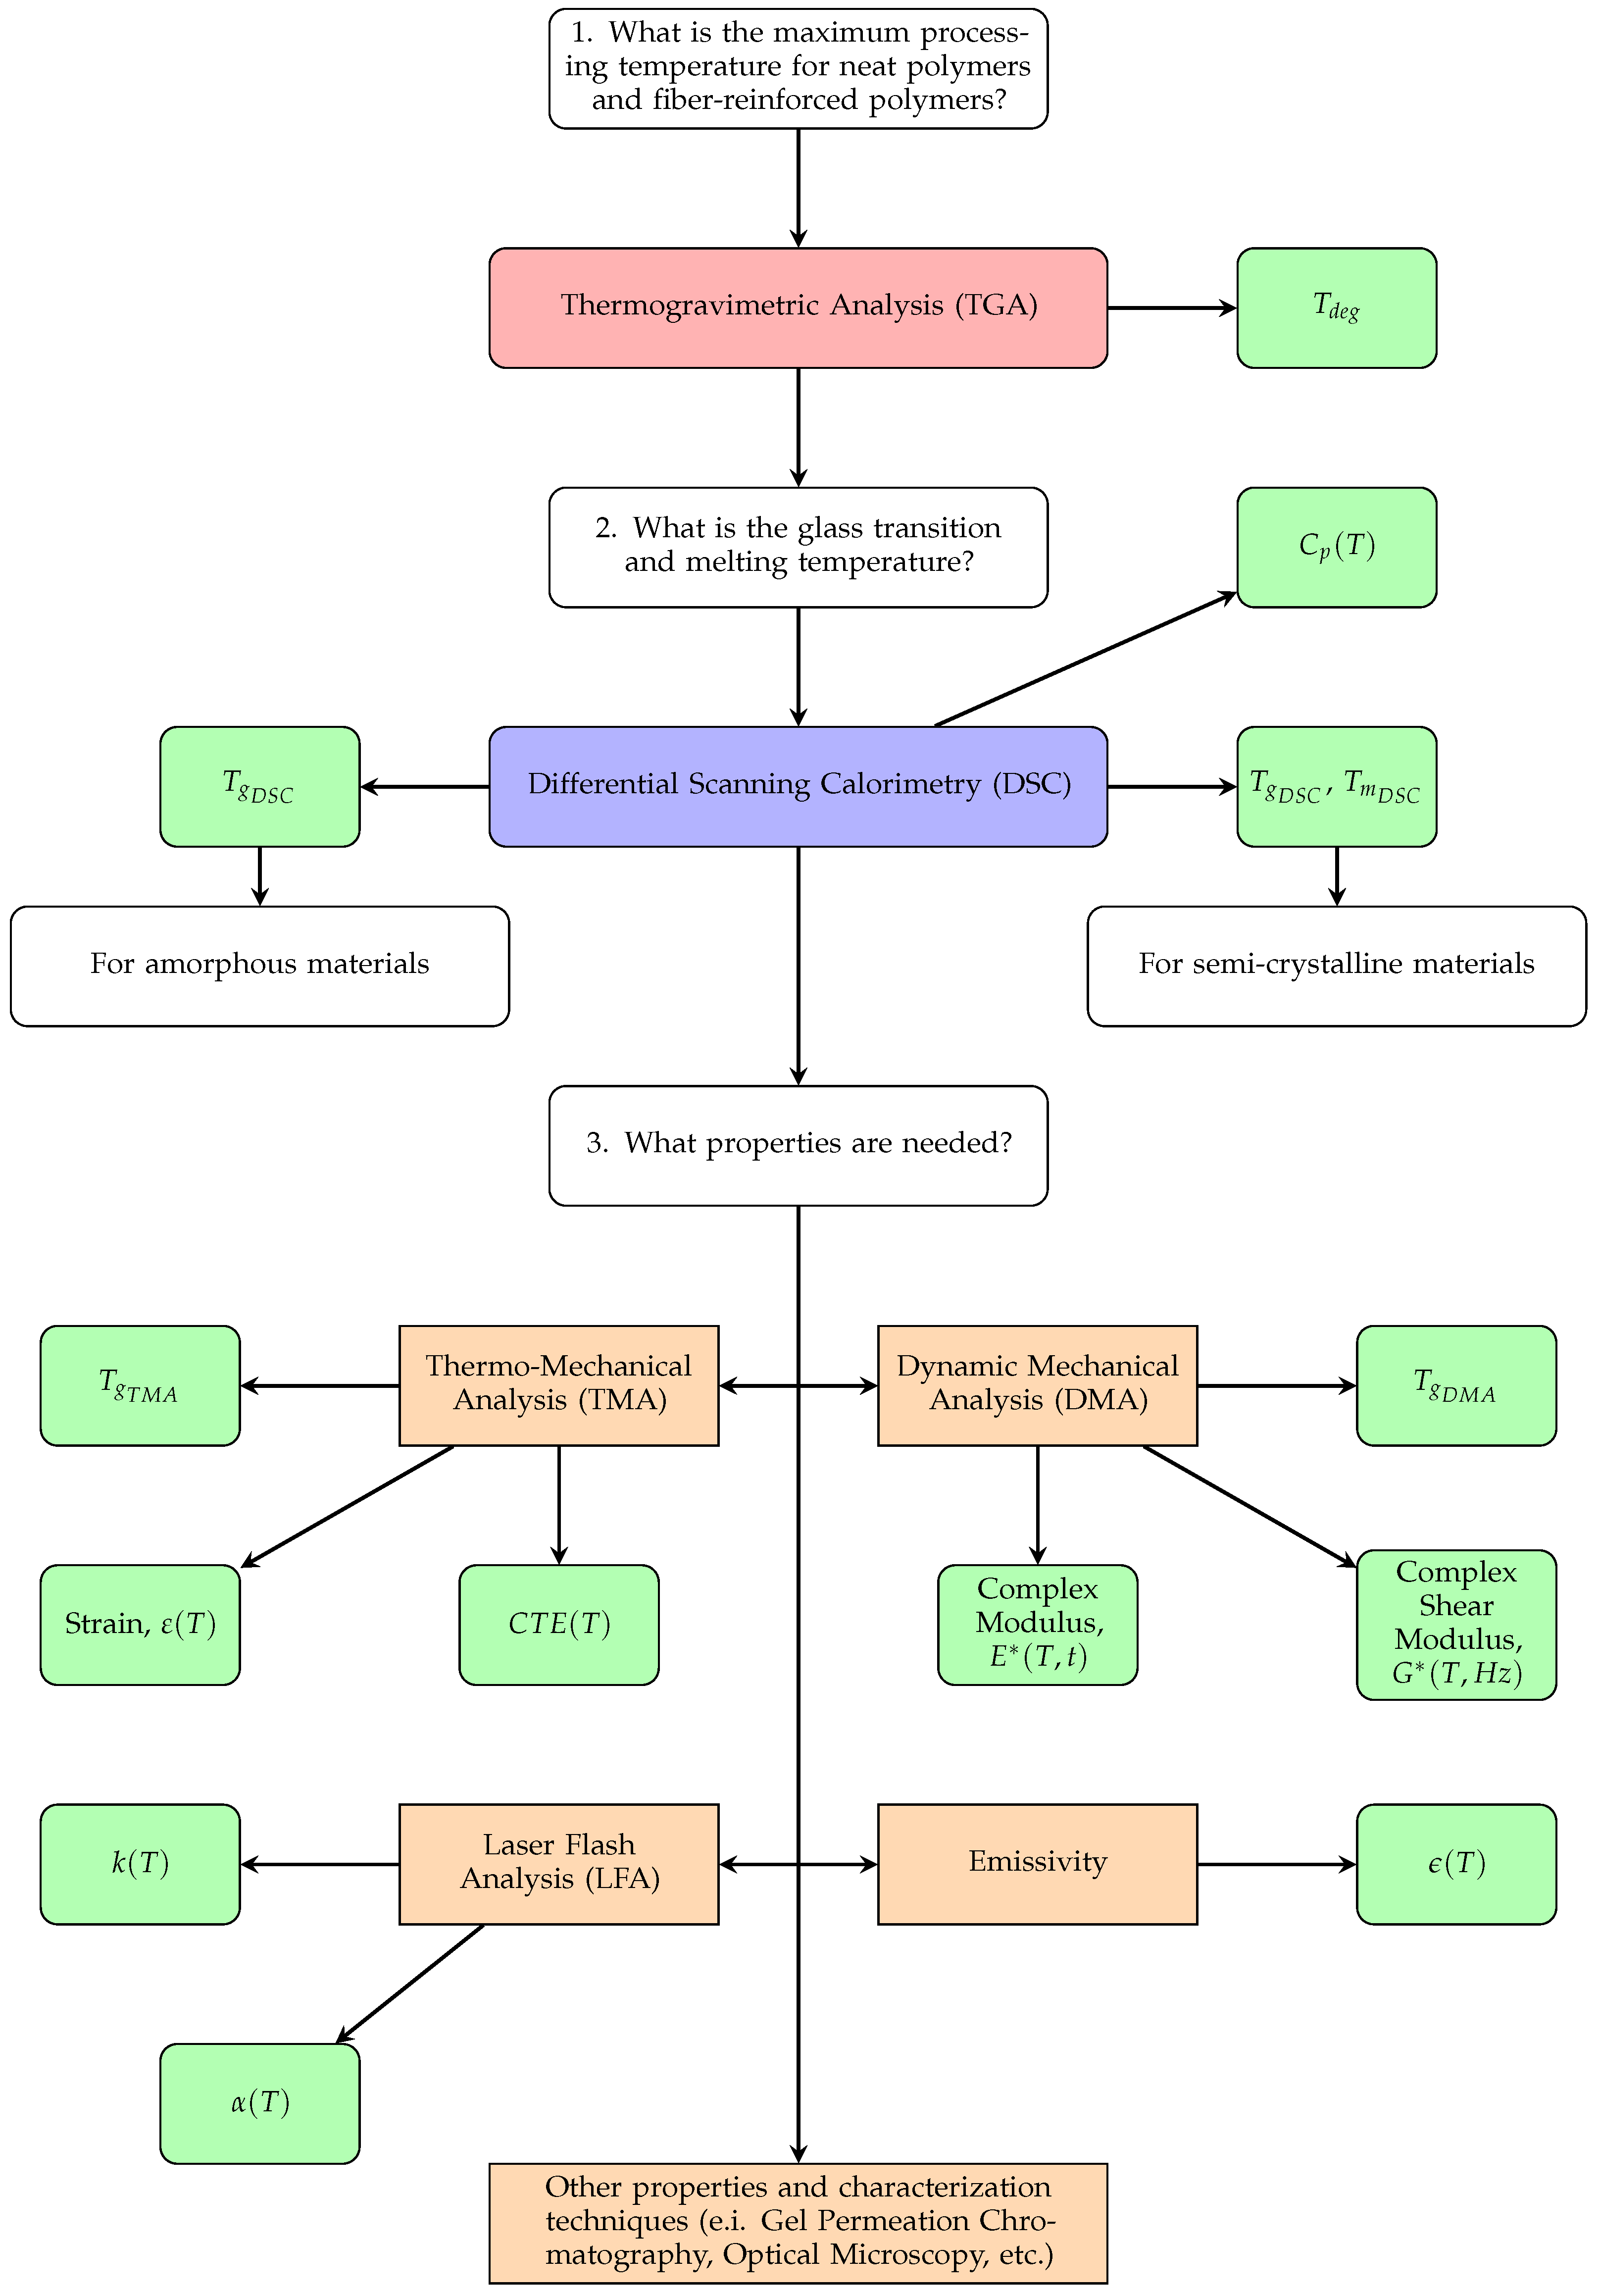
2.2.1. Roadmap
2.2.2. Thermogravimetric Analysis (TGA)
2.2.3. Differential Scanning Calorimetry (DSC)
2.2.4. Thermomechanical Analysis (TMA)
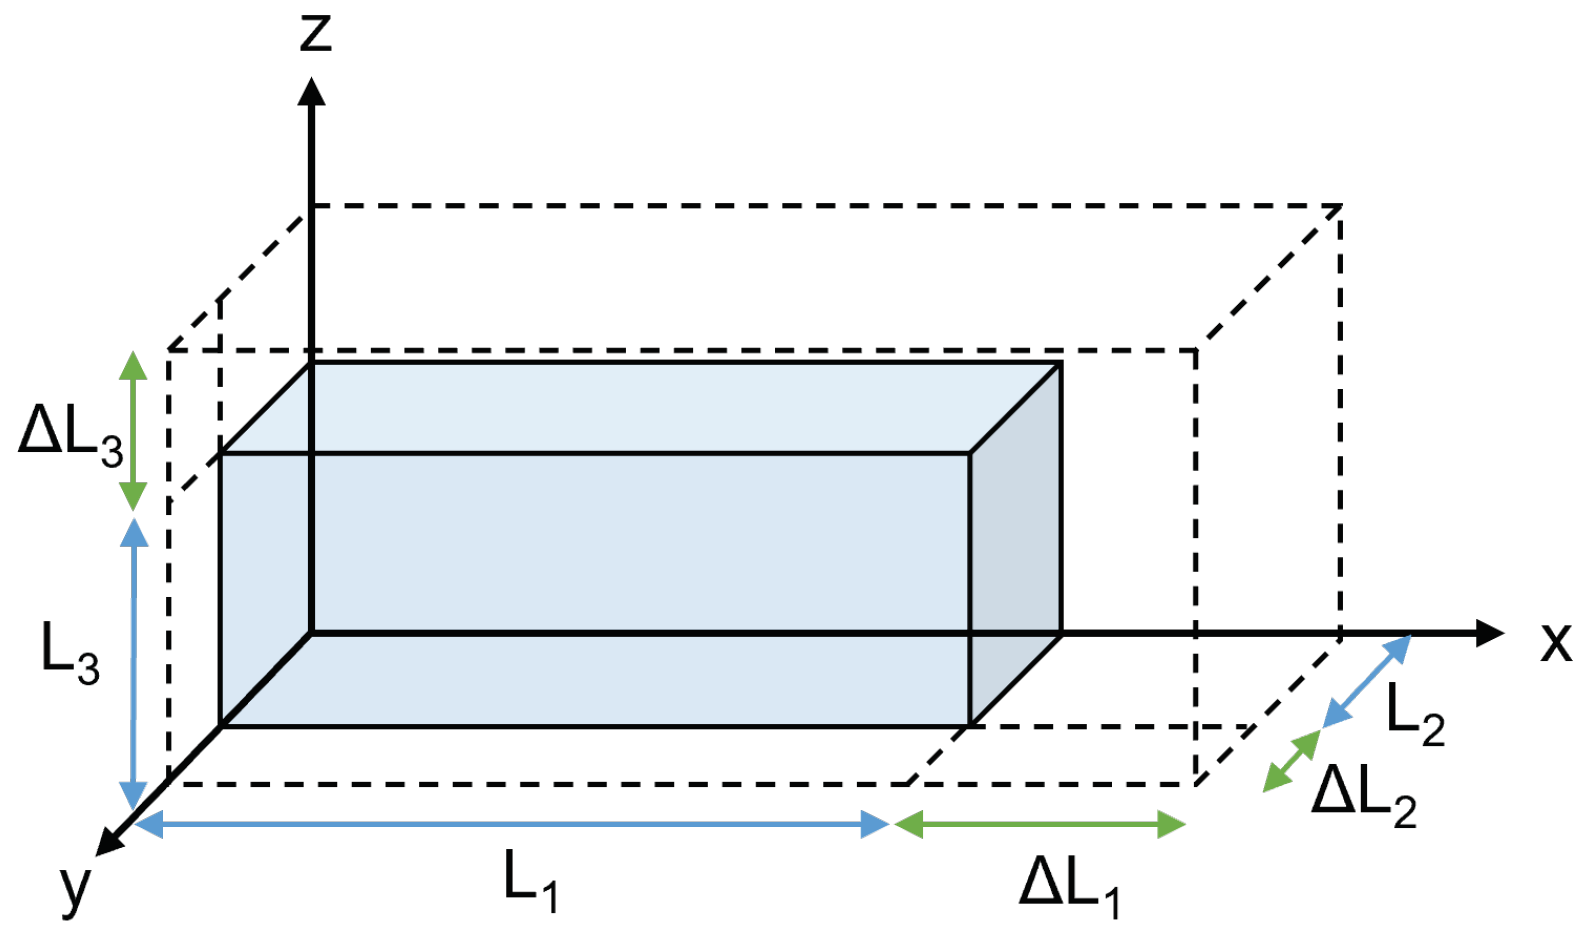
2.3. Volumetric Strains as a Function of Temperature
3. Results and Discussion
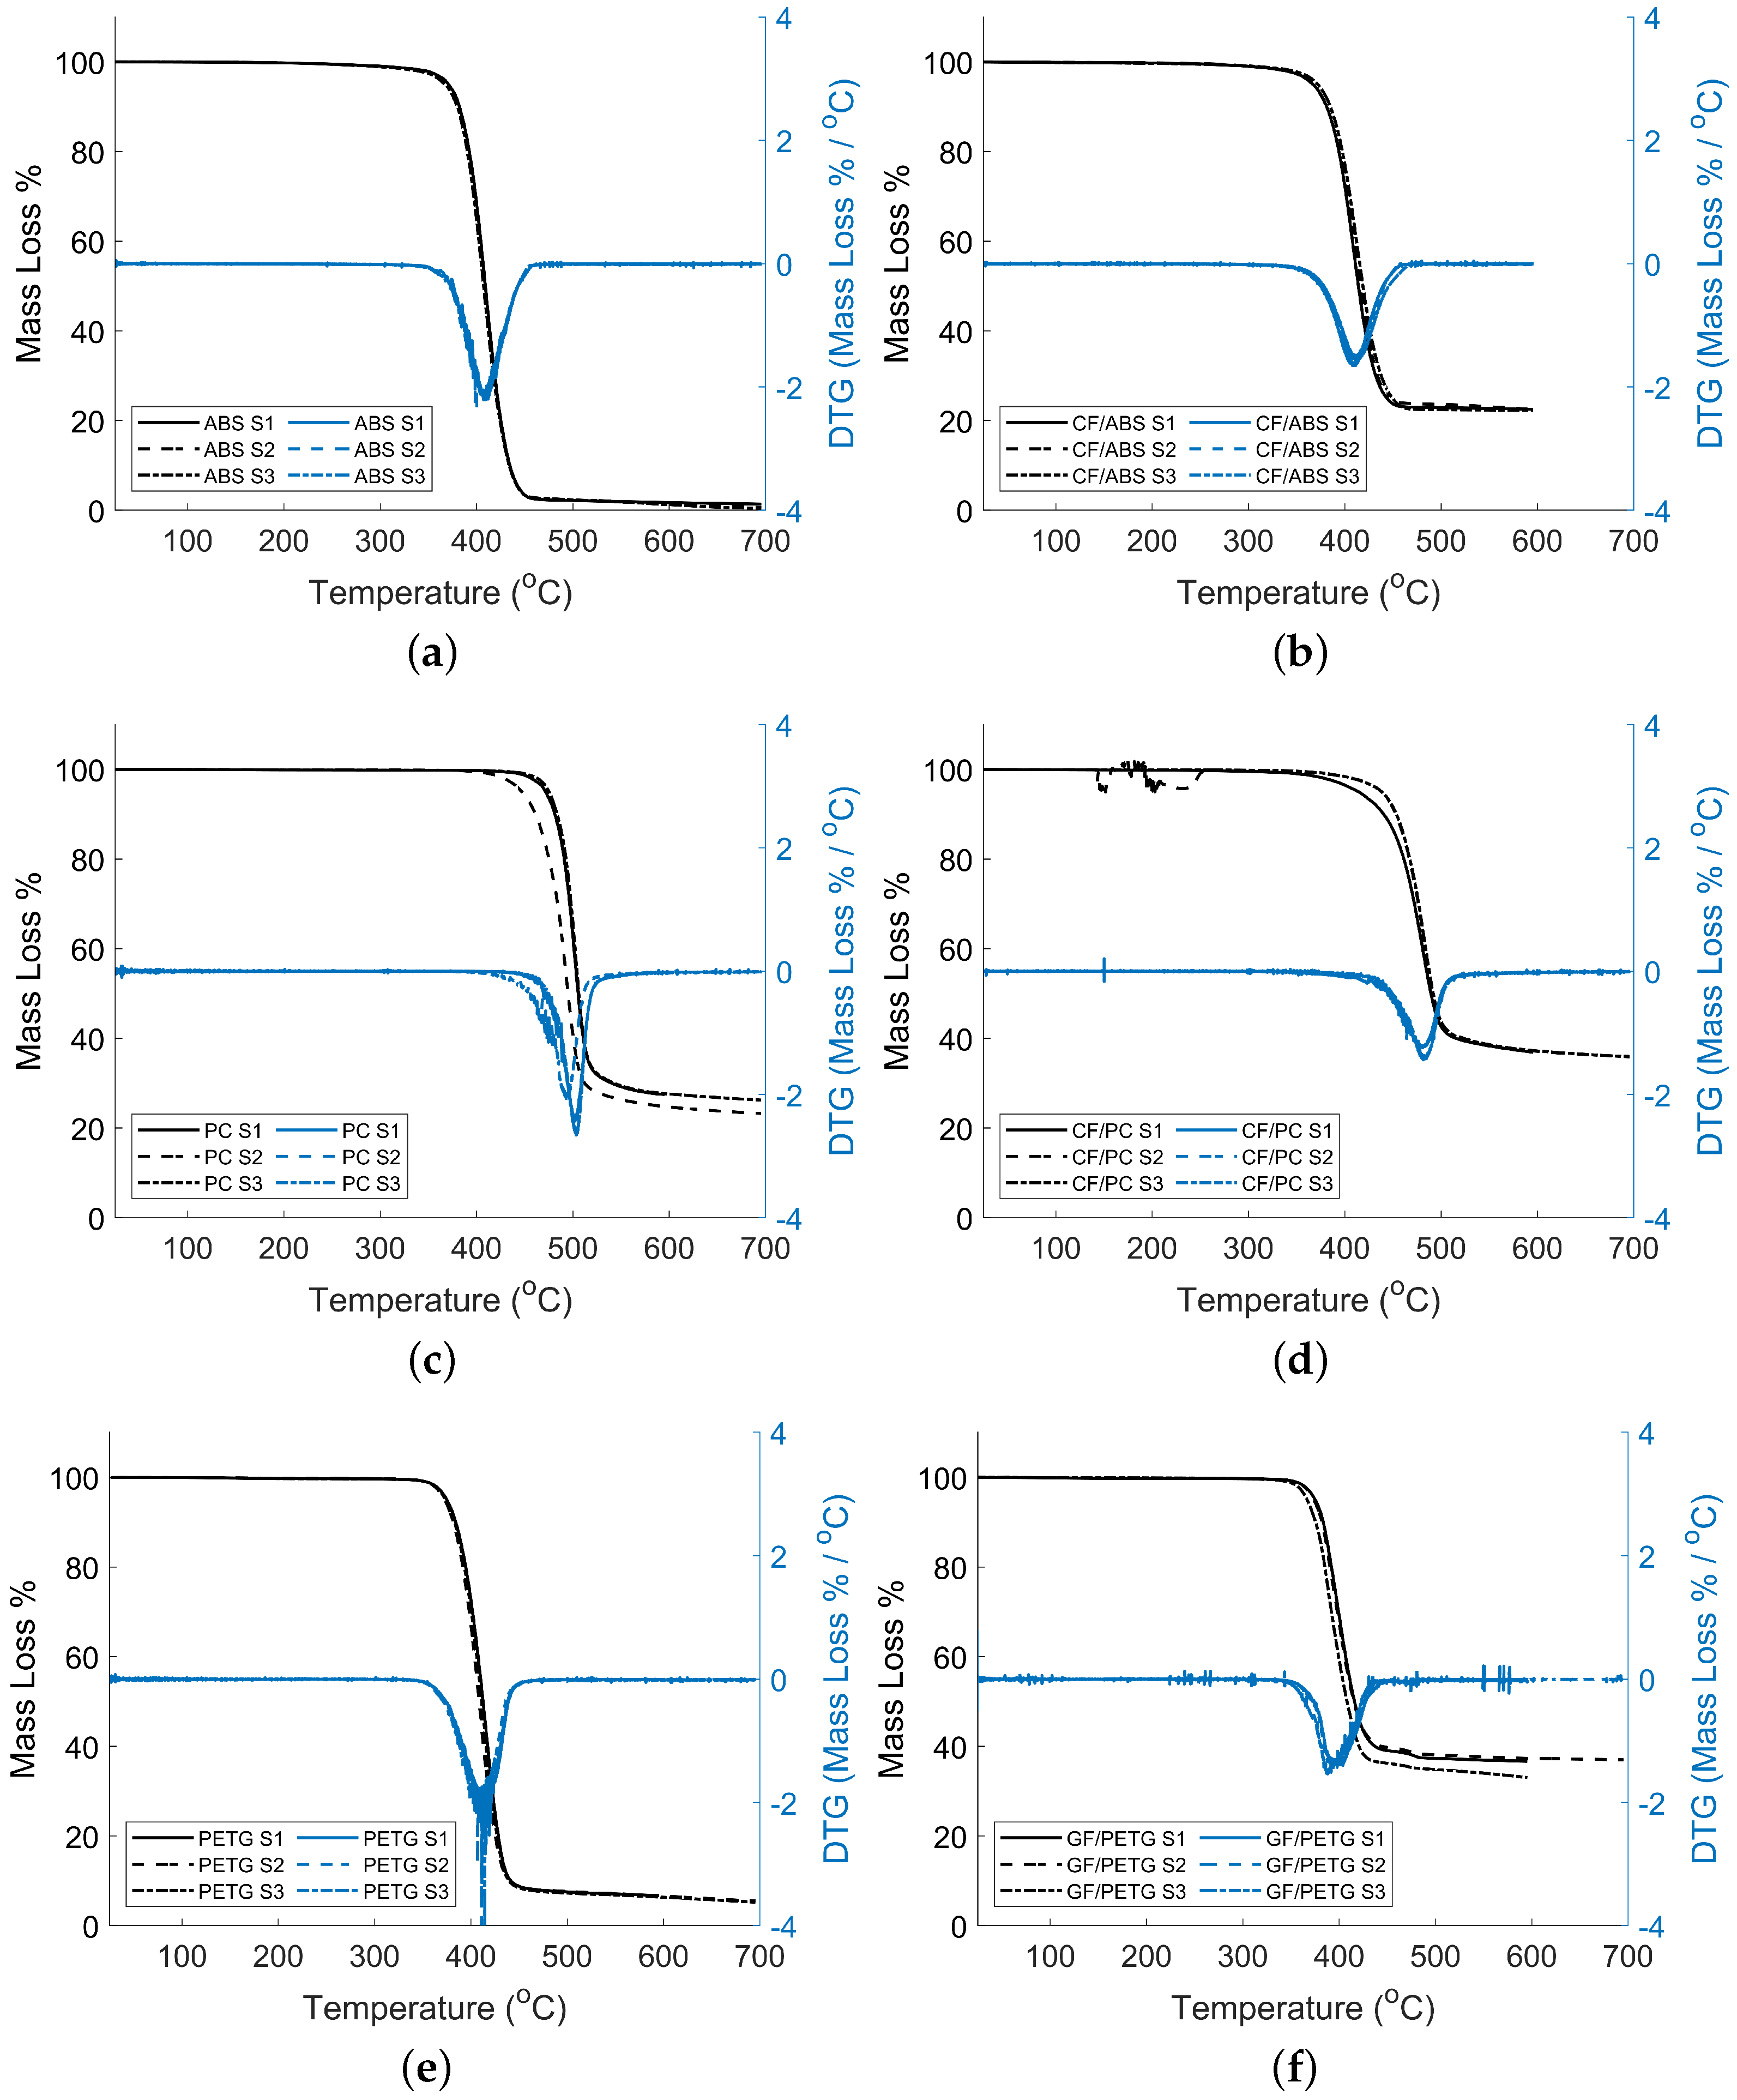
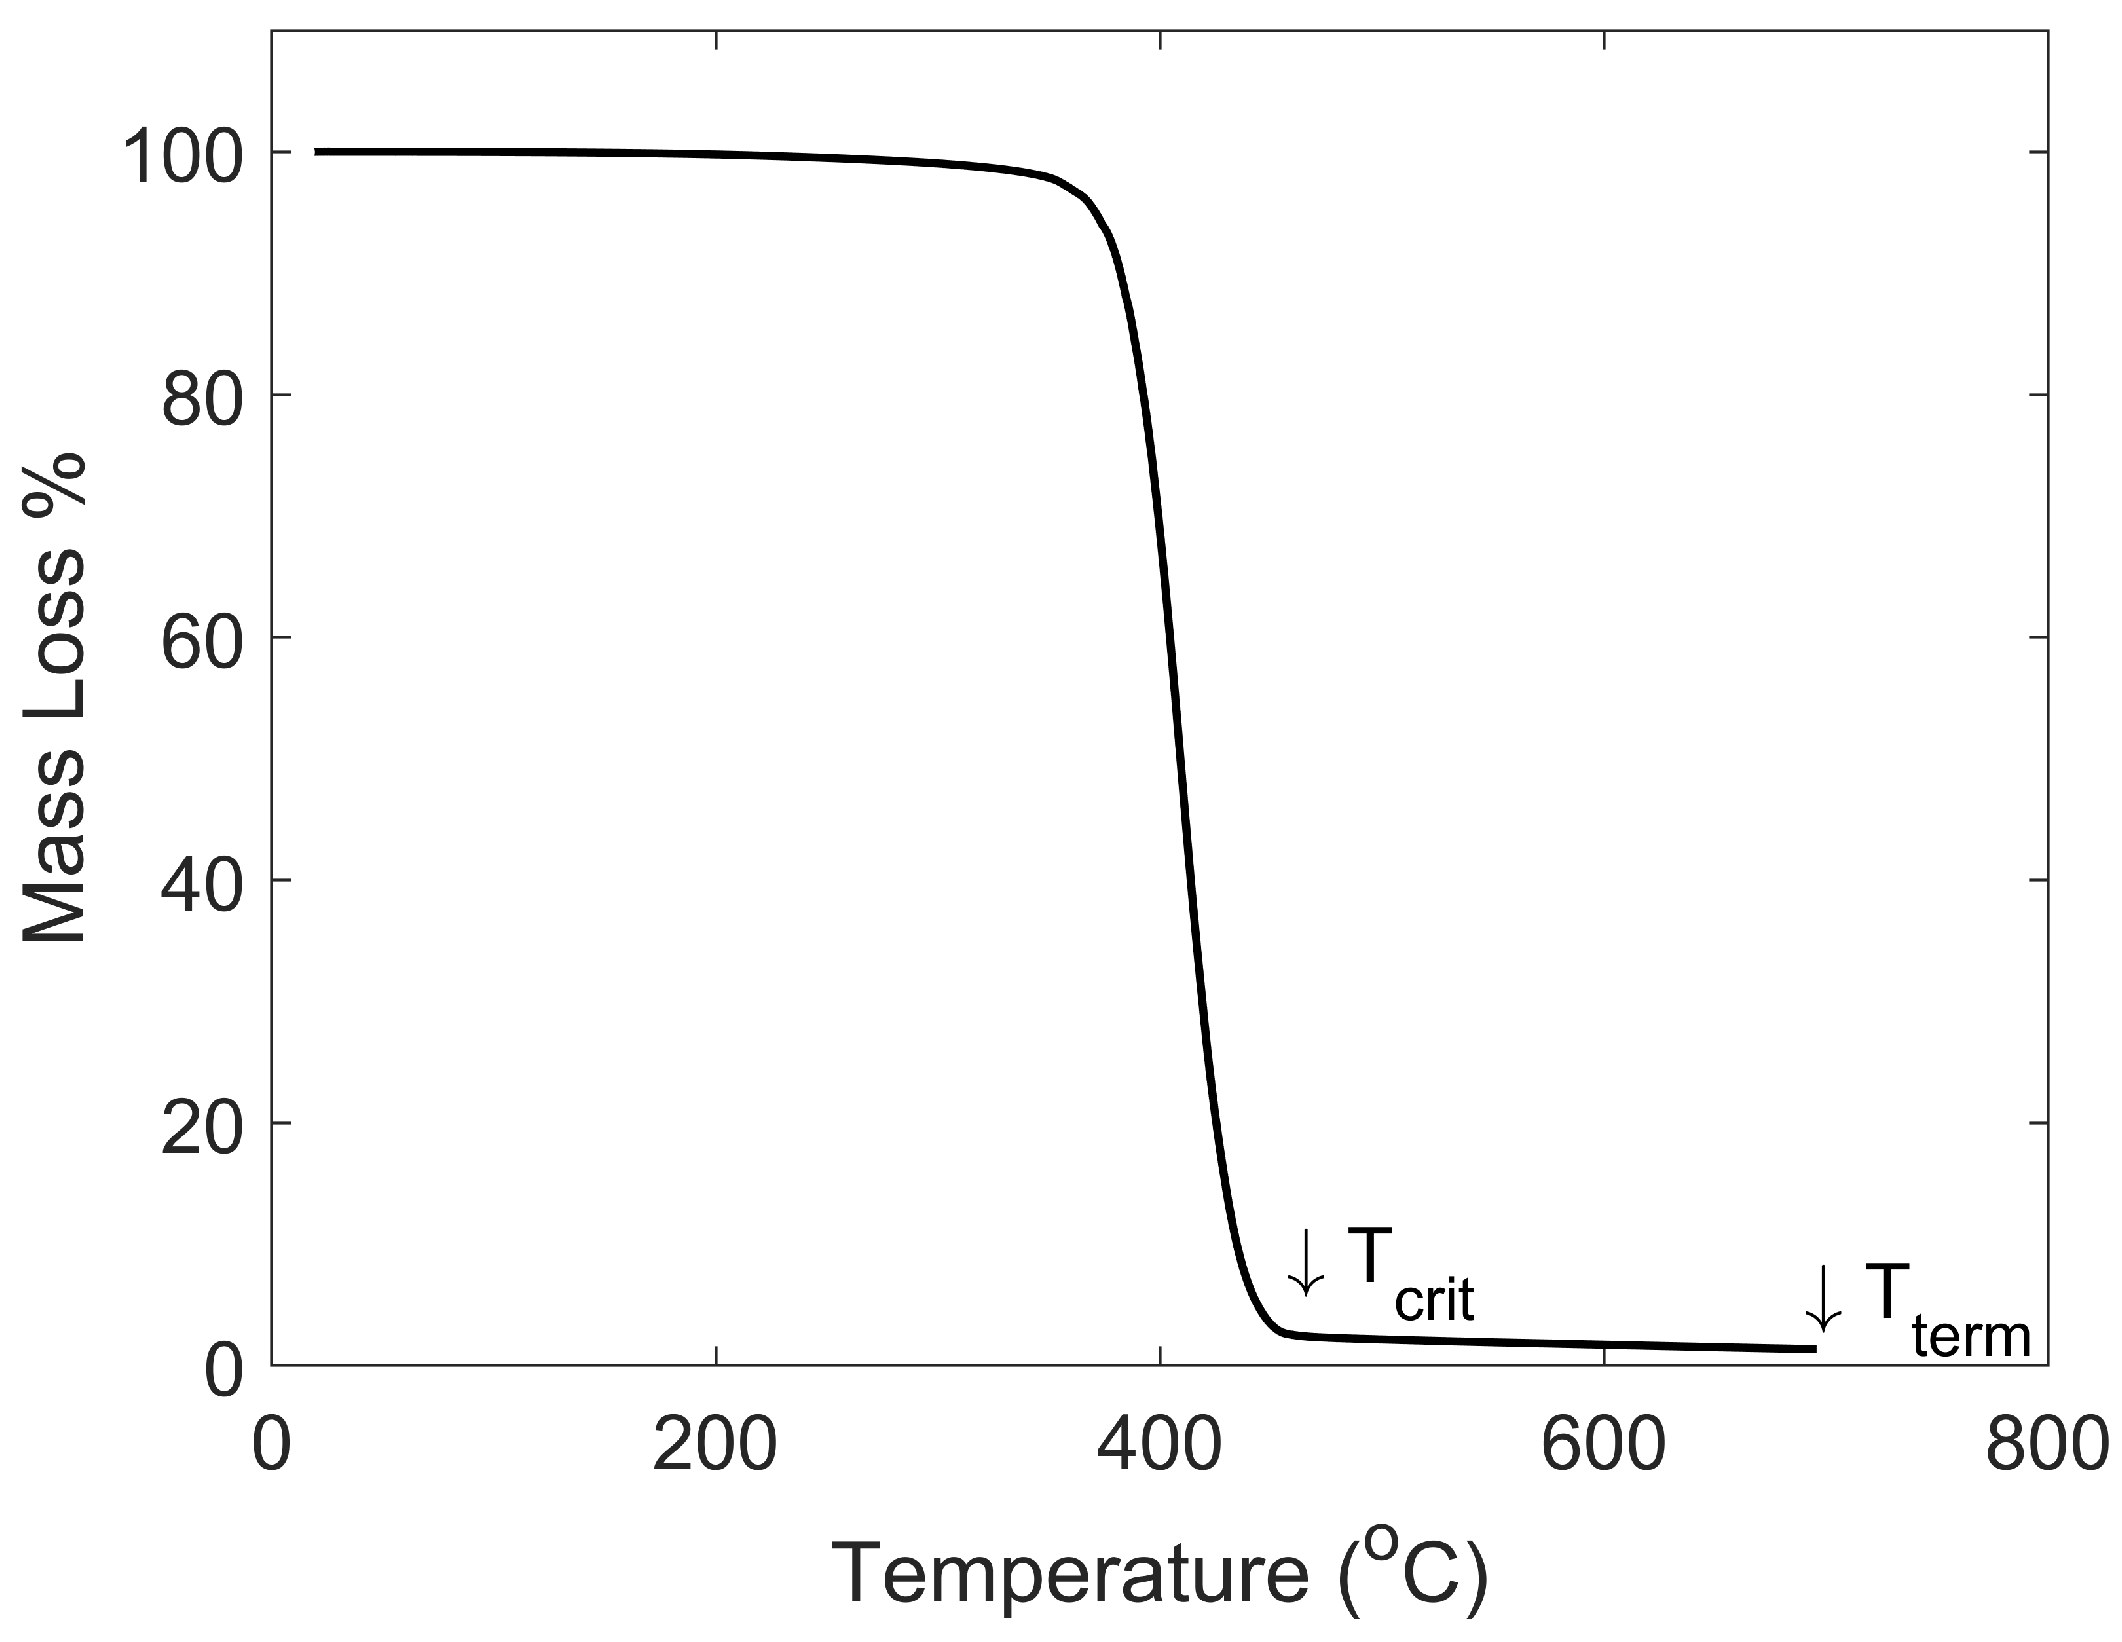
3.1. TGA Results
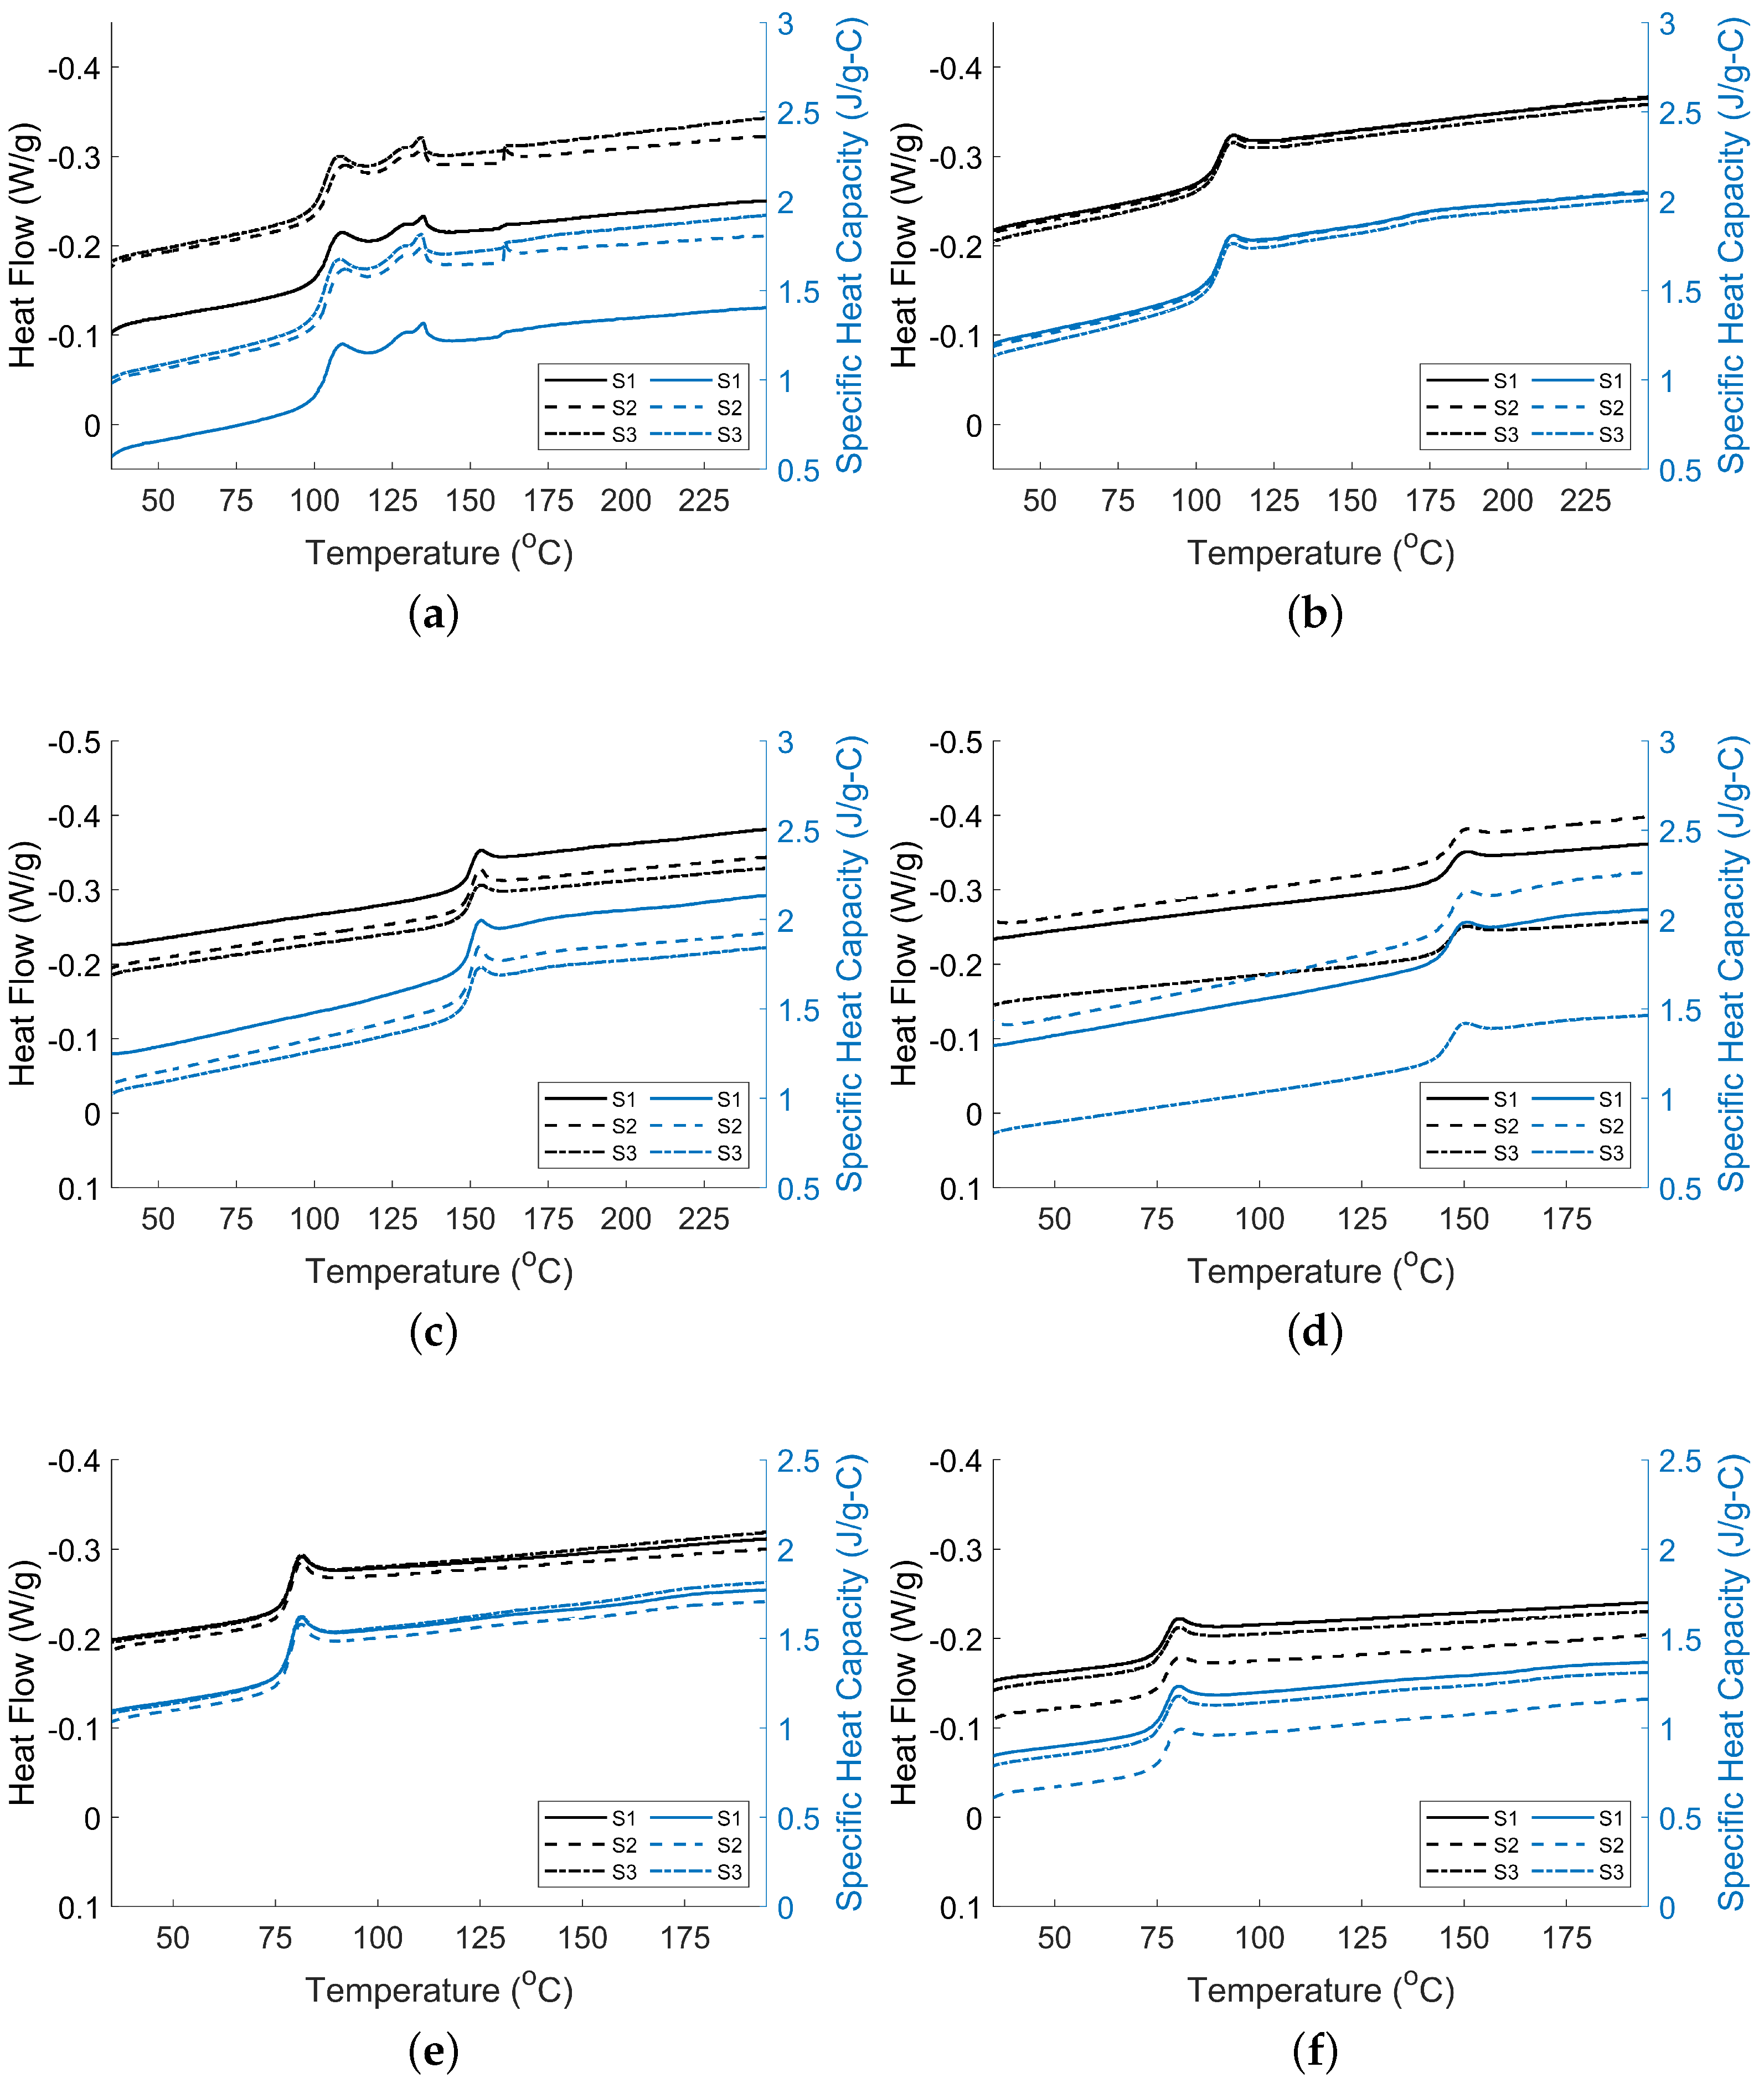
3.2. DSC Results
3.2.1. Heat Flow
3.2.2. Specific Heat Capacity
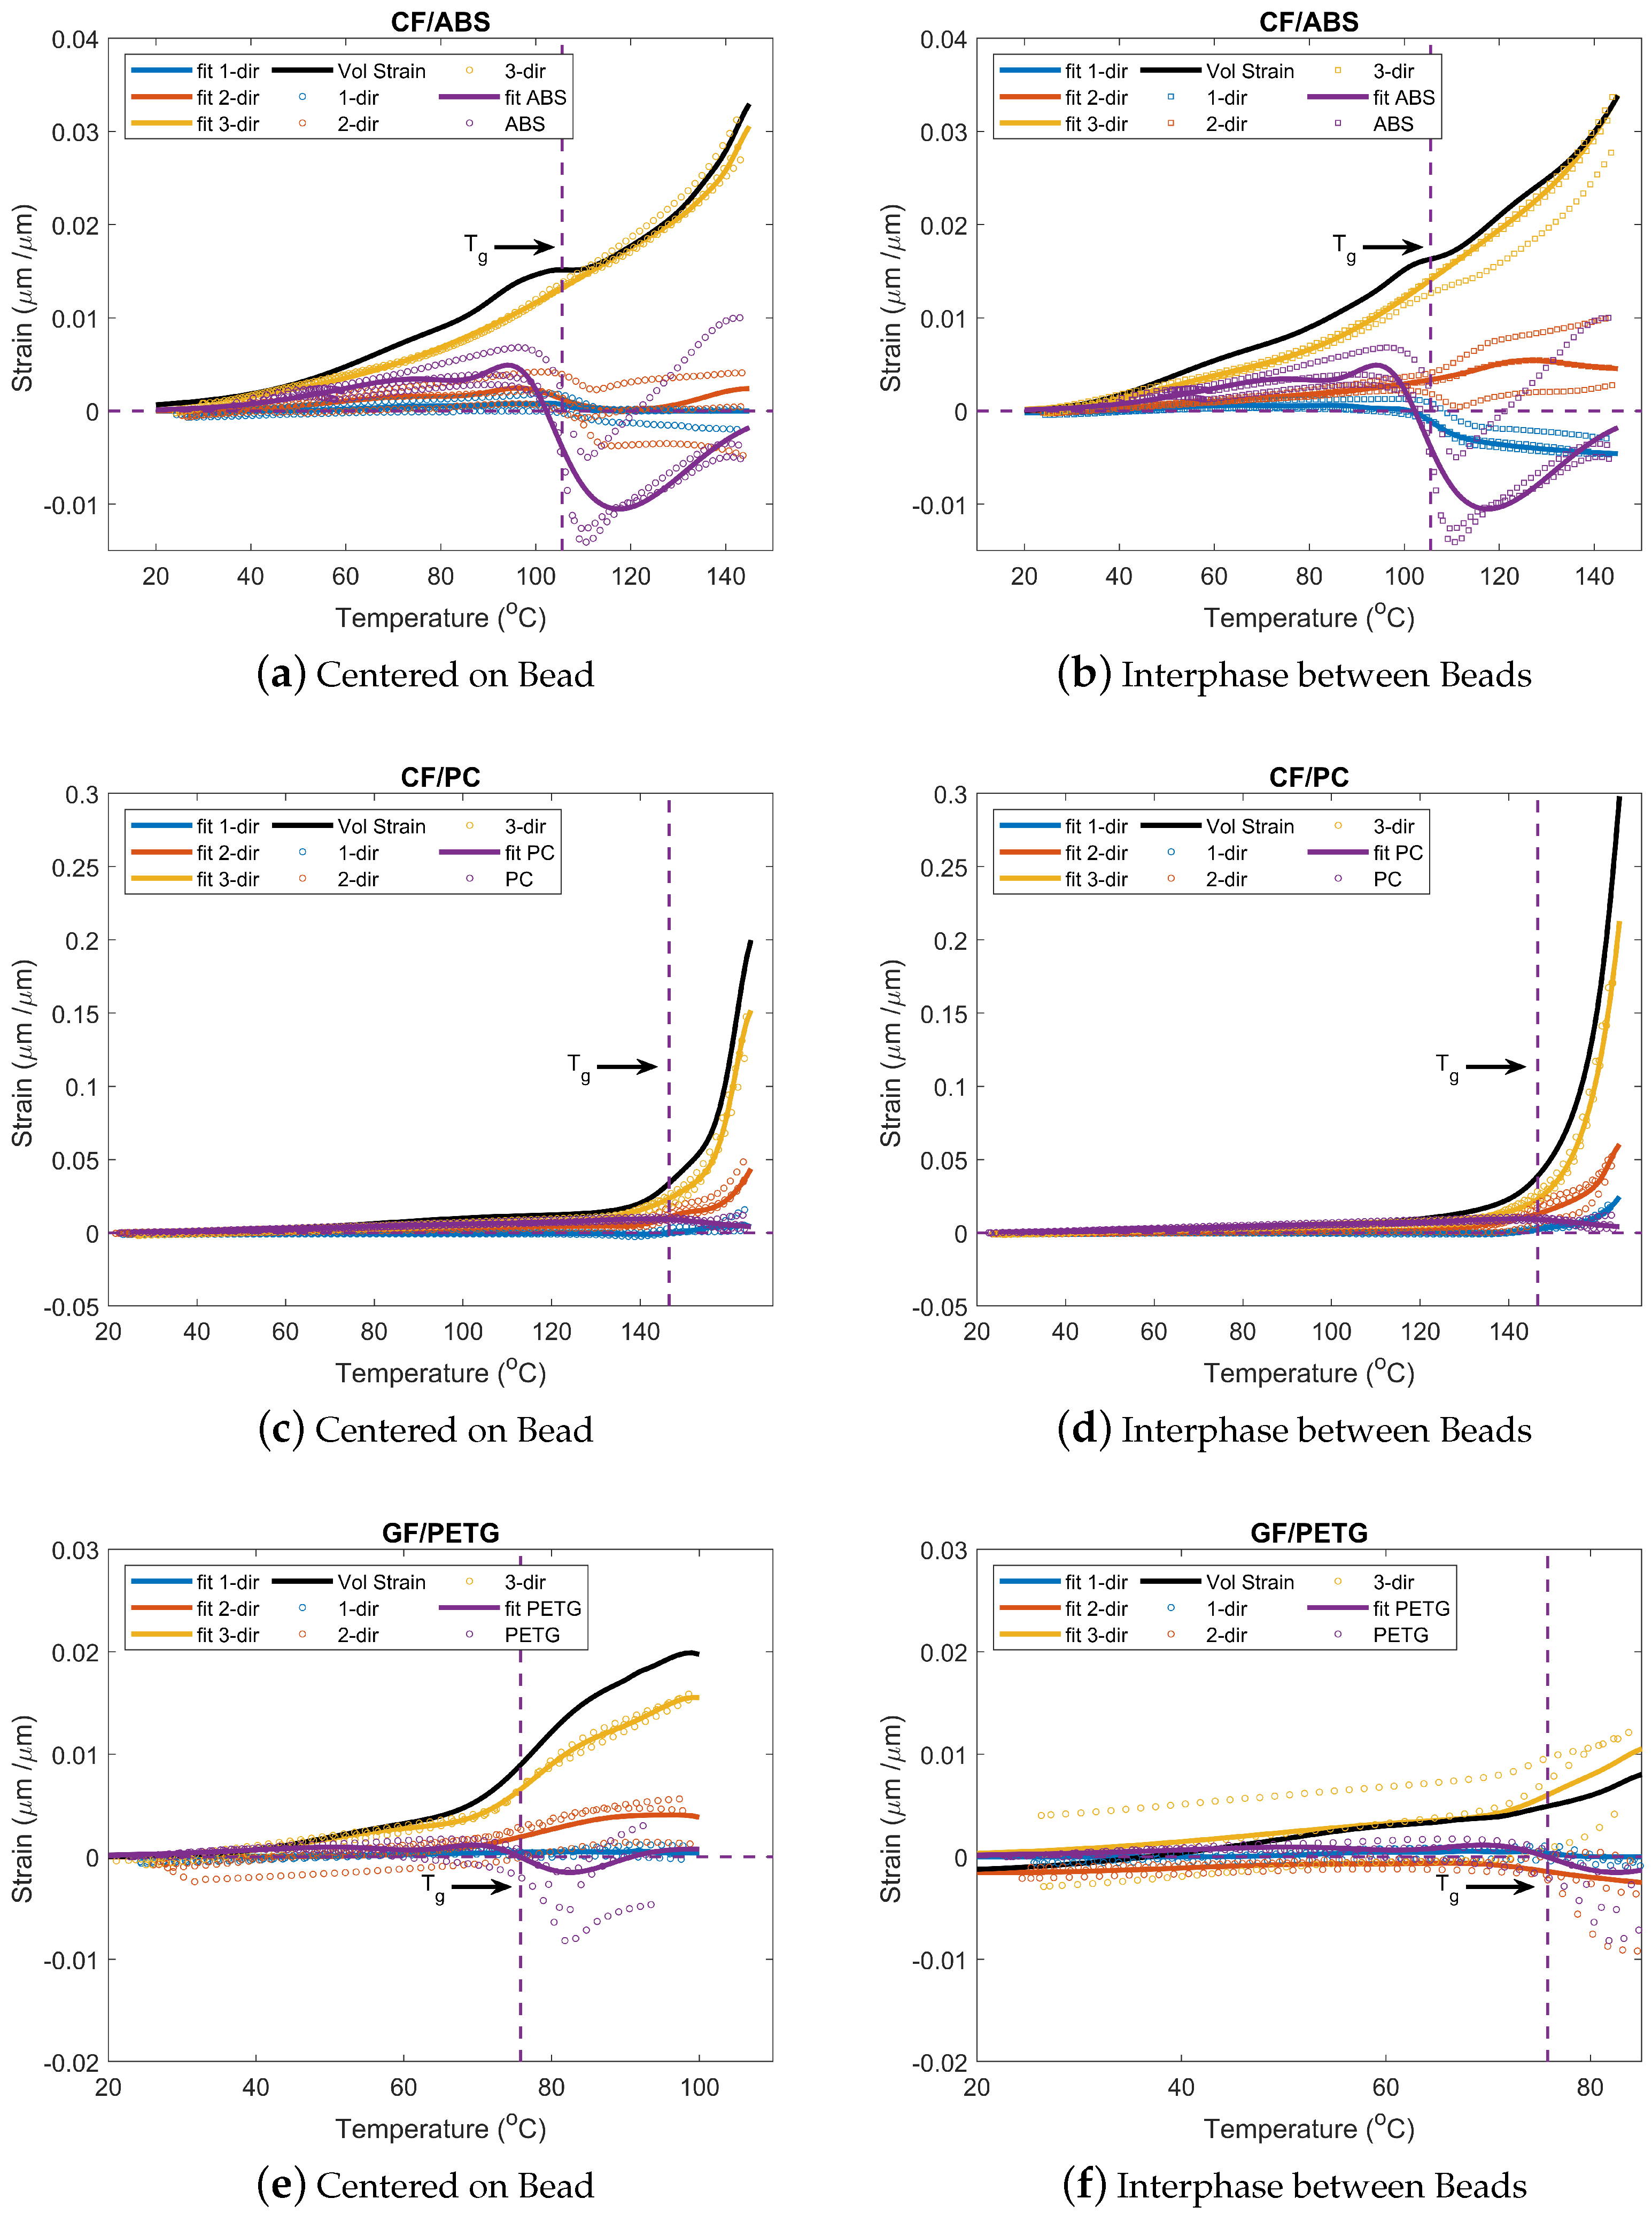
3.3. TMA Results
3.3.1. Strain vs. Temperature
3.3.2. Volumetric Strain Calculation
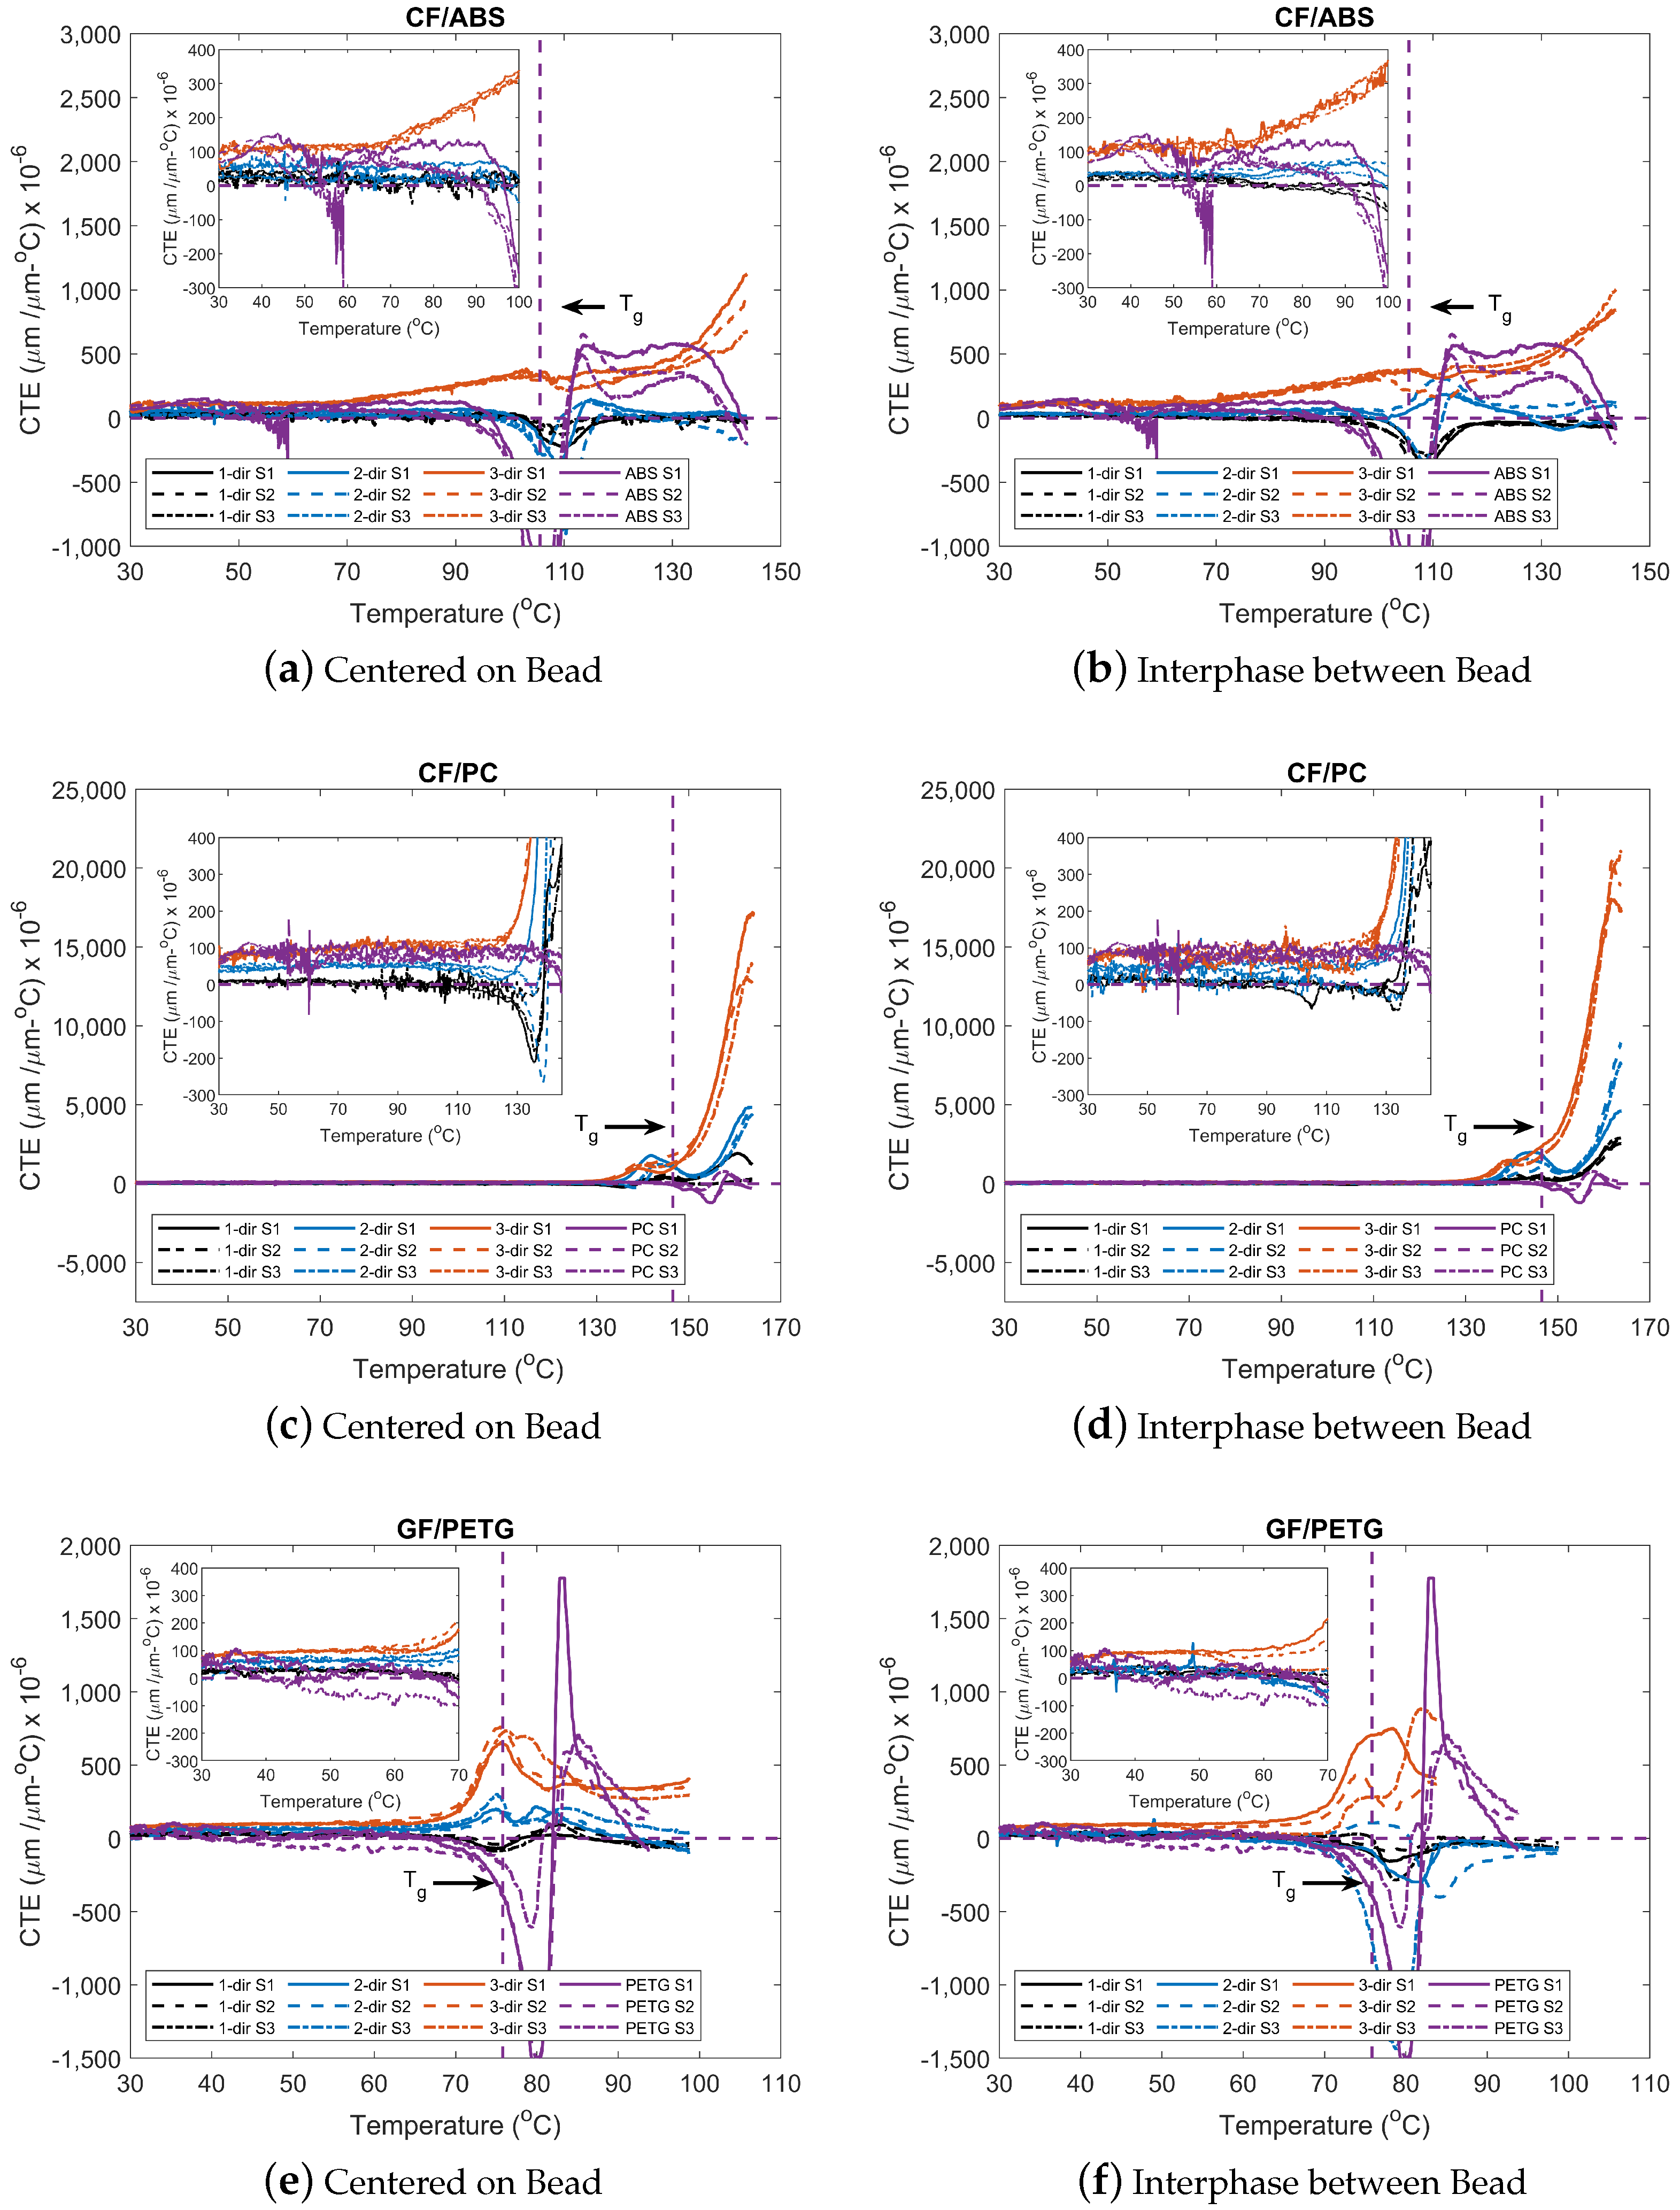
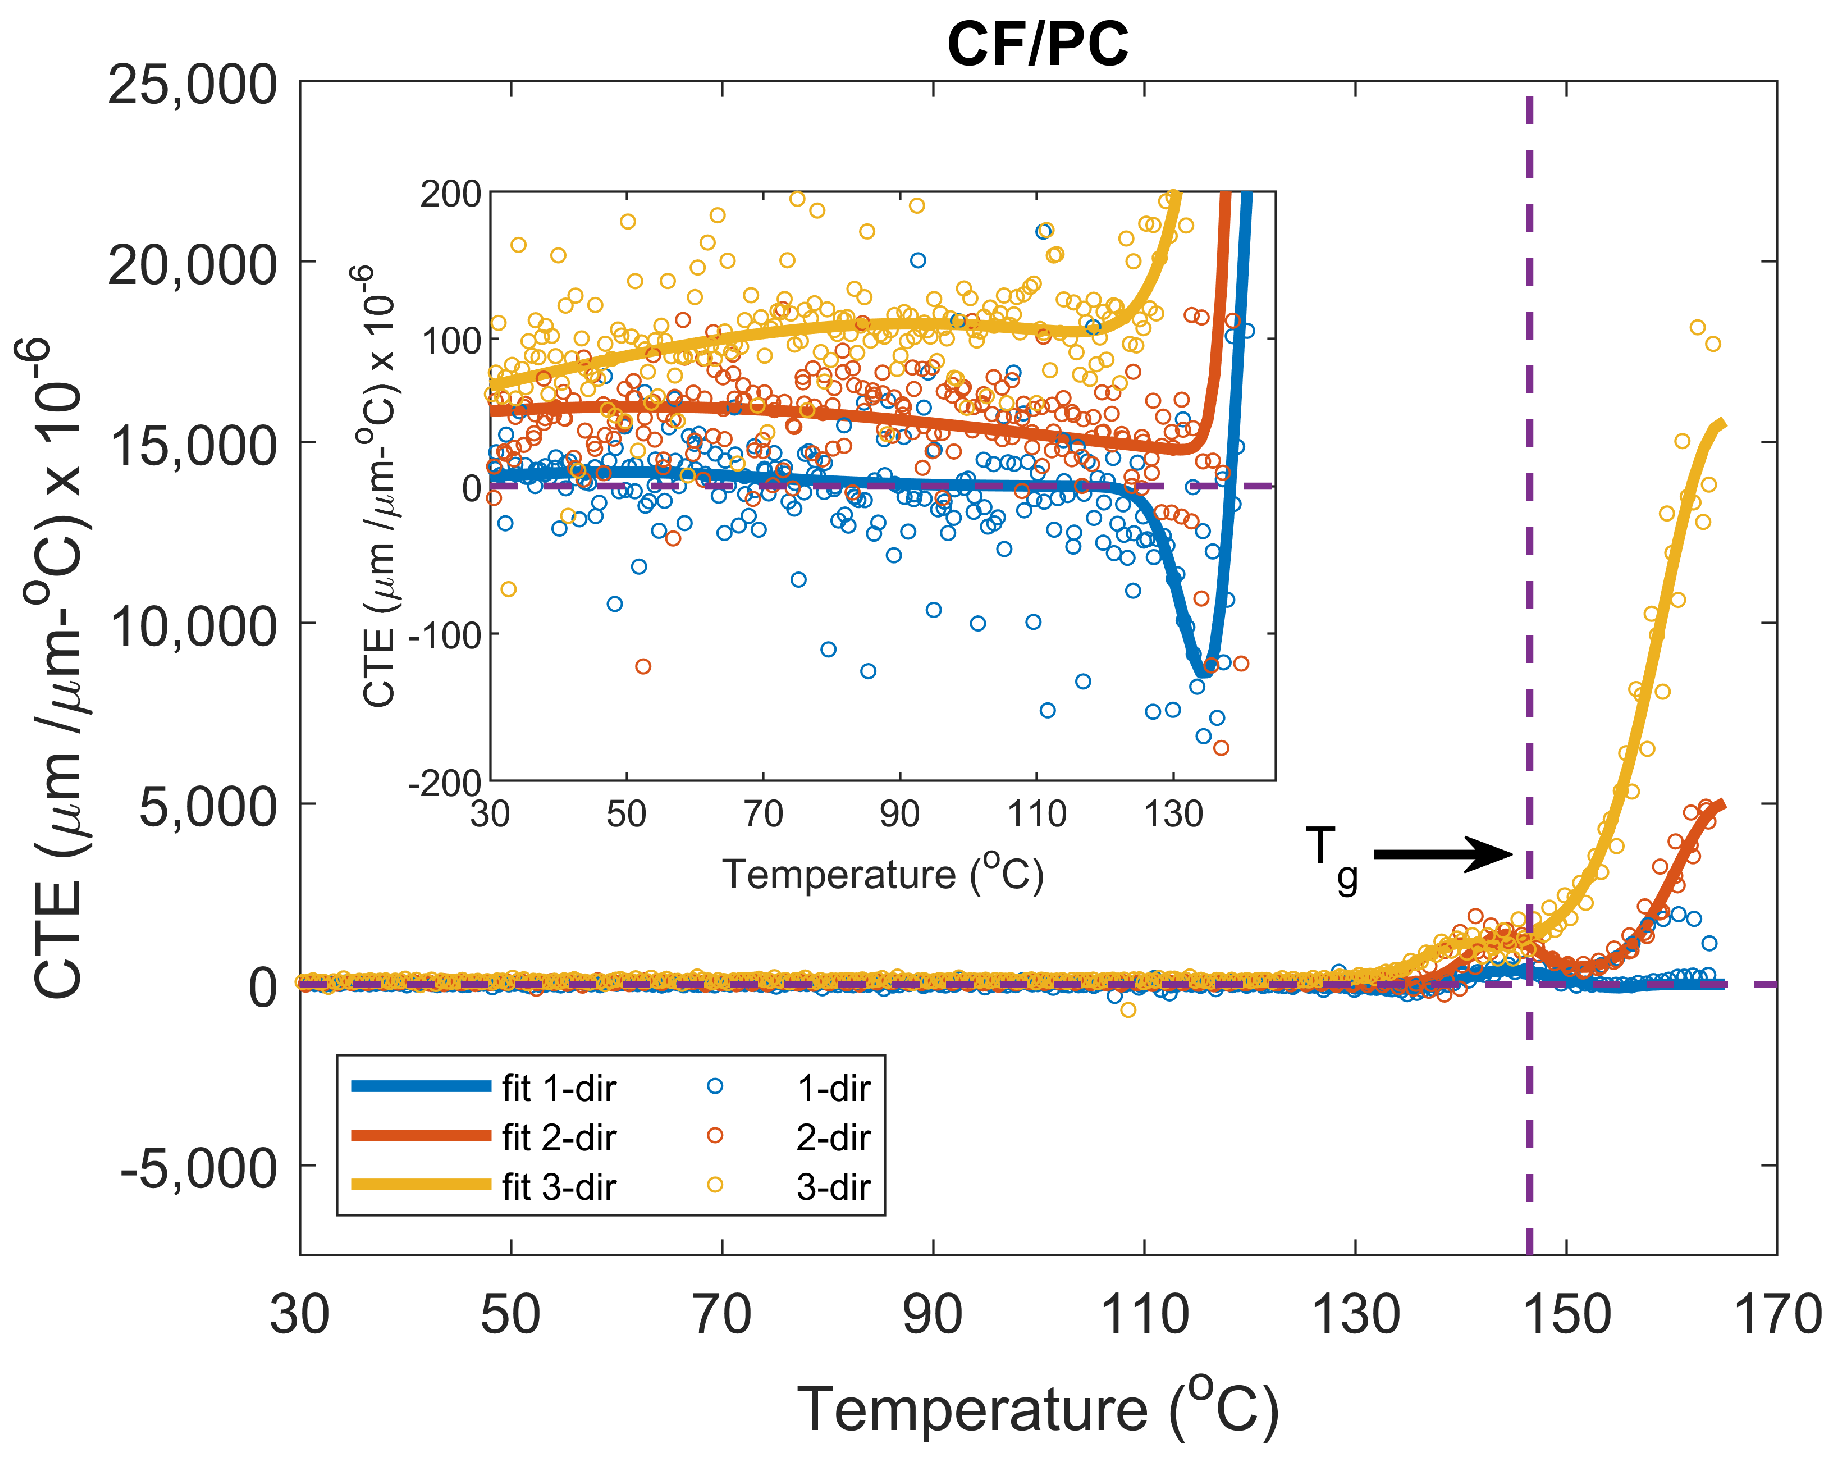
3.3.3. CTE vs. Temperature
3.3.4. Implementation of CTE Data for Numerical Modeling
4. Conclusions
- TGA results showed an increase in the remaining percent mass at and for fiber-filled polymers versus neat polymers. For ABS and PETG, the increase in percent mass is similar to the fiber mass percentage. The PC had a 10% increase with the addition of CF compared to the neat counterpart. The difference is believed to result from additives placed by the manufacturer in the PC materials or char. of ABS varied minimally with the addition of CF, while the addition of fibers to the PETG and PC led to a decrease in .
- DSC results showed fibers’ influence on the composite values. The specific heat capacities increased along with temperature and changed with the addition of fibers and increased with conductive carbon fibers, while they decreased when insulator fibers such as glass are used. The variances in the neat materials seem to have little effect on the outcome of composite fiber-filled materials.
- The strain data show that preferential fiber alignment is present in the parts. Samples showed lower deformation in the 1-dir followed by the 2-dir. The 3-dir possessed the highest deformation. This trend was observed for temperatures below and above . Near , an event where the materials possess a negative strain occurs. This is attributed to the free-volume and phase change process going from solid to glassy.
- CTE results showed that neat materials are similar in magnitude to that of the 3-dir, corresponding to low fiber alignment in the 3-dir. CTE values of samples taken from the interphase between beads are greater than those centered on the bead and are partly due to the complex local fiber alignment at the interphase between the beads. Results show orthotropic behavior in the 3D printed materials. CTE results were consistent with values found in the literature. A Gaussian function was best suited to describe the CTE behavior of the materials used but may not be adequate for all data sets.
Author Contributions
Funding
Institutional Review Board Statement
Informed Consent Statement
Data Availability Statement
Acknowledgments
Conflicts of Interest
Appendix A. Strain vs. Temperature Gaussian Fitting Parameters

| Material | CF/ABS COB | CF/ABS IBB | ||||
|---|---|---|---|---|---|---|
| Direction | 1 | 2 | 3 | 1 | 2 | 3 |
| 4.83 × 10 | 1.70 × 10 | 6.50 × 10 | 1.30 × 10 | 4.80 × 10 | −8.28 × 10 | |
| 104.38 | 97.83 | 146.84 | 101.88 | 134.31 | 176.10 | |
| 4.18 | 9.64 | 6.30 | 6.41 | 46.65 | 50.63 | |
| 5.78 × 10 | 2.40 × 10 | 8.03 × 10 | 1.30 × 10 | 8.59 × 10 | 9.25 × 10 | |
| 96.52 | 145.11 | 136.57 | 91.86 | 124.24 | 180.06 | |
| 8.44 | 13.73 | 4.64 | 12.80 | 9.98 | 53.49 | |
| 5.35 × 10 | 1.60 × 10 | 2.87 × 10 | −9.40 × 10 | 7.25 × 10 | 2.10 × 10 | |
| 78.20 | 75.88 | 176.67 | 85.76 | 67.26 | 61.63 | |
| 17.60 | 25.16 | 80.58 | 5.25 × 10 | 25.24 | 24.76 | |
| - | - | - | −2.80 × 10 | - | - | |
| - | - | - | 92.95 | - | - | |
| - | - | - | 52.42 | - | - | |
| - | - | - | 2.55 × 10 | - | - | |
| - | - | - | 79.97 | - | - | |
| - | - | - | 7.36 × 10 | - | - | |
| - | - | - | 3.00 × 10 | - | - | |
| - | - | - | 73.87 | - | - | |
| - | - | - | 33.06 | - | - | |
| - | - | - | −4.20 × 10 | - | - | |
| - | - | - | 166.13 | - | - | |
| - | - | - | 51.10 | - | - | |
| 0.3059 | 0.3836 | 0.9980 | 0.9420 | 0.9835 | 0.9978 | |
| Material | CF/PC COB | CF/PC IBB | ||||
|---|---|---|---|---|---|---|
| Direction | 1 | 2 | 3 | 1 | 2 | 3 |
| −8.08 × 10 | 2.53 × 10 | 9.02 × 10 | 9.64 × 10 | 1.74 × 10 | 1.17 × 10 | |
| 676.11 | 514.14 | 165.59 | 178.93 | 165.31 | 345.52 | |
| 102.60 | 70.05 | 5.72 | 11.59 | 3.61 | 49.53 | |
| 4.30 × 10 | 5.50 × 10 | 7.68 × 10 | 4.40 × 10 | 0 | 1.87 × 10 | |
| 165.19 | 149.83 | 178.17 | 157.98 | 151.87 | 215.52 | |
| 3.10 | 6.55 | 26.30 | 7.64 | 2.00 × 10 | 100.15 | |
| 1.36 × 10 | 4.30 × 10 | 7.50 × 10 | 2.60 × 10 | 9.71 | 0 | |
| 163.16 | 124.46 | 118.64 | 149.22 | 340.55 | 1.55 × 10 | |
| 11.67 | 57.10 | 48.29 | 5.89 | 75.44 | 269.08 | |
| 0.8752 | 0.9834 | 0.9969 | 0.9870 | 0.9046 | 0.9974 | |
| Material | GF/PETG COB | GF/PETG IBB | ||||
|---|---|---|---|---|---|---|
| Direction | 1 | 2 | 3 | 1 | 2 | 3 |
| 1.73 × 10 | 3.27 × 10 | 2.7 × 10 | 0 | 34.34 | 5.50 × 10 | |
| 91.77 | 99.36 | 61.75 | 80.26 | 35.48 | 87.13 | |
| 1.25 | 3.29 | 18.29 | 1.72 × 10 | 12.58 | 4.70 | |
| −2.84 × 10 | −3.96 × 10 | −3.58 × 10 | 4.64 × 10 | 18.78 | 3.90 × 10 | |
| 98.74 | 90.81 | 93.05 | 69.84 | 51.62 | 80.91 | |
| 13.03 | 2.49 | 11.78 | 7.00 | 6.38 | 7.08 | |
| 6.53 × 10 | 4.10 × 10 | 4.97 × 10 | −5.5 × 10 | 18.78 | 3.70 × 10 | |
| 97.17 | 92.68 | 93.82 | 78.98 | 51.62 | 72.92 | |
| 35.26 | 19.58 | 13.92 | 66.11 | 6.38 | 34.27 | |
| - | - | - | 8.49 × 10 | - | - | |
| - | - | - | 79.28 | - | - | |
| - | - | - | −8.9 × 10 | - | - | |
| - | - | - | 4.3 × 10 | - | - | |
| - | - | - | 63.14 | - | - | |
| - | - | - | 34.60 | - | - | |
| 0.2838 | 0.5530 | 0.9945 | 0.0658 | 0.9067 | 0.2654 | |
| Material | ABS | PC | PETG |
|---|---|---|---|
| −1.35 × 10 | 0 | −2.33 × 10 | |
| 114.57 | 273.76 | 74.02 | |
| 22.77 | 20.28 | 11.16 | |
| 7.30 × 10 | 4.40 × 10 | 2.23 × 10 | |
| 97.79 | 143.91 | 73.37 | |
| 9.45 | 17.71 | 10.25 | |
| 4.80 × 10 | 6.40 × 10 | 1.60 × 10 | |
| 89.63 | 115.14 | 71.99 | |
| 36.50 | 57.31 | 34.71 | |
| 0.9424 | 0.9275 | 0.9414 |
Appendix B. Determination of Tcrit and Tdeg
| Sample Number | Parameter | ABS | CF/ABS | PC | CF/PC | PETG | GF/PETG |
|---|---|---|---|---|---|---|---|
| 1 | Temperature (C) | 457.15 | 464.76 | 530.17 | 518.42 | 449.87 | 487.27 |
| Percentage (%) | 2.623 | 22.64 | 31.10 | 40.38 | 8.79 | 37.42 | |
| 2 | Temperature (C) | 454.49 | 455.16 | 557.75 | 504.43 | 454.05 | 481.94 |
| Percentage (%) | 2.867 | 23.27 | 28.95 | 41.4 | 8.186 | 38.34 | |
| 3 | Temperature (C) | 455.38 | 462.13 | 537.73 | 526.28 | 450.48 | 446.81 |
| Percentage (%) | 2.957 | 23.90 | 27.02 | 39.70 | 8.734 | 36.62 |
| Sample Number | Parameter | ABS | CF/ABS | PC | CF/PC | PETG | GF/PETG |
|---|---|---|---|---|---|---|---|
| 1 | Temperature (C) | 695.57 | 595.36 | 595.31 | 695.33 | 595.33 | 595.40 |
| Percentage (%) | 1.359 | 22.32 | 27.46 | 35.95 | 6.722 | 36.67 | |
| 2 | Temperature (C) | 695.55 | 592.98 | 695.44 | 595.41 | 695.37 | 695.35 |
| Percentage (%) | 0.6329 | 22.52 | 26.23 | 36.90 | 5.279 | 37.00 | |
| 3 | Temperature (C) | 695.54 | 592.98 | 695.35 | 695.63 | 695.37 | 595.45 |
| Percentage (%) | 0.3774 | 22.53 | 23.25 | 35.89 | 5.549 | 33.05 |
References
- Heller, B.P.; Smith, D.E.; Jack, D.A. Planar deposition flow modeling of fiber filled composites in large area additive manufacturing. Addit. Manuf. J. 2019, 25, 227–238. [Google Scholar] [CrossRef]
- Coogan, T.J.; Kazmer, D.O. Modeling of interlayer contact and contact pressure during fused filament fabrication. J. Rheol. 2019, 63, 655–672. [Google Scholar] [CrossRef]
- Cuan-Urquizo, E.; Barocio, E.; Tejada-Ortigoza, V.; Byron Pipes, R.; Rodriguez, C.A.; Roman-Flores, A. Characterization of the Mechanical Properties of FFF Structures and Materials: A Review on the Experimental, Computational and Theoretical Approaches. Materials 2019, 12, 895. [Google Scholar] [CrossRef] [Green Version]
- Kunc, V.; Compton, B.; Simunovic, S.; Duty, C.; Love, L.; Post, B.; Blue, C.; Talagani, F.; Dutton, R.; Godines, C.; et al. Modeling of Large Scale Reinforced Polymer Additive Manufacturing. ANTEC 2015, 1–9. [Google Scholar]
- Fitzharris, E.R.; Watanabe, N.; Rosen, D.W.; Shofner, M.L. Effects ofmaterial properties on warpage in fused deposition modeling parts. Int. J. Adv. Manuf. Technol. 2018, 95, 2059–2070. [Google Scholar] [CrossRef]
- Serdeczny, M.P.; Comminal, R.; Pedersen, D.B.; Spangenberg, J. Numerical simulations of the mesostructure formation in material extrusion additive manufacturing. Addit. Manuf. J. 2019, 28, 419–429. [Google Scholar] [CrossRef]
- Bowles, D.E.; Tompkins, S.S. Prediction of Coefficients of Thermal Expansion for Unidirectional Composites. J. Compos. Mater. 1989, 23, 370–388. [Google Scholar] [CrossRef]
- Velez-Garcia, G.; Wright, A.; Kunc, V.; Duty, C. Coefficient of thermal expansion test report. ORNL Tech. Rep. 2014. ORNL/TM-2014/334. [Google Scholar]
- Love, L.; Kunc, V.; Rios, O.; Duty, C.; Elliot, A.; Post, B.; Smith, R.; Blue, C. The importance of carbon fiber to polymer additive manufacturing. J. Mater. Res. 2014, 29, 1893–1898. [Google Scholar] [CrossRef] [Green Version]
- Duty, C.E.; Kunc, V.; Compton, B.; Erdman, D.; Smith, R.; Lind, R.; Lloyd, P.; Love, L. Structure and mechanical behavior of big area additive manufacturing (BAAM) materials. Rapid Prototyp. 2017, 23, 181–189. [Google Scholar] [CrossRef]
- Masum Billah, K.; Lorenzana, F.A.R.; Martinez, N.L.; Wicker, R.B.; Espalin, D. Thermomechanical characterization of short carbon fiber and short glass fiber-reinforced ABS used in large format additive manufacturing. Addit. Manuf. 2020, 35. [Google Scholar] [CrossRef]
- Record, G.W. Largest Prototype Polymer 3D Printer. Available online: https://www.guinnessworldrecords.com/world-records/432577-largest-prototype-polymer-3d-printer (accessed on 24 January 2022).
- COEX. About ABS Filament. Available online: https://coexllc.com/about-abs-filament/ (accessed on 22 January 2022).
- Makerbot. Everything You Need to Know about Petg 3D Printing. Available online: https://www.makerbot.com/stories/engineering/everything-you-need-to-know-about-petg-3d-printing/ (accessed on 19 January 2022).
- Zhao, L.G.; Warrior, N.A.; Long, A.C. A thermo-viscoelastic analysis of process-induced residual stress in fibre-reinforced polymer–matrix composites. Mater. Sci. Eng. A 2007, 452–453, 483–498. [Google Scholar] [CrossRef]
- Yang, L.; Yan, Y.; Ma, J.; Liu, B. Effects of inter-fiber spacing and thermal residual stress on transverse failure of fiber-reinforced polymer–matrix composites. Comput. Mater. Sci. 2013, 68, 255–262. [Google Scholar] [CrossRef]
- OAK RIDGE National Laboratory. User Facilities: Manufacturing Demonstration Facility. Available online: https://www.ornl.gov/facility/mdf (accessed on 23 January 2022).
- University of South Carolina, McNAIR Center. Design and Manufacturing. Available online: https://sc.edu/about/centers_institutes/mcnair/research_leadership/composites/design_and_manufacturing/index.php (accessed on 24 January 2022).
- The University of Maine. Large-Scale Bio-Based Additive Manufacturing. Available online: https://composites.umaine.edu/large-scale-bio-based-additive-manufacturing/ (accessed on 18 January 2022).
- Sichina, W.J. Characterization of Polymers Using TGA. Available online: https://thermalsupport.com/wp-content/uploads/2018/05/PETech-78.pdf (accessed on 2 February 2022).
- Interpreting Unexpected Events and Transitions in DSC Results. Available online: http://www.tainstruments.com/pdf/literature/TA039.pdf (accessed on 24 January 2022).
- LINSEIS. Measuring Specific Heat Capacity using Laser Flash Analysis. Available online: https://www.linseis.com/en/wiki-en/measuring-specific-heat-capacity-cp-using-laser-flash-analysis-lfa/ (accessed on 15 January 2022).
- Fredi, G.; Dorigato, A.; Fambri, L.; Pegoretti, A. Multifunctional epoxy/carbon fiber laminates for thermal energy storage and release. Compos. Sci. Technol. 2018, 158, 101–111. [Google Scholar] [CrossRef]
- Bedsole, R.; Hill, C.; Rowe, K.; Duty, C.; Ajinjeru, C.; Kunc, B.; Riha, D. Big Area Additive Manufacturing (BAAM) Materials Development and Reinforcement with Advanced Composites. IACMI Compos. Inst. 2018. Available online: https://www.osti.gov/servlets/purl/1434289 (accessed on 21 January 2022).
- Wang, Z.; Smith, D.E. Numerical analysis of screw swirling effects on fiber orientation in large area additive manufacturing polymer composite deposition. Compos. Part B 2019, 177, 107284. [Google Scholar] [CrossRef]
- Hernandez, W.P.; Castello, D.A.; Roitman, N.; Magluta, C. Thermorheologically simple materials: A bayesian frameworkfor model calibration and validation. J. Sound Vib. 2017, 402, 14–30. [Google Scholar] [CrossRef]
- TA Instruments. Thermal Analysis Application Brief: Application of Time-Temperature Superposition Principles to DMA. Available online: http://www.tainstruments.com/pdf/literature/TA144.pdf (accessed on 24 January 2022).
- TRANSCAT. How to Determine the ‘Emissivity’ of an Object. Available online: https://www.transcat.com/calibration-resources/application-notes/measuring-emissivity (accessed on 18 January 2022).
- Compton, B.G.; Post, B.K.; Duty, C.E.; Love, L.; Kunc, V. Thermal analysis of additive manufacturing of large-scale thermoplastic polymer composites. Addit. Manuf. 2017, 17, 77–86. [Google Scholar] [CrossRef]
- ASTM Standard E1131-20 1986 (2014); Standard Test Method for Compositional Analysis by Thermogravimetry. ASTM International: West Conshehoken, PA, USA, 2020.
- ASTM Standard D3418-21 1975 (2021); Standard Test Method for Transition Temperatures and Enthalpies of Fusion and Crystallization of Polymers by Differential Scanning Calorimetry. ASTM International: West Conshehoken, PA, USA, 2021.
- ASTM Standard E831-19 1981 (2019); Standard Test Method for Linear Thermal Expansion of Solid Materials by Thermomechanical Analysis. ASTM International: West Conshehoken, PA, USA, 2019.
- Ansys. Generalized Hooke’s Law. Available online: https://courses.ansys.com/wp-content/uploads/2020/10/2.2.3-Generalized-Hookes-Law_New_Tem.pdf (accessed on 16 January 2022).
- Volumetric Strain. Available online: https://pkel015.connect.amazon.auckland.ac.nz/SolidMechanicsBooks/Part_I/BookSM_Part_I/04_Strain/04_Strain_03_Volumetric_Strain.pdf (accessed on 20 January 2022).
- Fong, K.Y.; Mariatti, M.; Takagi, H. Effect of Matrix and Staking Sequence of Recycled Jute/Carbon Fiber Hybrid Laminated Composites. J. Polym. Mater. 2012, 29, 437–449. [Google Scholar]
- Billah, K.M.M.; Lorenzana, F.A.R.; Martinez, N.L.; Chacon, S.; Wicker, R.B. Thermal Analysis of Thermoplastic Materials Filled with Chopped Fiber for Large Area 3D Printing. In Proceedings of the 2019 International Solid Freeform Fabrication Symposium, Austin, TX, USA, 12–14 August 2019; pp. 892–898. [Google Scholar]
- Uyar, T.; Tonelli, A.E.; Hacaloğlu, J. Thermal degradation of polycarbonate, poly (vinyl acetate) and their blends. Polym. Degrad. Stab. 2006, 91, 2960–2967. [Google Scholar] [CrossRef]
- Hacioglu, F.; Tayfun, U.; Ozdemir, T.; Tincer, T. Characterization of carbon fiber and glass fiber reinforced polycarbonate composites and their behavior under gamma irradiation. Prog. Nucl. Energy 2021, 134, 103665. [Google Scholar] [CrossRef]
- Techawinyutham, L.; Tengsuthiwat, J.; Srisuk, R.; Techawinyutham, W.; Rangappa, S.M.; Siengchin, S. Recycled LDPE/PETG blends and HDPE/PETG blends: Mechanical, thermal, and rheological properties. J. Mater. Res. Technol. 2021, 15, 2445–2458. [Google Scholar] [CrossRef]
- Lorenzana, F.A.R. Thermal Characterization of ABS/Carbon Fiber, ABS/Glass Fiber and PETG/Glass Fiber Reinforced Composites Used in Large Area Additive Manufacturing. Ph.D. Thesis, The University of Texas at El Paso, El Paso, TX, USA, 2019. [Google Scholar]
- Romanova, N.; Shafigullini, L.; Gabdrakhmanov, A.; Buyatova, S. Thermal properties of products based on ABS/PC. MATEC Web Conf. 2019, 298, 00016. [Google Scholar] [CrossRef]
- Tsukuda, R.; Sumimoto, S.; Ozowa, T. Thermal Conductivity and Heat Capacity of ABS Resin Composites. J. Appl. Polym. Sci. 1997, 63, 1279–1286. [Google Scholar] [CrossRef]
- Shi, Q.; Xiao, R.; Yang, H.; Lei, D. Effects of physical aging on thermomechanical behaviors of poly(ethylene terephthalate)-glycol (PETG). Polym.-Plast. Technol. Mater. 2020, 8, 835–846. [Google Scholar] [CrossRef]
- Latko-Duralex, P.; Dydex, K.; Boczkowska, A. Thermal, Rheological and Mechanical Properties of PETG/rPETG Blends. J. Polym. Environ. 2019, 27, 2600–2606. [Google Scholar] [CrossRef] [Green Version]
- Phua, Y.J.; Ishak, Z.A.M.; Senawi, R. Injection Molded Short Glass and Carbon Fiber Reinforced Polycarbonate Hybrid Composites: Effects of Fiber Loading. J. Reinf. Plast. Compos. 2010, 29, 2592–2603. [Google Scholar] [CrossRef]
- Gramann, P.; Cruz, J.; Ralston, B. Using Differential Scanning Calorimetry to Determine the Quality of a PVC Part; The Madison Group: Redditch, UK, 2010. [Google Scholar]
- Reed, T.F.; Blair, H.E.; Vadimsky, R.G. The Causes of Pitting and Haze on Molded ABS Plastic Surfaces. In Recent Advantages in Polymer Blends, Grafts, and Blocks; Springer Science+Business Media: Berlin, Germany, 1974; pp. 359–373. [Google Scholar]
- Tagvidi, M.; Falk, R.H.; Hermanson, J.C. Effect of Natural Fibers on Thermal and Mechanical Properties of Natural Fiber Polypropelene Composites Studied by Dynamic Mechanical Analysis. J. Appl. Polym. Sci. 2006, 101, 4341–4349. [Google Scholar] [CrossRef] [Green Version]
- Castillo, F.Y.; Socher, R.; Krause, B.; Headrick, R.; Grady, B.P.; Prada-Silvy, R.; Potschke, P. Electrical, mechanical, and glass transition behavior of polycarbonate-based nanaocomposites with different multi-walled carbon nanotubes. Polymer 2011, 52, 3835–3845. [Google Scholar] [CrossRef]
- Uddin, K.; Islam, A.M.; Mitra, S.; Lee, J.; Thu, K.; Saha, B.B.; Koyama, S. Specific heat capacities of carbon-based absorbents for absorption heat pump application. Appl. Therm. Eng. 2018, 129, 117–126. [Google Scholar] [CrossRef]
- Rocky, K.A.; Islam, A.M.; Pal, A.; Ghosh, S.; Thu, K.; Nasruddin, N.; Saha, B.B. Experimental investigation of specific heat capacity of parent materials and composite absorbents for absorption heat pumps. Appl. Therm. Eng. 2020, 164, 1–12. [Google Scholar] [CrossRef]
- Baur, E.; Osswald, T.A.; Rudolph, N. Plastics Handbook The Resource for Plastics Engineers, 5th ed.; Carl Hanser Verlag: Munich, Germany, 2019; pp. 98–100. [Google Scholar]
- Manufacturing, D. Custom Metal & Plastic Solutions. Available online: https://dielectricmfg.com/knowledge-base/abs/ (accessed on 24 January 2022).
- Manufacturing, D. Custom Metal & Plastic Solutions. Available online: https://dielectricmfg.com/knowledge-base/lexan/ (accessed on 14 January 2022).
- Manufacturing, D. Custom Metal & Plastic Solutions. Available online: https://dielectricmfg.com/knowledge-base/petg/ (accessed on 19 January 2022).
- Hyer, M.W. Stress Analysis of Fiber-Reinforced Composite Materials; DEStech Publications, Inc.: Lancaster, PA, USA, 2009. [Google Scholar]
- Plastics, P. Thermal Properties of Plastic Materials. Available online: https://www.professionalplastics.com/professionalplastics/ThermalPropertiesofPlasticMaterials.pdf (accessed on 20 January 2022).
- White, R.P.; Lipson, J.E.G. Polymer Free Volume and Its Connection to the Glass Transition. Macromolecules 2016, 49, 3987–4007. [Google Scholar] [CrossRef]
- Colon Quintana, J.L.; Osswald, T. Understanding Softening of Amorphous Materials for FFF Applications. Int. Polym. Process. 2022. Accepted. [Google Scholar] [CrossRef]
- Brenken, B. Extrusion Deposition Additive Manufacturing of Fiber Reinforced SEMI-Crystalline Polymers. Ph.D. Thesis, Purdue University, West Lafayette, IN, USA, 2017. [Google Scholar]
- Zhiguo, R.; Ying, Y.; Jianfeng, L.; Zhongxing, Q.; Lei, Y. Determination of thermal expansion coefficients for unidirectional fiber-reinforced composites. J. Aeronaut. 2014, 27, 1180–1187. [Google Scholar] [CrossRef] [Green Version]
- Heinle, M.; Drummer, D. Temperature-Dependent Coefficient of Thermal Expansion (CTE) of Injection Molded, Short-Glass-Fiber-Reinforced Polymers. Polym. Eng. Sci. 2015, 55, 2661–2668. [Google Scholar] [CrossRef]
- Moreno Sanchez, D.; Mata, M.D.L.; Delgado, F.J.; Casal, V.; Molina, S.I. Development of carbon fiber acrylonitrile styrene acrylate composite for large format additive manufacturing. Mater. Des. 2020, 191, 108577. [Google Scholar] [CrossRef]
- Andrzejewski, J.; Mohanty, A.K.; Misra, M. Development of hybrid composites reinforced with biocarbon/carbon fiber system. The comparative study for PC, ABS and PC/ABS based materials. Compos. Part B 2020, 200, 108317. [Google Scholar] [CrossRef]
- Wedgewood, A.; Pibulchinda, P.; Barocio Vaca, E.; Hill, C.; Bogdanor, M.J. Materials Development and Advanced Process Simulation for Additive Manufacturing with Fiber-Reinforced Thermoplastics (Final Technical Report). IACMI Compos. Inst. 2020. [Google Scholar] [CrossRef]
- Cugini, A.V. Aspects of Physical Aging and Solid-State Processing of Polymeric Glasses. Ph.D. Thesis, University of Massachusetts Amherst, Amherst, MA, USA, 2015. [Google Scholar]
- Monnier, X.; Marina, S.; Lopez de Pariza, X.; Sardon, H.; Martin, J.; Cangialosi, D. Physical Aging Behavior of a Glassy Polyether. Polymers 2021, 13, 954. [Google Scholar] [CrossRef]
- Struik, L.C.E. Physical Aging in Amorphous Polymers and Other Materials; Wiley Online Library: Hoboken, NJ, USA, 1977; pp. 5–58. [Google Scholar] [CrossRef]
- Tanikella, N.G.; Witbrodt, B.; Pearce, J.M. Tensile strength of commercial polymer materials for fused filament fabrication 3D printing. Addit. Manuf. 2017, 15, 40–47. [Google Scholar] [CrossRef] [Green Version]
- Blok, L.G.; Longana, M.L.; Woods, B.K.S. Fabrication and Characterisation of Aligned Discontinuous Carbon Fibre Reinforced Thermoplastics as Feedstock Material for Fused Filament Fabrication. Materials 2020, 13, 4671. [Google Scholar] [CrossRef] [PubMed]
- Omnexus. Coefficient of Linear Thermal Expansion. Available online: https://omnexus.specialchem.com/polymer-properties/properties/coefficient-of-linear-thermal-expansion (accessed on 13 January 2022).
- SD3D. PETG Technical Data Sheet. Available online: https://www.sd3d.com/wp-content/uploads/2017/06/MaterialTDS-PETG_01.pdf (accessed on 24 January 2022).
- Kovacova, M.; Kozakovicova, J.; Prochazka, M.; Janigova, I.; Vysopal, M.; Cernickova, I.; Krajcovic, J.; Spitalsky, Z. Novel Hybrid PETG Composites for 3D Printing. Appl. Sci. 2020, 10, 3062. [Google Scholar] [CrossRef]
- TA Instruments. Modulated Thermomechanical Analysis—Measuring Expansion and Contraction Simultaneously. Available online: http://www.tainstruments.com/pdf/literature/TA311a.pdf (accessed on 18 January 2022).
- Materials, A. E-Glass Fibre. Available online: https://www.azom.com/properties.aspx?ArticleID=764 (accessed on 22 January 2022).
- Pradere, C.; Sauder, C. Transverse and longitudinal coefficient of thermal expansion of carbon fibers at high temperatures (300–2500 K). Carbon 2008, 46, 1874–1884. [Google Scholar] [CrossRef]


| Type of Material | Supplier | Family | Code | Fiber Content wt. % | Common Name |
|---|---|---|---|---|---|
| Neat | JABIL | - | ABS 1400 | - | ABS |
| SABIC | SABIC® | PC Resin PC0703R | - | PC | |
| TECHMER | HIFILL® | PETG 17043DP | - | PETG | |
| Fiber Filled | TECHMER | ELECTRAFIL® | ABS 1501 3DP | 20 | CF/ABS |
| TECHMER | ELECTRAFIL® | PC 1705 3DP | 25 | CF/PC | |
| TECHMER | HIFILL® | PETG 1701 3DP | 30 | GF/PETG |
| Material | Heating Zones (C) | Feed Rate (mm/min) | Screw Speed (RPM) | Layer Time (s) | |||
|---|---|---|---|---|---|---|---|
| 1 | 2 | 3 | 4 | ||||
| CF/ABS | 200 | 220 | 240 | 250 | 4870 | 99 | 80 |
| CF/PC | 270 | 305 | 305 | 315 | 4875 | 68 | 80 |
| GF/PETG | 220 | 240 | 270 | 275 | 1300 | 25 | 260 |
| Material | Percent Mass at | Percent Mass at | (C) | (C) |
|---|---|---|---|---|
| ABS | 2.82% | 0.79% | 384.26 ± 1.43 | 407.79 ± 1.34 |
| CF/ABS | 23.27% | 22.46% | 384.15 ± 1.69 | 410.77 ± 1.84 |
| PC | 29.02% | 25.64% | 480.29 ± 9.09 | 499.29 ± 5.53 |
| CF/PC | 40.49% | 36.25% | 450.91 ± 3.86 | 481.97 ± 1.07 |
| PETG | 8.57% | 5.85% | 387.61 ± 1.68 | 413.67 ± 3.54 |
| GF/PETG | 37.46% | 35.57% | 375.10 ± 3.19 | 396.24 ± 6.39 |
| Material | (°C) | @ (J/g-C) | @ 35 °C (J/g-C) | @ Maximum Temperature (Table 5) (J/g-C) |
|---|---|---|---|---|
| ABS | 104.32 ± 1.90 | 0.32 ± 0.03 | 0.85 ± 0.20 | 1.71 ± 0.22 |
| CF/ABS | 106.57 ± 0.23 | 0.25 ± 0.02 | 1.17 ± 0.03 | 1.97 ± 0.02 |
| PC | 149.00 ± 0.19 | 0.22 ± 0.01 | 1.12 ± 0.10 | 1.97 ± 0.12 |
| CF/PC | 145.35 ± 0.28 | 0.17 ± 0.01 | 1.18 ± 0.27 | 2.02 ± 0.36 |
| PETG | 77.51 ± 0.14 | 0.26 ± 0.01 | 1.07 ± 0.03 | 1.77 ± 0.05 |
| GF/PETG | 75.99 ± 0.42 | 0.20 ± 0.01 | 0.75 ± 0.01 | 1.28 ± 0.09 |
| Material | ABS | PC | PETG | CF/ABS | CF/PC | GF/PETG |
|---|---|---|---|---|---|---|
| Temperature (C) | 250 | 250 | 200 | 250 | 250 | 200 |
| Location | Direction | CTE (m/m-C × 10) | |||
|---|---|---|---|---|---|
| 30 C | 90 C | 115 C | 145 C | ||
| COB * | 1 | 25.0 | 13.8 | −36.5 | −24.2 |
| 2 | 39.2 | 42.9 | 56.3 | −56.1 | |
| 3 | 79.9 | 255 | 288 | 903 | |
| IBB * | 1 | 18.7 | −10.2 | −78.2 | −34.9 |
| 2 | 32.4 | 57.9 | 199 | 55.7 | |
| 3 | 84.4 | 254 | 328 | 897 | |
| Neat | - | 82.0 | 37.3 | 500 | −165 |
| Location | Direction | CTE (m/m-C × 10) | |||
|---|---|---|---|---|---|
| 30 C | 130 C | 150 C | 165 C | ||
| COB * | 1 | 7.81 | −48.5 | 129 | 540 |
| 2 | 40.2 | 22.9 | 492 | 4680 | |
| 3 | 71.6 | 183 | 2080 | 14,500 | |
| IBB * | 1 | 8.18 | −14.8 | 276 | 2860 |
| 2 | 29.0 | 41.2 | 775 | 7040 | |
| 3 | 66.2 | 210 | 2850 | 19,100 | |
| Neat | - | 62.2 | 85.8 | −246 | −121 |
| Location | Direction | CTE (m/m-C × 10) | |||
|---|---|---|---|---|---|
| 30 C | 70 C | 85 C | 100 C | ||
| COB * | 1 | 20.3 | 6.07 | 36.5 | −54.5 |
| 2 | 25.2 | 85.5 | 133 | −41.3 | |
| 3 | 73.6 | 188 | 378 | 350 | |
| IBB * | 1 | 19.8 | −5.68 | −28.4 | −49.6 |
| 2 | 27.1 | −36.4 | −148 | −83.0 | |
| 3 | 63.0 | 135 | 530 | - | |
| Neat | - | 65.1 | −74.7 | 620 | 60.7 |
| Fitting Parameters | CTE (m/m-C) × 10 | ||
|---|---|---|---|
| 1-dir | 2-dir | 3-dir | |
| 9.59 | 53.93 | 1.42 × 10 | |
| 48.29 | 51.73 | 165.23 | |
| 30.85 | 88.87 | 8.53 | |
| −109.92 | 5.02 × 10 | 1.73 × 10 | |
| 154.44 | 165.29 | 157.24 | |
| 2.65 | 7.03 | 15.94 | |
| −293.24 | 1.22 × 10 | 550.38 | |
| 139.63 | 143.88 | 139.14 | |
| 7.91 | 4.40 | 3.71 | |
| 609.28 | 290.40 | 110.24 | |
| 143.65 | 151.05 | 92.15 | |
| 6.10 | 7.13 | 89.42 | |
| 0.9693 | 0.9345 | 0.9996 | |
Publisher’s Note: MDPI stays neutral with regard to jurisdictional claims in published maps and institutional affiliations. |
© 2022 by the authors. Licensee MDPI, Basel, Switzerland. This article is an open access article distributed under the terms and conditions of the Creative Commons Attribution (CC BY) license (https://creativecommons.org/licenses/by/4.0/).
Share and Cite
Colón Quintana, J.L.; Slattery, L.; Pinkham, J.; Keaton, J.; Lopez-Anido, R.A.; Sharp, K. Effects of Fiber Orientation on the Coefficient of Thermal Expansion of Fiber-Filled Polymer Systems in Large Format Polymer Extrusion-Based Additive Manufacturing. Materials 2022, 15, 2764. https://doi.org/10.3390/ma15082764
Colón Quintana JL, Slattery L, Pinkham J, Keaton J, Lopez-Anido RA, Sharp K. Effects of Fiber Orientation on the Coefficient of Thermal Expansion of Fiber-Filled Polymer Systems in Large Format Polymer Extrusion-Based Additive Manufacturing. Materials. 2022; 15(8):2764. https://doi.org/10.3390/ma15082764
Chicago/Turabian StyleColón Quintana, José Luis, Lucinda Slattery, Jon Pinkham, Joanna Keaton, Roberto A. Lopez-Anido, and Keith Sharp. 2022. "Effects of Fiber Orientation on the Coefficient of Thermal Expansion of Fiber-Filled Polymer Systems in Large Format Polymer Extrusion-Based Additive Manufacturing" Materials 15, no. 8: 2764. https://doi.org/10.3390/ma15082764