
Characterization and Comparison of Corrosion Layer Microstructure between Cement Mortar and Alkali-Activated Fly Ash/Slag Mortar Exposed to Sulfuric Acid and Acetic Acid


Abstract
:1. Introduction
2. Experimental Procedure
2.1. Materials and Specimens
2.1.1. Raw Materials
2.1.2. Specimen Preparation
2.2. Experimental Design
2.3. Test Methods
2.3.1. Appearance and Neutralization Depth Observation
2.3.2. Mass and Strength Test
2.3.3. X-ray Diffraction (XRD) and Scanning Electron Microscope (SEM)-Energy Dispersive Spectrometer (EDS) Analysis
2.3.4. Alternating Current (AC) Impedance Test
3. Results and Discussion
3.1. Deterioration Behavior of Mortar Exposed to Acids
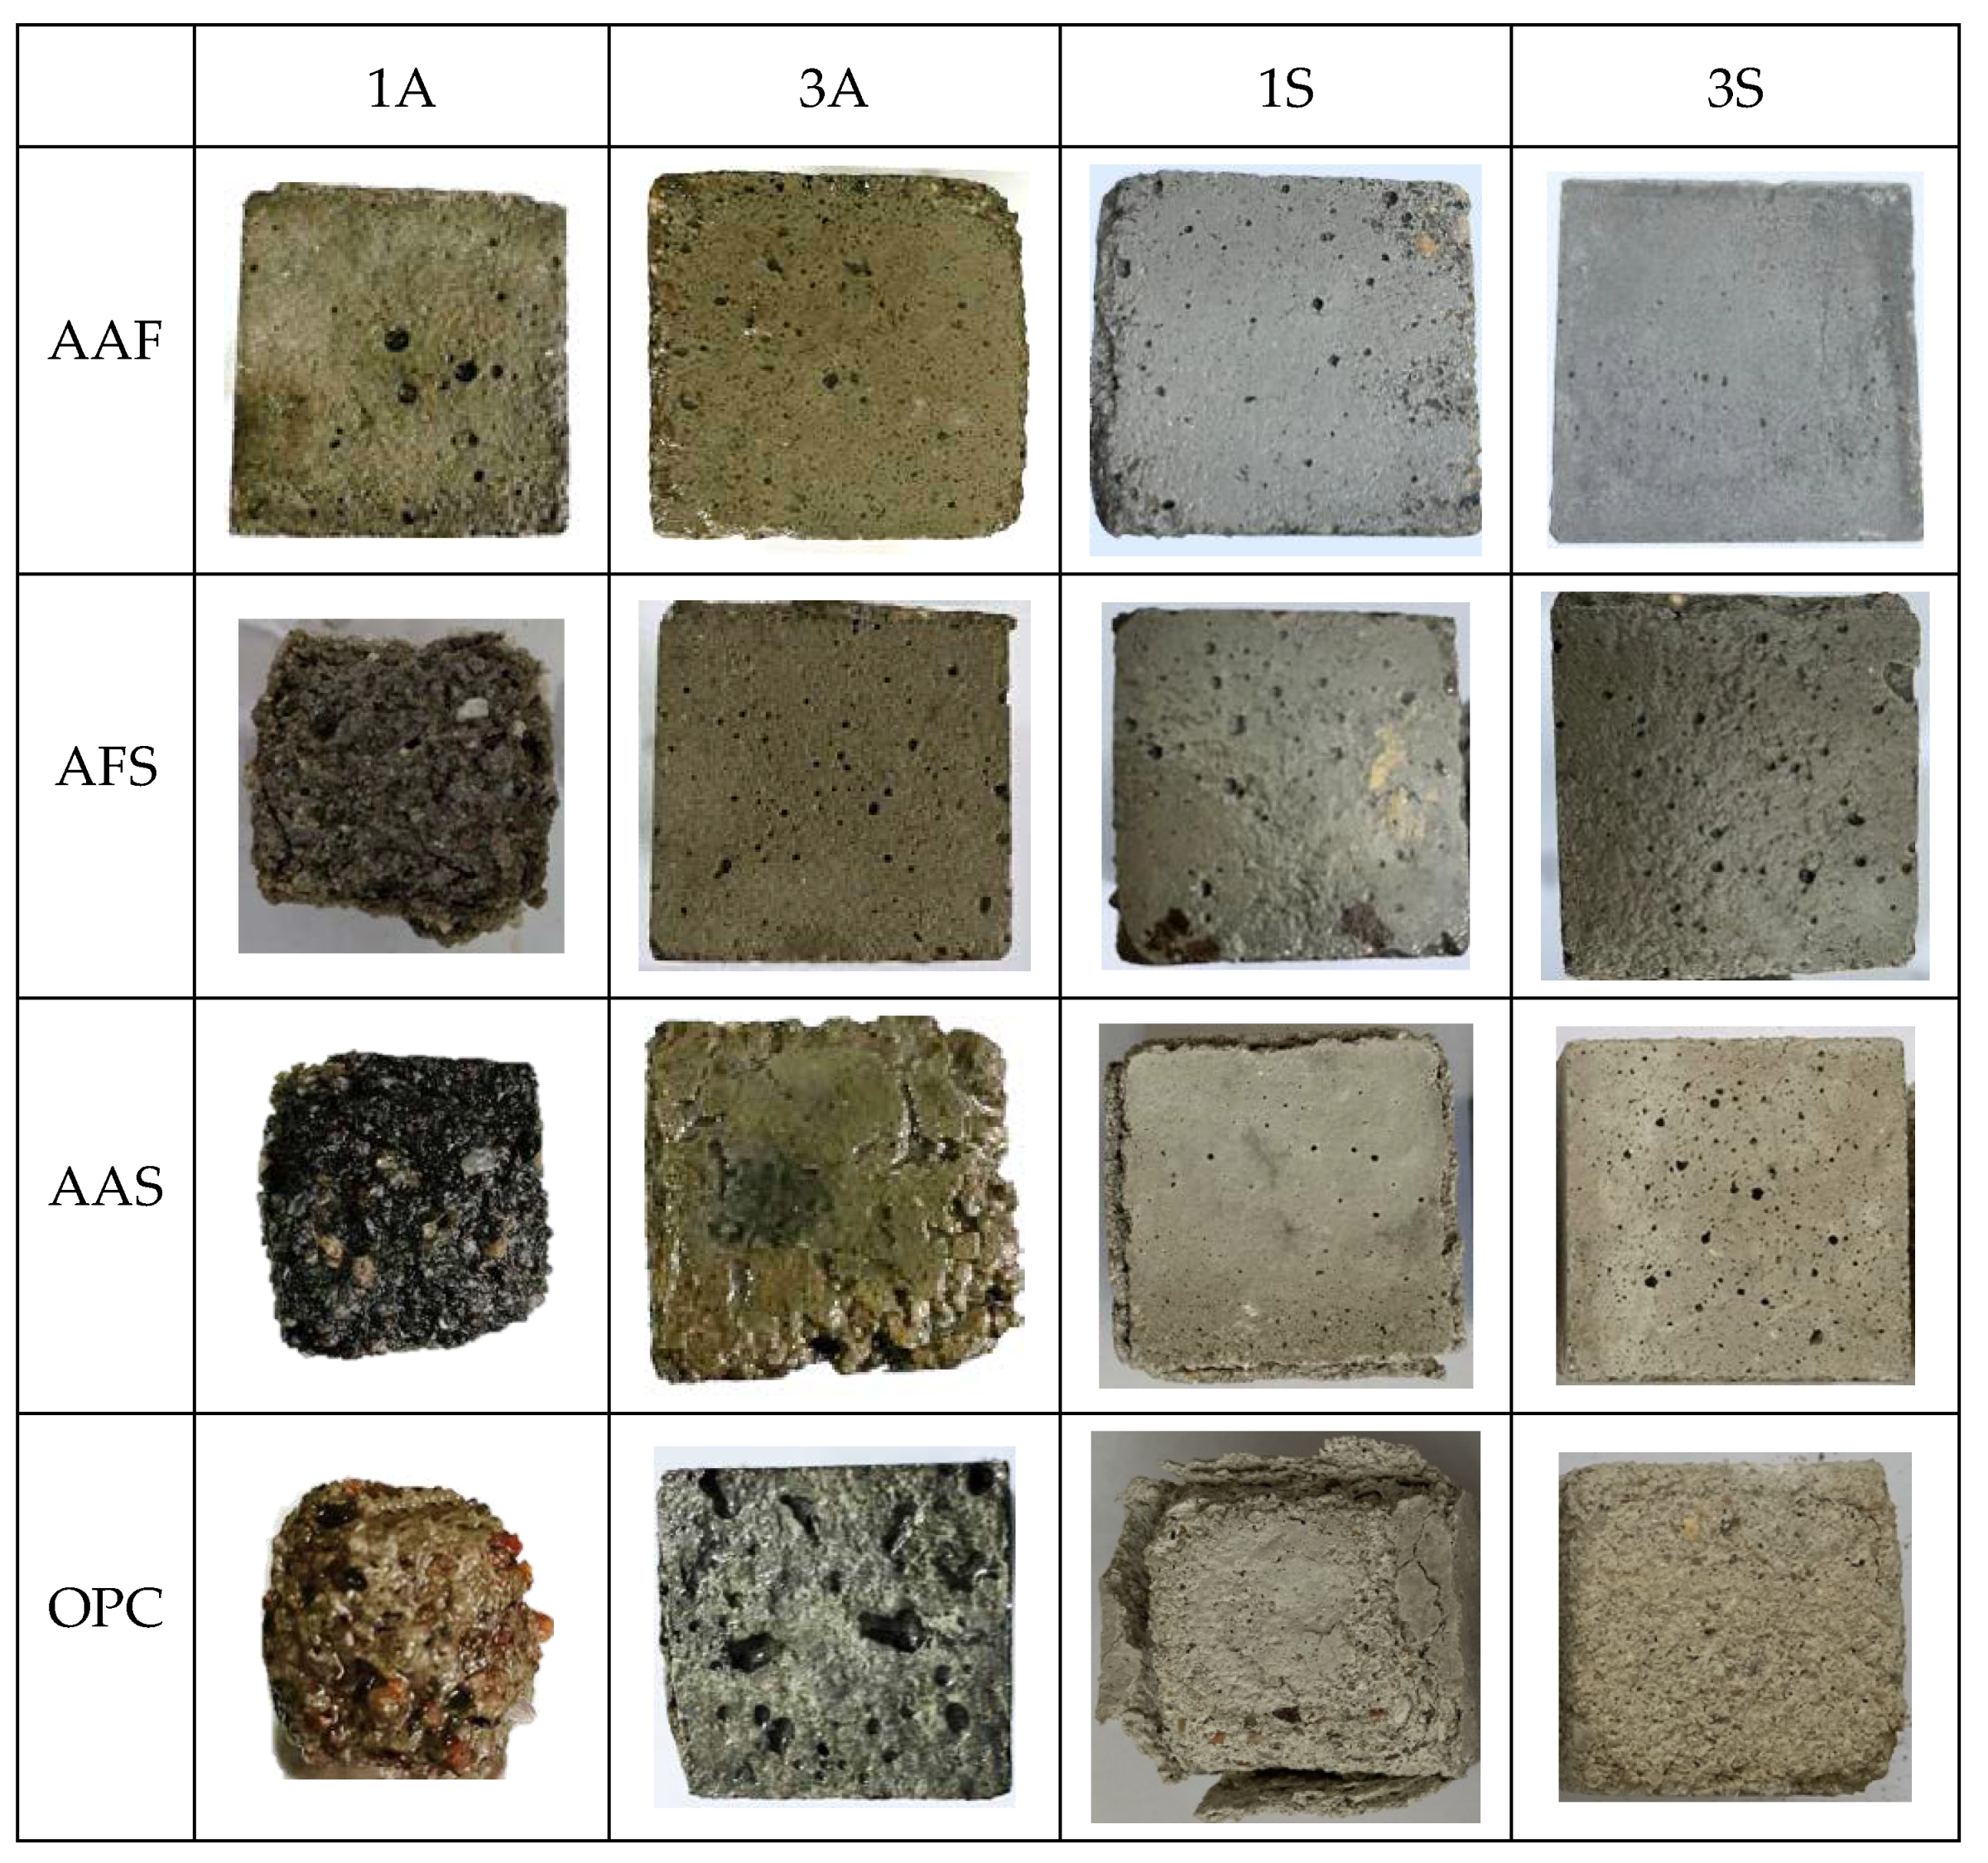
3.1.1. Corrosion Morphology
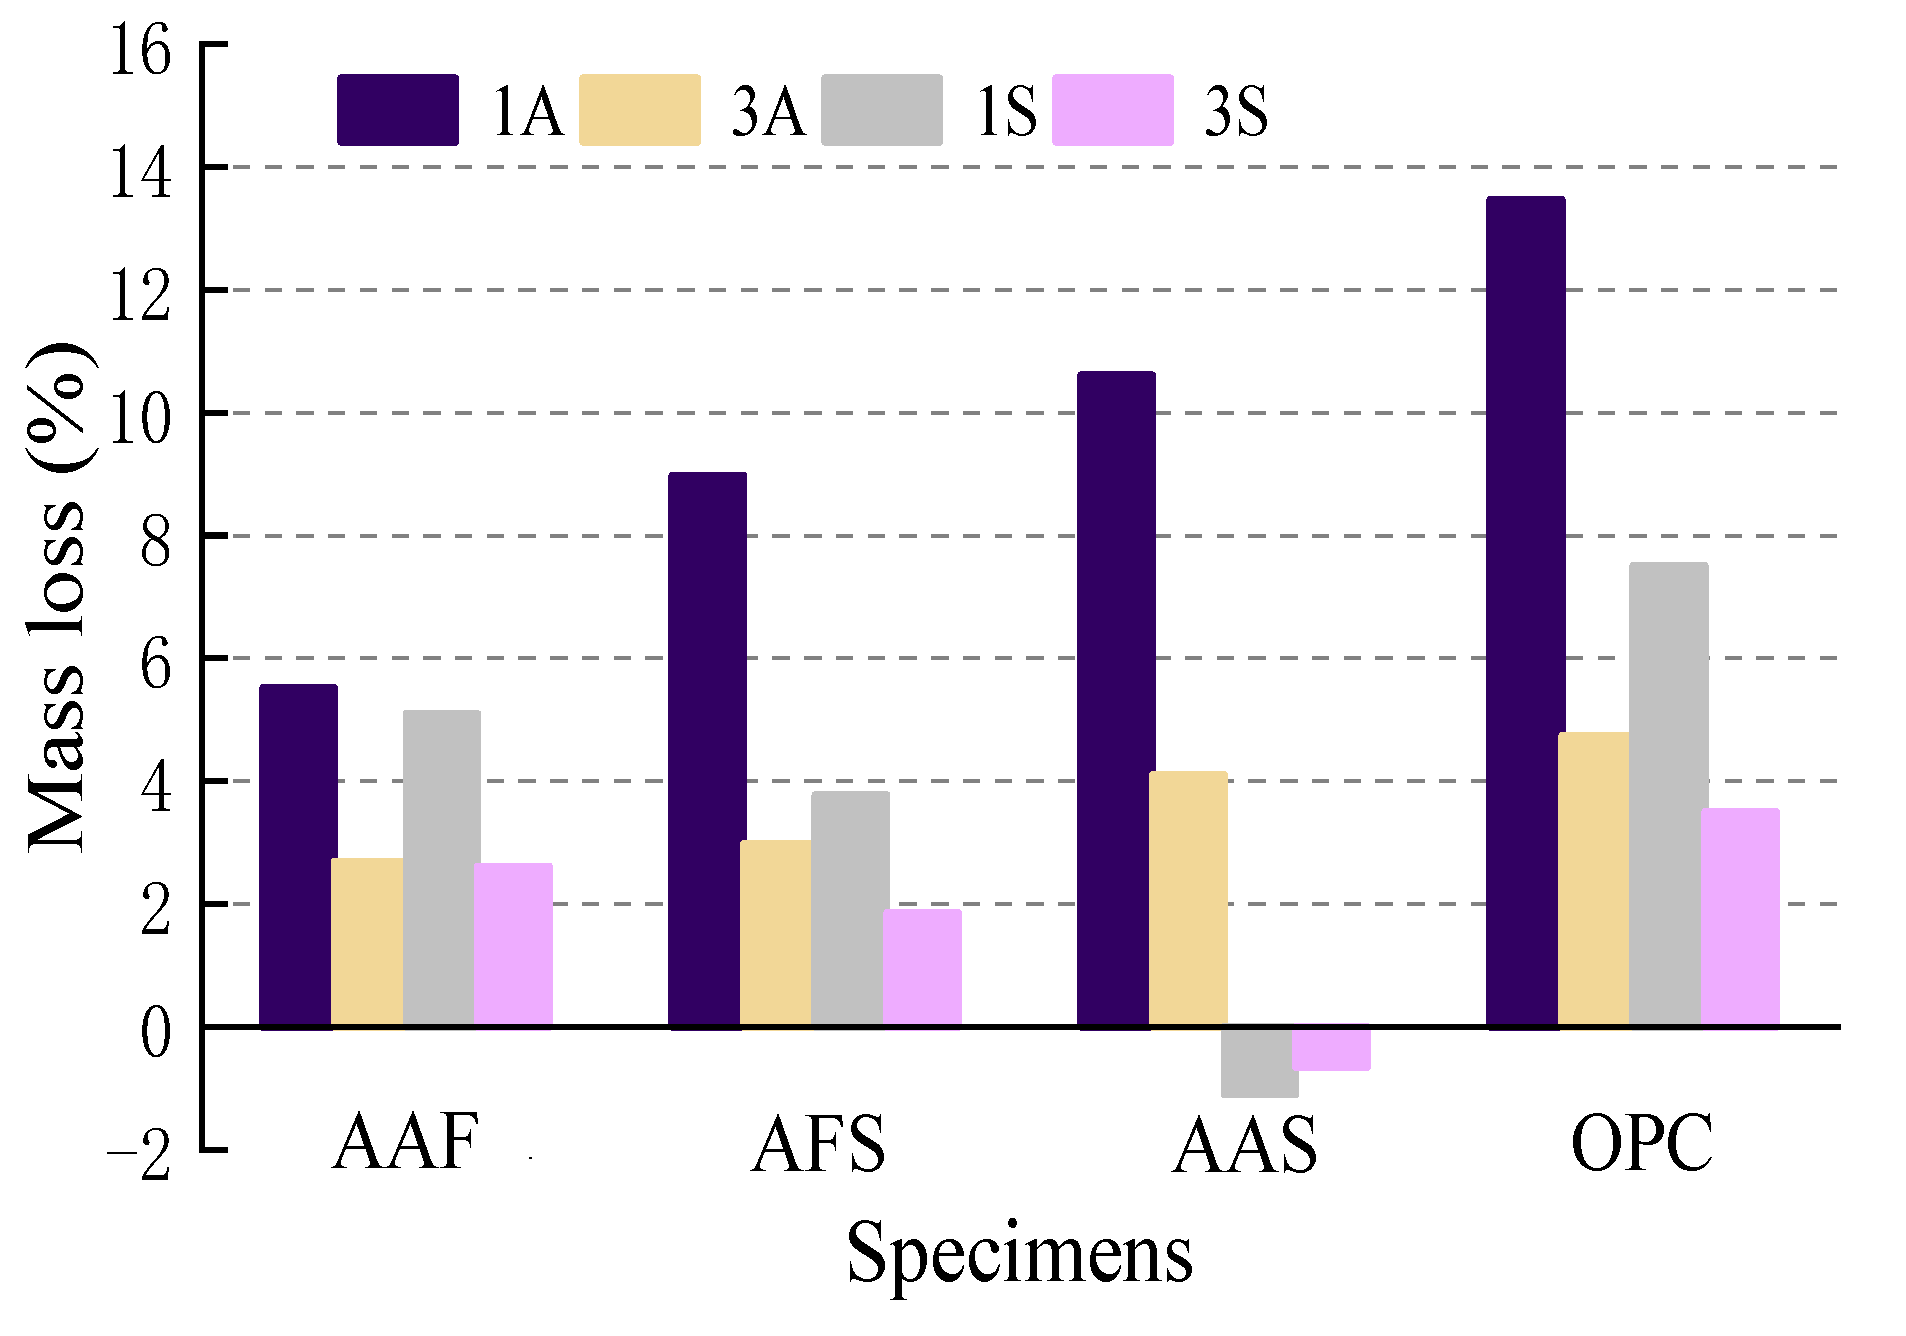
3.1.2. Mass Change
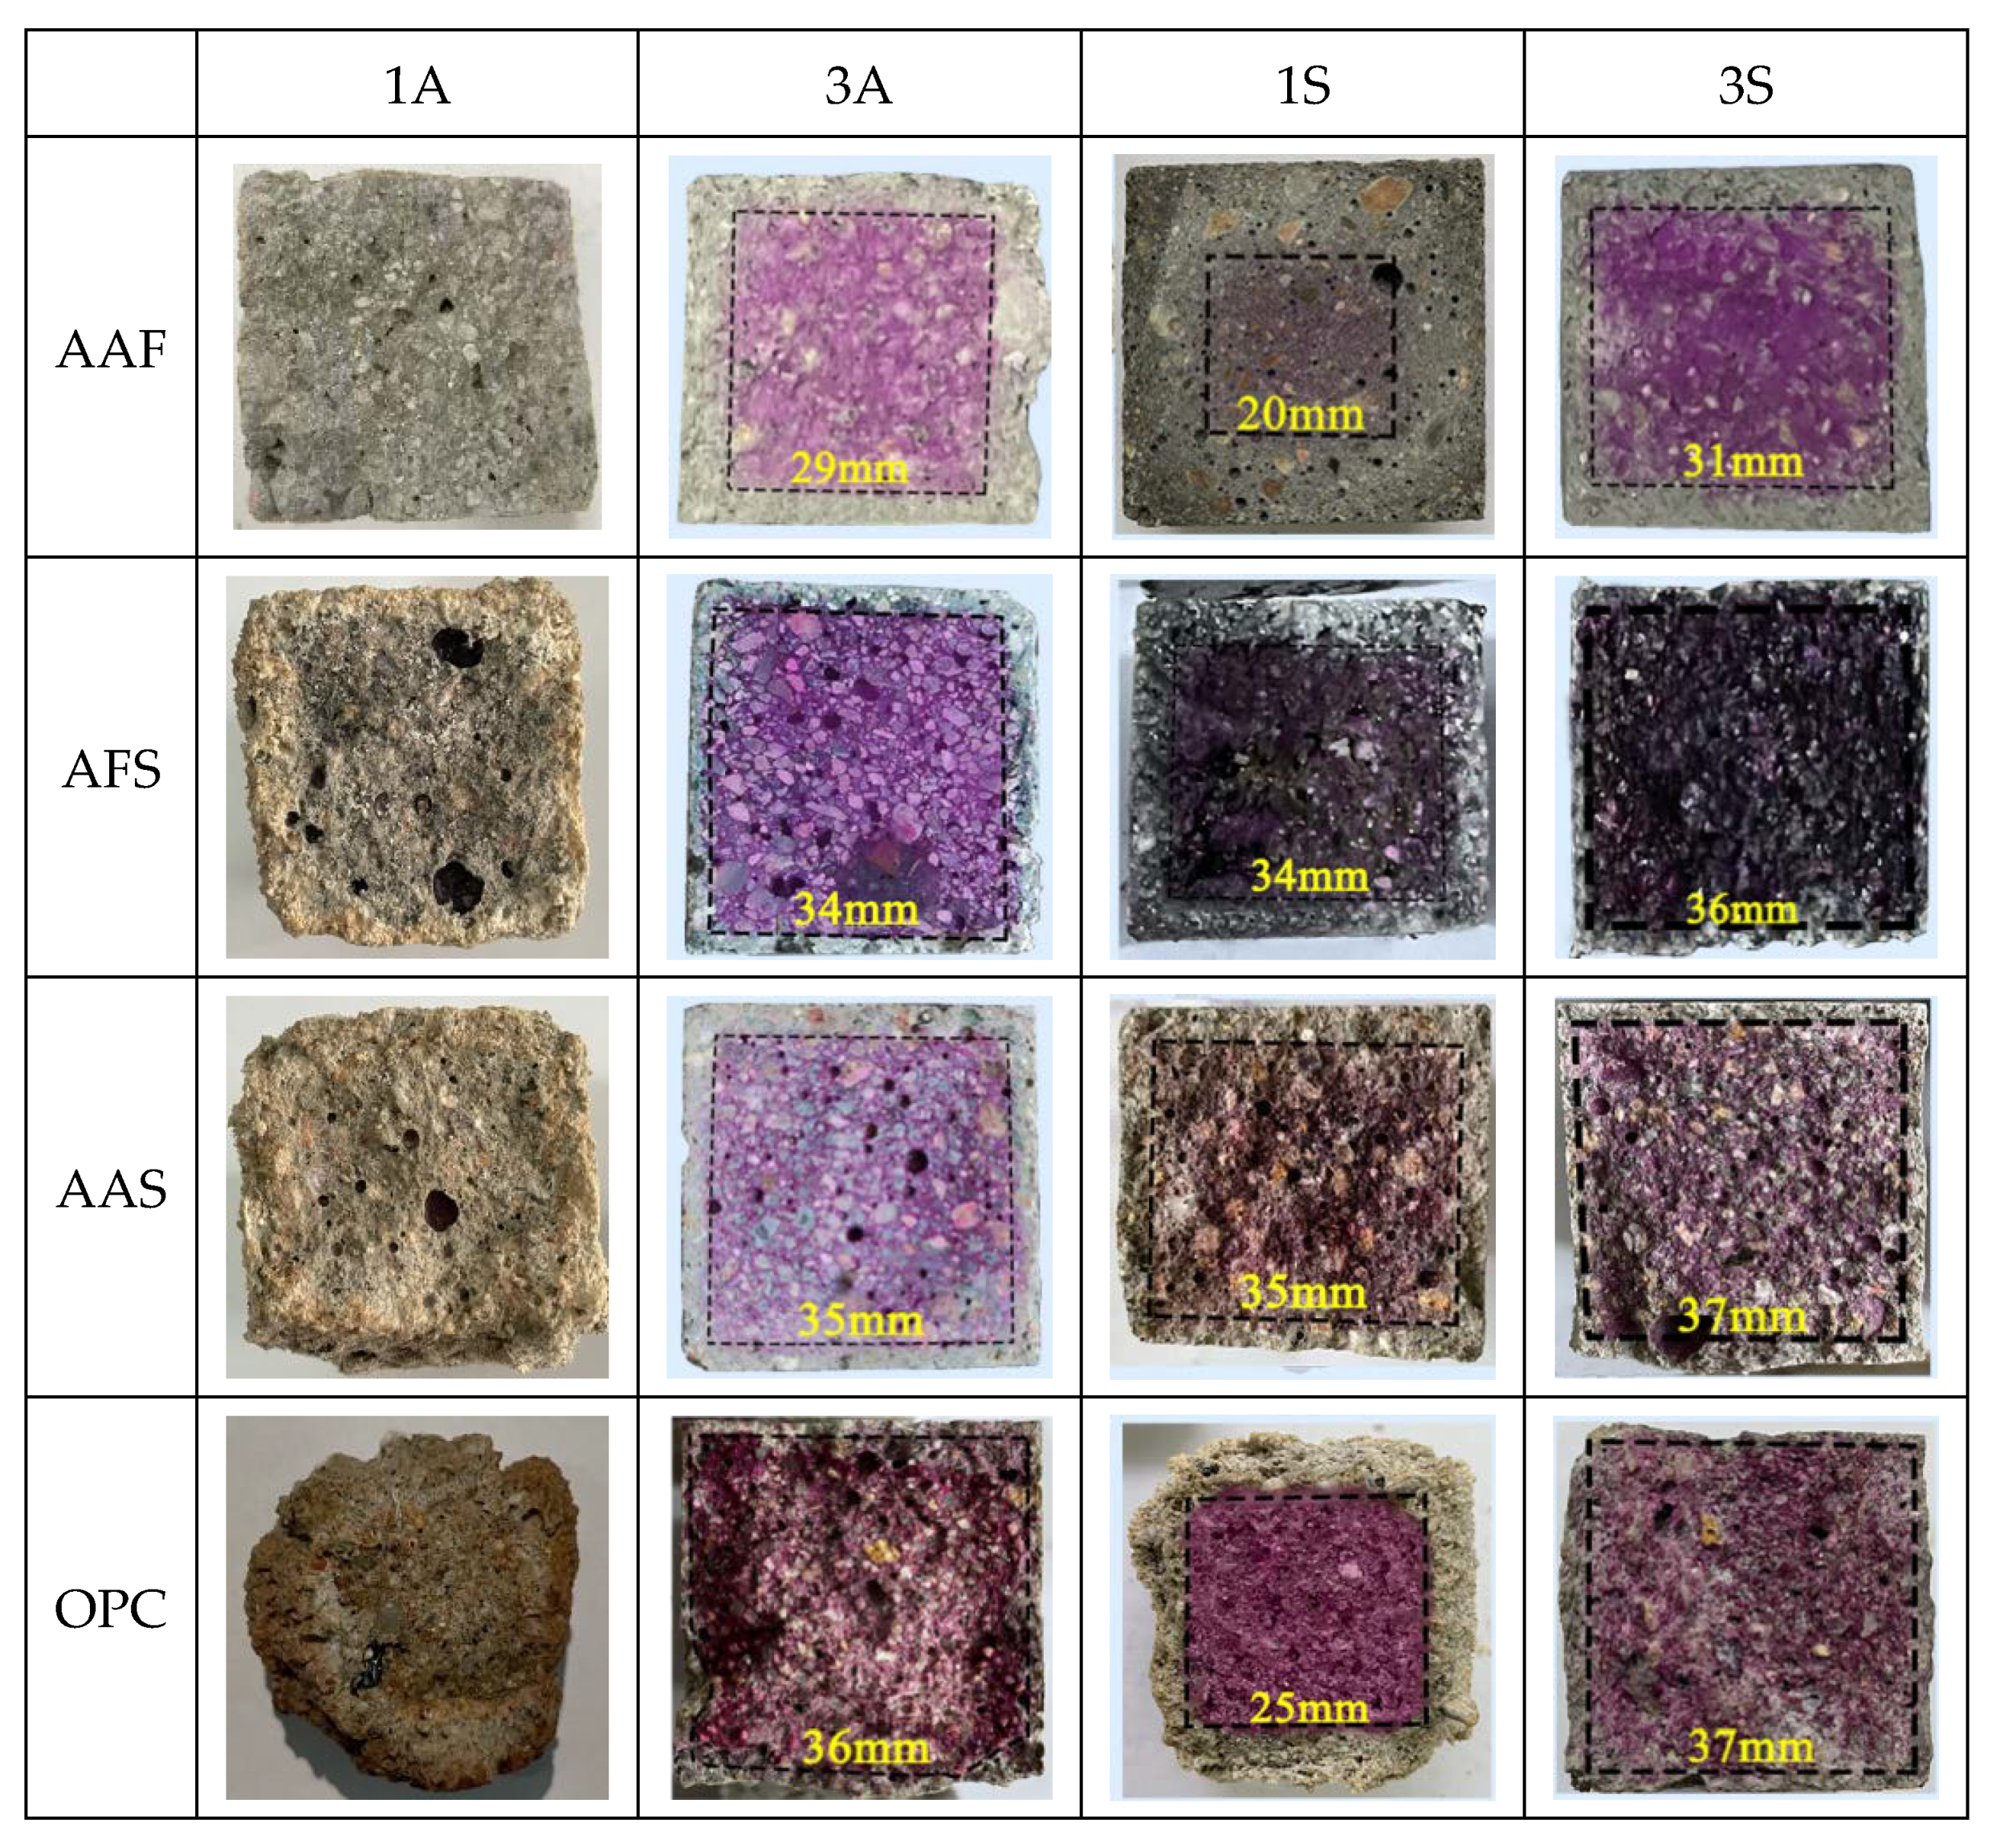
3.1.3. Neutralization Depth
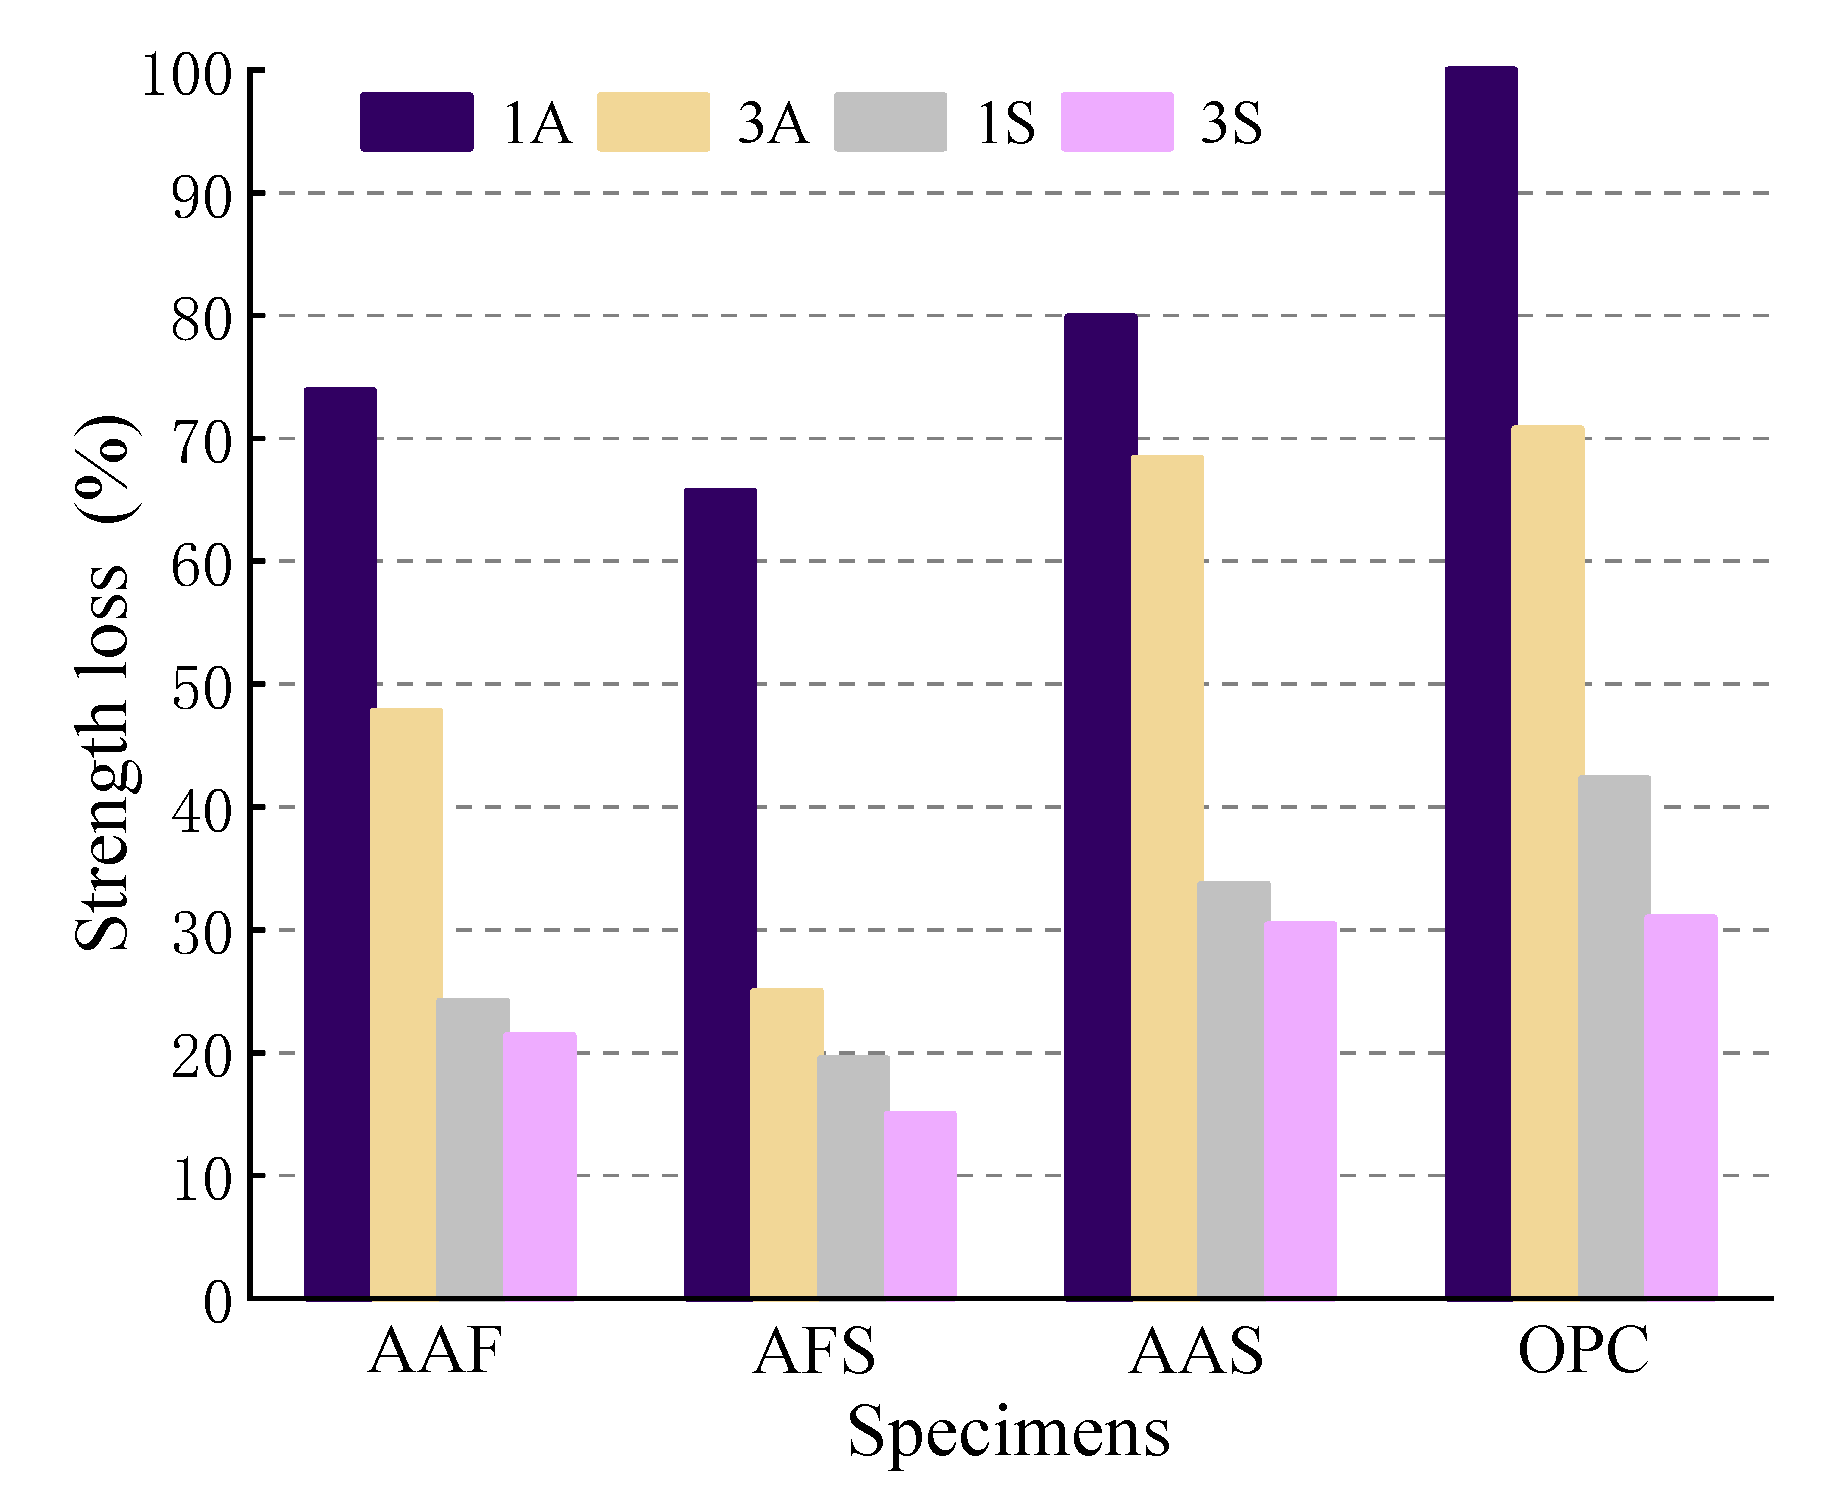
3.1.4. Strength
3.2. Observation and Testing of the Changes in Acidic Solutions
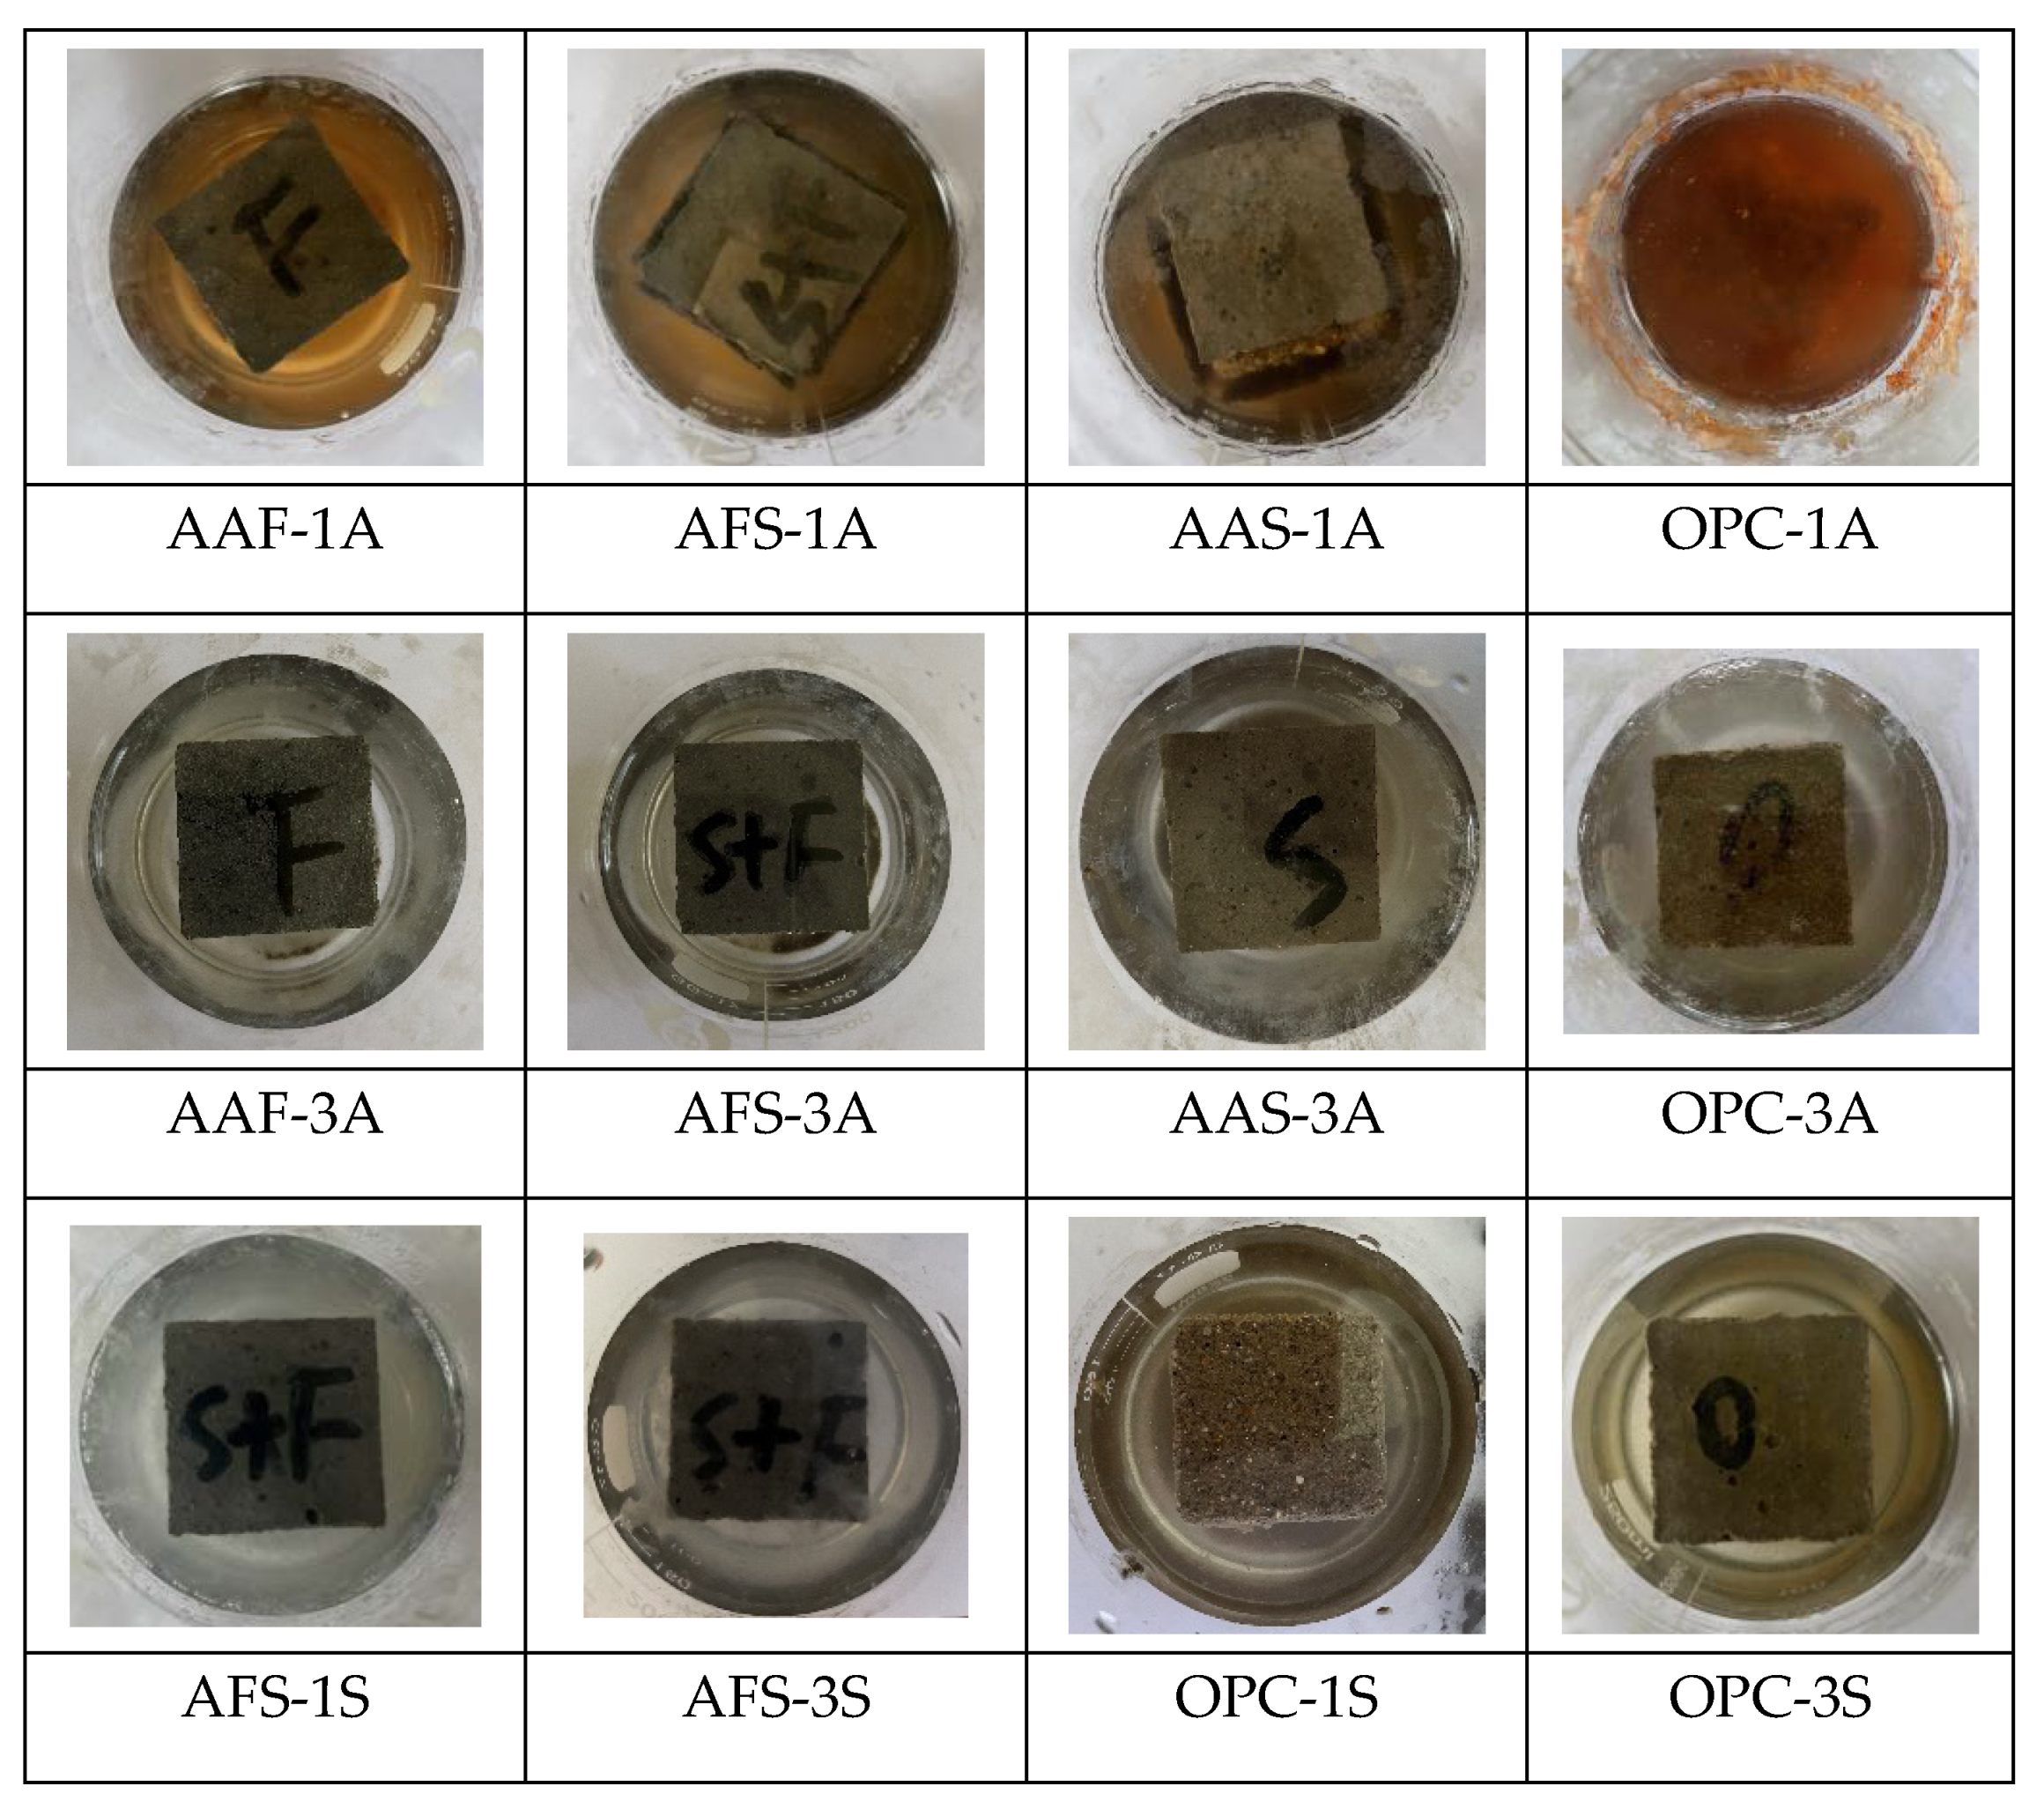
3.2.1. Color
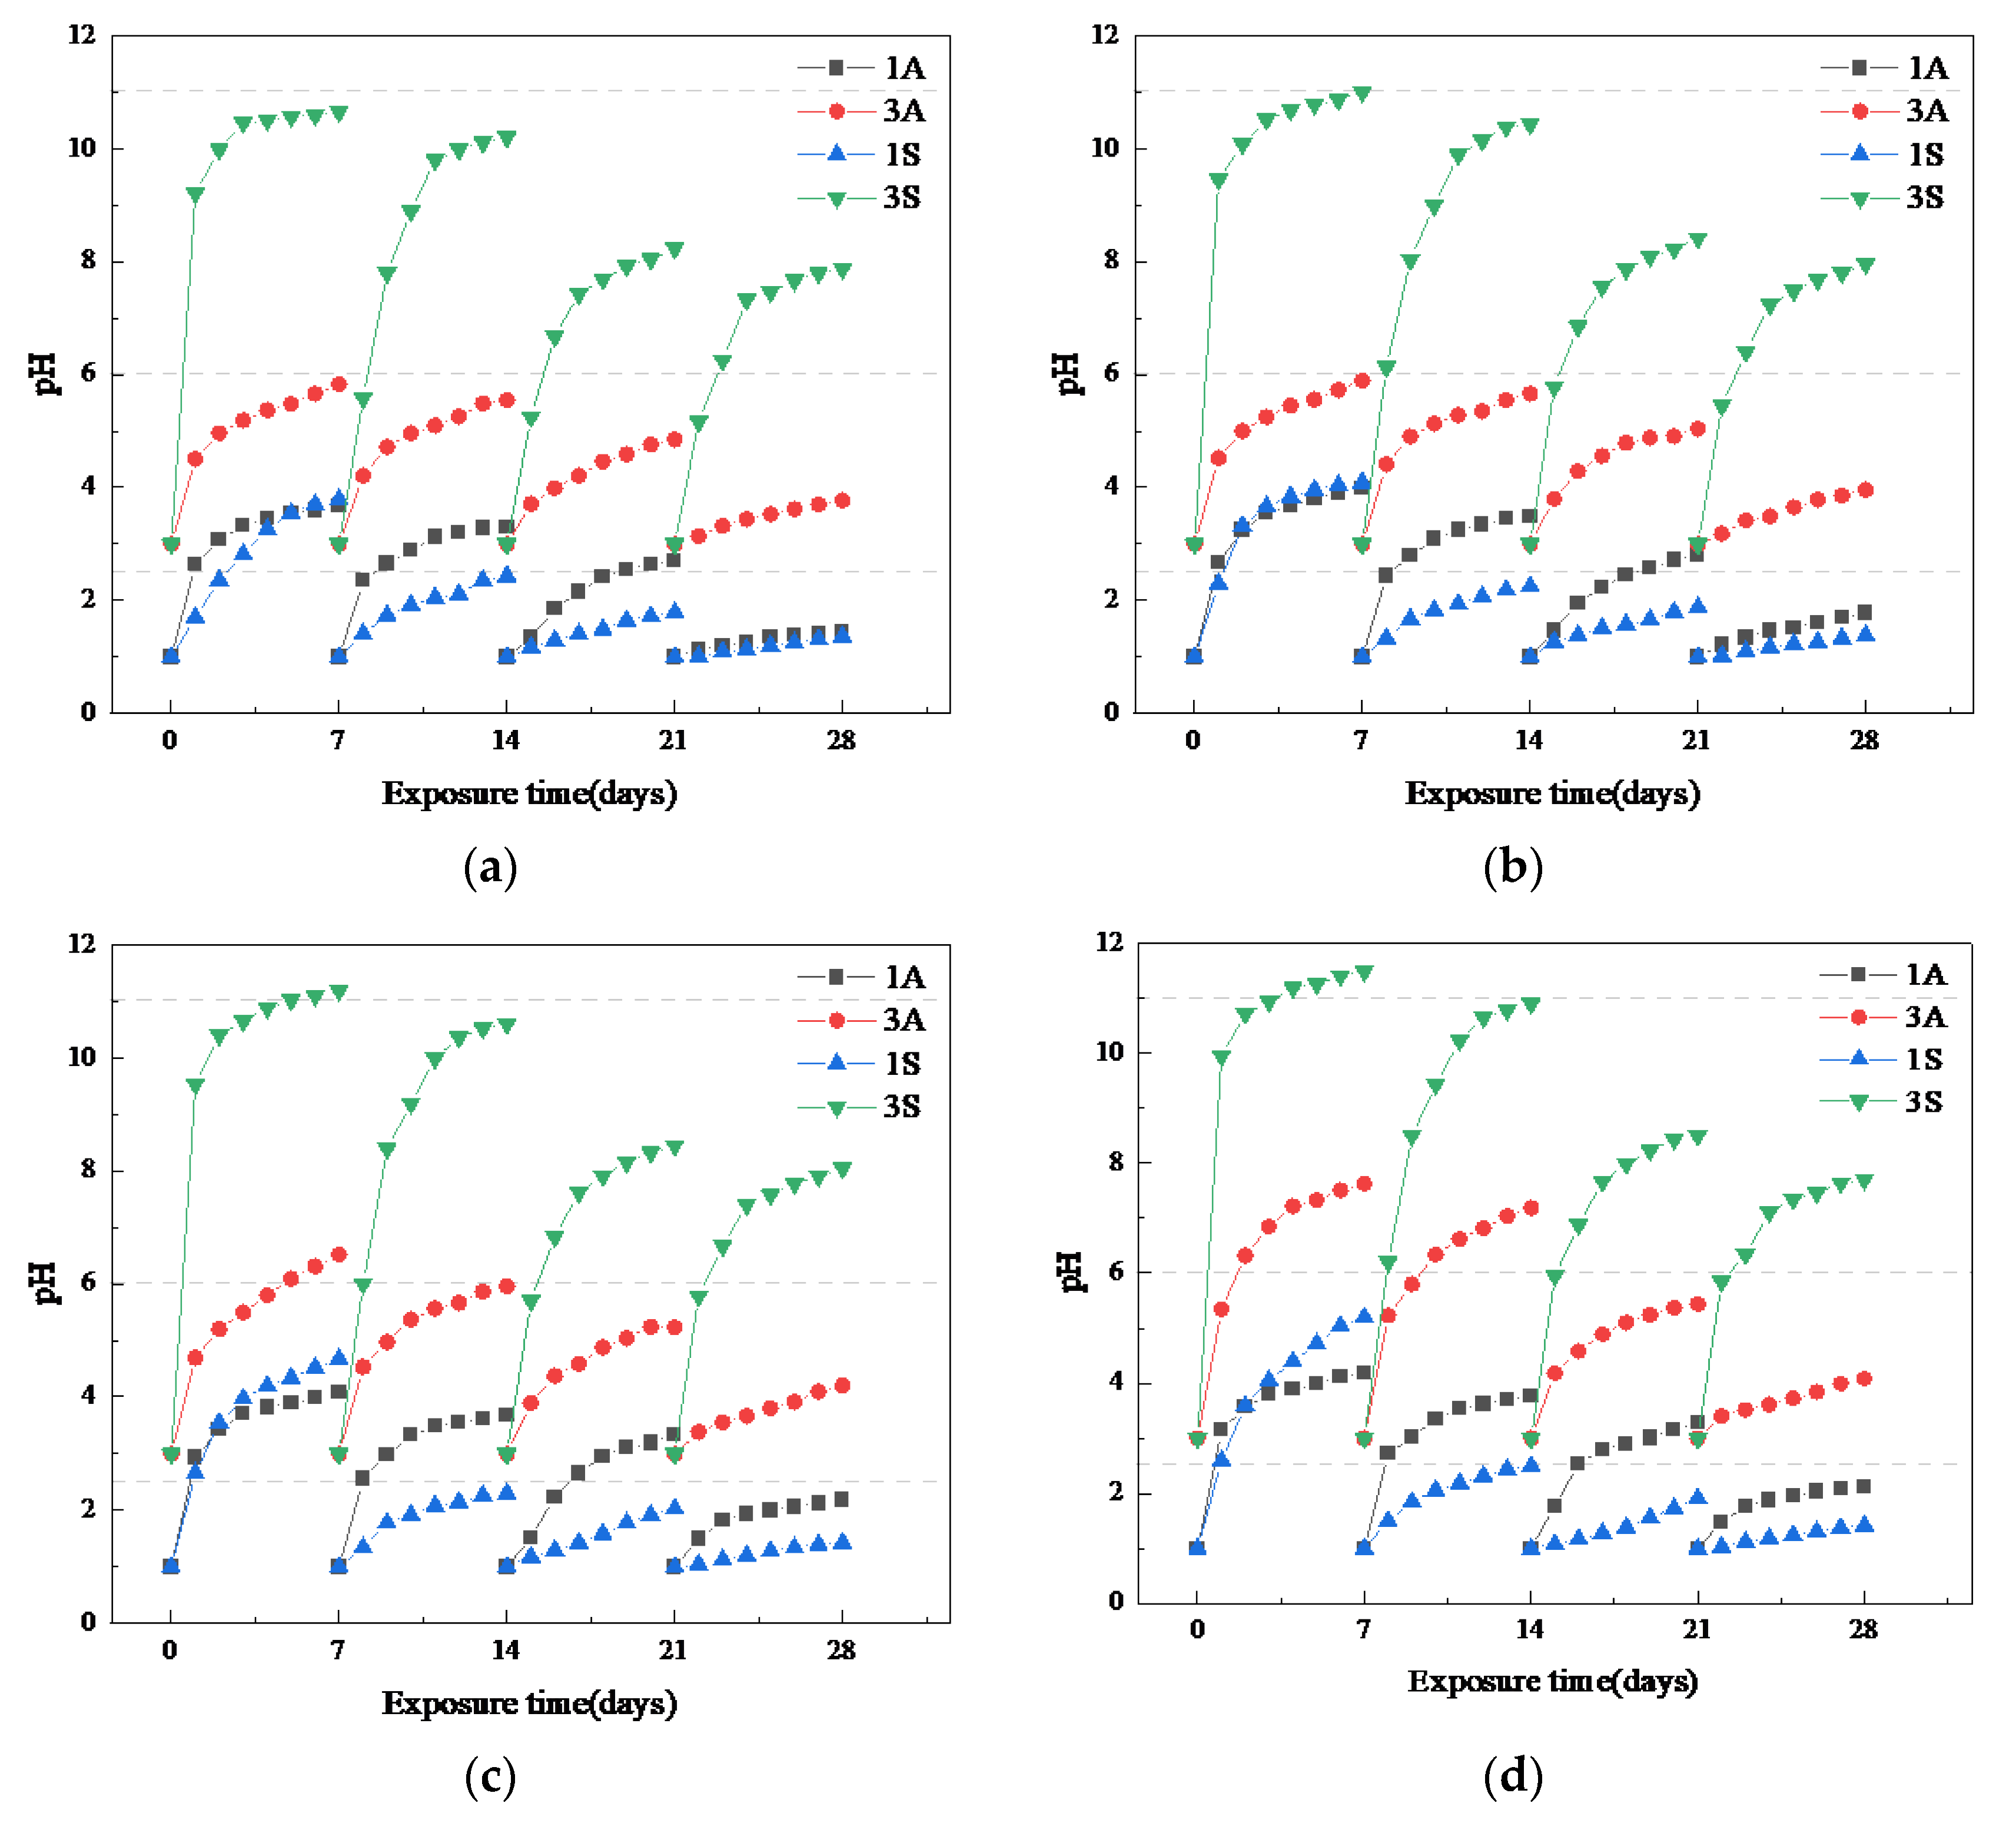
3.2.2. pH
3.3. Microscopic Analysis of Hardened Paste after Acid Corrosion
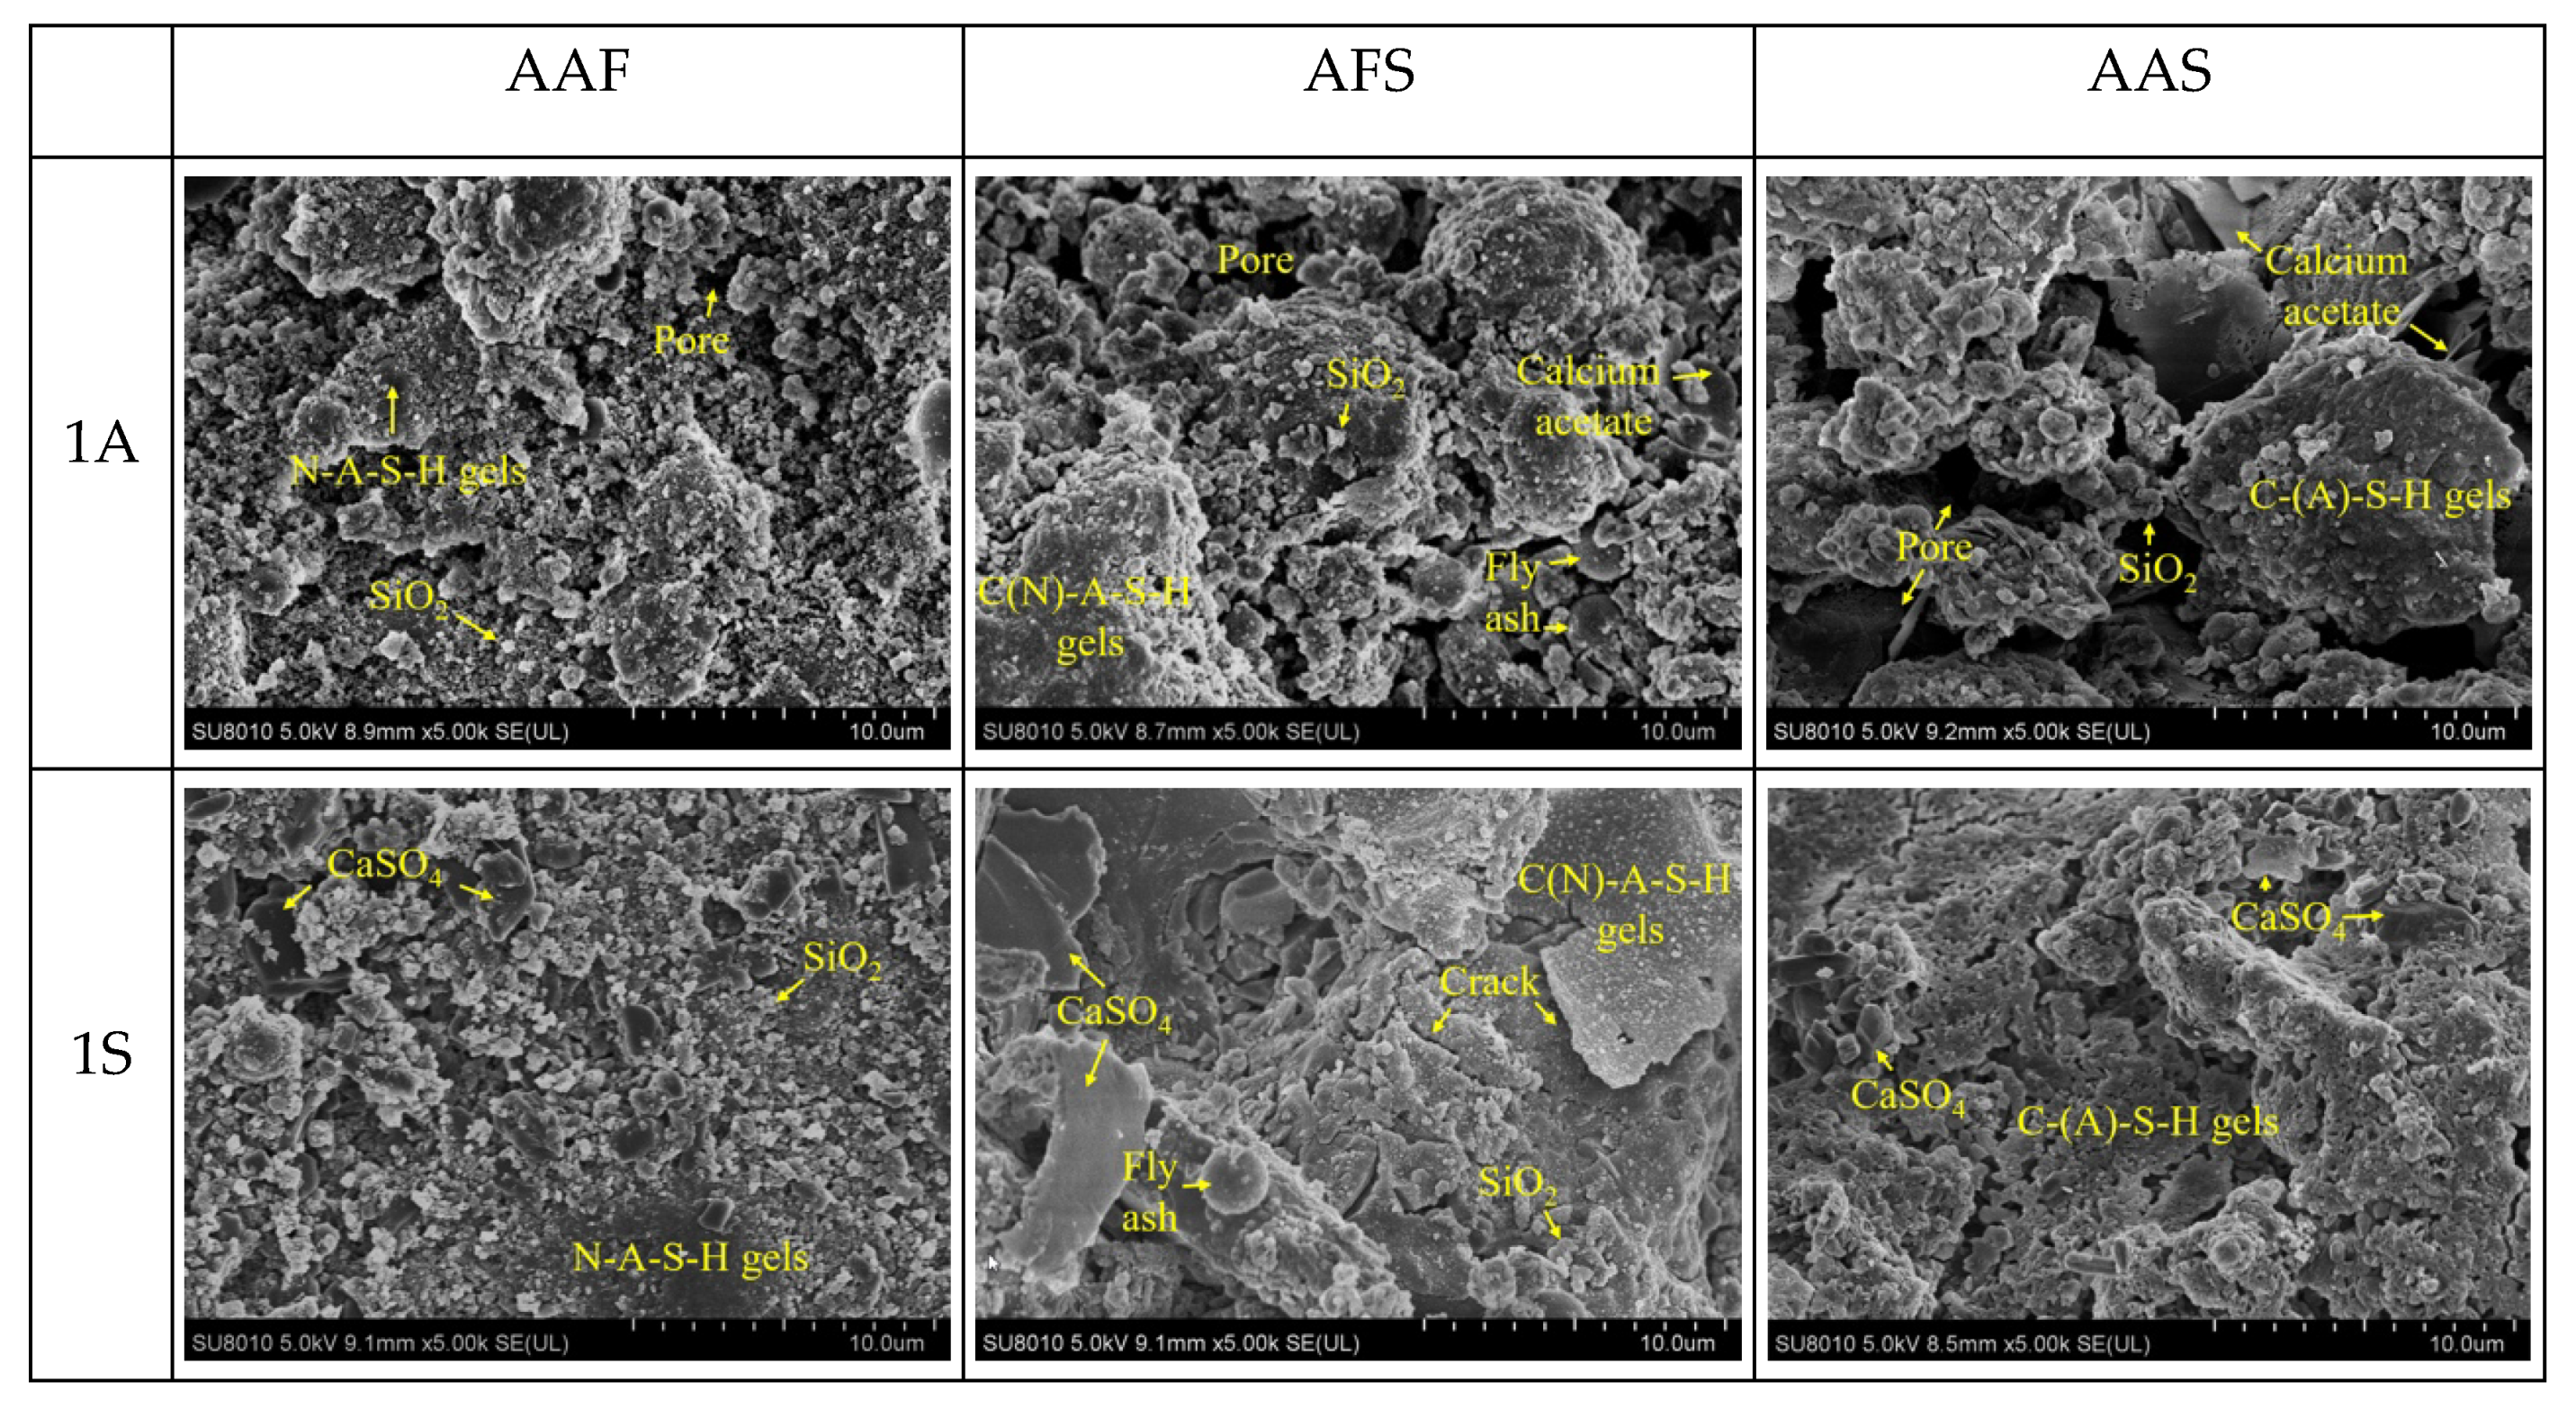
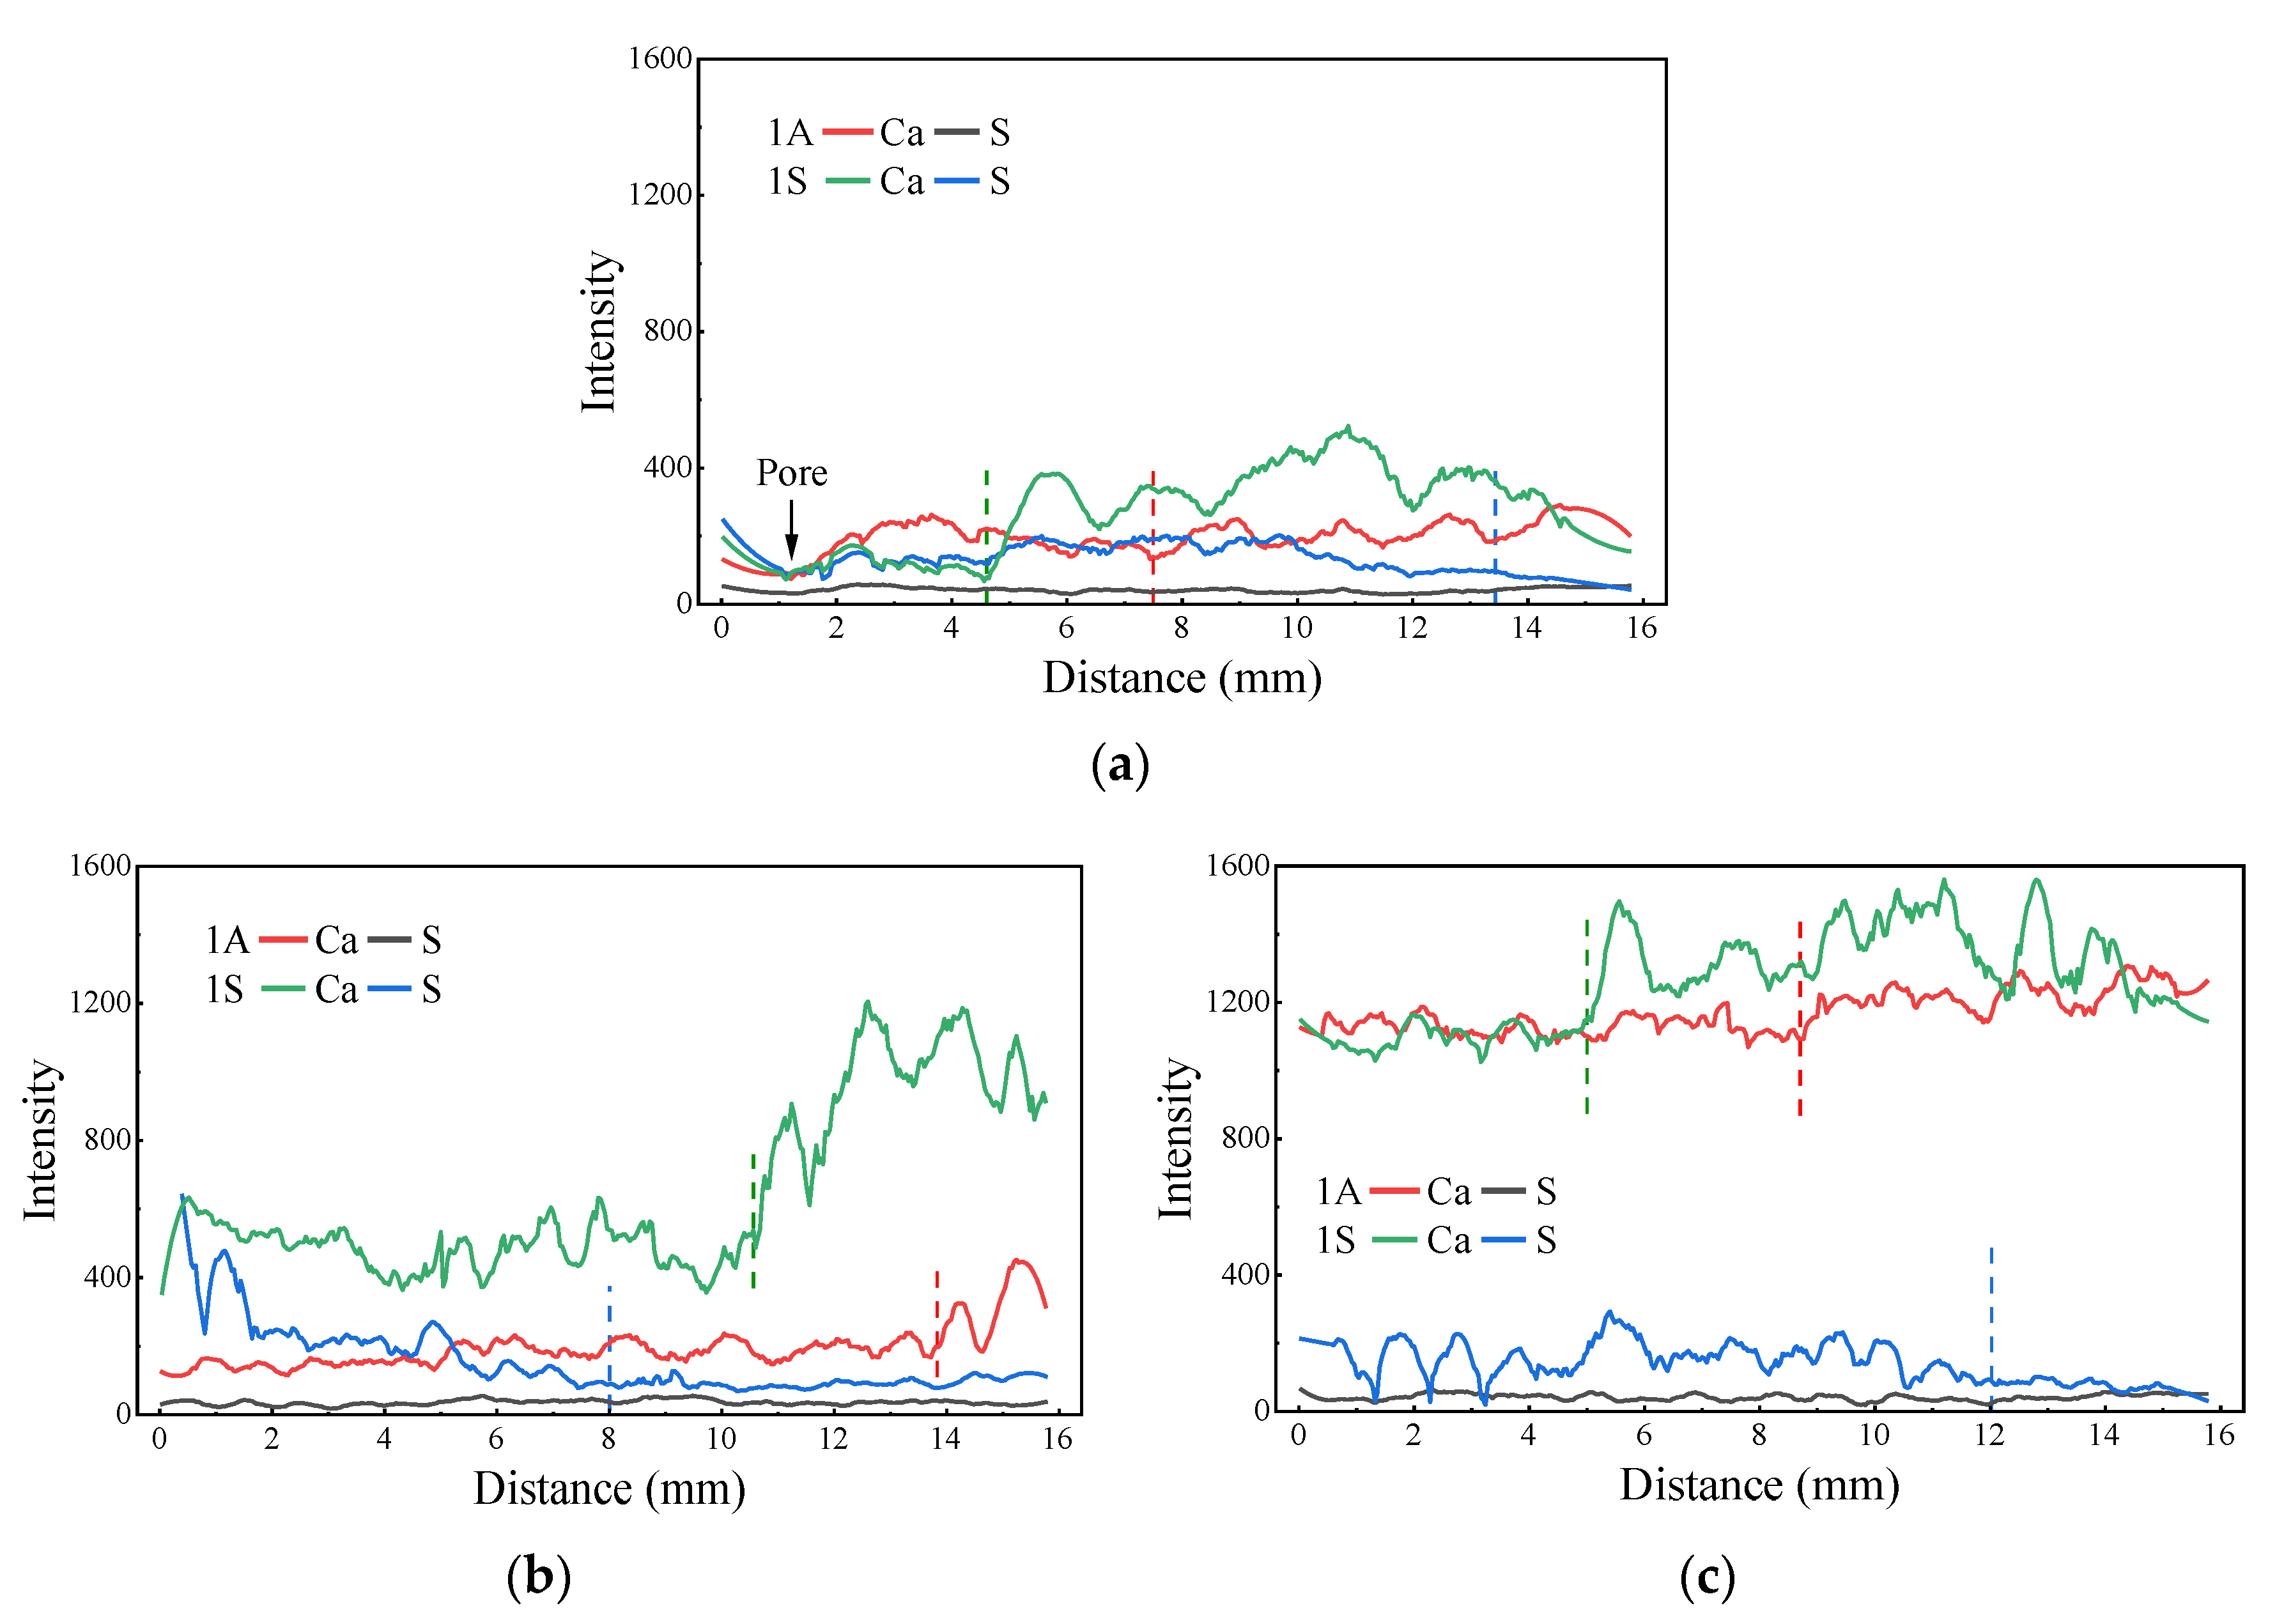
3.3.1. SEM-EDS
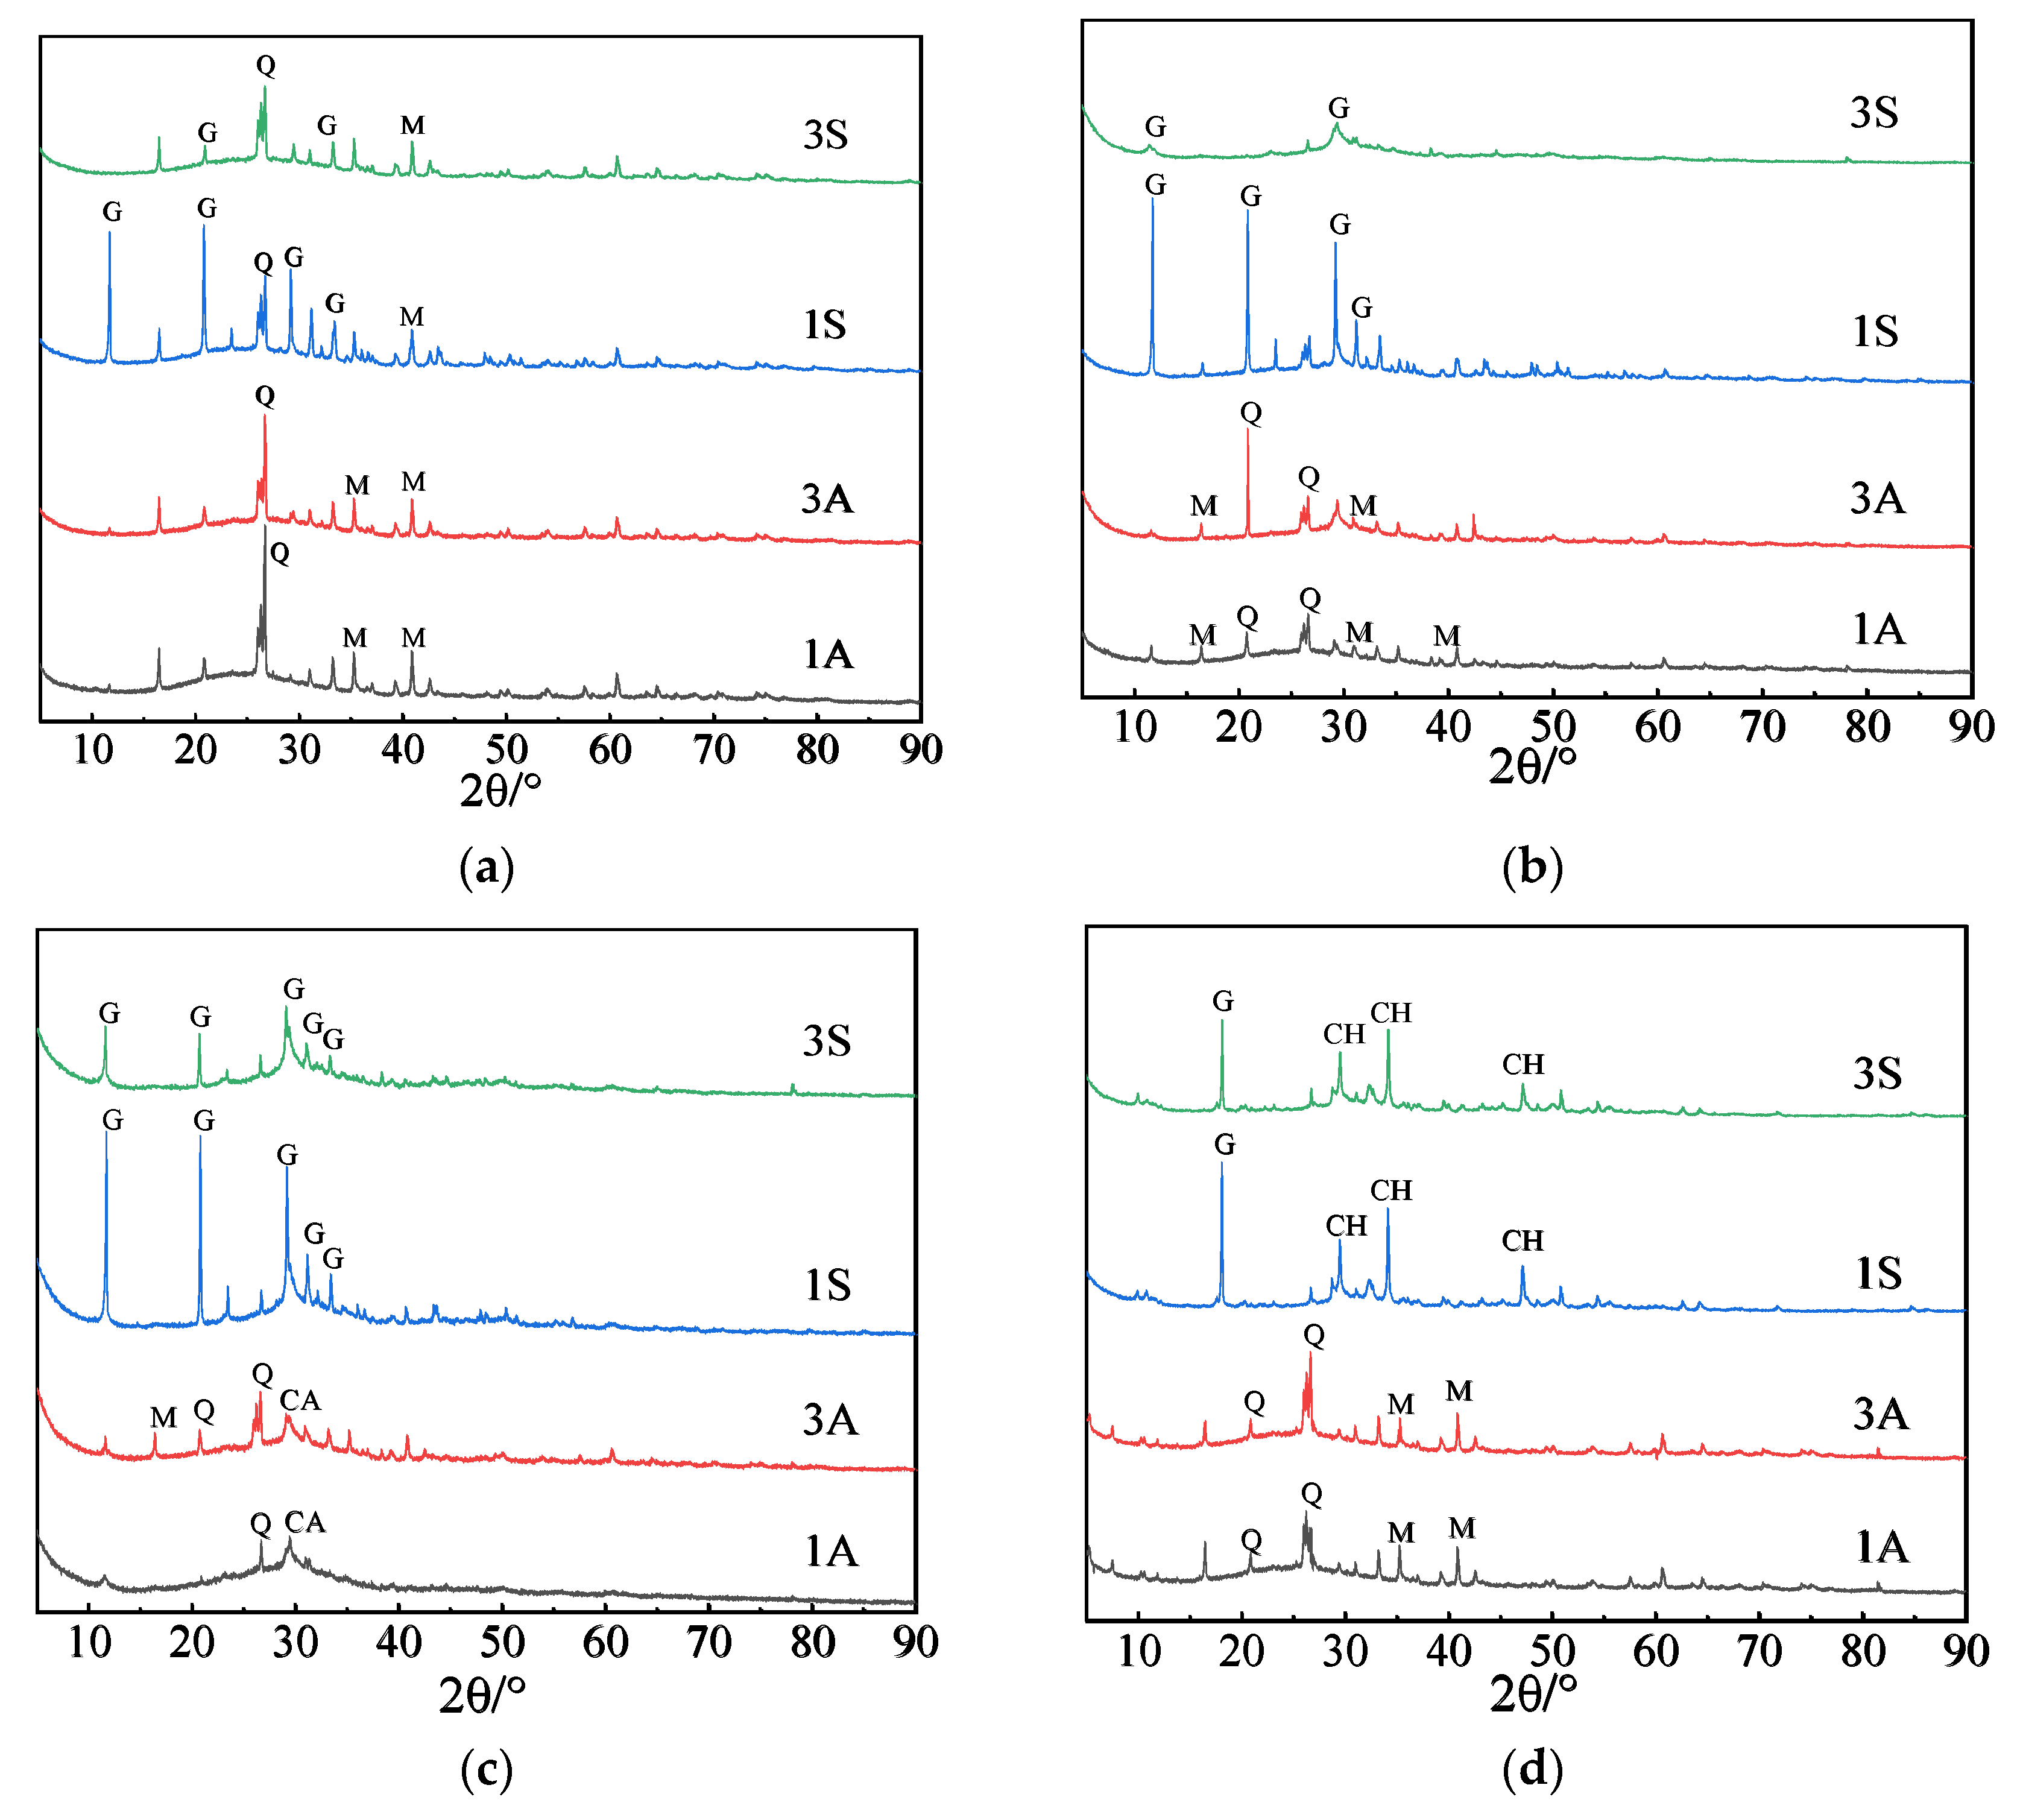
3.3.2. XRD
3.3.3. AC Impedance Spectra
4. Conclusions
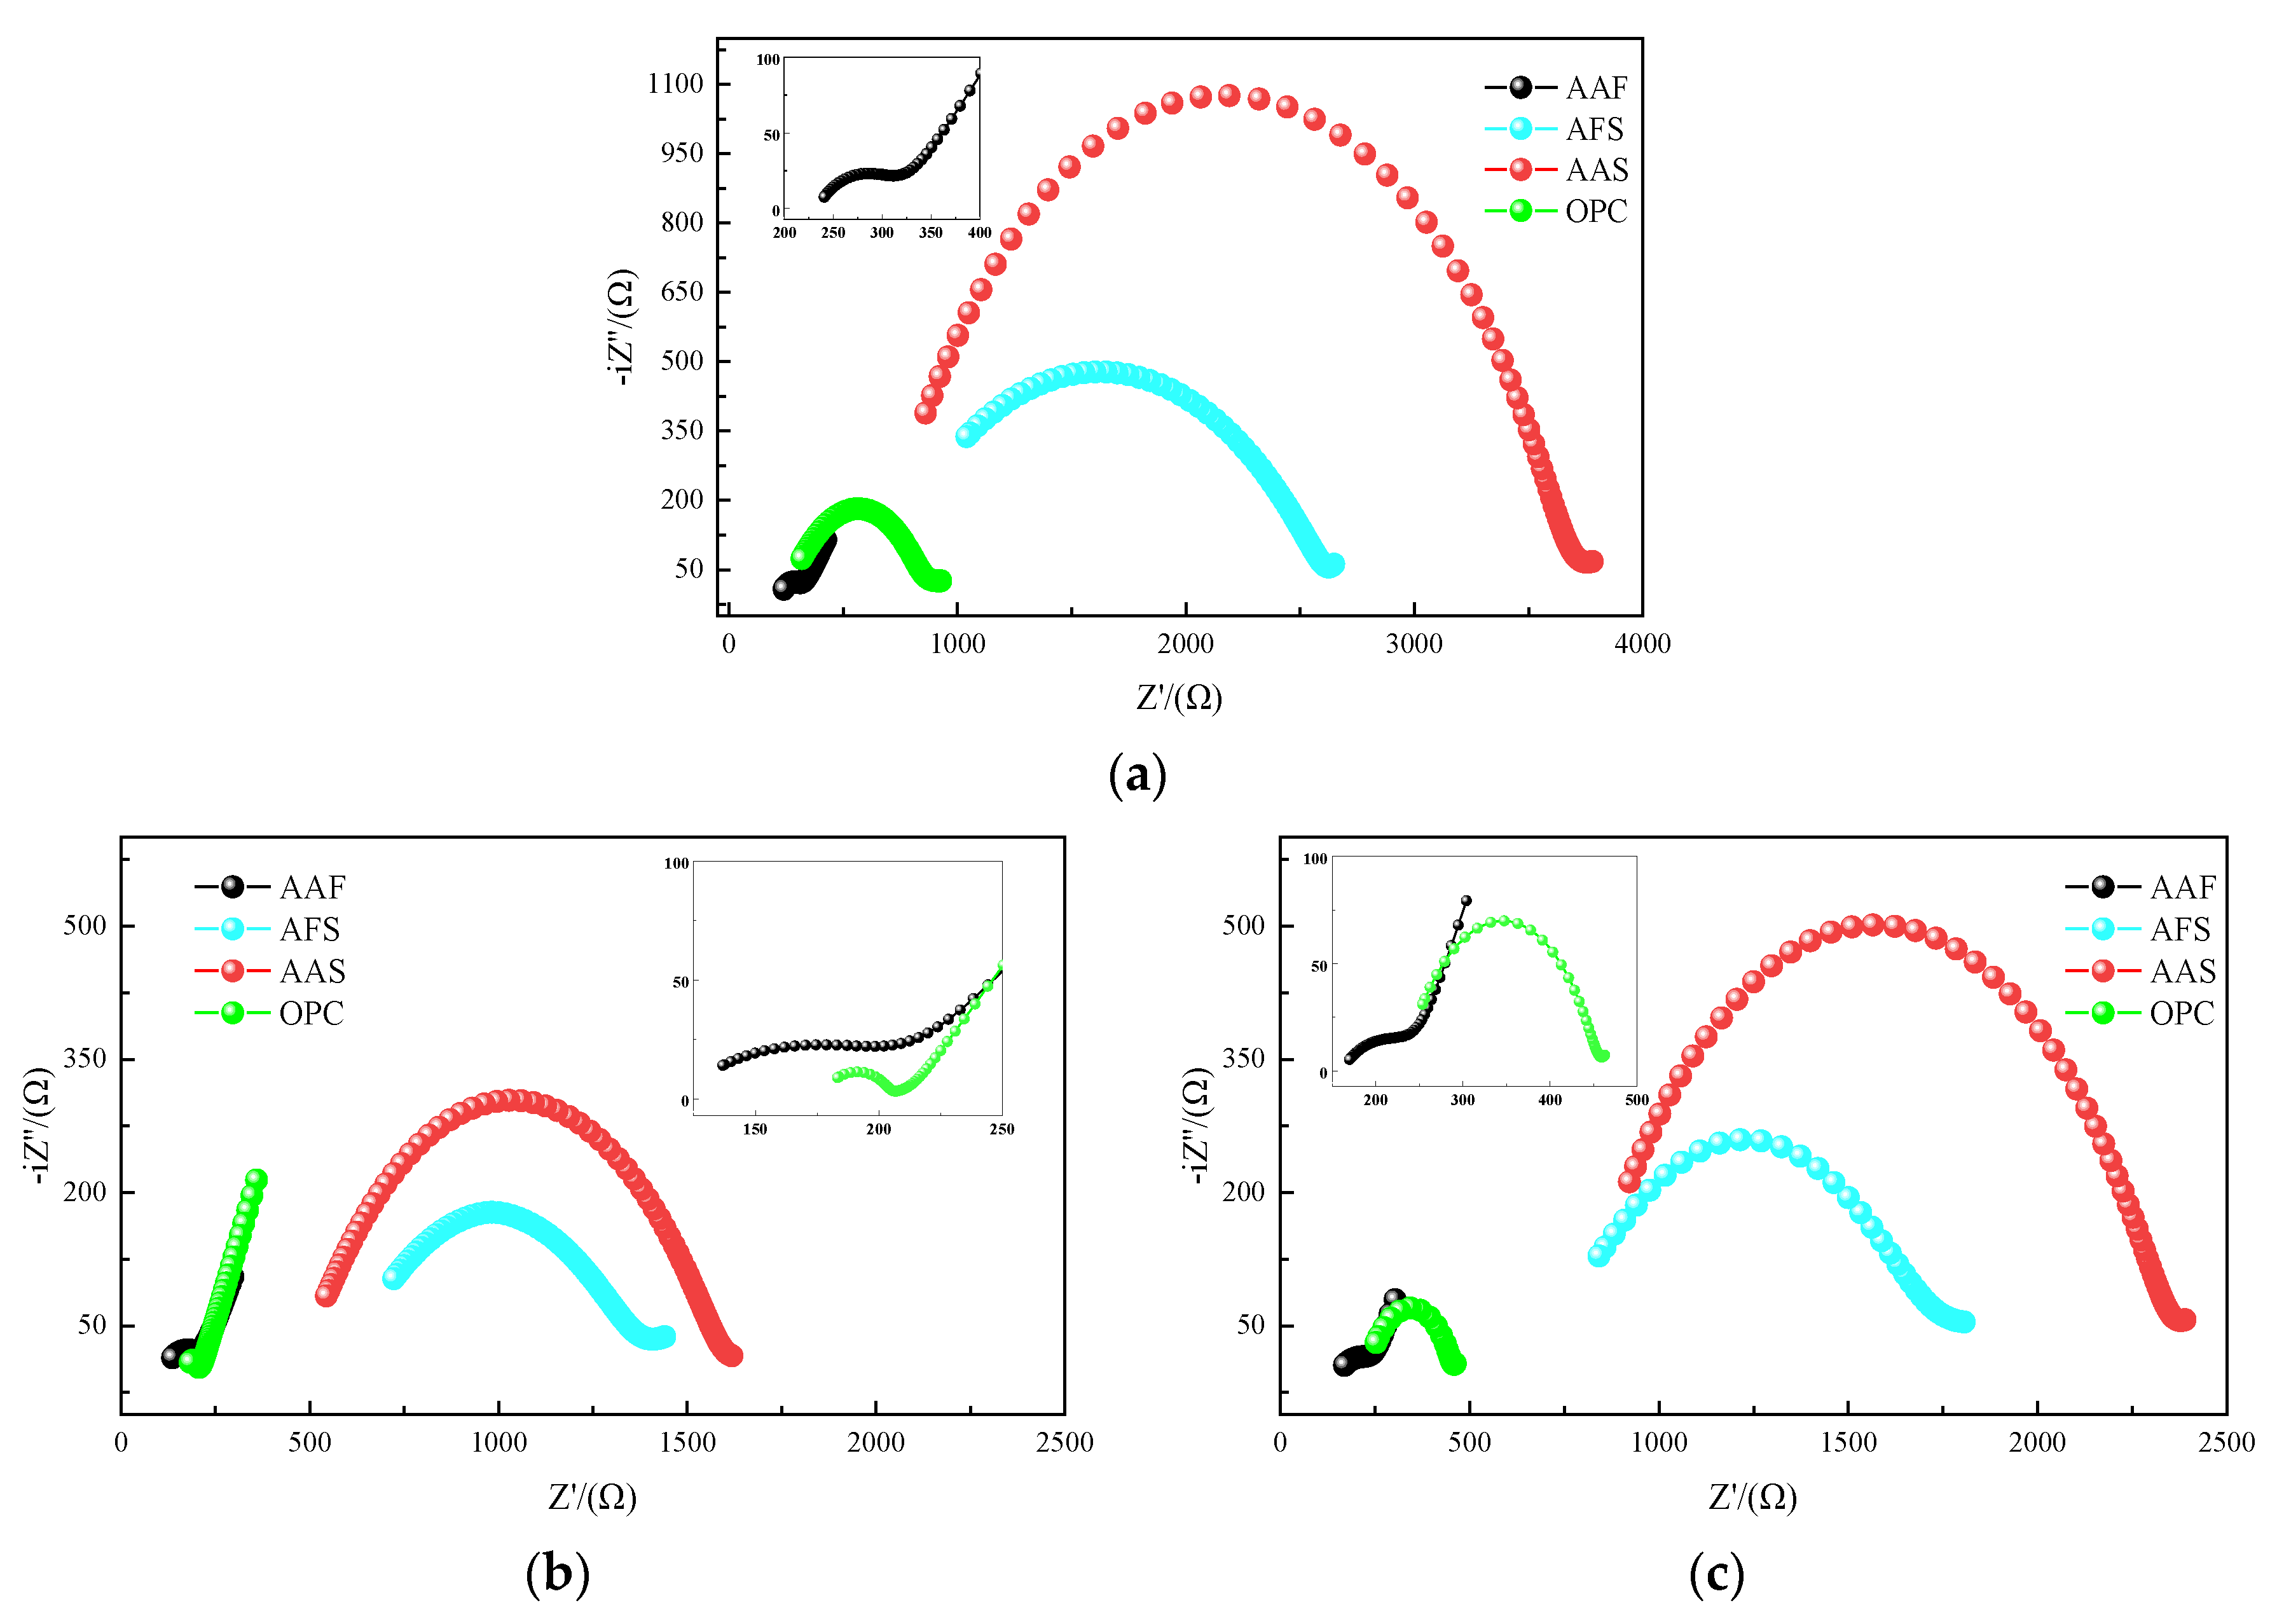
- When exposed to an acetic acid environment, OPC mortar experienced more severe deterioration in terms of appearance, mass loss, and strength loss as compared with alkali-activated mortars, but its neutralization depths were smaller, except for that in the 1S solution, resulting from the spalling of gypsum corrosion layer. The AAF mortar had a relatively intact appearance but the largest neutralization depth, which was due to its stable three-dimensional network but highly porous structure. The AC impedance results showed that, although the initial porosity of the AAF mortar was similar with that of the OPC mortar, the former had more connected pores; however, with increased slag in the binders, the parameter RCCP increased sharply, indicating the formation of denser structure. To sum up, AFS mortar has the best resistance to acid attack.
- By comparing the performance of mortar specimens in both acetic and sulfuric acids with the same pH value, it was found that the mortars in acetic acid suffered greater deterioration, which was mainly governed by the products and structure of the corrosion layer. The dealumination or decalcification of N-A-S-H/C-(A)-S-H gels and dissolution of calcium acetate led to the formation of a highly porous corrosion layer in acetic acid, whereas the crystallization of gypsum within the corrosion region when exposed to sulfuric acid had a pore filling effect. The color and pH changes of the acidic solution indicated that the gypsum formed could inhibit the leaching of iron and slow down the neutralization reaction between alkali solution in pores and acid. However, for AAS and OPC mortars exposed to sulfuric acid, extensive gypsum resulted in the formation of micro-cracks, and the corrosion layer of the OPC mortar was more prone to fall off.
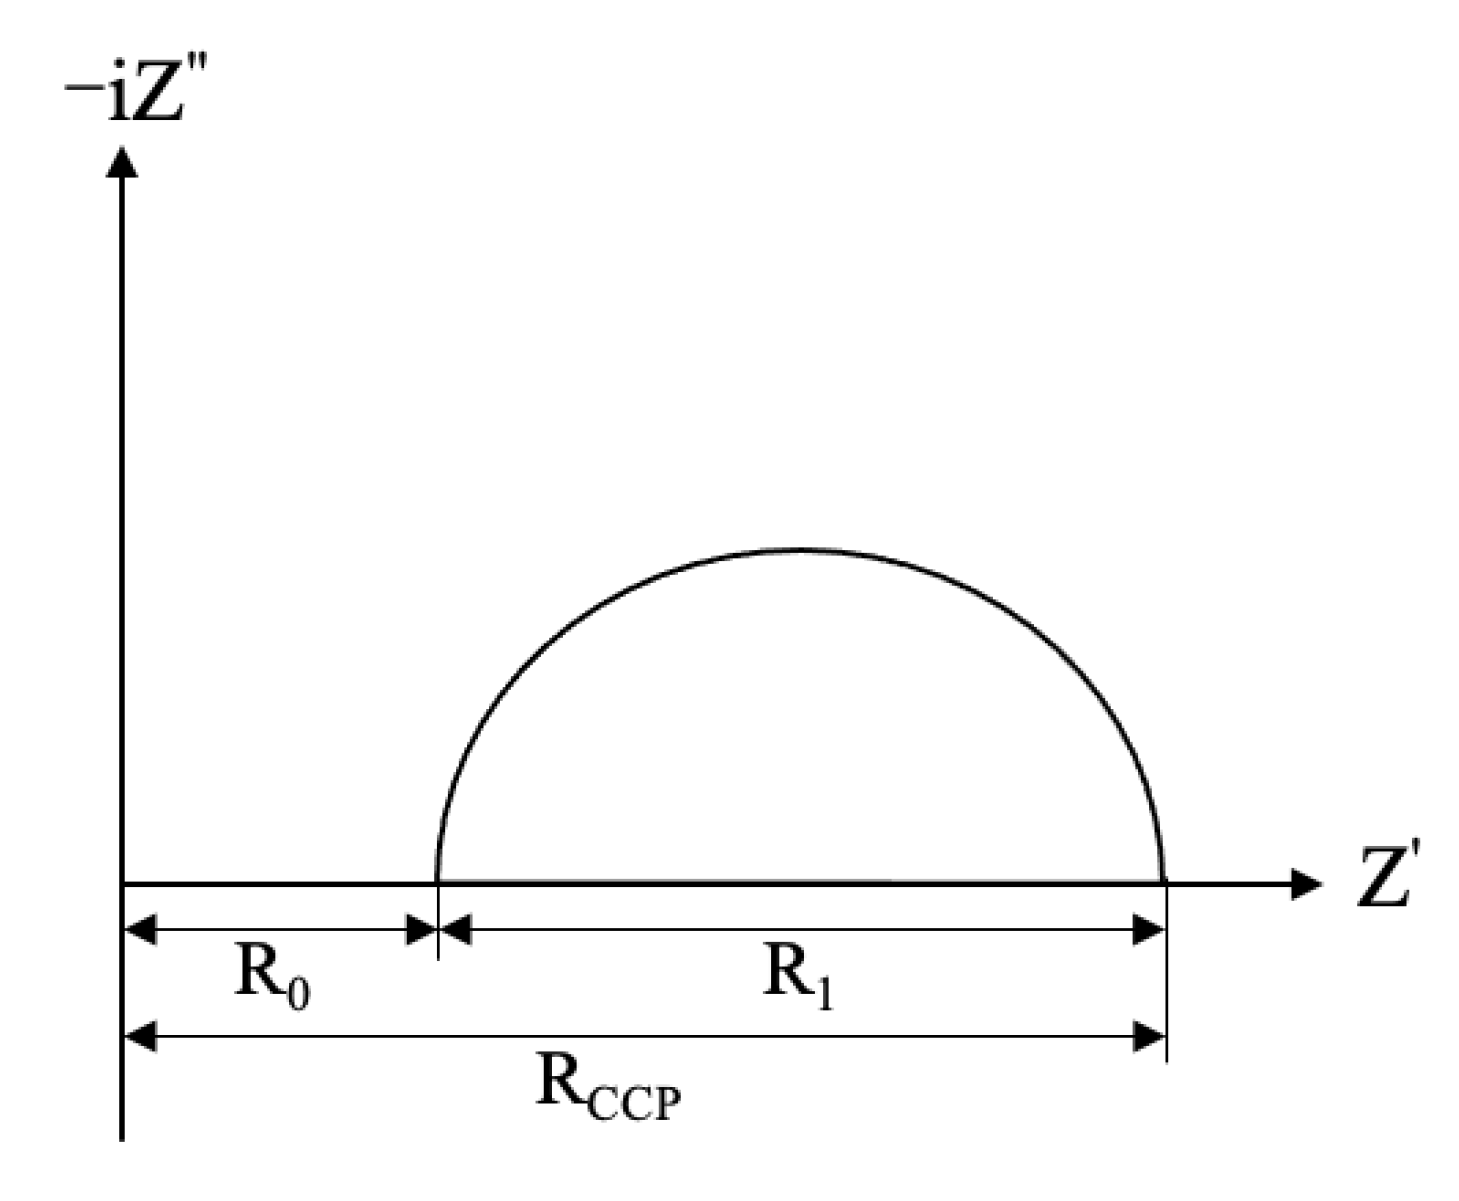
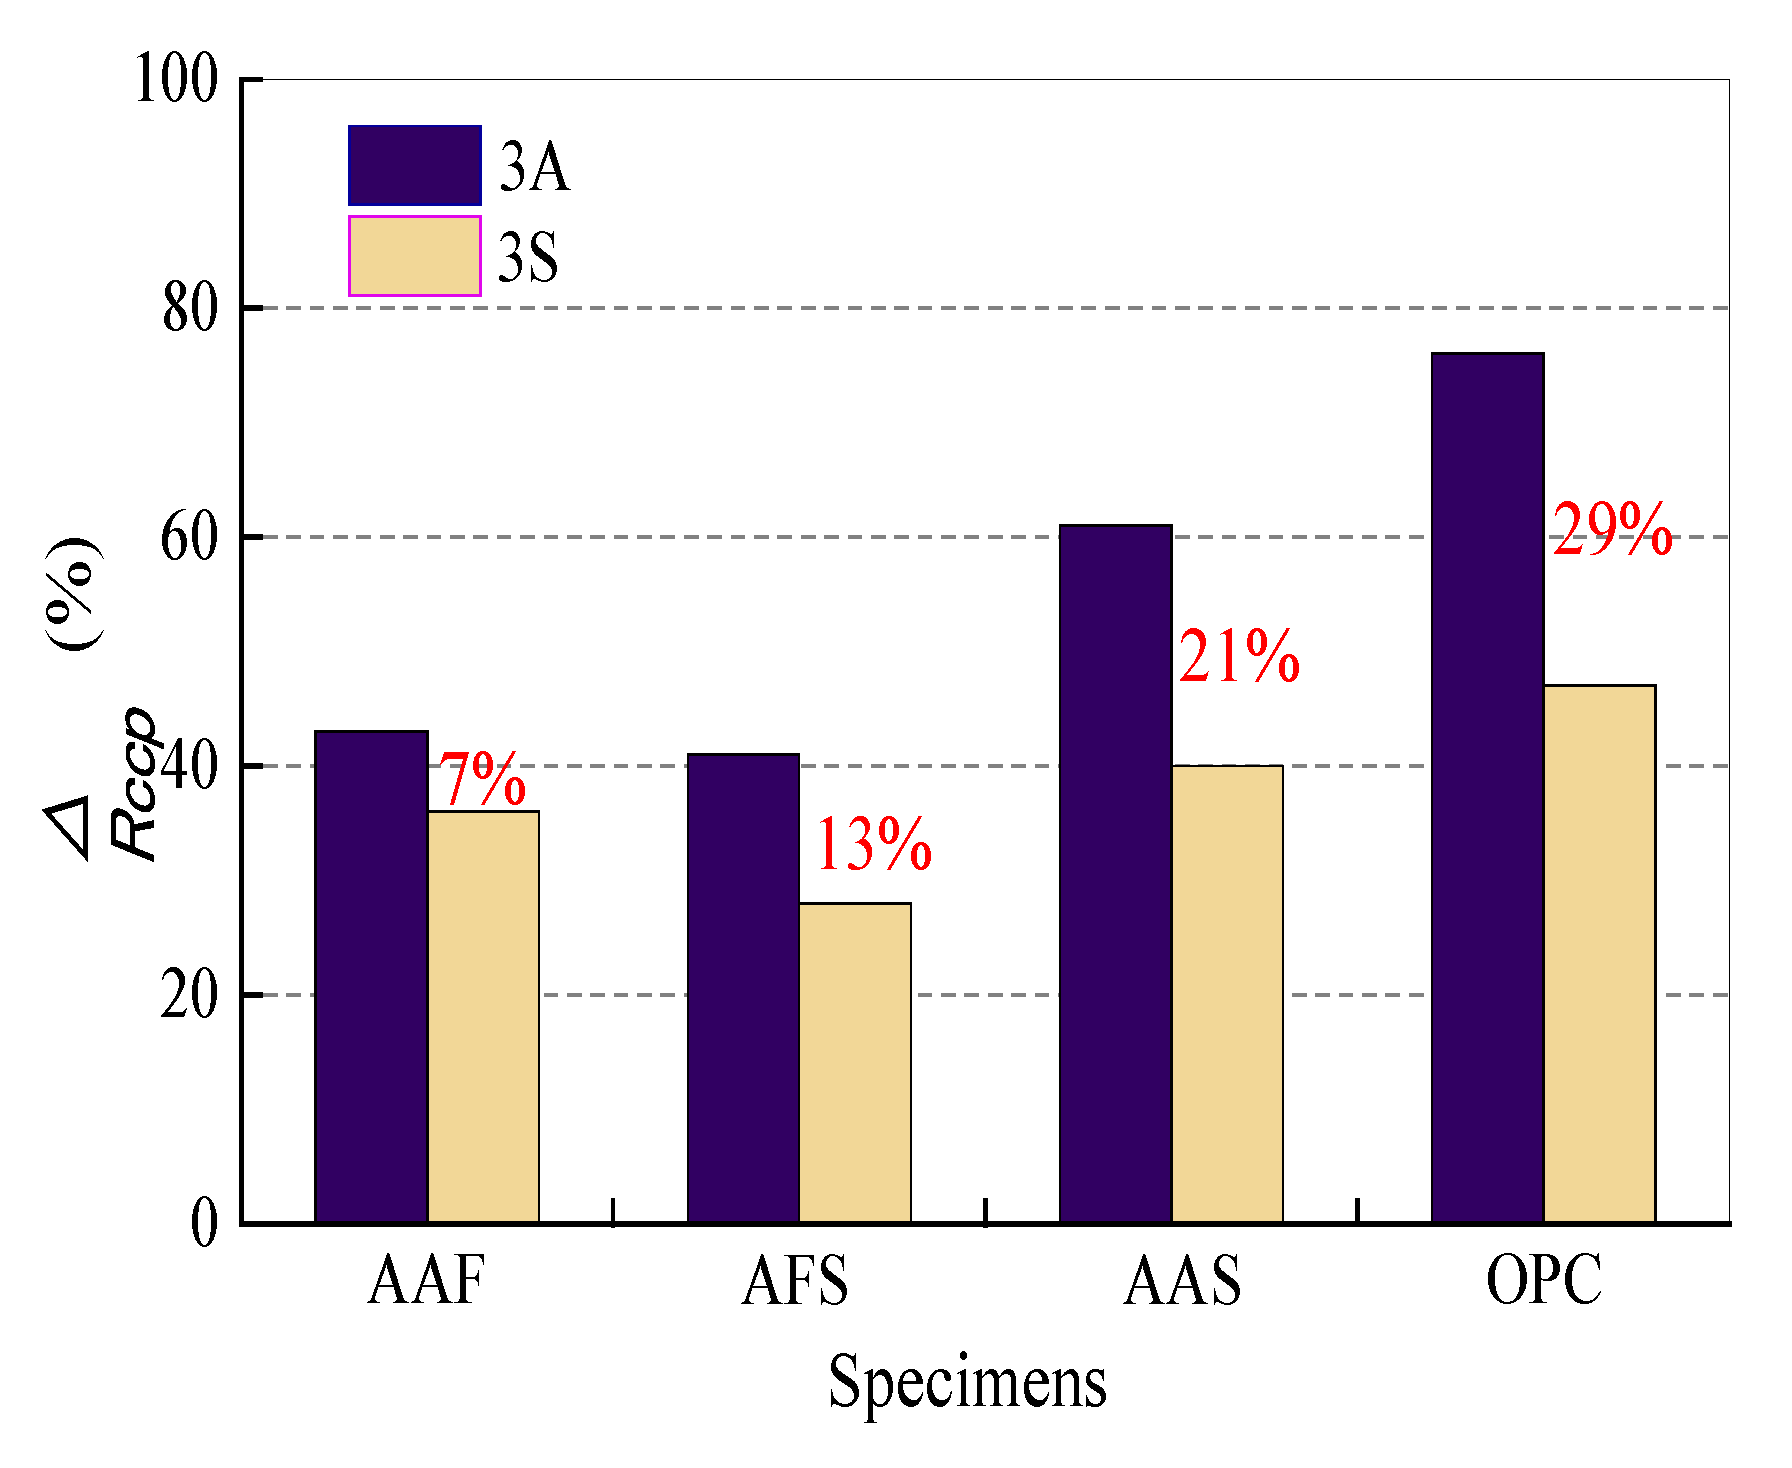
- In the acetic acid environment, the OPC mortar had the largest ΔRCCP value, which is the resistance difference of the continuously connected micropores before and after corrosion, followed by AAS, AAF, and AFS mortars, and the ΔRCCP values for all the specimens were smaller in sulfuric acid. Furthermore, the ΔRCCP values of different samples exposed to acetic and sulfuric acid solutions were compared, and the gap values increased with an increase in the calcium content of binders, which were 7%, 13%, 21%, and 29% for AAF, AFS, AAS and OPC mortars, respectively. Thus, it can be inferred that an appropriate amount of gypsum existing in the corrosion layer can act as a barrier to some extent in the sulfuric acid with a pH of three. Perhaps the adverse effect of expansive gypsum on the acid resistance of samples should also be considered in sulfuric acid with a pH of one.
Author Contributions
Funding
Institutional Review Board Statement
Informed Consent Statement
Conflicts of Interest
References
- Sydney, R.; Esfandi, E.; Surapaneni, S. Control concrete sewer corrosion via the crown spray process. Water Environ. Res. 1996, 68, 338–347. [Google Scholar] [CrossRef]
- Diercks, M.; Sand, W.; Bock, E. Microbial corrosion of concrete. Experientia 1991, 47, 514–516. [Google Scholar] [CrossRef]
- Han, J.; Gao, Z.; Zhang, X. Study on disequilibrium damage characteristics of concrete in primary settling pond by municipal sewage. China Civ. Eng. J. 2005, 38, 45–49. [Google Scholar] [CrossRef]
- Jiang, G.; Wightman, E. The role of iron in sulfide induced corrosion of sewer concrete. Water Res. 2014, 49, 166–174. [Google Scholar] [CrossRef]
- Okabe, S.; Odagiri, M.; Ito, T.; Satoh, H. Succession of sulfur-oxidizing bacteria in the microbial community on corroding concrete in sewer systems. Appl. Environ. Microbiol. 2007, 73, 971–980. [Google Scholar] [CrossRef] [Green Version]
- Cho, K.S.; Mori, T. A newly isolated fungus participates in the corrosion of concrete sewer pipes. Water Sci. Technol. 1995, 31, 263–271. [Google Scholar] [CrossRef] [Green Version]
- Hernandez, M.; Marchand, E.A.; Roberts, D.; Peccia, J. In situ assessment of active Thiobacillus species in corroding concrete sewers using fluorescent RNA probes. Int. Biodeterior. Biodegrad. 2002, 49, 271–276. [Google Scholar] [CrossRef]
- Parker, C.D. Mechanics of corrosion of concrete sewers by hydrogen sulfide. Sew. Ind. Waste 1951, 23, 1477–1485. [Google Scholar]
- Vollertsen, J.; Nielsen, A.H.; Jensen, H.S.; Wium-Andersen, T.; Hvitved-Jacobsen, T. Corrosion of concrete sewers—The kinetics of hydrogen sulfide oxidation. Sci. Total Environ. 2008, 394, 162–170. [Google Scholar] [CrossRef]
- Davidovits, J. Geopolymers and geopolymeric materials. J. Therm. Anal. Calorim. 1989, 35, 429–441. [Google Scholar] [CrossRef]
- Meyer, C. The greening of the concrete industry. Cem. Concr. Compos. 2009, 31, 601–605. [Google Scholar] [CrossRef]
- Ariffin, M.; Bhutta, M.; Hussin, M.; Tahir, M.M.; Aziah, N. Sulfuric acid resistance of blended ash geopolymer concrete. Constr. Build. Mater. 2013, 43, 80–86. [Google Scholar] [CrossRef]
- Sata, V.; Sathonsaowaphak, A.; Chindaprasirt, P. Resistance of lignite bottom ash geopolymer mortar to sulfate and sulfuric acid attack. Cem. Concr. Compos. 2012, 34, 700–708. [Google Scholar] [CrossRef]
- Kwasny, J.; Aiken, T.A.; Soutsos, M.N.; McIntosh, J.A.; Cleland, D.J. Sulfate and acid resistance of lithomarge-based geopolymer mortars. Constr. Build. Mater. 2018, 166, 537–553. [Google Scholar] [CrossRef] [Green Version]
- Bakharev, T. Resistance of geopolymer materials to acid attack. Cem. Concr. Res. 2005, 35, 658–670. [Google Scholar] [CrossRef]
- Xie, Y.; Lin, X.; Ji, T.; Liang, Y.; Pan, W. Comparison of corrosion resistance mechanism between ordinary Portland concrete and alkali-activated concrete subjected to biogenic sulfuric acid attack. Constr. Build. Mater. 2019, 228, 117071. [Google Scholar] [CrossRef]
- Xie, Y.; Lin, X.; Pan, W.; Ji, T.; Liang, Y.; Zhang, H. Study on corrosion mechanism of alkali-activated concrete with biogenic sulfuric acid. Constr. Build. Mater. 2018, 188, 9–16. [Google Scholar] [CrossRef]
- Bernal, S.A.; Rodríguez, E.D.; DE Gutierrez, R.M.; Provis, J.L. Performance of alkali-activated slag mortars exposed to acids. J. Sustain. Cem. Mater. 2012, 1, 138–151. [Google Scholar] [CrossRef]
- O’Connell, M.; McNally, C.; Richardson, M. Biochemical attack on concrete in wastewater applications: A state of the art review. Cem. Concr. Compos. 2010, 32, 479–485. [Google Scholar] [CrossRef]
- Bertron, A.; Duchesne, J.; Escadeillas, G. Degradation of cement pastes by organic acids. Mater. Struct. 2006, 40, 341–354. [Google Scholar] [CrossRef]
- Allahverdi, A.; Škvára, F. Sulfuric acid attack on hardened paste of geopolymer cements Part 2. Corrosion mechanism at mild and relatively low concentrations. Ceram. Silik. 2006, 50, 1–4. [Google Scholar] [CrossRef]
- Allahverdi, A.; Škvára, F. Sulfuric acid attack on hardened paste of geopolymer cements Part 1. Mechanism of corrosion at relatively high concentrations. Ceram. Silik. 2005, 49, 225–229. [Google Scholar]
- Ismail, I.; Bernal, S.A.; Provis, J.L.; San Nicolas, R.; Hamdan, S.; van Deventer, J.S.J. Modification of phase evolution in alkali-activated blast furnace slag by the incorporation of fly ash. Cem. Concr. Compos. 2014, 45, 125–135. [Google Scholar] [CrossRef]
- Khan, H.A.; Khan, M.S.; Castel, A.; Sunarho, J. Deterioration of alkali-activated mortars exposed to natural aggressive sewer environment. Constr. Build. Mater. 2018, 186, 577–597. [Google Scholar] [CrossRef]
- Albitar, M.; Ali, M.S.M.; Visintin, P.; Drechsler, M. Durability evaluation of geopolymer and conventional concretes. Constr. Build. Mater. 2017, 136, 374–385. [Google Scholar] [CrossRef]
- Lee, N.; Lee, H. Influence of the slag content on the chloride and sulfuric acid resistances of alkali-activated fly ash/slag paste. Cem. Concr. Compos. 2016, 72, 168–179. [Google Scholar] [CrossRef]
- Provis, J.; Myers, R.; White, C.; Rose, V.; van Deventer, J.S. X-ray microtomography shows pore structure and tortuosity in alkali-activated binders. Cem. Concr. Res. 2012, 42, 855–864. [Google Scholar] [CrossRef]
- Khan, H.A.; Castel, A.; Khan, M. Corrosion investigation of fly ash based geopolymer mortar in natural sewer environment and sulphuric acid solution. Corros. Sci. 2020, 168, 108586. [Google Scholar] [CrossRef]
- Lloyd, R.R.; Provis, J.L.; Van Deventer, J.S.J. Acid resistance of inorganic polymer binders. 1. Corrosion rate. Mater. Struct. 2011, 45, 1–14. [Google Scholar] [CrossRef]
- Ordinary Portland Cement Mixes With Selected Admixtures Subjected to Sulfuric Acid Attack. ACI Mater. J. 1988, 85, 512–518. [CrossRef]
- Puertas, F.; Jimenez, A.M.F. Mineralogical and microstructural characterisation of alkali-activated fly ash/slag pastes. Cem. Concr. Compos. 2003, 25, 287–292. [Google Scholar] [CrossRef]
- Ralli, Z.G.; Pantazopoulou, S.J. State of the art on geopolymer concrete. Int. J. Struct. Integr. 2021, 12, 511–533. [Google Scholar] [CrossRef]
- Christensen, B.J.; Mason, T.O.; Jennings, H.M. Influence of Silica Fume on the Early Hydration of Portland Cements Using Impedance Spectroscopy. J. Am. Ceram. Soc. 1992, 75, 939–945. [Google Scholar] [CrossRef]
- Song, G.-L. Equivalent circuit model for AC electrochemical impedance spectroscopy of concrete. Cem. Concr. Res. 2000, 30, 1723–1730. [Google Scholar] [CrossRef]


| Composition wt% | CaO | SiO2 | Al2O3 | MgO | Fe2O3 | P2O5 | TiO2 | K2O | Na2O | SO3 | Loss |
|---|---|---|---|---|---|---|---|---|---|---|---|
| Fly ash | 2.82 | 58.30 | 30.06 | 0.17 | 2.68 | 0.38 | 1.07 | 1.84 | 1.13 | 0.61 | 3.79 |
| GBFS | 38.70 | 30.21 | 14.42 | 9.33 | 0.46 | - | 1.82 | 0.15 | 0.51 | 2.10 | 2.30 |
| Cement | 62.40 | 21.35 | 4.76 | 3.06 | 3.13 | 0.49 | - | 0.21 | 0.54 | 2.52 | 1.54 |
| Ingredients | Fly Ash | Slay | Cement | Sand | Added Water | NaOH (10 M) | Na2SiO3 (Liquid) |
|---|---|---|---|---|---|---|---|
| AAF | 450 | - | - | 1350 | 45 | 70 | 200 |
| AFS | 225 | 225 | - | 1350 | 45 | 70 | 200 |
| AAS | - | 450 | - | 1350 | 45 | 70 | 200 |
| OPC | - | - | 450 | 1350 | 225 | - | - |
| No. | Compressive Strength (MPa) | Strength Loss (%) | Flexural Strength (MPa) | Strength Loss (%) | ||
|---|---|---|---|---|---|---|
| Before | After | Before | After | |||
| AAF-1A | 32.2 | 8.4 | 73.9 | 5.35 | 1.67 | 69.0 |
| AAF-3A | 16.8 | 47.8 | 2.55 | 52.3 | ||
| AAF-1S | 24.4 | 24.2 | 3.95 | 26.2 | ||
| AAF-3S | 25.3 | 21.4 | 4.32 | 19.3 | ||
| AFS-1A | 78.1 | 26.8 | 65.7 | 11.75 | 5.52 | 53 |
| AFS-3A | 58.6 | 25.0 | 8.75 | 25.5 | ||
| AFS-1S | 62.9 | 19.5 | 9.13 | 22.3 | ||
| AFS-3S | 66.4 | 15.0 | 9.55 | 18.7 | ||
| AAS-1A | 65.8 | 13.2 | 79.9 | 12.00 | 3.21 | 73.0 |
| AAS-3A | 20.8 | 68.4 | 5.08 | 57.7 | ||
| AAS-1S | 43.6 | 33.7 | 7.67 | 36.1 | ||
| AAS-3S | 45.8 | 30.4 | 8.65 | 27.9 | ||
| OPC-1A | 33.6 | - | 100.0 | 5.71 | - | 100 |
| OPC-3A | 9.8 | 70.8 | 2.18 | 61.8 | ||
| OPC-1S | 19.4 | 42.3 | 3.45 | 39.6 | ||
| OPC-3S | 23.2 | 31.0 | 3.95 | 30.8 | ||
| Impedance Parameter/Ω | Before | 3A | 3S | ||||||||
|---|---|---|---|---|---|---|---|---|---|---|---|
| R0 | R1 | RCCP | R0 | R1 | RCCP | ΔRCCP (%) | R0 | R1 | RCCP | ΔRCCP (%) | |
| AAF | 229 | 137 | 366 | 125 | 83 | 208 | 43 | 165 | 69 | 234 | 36 |
| AFS | 701 | 1728 | 2429 | 599 | 822 | 1421 | 41 | 649 | 1112 | 1761 | 28 |
| AAS | 918 | 2965 | 3883 | 508 | 1011 | 1519 | 61 | 823 | 1492 | 2315 | 40 |
| OPC | 260 | 581 | 841 | 177 | 28 | 205 | 76 | 234 | 214 | 448 | 47 |
Publisher’s Note: MDPI stays neutral with regard to jurisdictional claims in published maps and institutional affiliations. |
© 2022 by the authors. Licensee MDPI, Basel, Switzerland. This article is an open access article distributed under the terms and conditions of the Creative Commons Attribution (CC BY) license (https://creativecommons.org/licenses/by/4.0/).
Share and Cite
Zhao, W.; Fan, Z.; Li, X.; Kong, L.; Zhang, L. Characterization and Comparison of Corrosion Layer Microstructure between Cement Mortar and Alkali-Activated Fly Ash/Slag Mortar Exposed to Sulfuric Acid and Acetic Acid. Materials 2022, 15, 1527. https://doi.org/10.3390/ma15041527
Zhao W, Fan Z, Li X, Kong L, Zhang L. Characterization and Comparison of Corrosion Layer Microstructure between Cement Mortar and Alkali-Activated Fly Ash/Slag Mortar Exposed to Sulfuric Acid and Acetic Acid. Materials. 2022; 15(4):1527. https://doi.org/10.3390/ma15041527
Chicago/Turabian StyleZhao, Wenjing, Zirui Fan, Xin Li, Lijuan Kong, and Liying Zhang. 2022. "Characterization and Comparison of Corrosion Layer Microstructure between Cement Mortar and Alkali-Activated Fly Ash/Slag Mortar Exposed to Sulfuric Acid and Acetic Acid" Materials 15, no. 4: 1527. https://doi.org/10.3390/ma15041527