
Compressive Behavior of Al-TiB2 Composite Foams Fabricated under Increased Pressure

School of Metallurgy, Northeastern University, Shenyang 110819, China
*
Author to whom correspondence should be addressed.
Materials 2021, 14(17), 5112; https://doi.org/10.3390/ma14175112
Submission received: 16 July 2021
/
Revised: 31 August 2021
/
Accepted: 2 September 2021
/
Published: 6 September 2021
Abstract
:The application of increased pressure was used as a strategy to investigate the effect of different cell structures on the mechanical properties of Al-TiB2 composite foams. In situ Al-xTiB2 (x = 5, 10 wt.%) composites were foamed under three different pressures (0.1 MPa, 0.24 MPa, 0.4 MPa) through the liquid melt route. The macro-structure of the composite foams was analyzed in terms of cell size distribution measured by X-ray microcomputed tomography (micro-CT). It was found that the mean cell size decreases, and the cell size distribution range narrows with increasing pressure. Uniaxial compression tests revealed that the stress fluctuation (Rsd) of 10TiB2 foams is larger than that of 5TiB2 foams under the same pressure. Moreover, cell size refinement causes the simultaneous deformation of multi-layer cells, which leads to an enhancement in the energy absorption efficiency and specific energy absorption. The comparison of experimental data with theoretical predictions (G&A model) is discussed.
1. Introduction
Metal foams are porous materials in which one phase is gaseous and the others are dense metals or alloys. Aluminum foams with a closed cell structure have high specific strength and excellent energy absorption ability and have been receiving increasing attention in various engineering fields such as construction, transportation, and aerospace [1,2,3].
The mechanical properties of aluminum foams depend on both their morphological and micro-structural features. A number of studies have been conducted to investigate the influence of morphological features (such as defects, cell shape anisotropy, cell wall thickness, etc.) on mechanical performance. Defects (curved and serrated cell walls, missing cells, partially coupled cells, etc.) could significantly reduce the plastic collapse stress of aluminum foams [4,5]. The anisotropy cell shape leads to higher plastic collapse stress and energy absorption capacity in the longitudinal direction than in the transverse direction [6]. Additionally, high degrees of local anisotropy are likely to induce collapse bands [7]. However, the effect of the significant change of cell size under increased pressure on mechanical properties has not been reported.
As is well known, the cell wall material of metal foams has, in general, significant effects on their mechanical properties. It is widely accepted that the bending and buckling of cell walls dominate deformation behavior in the plateau stage. Several model analyses and simulations have been used, which have indicated the bending, buckling, and fracture of a simplified unit cell structure [8,9,10,11,12]. The most typical one is the Gibson–Ashby model (G&A model) [8]. Moreover, the nature of the cell wall material has an effect on compressive behavior. Past studies have suggested that the alloy composite selected for foaming experiments has an effect on mechanical behavior [8,13,14,15]. Furthermore, large ex situ particle additions (such as SiC, Al2O3, and Y2O3, 6–20 μm) during the fabrication of closed-cell foams can cause the metal matrix to be brittle, which can deteriorate the mechanical properties of composite foams. Recently, in situ Al-TiB2 composite materials have attracted wide attention due to the in situ TiB2 particle micron size (<2 μm) and a good bond with the matrix compared to large ex situ particles, which can avoid deteriorating the mechanical properties [16,17,18]. However, the effect of different cell structures on the mechanical properties of in situ Al-TiB2 composite foams was not presented in these studies.
The purpose of this paper was to investigate the effect of different cell structures on the mechanical properties of Al-TiB2 composite foams. In situ Al-xTiB2 (x = 5, 10 wt.%) composite foams were prepared by the melt route under three different pressures. The pore structure was characterized by X-ray microcomputed tomography (micro-CT), and the micro-structure was characterized by scanning electron microscopy (SEM). The compressive performance of in situ TiB2 composite foams was also investigated.
2. Materials and Methods
2.1. Foam Preparation
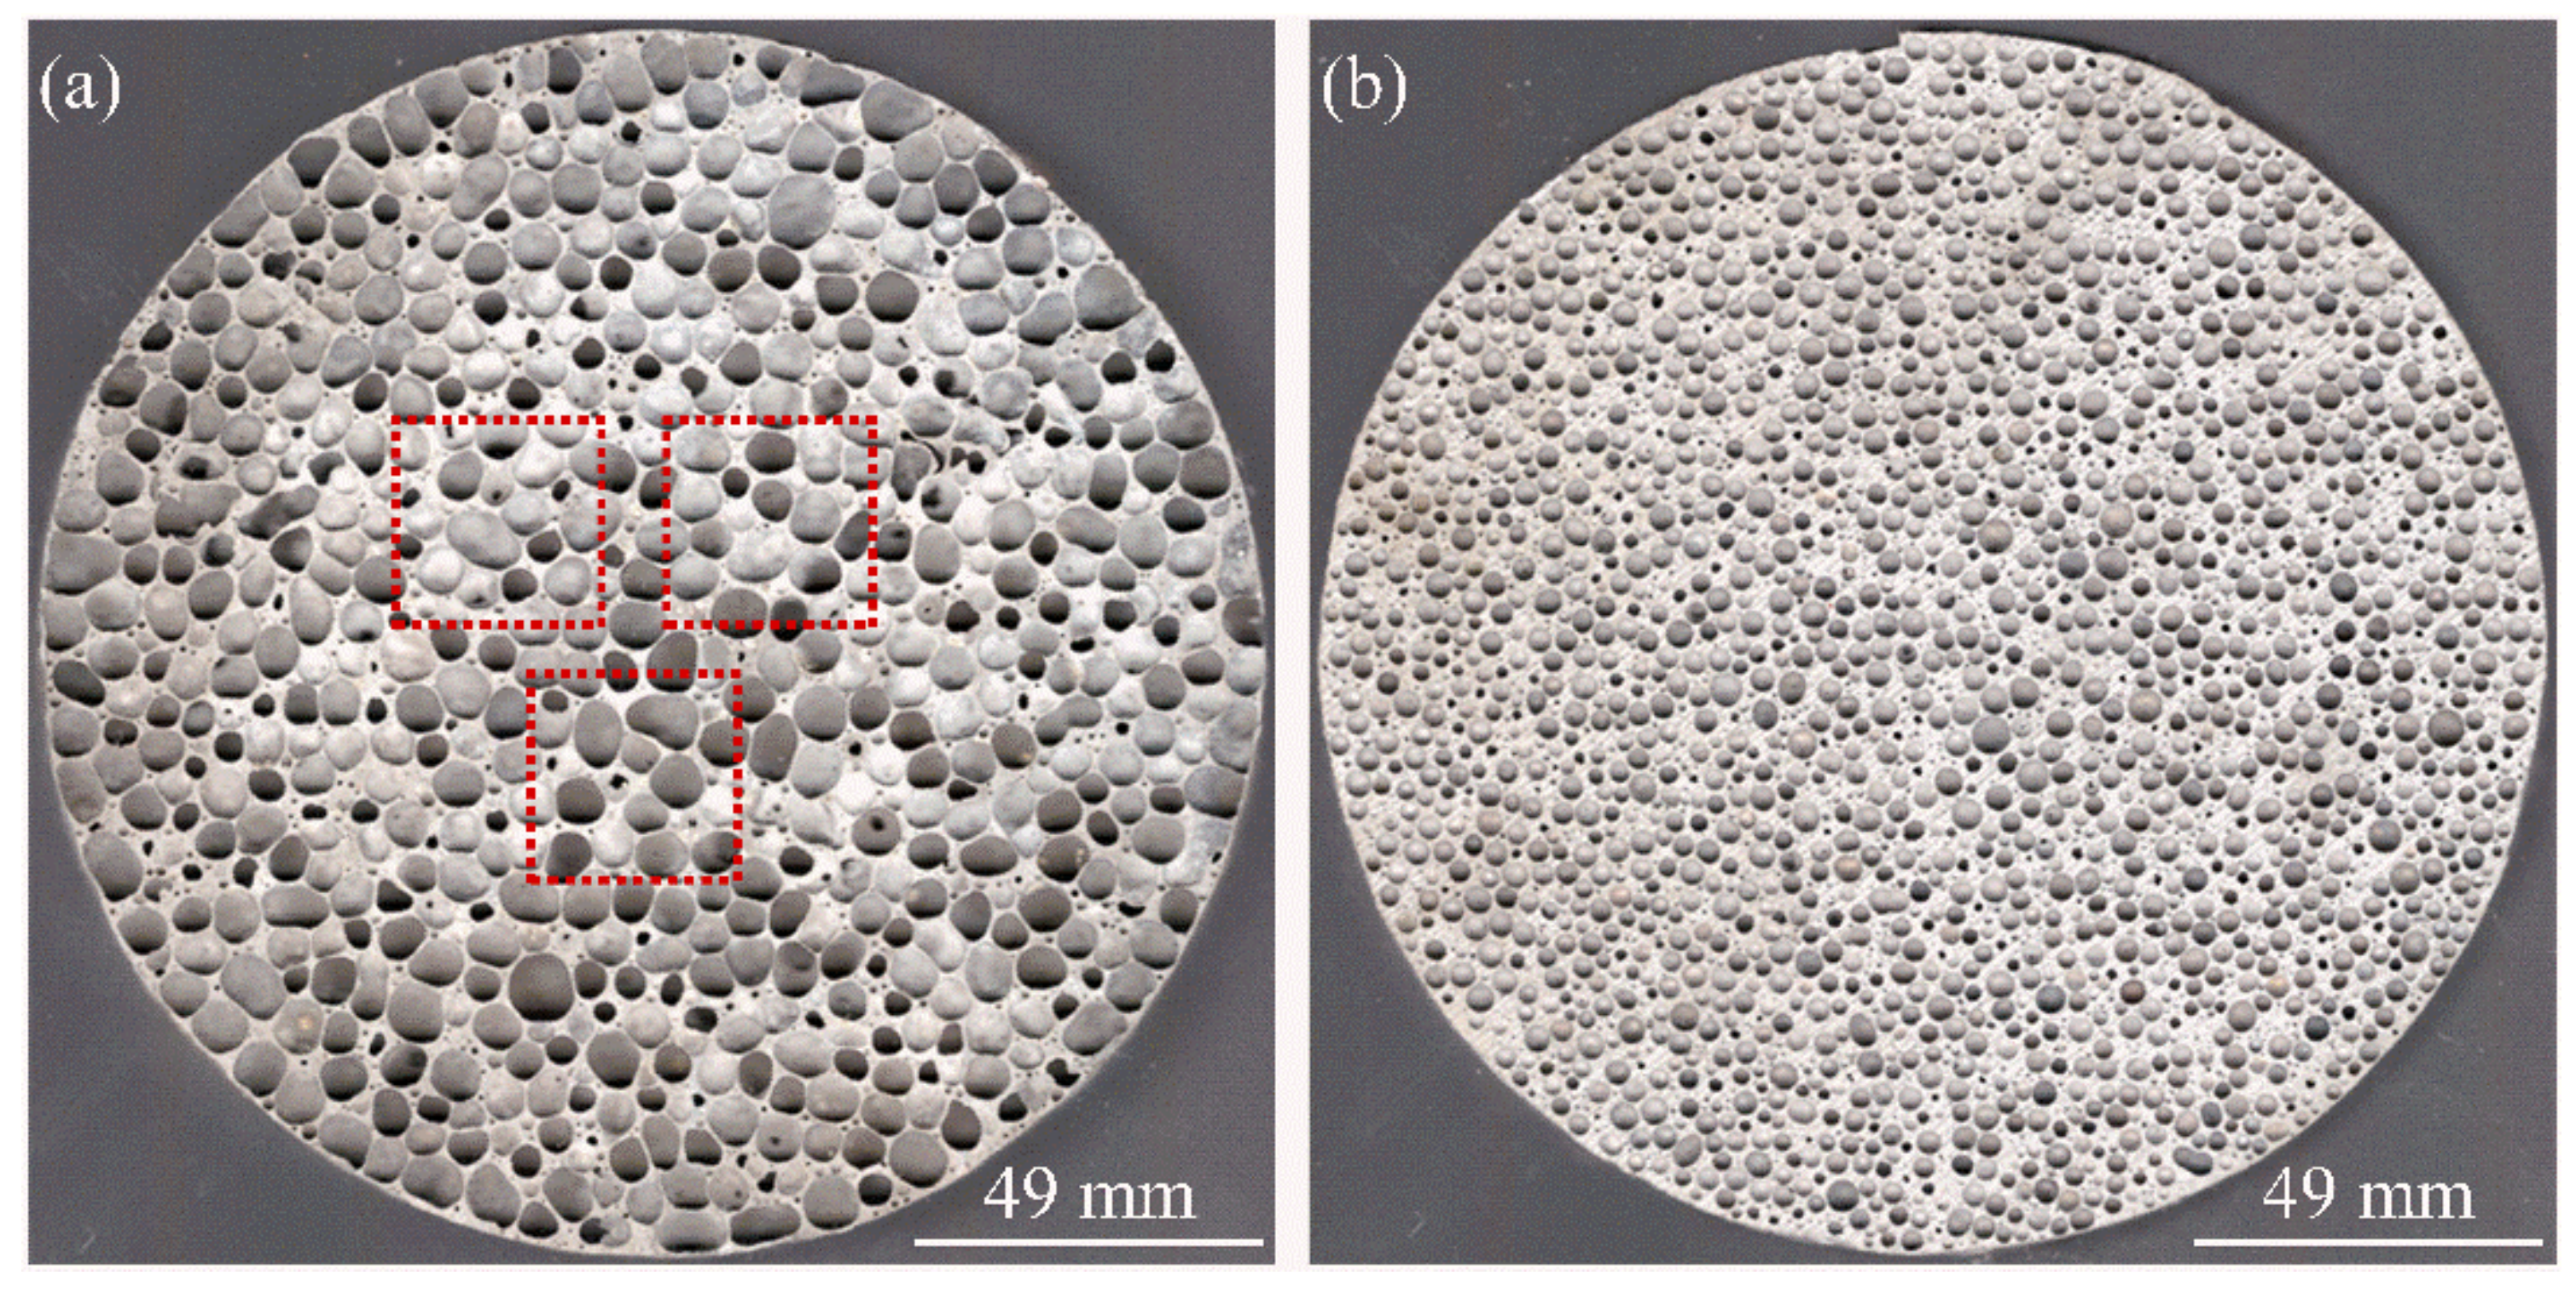
In situ Al-10TiB2 composite ingots were produced by Shandong Binzhou Huachuang Metal Co., Ltd. China. The chemical composition is shown in Table 1. Al-5TiB2 melt was obtained by adding pure aluminum (purity 99.6%) to the Al-10TiB2. First, the composite melt was obtained by heating 2.5 kg of composite placed in a stainless steel round crucible (inner diameter 172 mm and wall thickness 7 mm) in a furnace at 750 °C for 5 h. After the temperature decreased to 720 °C, calcium (2.25%, purity 99.9%) was added to the melt and was then stirred continuously for 5 min at 400 rpm. Then, titanium hydride powder (mean diameter: 22 μm, purity 99.4%, pre-treated at 400 °C for 30 min in air), which was to be used as foaming agent, was introduced into the melt at 690 °C. During this addition, the melt was stirred continuously for 3 min at 1200 rpm to obtain a homogeneous distribution. After this, the melt was held isothermally inside of the furnace in nitrogen at the setting pressure value. Finally, the sample was removed and was allowed to solidify by means of air cooling. The detailed procedure and setup are shown in Ref. [19]. The foaming parameters are shown in Table 2. The fabricated foams will be referred to as xTiB2-yP (x = 5.10; y = foaming pressure). Figure 1 shows the top view of the fabricated cylindrical sample. A total of three 30 × 30 × 30 mm3 specimens were cut from the samples fabricated under each pressure by a wire-cutting machine. The sampling position was the same cross-section in the middle of the cylindrical sample, as shown by the dotted box in Figure 1.
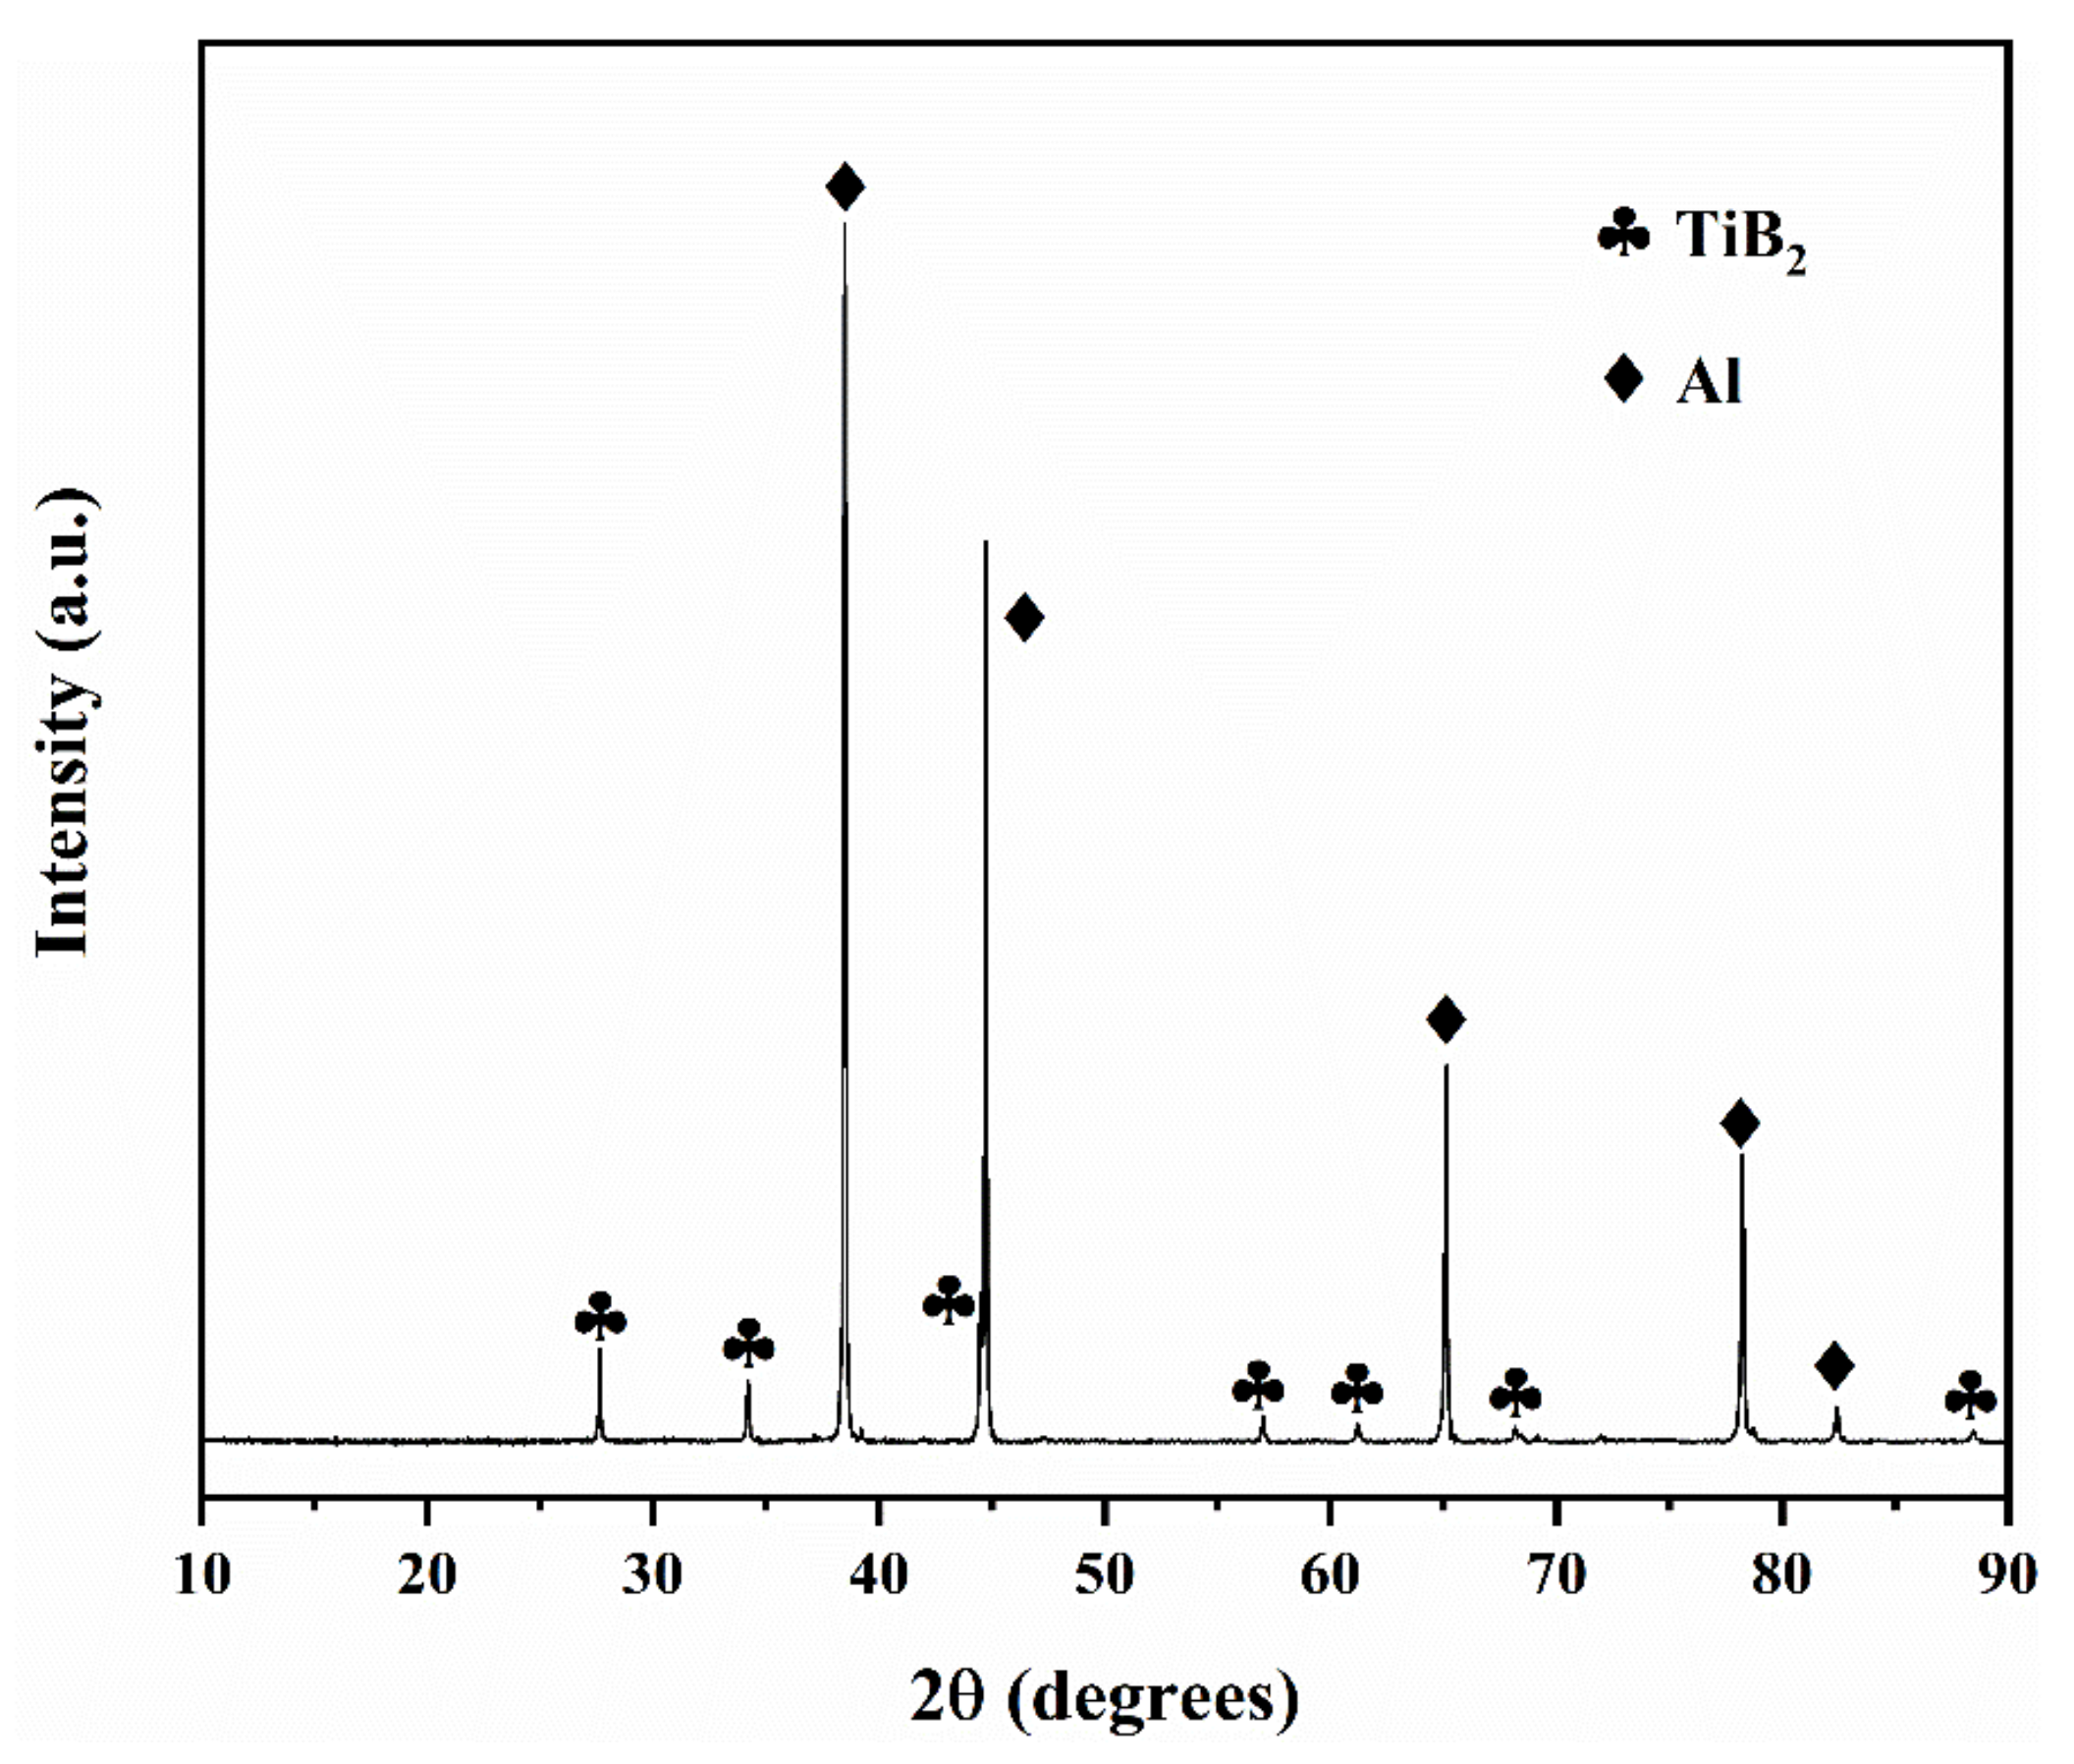
Figure 2 shows the XRD pattern of the Al-10TiB2 composite. The characteristic Al and TiB2 peaks can be observed in the composite.
2.2. Structural and Mechanical Characterization
The density (ρ) measurement of the foams was conducted by dividing their weight by their volume. Relative density (ρ/ρs) is defined as the ratio of the density of the foam to the density of the constituent dense solid (2.73 and 2.79 g/cc were taken as the densities of the 5 and 10TiB2 dense solids) [16]. Macrostructural parameters such as equivalent diameter and cell circularity were characterized using micro-CT (from Dandong Aolong Ray Instrument Group Co. Ltd., Dandong, China). The X-ray tube current and voltage were set to be 90 µA and 90 kV, respectively. The tomographic images of the samples were obtained by rotating the samples 360° in steps of 1°. After each step, radiation projections were performed, and two-dimensional slices were obtained based on the back-projection reconstruction algorithm. The gray threshold was adjusted to clearly identify the cell pores and cell walls in the CT images. Image analysis software (Image-Pro Plus 6.0) was used to measure the above-mentioned structural parameters. The mean cell diameter (Dmean) was determined by the cell size distribution based on the area fraction. The lognormal distribution function fits the cell size distributions better than a Gaussian distribution function [14]. The mean circularity (Cmean) of the cells was determined by calculating the arithmetic average. The reader is referred to Ref. [14] for more details regarding the explanation of the macrostructure. Microstructural analysis was conducted using a scanning electron microscope (SEM: TESCAN MIRA3, TESCAN, Brno, Czech Republic) on the cell walls of the foam before compression testing.
Quasi-static compression tests were conducted in a standard universal testing machine (CMT5105, MTS Systems, Shanghai, China) at a displacement rate of 2 mm/min up to nominal strains of 8%, 20%, and 80%. Extra micro-CT was implemented on the foams that were strained up to 8% (or 6%) and 20%. Note that these two strains approximately correspond to the beginning of the plastic deformation of the samples and to the steady-state plastic deformation regime (or the plateau stage in the stress-strain curve).
3. Results and Discussion
3.1. Foam Macro-Structural Characterization
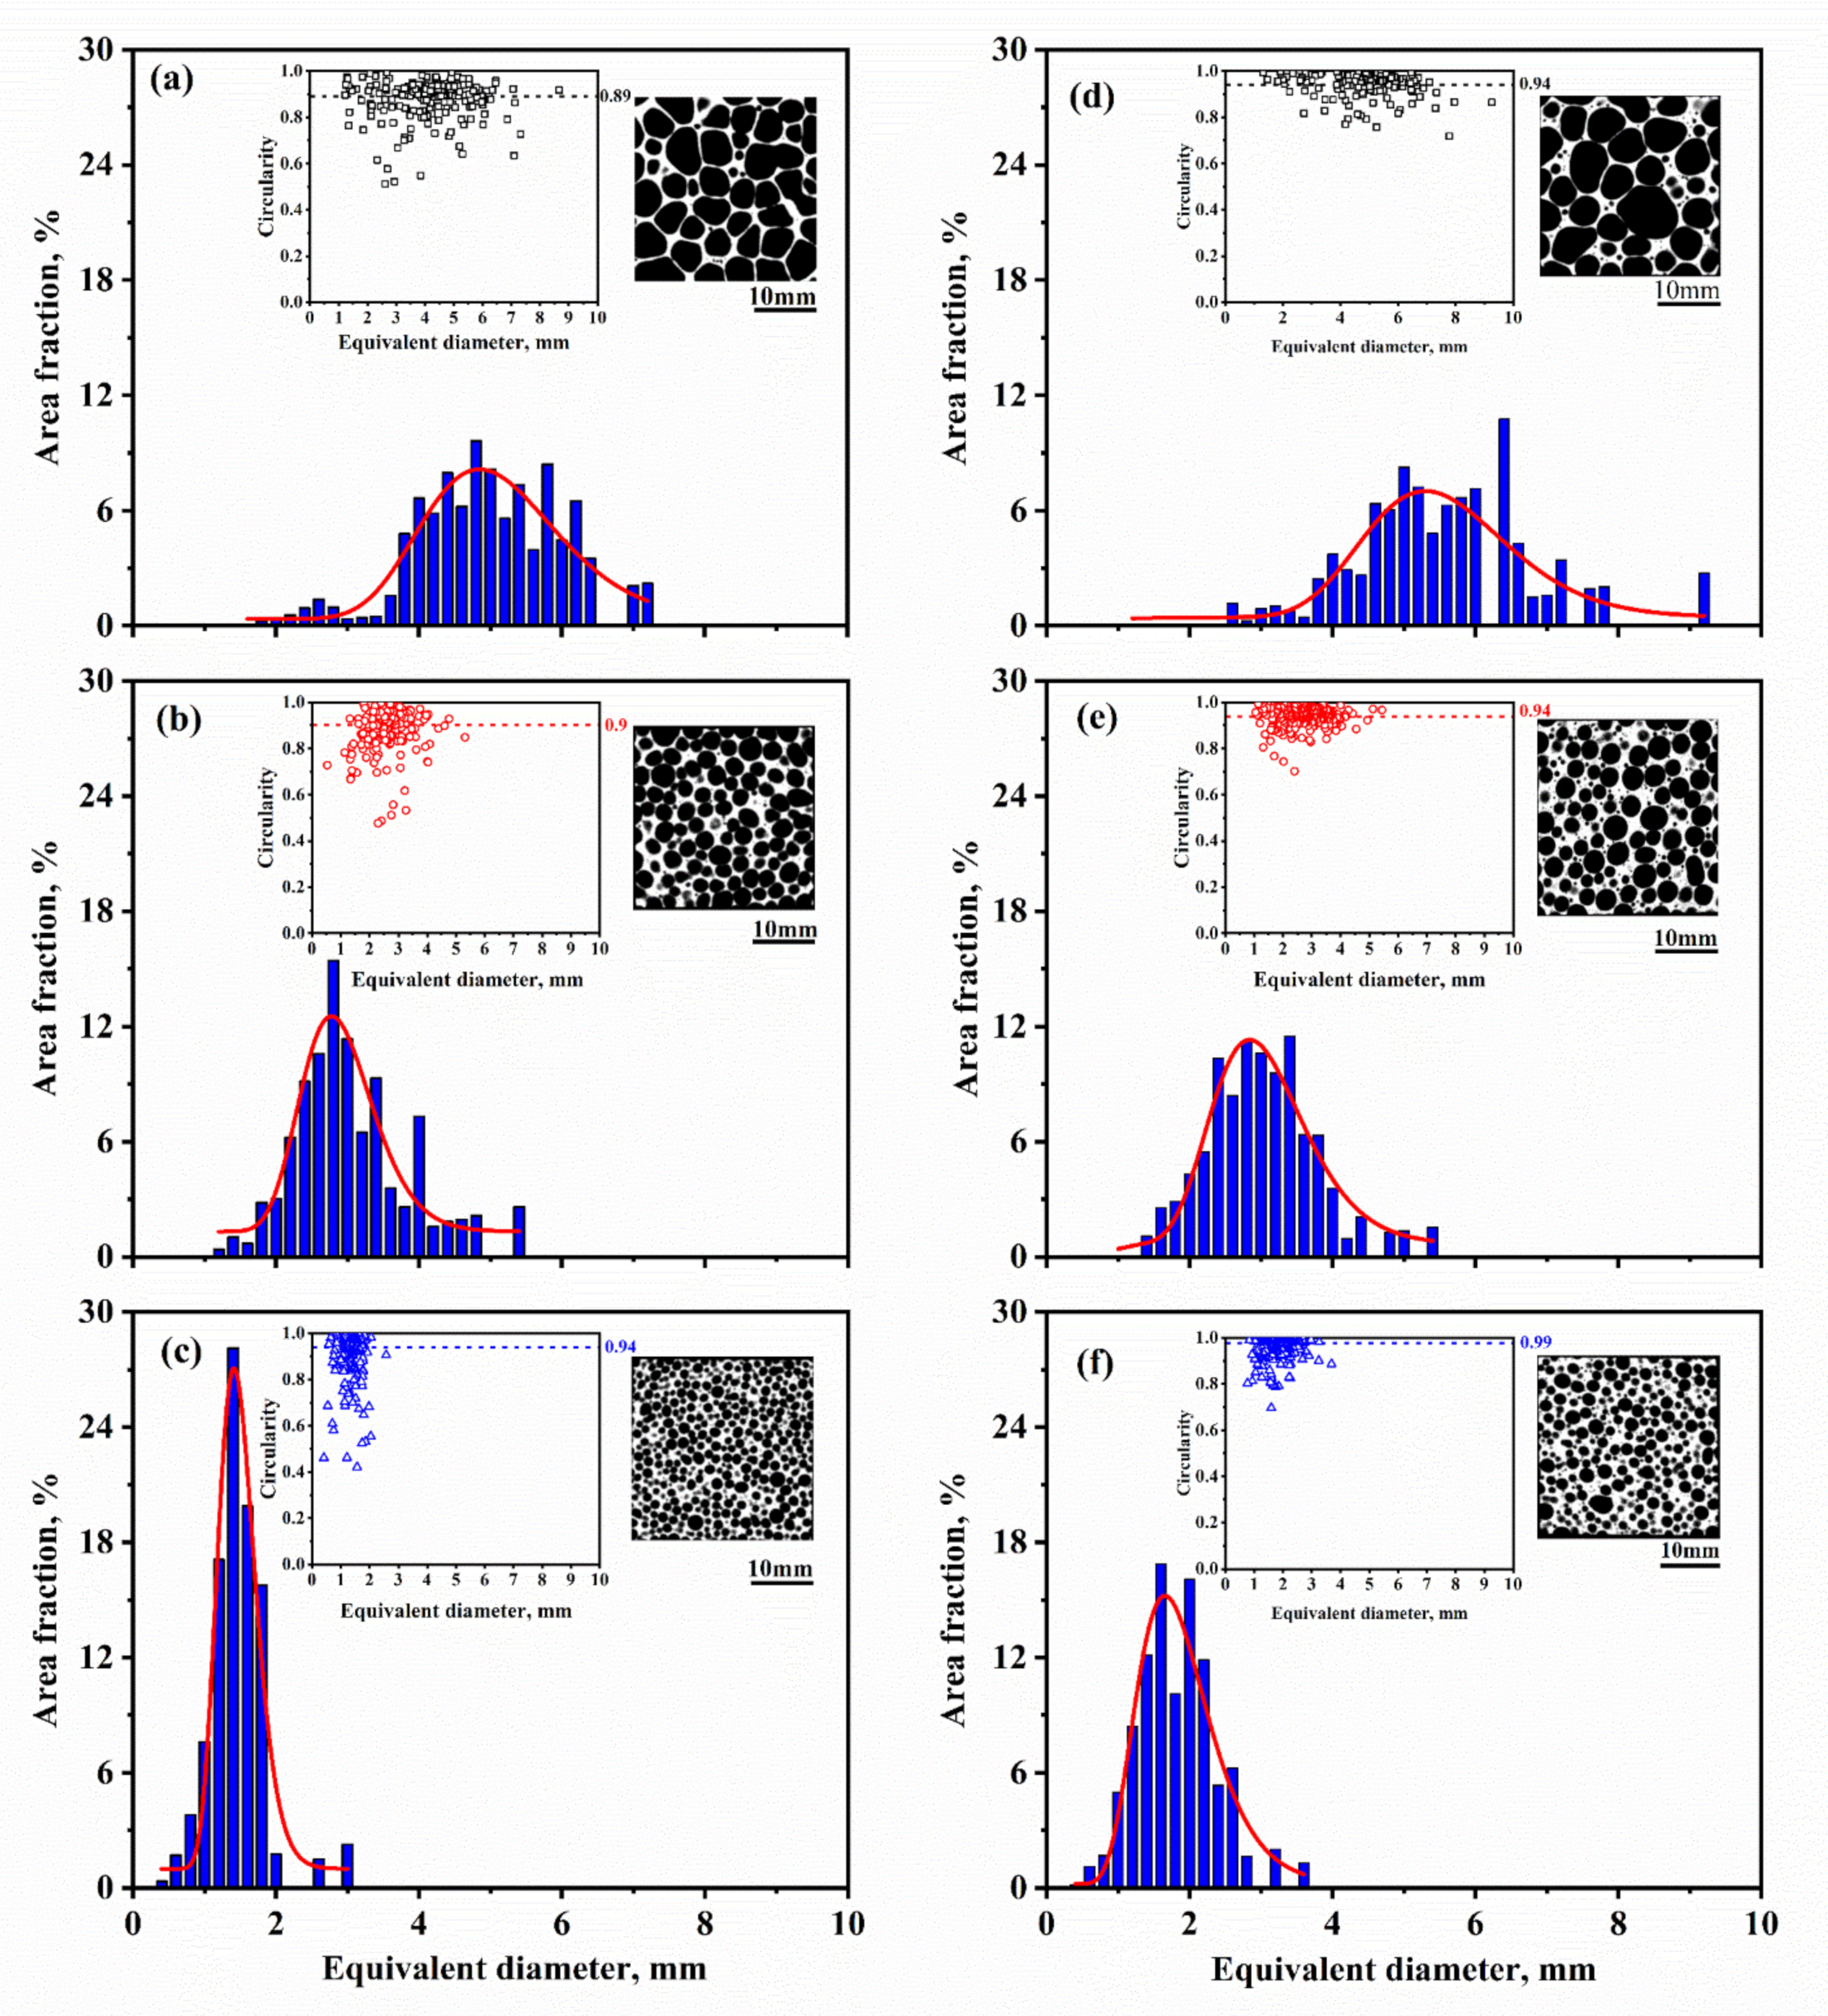
Figure 3 shows the structure and corresponding cell size distribution and circularity of the composite foams fabricated under different pressures. When the foaming pressure increases, there is a significant decrease in the mean cell diameter and the cell size distribution range, leading to a homogeneous cell structure. The reduction of gravity drainage and bubble coalescing under increased pressure is responsible for the homogeneous cell structure [19]. On the other hand, 5TiB2 foams exhibit a narrower cell size distribution range compared to the 10TiB2 foams under the same foaming pressure. Moreover, the circularity increases with the increase of the foaming pressure. When the pressure increases from 0.1 MPa to 0.24 MPa, the circularity values of the 5TiB2 and 10TiB2 foams do not increase much (there is basically no increase). When the pressure increases to 0.4 MPa, the circularity values of the two foams increase significantly. The macrostructural characteristics of composite foams such as ρ, Dmean, and Cmean are listed in Table 3. It can be seen that the 5TiB2 foams exhibit smaller ρ, Dmean, and Cmean compared to the 10 TiB2 foams under the same foaming pressure. In the present paper, the density of the foams is related to the expansion height of the foams because the quality of the samples that have not been cut is the same. It has been reported that 5TiB2 composite foams have better expansion compared to 10TiB2 composite foams [20]. In addition, it has also been claimed that the rupture in cell walls causes bubble coalescence and that this coalescence occurs more frequently in the case of 10TiB2 composite foams compared to 5TiB2 composite foams [20], which results in the mean cell size of the 10TiB2 composite foams being higher than that of the 5TiB2 composite foams for the same foaming pressure.
3.2. Foam Micro-Structural Characterization
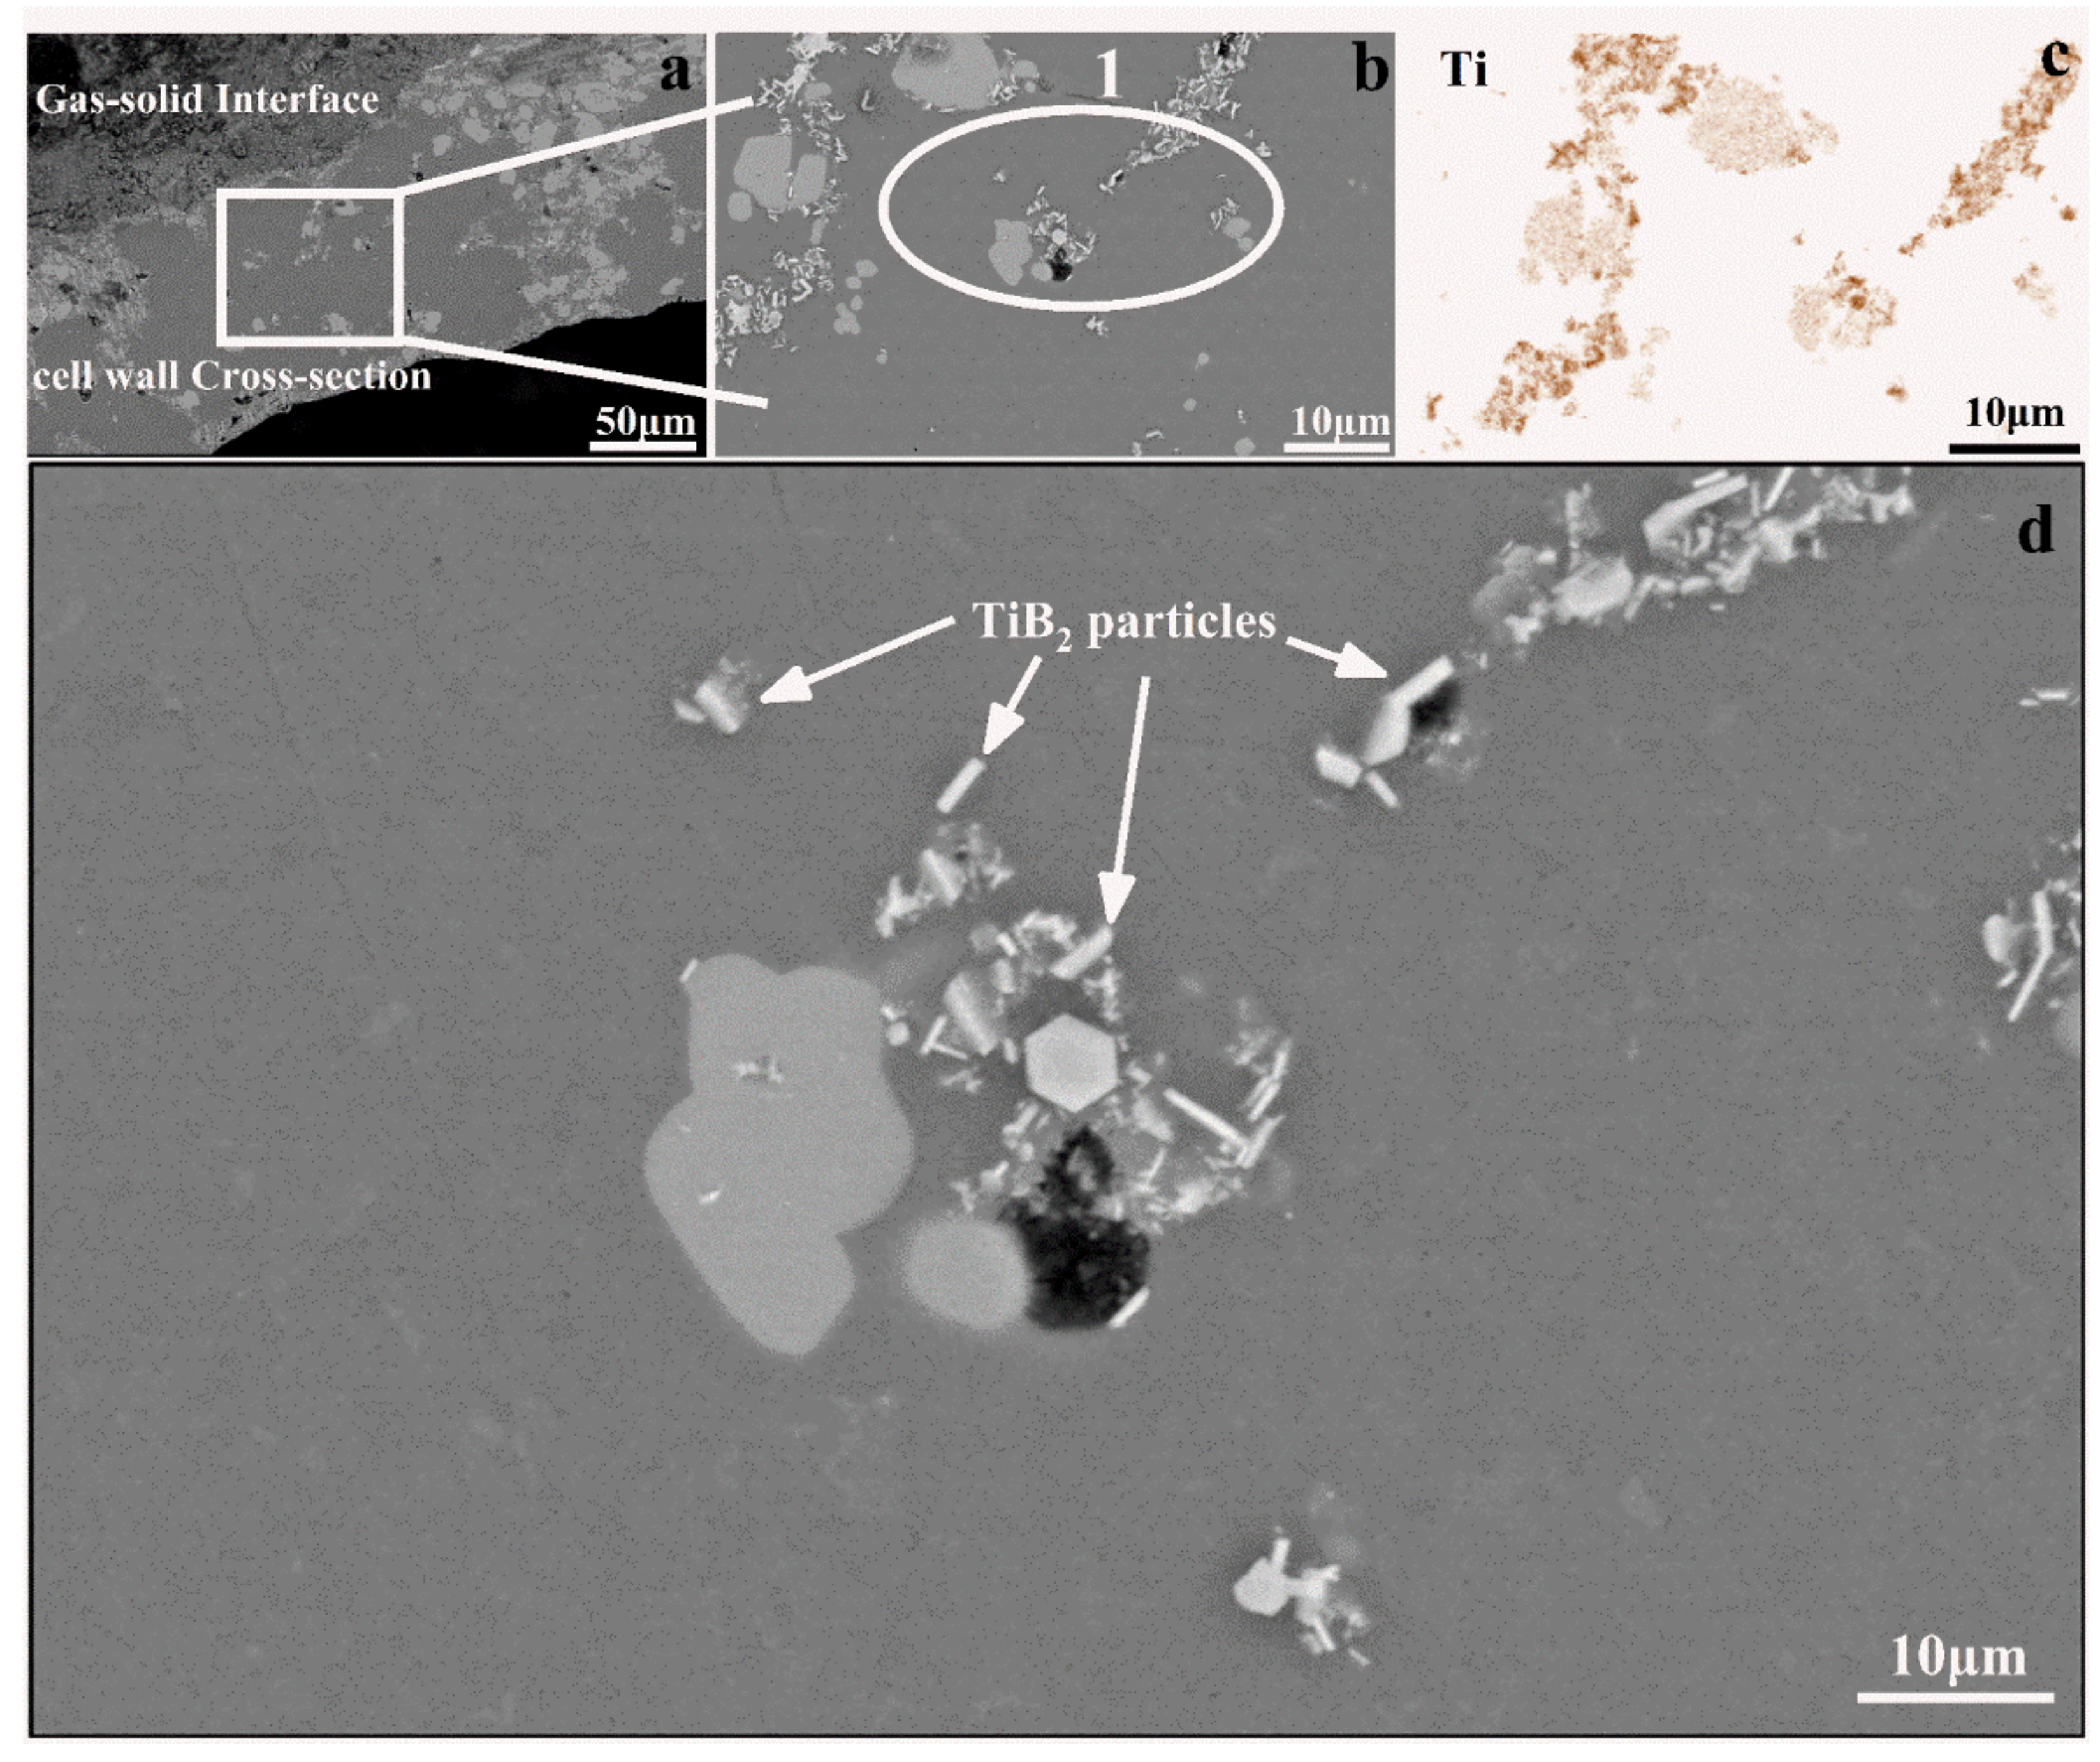
The representative microstructures of the Al-5TiB2 composite foams are shown in Figure 4. It can be clearly observed that the Ti phases are present in the cell wall cross-section from the Ti elemental mapping (Figure 4c). The Ti phases represent TiH2 and TiB2. They can be easily distinguished since they are very different in size (16 μm and 0.9 μm, respectively) [18]. Here, TiB2 particles are more clearly visible, as shown in Figure 4d. Most of the TiB2 particles appear in the form of agglomerates at the cell wall cross-section. It can be determined that the TiB2 particles have a faceted morphology and that the average particle size is 1.2 μm, based on the measurement of the longest dimension of about 120 particles.
SEM images of the 10TiB2-0.4P sample are shown in Figure 5. Figure 5a reveals the macro morphology of the 10TiB2-0.4P sample. Large gas porosities are seen in the cell walls. The gas pores created by gas release are characterized by regularly shaped pores (usually circular) [14]. Figure 5b reveals the microstructure of the gas-metal interface. Figure 5d–f shows the Al, Ca, and Ti elemental mappings of Figure 5b, respectively. The Ti elemental mapping shown in Figure 5f indicates that the TiB2 particles are uniformly distributed on the gas-metal interface. Figure 5c reveals the microstructure of the cell walls showing α-Al grains, Al-Ca-Ti intermetallic compound, and TiB2 particles located between the α-Al grains and the intermetallic compound. Figure 5g–i show the Al, Ca, and Ti elemental mappings from Figure 5c, respectively. From the Ti elemental mapping shown in Figure 5f,i, it can be clearly seen that the TiB2 particles are present in the inter-dendritic regions and around the Al-Ca-Ti intermetallic compound. Grain refinement of α-Al dendrites can be clearly seen from the microstructures due to the presence of TiB2 particles.
Figure 6 compares the pure Al foam (without TiB2) with the Al-TiB2 foams fabricated under the same conditions (0.4 MPa). Figure 6a–c shows the macro morphology of pure Al, Al-5TiB2, and Al-10TiB2, respectively. It can be seen that the average cell size of the Al-TiB2 foams is significantly larger than that of pure Al foam. Figure 6d–f show the micro morphology of the gas-metal interface of pure Al, Al-5TiB2, and Al-10TiB2, respectively. Figure 6g–i show the Ti elemental mappings of (d)–(f), respectively. From the Ti elemental mappings, it can be seen that the Ti content of the pure Al foam is significantly less than that of the Al-TiB2 foams, which indicates that the TiB2 particles are uniformly distributed on the cell walls of the Al-TiB2 foams.
3.3. Deformation Initiation
Tomographs obtained from the 5TiB2 and 10TiB2 foams that were deformed with up to 8% (or 6%) and 20% strain are shown in Figure 7 and Figure 8, respectively. At 8% (or 6%) strain, the cell walls of the 5TiB2 (or 10TiB2) plastically buckle perpendicular to the load direction, and some cell walls produce slight buckling parallel to the load direction, as shown by the arrows and ellipse zones. However, in the case of 10TiB2-0.24P and 10TiB2-0.4P, the plastic deformation is not obvious. At 20% strain, the deformation band (the zone between the two red lines) is a mixture of both ductile and brittle in nature in the case of 5TiB2-0.1P since both buckling and cracking of thin cell walls can be observed. However, for 10TiB2-0.1P, the obvious cracking of the cell walls can be observed in the deformation band, which is consistent with the report that the cell wall of 10TiB2 foams is highly brittle in nature [16]. For 5TiB2-0.1P and 10TiB2-0.1P, the site of the onset of local deformation usually initiates at larger cells generating a concentration of stress in adjacent areas [21,22]. Nevertheless, 10TiB2-0.24P and 10TiB2-0.4P foams form deformation bands at 45 degrees to the compression direction. The 5TiB2-0.24P and 5TiB2-0.4P foams show approximately horizontal deformation bands. This may be related to the nature of the cell wall material. It is reported that the 10TiB2 foams are very brittle in nature during compression, while such brittleness is not so prominent in the 5TiB2 composite foams [16,20]. Therefore, 10TiB2 foams tend to experience shear deformation.
3.4. Compression Behavior
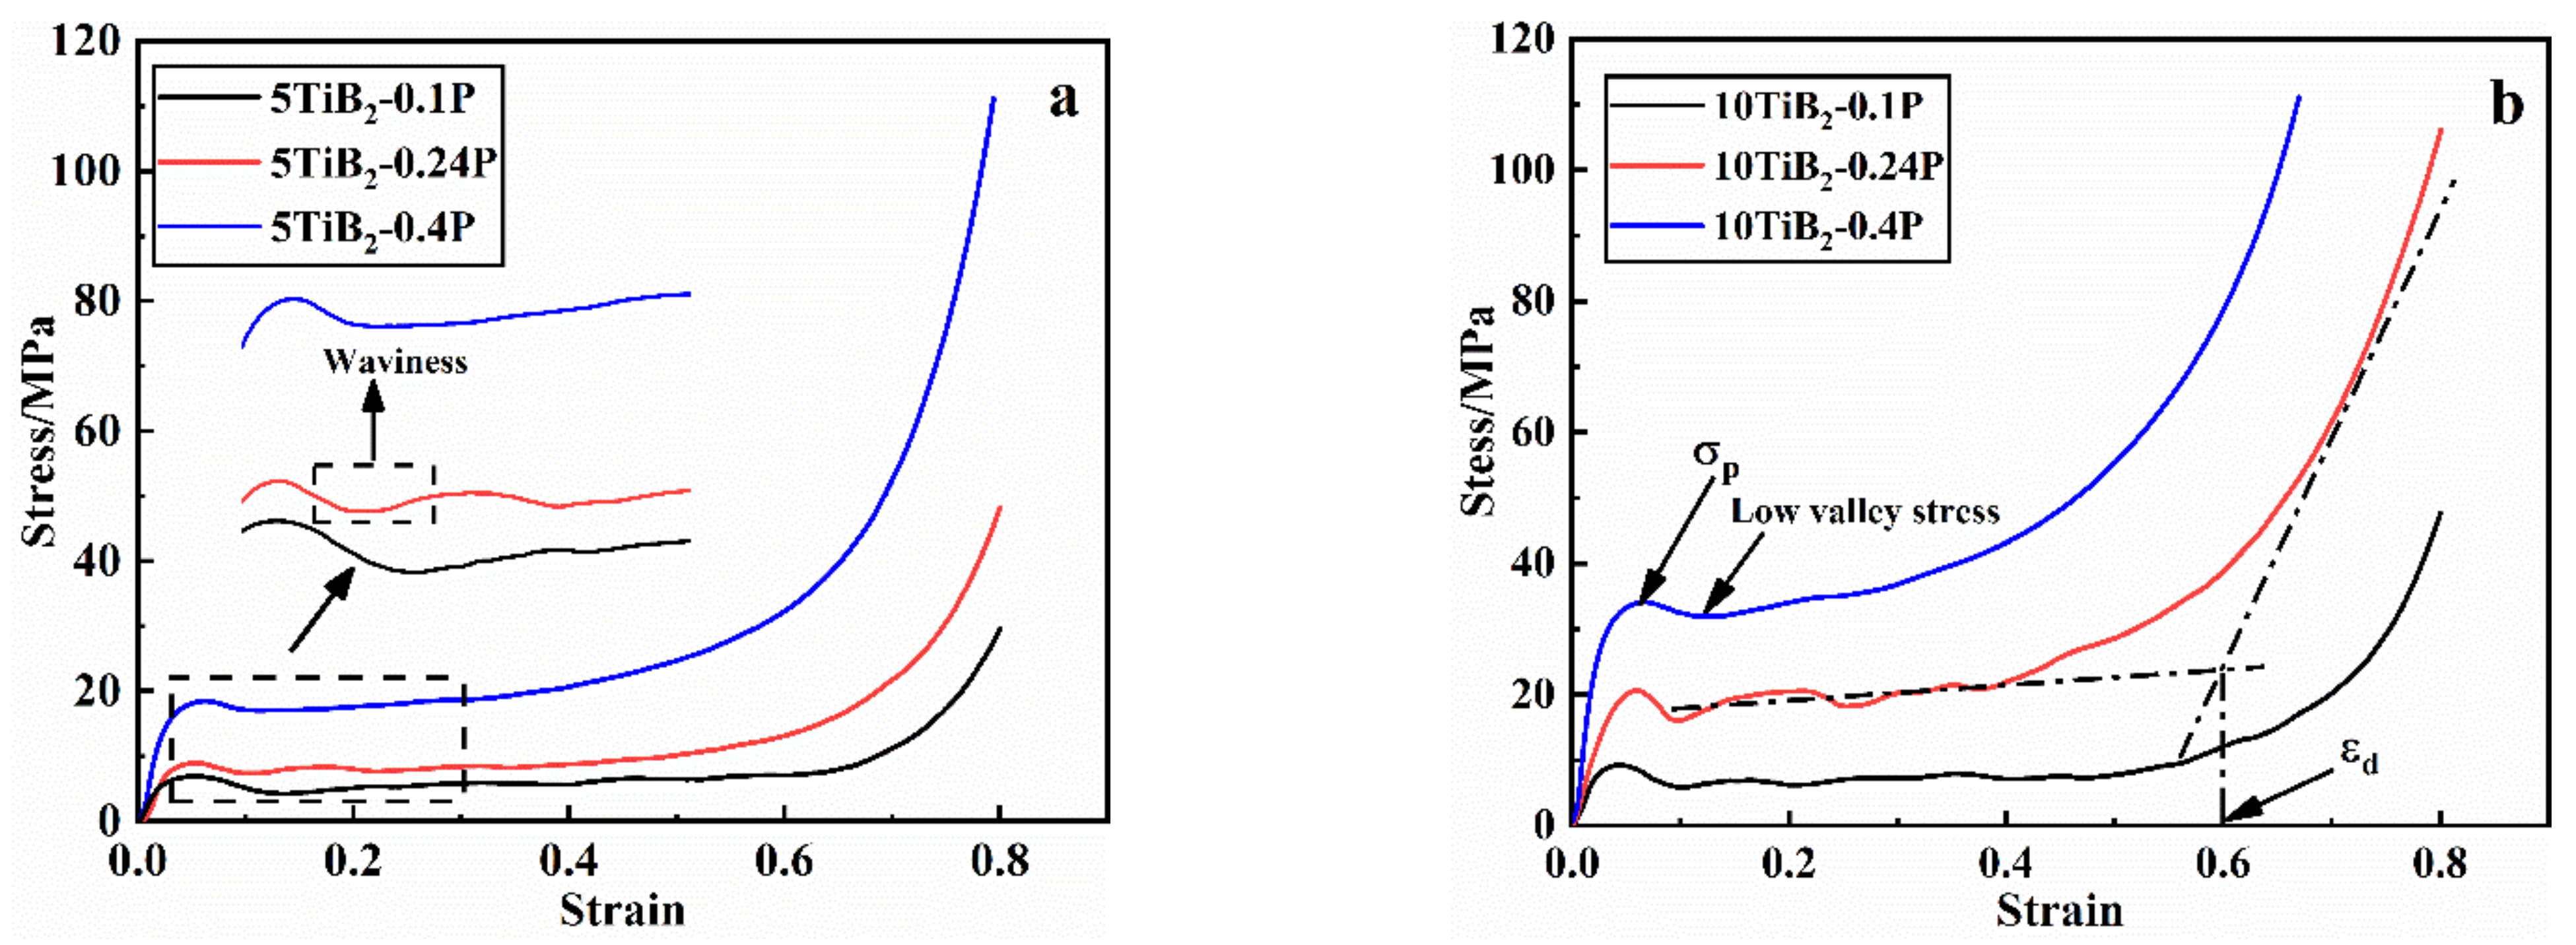
The typical stress-strain curves of all of the composite foams are shown in Figure 9. All the of the curves show three regions: a linear elastic region at the initial stage, a plateau region with nearly constant flow stress, and a densification region where the stress rapidly increases. The waviness of the stress-strain curve becomes smooth as the cell size is refined. The first peak value in the stress-strain curve was chosen as the yield strength σp. Rsd was defined as the stress drop ratio [(difference of σp and low valley stress)/σp] [6]. The densification strain εd was determined by finding the intersection point of two lines. The first one was the linear fit to the plateau region, and the second one was the tangent to the densification region, as explained in Ref. [14]. Energy absorption W is the area under the stress-strain curve up to εd and is calculated by following equation [23]:
The yield strength (σp) of metal foams is directly related to the density and the strength of the solid constituent. For this, the σp values of all of the foams were normalized by the (ρr)n in order to eliminate the effect of density. The exponent n was selected as 1.5 and 2 according to Refs. [14,23]. The corresponding normalized values and compressive properties such as σp, Rsd, εd, and W are given in Table 4.
The deformation mode of foams is the main reason that waviness of the stress-strain curves is induced. Observation of the final deformation stages can elucidate this (see Figure 7 and Figure 8). The crushed bands of the 5TiB2-0.1P and 10TiB2-0.1P foams are formed due to the complete collapse of a layer of cells. The crushed bands of the 5TiB2-0.24P and 10TiB2-0.24P foams are formed by the simultaneous collapse of three layers of cells. The crushed bands of the 5TiB2-0.4P and 10TiB2-0.4P foams are formed by the simultaneous collapse of six and five layers of cells, respectively. The collapse of single-layer cell leads to larger stress drop ratio and fluctuations of the stress-strain curves. However, as the cell size is refined, the simultaneous crush of multiple cells decreases the stress drop ratio and smooths the stress-strain curves.
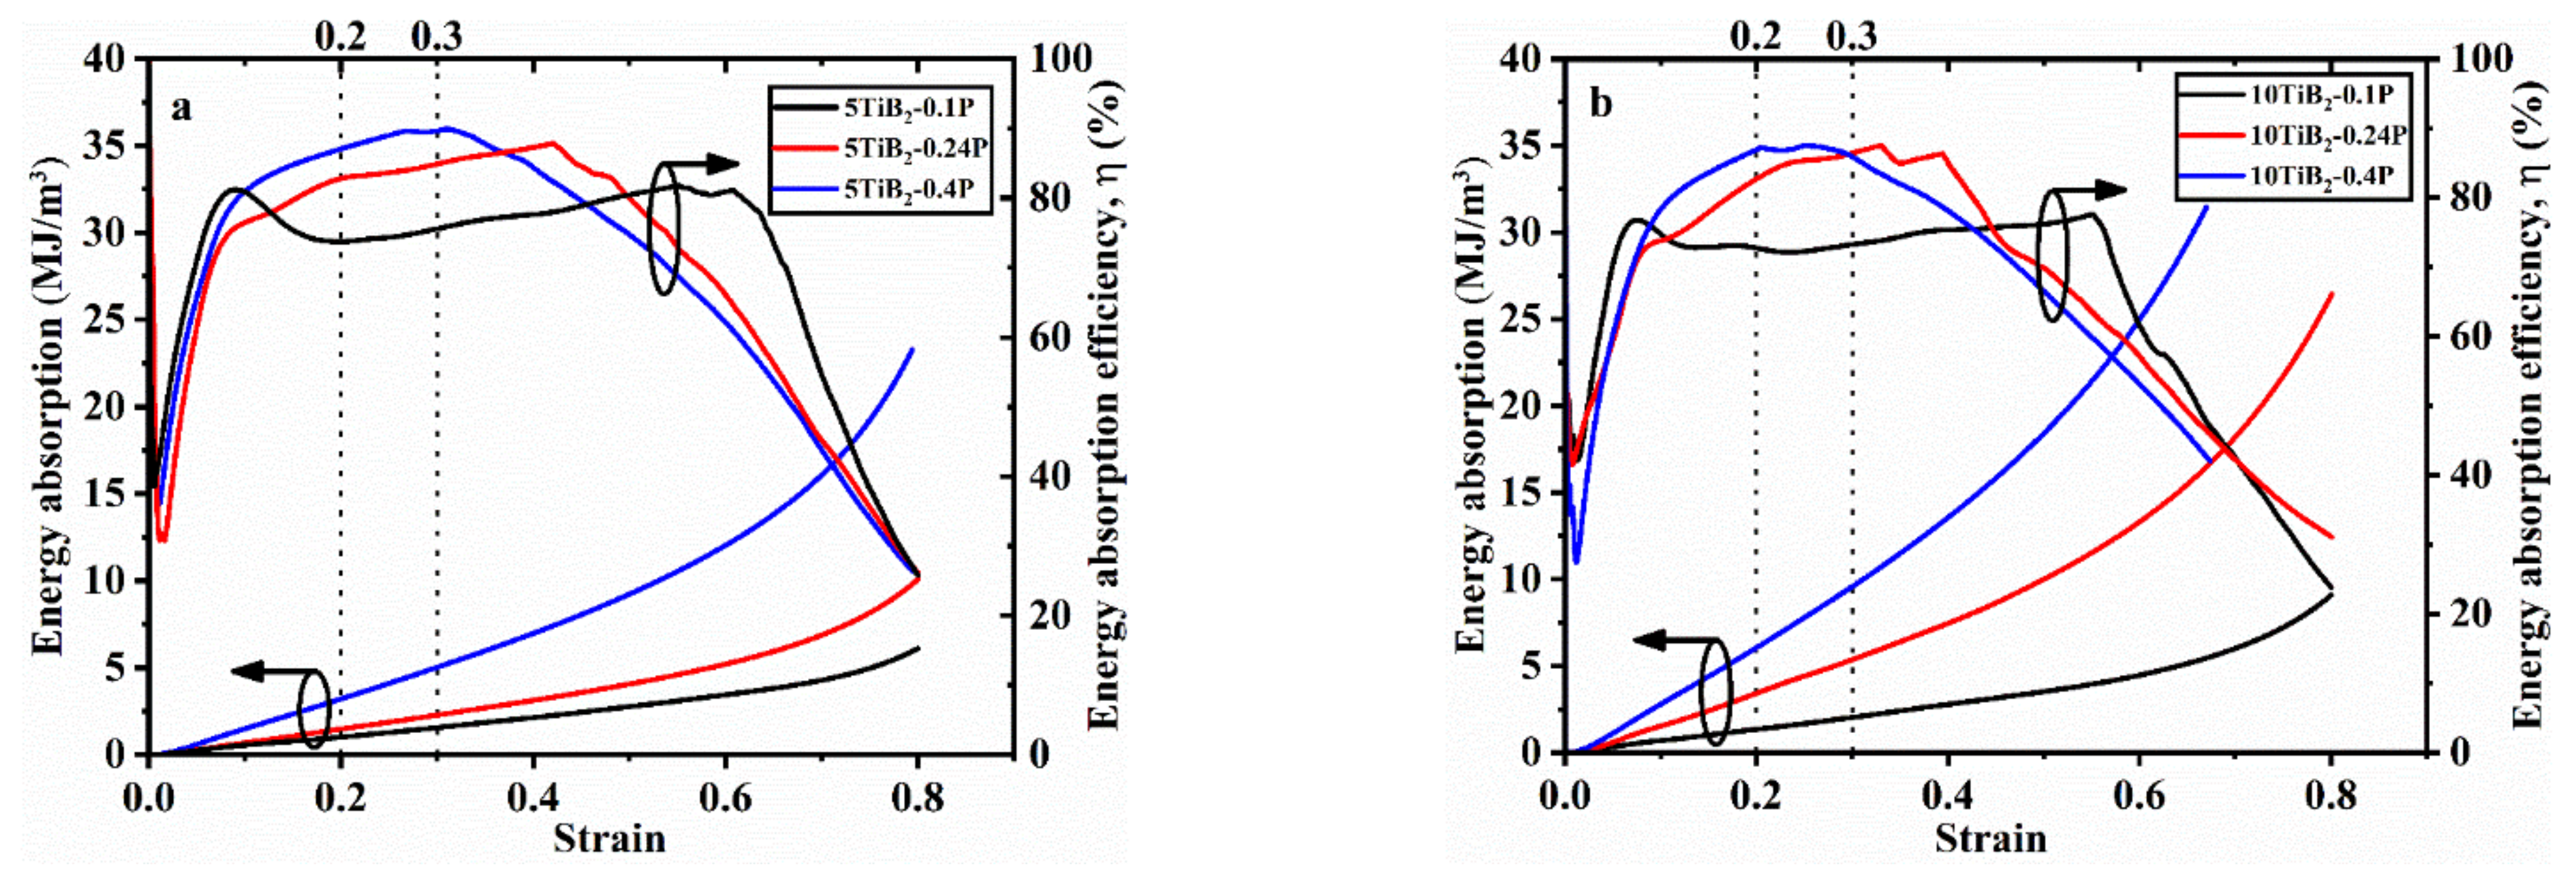
The energy absorption and energy absorption efficiency (η) curves of the foams are shown in Figure 10. η is obtained by the following equation [14]:
where σmax(ε) is the maximum stress up to the strain ε. The W and η (maximum value in the curves) are displayed in Table 4. Note that for ideal foams exhibiting a constant plateau stress in compression, η = 1 (or 100%), whereas η = 0.5 (or 50%) for elastic-brittle solids [24]. As seen in Figure 10, when the foaming pressure increases, the energy absorption of both the 5TiB2 and 10TiB2 foams increases. This is due to the increase of density, which increases the compressive stress. For the 5TiB2-0.1P and 10TiB2-0.1P foams, the η reaches 0.81 and 0.77 when yielding occurs. Afterwards, it reduces due to the strain softening and reaches 0.82 and 0.78 at the end of the plateau stage. Finally, there is a significant drop due to the compaction of the foams. For the 5TiB2-0.24P and 10TiB2-0.24P foams, the η reaches 0.75 and 0.73 when yielding occurs. Later, it rises to 0.88 and 0.87 and drops significantly during the densification stage. For the 5TiB2-0.4P and 10TiB2-0.4P foams, the η reaches 0.79 and 0.75 when yielding occurs. Later, it rises to 0.90 and 0.88 and drops significantly during the densification stage.
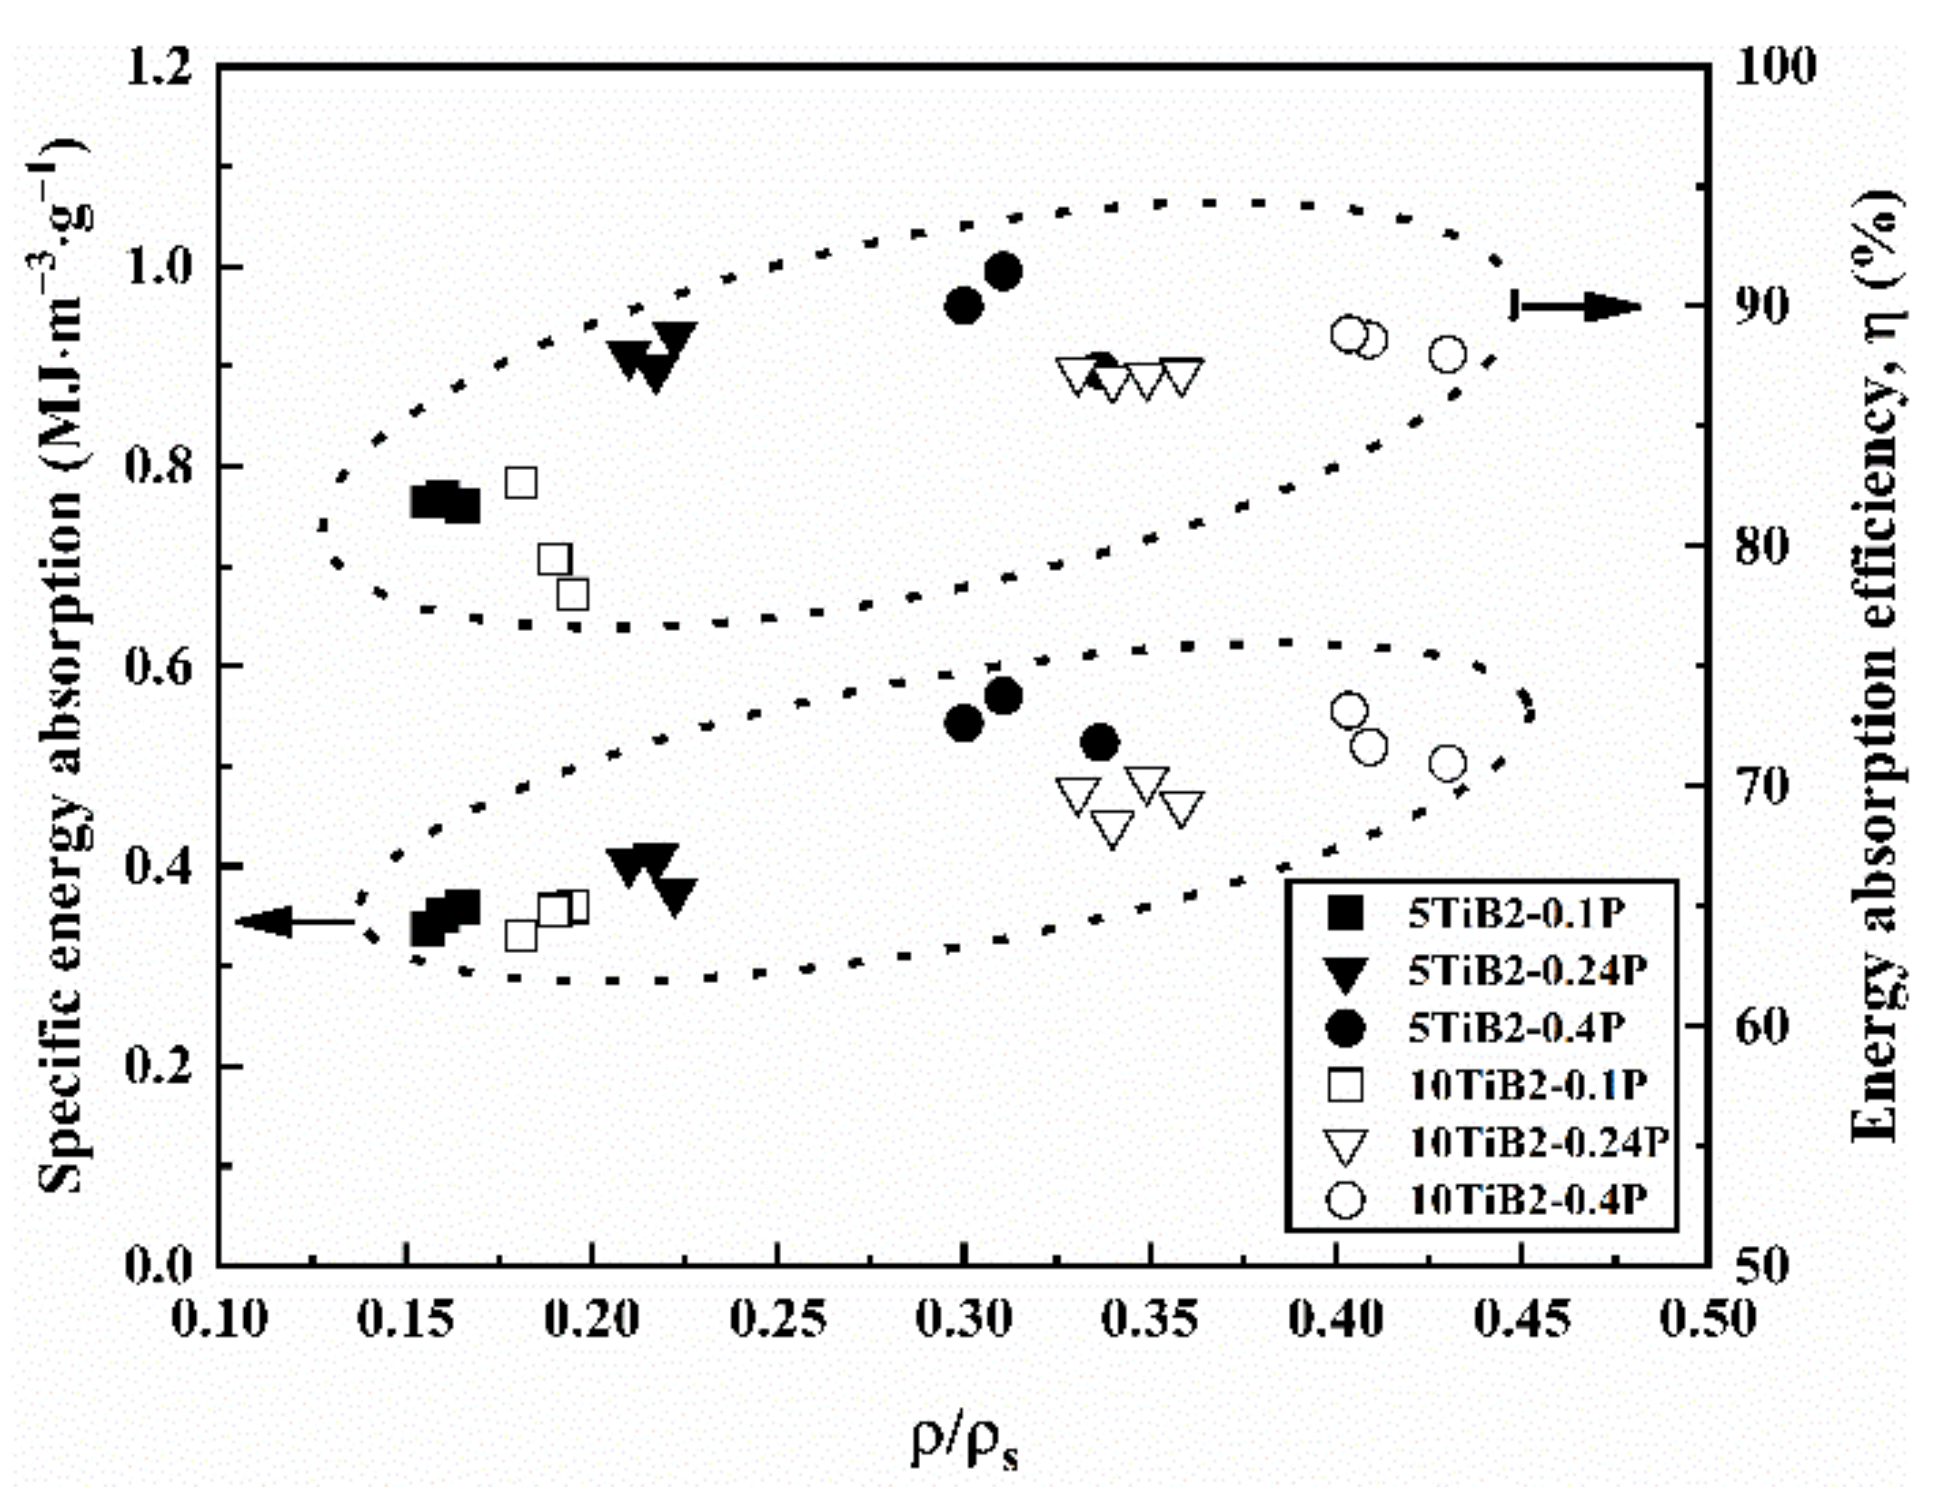
The specific energy absorption (SEA) and η versus the relative density of the composite foams with different cell structures are shown in Figure 11. The SEA provides a criterion for the comparison of energy absorbers in their ability to absorb the deformation energy. It can be formulated in several bases, including per unit and volume. The SEA per unit mass is expressed as:
where m is the structure’s total mass. It can be seen that the SEA and η of the composite foams increases when the relative density increases. The energy absorption efficiency is related to the smoothness of the plateau stage in the stress-strain curves. As the pressure increases, a uniform cell structure with fine bubbles is obtained (see Figure 3). This leads to the simultaneous crush of multiple cells (see Figure 7 and Figure 8) and the decrease of fluctuations in the stress-strain curves when pressure increases. As a result, the energy absorption efficiency increases with increasing pressure. In addition, the energy absorption efficiency of the 5TiB2 foam is superior to that of the 10TiB2 foam, as shown in Figure 11. The ductile and brittle deformation nature for the 5TiB2 and 10TiB2 foams, respectively, are shown in Figure 7 and Figure 8, which can support this result.
3.5. Comparisons
The yield strength of a closed-cell aluminum foam is related to the cell edge bending and cell face stretching. Gibson and Ashby derived an equation for the yield strength σp of a foam in terms of the foam relative density and properties of the base material [8]:
where σs and ρs are the yield stress and density for the base material, respectively. The term is the solid fraction that is contained in the cell edges (), and the remaining fraction () occupies the cell faces.
If the solid fraction in the cell edges is taken as 100%, the foam is open cell, and the equation can be written as follows:
Usually, the values of are between 0.65 and 0.85 [25,26]. However, is set to 0.75 to compare the experimental results [27,28]. On this basis, the foregoing equation can be written as follows:
In another study, Simone and Gibson proposed a similar equation using finite element analysis [29,30]:
The comparison of the experimental data with the prediction models is shown in Figure 12. The yield strength of the base material is taken to be the reference value (150 MPa and 200 MPa for 5TiB2 and 10TiB2, respectively) [16]. The discrete points shown in Figure 12 are the experimental data of the composite foams fabricated under different pressures. It is clear that the strength of the composite foams fabricated under the condition of less 0.20 MPa is slightly lower than the prediction (6). As shown in Equation (4), the contribution from cell edge bending to the overall strength of the foam is by a term that is non-linear in the relative density, while the contribution from cell face stretching is linear in the relative density. In addition, the relative density is much less than 1. Therefore, the influence of cell wall geometry on strength is particularly important. The discrepancy between the experimental data and the prediction model (6) is mainly due to defects, such as cell wall curvature and corrugation, porous inclusions, holes, fractured cell walls, and non-uniform distribution of local density [4,25,27,31]. According to reports, when the ratio (L/2R) of the cell wall length (L) to the curvature radius (R) increases from 0 to 0.5, the strength of closed-cell foams is reduced by 32% to 55% compared to foams with a flat cell wall [32]. However, for composite foams fabricated under the condition of 0.40 MPa, the specific strength is essentially consistent with the prediction model (6). This may be due to the uniform cell structure obtained under increased pressure (see Figure 3), resulting in a reduction in the pressure difference between adjacent cells, which helps to obtain a flat cell wall.
4. Conclusions
We have demonstrated that increased pressure is a good strategy for enhancing the mechanical properties of in situ Al-xTiB2 (x = 5, 10 wt.%) composite foams through the refinement of the cell structure. It was discovered that the mean cell size decreases, and the cell size distribution narrows with increasing pressure. The study of the stages of deformation revealed that uniform cell structure causes the simultaneous deformation of multi-layer cells, which leads to an improvement in energy absorption efficiency. Moreover, in composite foams fabricated under the condition of 0.40 MPa, the specific strength is mostly consistent with the prediction of G&A model.
Author Contributions
Y.Y.: methodology, investigation, validation, formal analysis, writing—original draft; Z.C.: conceptualization, writing—review and editing, validation, formal analysis, supervision; J.W.: methodology, software; G.T.: investigation, methodology; Y.M.: methodology. All authors have read and agreed to the published version of the manuscript.
Funding
This research was funded by State Administration of Science. Technology and Industry for National Defense, grant number JCKY2018110C051.
Institutional Review Board Statement
Not applicable.
Informed Consent Statement
Not applicable.
Data Availability Statement
The data that support the findings of this study are available from the corresponding author upon reasonable request.
Acknowledgments
This work was financially supported by the State Administration of Science, Technology and Industry for National Defense Project JCKY2018110C051. The authors gratefully acknowledge this organization for their financial support.
Conflicts of Interest
The authors declare that they have no known competing financial interest or personal relationships that could have appeared to influence the work reported in this paper.
References
- Miyoshi, T.; Itoh, M.; Akiyama, S.; Kitahara, A. ALPORAS Aluminum Foam: Production Process, Properties, and Applications. Adv. Eng. Mater. 2000, 2, 179. [Google Scholar] [CrossRef]
- Banhart, J. Light-Metal Foams-History of Innovation and Technological Challenges. Adv. Eng. Mater. 2013, 15, 82. [Google Scholar] [CrossRef]
- Francisco, G.M. Commercial Applications of Metal Foams: Their Properties and Production. Materials 2016, 9, 85. [Google Scholar] [CrossRef]
- Sugimura, Y.; Meyer, J.; He, M.Y.; Bart-Smith, H.; Grenstedt, J.; Evans, A.G. On the mechanical performance of closed cell Al alloy foams. Acta Mater. 1997, 45, 5245. [Google Scholar] [CrossRef]
- Jeon, I.; Asahina, T. The effect of structural defects on the compressive behavior of closed-cell Al foam. Acta Mater. 2005, 53, 3415. [Google Scholar] [CrossRef]
- Mu, Y.; Yao, G.; Luo, H. Effect of cell shape anisotropy on the compressive behavior of closed-cell aluminum foams. Mater. Des. 2010, 31, 1567. [Google Scholar] [CrossRef]
- Saadatfar, M.; Mukherjee, M.; Madadi, M.; Schroder-Turk, G.E.; Garcia-Moreno, F.; Schaller, F.M.; Hutzler, S.; Sheppard, A.P.; Banhart, J.; Ramamurty, U. Structure and deformation correlation of closed-cell aluminium foam subject to uniaxial compression. Acta Mater. 2012, 60, 3604. [Google Scholar] [CrossRef]
- Gibson, L.J.; Ashby, M.F. Cellular Solids: Structure and Properties; Cambridge University Press: Cambridge, UK, 1997. [Google Scholar]
- Bart-Smith, H.; Bastawros, A.F.; Mumm, D.R.; Evans, A.G.; Sypeck, D.J.; Wadley, H.N.G. Compressive deformation and yielding mechanisms in cellular Al alloys determined using X-ray tomography and surface strain mapping. Acta Mater. 1998, 521, 3583. [Google Scholar] [CrossRef]
- Maire, E.; Fazekas, A.; Salvo, L.; Dendievel, R.; Youssef, S.; Cloetens, P.; Letang, J.M. X-ray tomography applied to the characterization of cellular materials. Related finite element modeling problems. Compos. Sci. Technol. 2003, 63, 2431. [Google Scholar] [CrossRef]
- Maire, E.; Elmoutaouakkil, A.; Fazekas, A.; Salvo, L. In situ X-ray tomography measurements of deformation in cellular solids. MRS Bull. 2003, 28, 284. [Google Scholar] [CrossRef]
- Ashby, M.F.; Evans, A.G.; Fleck, N.A.; Hutchinson, J.W.; Wadley, H.N.G. Metal Foams: A Design Guide; Butterworth Heinemann: Oxford, UK, 2000. [Google Scholar]
- Toda, H.; Ohgaki, T.; Uesugi, K.; Kobayashi, M.; Kuroda, N.; Kobayashi, T.; Niinomi, M.; Akahori, T.; Makii, K.; Aruga, Y. Quantitative assessment of microstructure and its effects on compression behavior of aluminum foams. Metall. Mater. Trans. A-Phys. Metall. Mater. Sci. 2006, 37, 1211. [Google Scholar] [CrossRef]
- Mukherjee, M.; Ramamurty, U.; Garcia-Moreno, F.; Banhart, J. The effect of cooling rate on the structure and properties of closed-cell aluminium foams. Acta Mater. 2010, 58, 5031. [Google Scholar] [CrossRef]
- Ohgaki, T.; Toda, H.; Kobayashi, M.; Uesugi, K.; Niinomi, M.; Akahori, T.; Kobayash, T.; Makii, K.; Aruga, Y. In situ observations of compressive behaviour of aluminium foams by local tomography using high-resolution X-rays. Philos. Mag. 2006, 86, 4417. [Google Scholar] [CrossRef]
- Atturan, U.A.; Nandam, S.H.; Murty, B.S.; Sankaran, S. Deformation behaviour of in-situ TiB2 reinforced A357 aluminium alloy composite foams under compressive and impact loading. Mater. Sci. Eng. A-Struct. Mater. Prop. Microstruct. Process. 2016, 684, 178. [Google Scholar] [CrossRef]
- Suresh, S.; Moorthi, N.S.V. Aluminium-Titanium Diboride (Al-TiB2) Metal Matrix Composites: Challenges and Opportunities. Procedia Eng. 2012, 38, 89. [Google Scholar] [CrossRef] [Green Version]
- Bhogi, S.; Nampoothiri, J.; Ravi, K.R.; Mukherjee, M. Influence of nano and micro particles on the expansion and mechanical properties of aluminum foams. Mater. Sci. Eng. A-Struct. Mater. Prop. Microstruct. Process. 2017, 685, 131. [Google Scholar] [CrossRef]
- Cao, Z.; Li, M.; Luo, H. Fabrication of Aluminum Foams with Fine Cell Structure under Increased Pressure. Adv. Eng. Mater. 2015, 18, 1022. [Google Scholar] [CrossRef]
- Atturan, U.A.; Nandam, S.H.; Murty, B.S.; Sankaran, S. Processing and characterization of in-situ TiB2 stabilized closed cell aluminium alloy composite foams. Mater. Des. 2016, 101, 245. [Google Scholar] [CrossRef]
- Kader, M.A.; Islam, M.A.; Saadatfar, M.; Hazell, P.J.; Brown, A.D.; Ahmed, S.; Escobedo, J.P. Macro and micro collapse mechanisms of closed-cell aluminium foams during quasi-static compression. Mater. Des. 2017, 118, 11. [Google Scholar] [CrossRef]
- Markaki, A.E.; Clyne, T.W. The effect of cell wall microstructure on the deformation and fracture of aluminium-based foams. Acta Mater. 2001, 49, 1677. [Google Scholar] [CrossRef]
- Bhogi, S.; Muduli, B.; Mukherjee, M. Effect of Mg addition on the structure and properties of Al–TiB2 foams. Mater. Sci. Eng. A-Struct. Mater. Prop. Microstruct. Process. 2020, 791, 139581. [Google Scholar] [CrossRef]
- Kolluri, M.; Karthikeyan, S.; Ramamurty, U. Effect of Lateral Constraint on the Mechanical Properties of a Closed-Cell Al Foam: I. Experiments. Mater. Trans. A-Phys. Metall. Mater. Sci. 2007, 38, 2006. [Google Scholar] [CrossRef]
- Mccullough, K.Y.G.; Fleck, N.A.; Ashby, M.F. Uniaxial stress-strain behavior of aluminium alloy foams. Acta Mater. 1999, 47, 2323. [Google Scholar] [CrossRef]
- Elmoutaouakkil, A.; Salvo, L.; Maire, E.; Peix, G. 2D and 3D characterisation of metal foams using X-ray tomography. Adv. Eng. Mater. 2010, 4, 803. [Google Scholar] [CrossRef]
- Benouali, A.H.; Froyen, L.; Dillard, T.; Forest, S.; N’Guyen, F. Investigation on the influence of cell shape anisotropy on the mechanical performance of closed cell aluminium foams using micro-computed tomography. J. Mater. Sci. 2005, 40, 5801. [Google Scholar] [CrossRef]
- Jang, W.Y.; Hsieh, W.Y.; Miao, C.C.; Yen, Y.C. Microstructure and mechanical properties of ALPORAS closed-cell aluminium foam. Mater. Charact. 2015, 107, 228. [Google Scholar] [CrossRef]
- Simone, A.E.; Gibson, L.J. Effects of solid distribution on the stiffness and strength of metallic foams. Acta Mater. 1998, 46, 2139–2150. [Google Scholar] [CrossRef]
- Simone, A.E.; Gibson, L.J. Aluminum foams produced by liquid-state processes. Acta Mater. 1998, 46, 3109. [Google Scholar] [CrossRef]
- Silva, M.J.; Gibson, L.J. The effects of non-periodic microstructure and defects on the compressive strength of two-dimensional cellular solids. Int. J. Mech. Sci. 1997, 39, 549. [Google Scholar] [CrossRef]
- Simone, A.E.; Gibson, L.J. The effects of cell face curvature and corrugations on the stiffness and strength of metallic foams. Acta Mater. 1998, 46, 3929–3935. [Google Scholar] [CrossRef]
Figure 1.
The top-view of the fabricated cylindrical sample; the dotted box is the cutting position of the compressed samples: (a) 10TiB2-0.1P; (b) 10TiB2-0.24P.
Figure 1.
The top-view of the fabricated cylindrical sample; the dotted box is the cutting position of the compressed samples: (a) 10TiB2-0.1P; (b) 10TiB2-0.24P.

Figure 2.
XRD pattern of Al-10TiB2 composite (a. u. = arbitrary unit).

Figure 3.
The structure and corresponding cell size distribution (red line: fitting of lognormal distribution function) and circularity of foam specimens: (a) 5TiB2-0.1P; (b) 5TiB2-0.24P; (c) 5TiB2-0.4P; (d) 10TiB2-0.1P; (e) 10TiB2-0.24P; (f) 10TiB2-0.4P.
Figure 3.
The structure and corresponding cell size distribution (red line: fitting of lognormal distribution function) and circularity of foam specimens: (a) 5TiB2-0.1P; (b) 5TiB2-0.24P; (c) 5TiB2-0.4P; (d) 10TiB2-0.1P; (e) 10TiB2-0.24P; (f) 10TiB2-0.4P.

Figure 4.
SEM images of Al-5TiB2 composite foams: (a) cell wall cross-section; (b) a magnified view of the cell wall; (c) the corresponding Ti elemental mapping in b and (d) is a magnified view of the region marked by Circle 1.
Figure 4.
SEM images of Al-5TiB2 composite foams: (a) cell wall cross-section; (b) a magnified view of the cell wall; (c) the corresponding Ti elemental mapping in b and (d) is a magnified view of the region marked by Circle 1.

Figure 5.
SEM images of the10TiB2-0.4P sample: (a) macro morphology; (b) showing gas-metal interface; (c) showing Al-Ca-Ti intermetallic compound and TiB2 network; (d) Al, (e) Ca, (f) Ti elemental mappings of image (b); (g) Al, (h) Ca, (i) Ti elemental mappings of image (c).
Figure 5.
SEM images of the10TiB2-0.4P sample: (a) macro morphology; (b) showing gas-metal interface; (c) showing Al-Ca-Ti intermetallic compound and TiB2 network; (d) Al, (e) Ca, (f) Ti elemental mappings of image (b); (g) Al, (h) Ca, (i) Ti elemental mappings of image (c).

Figure 6.
Ti elemental mappings of three different matrix compositions (pure Al, Al-5TiB2, and Al-10TiB2) in the gas–metal interface: (a–c) macro morphology and (d–f) gas–metal interface of (a–c), respectively; (g–i) Ti elemental mappings of (d–f), respectively.
Figure 6.
Ti elemental mappings of three different matrix compositions (pure Al, Al-5TiB2, and Al-10TiB2) in the gas–metal interface: (a–c) macro morphology and (d–f) gas–metal interface of (a–c), respectively; (g–i) Ti elemental mappings of (d–f), respectively.

Figure 7.
Deformation process of Al-5TiB2 foams fabricated under different pressures.

Figure 8.
Deformation process of Al-10TiB2 foams fabricated under different pressures.

Figure 9.
Compressive stress-strain curves of the foams: (a) 5TiB2 and (b) 10TiB2.

Figure 10.
Energy absorption and energy absorption efficiency versus strain of (a) 5TiB2 and (b) 10TiB2.
Figure 10.
Energy absorption and energy absorption efficiency versus strain of (a) 5TiB2 and (b) 10TiB2.

Figure 11.
SEA and η of foams with different cell structures.

Figure 12.
Comparison of experimental data with prediction models.


Table 1.
The chemical composition of the Al-10TiB2 composite ingot.
| Element | Al | Si | Fe | Ti | B | V |
|---|---|---|---|---|---|---|
| wt.% | balance | 0.085 | 0.154 | 6.835 | 3.117 | 0.006 |
Table 2.
Foaming parameters.
| Al-xTiB2 | Ca (wt.%) | Stirring Time (min) | TiH2 (wt.%) | Stirring Time (min) | Foaming Pressure (MPa) | Foaming Time (min) |
|---|---|---|---|---|---|---|
| x = 5 | 2.25 | 5 | 1.2 | 3 | 0.1 | 10 |
| 2.25 | 5 | 1.2 | 3 | 0.24 | 15 | |
| 2.25 | 5 | 1.2 | 3 | 0.4 | 20 | |
| x = 10 | 2.25 | 5 | 1.2 | 3 | 0.1 | 10 |
| 2.25 | 5 | 1.2 | 3 | 0.24 | 15 | |
| 2.25 | 5 | 1.2 | 3 | 0.4 | 20 |
Table 3.
Structure properties of 5TiB2 and 10TiB2 foams. R2 indicates the goodness of a fit of the cell size distribution with a log-normal function.
Table 3.
Structure properties of 5TiB2 and 10TiB2 foams. R2 indicates the goodness of a fit of the cell size distribution with a log-normal function.
| Sample | ρ [g/cm3] | ρr | Dmean [mm] | R2 | Cmean [Arithmetic Mean] |
|---|---|---|---|---|---|
| 5TiB2-0.1P | 0.44 | 0.16 | 5.03 ± 0.09 | 0.81 | 0.89 ± 0.10 |
| 5TiB2-0.24P | 0.57 | 0.21 | 2.87 ± 0.06 | 0.85 | 0.90 ± 0.10 |
| 5TiB2-0.4P | 0.81 | 0.30 | 1.50 ± 0.02 | 0.95 | 0.94 ± 0.13 |
| 10TiB2-0.1P | 0.54 | 0.19 | 5.49 ± 0.15 | 0.64 | 0.94 ± 0.06 |
| 10TiB2-0.24P | 0.96 | 0.34 | 2.99 ± 0.06 | 0.90 | 0.94 ± 0.04 |
| 10TiB2-0.4P | 1.19 | 0.43 | 1.81 ± 0.06 | 0.89 | 0.99 ± 0.07 |
Table 4.
Compressive properties of the 5TiB2 and 10TiB2 foams.
| Sample | σp [MPa] | σp/(ρr)n [MPa] | Rsd [%] | εd [%] | W [MJ m−3] | η [%] | |
|---|---|---|---|---|---|---|---|
| n = 1.5 | n = 2 | ||||||
| 5TiB2-0.1P | 6.86 | 112 | 280 | 39.0 | 69.0 | 4.17 | 82 |
| 5TiB2-0.24P | 9.06 | 105 | 234 | 17.9 | 66.6 | 6.21 | 88 |
| 5TiB2-0.4P | 18.47 | 113 | 207 | 8.2 | 59.5 | 11.88 | 90 |
| 10TiB2-0.1P | 9.78 | 118 | 271 | 40.2 | 66.0 | 5.28 | 78 |
| 10TiB2-0.24P | 21.22 | 107 | 184 | 25.3 | 54.8 | 11.45 | 87 |
| 10TiB2-0.4P | 34.57 | 123 | 187 | 8.9 | 45.7 | 16.17 | 88 |
Publisher’s Note: MDPI stays neutral with regard to jurisdictional claims in published maps and institutional affiliations. |
© 2021 by the authors. Licensee MDPI, Basel, Switzerland. This article is an open access article distributed under the terms and conditions of the Creative Commons Attribution (CC BY) license (https://creativecommons.org/licenses/by/4.0/).
Share and Cite
MDPI and ACS Style
Yu, Y.; Cao, Z.; Wang, J.; Tu, G.; Mu, Y. Compressive Behavior of Al-TiB2 Composite Foams Fabricated under Increased Pressure. Materials 2021, 14, 5112. https://doi.org/10.3390/ma14175112
AMA Style
Yu Y, Cao Z, Wang J, Tu G, Mu Y. Compressive Behavior of Al-TiB2 Composite Foams Fabricated under Increased Pressure. Materials. 2021; 14(17):5112. https://doi.org/10.3390/ma14175112
Chicago/Turabian StyleYu, Yang, Zhuokun Cao, Jiaqi Wang, Ganfeng Tu, and Yongliang Mu. 2021. "Compressive Behavior of Al-TiB2 Composite Foams Fabricated under Increased Pressure" Materials 14, no. 17: 5112. https://doi.org/10.3390/ma14175112
Note that from the first issue of 2016, this journal uses article numbers instead of page numbers. See further details here.