
Towards Customized Footwear with Improved Comfort

 , , and
Abstract
:
1. Introduction
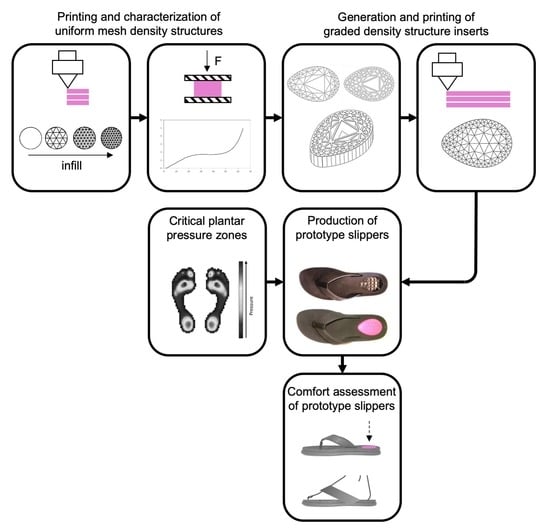
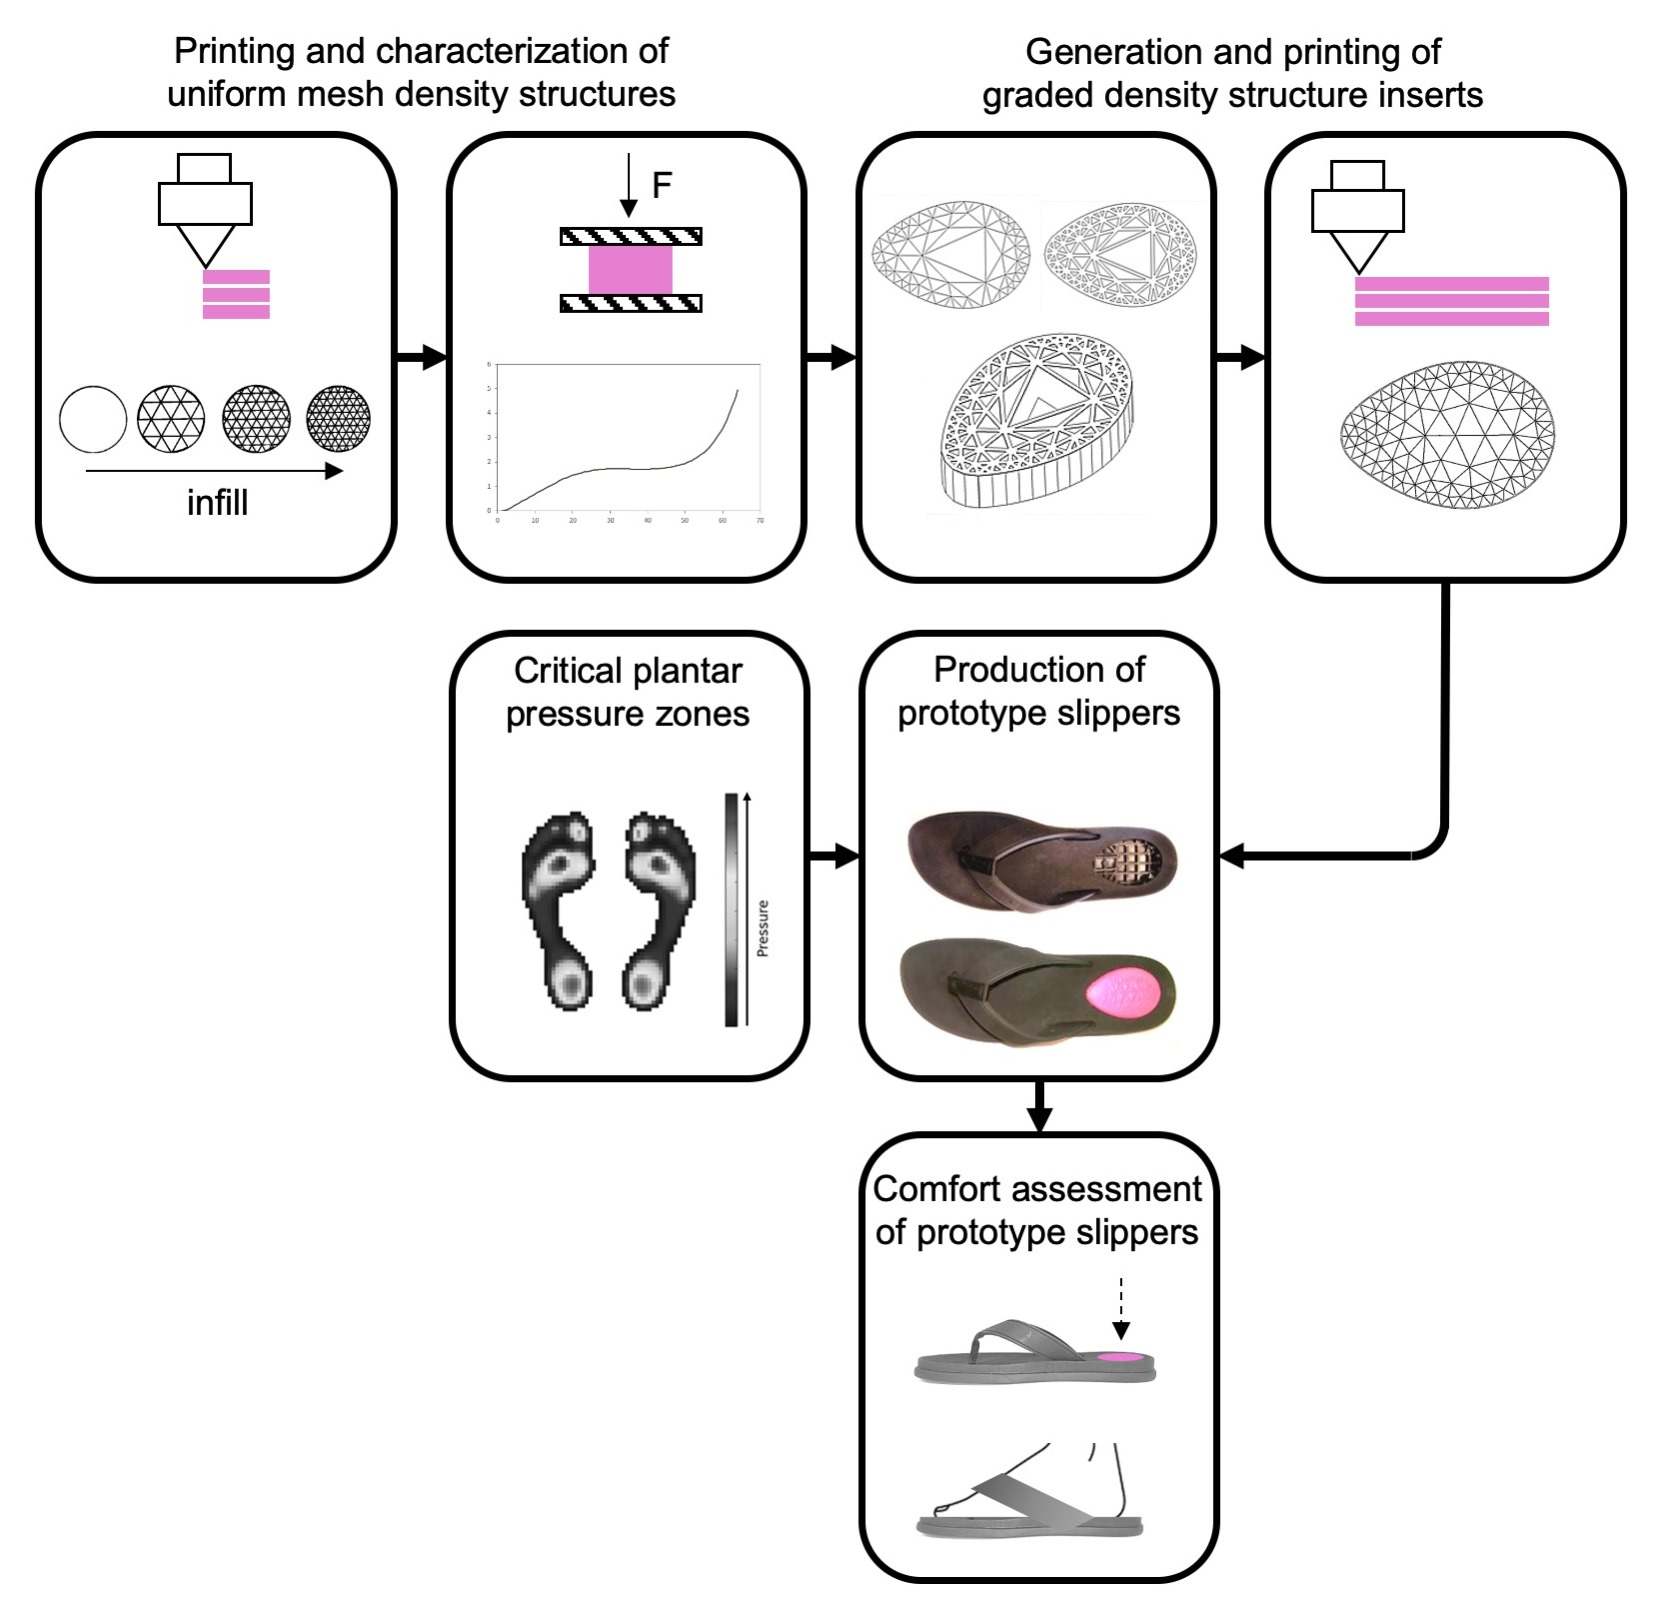
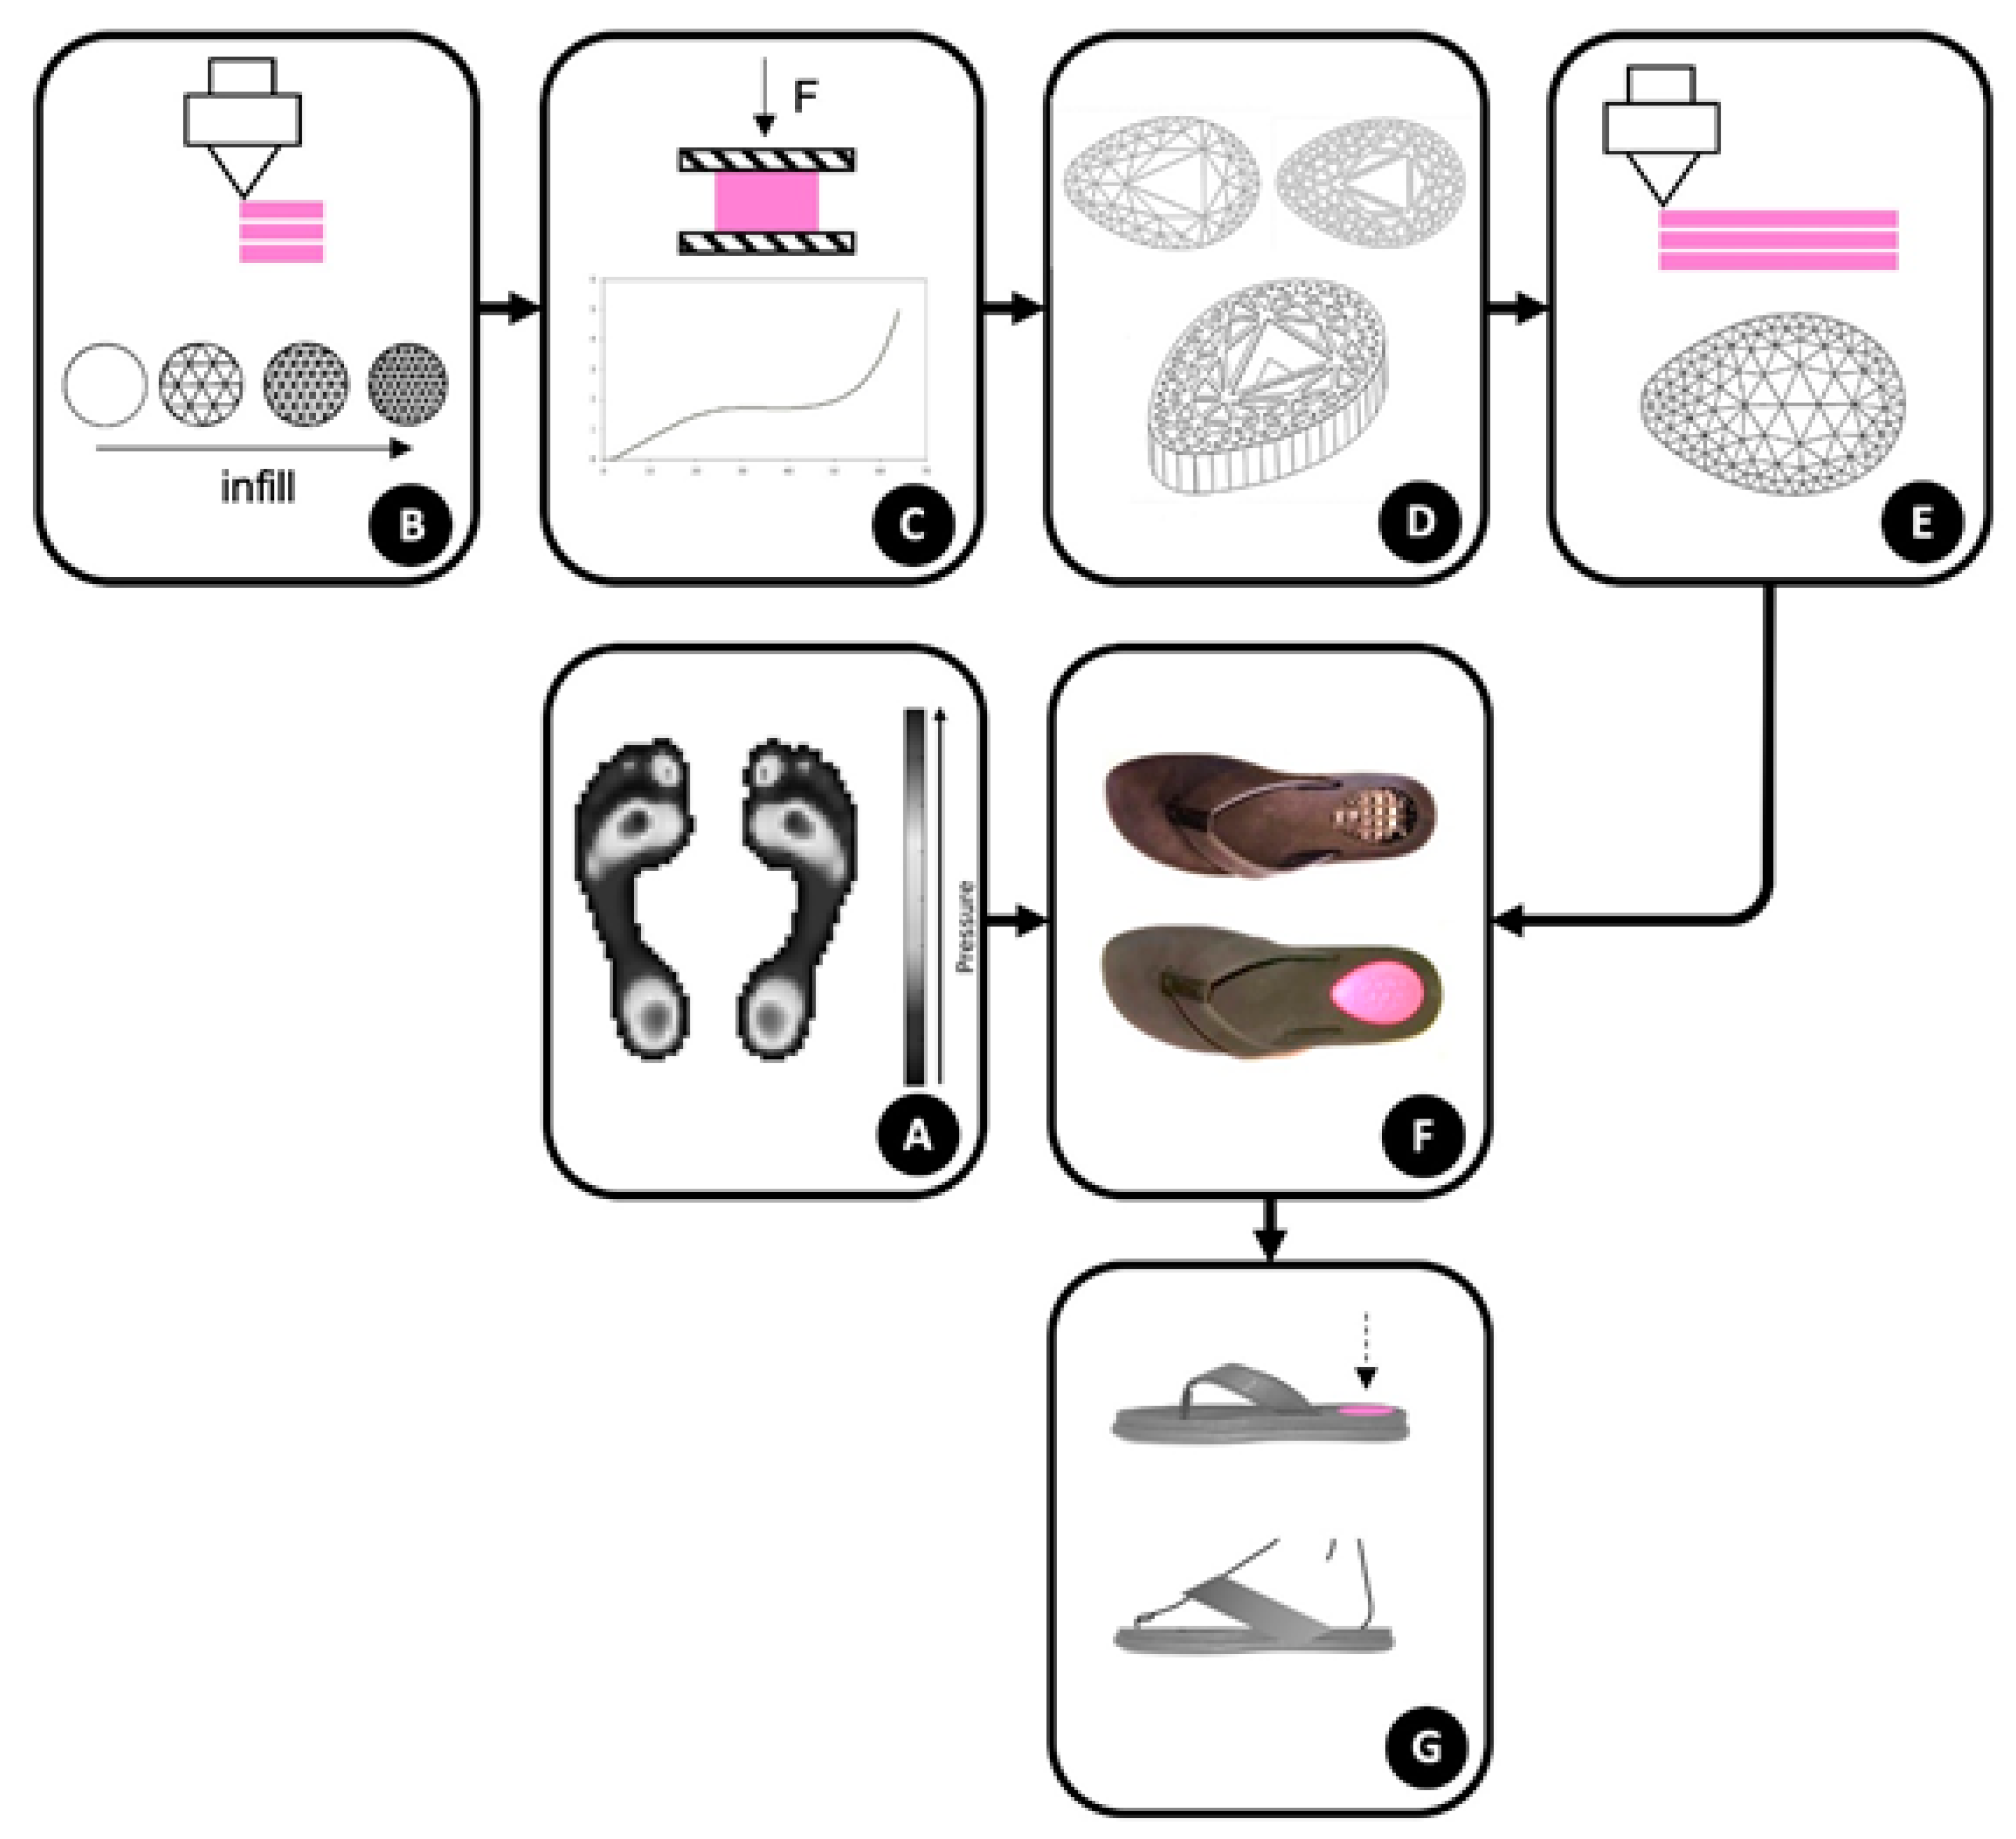
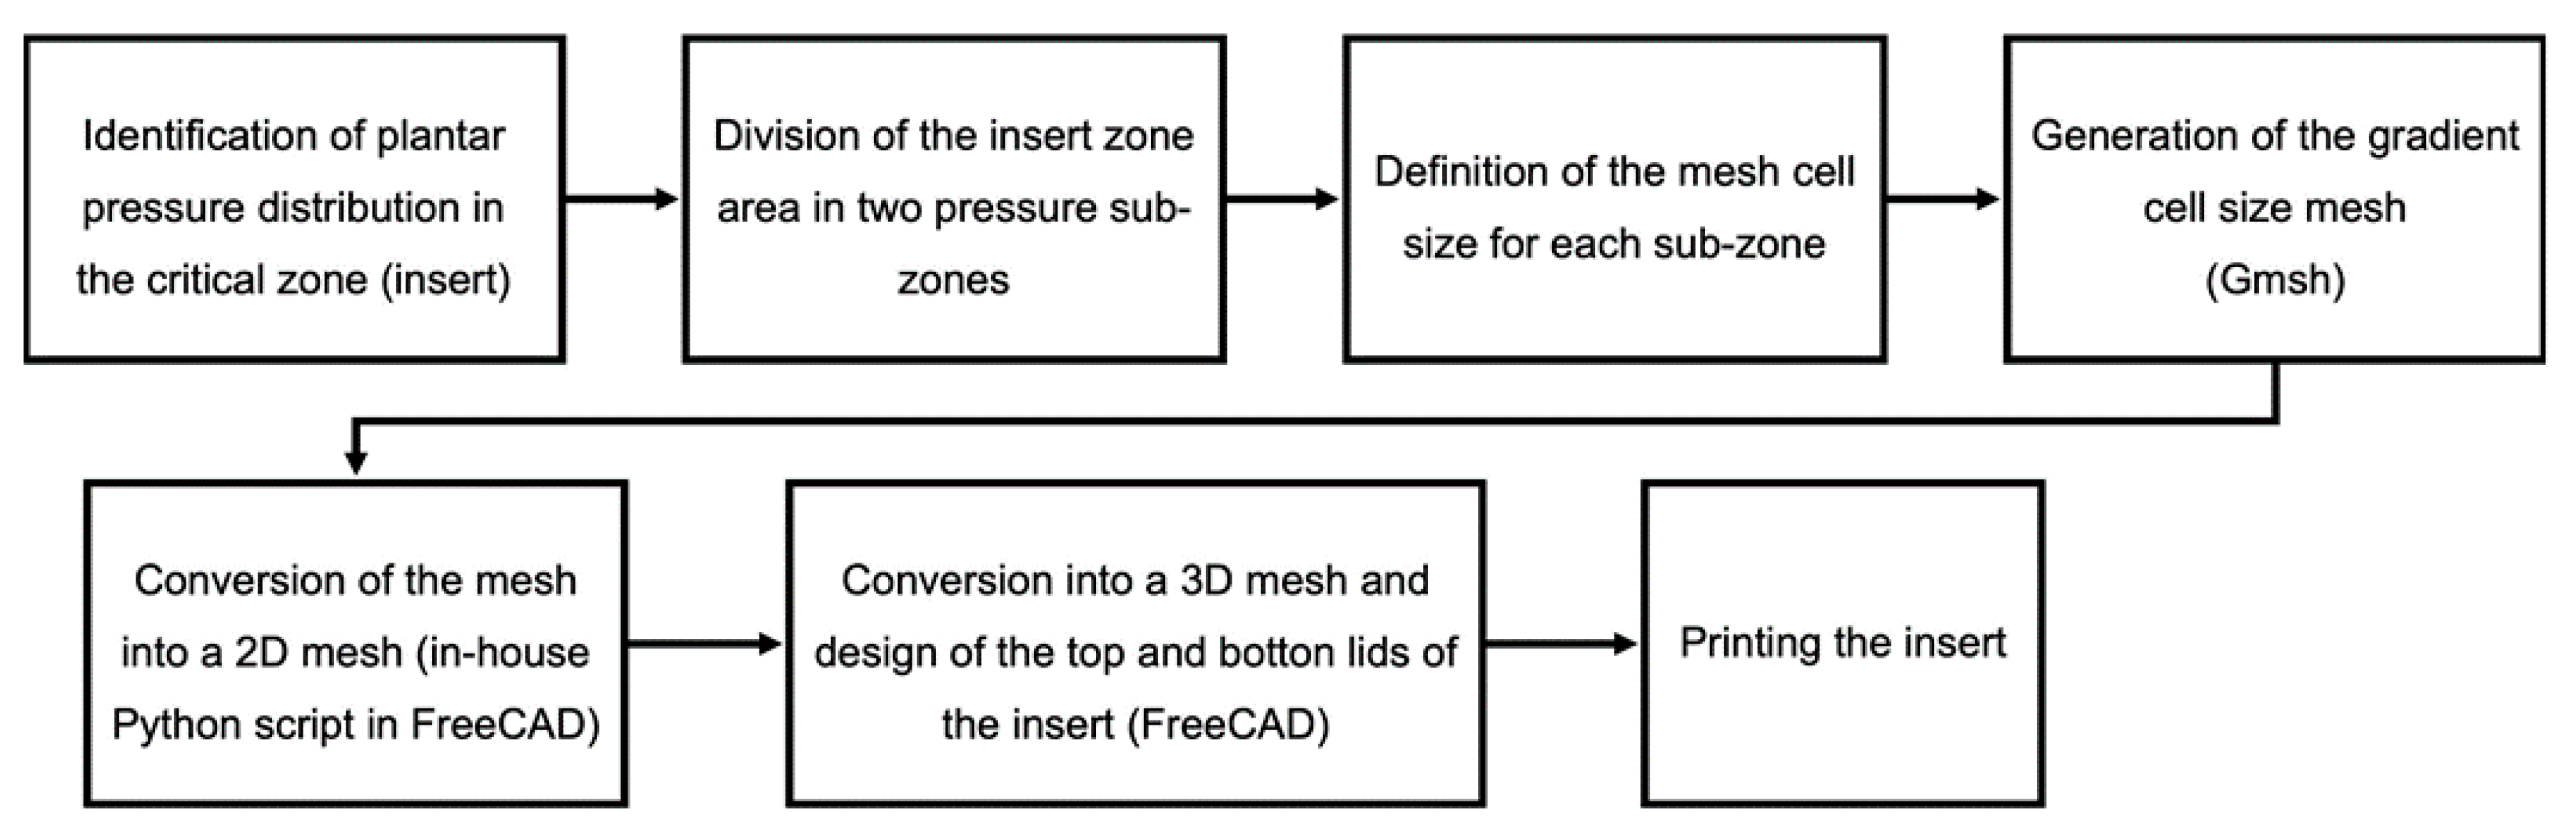
2. Methodology
3. Study on Uniform Mesh Density Structures
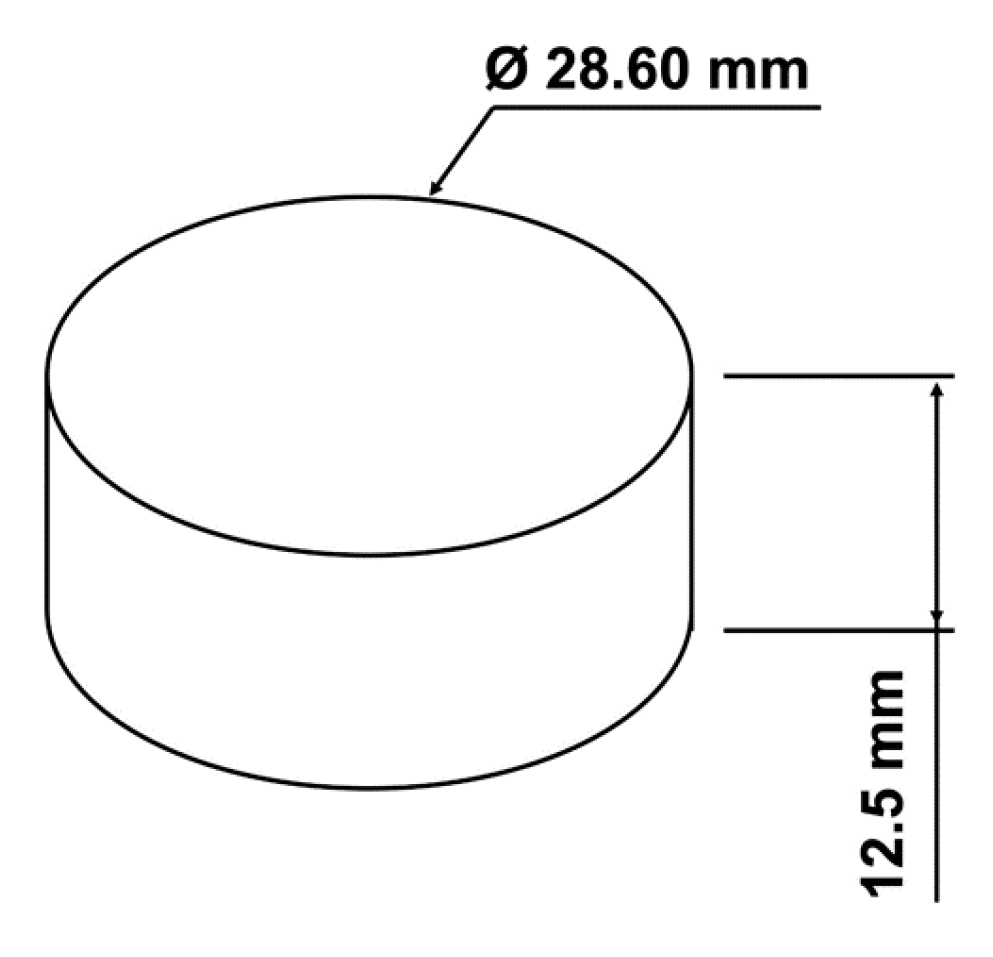
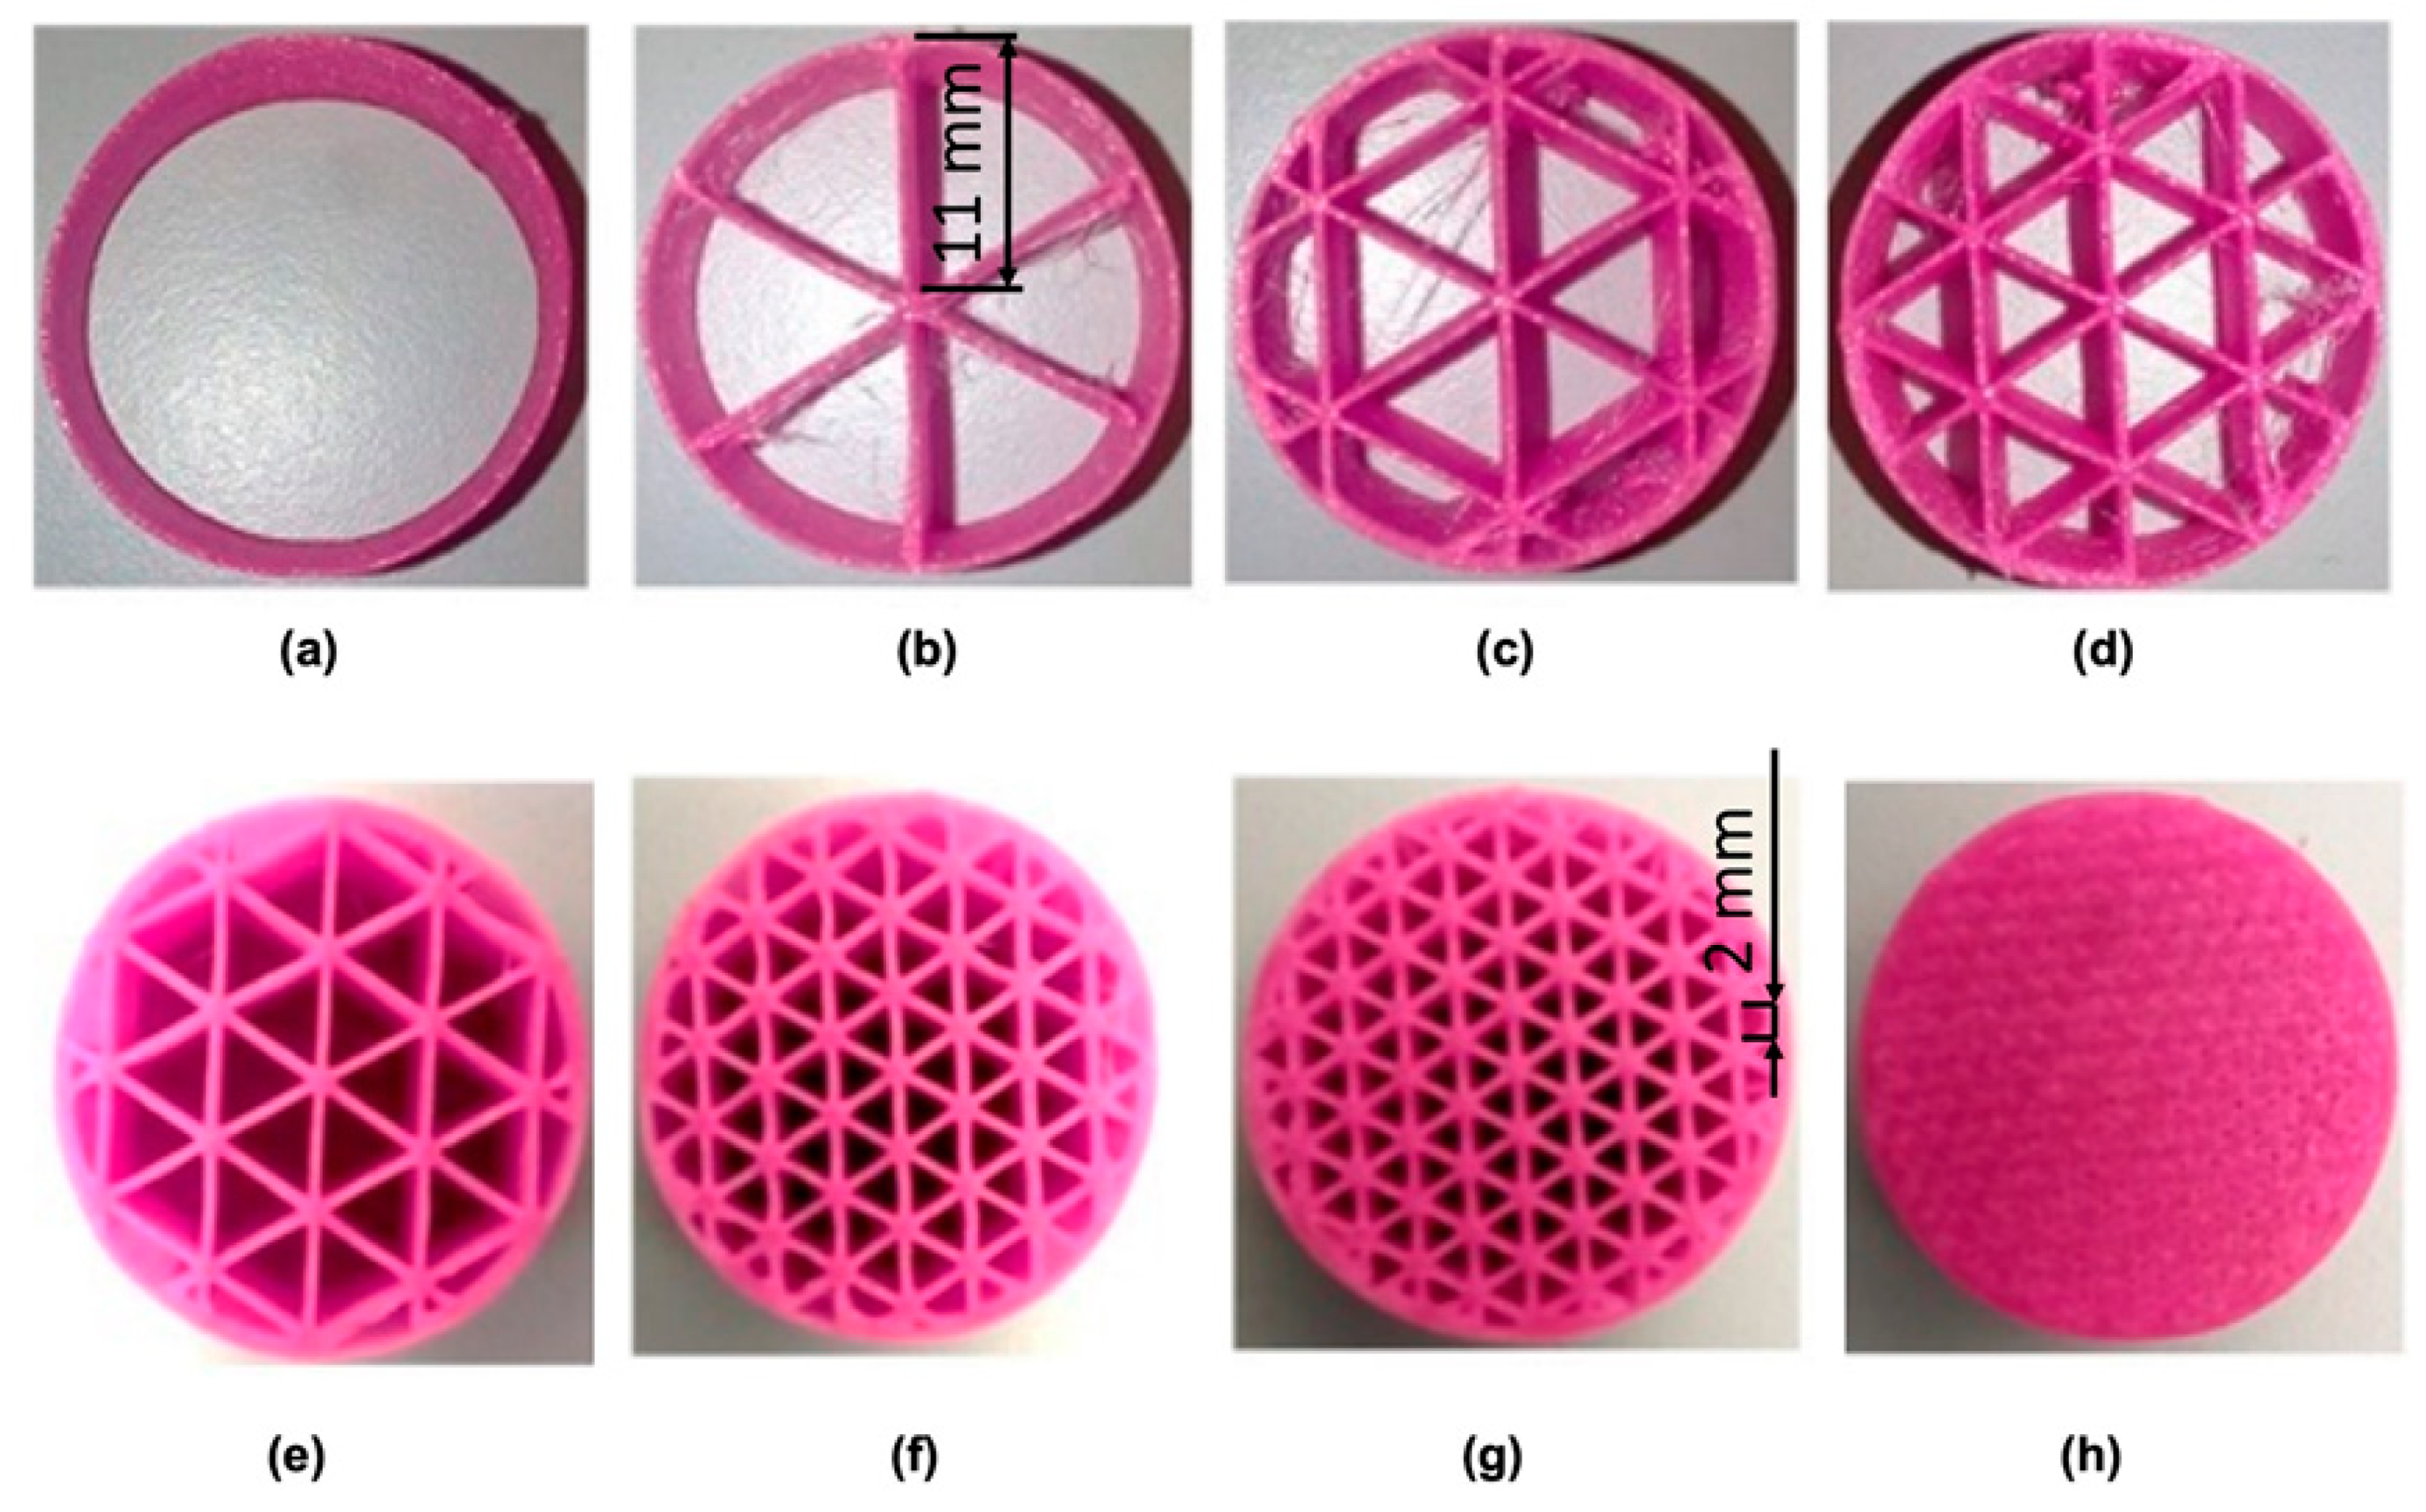
3.1. Material, Geometry and Mesh Densities
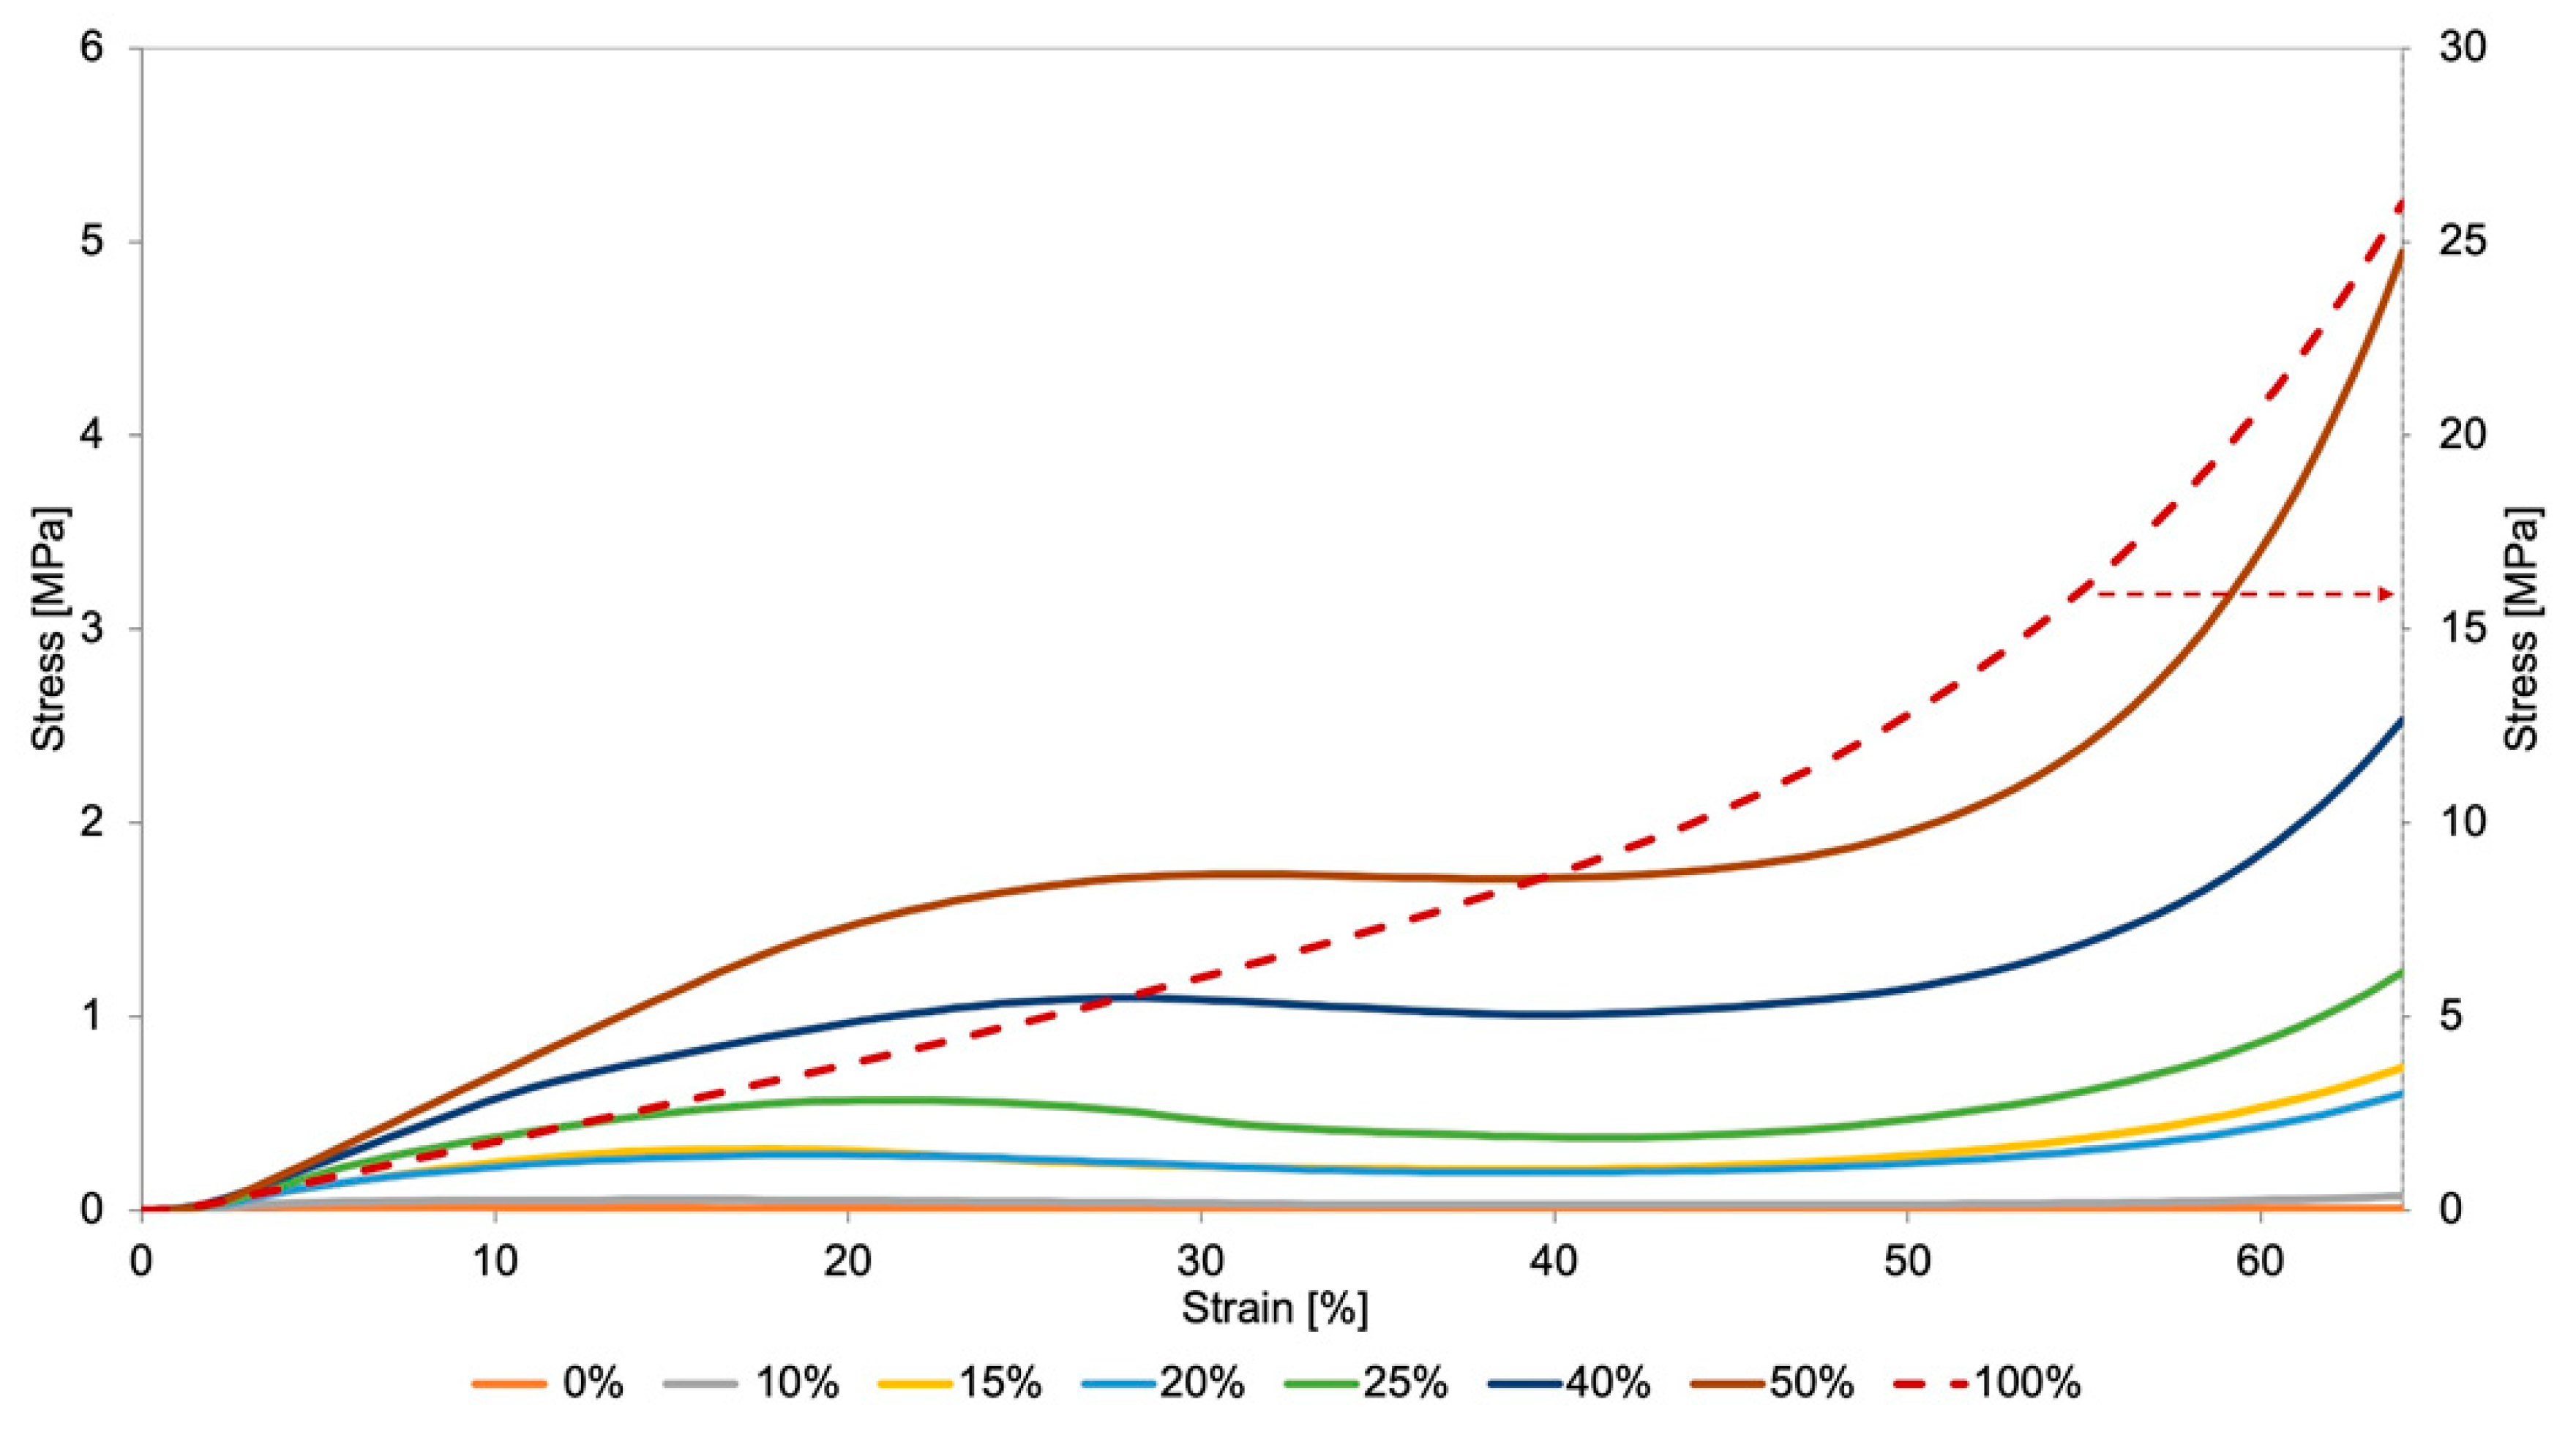
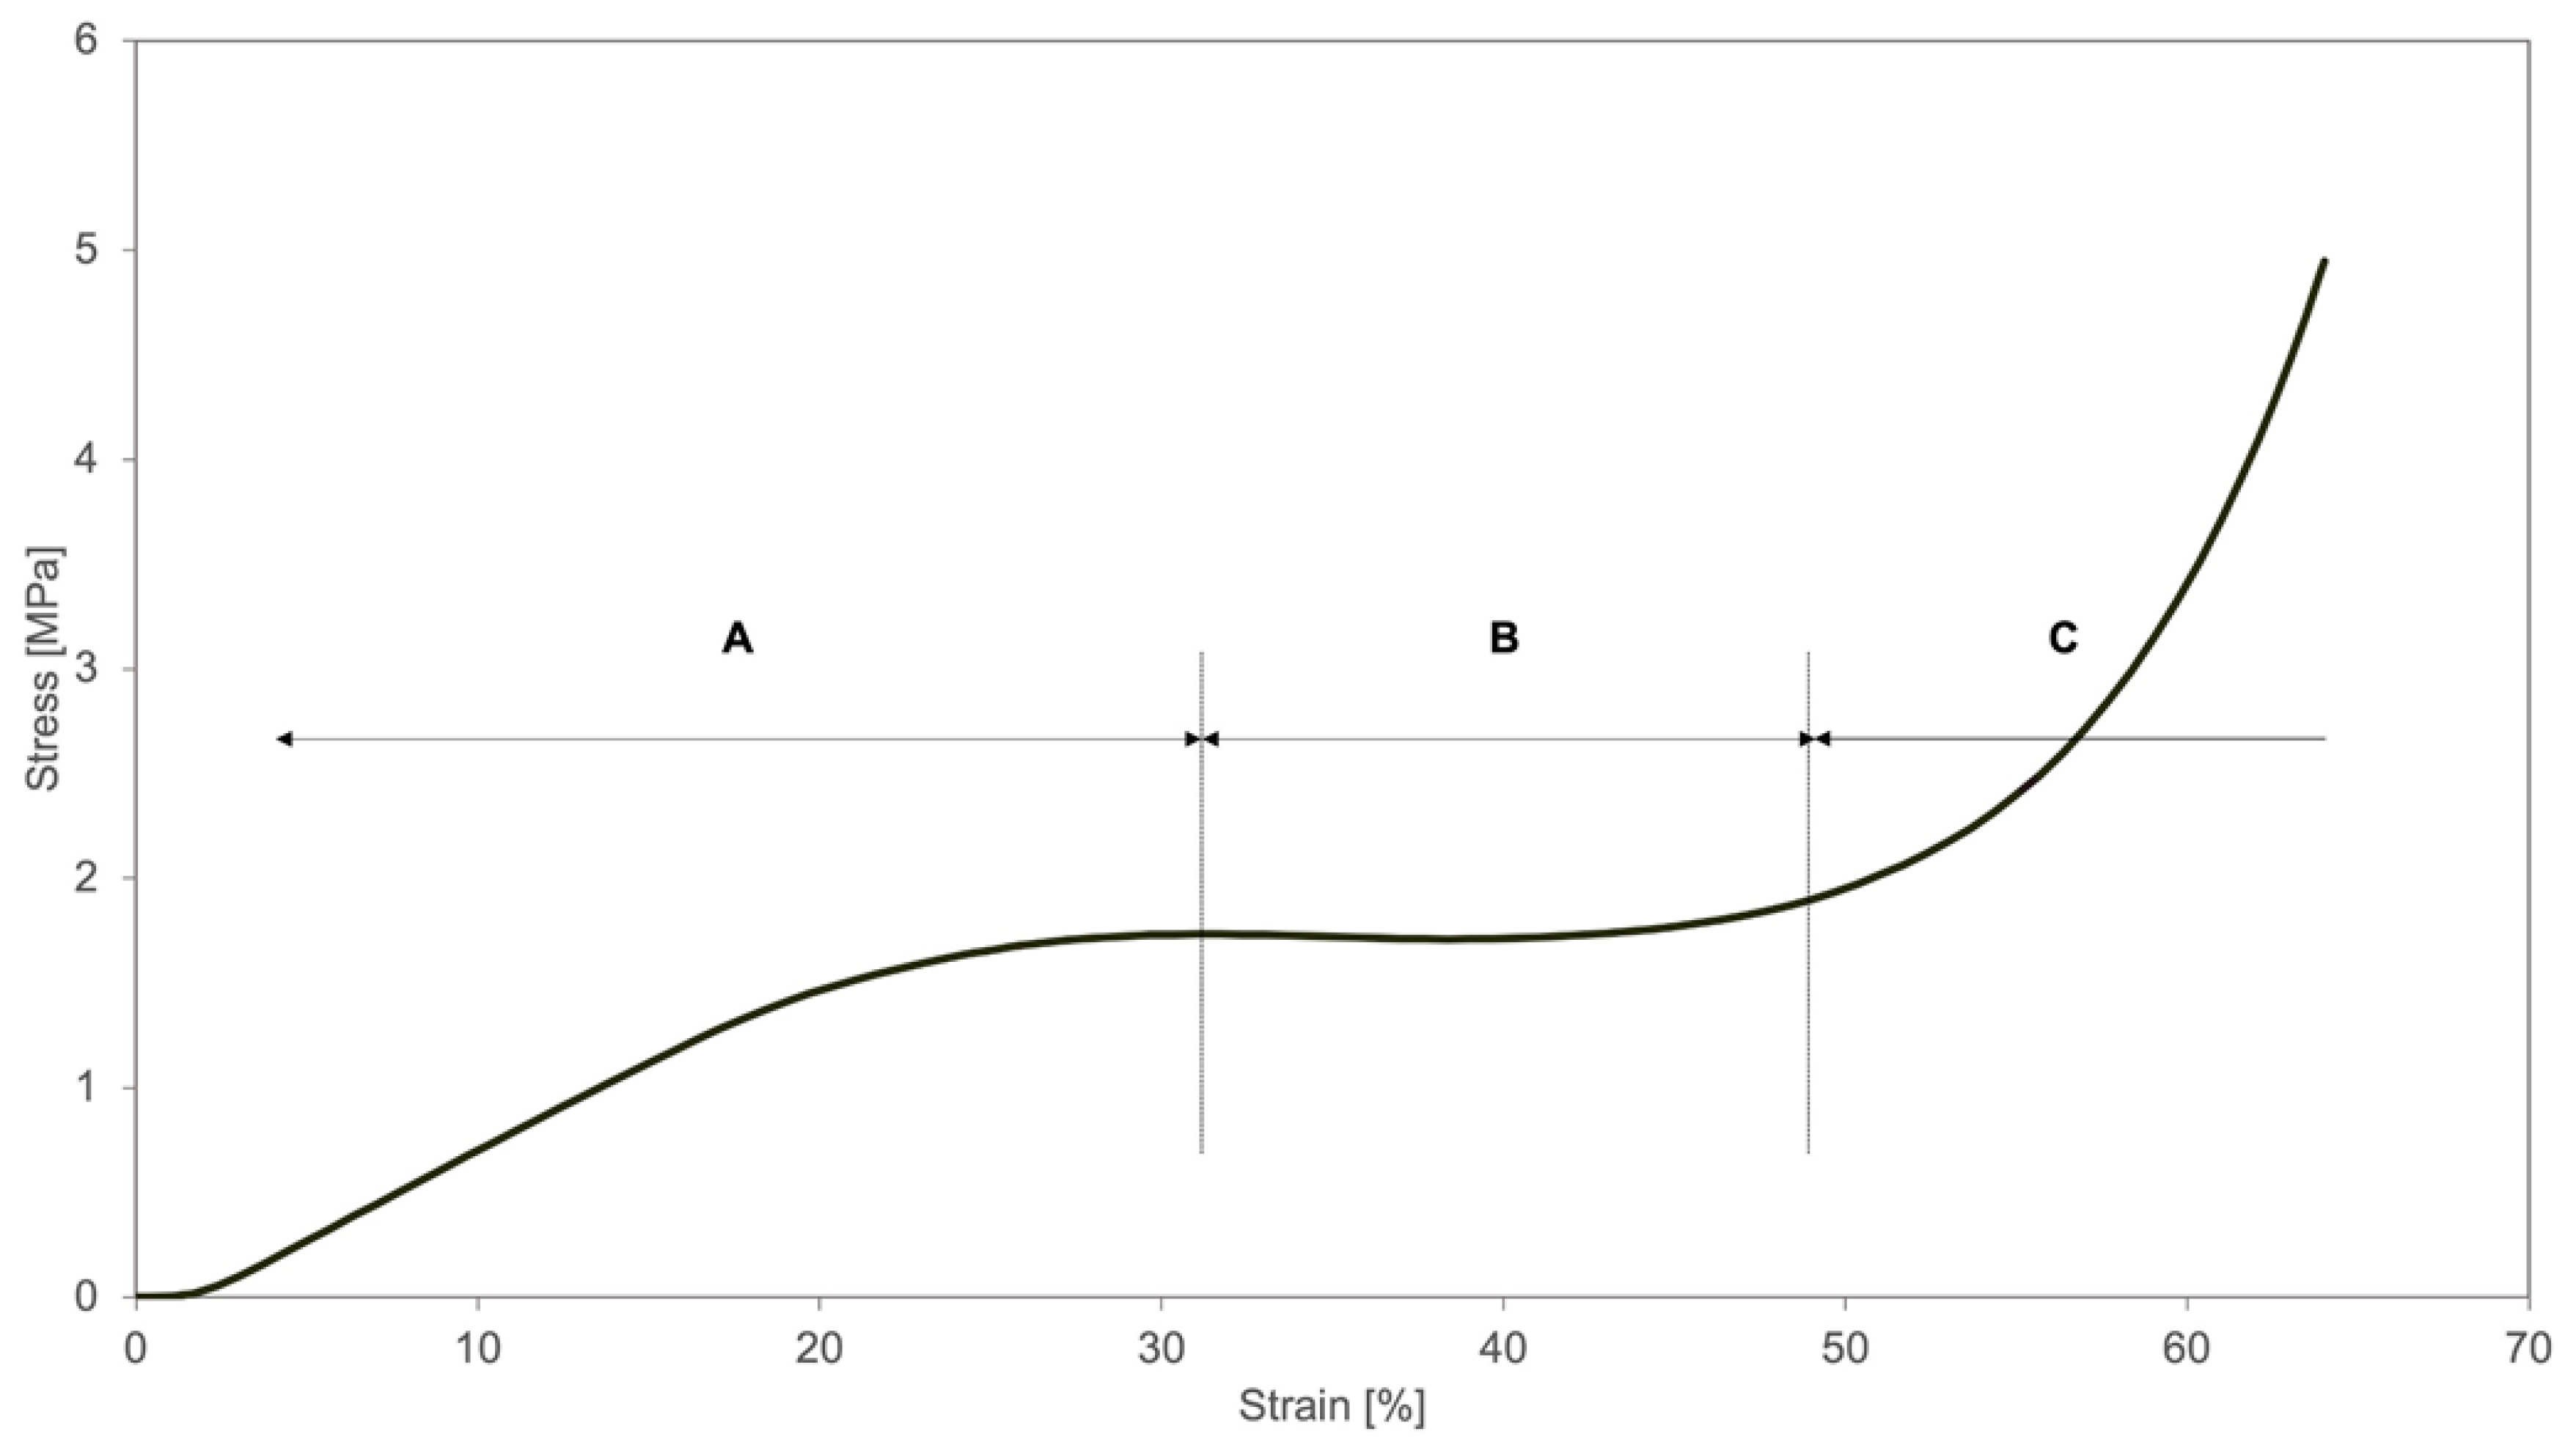
3.2. Compression Tests
- the linear region of the stress-strain curve, where the stress increases proportionally to the strain imposed to the material;
- region where the structure deformation takes place, due to the buckling of the vertical walls, corresponding to a plateau/quasi-plateau region where the strain increases at almost constant stress (the stress at yielding);
- densification region where the stress starts again to increase, due to the full collapse or crushing of the structure. In these conditions, an almost compact structure is, therefore, being compressed.
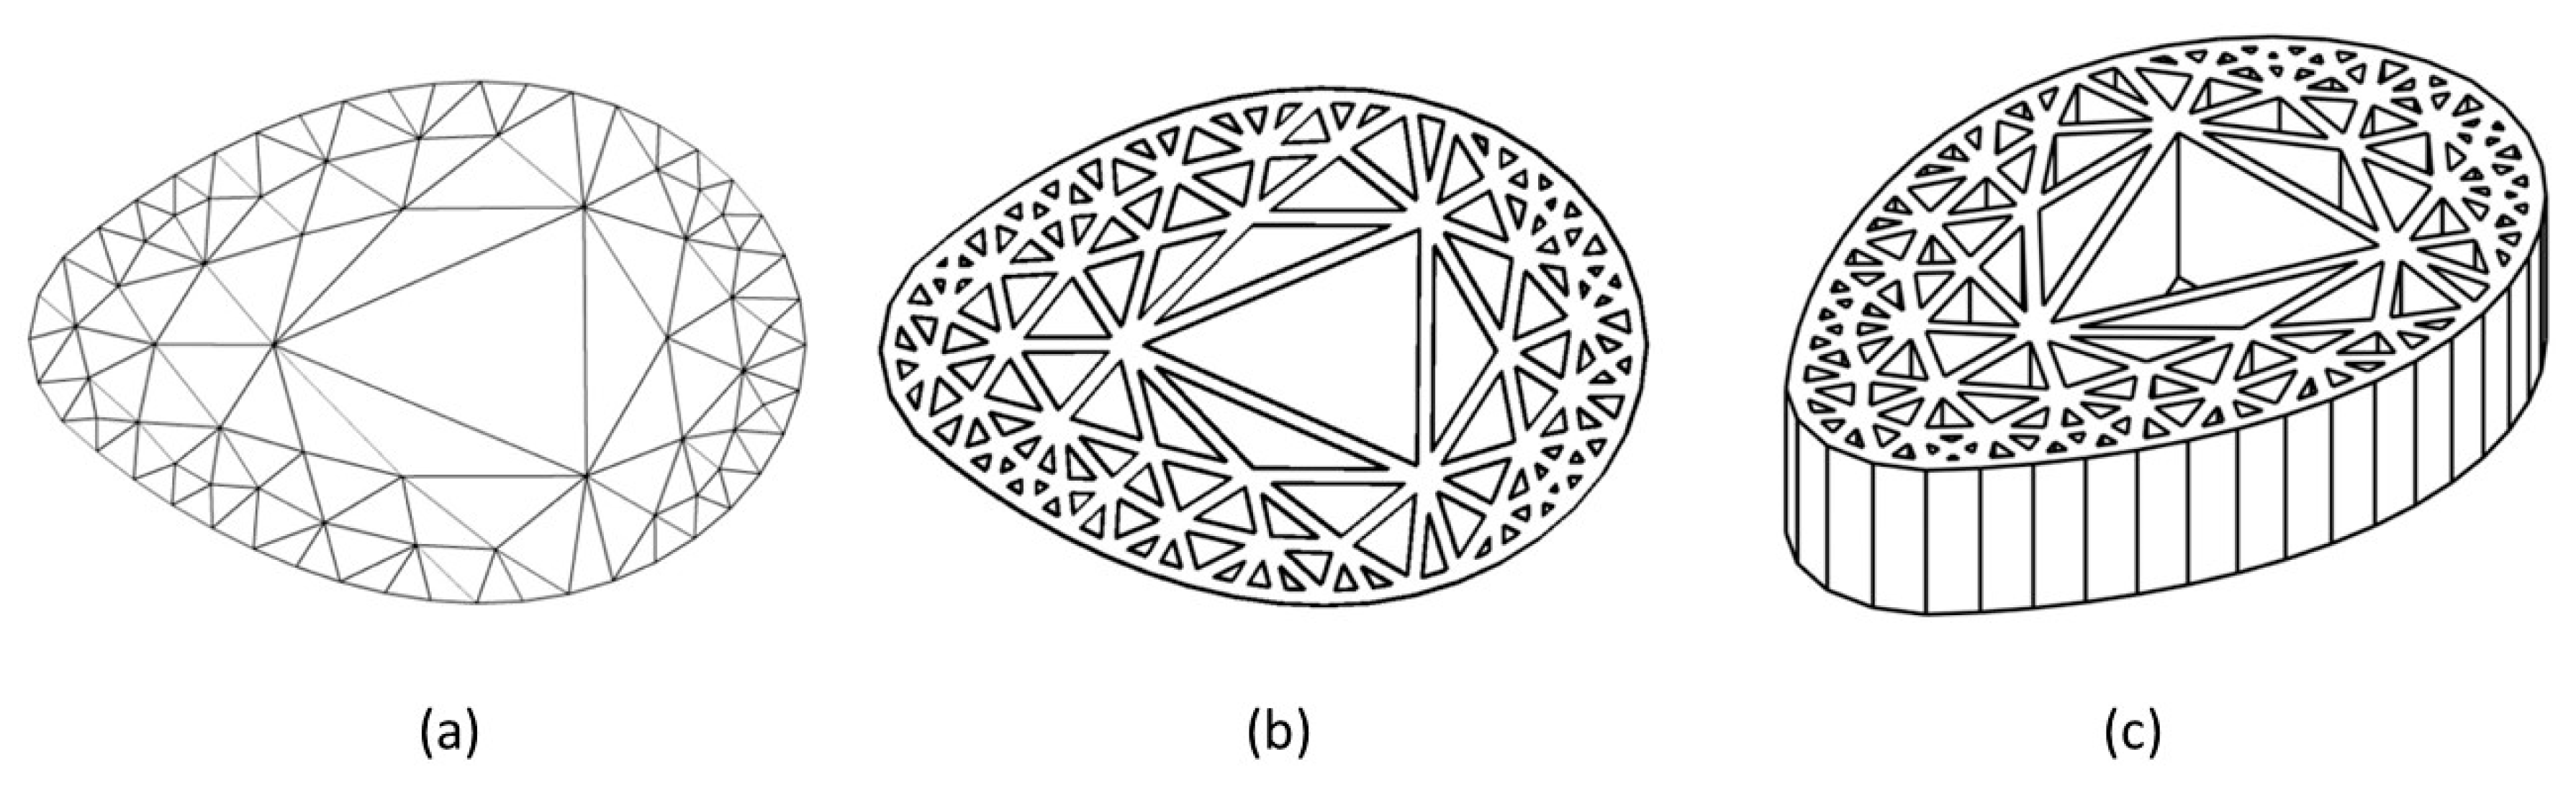
4. Structures with Mesh Density Gradient
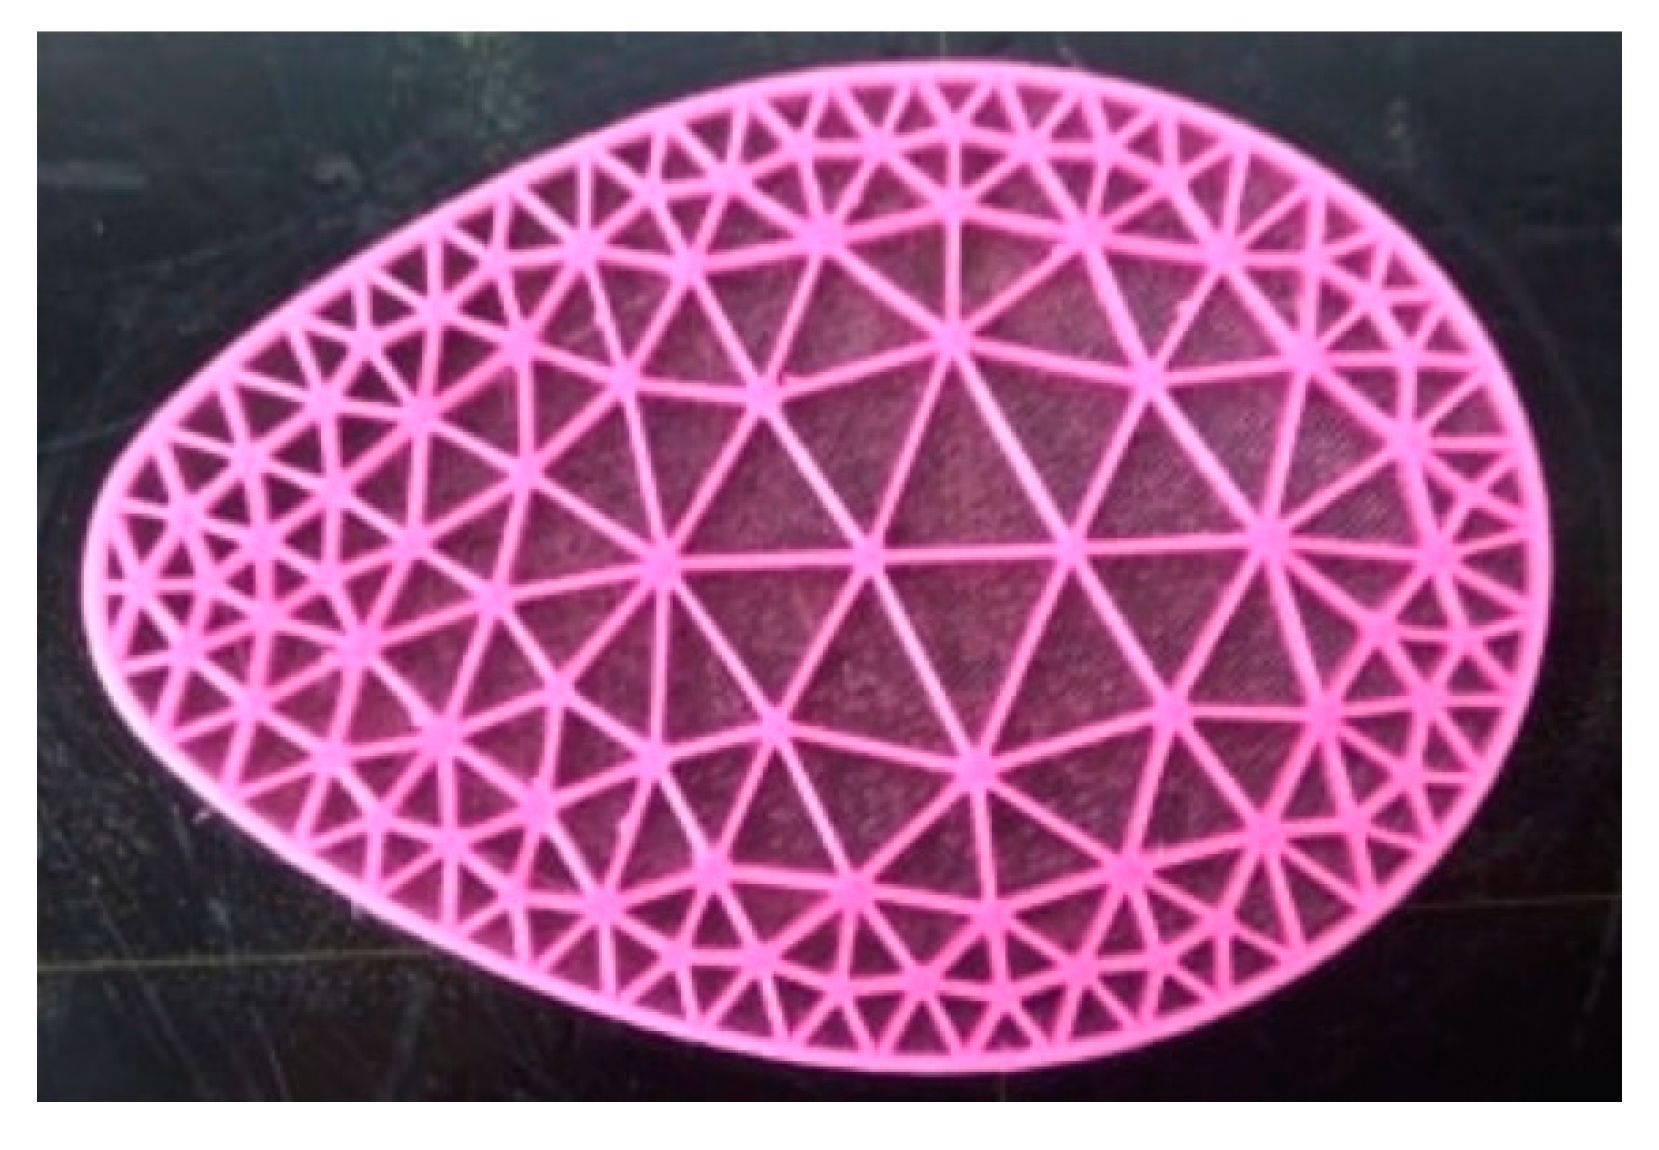
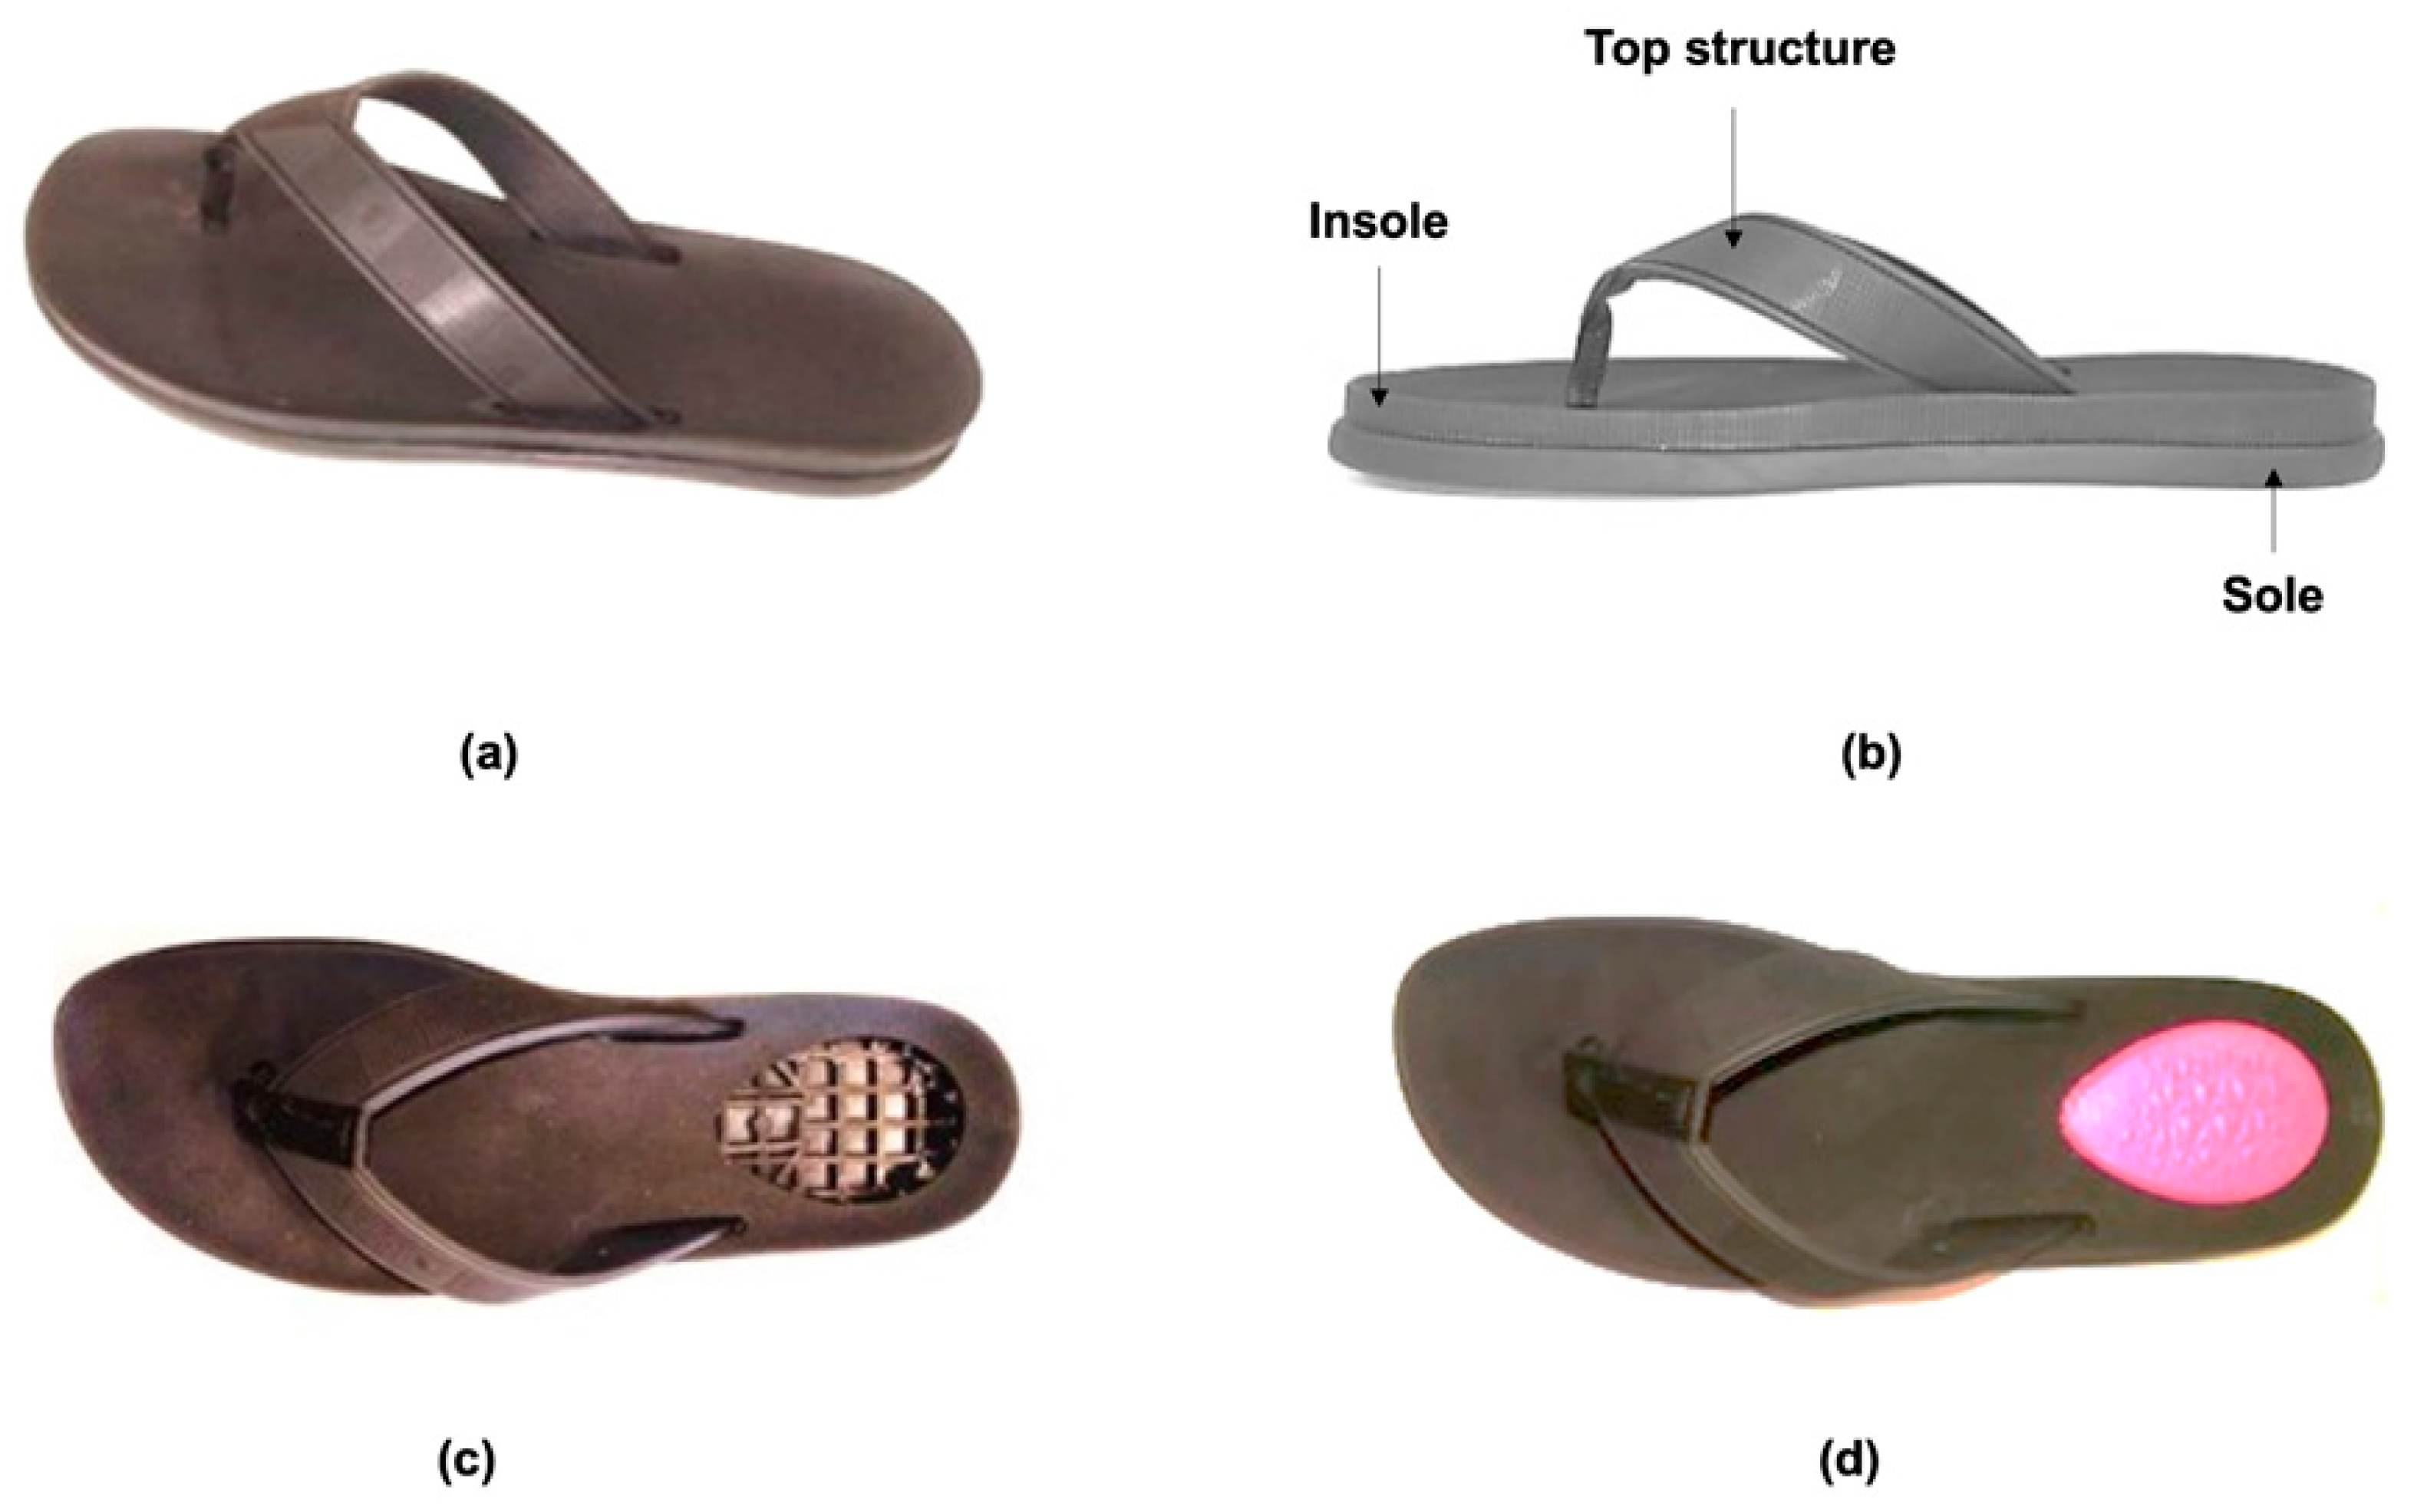
5. Case Study
5.1. Original Shoes and Prototypes
5.2. Comfort Assessment
6. Conclusions
Author Contributions
Funding
Institutional Review Board Statement
Informed Consent Statement
Data Availability Statement
Conflicts of Interest
References
- Che, H.; Nigg, B.; de Koning, J. Relationship between plantar pressure distribution under the foot and insole comfort. Clin. Biomech. 1994, 9, 335–341. [Google Scholar] [CrossRef]
- Silva, R.; Rodrigues, J.; Pinto, V.; Ferreira, M.; Russo, R.; Pereira, C. Evaluation of shock absorption properties of rubber materials regarding footwear applications. Polym. Test. 2009, 28, 642–647. [Google Scholar] [CrossRef]
- Broega, A.C.; Righetto, M.; Ribeiro, R. Female high heel shoes: A study of comfort. In Proceedings of the IOP Conference Series: Materials Science and Engineering; IOP Publishing: Bristol, UK, 2017; Volume 254, p. 232001. [Google Scholar]
- Jordan, C.; Bartlett, R. Pressure distribution and perceived comfort in casual footwear. Gait Posture 1995, 3, 215–220. [Google Scholar] [CrossRef]
- Goonetilleke, R.S. Designing to Miminize Discomfort. Ergon. Des. Q. Hum. Factors Appl. 1998, 6, 12–19. [Google Scholar] [CrossRef]
- Lane, T.J.; Landorf, K.B.; Bonanno, D.R.; Raspovic, A.; Menz, H.B. Effects of shoe sole hardness on plantar pressure and comfort in older people with forefoot pain. Gait Posture 2014, 39, 247–251. [Google Scholar] [CrossRef]
- Karia, S.; Parasuraman, S.; Elamvazuthi, I.; Debnath, N.; Ali, S.S.A.; Khan, M.A. Plantar pressure distribution and gait stability: Normal VS high heel. In Proceedings of the 2016 2nd IEEE International Symposium on Robotics and Manufacturing Automation (ROMA), Ipoh, Malaysia, 25–27 September 2016; pp. 1–5. [Google Scholar] [CrossRef]
- Shu, L.; Hua, T.; Wang, Y.; Li, Q.; Feng, D.D.; Tao, X. In-Shoe Plantar Pressure Measurement and Analysis System Based on Fabric Pressure Sensing Array. IEEE Trans. Inf. Technol. Biomed. 2010, 14, 767–775. [Google Scholar] [CrossRef] [Green Version]
- Razak, A.H.A.; Zayegh, A.; Begg, R.K.; Wahab, Y. Foot Plantar Pressure Measurement System: A Review. Sensors 2012, 12, 9884–9912. [Google Scholar] [CrossRef] [Green Version]
- West, S.; Barnett, S. Plantar pressure measurement: Which system? Diabetic Foot 1999, 2, 108–110. [Google Scholar]
- Lopes, L.; Silva, A.; Carneiro, O. Multi-material 3D printing: The relevance of materials affinity on the boundary interface performance. Addit. Manuf. 2018, 23, 45–52. [Google Scholar] [CrossRef]
- Ribeiro, M.; Carneiro, O.S.; Da Silva, A.F. Interface geometries in 3D multi-material prints by fused filament fabrication. Rapid Prototyp. J. 2019, 25, 38–46. [Google Scholar] [CrossRef]
- Besisa, D.H.A.; Ewais, E.M.M. Advances in Functionally Graded Ceramics—Processing, Sintering Properties and Applications. In Advances in Functionally Graded Materials and Structures; Ebrahim, F., Ed.; Intech Open (e-Book): Rijeka, Croatia, 2016. [Google Scholar] [CrossRef] [Green Version]
- Esmailzadeh, M.; Manesh, H.D.; Zebarjad, S.M. Fabrication and characterization of functional graded polyurethane foam (FGPUF). Polym. Adv. Technol. 2017, 29, 182–189. [Google Scholar] [CrossRef]
- Bhavar, V.; Kattire, P.; Thakare, S.; Patil, S.; Singh, R. A Review on Functionally Gradient Materials (FGMs) and Their Applications. IOP Conf. Series: Mater. Sci. Eng. 2017, 229, 012021. [Google Scholar] [CrossRef]
- Jepson, L.; Beaman, J.; Bourell, D.L.; Wood, K.L. SLS Processing of Functionally Gradient Materials. In Proceedings of the International Solid Freeform Fabrication Symposium, Austin, TX, USA, 11–13 August 1997; pp. 67–79. [Google Scholar]
- Ajdari, A.; Nayeb-Hashemi, H.; Vaziri, A. Dynamic crushing and energy absorption of regular, irregular and functionally graded cellular structures. Int. J. Solids Struct. 2011, 48, 506–516. [Google Scholar] [CrossRef]
- Xu, F.; Zhang, X.; Zhang, H. A review on functionally graded structures and materials for energy absorption. Eng. Struct. 2018, 171, 309–325. [Google Scholar] [CrossRef]
- Ahankari, S.; Kar, K. Functionally Graded Composites: Processing and Applications. In Composite Materials: Processing, Applications, Characterizations; Kar, K.K., Ed.; Springer: Berlin/Heidelberg, Germany, 2017. [Google Scholar] [CrossRef]
- Chen, Y.; Liou, F. Additive Manufacturing of Metal Functionally Graded Materials: A Review. In Proceedings of the Solid Freeform Fabrication Symposium—An Additive Manufacturing Conference, Austin, TX, USA, 13–15 August 2018; Volume 1, pp. 1215–1231. [Google Scholar]
- Tang, L.; Wang, L.; Bao, W.; Zhu, S.; Li, D.; Zhao, N.; Liu, C.; Zhao, N. Functional gradient structural design of customized diabetic insoles. J. Mech. Behav. Biomed. Mater. 2019, 94, 279–287. [Google Scholar] [CrossRef]
- ASTM D575-91. Standard Test Methods for Rubber Properties in Compression; ASTM International: West Conshohocken, PA, USA, 2018. [Google Scholar]
- Anjos, O.; Rodrigues, C.; Morais, J.; Pereira, H. Effect of density on the compression behaviour of cork. Mater. Des. 2014, 53, 1089–1096. [Google Scholar] [CrossRef]
- Mane, J.; Chandra, S.; Sharma, S.; Ali, H.; Chavan, V.; Manjunath, B.; Patel, R. Mechanical Property Evaluation of Polyurethane Foam under Quasi-static and Dynamic Strain Rates—An Experimental Study. Procedia Eng. 2017, 173, 726–731. [Google Scholar] [CrossRef]
- Alzoubi, M.F.; Al-Hallaj, S.; Abu-Ayyad, M. Modeling of Compression Curves of Flexible Polyurethane Foam with Variable Density, Chemical Formulations and Strain Rates. J. Solid Mech. 2014, 6, 82–97. [Google Scholar]
- Tu, Z.; Shim, V.; Lim, C. Plastic deformation modes in rigid polyurethane foam under static loading. Int. J. Solids Struct. 2001, 38, 9267–9279. [Google Scholar] [CrossRef]
- Zulkifli, S.S.; Loh, W.P. A state-of-the-art review of foot pressure. Foot Ankle Surg. 2020, 26, 25–32. [Google Scholar] [CrossRef]
- Geuzaine, C.; Remacle, J.-F. Gmsh: A 3-D finite element mesh generator with built-in pre- and post-processing facilities. Int. J. Numer. Methods Eng. 2009, 79, 1309–1331. [Google Scholar] [CrossRef]
- Riegel, J.; Mayer, W.; van Havre, Y. FreeCAD (Version 0.18.16131). 2001–2019. Available online: http://www.freecadweb.org (accessed on 29 March 2021).
- Chiu, H.-T.; Shiang, T.-Y. Effects of Insoles and Additional Shock Absorption Foam on the Cushioning Properties of Sport Shoes. J. Appl. Biomech. 2007, 23, 119–127. [Google Scholar] [CrossRef] [PubMed] [Green Version]


| Filling Density (%) | ||||||||
|---|---|---|---|---|---|---|---|---|
| 0 | 10 | 15 | 20 | 25 | 40 | 50 | 100 | |
| Elastic modulus, E (kPa) | 2.2 | 10.7 | 31.5 | 35.2 | 53.0 | 65.8 | 81.2 | 199.5 |
| Maximum stress, σmax (kPa) | 17.4 | 52.3 | 313.8 | 286.9 | 567.1 | 1094.6 | 1734.3 | 25,997.1 |
| Strain at σmax (%) | 3.0 | 15.0 | 17.7 | 18.4 | 21.0 | 27.7 | 31.7 | 64.0 |
| Displacement at σmax (mm) | 0.4 | 1.9 | 2.2 | 2.3 | 2.7 | 3.5 | 4.0 | 8.0 |
| Maximum Deceleration (ms−2) | Energy Return (%) | ||||||
|---|---|---|---|---|---|---|---|
| Left | Right | Average | Left | Right | Average | ||
| Reference | 270.61 | 277.11 | 273.86 | 50.06 | 48.84 | 49.45 | |
| Inserts | A | 224.67 | 226.45 | 225.56 | 39.05 | 37.15 | 38.10 |
| B | 215.02 | 218.22 | 216.62 | 40.98 | 37.83 | 39.41 | |
| C | 220.95 | 204.88 | 212.92 | 38.74 | 40.98 | 39.86 | |
| D | 210.15 | 215.58 | 212.87 | 43.72 | 43.85 | 43.79 | |
| E | 161.80 | 164.93 | 163.37 | 45.44 | 45.52 | 45.48 | |
| F | 168.19 | 162.51 | 165.35 | 44.37 | 43.32 | 43.85 | |
| G | 237.62 | 228.82 | 233.22 | 55.66 | 55.38 | 55.52 | |
| H | 250.33 | 238.17 | 244.25 | 56.31 | 54.67 | 55.49 | |
| User | Gender | Weight Range (kg) | More Comfortable Inserts (Justification) | Less Comfortable Inserts (Justification) |
|---|---|---|---|---|
| 1 | M | 61–70 | E and F (higher stability) | |
| 2 | M | 61–70 | C (softer) | |
| 3 | M | 81–90 | A (softer) and H (stable) | |
| 4 | M | 81–90 | B (better heel impact absorption) | |
| 5 | M | 71–80 | A to D (better heel impact absorption) and E | F to H (too rigid) |
| 6 | M | 81–90 | C and D (lower heel pressure) | G and H (higher heel pressure) |
| 7 | M | 61–70 | A to D (better impact absorption) | |
| 8 | M | 81–90 | G and H (more rigid) | |
| 9 | F | 61–70 | A (absorbs better the impact) | H (too rigid. Similar to the reference slippers) |
| 10 | M | 61–70 | C and D (softer) | G and H (too rigid) |
| 11 | M | 71–80 | F (rigid; similar to the reference slippers) | A and B (not stable) |
| 12 | M | 61–70 | A to D (softer) | |
| 13 | M | 71–80 | A to D (softer) | |
| 14 | F | 61–70 | A to D (softer) |
Publisher’s Note: MDPI stays neutral with regard to jurisdictional claims in published maps and institutional affiliations. |
© 2021 by the authors. Licensee MDPI, Basel, Switzerland. This article is an open access article distributed under the terms and conditions of the Creative Commons Attribution (CC BY) license (https://creativecommons.org/licenses/by/4.0/).
Share and Cite
Teixeira, R.; Coelho, C.; Oliveira, J.; Gomes, J.; Pinto, V.V.; Ferreira, M.J.; Nóbrega, J.M.; Silva, A.F.d.; Carneiro, O.S. Towards Customized Footwear with Improved Comfort. Materials 2021, 14, 1738. https://doi.org/10.3390/ma14071738
Teixeira R, Coelho C, Oliveira J, Gomes J, Pinto VV, Ferreira MJ, Nóbrega JM, Silva AFd, Carneiro OS. Towards Customized Footwear with Improved Comfort. Materials. 2021; 14(7):1738. https://doi.org/10.3390/ma14071738
Chicago/Turabian StyleTeixeira, Rafaela, Carlos Coelho, João Oliveira, Joana Gomes, Vera Vaz Pinto, Maria José Ferreira, João Miguel Nóbrega, Alexandre Ferreira da Silva, and Olga Sousa Carneiro. 2021. "Towards Customized Footwear with Improved Comfort" Materials 14, no. 7: 1738. https://doi.org/10.3390/ma14071738