A Highly Sensitive Room Temperature CO2 Gas Sensor Based on SnO2-rGO Hybrid Composite
by
 ,
,
Zhi Yan Lee
1,* ,
,
Huzein Fahmi bin Hawari
1,
Gunawan Witjaksono bin Djaswadi
1 and
Kamarulzaman Kamarudin
2 1
Department of Electrical and Electronics Engineering, Universiti Teknologi PETRONAS (UTP), Seri Iskandar 32610, Malaysia
2
School of Mechatronics Engineering, Universiti Malaysia Perlis (UniMAP), Kangar 01000, Malaysia
*
Author to whom correspondence should be addressed.
Materials 2021, 14(3), 522; https://doi.org/10.3390/ma14030522
Submission received: 15 November 2020
/
Revised: 14 December 2020
/
Accepted: 15 December 2020
/
Published: 22 January 2021
(This article belongs to the Special Issue Advanced Materials for Gas Sensors)
Abstract
:A tin oxide (SnO2) and reduced graphene oxide (rGO) hybrid composite gas sensor for high-performance carbon dioxide (CO2) gas detection at room temperature was studied. Since it can be used independently from a heater, it emerges as a promising candidate for reducing the complexity of device circuitry, packaging size, and fabrication cost; furthermore, it favors integration into portable devices with a low energy density battery. In this study, SnO2-rGO was prepared via an in-situ chemical reduction route. Dedicated material characterization techniques including field emission scanning electron microscopy (FESEM), high-resolution transmission electron microscopy (HRTEM), energy dispersive X-ray (EDX) spectroscopy, Raman spectroscopy, and X-ray photoelectron spectroscopy (XPS) were conducted. The gas sensor based on the synthesized hybrid composite was successfully tested over a wide range of carbon dioxide concentrations where it exhibited excellent response magnitudes, good linearity, and low detection limit. The synergistic effect can explain the obtained hybrid gas sensor’s prominent sensing properties between SnO2 and rGO that provide excellent charge transport capability and an abundance of sensing sites.
1. Introduction
CO2 is an odorless, tasteless, and colorless gas that is not easily detected by human senses. CO2 is also an essential air constitution and is associated with plant survival through photosynthesis. There is a great demand for sensitive CO2 sensors in various air quality control applications in the healthcare, space application, biotechnology, food industry, and mining field. In the healthcare industry, for example, sensitive CO2 sensors are desired in capnography to detect disease at early stages [1,2]. CO2 detection is also crucial in the international space station to ensure astronaut health and safety. A sensitive CO2 sensor is used to monitor the CO2 concentration in the air of the crew cabin during CO2 sequestration processes to ensure that CO2 is scrubbed [3]. In the bioprocesses sector, CO2 monitoring is important where slight CO2 concentration changes can affect microbial cells’ morphology, along with their metabolic products and rates [4]. Therefore, it is imperative to develop an effective and highly sensitive gas detection method for trace amounts of CO2, even at low concentrations or at room temperature.
Currently, CO2 gas sensors can be classified based on their operation mechanisms, such as resistive [5,6], surface acoustic wave (SAW) [7], optical [8,9], gas chromatography [10], and electrochemical sensor [11]. Resistive-type metal oxides have been widely utilized due to their compact size, long lifetime, low cost, and ease of production [5]. As an n-type semiconductor with a wide bandgap of 3.6 eV, tin(IV) oxide (SnO2) is the most recognizable metal oxide due to its potential in a wide variety of applications, including solar cells [12], energy storage [13], and gas sensing [14,15]. For CO2 sensing, various preparations of SnO2 have been explored by researchers. Wang et al. synthesized a SnO2 thick film sensor prepared by a coprecipitation method and showed a sensing response of 1.24 toward 2000 ppm CO2 at 240 °C [5]. Xiong et al. prepared undoped and lanthanum oxychloride (LaOCl)-doped SnO2 nanofibers through electrospinning techniques, where an operating temperature of 300 °C was used to achieve a sensing response of 1.04 and 3.7 toward 100 ppm CO2, respectively [16]. Trung et al. reported a CO2 sensor based on LaOCl–SnO2 nanowires, which showed a higher response (5.6) than that of bare SnO2 nanowires (~1.25) upon exposure to 2000 ppm CO2 at 400 °C [17]. According to these findings, typical metal oxide-based gas sensors suffer from detection limits near 100 ppm CO2. Furthermore, to operate at high temperatures (240–400 °C), heater circuitry is required, thereby limiting their use in miniaturized circuitry design found in a portable device. Moreover, high operating temperatures can also be dangerous for use in flammable environments such as oil fields. This shortcoming has given rise to a strong dependency on a power source and could deteriorate the lifetime of the gas sensor [18]. Therefore, exploring solutions to have low operating temperatures for SnO2-based gas sensors is essential to maintain sensor reliability.
Graphene is a carbon allotrope composed of a single layer of sp2 carbon atoms connected in a hexagonal structure. Graphene, which was first discovered by K. Novoselov and K. A. Geim in 2004, has recently gained researchers’ attention because of its extraordinary electrical, thermal, and mechanical characteristics [19]. Reduced graphene oxide (rGO) is a candidate for obtaining room-temperature CO2 gas sensing properties close to graphene, such as high electron mobility, high signal-to-noise ratio, and suitability for large-scale synthesis [20,21].
Synergistic hybridization of rGO with metal oxide particles has been an effective way to greatly improve gas detection because it combines both materials’ traits and enhances gas sensing capabilities toward various gases. Many composite modifications have been made, such as the formation of SnO2/rGO [22,23,24,25,26,27], zinc oxide/reduced graphene oxide (ZnO/rGO) [28], cobalt oxide/reduced graphene oxide (Co3O4/rGO) [29] and tin-titanium dioxide/reduced graphene oxide/carbon nanotube (Sn–TiO2/rGO/CNT) [30]. These composites exhibit good gas detection, including enhanced sensitivity at room temperature. Great structures have been produced via hydrothermal [23] and sol-gel [31] synthetization methods to fulfill the unique advantages of SnO2-rGO toward their specific applications.
To date, attempts made to fabricate CO2 gas sensors based on metal oxide/rGO hybrid composite are very limited because, unlike common gases such as ammonia, acetone, and ethanol, CO2 is rather inert in nature. Hence, this research attempts to address the above problem by leading us to pursue a strategy to realize a better gas sensor for detecting CO2 using the aforementioned metal oxide-rGO composite. Additionally, the reaction process involving CO2 can be better understood. Meanwhile, since the publicly available reaction process involving air as carrier gas becomes active sensing sites at the surface of the material, that gives an advantage to sensing performance. Nitrogen is used instead to let the reader understand the underlying direct sensing mechanism of hybrid composite towards CO2 [5,32,33].
In the current work, the SnO2-decorated rGO hybrid composite was synthesized through a facile reduction method. Since most resistive gas sensors that run on the interdigitated electrode (IDE) involves a simple measuring method and easy device design, the above was chosen as the sensing platform for this study in which a thin sensing film was coated directly on a silicon substrate prepatterned with an IDE. Consequently, the SnO2-rGO gas sensor’s response toward various concentrations of CO2 operated at room temperature was studied, and the performance was compared with that of a bare rGO gas sensor. A comprehensive study of the CO2 gas sensing mechanism was also presented.
2. Materials and Methods
2.1. Materials and Reagents
All reagents, including a commercial 0.4 wt.% liquid graphene oxide (Graphenea, San Sebastian, Spain), tin (II) chloride dihydrate (SnCl2·2H2O), ethylene glycol, ammonium hydroxide, and ascorbic acid (Sigma Aldrich, St. Louis, MI, USA), were analytical grade and were used without further purification.
2.2. Preparation of SnO2-rGO Hybrid Composite and rGO
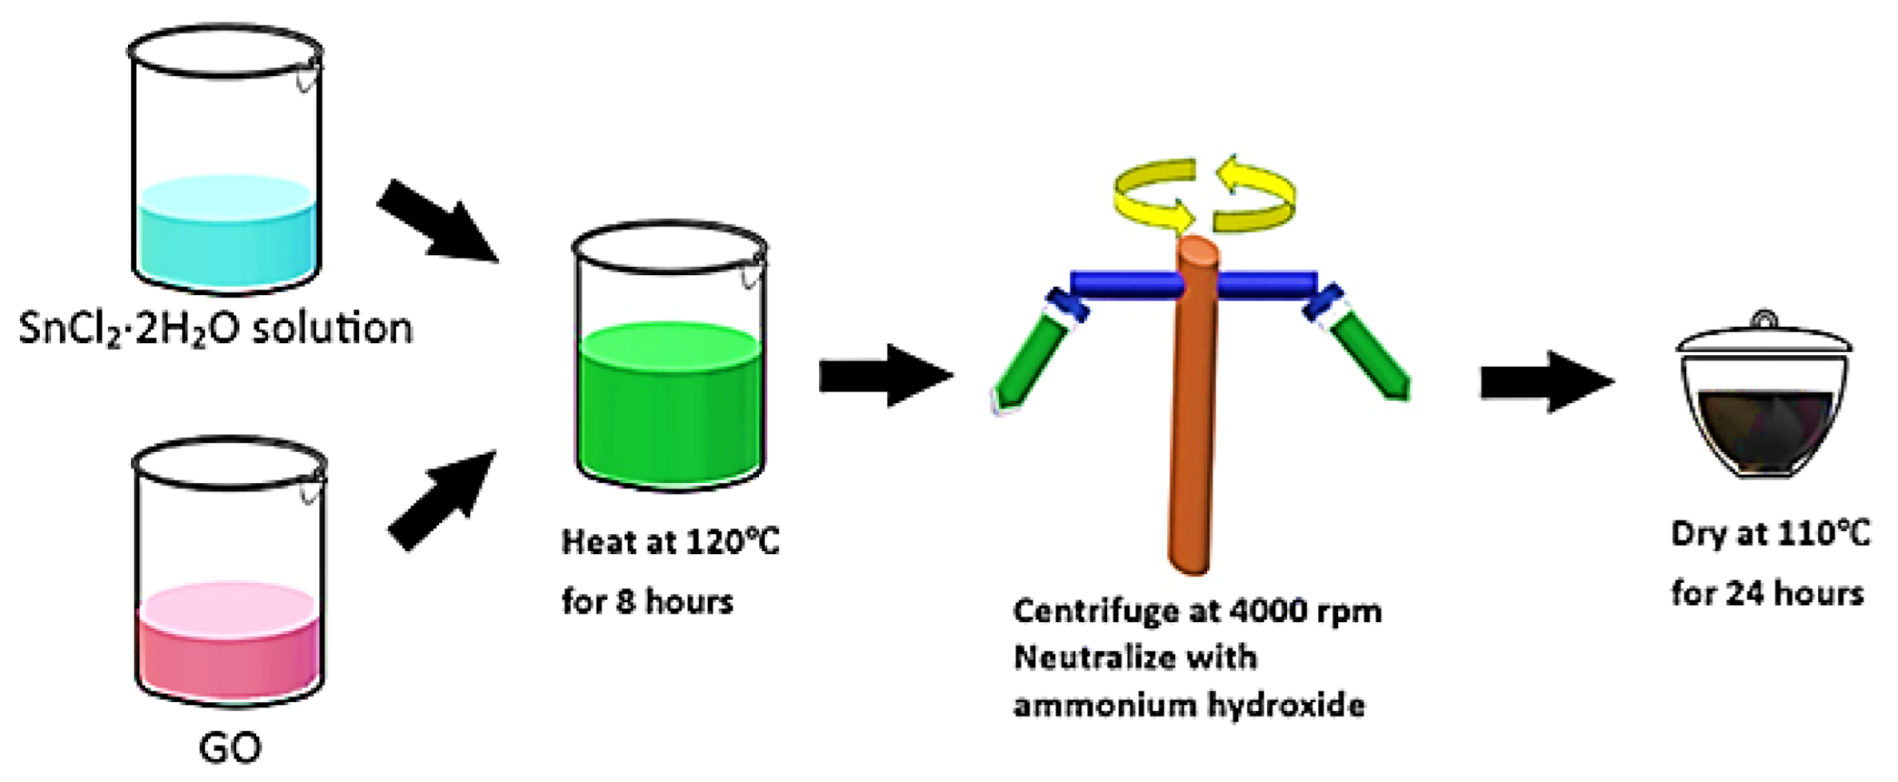
Figure 1 shows the SnO2-rGO hybrid composite that was synthesized via a modified reduction method as described in the literature [34]. 10 mL of graphene oxide (GO) were first dispersed in 40 mL of distilled water by ultrasonication for 1 h. After that, approximately 2 g of tin (II) chloride dihydrate (SnCl2·2H2O) were dissolved in 10 mL ethylene glycol in another beaker under vigorous stirring at room temperature for 1 h, during which the mixture color turned from a transparent to a milky white medium. Subsequently, the precursor solution was added to the GO suspension and heated to 120 °C for 8 h. The as-prepared suspension was then centrifuged and washed with distilled water to remove remaining contaminants such as unwanted ions. A small amount of ammonium hydroxide (10%) was added to neutralize the colloid’s acidity. For comparison, rGO was prepared using the same procedure by replacing tin salt to treat an environmentally friendly yet effective reducing agent, ascorbic acid [35].
2.3. Interdigitated Electrode (IDE) Sensor Fabrication
An IDE platform was fabricated through a photolithography process to investigate the sensing performance of the SnO2-rGO gas sensor towards CO2. Firstly, the silicon wafer was cleaned using a solution containing hydrogen peroxide, hydrogen fluoride, and DI water. A wet oxidation process was then carried out to grow a layer of SiO2 on top of silicon wafer before a conductive layer of aluminum is sputtered on top of the substrate. Next, the IDE pattern transfer process was completed from the mask to the top of the silicon substrate. During this process, UV light was passed through a photomask to transfer the IDE pattern on the photoresist covering the top of the silicon substrate. The area which was not covered by photomask was wiped out during the etching process until the IDE structure was formed on the silicon substrate. Then, 2 µL of the as-prepared SnO2-rGO in an aqueous solution was deposited on top of the IDE with a sensing area of 5.81 mm2 (7 mm width × 0.83 mm height) by using an electronic micropipette (EK80218 PIPETMAN, GILSON, Middleton, WI, USA) through a drop-casting method to produce a thin film. The thickness of the composite film was determined to be approximately ~792.311 nm from the Atomic Force Microscopy observation.
2.4. Gas Sensing Measurement
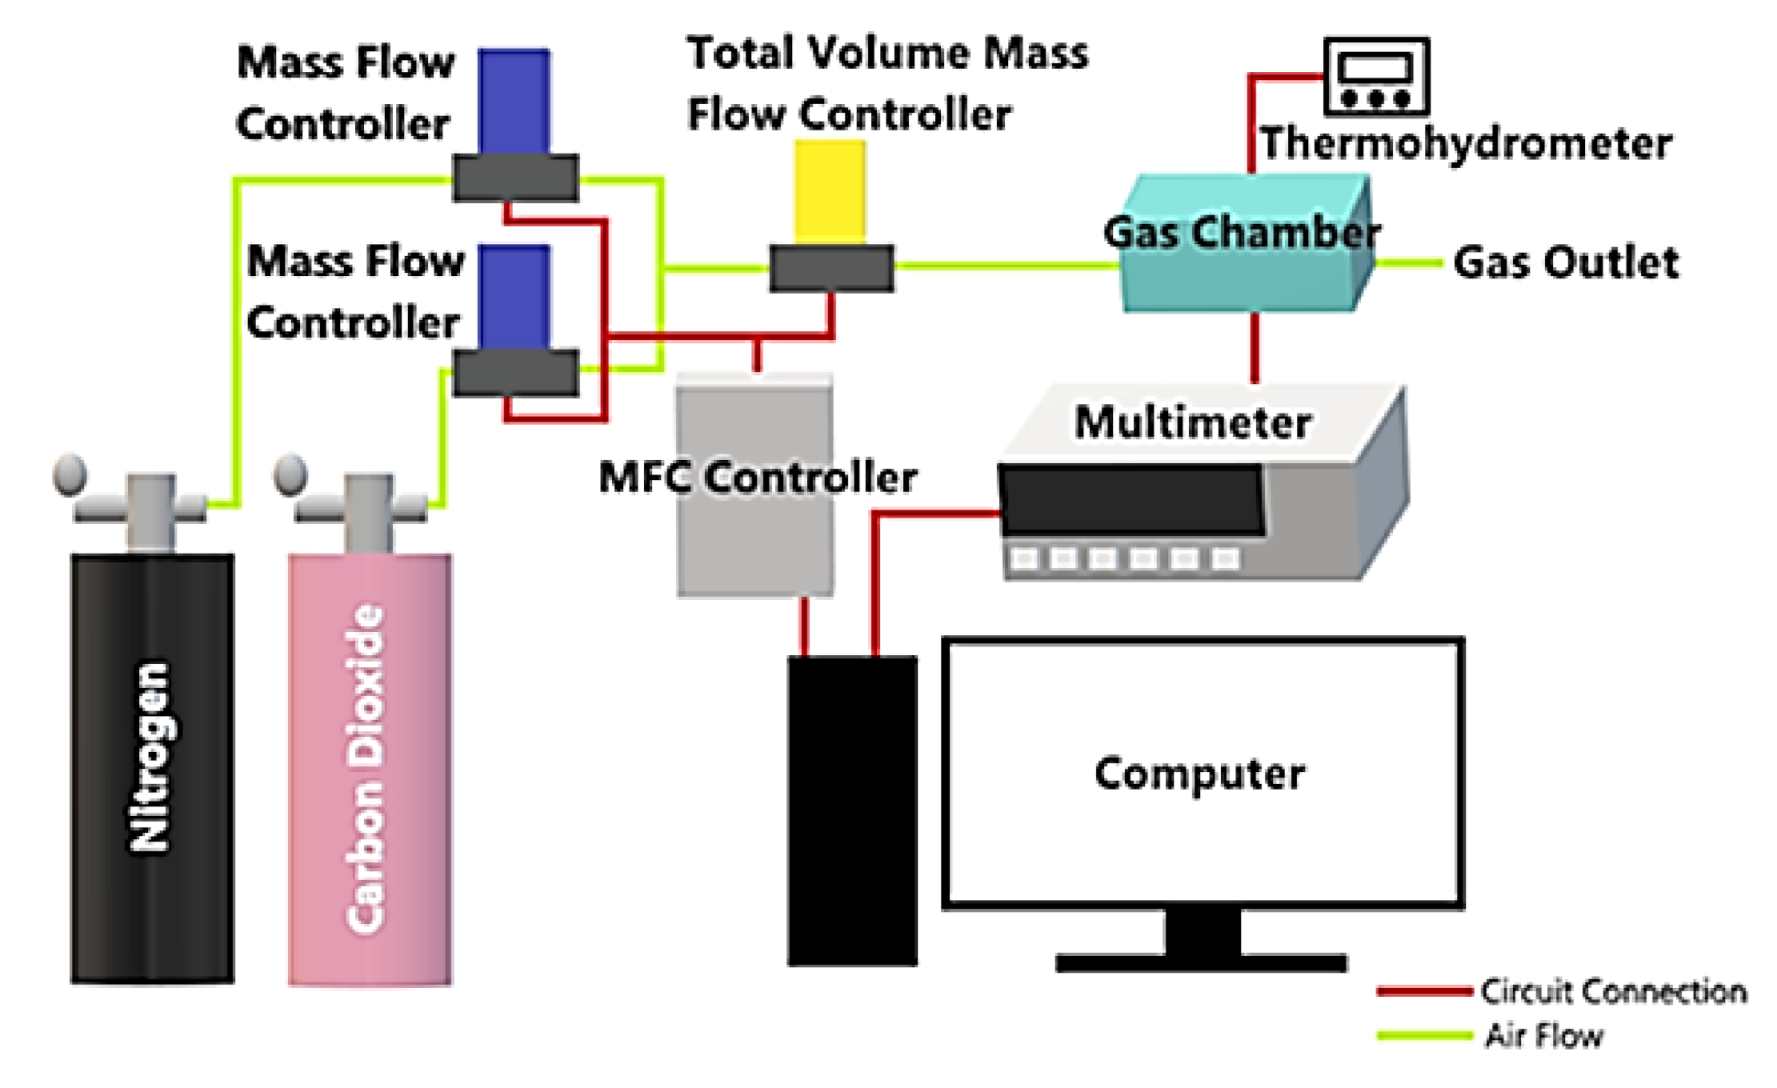
The testing setup used to evaluate sensor performance toward CO2 is schematically illustrated in Figure 2. The data acquisition system consisted of a computer-controlled multimeter (34410A, Keysight, Santa Rosa, CA, USA) connected to the IDE pads through a probe station to measure the gas sensor’s electrical resistance towards CO2 and nitrogen exposure at room temperature.
The target gases used in this study were CO2 (50 ppm and 500 ppm, Linde, Malaysia) and nitrogen (Linde, Malaysia). Different desired concentrations of gas were purged into an air-tight chamber by diluting the stock CO2 gas with known volumes of nitrogen gas using digital mass flow controllers (MFC, DFC26, Aalborg, Orangeburg, SC, USA). The final gas flow was kept at 300 mL/min. Teflon protectors were used in the metal joints of the gas chamber to seal against gas leaks. The room temperature and relative humidity inside the chamber were closely monitored using a digital thermohydrometer. The sensing experiment was conducted in a nitrogen environment and operated under ambient room conditions at 23.5 ± 1 °C and 58 ± 3% RH. Every sensing measurement started with the lowest CO2 concentration (5 ppm) and increased gradually until all desired gas concentrations are recorded (5–500 ppm). Before the next target concentration is tested, the gas sensor is purged with nitrogen gas in intervals.
The sensor’s response that reflects the concentration of CO2 can be measured by monitoring the resistance across the IDE pads. The gas sensor response is expressed in terms of resistance change upon exposure to gas analytes and nitrogen (Equation (1)):
where Ra is the baseline electrical resistance of the gas sensor when exposed to nitrogen and Rg is the resistance in the presence of the target gas. The response time was defined as the sensor’s time to reach 90% of the maximum response change upon exposure to the gas samples. Similarly, recovery time was defined as the time needed to recover back to 10% of the initial baseline value upon exposure to nitrogen gas while cutting off the gas supply from the CO2.
Response, Rs = (Rg − Ra)/Ra × 100 %
2.5. Material Characterization
Surface morphologies of the SnO2-rGO hybrid composite and rGO sample were examined using variable pressure field emission scanning electron microscopy (FESEM: SUPRA 55VP, Carl Zeiss AG, Oberkochen, Baden-Württemberg, Germany) with energy dispersive spectroscopy (EDX). The morphological analysis was further analyzed by high-resolution transmission electron microscopy (HRTEM: Tecnai G2 F20, FEI, Hillsboro, OR, USA). The Raman spectra of the samples were obtained using a Raman spectrometer (Jobin-Yvon LabRAM, HR800, Horiba, Kyoto, Kansai, Japan, 514 nm). The XPS measurements were recorded on an X-ray Photoelectron Spectrometer (K-Alpha, Thermo Scientific, Waltham, MA, USA, 400 µm) using an Al X-ray radiation excitation source.
3. Results
3.1. Topographic Details
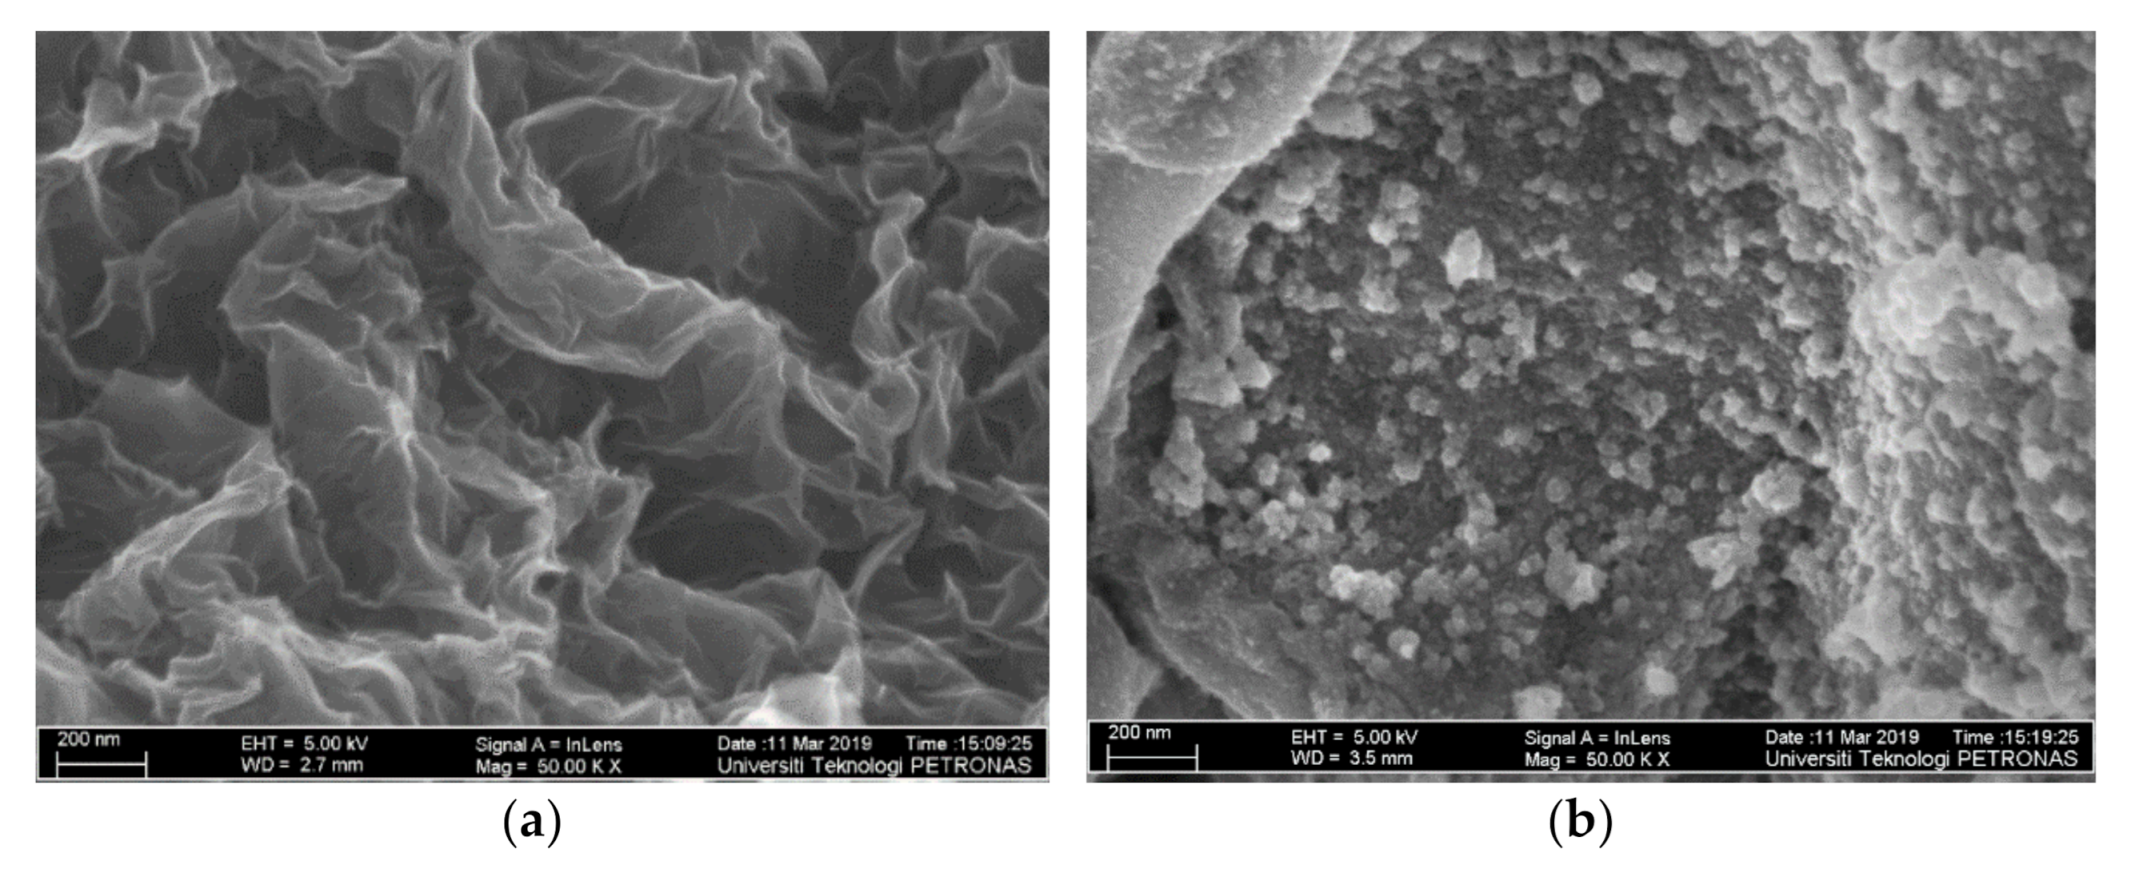
FESEM was conducted to characterize the surface morphology of the rGO and SnO2-rGO composite. As depicted in Figure 3a, under 50 kX magnification, wrinkles made of stacks of single rGO layers can be found everywhere on the surface, which matches with amorphous rGO characteristics [36]. As vividly demonstrated in Figure 3b, synthesized SnO2-rGO consists of highly crystalline and spherical constituents, which verify the existence of SnO2. With the introduction of an appropriate amount of SnO2 cubes into rGO during the facile reduction process, the SnO2 species are tightly encased within rGO sheets, and the SnO2 small nanocrystals do not agglomerate with each other. SnO2 nanocrystals fill in the neighboring rGO spaces, and this wide area of rGO with a crystalline structure of SnO2 allows more active sites for gas interaction.
As an anti-settling agent, ethylene glycol was included during material synthesis to keep rGO stable after losing its hydrophilic characteristics during the GO reduction process [26]. When the solution is coated on IDE, SnO2 and rGO fuse together and form a continuous nanocomposite film on the silicon substrate after hardening. The above reduction method produces an organized hybrid structure with distinctive characteristics and paves the way for excellent gas-sensing performance.
3.2. Grain Size Analysis
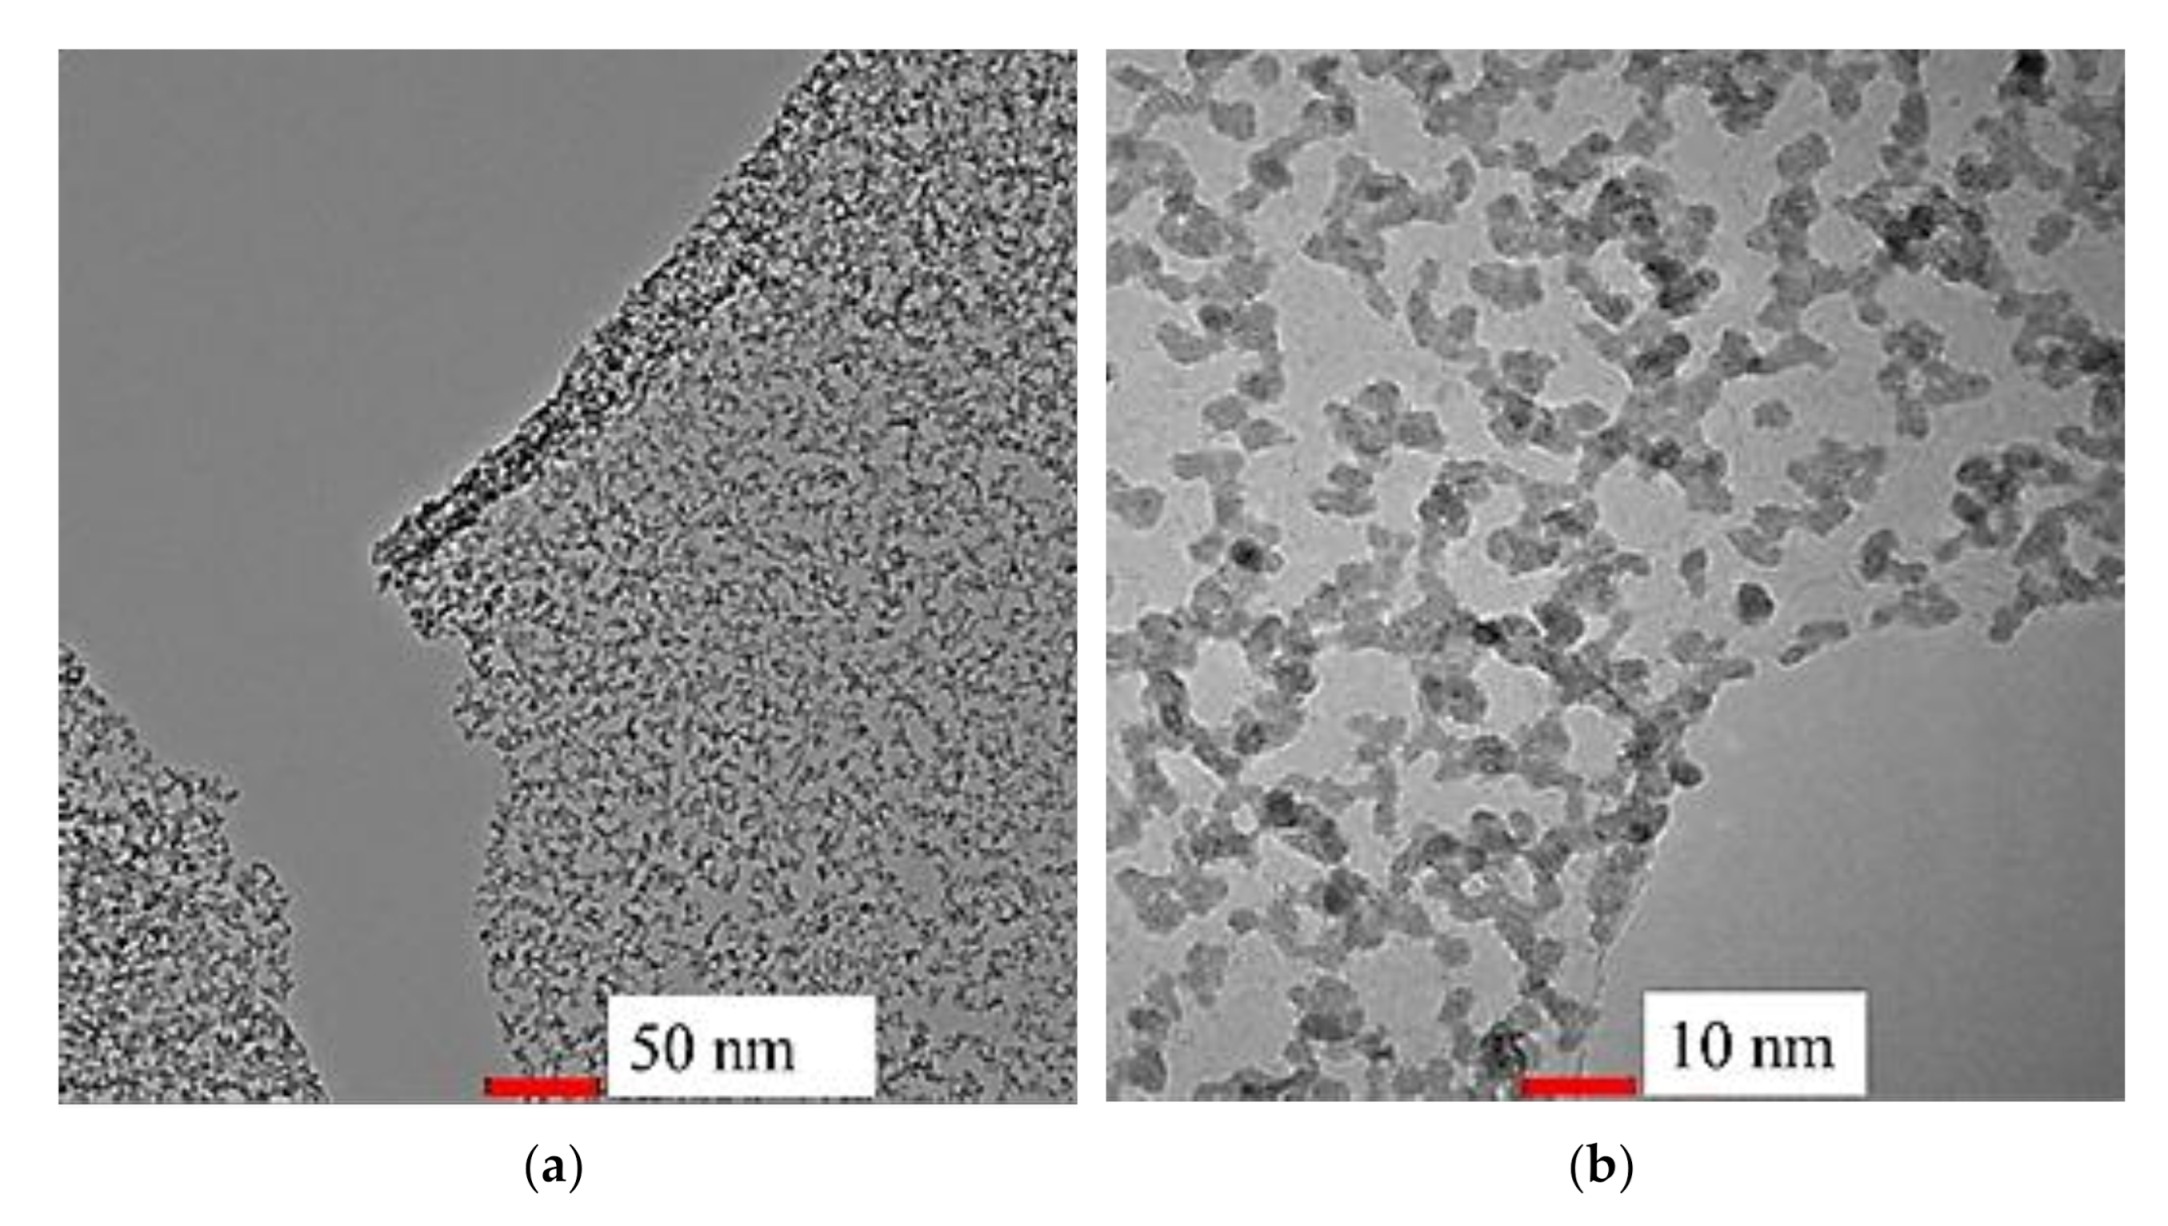
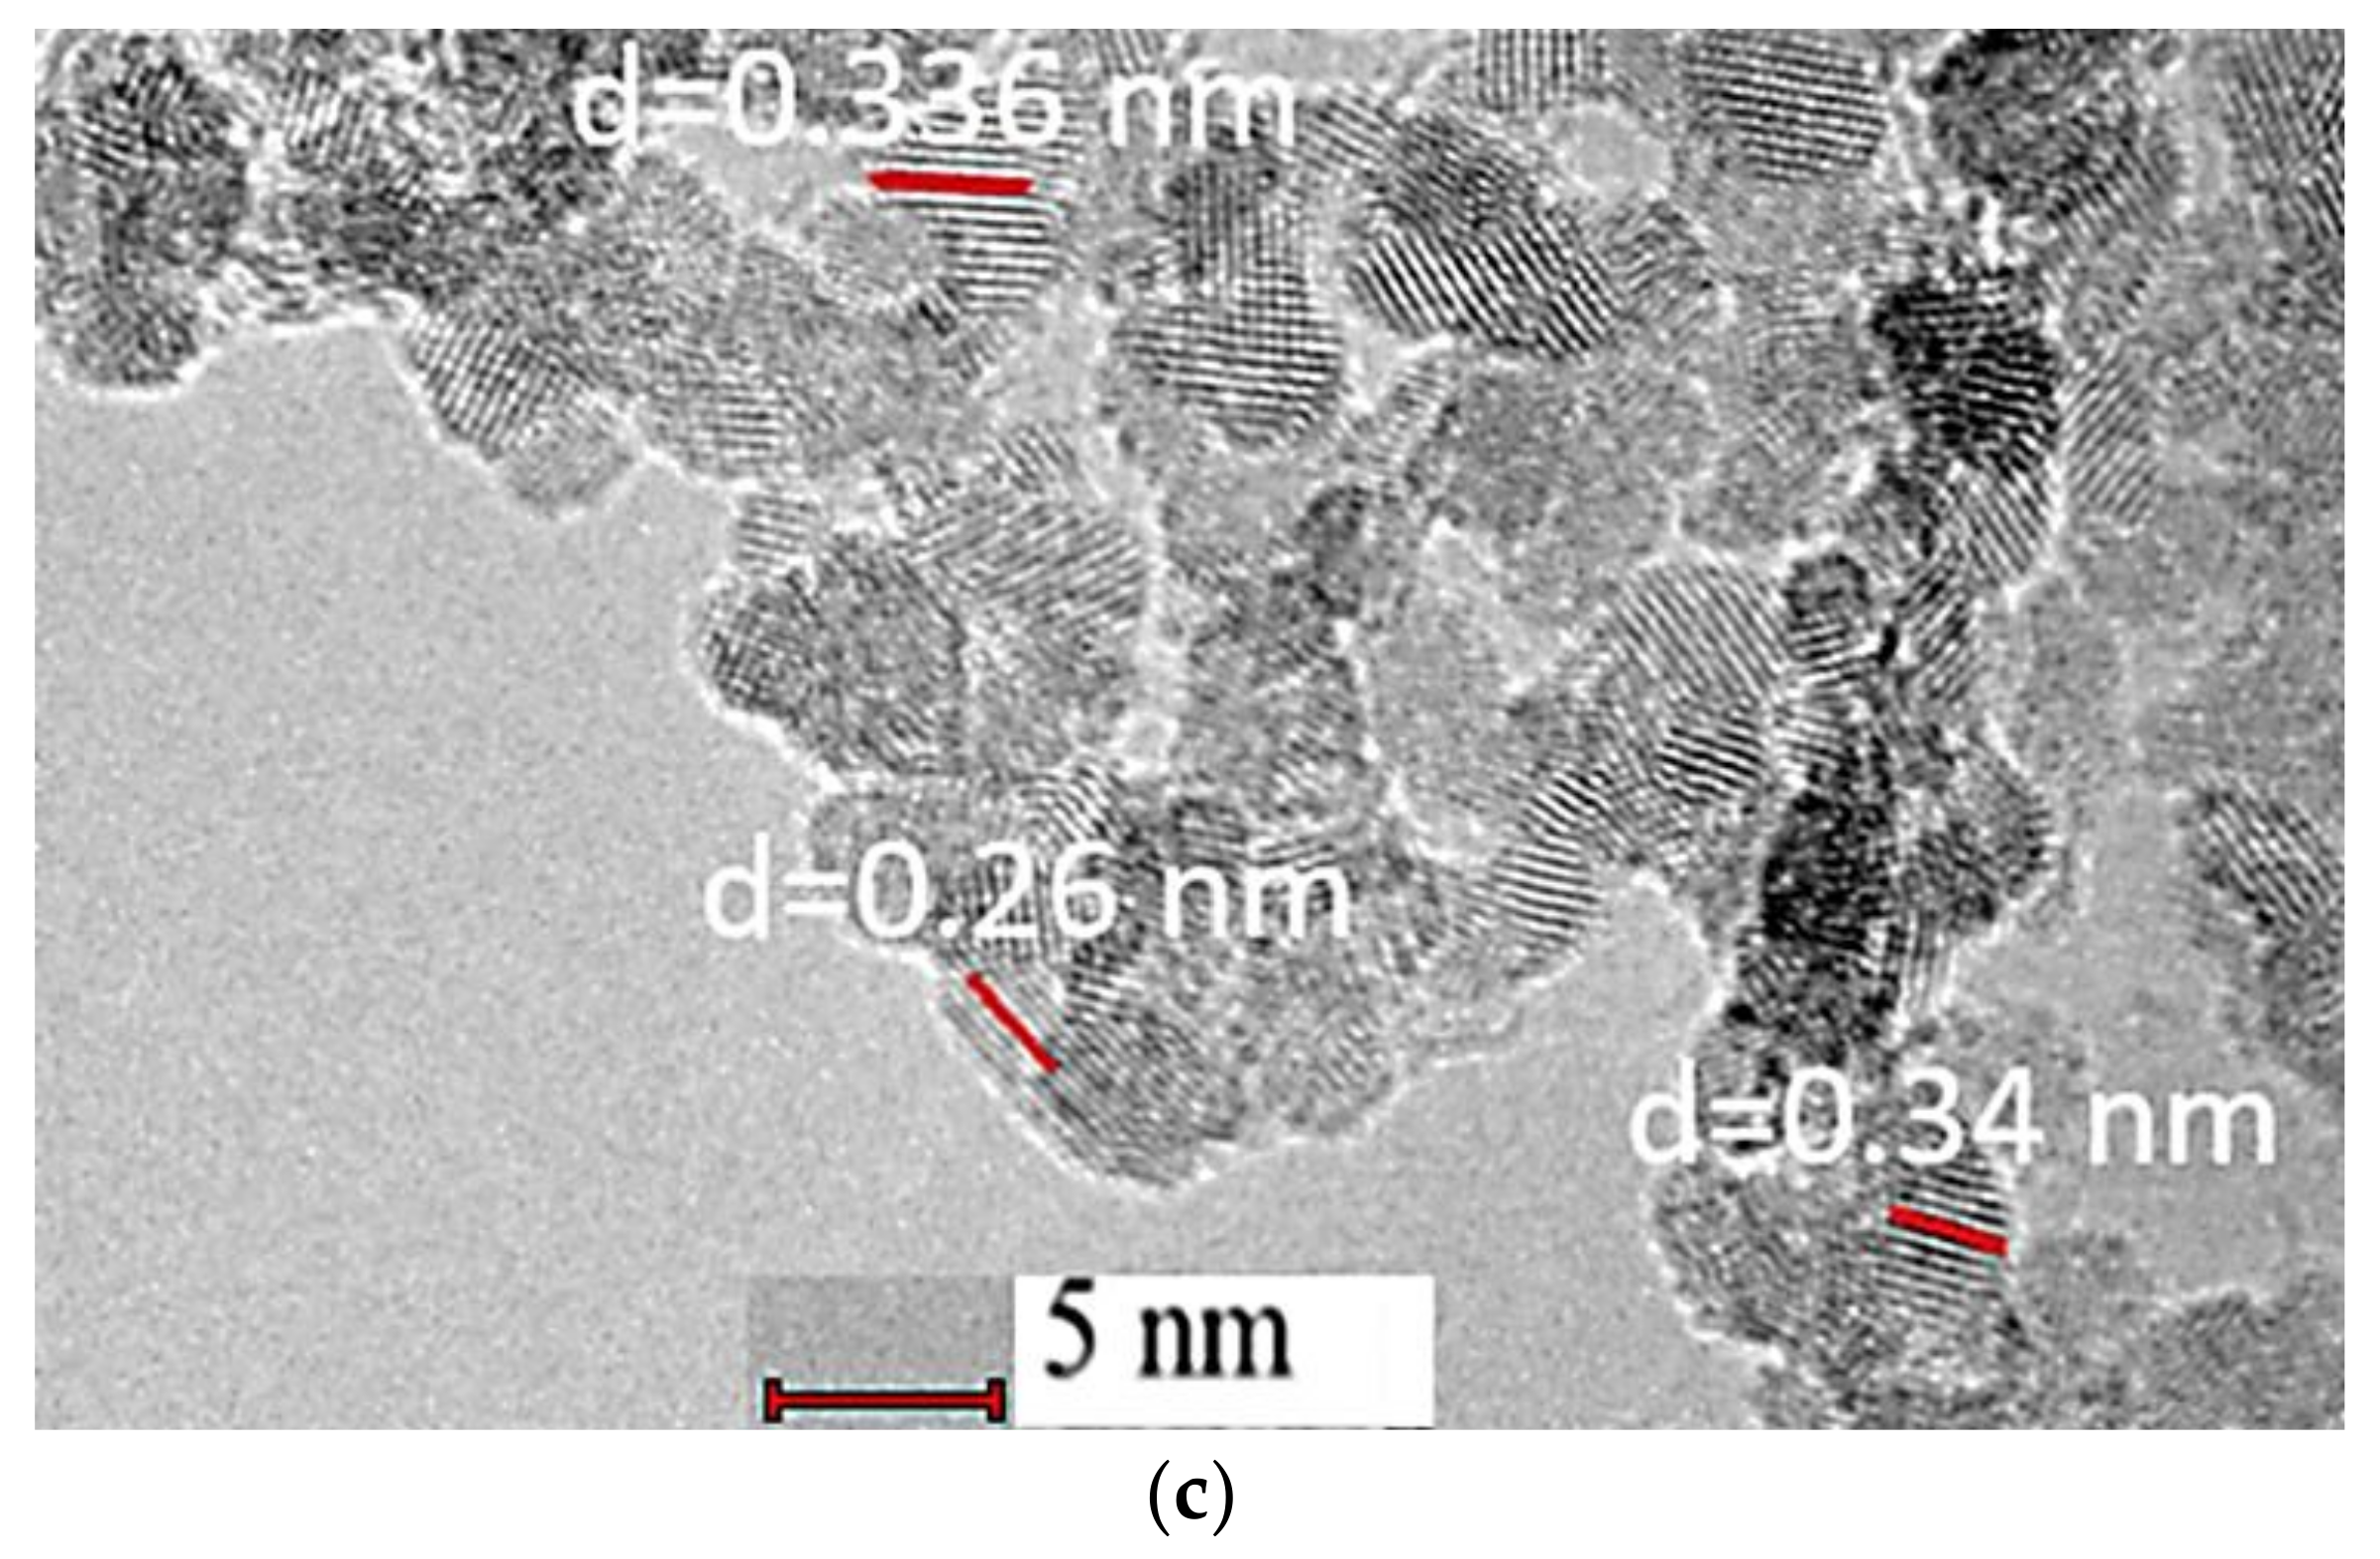
In order to study the grain size of SnO2-rGO nanostructures, HRTEM analysis was carried out. As shown in Figure 4a,b, the pristine SnO2 samples with a diameter ranging from 3–7 nm were observed to be well distributed and properly grown on the transparent rGO sheet. As referred to in Figure 4c, lattice fridges from the sample show two sizes of interplanar spacings consisted of 0.26 and 0.34 nm on average, which corresponds to the (101) and (110) planes from highly crystalline SnO2 samples [37]. The morphological characteristics showed above match with the SnO2-rGO composite found in previous studies [38,39].
3.3. Elemental Composition
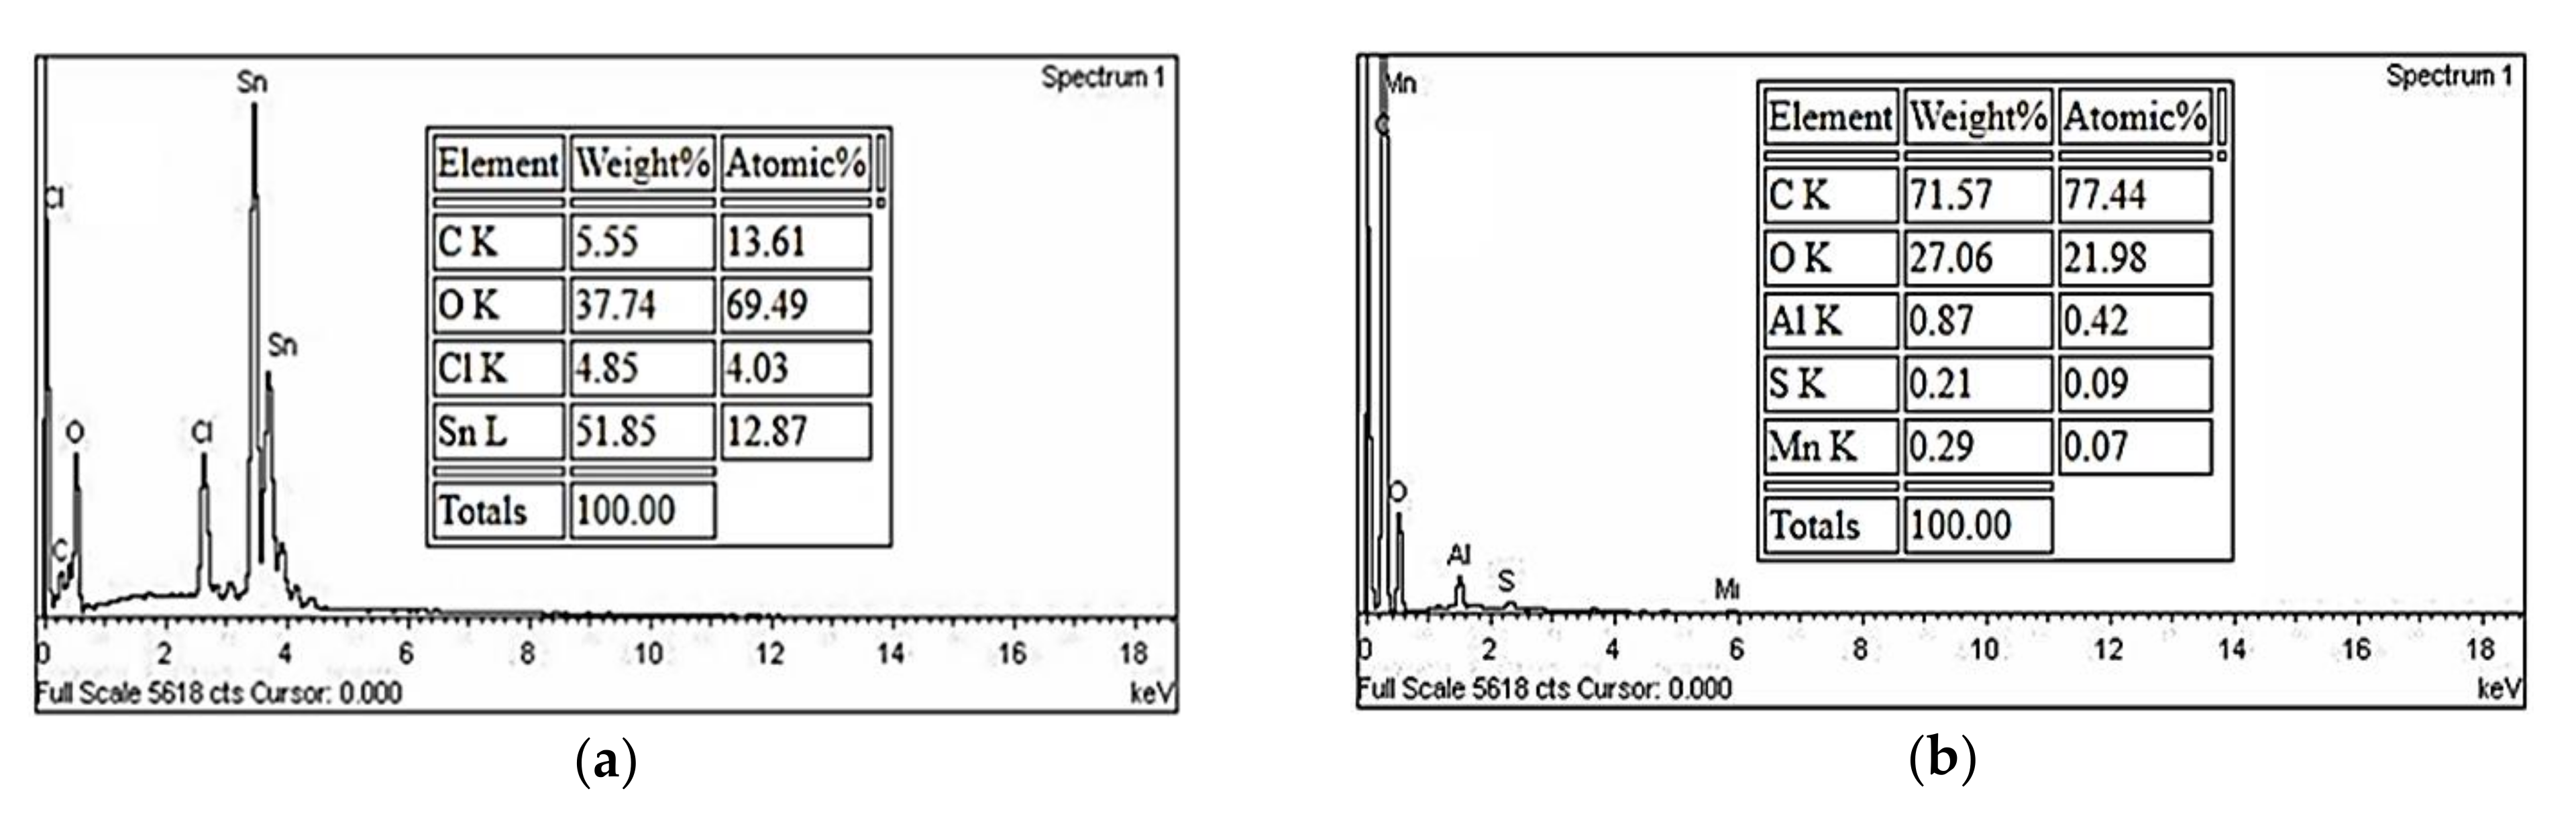
EDX spectrometry was used to identify the elemental composition of the analyzed sample. As shown in Figure 5a, the tin content was 51.85 wt.%, to confirm the existence of SnO2 in the hybrid composite film through the reduction route. Moreover, the weight ratio of carbon to oxygen found in SnO2-rGO was 0.147, which was less than the 2.645 ratios found in rGO alone, as clearly shown in Figure 5. Content of oxygen element found in hybrid composites is higher because SnO2 dopant contains oxygen anions and oxygen residues after reduction of GO within the SnO2-rGO composite [40,41,42]. The occurrence of carbon (C), oxygen (O), and tin (Sn) further confirm the formation of SnO2-rGO during the in-situ reduction process.
3.4. Material Crystallinity, Orientation, and Phases Analysis
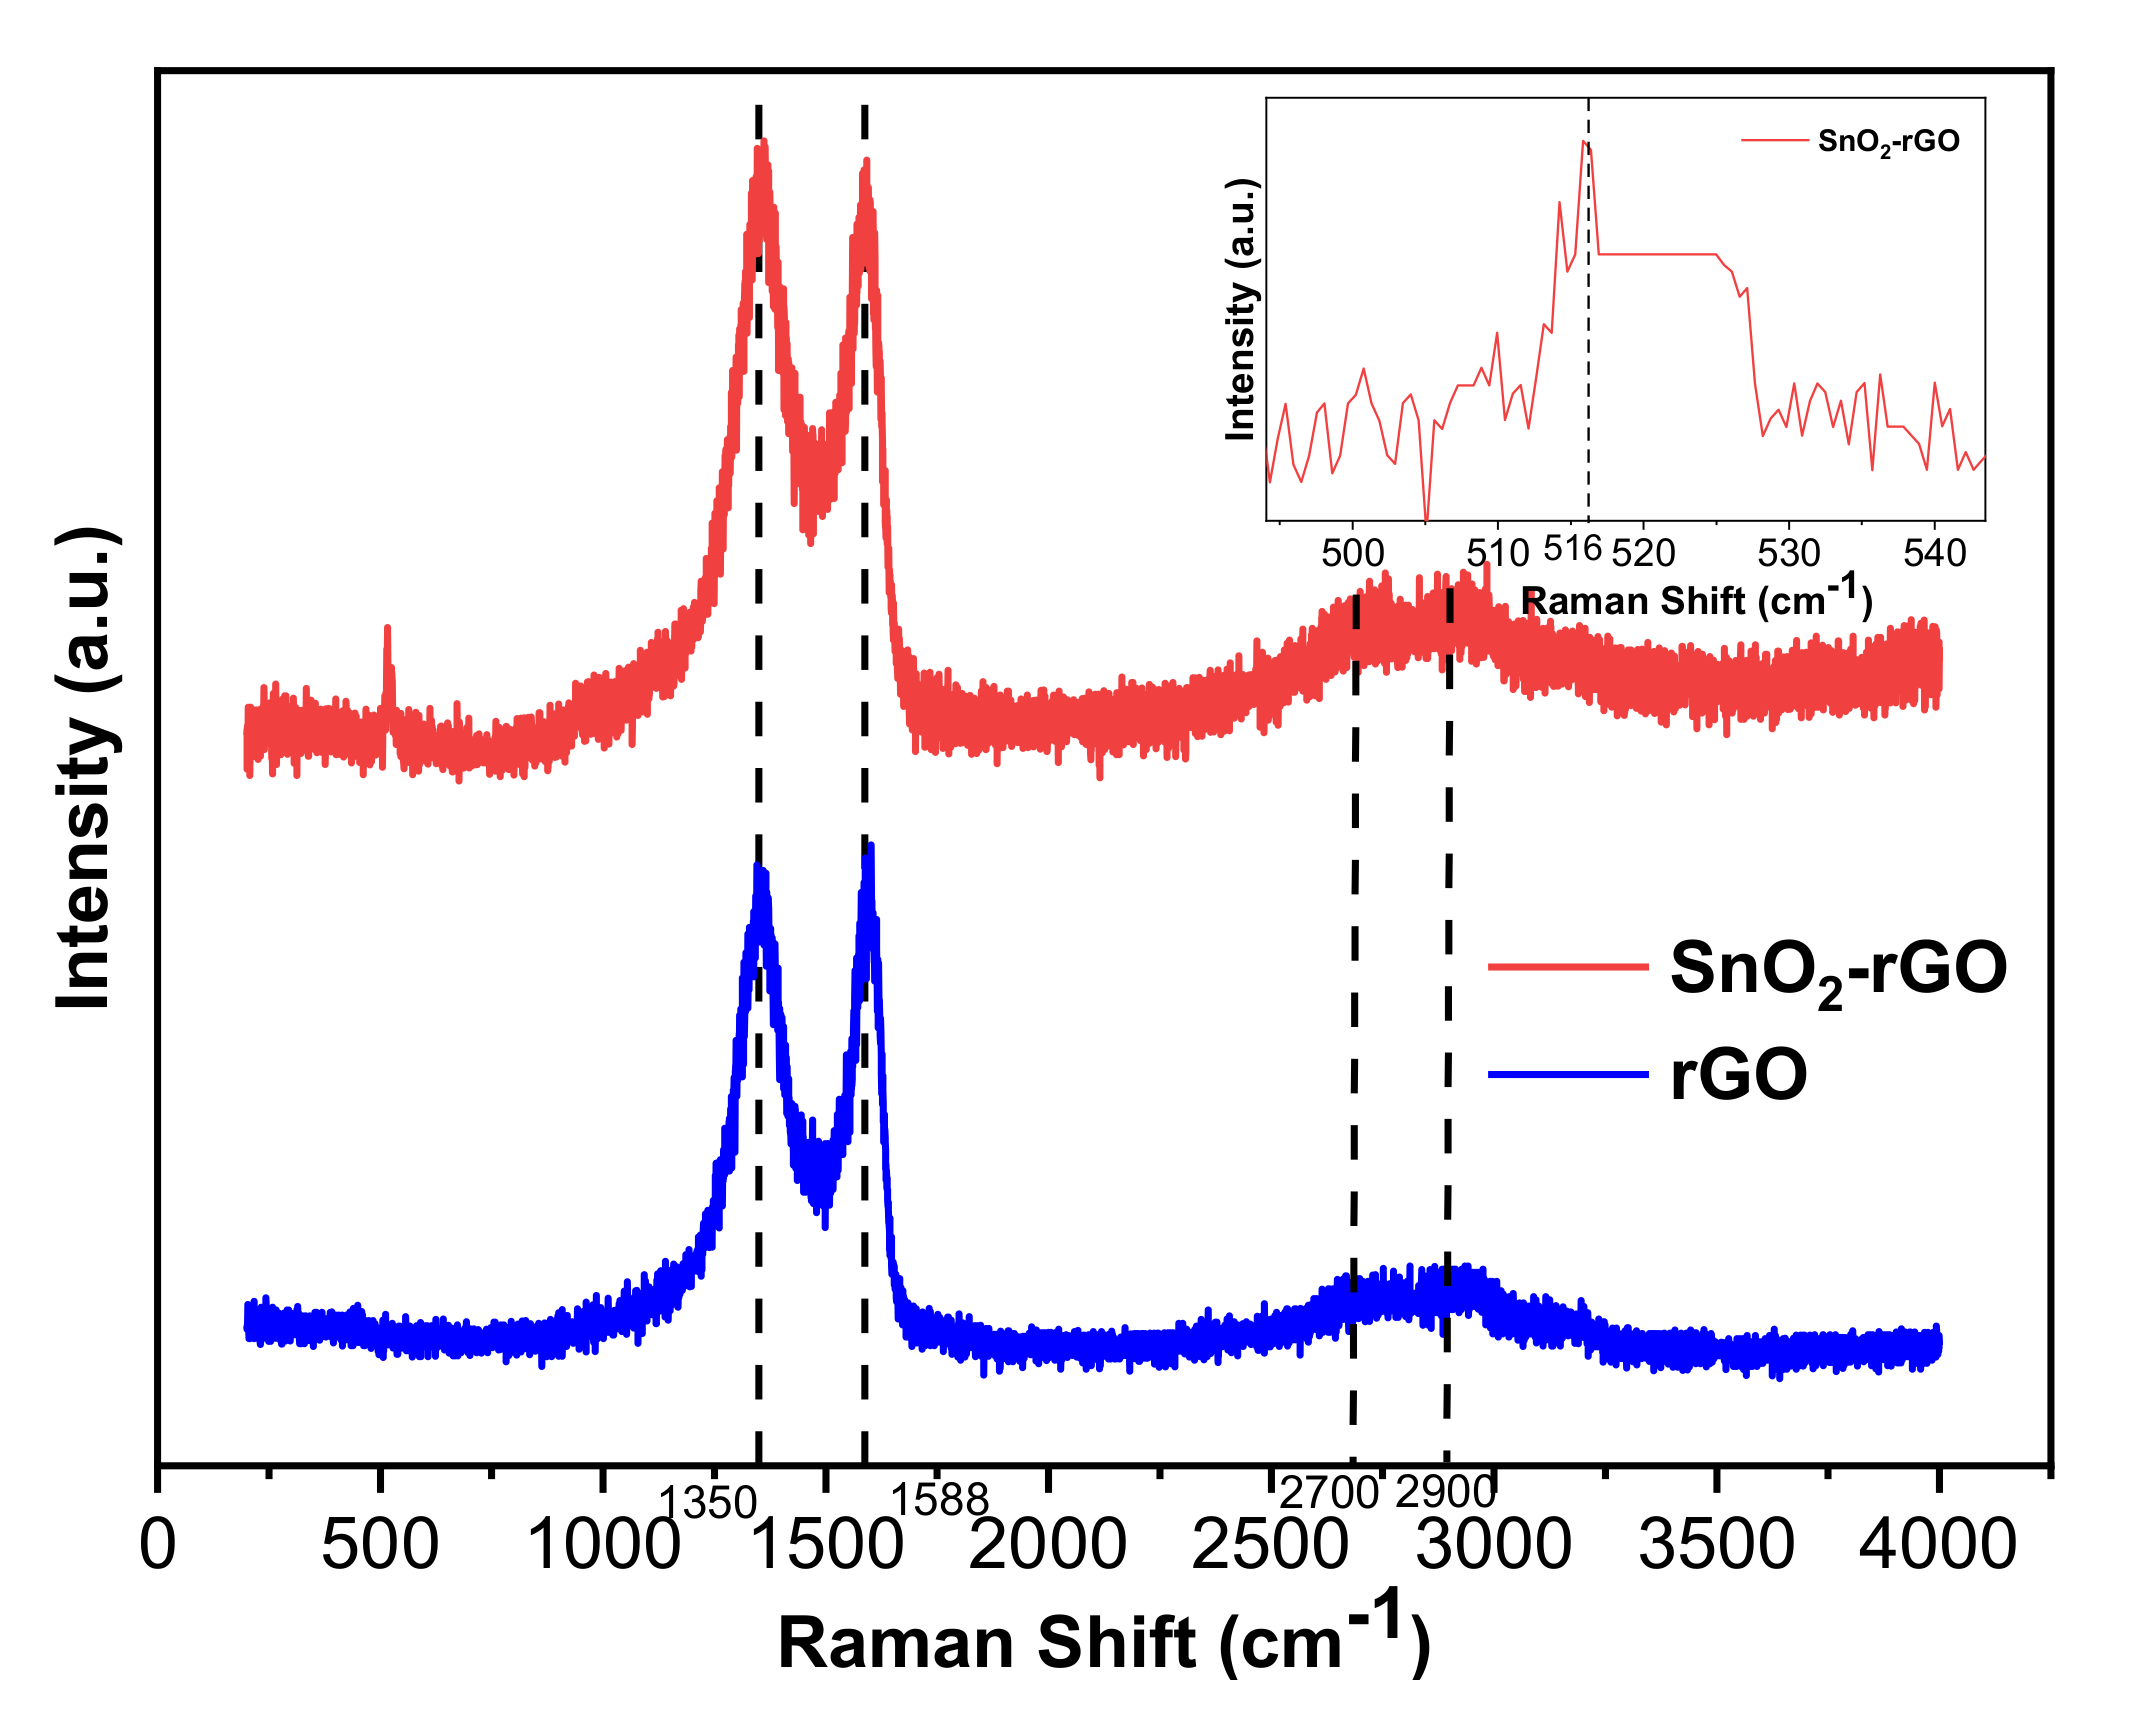
Nondestructive Raman spectra can provide insight into the defects and disorders found in carbon-related structures after a reduction process. As shown in Figure 6, both SnO2-rGO and pristine rGO share two prominent bands in common: the D band within the range of 1350 to 1361 cm−1 and the G band between 1588 and 1592 cm−1, which matches the characteristics of pristine graphene [27,43]. The D peak with high amplitude indicates an A1g breathing mode due to defects and disordered regions induced by functional groups with the sp2 hybridized carbon [43]. The G band’s position is shifted to the right, indicating that the better restoration of the carbon plane’s electronic structure is due to the doping effect between SnO2 and rGO [27]. The G peak corresponds to an E2g breathing mode from the C-C bond stretching of sp2 carbonaceous-based graphene material [38]. Two weak peaks, referred to as second-order D and G (2D and 2G) bands, were also observed overlapping between 2700 and 2900 cm−1. In this case, the material has a multilayer structure, which further reinstates that the facile chemical routes successfully synthesize high-density rGO [25,43]. The 2D and 2G peaks will appear regardless of defects in the material.
The intensity ratio (Id/Ig) provides insight into the reduction of GO, which helps determine the structural disorder of the synthesized material. After the addition of SnO2 to rGO, the intensity ratio of the D band and G band is 1.006, higher than the 0.993 from rGO. The improved intensity ratio implies that the synergistic effect of the SnO2-rGO hybridization creates more disorder in terms of vacancies and grain boundaries and decreases the size of the sp2 carbon domain [25,27,44]. GO can be efficiently reduced to a higher degree with tin salt rather than ascorbic acid. The D and G bands’ good intensity ratio and position indicate that SnO2-rGO could provide efficient electron transfer at interfaces during the gas sensing process.
3.5. Chemical Bonding States
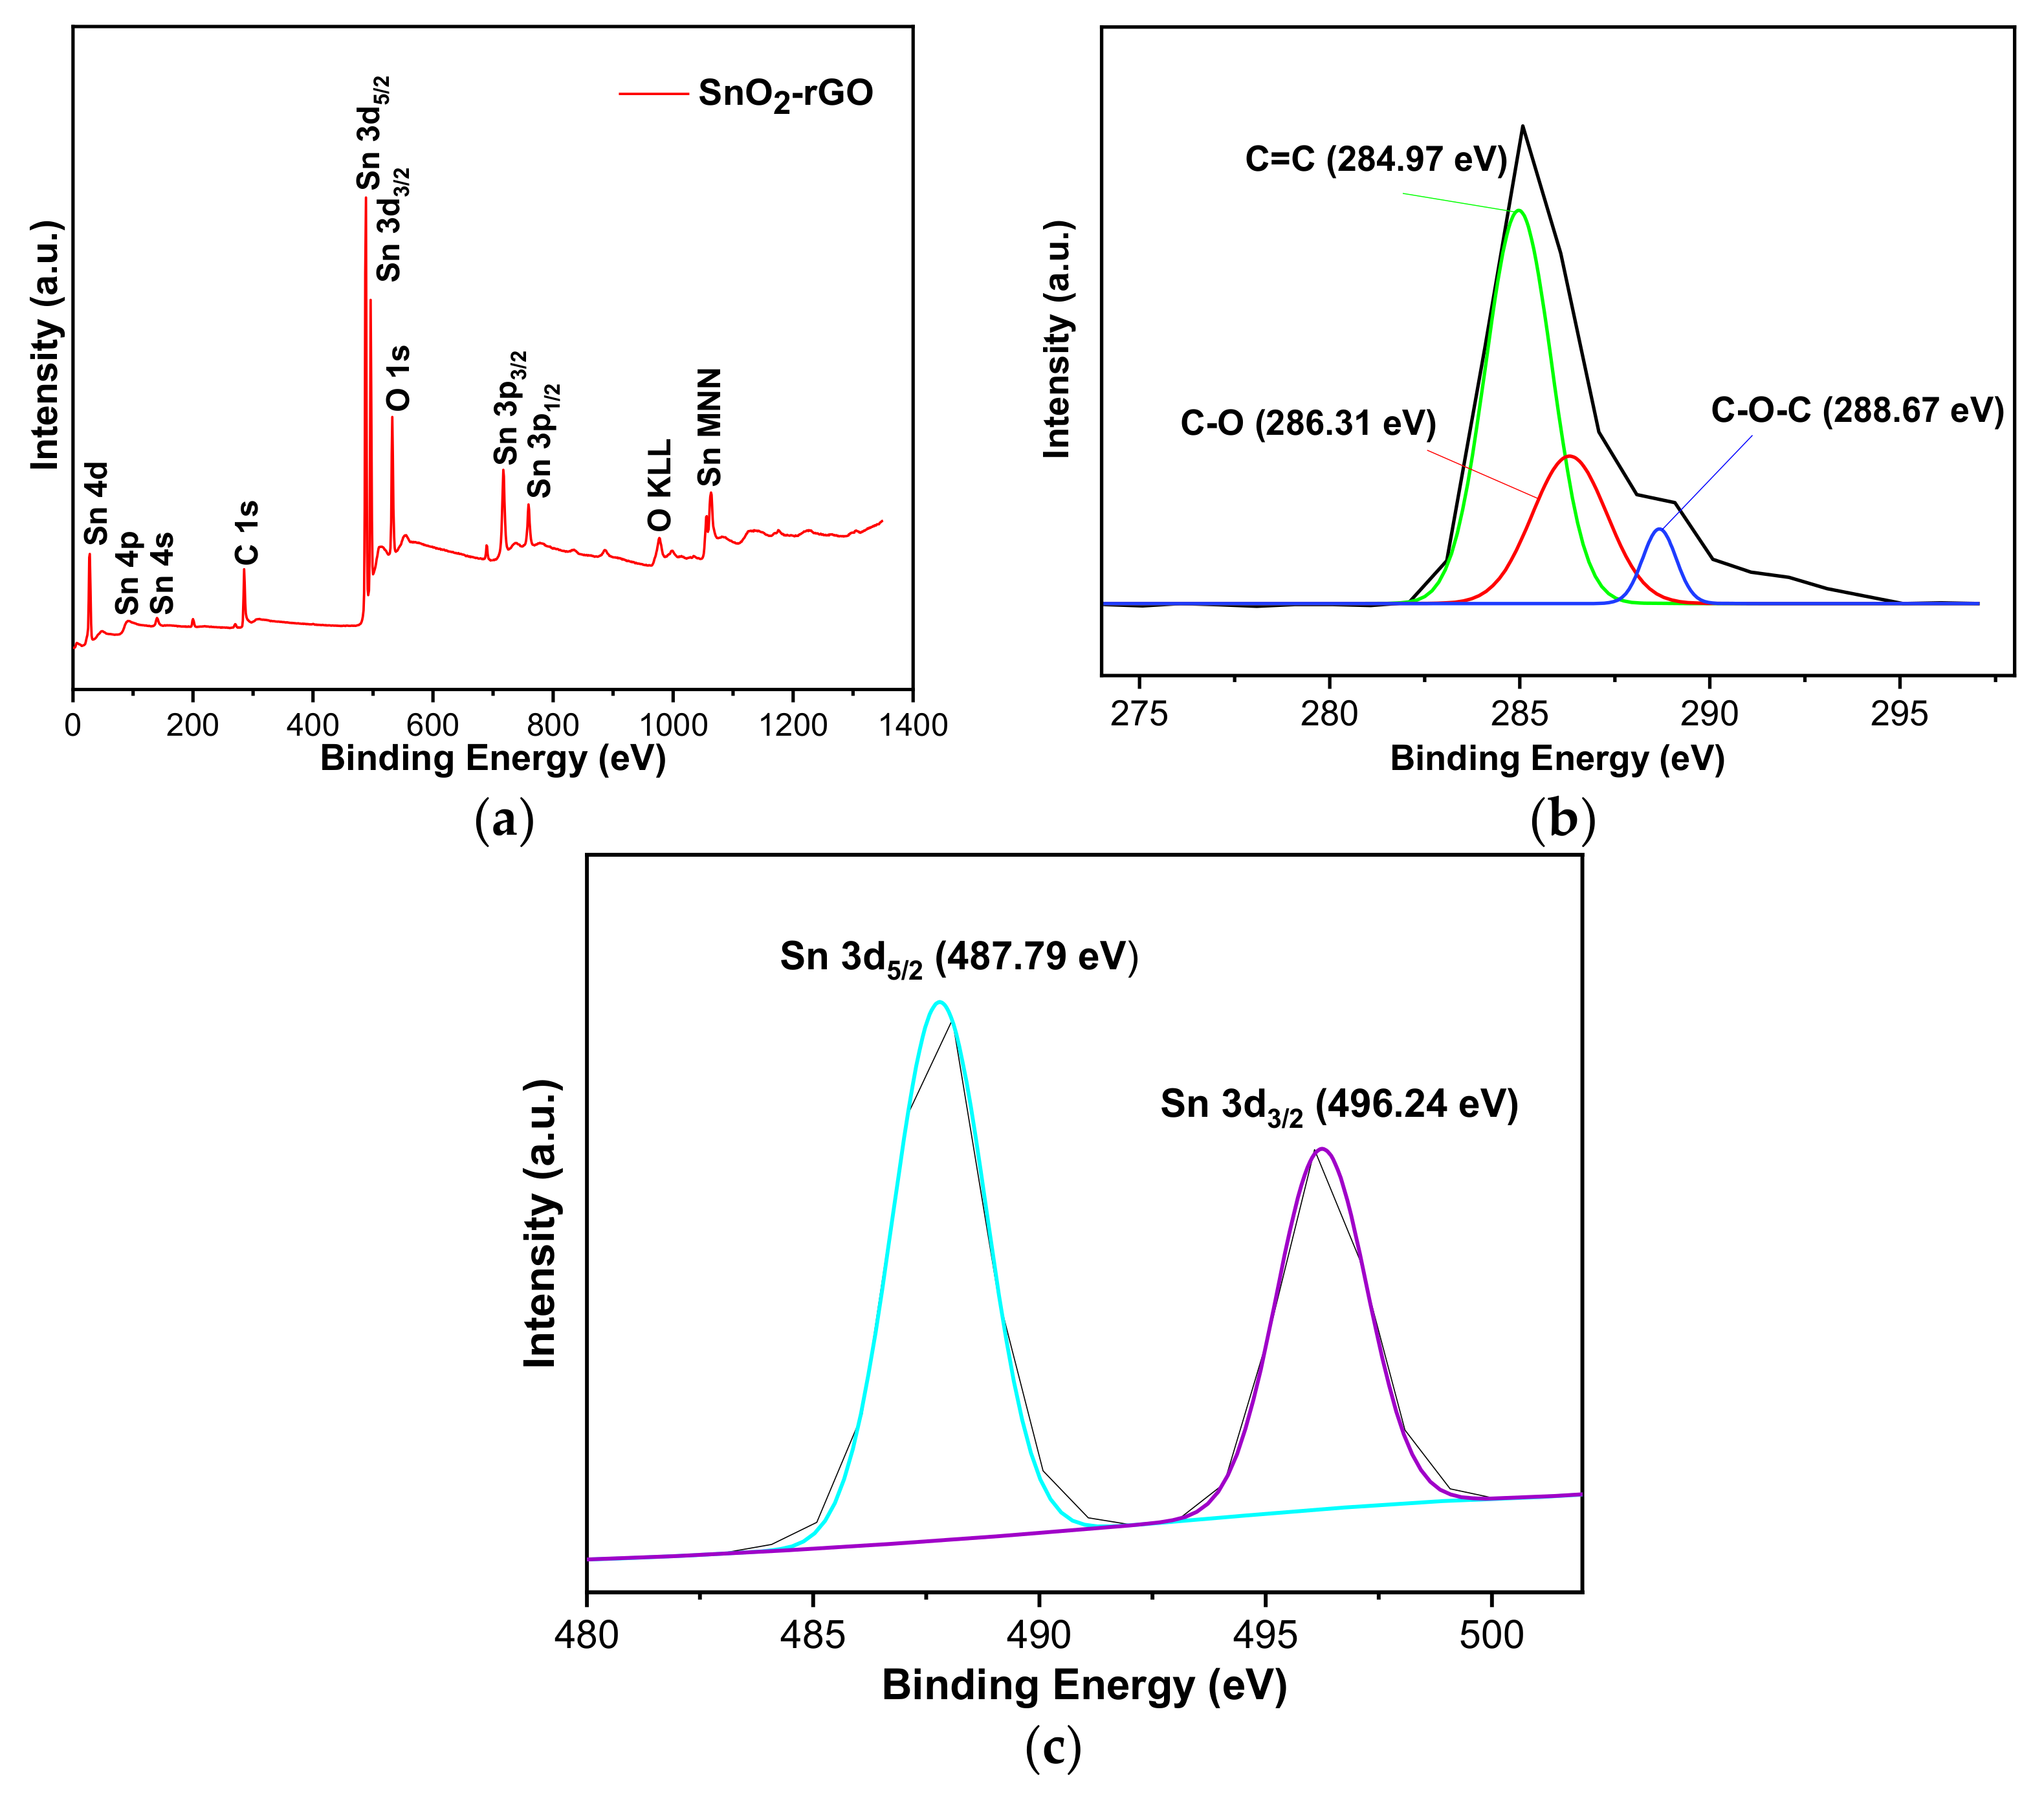
XPS was carried out to determine the chemical states and elemental composition found in SnO2-rGO composite. The full XPS survey spectrum in Figure 7a identifies C 1s (285.28 eV), O 1s (532.13 eV), and Sn 3d (487.79 eV) spectra, which confirms the presence of C, O, and Sn elements. Figure 7b shows three peaks of the C 1s spectrum at 284.9 eV, 286.3 eV, and 288.7 eV, which are mainly attributed to C–O, C=C, and C–O–C found in rGO that contains residual oxygen after the reduction process [45]. Moreover, two dominant peaks of the Sn 3d spectrum at 487.79 eV and 496.24 eV were observed, which refer to Sn 3d5/2 and Sn 3d3/2 in Figure 7c. Three relatively weak peaks of Sn 4d, Sn 3p3/2, and Sn 3p1/2 were observed at 28.08 eV, 717.08 eV, and 759.08 eV, respectively. The peak distance between the two Sn 3d spectra was 8.1 eV. The Sn peak location and peak distance confirm the presence of SnO2 anchored on the hybrid composite [26]. Additionally, the O 1s spectrum’s binding energies are attributed to carbon atoms with C–C, C-O, and C-OH bonds. These results match the Raman spectra results described earlier, which reinforces that the simultaneous reduction of GO and formation of SnO2 nanoparticles were successfully performed using SnCl2 molecules to form the hybrid composite.
3.6. Gas Sensing Characterization
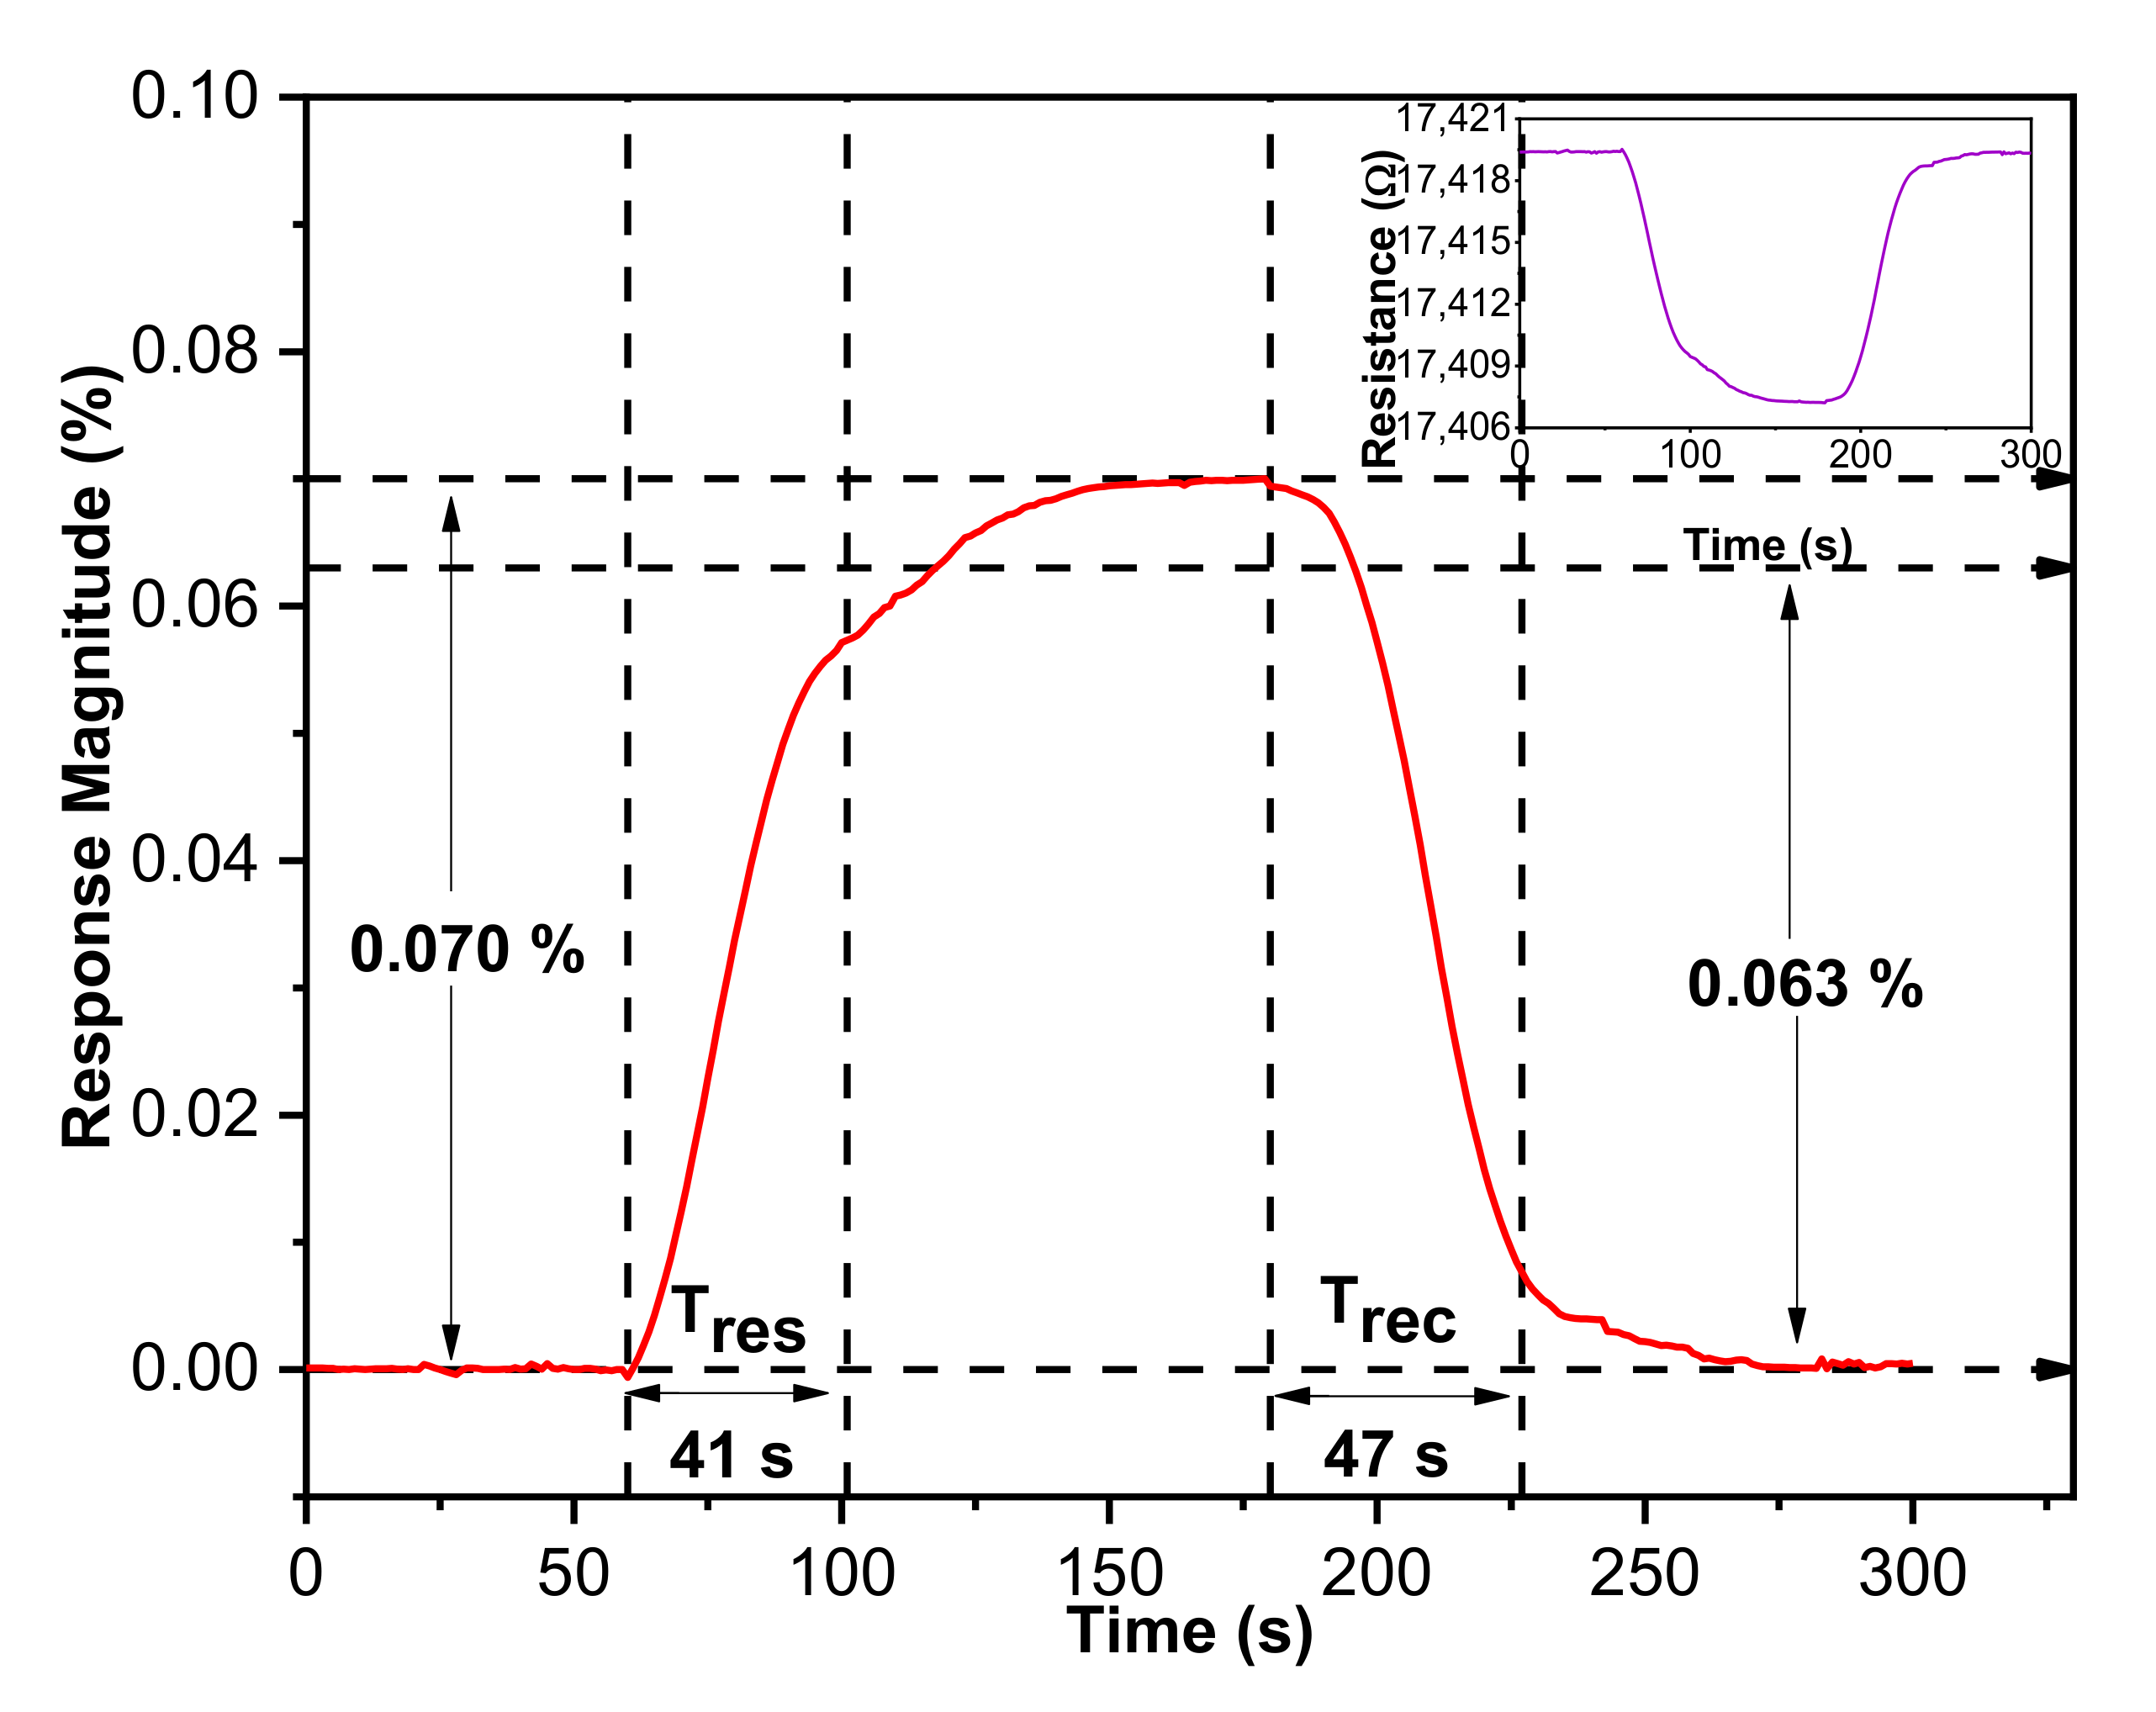
The direct-current resistance changes of the IDE-based gas sensor related to CO2 gas concentration were monitored to understand sensing kinetics. Figure 8 shows the dynamic response and recovery curve of a SnO2-rGO hybrid composite resistive sensor toward 5 ppm CO2 gas at room temperature. For 120 s, the hybridized SnO2-rGO sensor underwent a negative exponential response curve toward CO2. The hybrid structure response was instantaneous for 60 s before transitioning to a steady-state, which indicated saturation of CO2 absorption at a response magnitude of 0.070%. According to the response curve, the response and recovery time of SnO2-rGO toward 5 ppm CO2 were 41 and 47 s, respectively. This gas sensor shows a shorter response/recovery time than those reported using SnO2 based sensor, with values of 146 s/50 s and 92 s/98 s, respectively [5,16]. Besides that, this hybrid gas sensor enhanced gas sensitivity towards a low concentration of CO2 without dependence on high operating temperature.
The inset in Figure 8 shows the measured sensing curve’s representation in terms of resistance versus time. Sensor resistance decreases once the sensor is exposed to reducing gas CO2, which indicates that the hybrid composite shows dominant traits similar to n-type material. When nitrogen gas was alternated with CO2 as the main gas source, the hybrid sensor showed good recoverability characteristics where the response managed to recover back to the initial value.
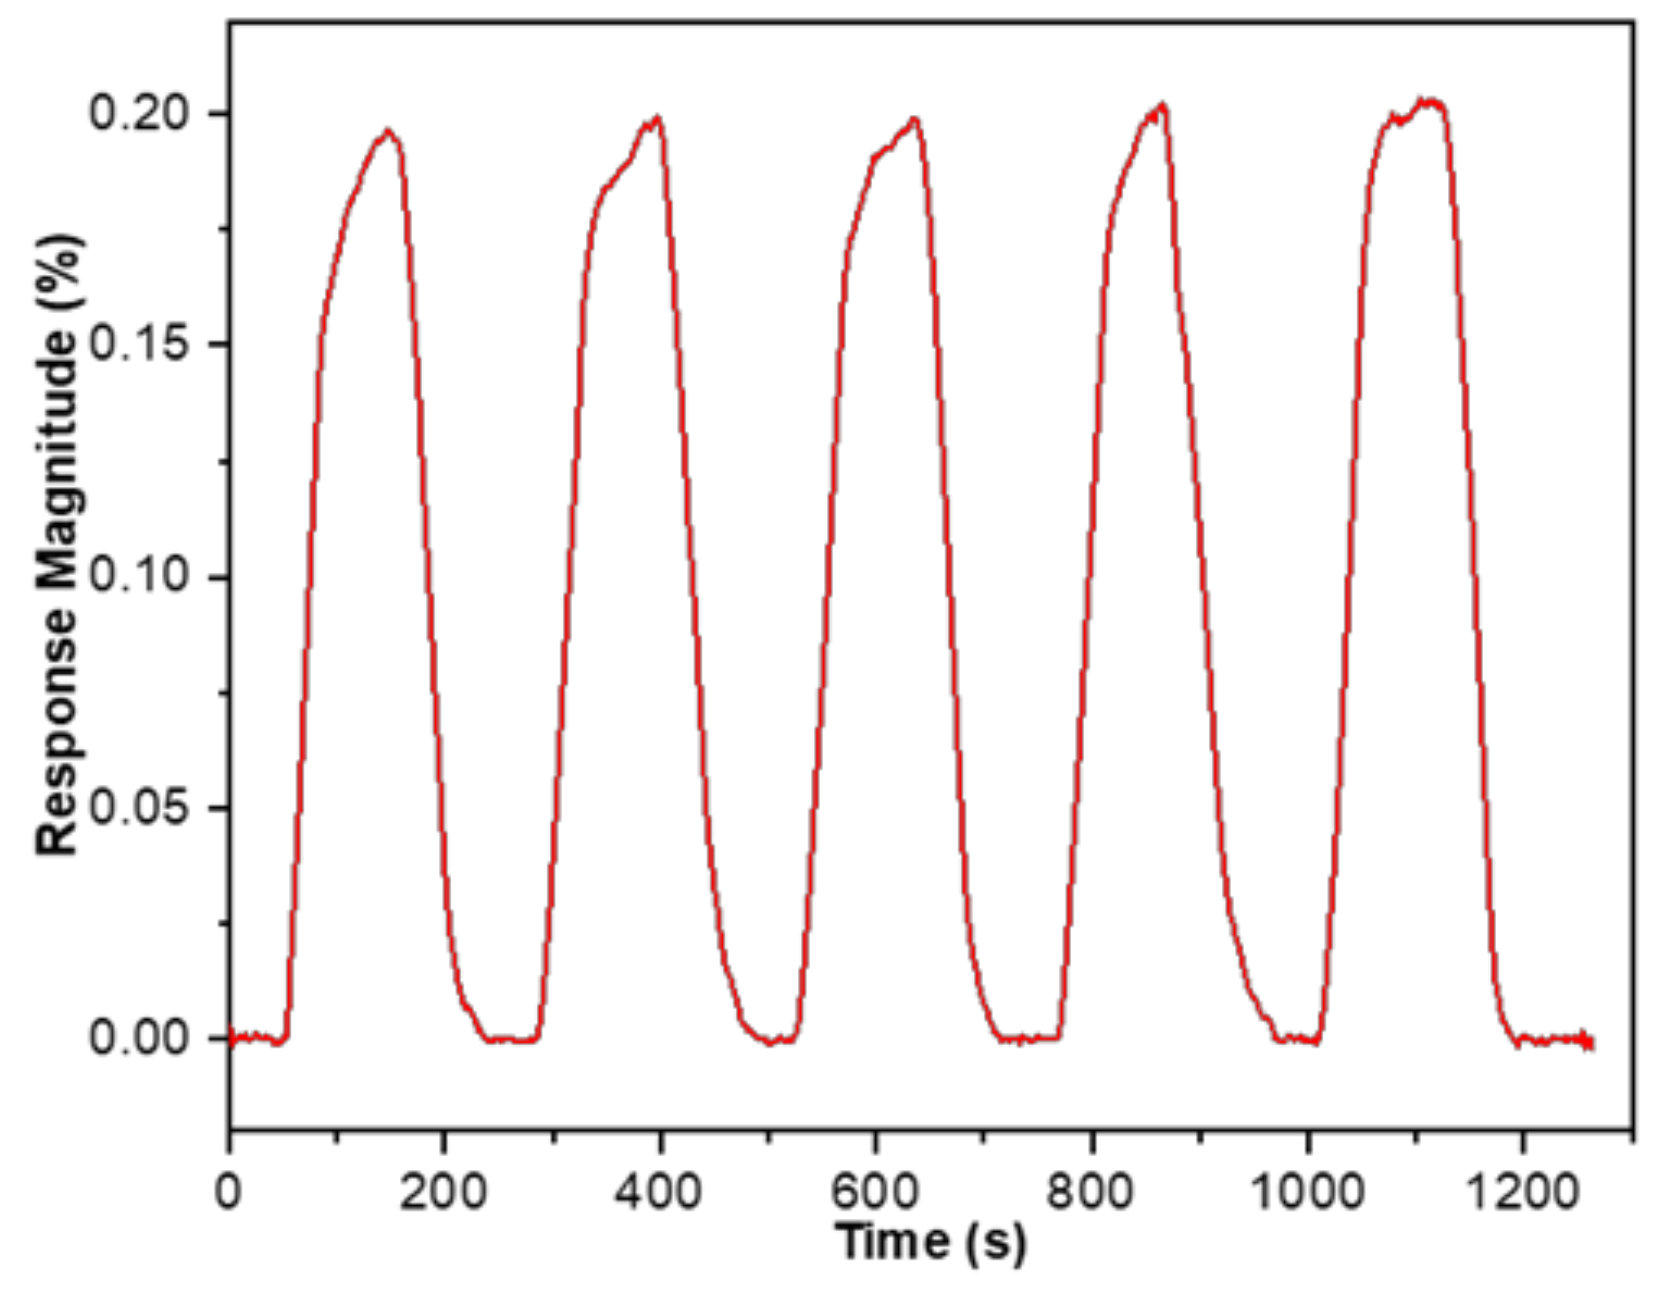
The repetition test using CO2 gas at room temperature was also studied. The SnO2-rGO hybrid nanocomposite sensors were exposed to 10 ppm gas on and off for 5 consecutive cycles, and the average response magnitude was 0.200%. As presented in Figure 9, the overall response times of the SnO2-rGO nanocomposite upon exposure to CO2 with a 10 ppm concentration were kept less than 60 s, and their recovery times upon exposure to nitrogen were also less than 69 s. This behavior is very promising since even for a very low concentration of 10 ppm, the sensor responds consistently in terms of response amplitudes, response times, and recovery times. Simultaneously, the hybrid gas sensor demonstrates that the response can be recovered back to the baseline value for five cyclic periods. This might reflect the fact that CO2 can be easily and repeatedly desorbed from the surface of a SnO2-decorated rGO gas sensor after the adsorption process.
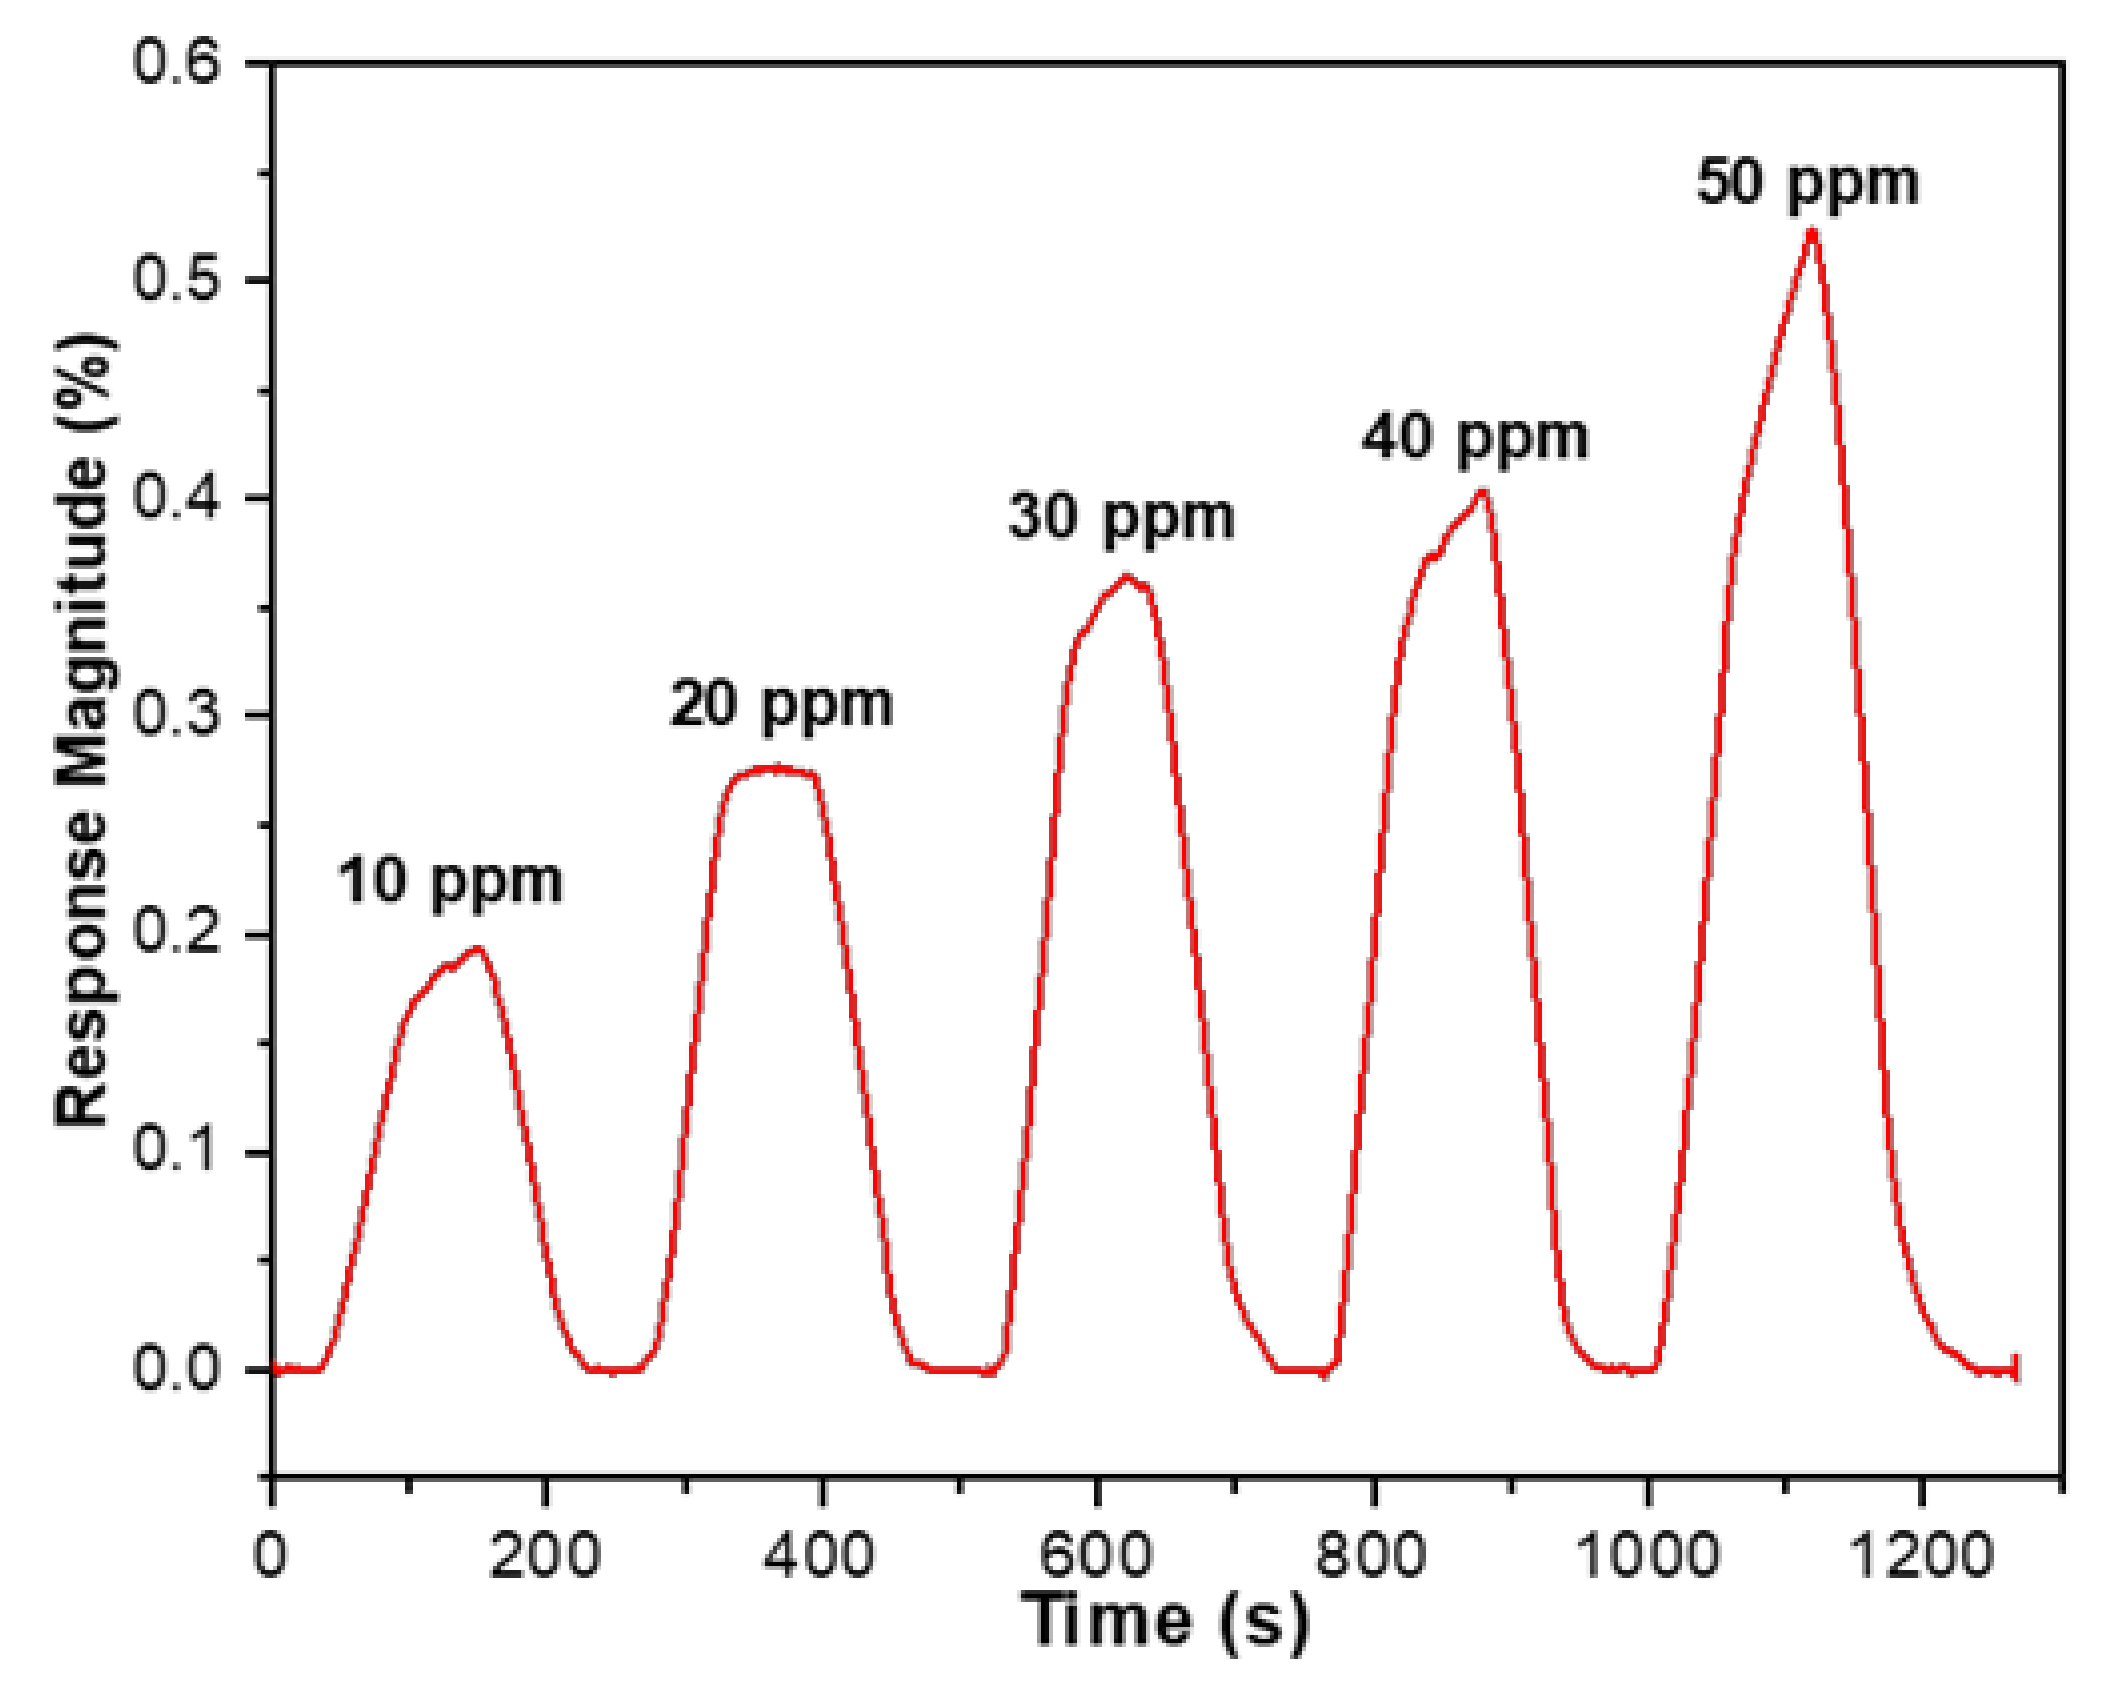
To further verify the SnO2-rGO hybrid nanostructure’s sensitivity towards a wider concentration range, successive responses to transient cycles in relation to low CO2 concentrations from 10 ppm to 50 ppm were recorded within 1300 s. According to the Figure 10 curve, the response change of the SnO2-rGO sensor is proportional to the concentration of CO2, ranging from 10 ppm to 50 ppm. No baseline drift is seen during the gas sensing experiment with the same cyclic period.
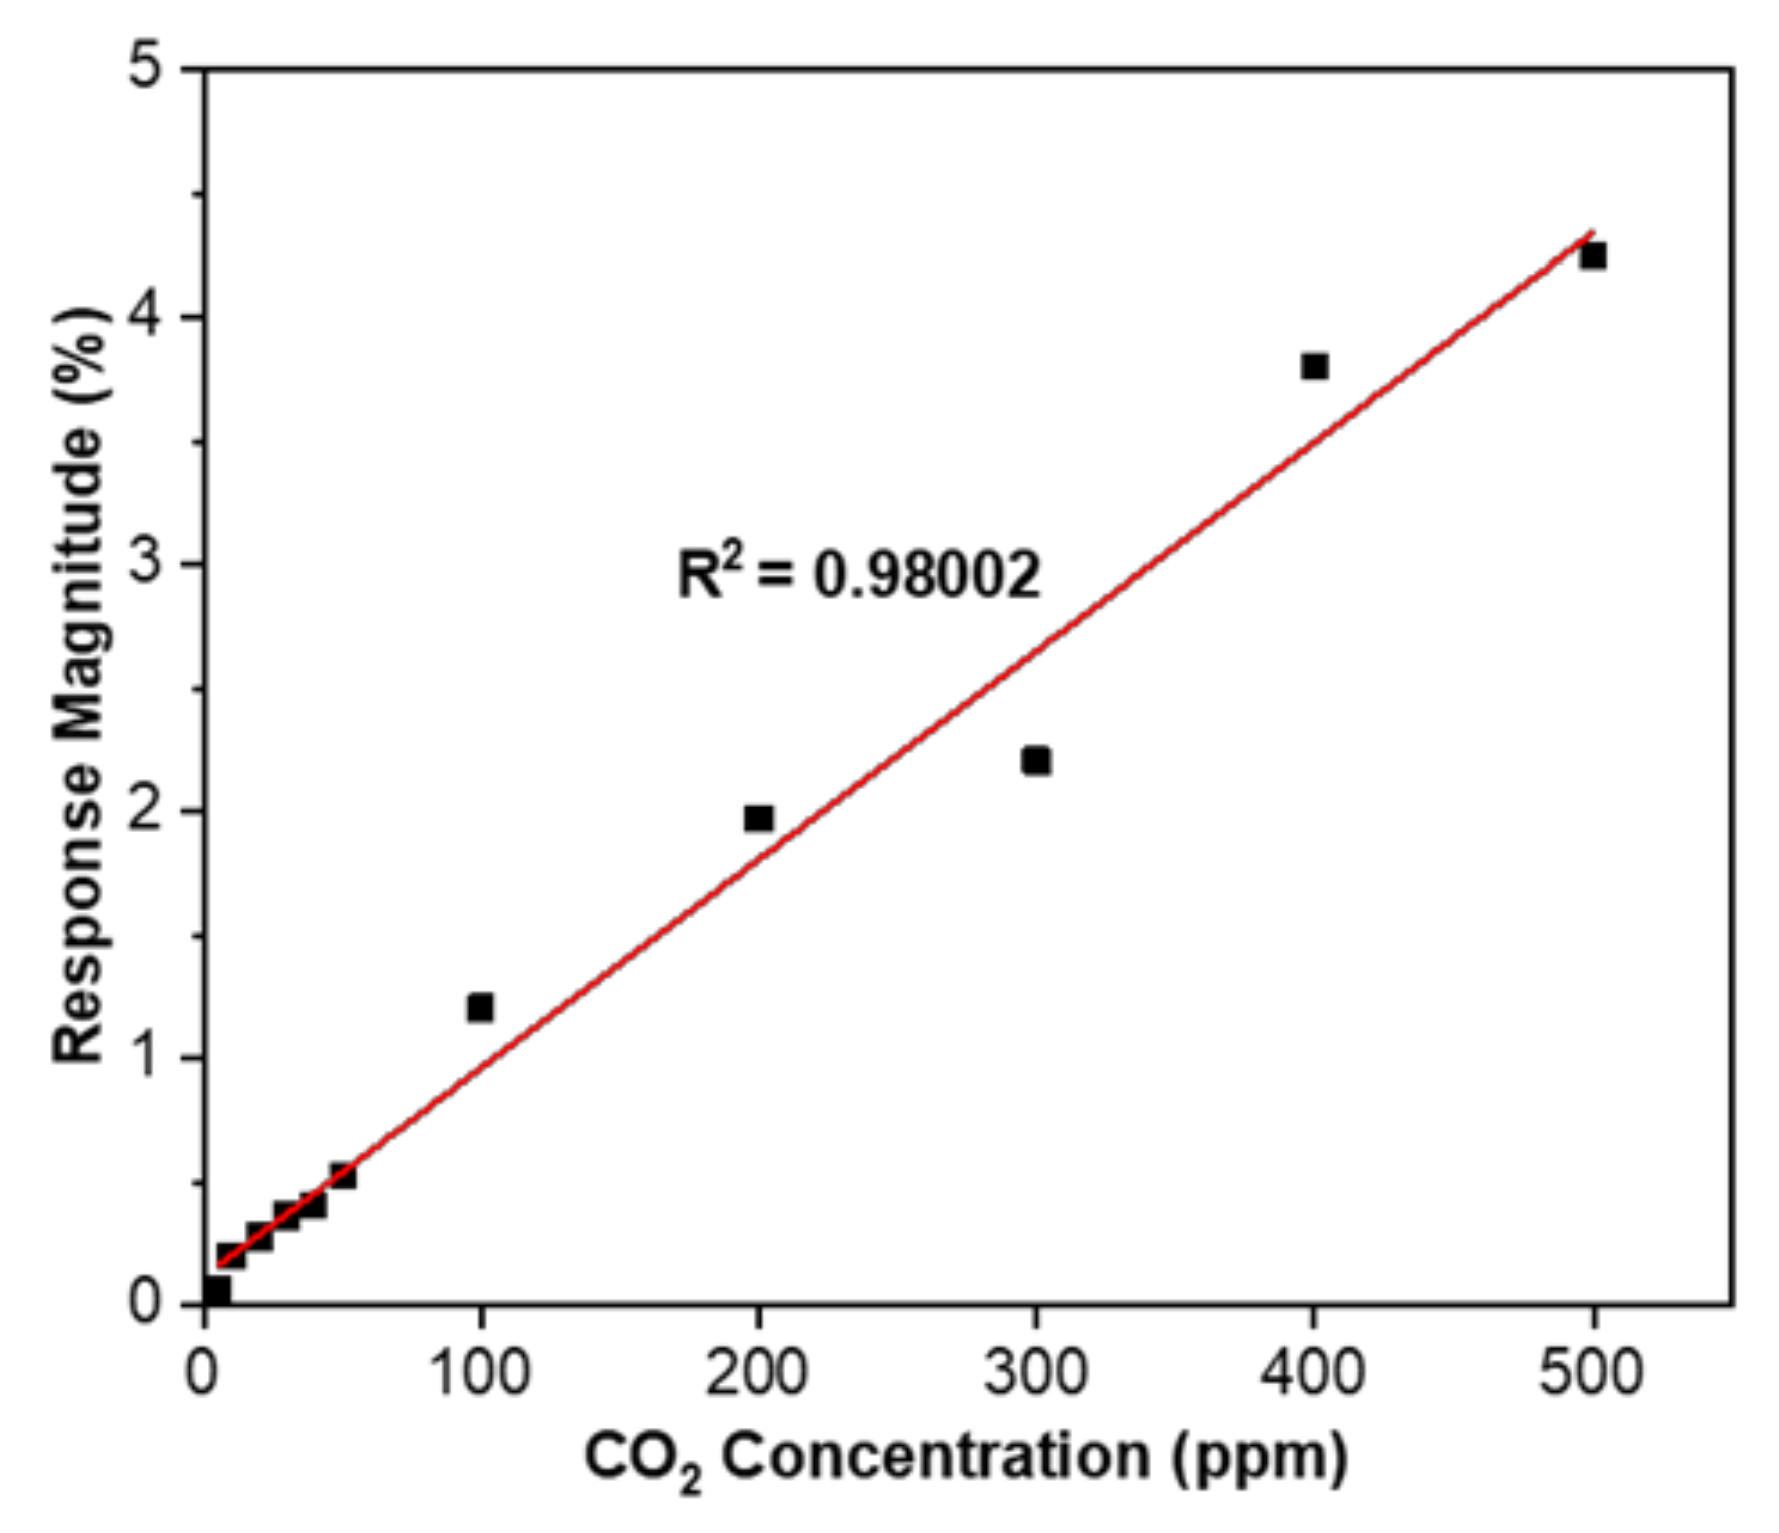
A SnO2-rGO gas sensor’s sensitivity was also investigated upon exposure to 5–500 ppm CO2 at room temperature. As shown in Figure 11, the experimental results reveal a good linear relationship between response change and gas concentration. The sensitivity is measured from the slope of the linear graph between the sensor response and gas concentration. From this linear fitted graph, the sensitivity is 0.00845 ppm−1 and the linear regression equation is expressed as y = 0.00845x + 0.11832 with R2 = 0.98002.
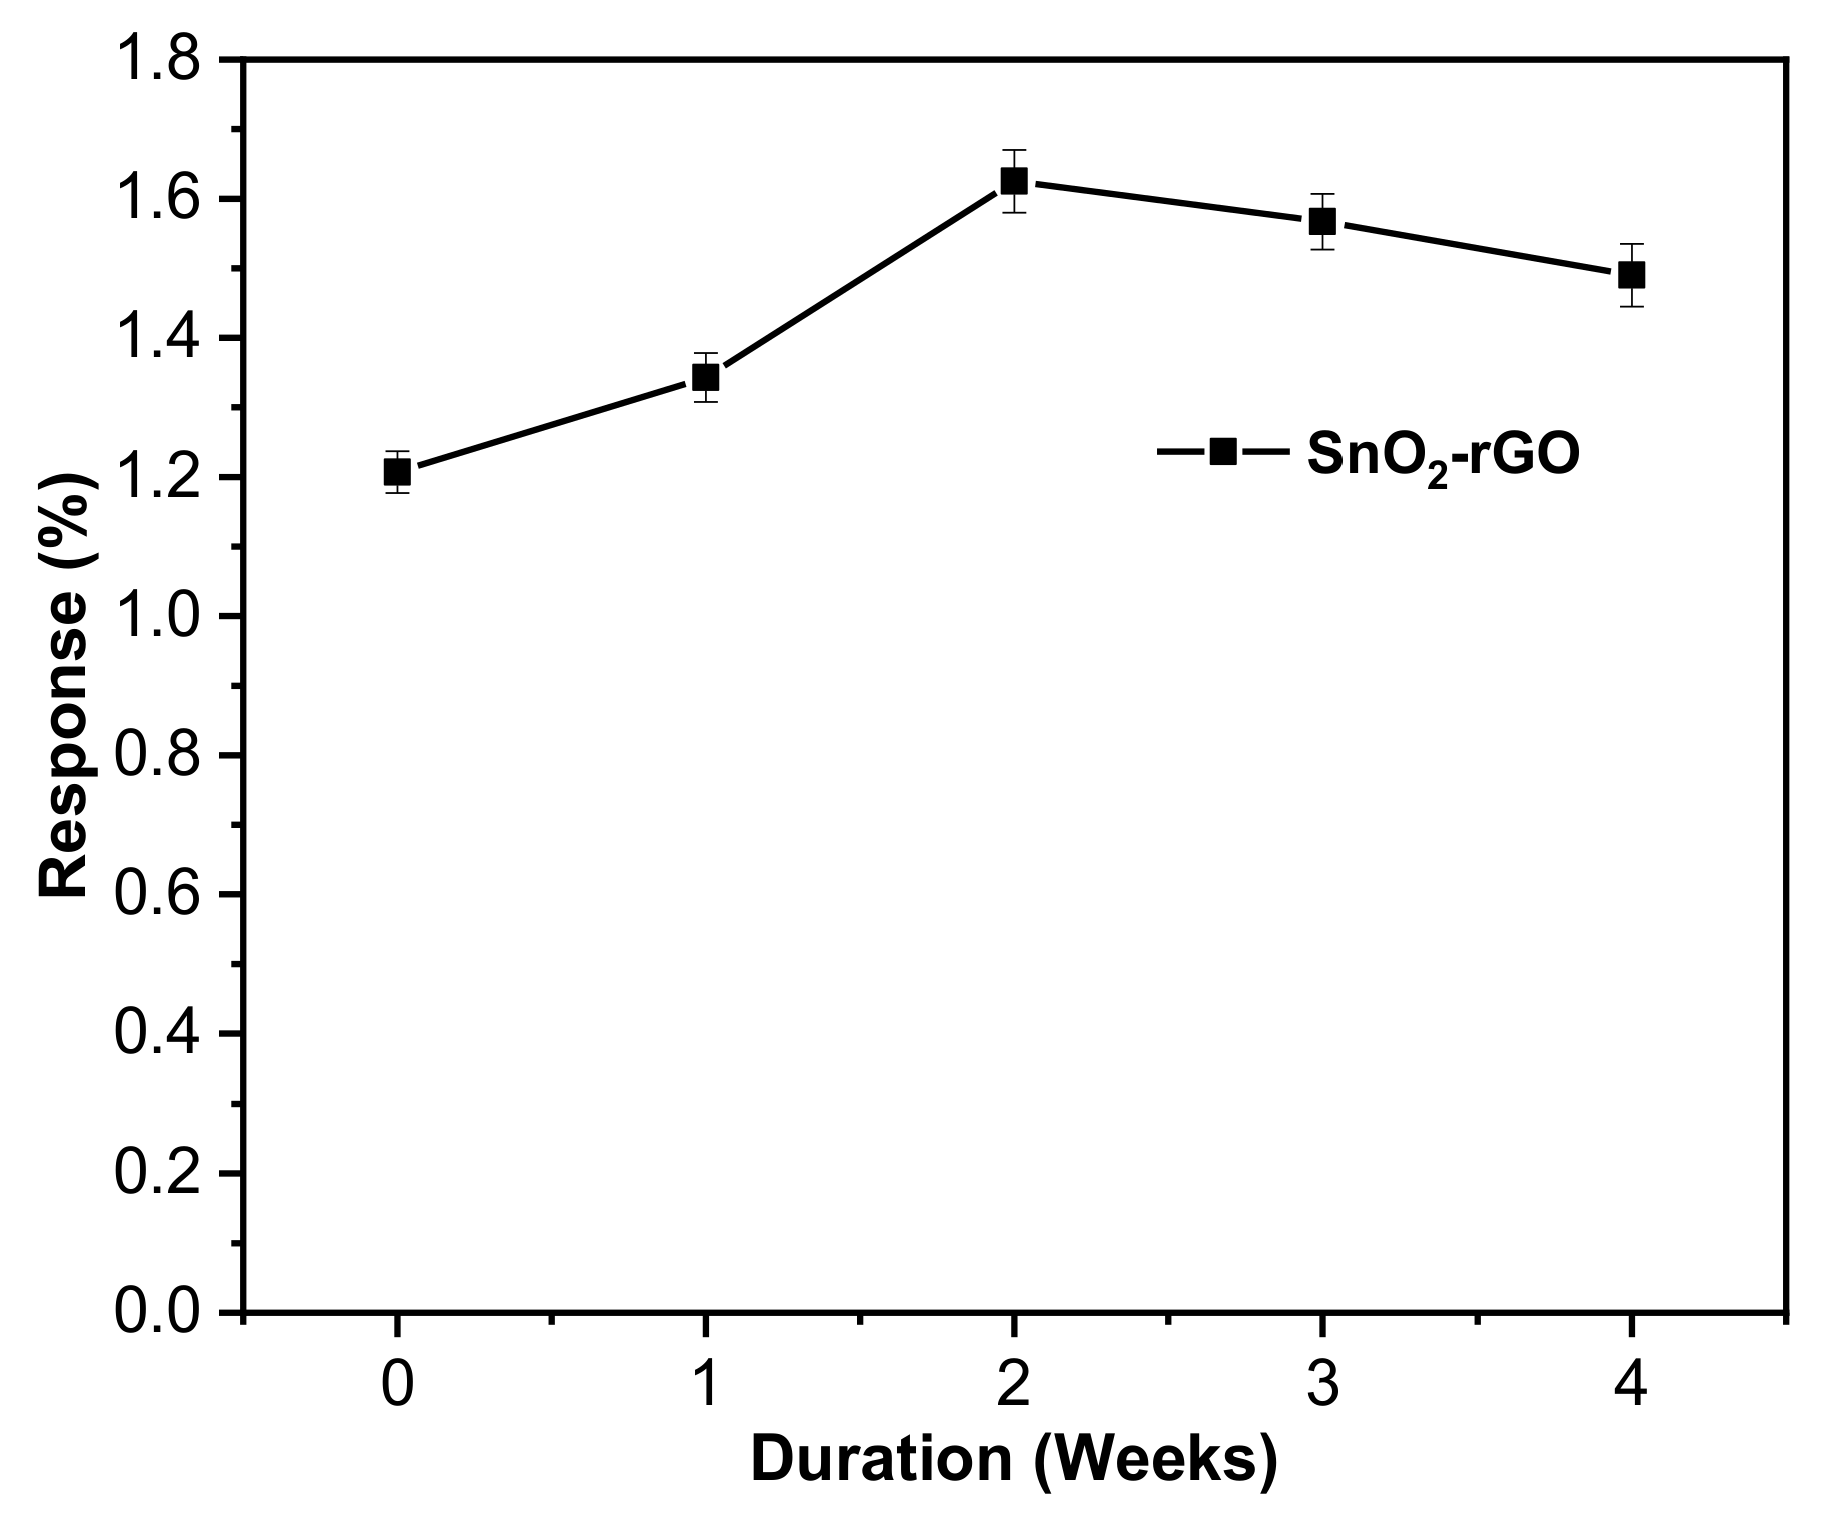
Response stability is a vital statistic for evaluating the functionality of practical gas sensors after multiple uses. To further evaluate the gas sensing performance of SnO2-rGO for a month, the as-fabricated sensor is kept under ambient conditions (58 ± 3% RH) at room temperature for testing purposes. As shown in Figure 12, the standard deviation of the CO2 gas sensor response change at a testing concentration of 100 ppm every 7 days for 4 weeks is 0.171. The sensor responds consistently to the same concentration of CO2 because the sensing material is less affected by chemical change when exposed to the atmosphere for at least a month. Interestingly, as exposure time extended beyond week 2, environmental factors such as dust particles, water vapor, and oxygen molecules tend to occupy active sites and hinder chemisorption, leading to a slight deterioration in response amplitude at a rate of 5.65%/week [27].
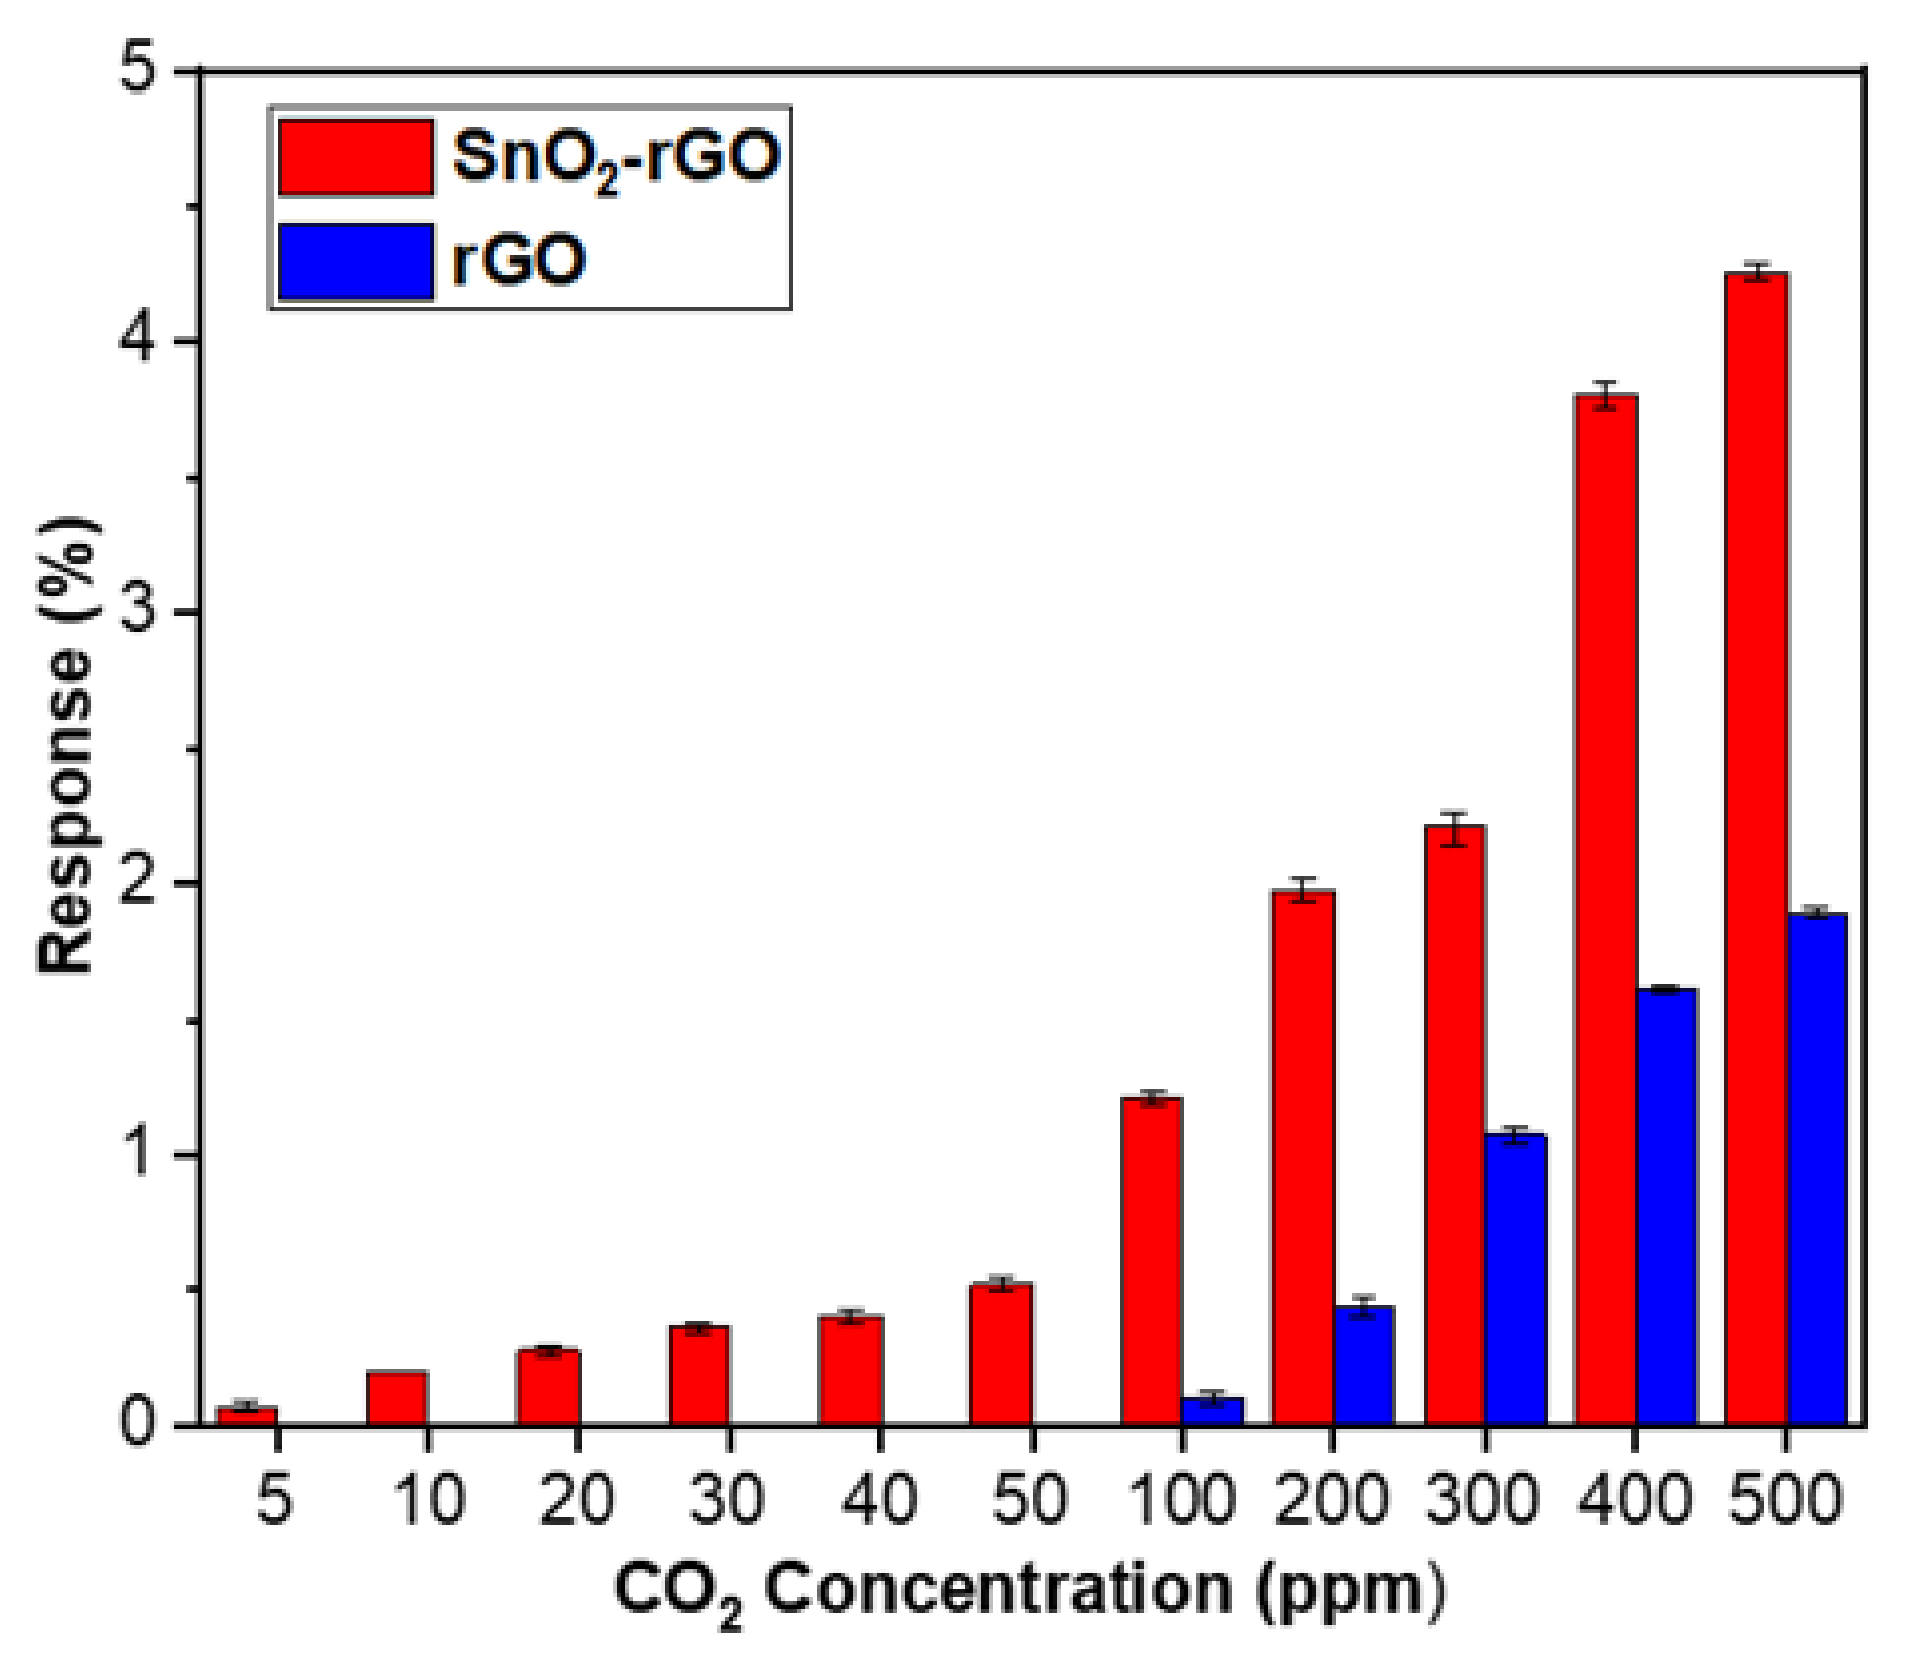
As shown in Figure 13, the SnO2-rGO hybrid composite shows good sensitivity to CO2 gas even at testing concentrations as low as 5 ppm, whereas rGO shows no sign of response to the same gas analytes a higher concentration of 50 ppm. The response of SnO2-rGO increases slowly from 5 ppm to 50 ppm, and then later increases drastically from 100 ppm until it reaches its peak at 500 ppm CO2. A comparison of the results indicated that the SnO2-rGO hybrid composite gas sensor offered the highest response magnitude and dynamic detection range with the lowest detection limit compared with those of the rGO sensor. This suggested that the catalytic activity of hybridized SnO2-rGO preserved more adsorption sites, which improved the sensing performance toward CO2.
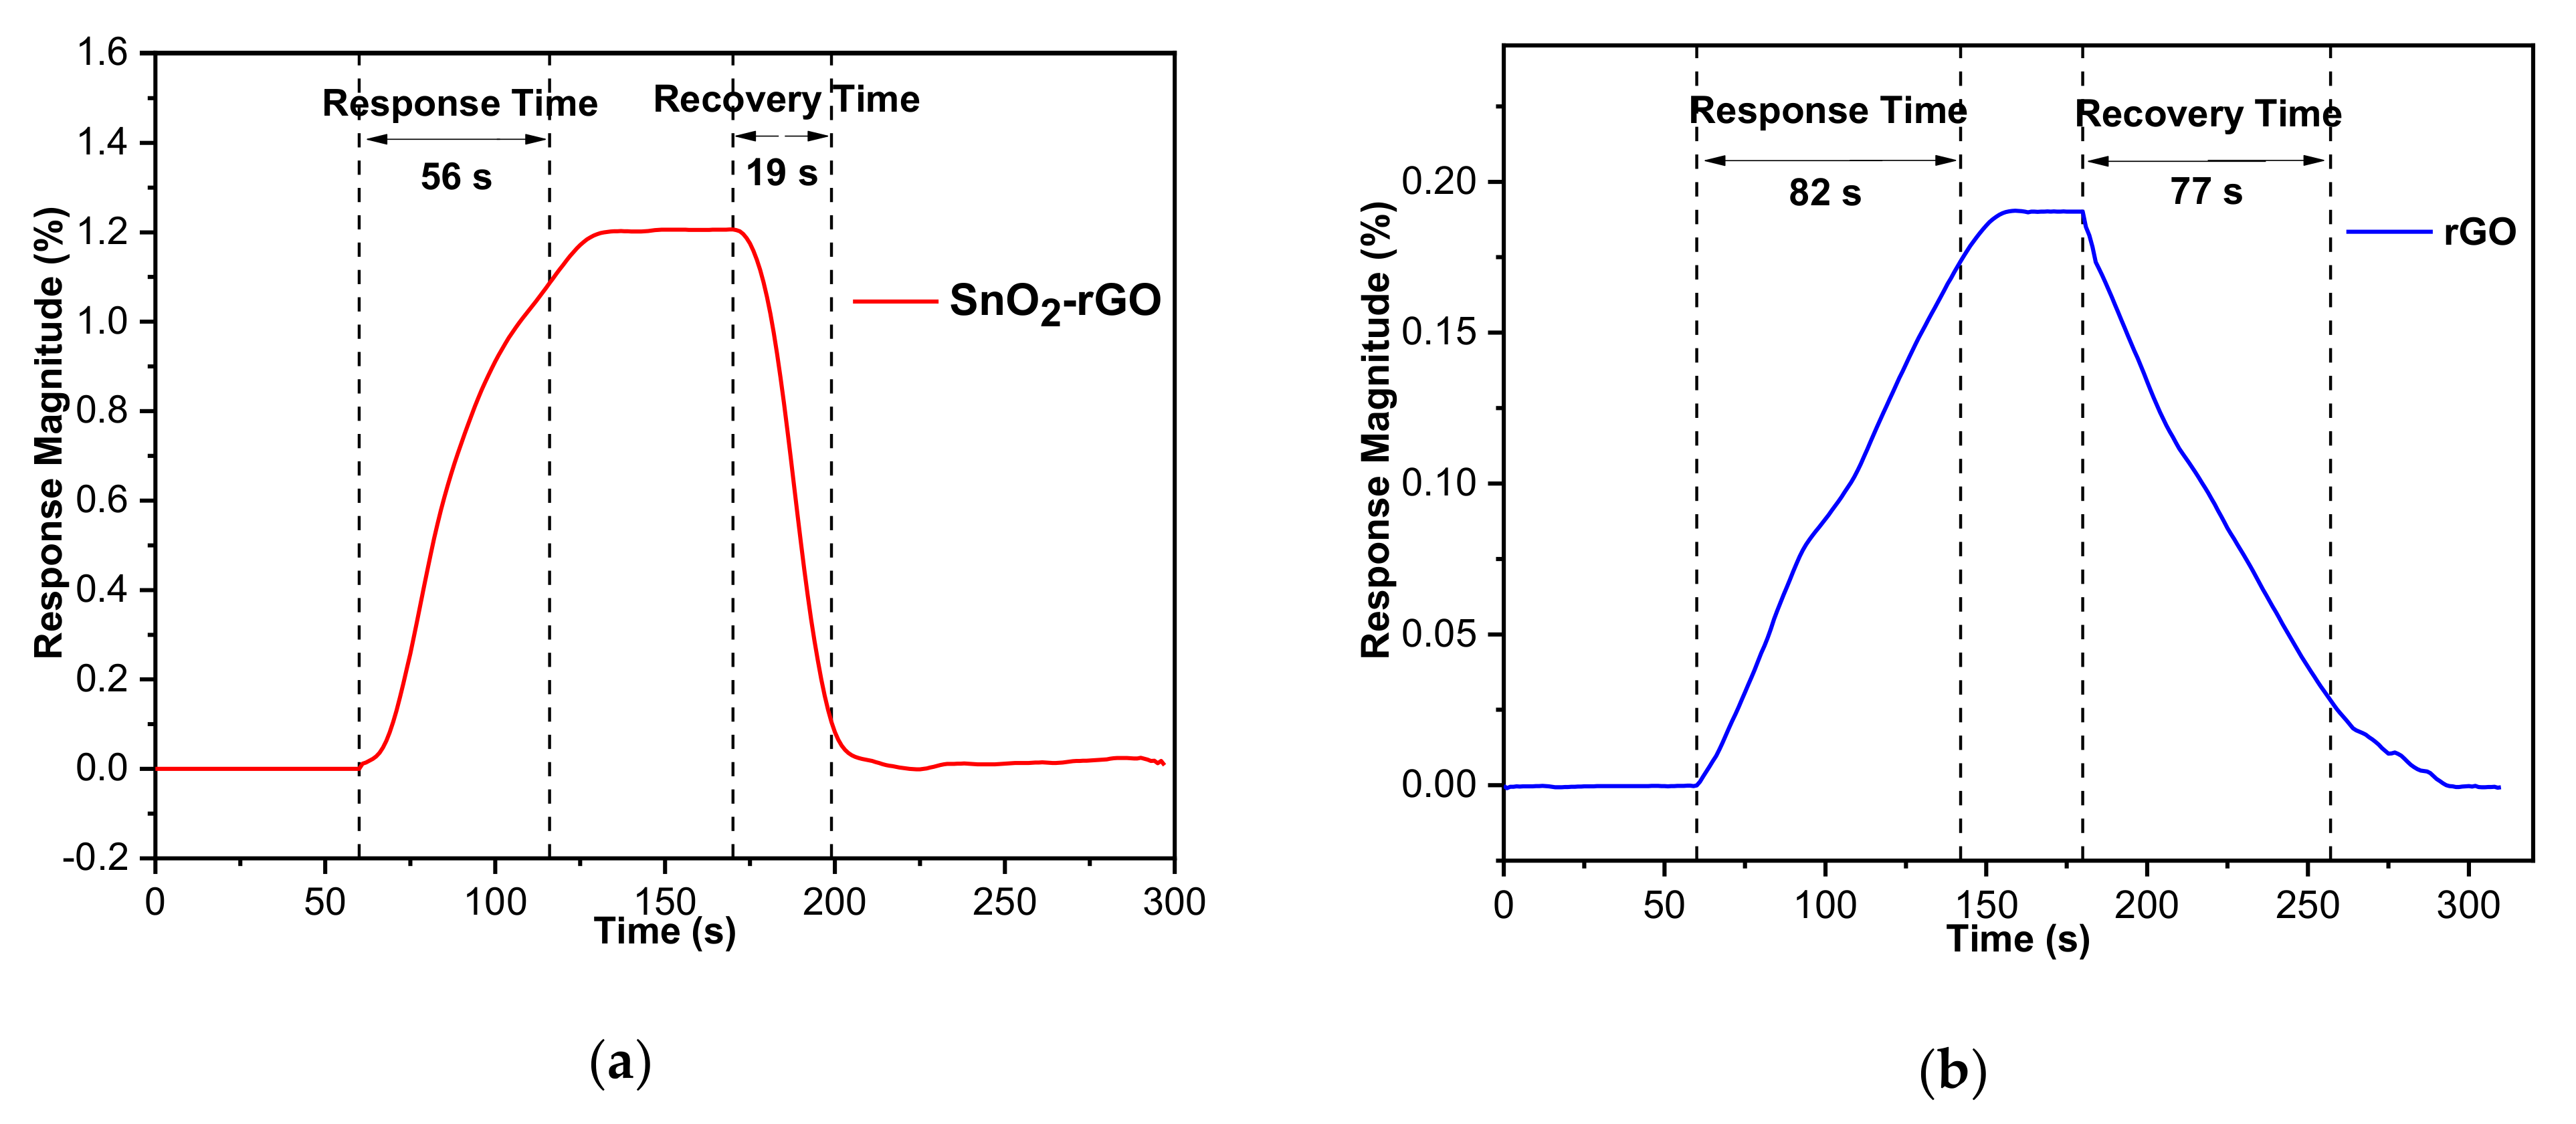
The sensitivity difference of the hybrid composite and rGO sensors is understandable by comparing the dynamic responses to both materials’ transient cycles upon exposure to 100 ppm CO2 gas at room temperature. Figure 14 illustrates the sensing response curves for the SnO2-rGO and rGO gas sensors exposed to 100 ppm CO2 over time. The SnO2-rGO hybrid composite gas sensor reads 1.206%, which was 6.7 times better than that of pristine rGO (0.179%). Adding SnO2 into rGO provided a high surface area that increased contact with the gas and contributed to enhanced sensing. SnO2-rGO achieved a fast response and recovery time of 56 s and 19 s, respectively, toward 100 ppm CO2, compared with 82 s and 77 s for an rGO sensor at room temperature. The SnO2-rGO hybrid composite gas sensor yields better overall performance because the influence of SnO2 in the hybrid composite decreases the conductivity of rGO, forming a comparatively high response change of the sensor [27].
The sensing performance of the fabricated SnO2-rGO and rGO gas sensors was compared with resistive-based CO2 gas sensors reported in other literature, as shown in Table 1. The nanocomposite sensor detects 5 ppm CO2 when operating at room temperature, which is the lowest among previously reported gas sensors, and confirms that the SnO2-rGO hybrid nanostructure can ameliorate the detection limit of CO2 sensing. In addition, room operating temperature detection is achieved through linkage of SnO2 and rGO, as compared to SnO2 counterparts.
3.7. Room Temperature Sensing Mechanism of the SnO2-rGO Gas Sensor
The gas sensing curve based on resistance changes when exposed to the test gas was broken down into three phases to obtain better insight into the above gas sensing mechanism: stabilization, adsorption/response, and recovery. The surface condition plays a key role in gas sensing properties. As the gas sensor is continuously exposed to nitrogen gas for 60 s, the surrounding gas mixture, especially oxygen molecules, is excluded from forming oxygen species such as and in the near-surface region [5,23]. When there is no reacting gas, lesser electrons get enough energy to jump into the conduction band and travel across the junction, while holes are left behind. The accumulation of charge at the interface slowly builds up intermediate space charge layers. The hybrid composite gas sensor will not experience further charge in resistivity when the surface is saturated with nitrogen.
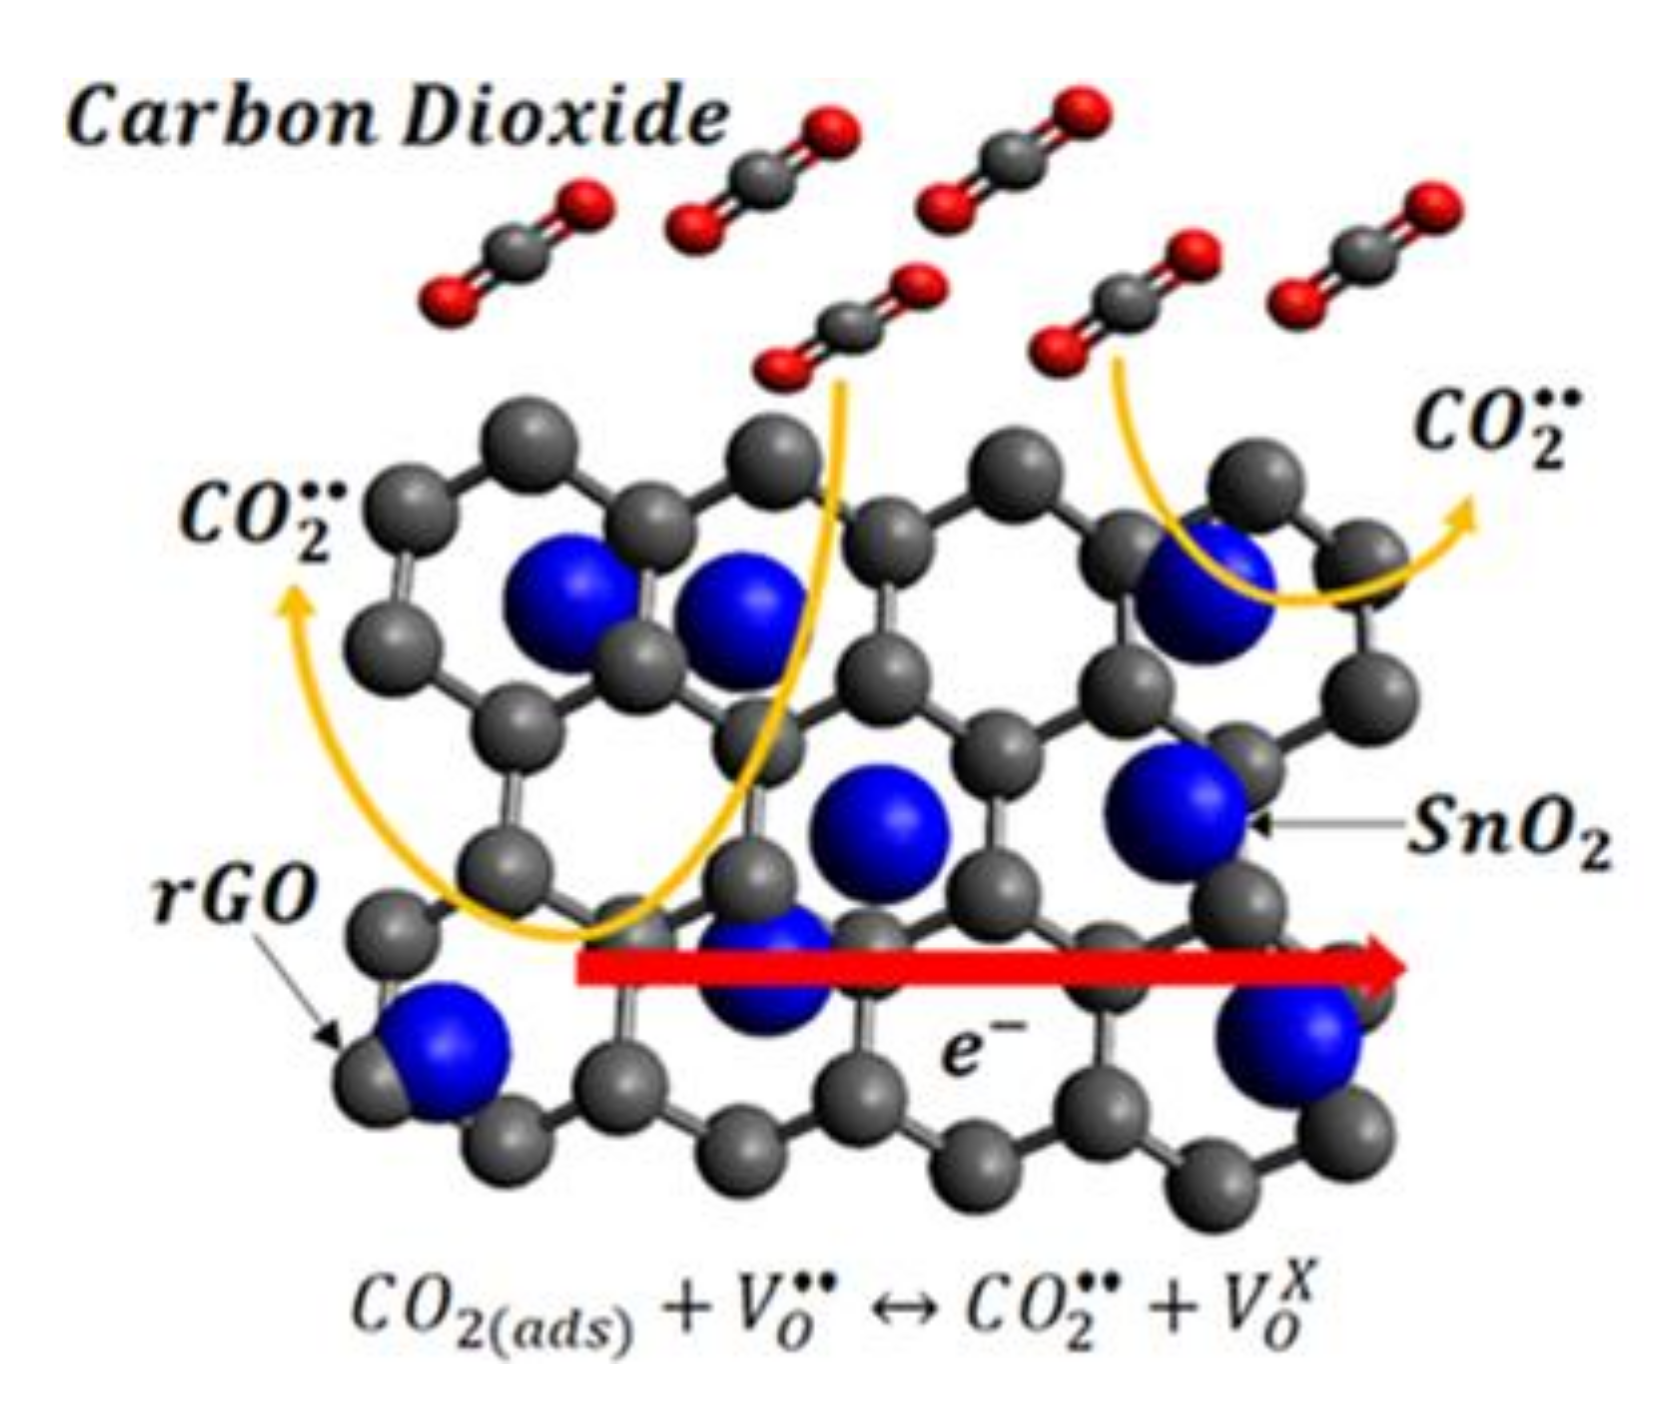
The interaction between sensing film and CO2 in the absence of air is illustrated in Figure 15. During the response stage, CO2 as a weak reducing gas is partially ionized while reacting with oxygen vacancy sites, . The gain of electrons from CO2 creates a change of carrier concentration, thereby decreasing its overall resistance. The decline of the sensor’s electrical resistance upon CO2 introduction is in agreement with the results observed in CO2 detection using SnO2 in an oxygen-deficient background [5,16]. At this stage, the electron transfer rate on the sensing film’s surface due to gas adsorption reflects the concentration of gas molecules. Once the gas sensor plateaus signal out, it clearly indicates that the gas sensor is saturated with the target gas. At this moment, nitrogen gas will be purged into the chamber and replaces the CO2 molecules on the sensing surface, which results in the desorption of CO2 and is responsible for the change of the resistivity back to the baseline. The sensing response upon exposure to CO2 is visible but becomes difficult to observe as fewer CO2 can undergo ionosorption without oxygen molecules’ influence.
rGO is a highly conductive material, which is attributed to its honeycomb-like arrangement of carbon atoms. This structure allows electrons to travel in a long mean free path while being less likely to be interrupted, thus reducing the gas sensor’s resistance. However, the interaction between rGO and CO2 is weak [32] due to the wrinkles restricting the gas sensor potential from having a sensitivity down to a single atom. On the other hand, SnO2 and rGO hybrid composites have different but complementary gas sensing characteristics, where SnO2 acts as a spacer to avoid the stacking of rGO sheets and rGO overcomes the agglomeration tendency of SnO2, which is reflected by the small crystalline structure with diameters of 3 to 7 nm on the surface of the hybrid composite [27]. The functionalization of rGO with the addition of SnO2 creates a 3D hierarchical nanostructure with a high surface-to-volume ratio where more surface atoms can interact with the target gas and provides a large, accessible surface area for gas adsorption [23].
The facile synthesis process of the hybrid composite by homogeneously blending SnO2 into rGO encourages better electron transport and gas adsorption. rGO and SnO2 exhibit p-type and n-type semiconducting characteristics, respectively, due to their hybridization effect [24]. Since the hybrid composite is composed of SnO2 and rGO with different band gaps, band bending is formed at p-n heterojunctions with a charge gradient that obstructs electron transfer; the above causes a significant change in electrical properties before and after exposure to the target gas at room temperature when electrons, as the majority carriers, are induced or attracted away from the hybrid structures. Environmental factors such as oxygen content and humidity, along with selectivity of SnO2/rGO will be studied in future research.
According to the analyses above, we can conclude that the dominance of the overall room temperature gas sensing performance of the hybrid composite toward CO2 molecules with good response and recovery properties is attributed to the high conductivity, an abundance of active sites, and p-n heterojunctions.
4. Conclusions
In summary, a facile synthesis route for a hybrid SnO2-rGO nanocomposite was conducted, and the material was placed on an IDE platform as a novel room temperature CO2 gas sensor device. Due to the synergistic effect from blending the near metallic conductivity of rGO and the metal oxide, the gas sensor showed improvement in a sub-ppm-level detection limit (5 ppm) and excellent CO2 sensing at room temperature and 58% RH. The linear relationship between the sensor response and CO2 concentration was R2 = 0.98002 with a slope of 0.00845 ppm−1. The relative response change of the hybrid composite sensor toward 100 ppm CO2 was 1.206%, which is 6.7 times better than that of pristine rGO (0.179%). The excellent gas interaction of the SnO2-rGO hybrid composite could be attributed to its high conductivity, a wide area of active sites, and p-n heterojunctions. In addition to such a synergistic hybridization of two promising sensing materials (SnO2 and rGO), its further advantages, such as a facile fabrication, low production cost, and low power consumption, the gas sensor has the potential for the development of portable CO2 gas sensor working at room temperature.
Author Contributions
Z.Y.L. synthesized sensing materials and fabricated gas sensor; H.F.b.H. and K.K. designed experimental setup and procedures; Z.Y.L. collected data; H.F.b.H. and G.W.b.D. provided supervision; Z.Y.L. conducted the experiment; both Z.Y.L. and K.K. analyzed data and proposed sensing mechanism; Z.Y.L. prepared manuscript while H.F.b.H. and G.W.b.D. reviewed the manuscript. All authors have read and agreed to the published version of the manuscript.
Funding
This research received financial support from University Technology PETRONAS under a research grant (YUTP 0153AA-H36) and the postgraduate assistant scheme.
Data Availability Statement
Data is contained within the article. The data presented in this study are available on request from the corresponding author after obtaining permission of authorized person. The data are not publicly available due to data confidentiality resulting from the requirements of the accreditation.
Acknowledgments
The authors would like to thank MIMOS Berhad for the help of IDE fabrication and University Malaysia Perlis for their research facilities and support.
Conflicts of Interest
The authors declare no conflict of interest.
References
- Sioba, M.S.; Ong, H.; Valdes, J.; Tang, J. Calculation of Physiologic Dead Space: Comparison of Ventilator Volumetric Capnography to Measurements by Metabolic Analyzer and Volumetric CO2 Monitor. Respir. Care 2012, 58, 1143–1151. [Google Scholar] [CrossRef] [PubMed] [Green Version]
- Kerslake, I.; Kelly, F. Uses of capnography in the critical care unit. BJA Educ. 2017, 17, 178–183. [Google Scholar] [CrossRef] [Green Version]
- Hannon, A.; Li, J. Solid State Electronic Sensors for Detection of Carbon Dioxide. Sensors 2019, 19, 3848. [Google Scholar] [CrossRef] [Green Version]
- Sparringa, R.; Kendall, M.; Westby, A.; Owens, J. Effects of temperature, pH, water activity and CO2 concentration on growth of Rhizopus oligosporus NRRL 2710. J. Appl. Microbiol. 2002, 92, 329–337. [Google Scholar] [CrossRef] [PubMed] [Green Version]
- Wang, D.; Chen, Y.; Liu, Z.; Li, L.; Shi, C.; Qin, H.; Hu, J. CO2-sensing properties and mechanism of nano-SnO2 thick-film sensor. Sens. Actuators B Chem. 2016, 227, 73–84. [Google Scholar] [CrossRef]
- Baharuddin, A.A.; Ang, B.C.; Haseeb, A.; Wong, Y.C.; Wong, Y.H. Advances in chemiresistive sensors for acetone gas detection. Mater. Sci. Semicond. Process. 2019, 103, 104616. [Google Scholar] [CrossRef]
- Xu, S.; Li, M.; Li, H.; Li, M.; Qu, C.; Yang, B. Carbon dioxide sensors based on a surface acoustic wave device with a graphene–nickel–l-alanine multilayer film. J. Mater. Chem. C 2015, 3, 3882–3890. [Google Scholar] [CrossRef]
- Starecki, F.; Charpentier, F.; Doualan, J.-L.; Quetel, L.; Michel, K.; Chahal, R.; Troles, J.; Bureau, B.; Braud, A.; Camy, P.; et al. Mid-IR optical sensor for CO2 detection based on fluorescence absorbance of Dy3+:Ga5Ge20Sb10S65 fibers. Sens. Actuators B Chem. 2015, 207, 518–525. [Google Scholar] [CrossRef]
- Seekaew, Y.; Wongchoosuk, C. A novel graphene-based electroluminescent gas sensor for carbon dioxide detection. Appl. Surf. Sci. 2019, 479, 525–531. [Google Scholar] [CrossRef]
- Kamiński, M.; Kartanowicz, R.; Jastrzebski, D.; Kamiński, M.M. Determination of carbon monoxide, methane and carbon dioxide in refinery hydrogen gases and air by gas chromatography. J. Chromatogr. A 2003, 989, 277–283. [Google Scholar] [CrossRef]
- Lee, J.; Choi, N.-J.; Lee, H.-K.; Kim, J.; Lim, S.; Kwon, J.; Lee, S.-M.; Moon, S.E.; Jong, J.; Yoo, D. Low power consumption solid electrochemical-type micro CO2 gas sensor. Sens. Actuators B Chem. 2017, 248, 957–960. [Google Scholar] [CrossRef]
- Roose, B.; Correa-Baena, J.-P.; Gödel, K.C.; Graetzel, M.; Hagfeldt, A.; Steiner, U.; Abate, A. Mesoporous SnO2 electron selective contact enables UV-stable perovskite solar cells. Nano Energy 2016, 30, 517–522. [Google Scholar] [CrossRef] [Green Version]
- Bonu, V.; Gupta, B.; Chandra, S.; Das, A.; Dhara, S.; Tyagi, A.K. Electrochemical supercapacitor performance of SnO2 quantum dots. Electrochim. Acta 2016, 203, 230–237. [Google Scholar] [CrossRef] [Green Version]
- Wang, B.; Zhu, L.F.; Yang, Y.H.; Xu, A.N.S.; Yang, G.W. Fabrication of a SnO2 Nanowire Gas Sensor and Sensor Performance for Hydrogen. J. Phys. Chem. C 2008, 112, 6643–6647. [Google Scholar] [CrossRef]
- Sun, P.; Yu, Y.; Xu, J.; Sun, Y.; Ma, J.; Lu, G. One-step synthesis and gas sensing characteristics of hierarchical SnO2 nanorods modified by Pd loading. Sens. Actuators B Chem. 2011, 160, 244–250. [Google Scholar] [CrossRef]
- Xiong, Y.; Xuea, Q.; Ling, C.; Lu, W.; Ding, D.; Zhu, L.; Li, X. Effective CO2 detection based on LaOCl-doped SnO2 nanofibers: Insight into the role of oxygen in carrier gas. Sens. Actuators B Chem. 2017, 241, 725–734. [Google Scholar] [CrossRef]
- Trung, D.D.; Toan, L.D.; Hong, H.S.; Lam, T.D.; Trung, T.; Van Hieu, N. Selective detection of carbon dioxide using LaOCl-functionalized SnO2 nanowires for air-quality monitoring. Talanta 2012, 88, 152–159. [Google Scholar] [CrossRef]
- Chavali, M.S.; Nikolova, M.P. Metal oxide nanoparticles and their applications in nanotechnology. SN Appl. Sci. 2019, 1, 607. [Google Scholar] [CrossRef] [Green Version]
- Geim, A.K. Graphene: Status and Prospects. Science 2009, 324, 1530–1534. [Google Scholar] [CrossRef] [Green Version]
- Ren, H.; Gu, C.; Joo, S.W.; Zhao, J.; Sun, Y.-F.; Huang, J. Effective hydrogen gas sensor based on NiO@rGO nanocomposite. Sens. Actuators B Chem. 2018, 266, 506–513. [Google Scholar] [CrossRef]
- Li, X.; Zhao, Y.; Wang, X.; Wang, J.; Gaskov, A.M.; Akbar, S. Reduced graphene oxide (rGO) decorated TiO2 microspheres for selective room-temperature gas sensors. Sens. Actuators B Chem. 2016, 230, 330–336. [Google Scholar] [CrossRef]
- Su, P.-G.; Yang, L.-Y. NH 3 gas sensor based on Pd/SnO2 /RGO ternary composite operated at room-temperature. Sens. Actuators B Chem. 2016, 223, 202–208. [Google Scholar] [CrossRef]
- Zhang, D.; Liu, A.; Chang, H.; Xia, B. Room-temperature high-performance acetone gas sensor based on hydrothermal synthesized SnO2-reduced graphene oxide hybrid composite. RSC Adv. 2015, 5, 3016–3022. [Google Scholar] [CrossRef]
- Zhang, D.; Liu, J.; Chang, H.; Liu, A.; Xia, B. Characterization of a hybrid composite of SnO2 nanocrystal-decorated reduced graphene oxide for ppm-level ethanol gas sensing application. RSC Adv. 2015, 5, 18666–18672. [Google Scholar] [CrossRef]
- Rong, X.; Chen, D.; Qu, G.; Li, T.; Zhang, R.; Sun, J. Effects of graphene on the microstructures of SnO2@rGO nanocomposites and their formaldehyde-sensing performance. Sens. Actuators B Chem. 2018, 269, 223–237. [Google Scholar] [CrossRef]
- Gui, Y.-H.; Wang, H.-Y.; Tian, K.; Yang, L.-L.; Guo, H.-S.; Zhang, H.-Z.; Fang, S.-M.; Wang, Y. Enhanced gas sensing properties to NO2 of SnO2/rGO nanocomposites synthesized by microwave-assisted gas-liquid interfacial method. Ceram. Int. 2018, 44, 4900–4907. [Google Scholar] [CrossRef] [Green Version]
- Navazani, S.; Shokuhfar, A.; Hassanisadi, M.; Askarieh, M.; Di Carlo, A.; Agresti, A. Facile synthesis of a SnO2@rGO nanohybrid and optimization of its methane-sensing parameters. Talanta 2018, 181, 422–430. [Google Scholar] [CrossRef]
- Wang, T.; Sun, Z.; Huang, D.; Zhang, Y.; Ji, Q.; Hu, N.; Yin, G.; He, D.-N.; Wei, H.; Zhang, Y. Studies on NH3 gas sensing by zinc oxide nanowire-reduced graphene oxide nanocomposites. Sens. Actuators B Chem. 2017, 252, 284–294. [Google Scholar] [CrossRef]
- Zhang, B.; Cheng, M.; Liu, G.; Gao, Y.; Zhao, L.; Li, S.; Wang, Y.; Liu, Y.; Liang, X.; Zhang, T.; et al. Room temperature NO2 gas sensor based on porous Co3O4 slices/reduced graphene oxide hybrid. Sens. Actuators B Chem. 2018, 263, 387–399. [Google Scholar] [CrossRef]
- Seekaew, Y.; Pon-On, W.; Wongchoosuk, C. Ultrahigh Selective Room-Temperature Ammonia Gas Sensor Based on Tin–Titanium Dioxide/reduced Graphene/Carbon Nanotube Nanocomposites by the Solvothermal Method. ACS Omega 2019, 4, 16916–16924. [Google Scholar] [CrossRef] [Green Version]
- Neri, G.; Leonardi, S.G.; Latino, M.; Donato, N.; Baek, S.; Conte, D.E.; Russo, P.A.; Pinna, N. Sensing behavior of SnO2/reduced graphene oxide nanocomposites toward NO2. Sens. Actuators B Chem. 2013, 179, 61–68. [Google Scholar] [CrossRef]
- Yoon, H.J.; Jun, D.H.; Yang, J.H.; Zhou, Z.; Yang, S.S.; Cheng, M.M.-C. Carbon dioxide gas sensor using a graphene sheet. Sens. Actuators B Chem. 2011, 157, 310–313. [Google Scholar] [CrossRef]
- Nemade, K.R.; Waghuley, S.A. Carbon dioxide gas sensing application of graphene/y2o3 quantum dots composite. Int. J. Mod. Phys. Conf. Ser. 2013, 22, 380–384. [Google Scholar] [CrossRef]
- Sha, R.; Badhulika, S. Facile green synthesis of reduced graphene oxide/tin oxide composite for highly selective and ultra-sensitive detection of ascorbic acid. J. Electroanal. Chem. 2018, 816, 30–37. [Google Scholar] [CrossRef]
- Zhang, J.; Yang, H.; Shen, G.; Cheng, P.; Zhang, J.; Guo, S. Reduction of graphene oxide vial-ascorbic acid. Chem. Commun. 2010, 46, 1112–1114. [Google Scholar] [CrossRef] [PubMed]
- Jiang, S.; Huang, R.; Zhu, W.; Li, X.; Zhao, Y.; Gao, Z.; Gao, L.; Zhao, J. Free-Standing SnO2@rGO Anode via the Anti-solvent-assisted Precipitation for Superior Lithium Storage Performance. Front. Chem. 2019, 7. [Google Scholar] [CrossRef]
- Wang, Y.; Huang, Z.X.; Shi, Y.; Wong, J.I.; Ding, M.; Yang, H.Y. Designed hybrid nanostructure with catalytic effect: Beyond the theoretical capacity of SnO2 anode material for lithium ion batteries. Sci. Rep. 2015, 5, 9164. [Google Scholar] [CrossRef] [Green Version]
- Zhu, X.; Guo, Y.; Ren, H.; Gao, C.; Zhou, Y. Enhancing the NO2 gas sensing properties of rGO/SnO2 nanocomposite films by using microporous substrates. Sens. Actuators B Chem. 2017, 248, 560–570. [Google Scholar] [CrossRef]
- Song, Z.; Wei, Z.; Wang, B.; Luo, Z.; Xu, S.; Zhang, W.; Yu, H.; Li, M.; Huang, Z.; Zang, J.; et al. Sensitive Room-Temperature H2S Gas Sensors Employing SnO2 Quantum Wire/Reduced Graphene Oxide Nanocomposites. Chem. Mater. 2016, 28, 1205–1212. [Google Scholar] [CrossRef]
- Al-Sheetan, K.M.; Shaik, M.R.; Al-Hobaib, A.S.; Alandis, N.M. Characterization and Evaluation of the Improved Performance of Modified Reverse Osmosis Membranes by Incorporation of Various Organic Modifiers and SnO2 Nanoparticles. J. Nanomater. 2015, 2015, 1–11. [Google Scholar] [CrossRef]
- Xu, C.; Shi, X.; Ji, A.; Shi, L.; Zhou, C.; Cui, Y. Fabrication and Characteristics of Reduced Graphene Oxide Produced with Different Green Reductants. PLoS ONE 2015, 10, e0144842. [Google Scholar] [CrossRef] [PubMed] [Green Version]
- Elbasuney, S.; El-Sayyad, G.S.; Yehia, M.; Aal, S.K.A. Facile synthesis of RGO-Fe2O3 nanocomposite: A novel catalyzing agent for composite propellants. J. Mater. Sci. Mater. Electron. 2020, 1–11. [Google Scholar] [CrossRef]
- Cançado, L.G.; Jorio, A.; Ferreira, E.H.M.; Stavale, F.; Achete, C.A.; Capaz, R.B.; Moutinho, M.V.O.; Lombardo, A.; Kulmala, T.S.; Ferrari, A.C. Quantifying Defects in Graphene via Raman Spectroscopy at Different Excitation Energies. Nano Lett. 2011, 11, 3190–3196. [Google Scholar] [CrossRef] [PubMed] [Green Version]
- Li, S.; Xie, W.; Wang, S.; Jiang, X.; Peng, S.; He, D. Facile synthesis of rGO/SnO2 composite anodes for lithium ion batteries. J. Mater. Chem. A 2014, 2, 17139–17145. [Google Scholar] [CrossRef]
- Meng, F.; Zheng, H.; Chang, Y.; Zhao, Y.; Li, M.; Wang, C.; Sun, Y.; Liu, J. One-Step Synthesis of Au/SnO2/RGO Nanocomposites and Their VOC Sensing Properties. IEEE Trans. Nanotechnol. 2018, 17, 212–219. [Google Scholar] [CrossRef]
- Fan, K.; Qin, H.; Wang, L.; Ju, L.; Hu, J. CO2 gas sensors based on La1−xSrxFeO3 nanocrystalline powders. Sens. Actuators B Chem. 2013, 177, 265–269. [Google Scholar] [CrossRef]
- Joshi, S.; Ippolito, S.J.; Sunkara, M.V. Hierarchical assembly of interleaved n-ZnO network and p-CuO for improved chemo-resistive CO2 Gas sensing performance. In Proceedings of the 12th International Conference on Nano/Micro Engineered and Molecular Systems (NEMS), Los Angeles, CA, USA, 9–12 April 2017; pp. 137–142. [Google Scholar]
Figure 1.
Schematic representation for the preparation of SnO2-rGO nanocomposite.

Figure 2.
Schematic of the experimental setup for CO2 detection.

Figure 3.
FESEM observations of the (a) rGO sheets; (b) SnO2-rGO hybrid composite.

Figure 4.
HRTEM image of the (a–c) SnO2-rGO composite with different magnifications to obtain grain sizes of SnO2.
Figure 4.
HRTEM image of the (a–c) SnO2-rGO composite with different magnifications to obtain grain sizes of SnO2.


Figure 5.
EDX spectra of the fundamental elements found in the (a) SnO2-rGO composite and (b) rGO.

Figure 6.
Raman spectra of SnO2-rGO and rGO (the inset shows the S1 band that belongs to SnO2).

Figure 7.
XPS spectra of the SnO2-rGO hybrid composite: (a) wide survey spectrum, (b) C 1s spectra, and (c) Sn 3d spectra.
Figure 7.
XPS spectra of the SnO2-rGO hybrid composite: (a) wide survey spectrum, (b) C 1s spectra, and (c) Sn 3d spectra.

Figure 8.
Response transients of the nanocomposite IDE gas sensor toward 5 ppm CO2 at ambient room temperature (the inset shows the variation of resistance as a function of time).
Figure 8.
Response transients of the nanocomposite IDE gas sensor toward 5 ppm CO2 at ambient room temperature (the inset shows the variation of resistance as a function of time).

Figure 9.
Repetitive response curves of the SnO2-rGO composite sensors to 5 continuous cycles of 10 ppm CO2 at room temperature.
Figure 9.
Repetitive response curves of the SnO2-rGO composite sensors to 5 continuous cycles of 10 ppm CO2 at room temperature.

Figure 10.
Dynamic responses to transient cycles with the SnO2-rGO nanocomposite upon exposure to five different concentrations of CO2 gas (10 ppm, 20 ppm, 30 ppm, 40 ppm, 50 ppm) at room temperature.
Figure 10.
Dynamic responses to transient cycles with the SnO2-rGO nanocomposite upon exposure to five different concentrations of CO2 gas (10 ppm, 20 ppm, 30 ppm, 40 ppm, 50 ppm) at room temperature.

Figure 11.
Linear graph showing the relationship between the SnO2-rGO sensor response magnitude and CO2 concentration.
Figure 11.
Linear graph showing the relationship between the SnO2-rGO sensor response magnitude and CO2 concentration.

Figure 12.
Stability of the sensor response toward 100 ppm CO2 over 28 days.

Figure 13.
Response magnitudes of the SnO2-rGO nanocomposite and rGO gas sensors upon exposure to CO2 gas with various concentrations from 5 to 500 ppm at room temperature.
Figure 13.
Response magnitudes of the SnO2-rGO nanocomposite and rGO gas sensors upon exposure to CO2 gas with various concentrations from 5 to 500 ppm at room temperature.

Figure 14.
Sensing response towards 100 ppm CO2 operated at a relative humidity of 58% RH and at room temperature. Dynamic response curve of (a) SnO2-rGO and (b) rGO gas sensors.
Figure 14.
Sensing response towards 100 ppm CO2 operated at a relative humidity of 58% RH and at room temperature. Dynamic response curve of (a) SnO2-rGO and (b) rGO gas sensors.

Figure 15.
Schematic illustration of the proposed sensing mechanism of SnO2-rGO hybrid during CO2 detection.
Figure 15.
Schematic illustration of the proposed sensing mechanism of SnO2-rGO hybrid during CO2 detection.


Table 1.
Overview of the sensing performance of CO2 gas sensors.
| Sensing Material | Synthesis Method | Tested CO2 Concentration @ Operating Temperature | Response | Reference |
|---|---|---|---|---|
| Graphene sheet | Mechanical cleavage | 100 ppm @RT | 25% | [32] |
| Graphene/Y2O3 quantum dots composite | Electrochemical exfoliation of graphite | 35 ppm @RT | 1.08 | [33] |
| La1−xSrxFeO3 | Sol–gel method followed by annealing | 2000 ppm @380 °C | 1.25 | [46] |
| SnO2 | Coprecipitation method | 2000 ppm @240 °C | 1.24 | [5] |
| LaOCl-SnO2 nanofibers | Electrospinning technique | 1000 ppm @300 °C | 3.7 | [16] |
| SnO2–LaOCl nanowires | Surface coating technique | 2000 ppm @400 °C | 5.6 | [17] |
| CuO/ZnO | Hydrothermal method | 10,000 ppm @320 °C | 0.44 | [47] |
| SnO2-rGO (current work) | 5 ppm @RT | 0.07% | ||
| rGO (current work) | 100 ppm | 0.179% |
Publisher’s Note: MDPI stays neutral with regard to jurisdictional claims in published maps and institutional affiliations. |
© 2021 by the authors. Licensee MDPI, Basel, Switzerland. This article is an open access article distributed under the terms and conditions of the Creative Commons Attribution (CC BY) license (http://creativecommons.org/licenses/by/4.0/).
Share and Cite
MDPI and ACS Style
Lee, Z.Y.; Hawari, H.F.b.; Djaswadi, G.W.b.; Kamarudin, K. A Highly Sensitive Room Temperature CO2 Gas Sensor Based on SnO2-rGO Hybrid Composite. Materials 2021, 14, 522. https://doi.org/10.3390/ma14030522
AMA Style
Lee ZY, Hawari HFb, Djaswadi GWb, Kamarudin K. A Highly Sensitive Room Temperature CO2 Gas Sensor Based on SnO2-rGO Hybrid Composite. Materials. 2021; 14(3):522. https://doi.org/10.3390/ma14030522
Chicago/Turabian StyleLee, Zhi Yan, Huzein Fahmi bin Hawari, Gunawan Witjaksono bin Djaswadi, and Kamarulzaman Kamarudin. 2021. "A Highly Sensitive Room Temperature CO2 Gas Sensor Based on SnO2-rGO Hybrid Composite" Materials 14, no. 3: 522. https://doi.org/10.3390/ma14030522
Note that from the first issue of 2016, this journal uses article numbers instead of page numbers. See further details here.