Article

Evaluation of Strength Development in Concrete with Ground Granulated Blast Furnace Slag Using Apparent Activation Energy

1
Innovative Durable Building and Infrastructure Research Center, Department of Architectural Engineering, Hanyang University, 1271 Sa 3-dong, Sangnok-gu, Ansan 15588, Korea
2
Department of Chemical and Environmental Engineering, University of California-Riverside, Riverside, CA 92521, USA
3
Department of Civil and Environmental Engineering, Hannam University, Daejeon 34430, Korea
4
Department of Architectural Engineering, Hanyang University, 1271 Sa 3-dong, Sangnok-gu, Ansan 15588, Korea
5
Intelligent Construction Automation Center, Kyungpook National University, 80, Daehak-ro, Buk-gu, Daegu 41566, Korea
*
Author to whom correspondence should be addressed.
Materials 2020, 13(2), 442; https://doi.org/10.3390/ma13020442
Submission received: 19 November 2019 / Revised: 5 January 2020 / Accepted: 14 January 2020 / Published: 17 January 2020
(This article belongs to the Special Issue Supplementary Cementitious Materials in Concrete)

Abstract

:
Ground granulated blast furnace slag (GGBFS) conventionally has been incorporated with ordinary Portland cement (OPC) owing to reduce the environmental load and enhance the engineering performance. Concrete with GGBFS shows different strength development of normal concrete, but sensitive, to exterior condition. Thus, a precise strength evaluation technique based on a quantitative model like full maturity model is required. Many studies have been performed on strength development of the concrete using equivalent age which is based on the apparent activation energy. In this process, it considers the effect of time and temperature simultaneously. However, the previous models on the apparent activation energy of concrete with mineral admixtures have limitation, and they have not considered the effect of temperature on strength development. In this paper, the apparent activation energy with GGBFS replacement ratio was calculated through several experiments and used to predict the compressive strength of GGBFS concrete. Concrete and mortar specimens with 0.6 water/binder ratio, and 0 to 60% GGBFS replacement were prepared. The apparent activation energy (Ea) was experimentally derived considering three different curing temperatures. Thermodynamic reactivity of GGBFS mixed concrete at different curing temperature was applied to evaluate the compressive strength model, and the experimental results were in good agreement with the model. The results show that when GGBFS replacement ratio was increased, there was a delay in compressive strength.

1. Introduction

Ground granulated blast furnace slag (GGBFS) is widely used in various engineering applications to replace the ordinary Portland cement (OPC) [1,2,3]. However, GGBFS is sensitive to curing conditions and exhibit slow strength development [4,5,6,7,8]. In order to predict the strength behavior in the concrete with GGBFS, much research have been performed based on cement hydration phenomena [9]. Moreover, it is necessary to estimate the mechanical properties of GGBFS concrete, such as compressive strength, splitting tensile strength, elastic modulus, creep, shrinkage, etc. Among the mechanical properties used in the design, compressive strength is the most important. There are different models for strength development, but among them, the maturity model is the best model. This model is based on the age concept. It has been widely used to evaluate the compressive strength of the concrete on the assumption of linear relationship with temperature [10,11,12] or a nonlinear relationship with the chemical reaction rate of the cement [13]. By considering curing temperature range and the accuracy of the prediction result, the equivalent age model is widely used for the interpretation of strength development, which incorporates the chemical reaction rate of the cement [13]. In the chemical reaction rate model, it is considered that apparent activation energy (Ea) is a key parameter with the curing temperature on the hydration reaction [14,15,16,17,18,19,20]. The Ea is indirectly proportional to compressive strength, as suggested in ASTM C 1074-11 [21]. The application of Ea in the equivalent age model for normal concrete and the related strength prediction model is reasonably agreed with the test results. However, the concrete with GGBFS exhibits several differences compared to normal concrete in regards to the strength development attributed to a reduction of compressive strength in early age, caused by retardation of the setting. When the GGBFS comes into contact with concrete pore solution, the impermeable acid film surrounds the particles on the surface is destroyed; therefore, the chemical reaction in concrete would start. The delay in initial compressive strength of concrete with GGBFS is owing to insufficient alkalinity of cement paste [4,5,6,22,23]. In addition, Escalante et al. [4,5] studied the hydration of Portland cement with GGBFS under curing conditions. The hydration reaction was measured for six months at 10 °C, 30 °C and 50 °C curing temperature of cement pastes with 30%, 50% GGBFS replacement in 0.5 and 0.35 W/C ratio. The highest hydration reaction rate was found with 30% GGBFS at 50 °C in 0.5 W/C, while the lowest was shown by 50% GGBFS replacement at 10 °C in 0.35 W/C. Thus, a prediction of concrete compressive strength development with GGBFS by using a full maturity model by evaluating Ea is required. The present study is aimed to predict the compressive strength development of the concrete with GGBFS by calculating the Ea.

2. Prediction of the Compressive Strength Based on Maturity Theory

2.1. Maturity

Maturity is a function that quantitatively expresses the effect of curing temperature and time on strength development of the concrete. Therefore, the maturity theory by considering curing temperature and time function can be defined as:
M = 0 t H ( T ) d t ,
where M and h(T) is maturity and maturity function, respectively. T denotes curing temperature over the age of t.
The maturity function is expressed in linear Equation (2) considering temperature and the age [10], whereas, the equivalent age can be calculated by Arrhenius chemical reaction rate (Equation (3)) [12,13,24].
0 t M s = ( T T 0 ) Δ t ,
where Ms is maturity at age t. T is the average temperature (°C) of the concrete during the time interval, and T0 is reference temperature (−10 °C) [11].
k T = A e x p E a R T ,
where kT is the reaction rate constant, A is proportionality constant, Ea is apparent activation energy (kJ/mol), R is gas constant (8.314 J/mol∙K), and T is the absolute temperature (Kelvin). Thus, the equivalent age (te) can be calculated by the following equation:
t e = 0 t H ( T ) d t H ( T r ) ,
where H(T) is maturity function at different curing temperature (t), whereas, H(Tr) represents the maturity function at fixed curing temperature, i.e., 20 °C (293 K). The equivalent age means curing time at standard temperature (20 °C). By considering Ea, te can be derived as:
t e = 0 t e x p E a R ( 1 T r 1 T ) d t ,
where T is the average curing temperature of the concrete during a time interval and Tr is the absolute or fixed temperature, i.e., 20 °C (293 K).
The strength development analysis using maturity was carried out by considering curing temperature and duration. Other researchers have suggested a hyperbolic regression model (Equation (6)) which gives more accurate predictions compared to an exponential function [24,25,26,27]. In addition, the following model was implemented by introducing a third variable to explain the dormant period during the hydration process of cement.
S = S u k T ( t e t 0 ) 1 + k T ( t e t 0 ) .
S is predicted compressive strength, whereas, Su represents the obtained experimental compressive strength at 28 days of curing. kT is the reaction rate constant at curing temperature (T). te and t0 represent the equivalent age and the age when compressive development starts (final setting time), respectively.

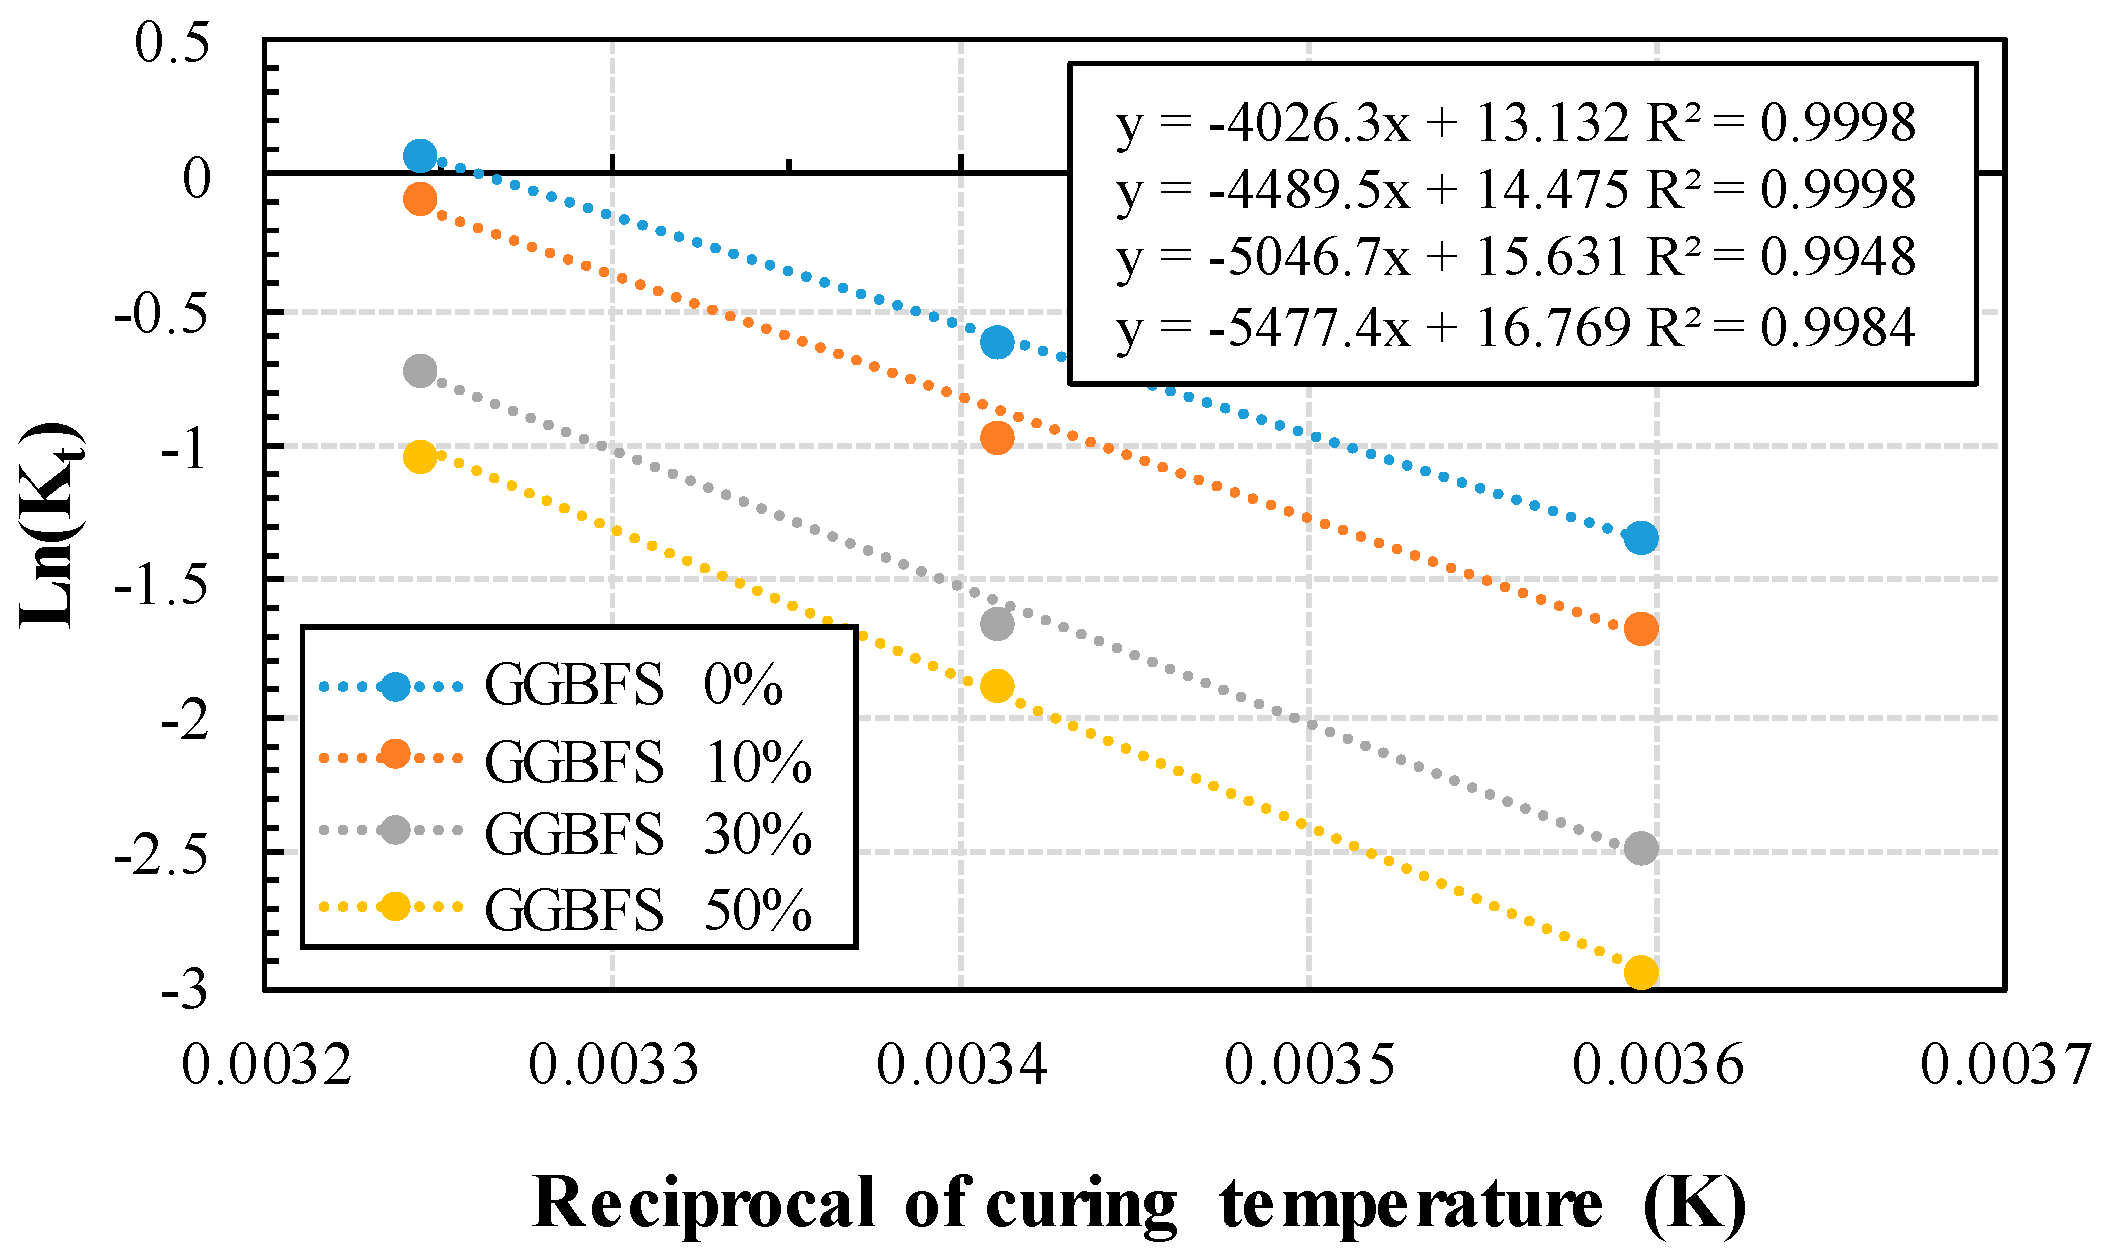
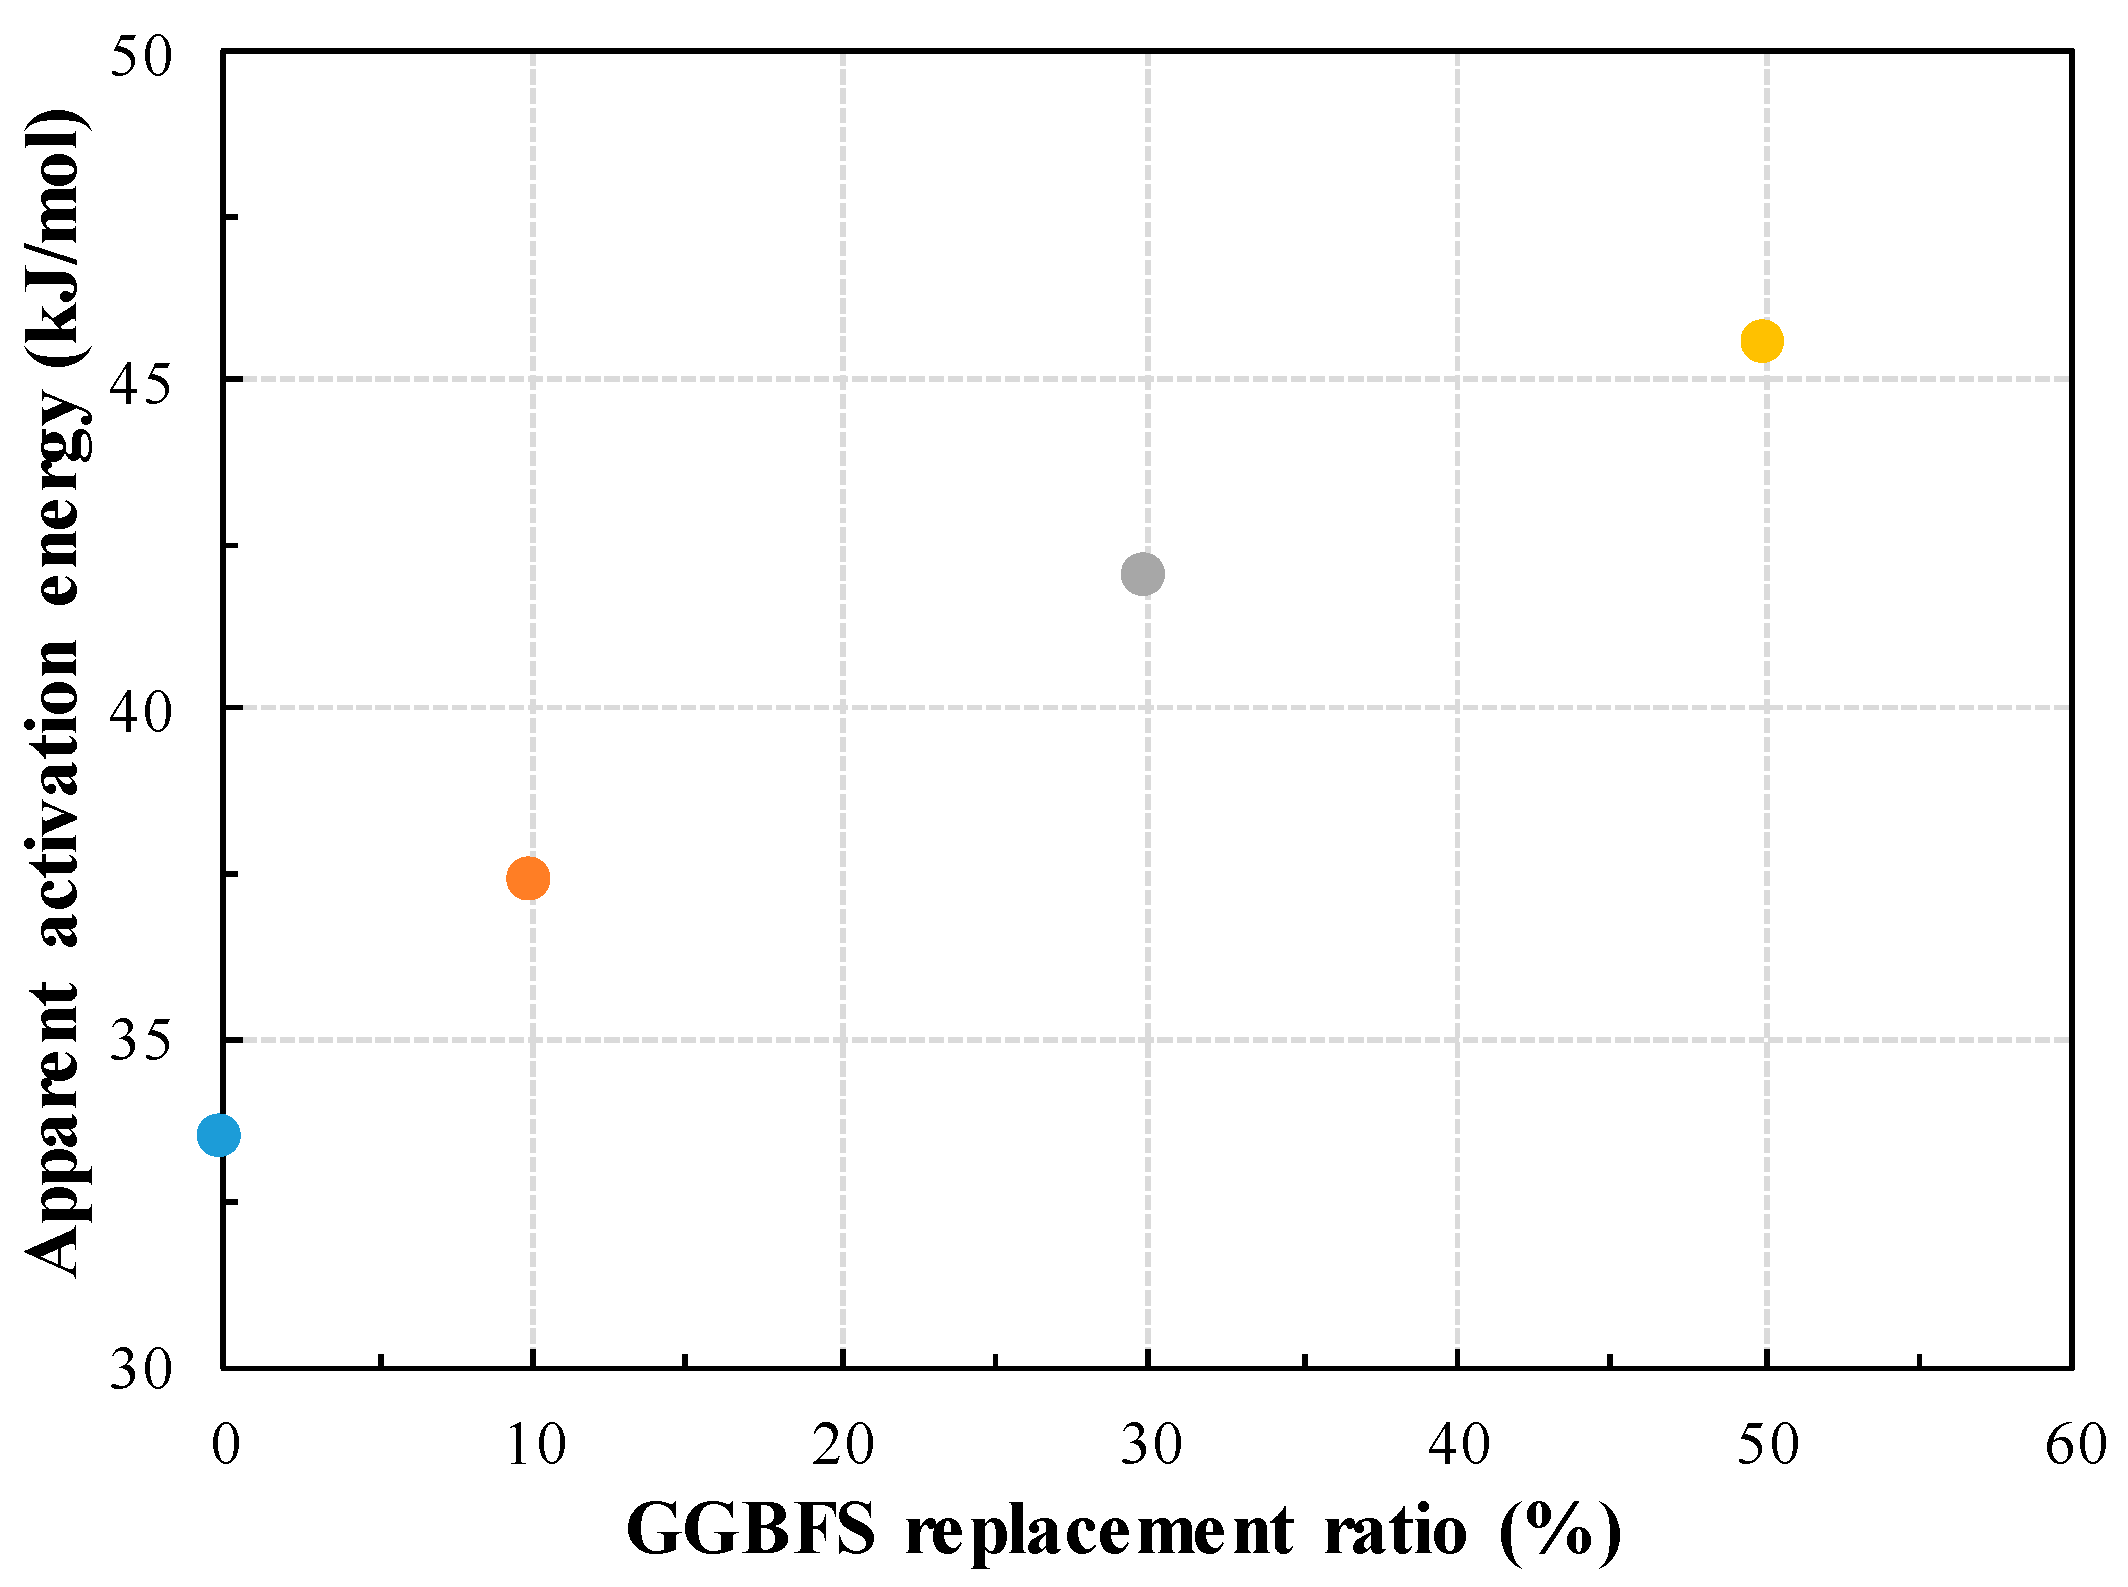
2.2. Reaction Rate Constant(kT) and Apparent Activation Energy (Ea)

The cement reacts with water at an early age resulting hydration reaction. Due to the hydration of cement paste in concrete, it develops strength. The hydration rate is governed by the reaction rate constant of the point when the cement paste and water react [24,28]. The hydration degree of Portland cement can be derived by the weight ratio of reaction products. The weight ratio of reaction products can be determined by non-hydrated cement using an electron microscope or X-ray diffraction analysis [29,30,31,32]. Also, the degree of hydration can be measured by the amount of water, as well as heat generation, and the compressive strength in an indirect way. The most common indirect hydration measurement method used in Portland cement is the micro-hydration method using conduction calorimeter. It measures the amount of hydration heat generated at the beginning when hydration of cement starts with time and represents the ratio of calorific value of final hydration per weight of cement [33]. This method accurately shows the degree of hydration at the beginning of cement hydration, but cannot change the degree of hydration, due to change in curing process [27]. The reaction rate constant is the indicator of the initial gradient for the degree of hydration. There are many factors which affect the reaction rate constant. However, it is difficult to quantitatively predict the effect of temperature on the reaction rate constant. Therefore, the reaction rate constant can be represented by the function of curing temperature if other conditions are identical. It is known that the reaction rate constant is influenced by the types of cement, curing temperature, W/C (%), admixture, and humidity conditions etc. [9,34,35,36,37]. Thus, activation energy (Ea) can help to calculate the reaction rate constant where minimum energy is required to occur the reaction. It has been reported that Ea can vary owing to the nature of Portland cement, which has different hydration reaction patterns with the setting process, curing period, and cementitious components [38]. Some researchers have reported that Ea is approximately 33.5 to 47.0 kJ/mol at early-age, and approximately 10 to 30 kJ/mol at long-term age [39,40,41,42,43,44,45,46,47,48,49]. Freisleben-Hansen and Pederson (FHP) [13] proposed an equation (Equation (7)) to estimate Ea of OPC concrete as a function of curing temperature.
E a = 33.5 + 1.47 ( 20 T a ) kJ / mol ( T a < 20   ° C ) ,
E a = 33.5 kJ / mol ( T a 20   ° C ) ,
where Ea is apparent activation energy by Freisleben-Hansen and Pedersen with temperature parameter, Ta is the average curing temperature of concrete during a time interval.
However, Carino pointed out that Ea can be determined by the composition, powder level, type, amount, and admixture of the cement [25,26], and other researchers argue that the Ea is changed by W/C ratio.
The hydration reaction of Portland cement can be formulated with Ea. Therefore, ASTM C 1074 [21] has suggested the method to determine the Ea. The procedure for determining the Ea and the compressive strength prediction procedure, according to ASTM C 1074 is shown in Figure 1.
The final setting time of the mortar cured at three different temperatures is measured. The compressive strength of mortar is measured at 2, 4, 8, 16, 32 and 64 times as the final setting time. By plotting the reciprocal of the age(x-axis) versus the compressive strength (y-axis), the y-intercept of the linear regression line can be obtained from the regression analysis. Ea can be calculated by plotting the reciprocal of the curing temperature(x-axis) versus the reciprocal of lnkT (y-axis) and dividing the gradient of the linear regression line obtained from the regression analysis. The equivalent age can be calculated by Ea of GGBFS concrete from Equation (5), and the compressive strength development is analyzed by the calculated equivalent age and kT from Equation (6).

3. Experimental Program

3.1. Experimental Variables

Experimental variables were GGBFS replacement ratio and curing temperature at 0.60 water/binder (W/B) ratio. Details of these ratios are shown in Table 1.

3.2. Materials

Cement and GGBFS

The cement used in the present study was ordinary Portland cement Type I containing 3.14 g/cm3 specific gravity. Blaine specific surface area of cement was 3230 cm2/g. GGBFS was used according to ASTM C 989 [50] with 2.84 g/cm3 specific gravity. Blaine specific surface area of cement was 4260 cm2/g. The chemical analysis of these materials are given in Table 2. The chemical composition OPC and GGBFS were carried out by X-ray fluorescence (XRF) instrument.

3.3. Mixture Proportions

The concrete mixture proportion is presented in Table 3. Four types of specimens with different GGBFS replacement ratio were prepared. The mortar was prepared by removing less than 5 mm coarse particle as shown the mixture proportion in Table 3 using 600 Am sieve according to ASTM C33 [51] to maintain the quality of the concrete. Different amounts of superplasticizer were used to equalize the workability of GGBFS and OPC concrete. When we have added the high amount of superplasticizer in GGBFS, the workability was reduced (results are not shown). Therefore, it is required to maintain workability. Hence, we have chosen a different amount of superplasticizer. We have taken the high amount of superplasticizer in OPC (without GGBFS) to mix the concrete properly owing to delay the setting time whereas, in case of GGBFS replacement, specimens were mixed properly even at a low amount of superplasticizer.

3.4. Prepared Specimens

Firstly, 0.1 m3 of concrete mix was prepared for each batch. Cement, GGBFS, fine aggregate and coarse aggregate were mixed in a screw type mixer for 1 min and 30 s. Thereafter, water and superplasticizer were added, and the mixture was mixed for 3 min and 30 s. In order to obtain the mortar, the fresh concrete was passed through a 5 mm sieve, and cast into a mold (200 mm × 100 mm) for penetration resistance test according to ASTM C403 [52], whereas, compressive strength of a mold (50 mm × 50 mm × 50 mm) according to ASTM C109 [53]. All specimens were cured at 5 ± 2 °C, 20 ± 2 °C, 35 ± 2 °C and 60% (±2.5%) relative humidity. The curing condition was selected according to ASTM C39 [54].

3.5. Test Methods

3.5.1. Penetration Resistance Test for Determining Setting Time

In order to measure the mortar setting time, the penetration resistance of the mortar was measured using a standard needle at a regular time interval according to ASTM C 403 [52]. From the plot of penetration resistance versus elapsed time, the initial and final setting times were determined. For mortar with 50% GGBFS content, the setting time could not be measured under curing conditions of 5 ± 1.5 ° C. Therefore, the time when the compressive strength of the mortar reaches 4 MPa was considered as the final setting time by the alternative method proposed in ASTM C 1074 [21].

3.5.2. Compressive Strength Test of Mortar and Concrete

The compressive strength of mortar was measured by 30 t class universal testing machine, and the average value was used by measuring the compressive strength in a triplicate set of specimens at 2, 4, 8, 16, 32 and 64 times for the final setting time [21]. In addition, the compressive strength of the concrete was measured 200 t class universal testing machine to measure the compressive strength in a triplicate set of specimens at ages 3, 7, 14, and 28 days, and the average value was considered as a result.

4. Results and Discussion

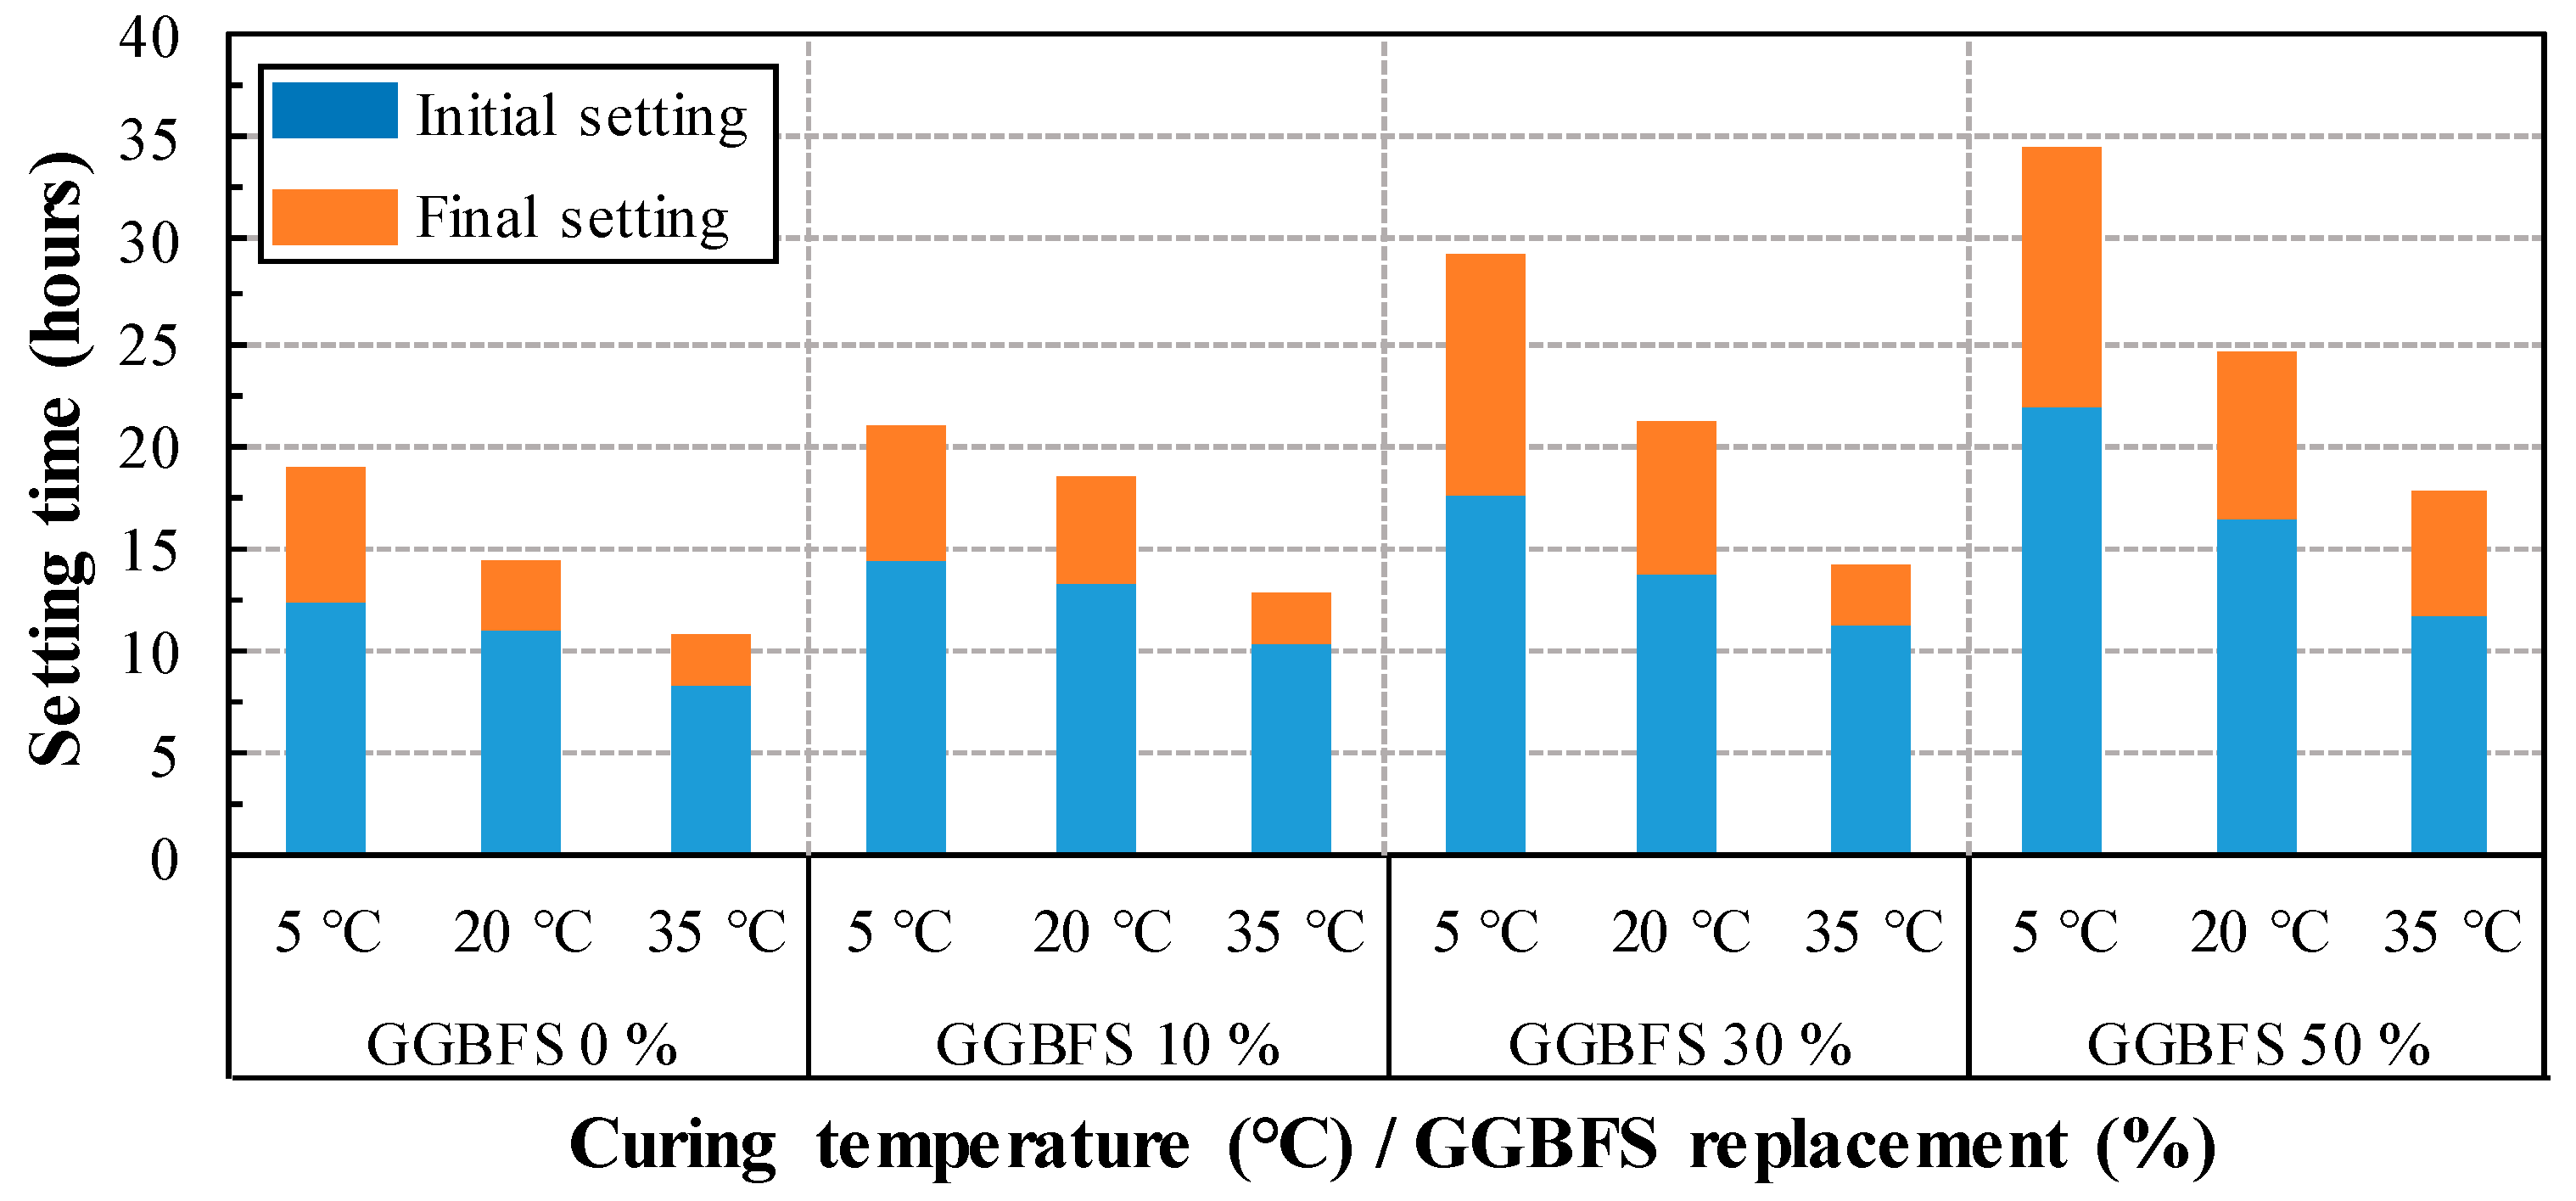
4.1. Setting Time of Mortars

The initial and final setting time of mortar with GGBFS was measured by a penetration resistance test. Figure 2 shows the effect of GGBFS and temperature on the setting time of mortar. As expected, mortars of the same GGBFS replacement ratio show a decrease in setting time at higher curing temperatures. In addition, compared with OPC mortar, as the GGBFS replacement ratio increases, the setting time increases at the same curing temperature. In case of mortar with 50% of GGBFS compared to OPC mortar at the curing temperature of 5 °C, the final setting time was delayed by 15.7 h. When mortar with 50% GGBFS was cured at 5° C and 35 °C, the final setting time was delayed by 16.9 h. The largest difference in the final setting time was 23.7 h between 50% GGBFS at 5 °C and OPC at 35 °C. It is considered that impermeable film has formed when GGBFS particle reacts with water. Due to the formation of the impermeable film results in the delay of hydration reaction, which restraining the penetration of water and ion [44,45,46,47]. Thus, this result suggests that the setting quickly occur owing to the fast reaction of hydration caused in early age at high temperature. Therefore, the setting time is affected by both curing temperature and GGBFS replacement ratio.

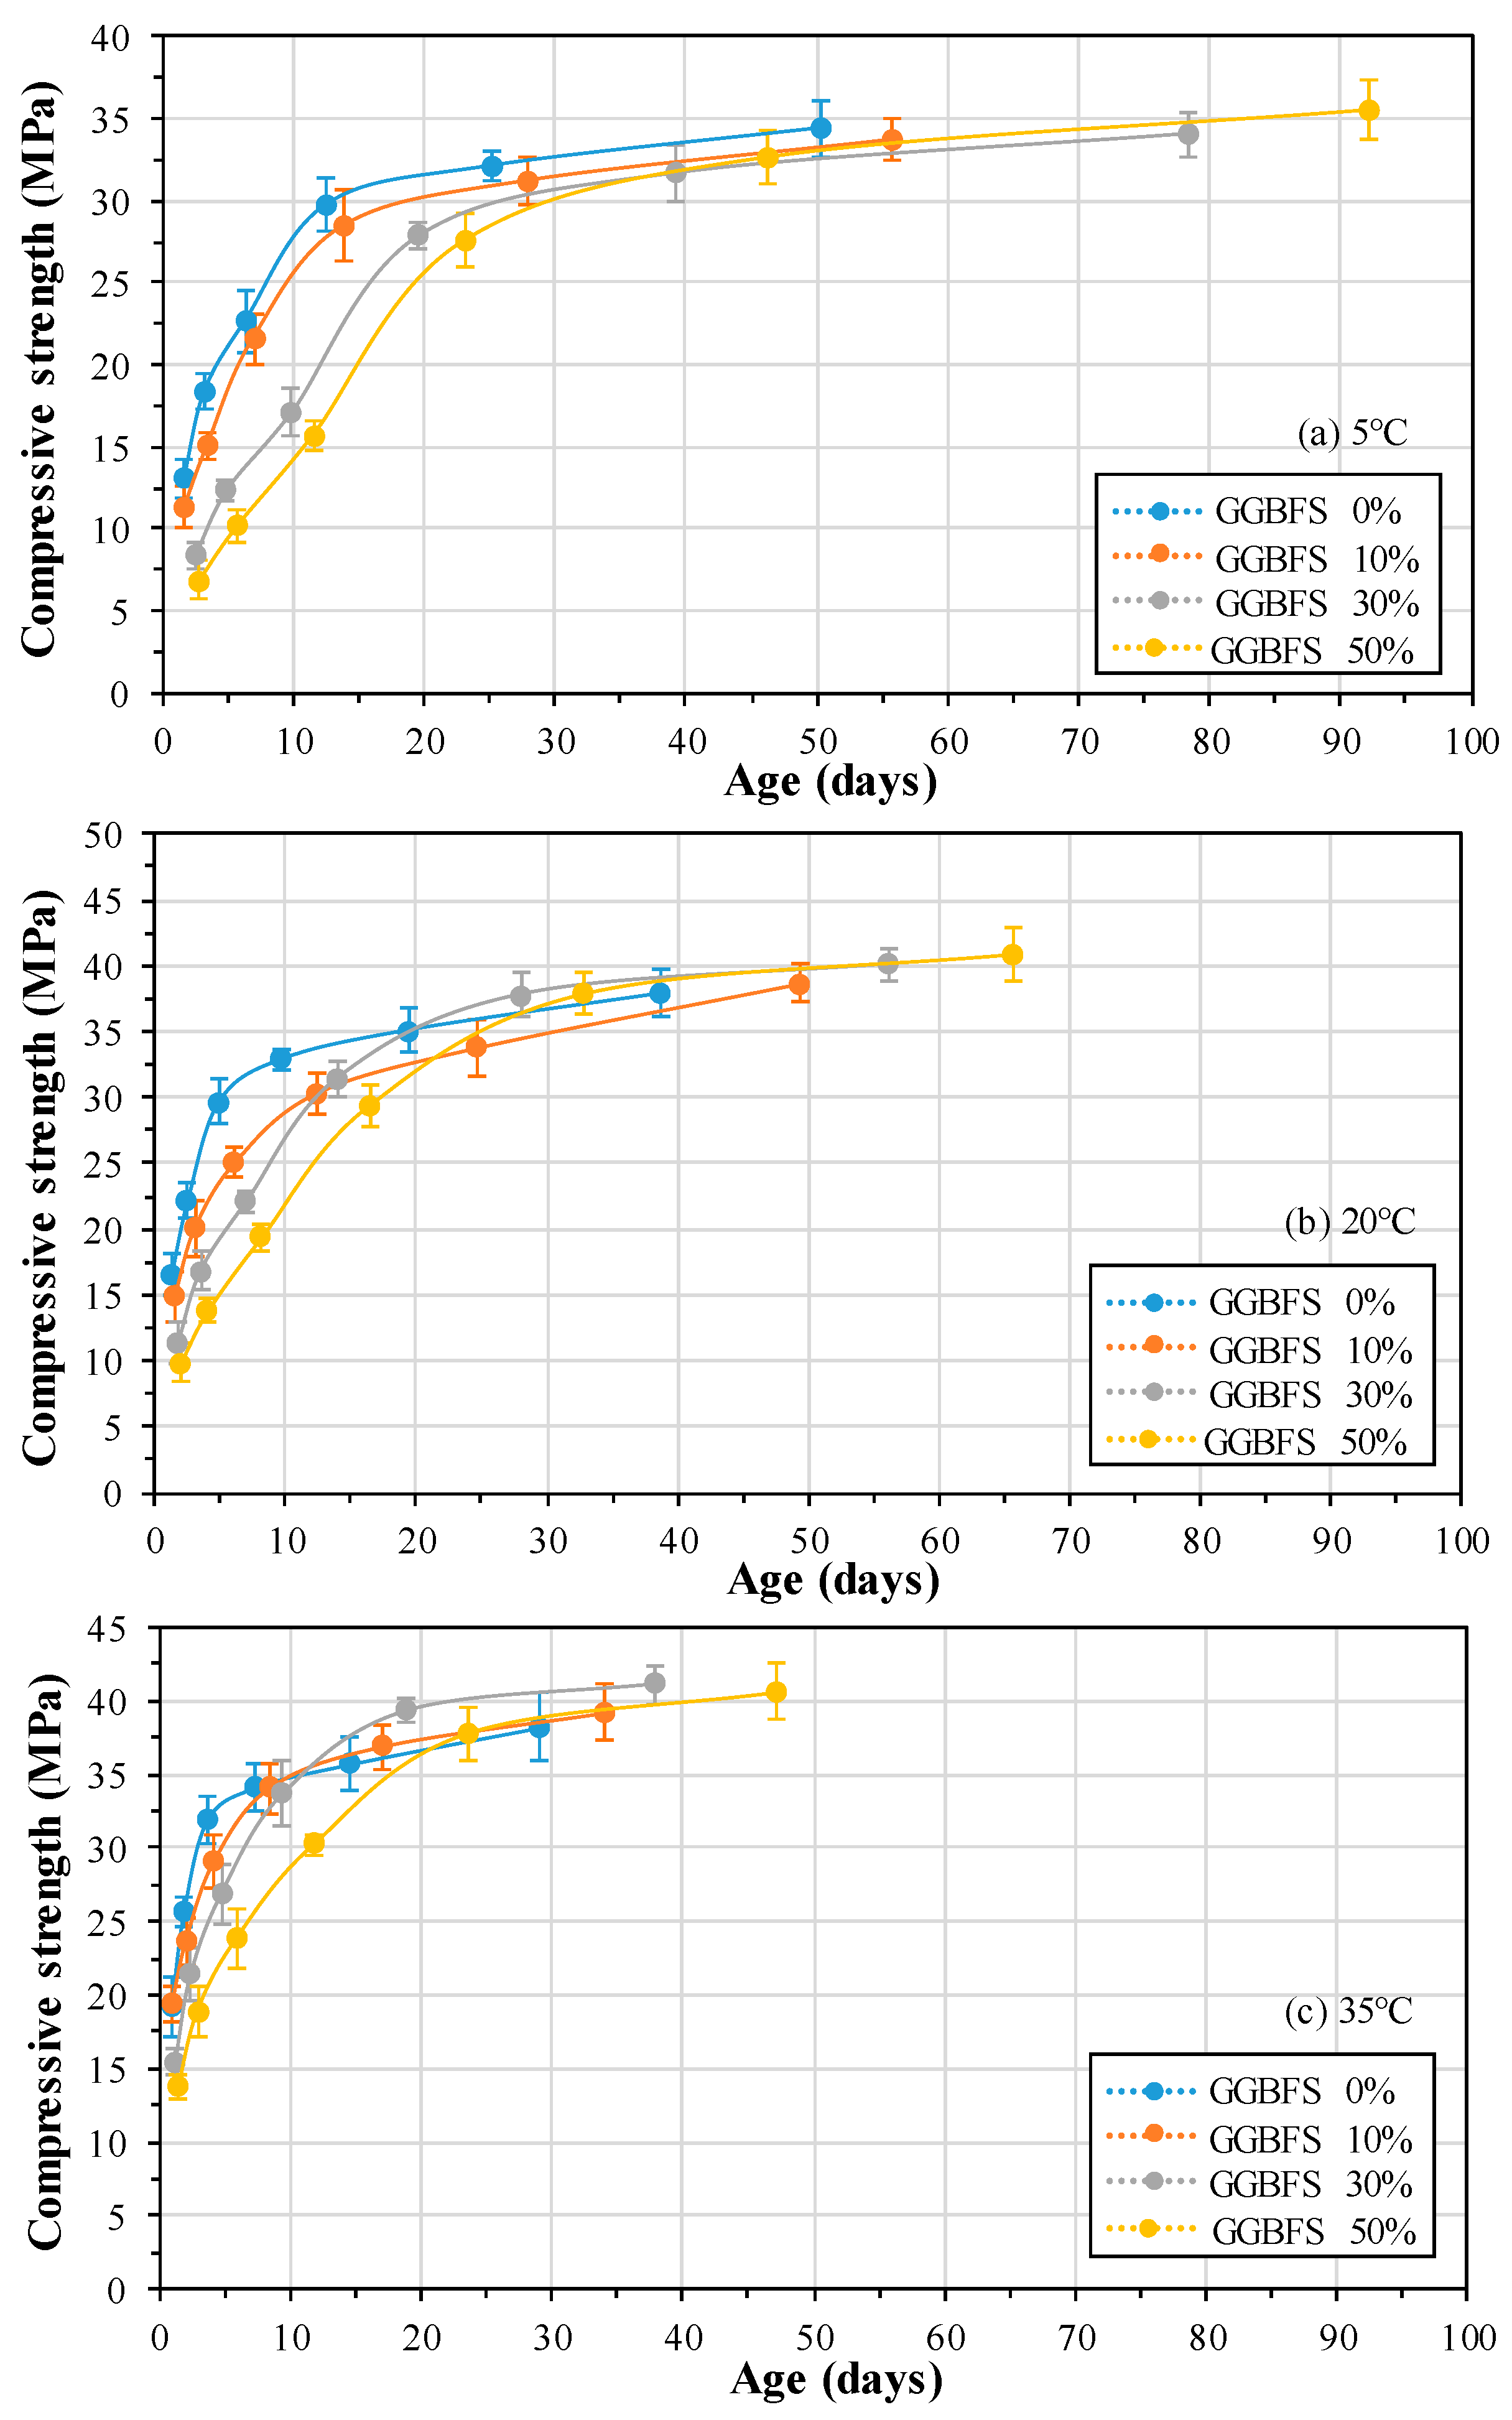
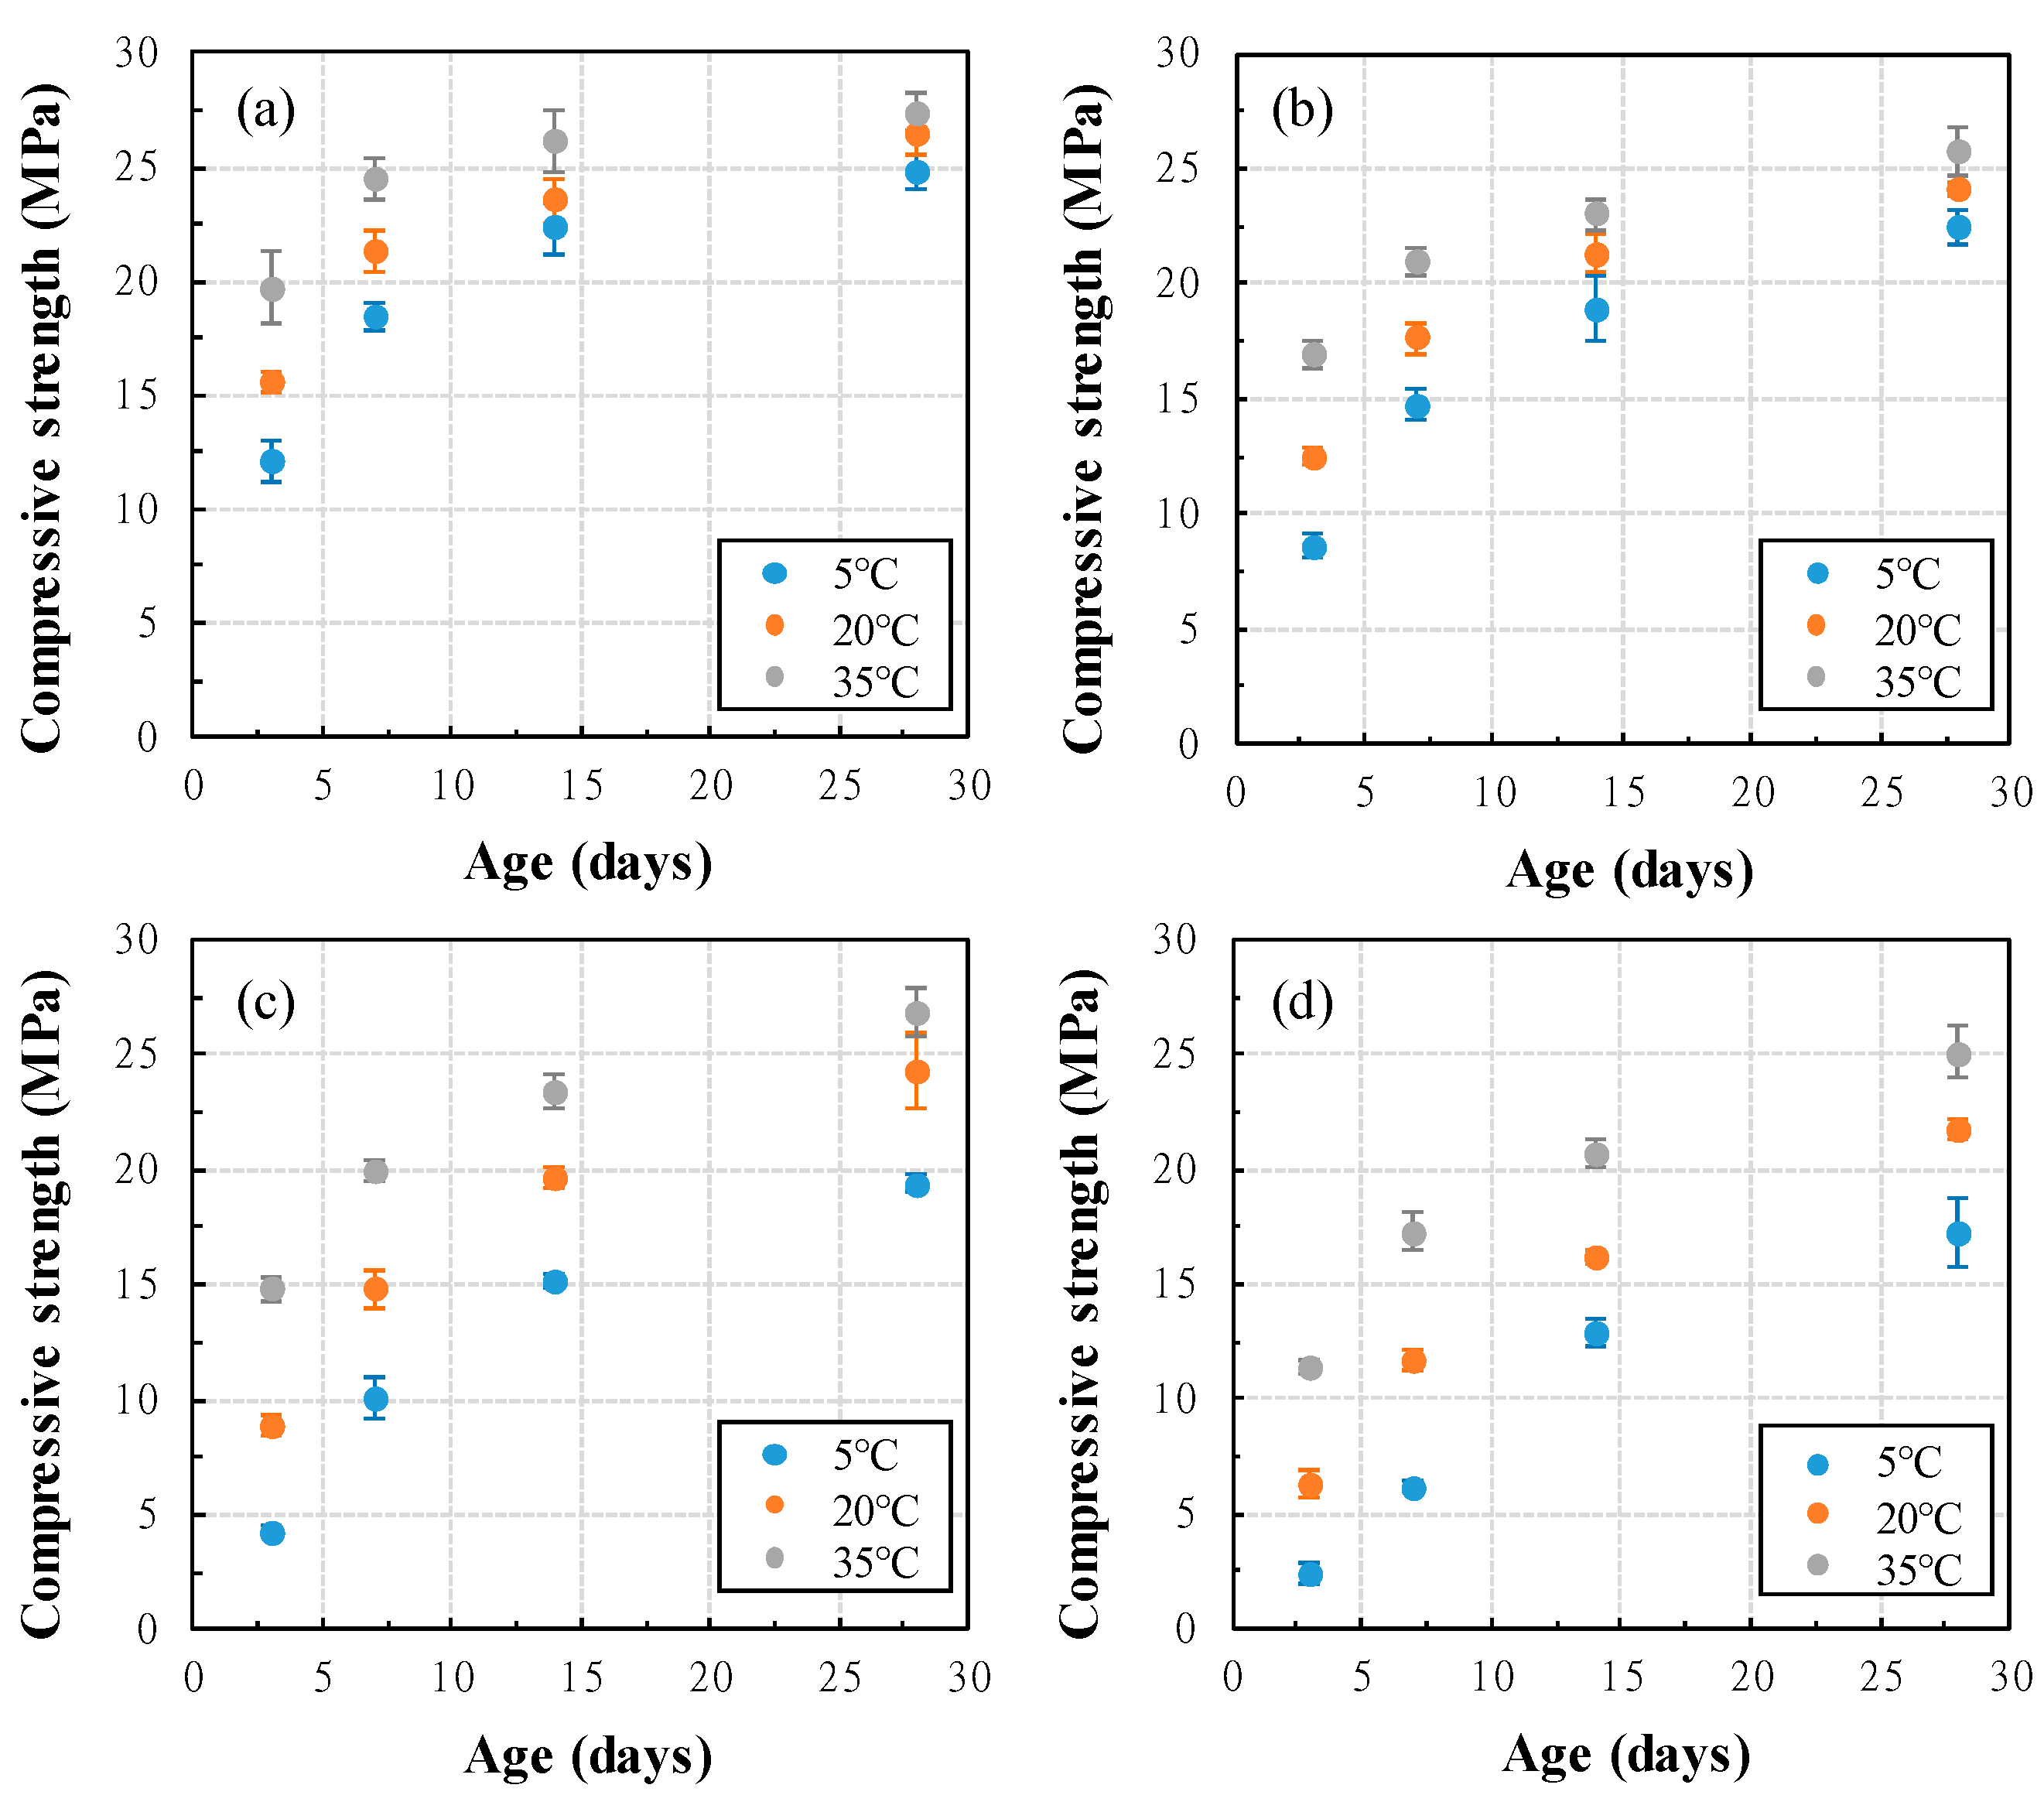
4.2. Compressive Strength of Mortars

The compressive strength of mortar with GGBFS replacement ratio at each curing temperature is shown in Figure 3. The compressive strength of mortar at an early age is found to be lowest with increasing GGBFS replacement ratio. However, with an increase in curing temperature, the compressive strength is increased. It is reported by Karim et al. that supplementary cementitious materials (SCM) in cement significantly modify the hydration kinetics and gives better performance at higher curing temperature [55]. However, the long term strength of blended cement mortar depends on curing temperature. Moreover, SCM can recover the strength once it cured in high temperature at longer duration. The early strength of higher GGBFS replacement mortar is lower, but it can be improved when it would cure at elevated temperature attributed to the quick cement hydration reaction. At 5 °C curing temperature, the compressive strength of 50% GGBFS mortar exceeded the compressive strength compared to 30% GGBFS after 39 days (Figure 3a). In addition, at 20 °C (Figure 3b) and 35 °C (Figure 3c) curing temperature, the compressive strength of 50% GGBFS mortar exceeded compare to OPC after 28 and 22 days, respectively. As the GGBFS replacement ratio increases, the crossover effect of compressive strength is delayed compared to OPC. However, the crossover effect of compressive strength decreases as the curing temperature increases. Therefore, depending on the replacement ratio of GGBFS, the hydration and degree of hydration of mortar are very sensitive to temperature.

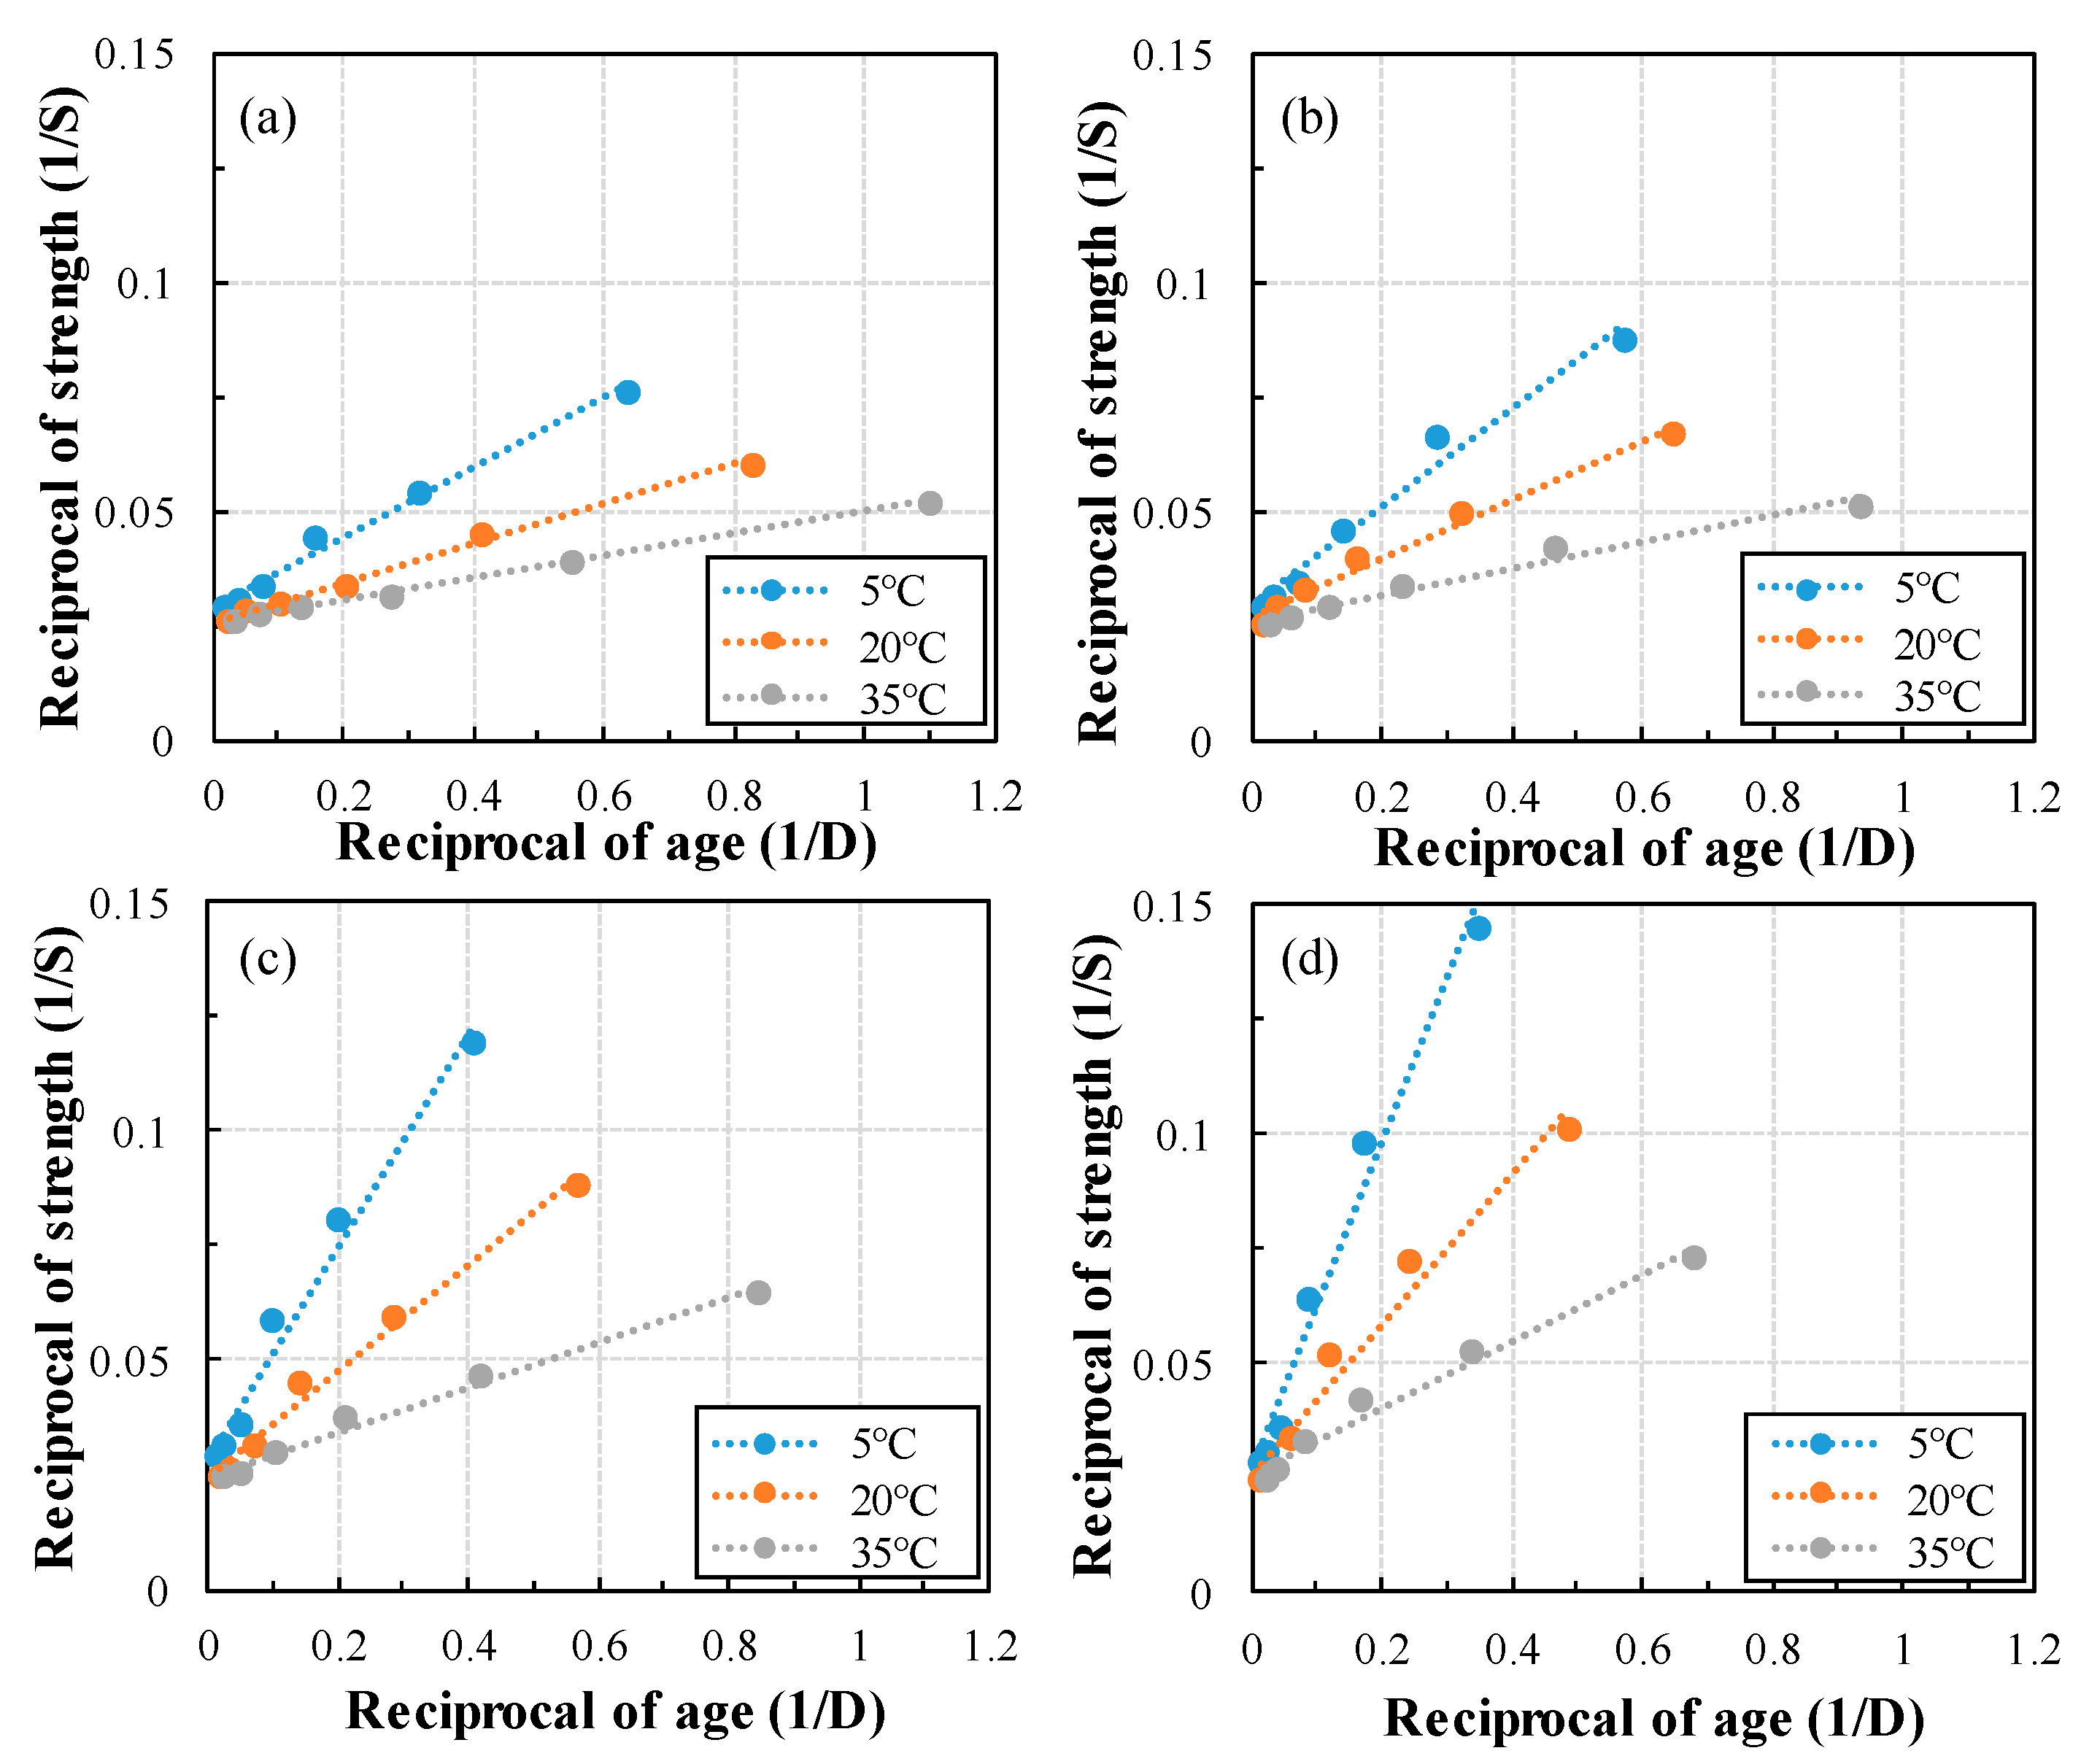
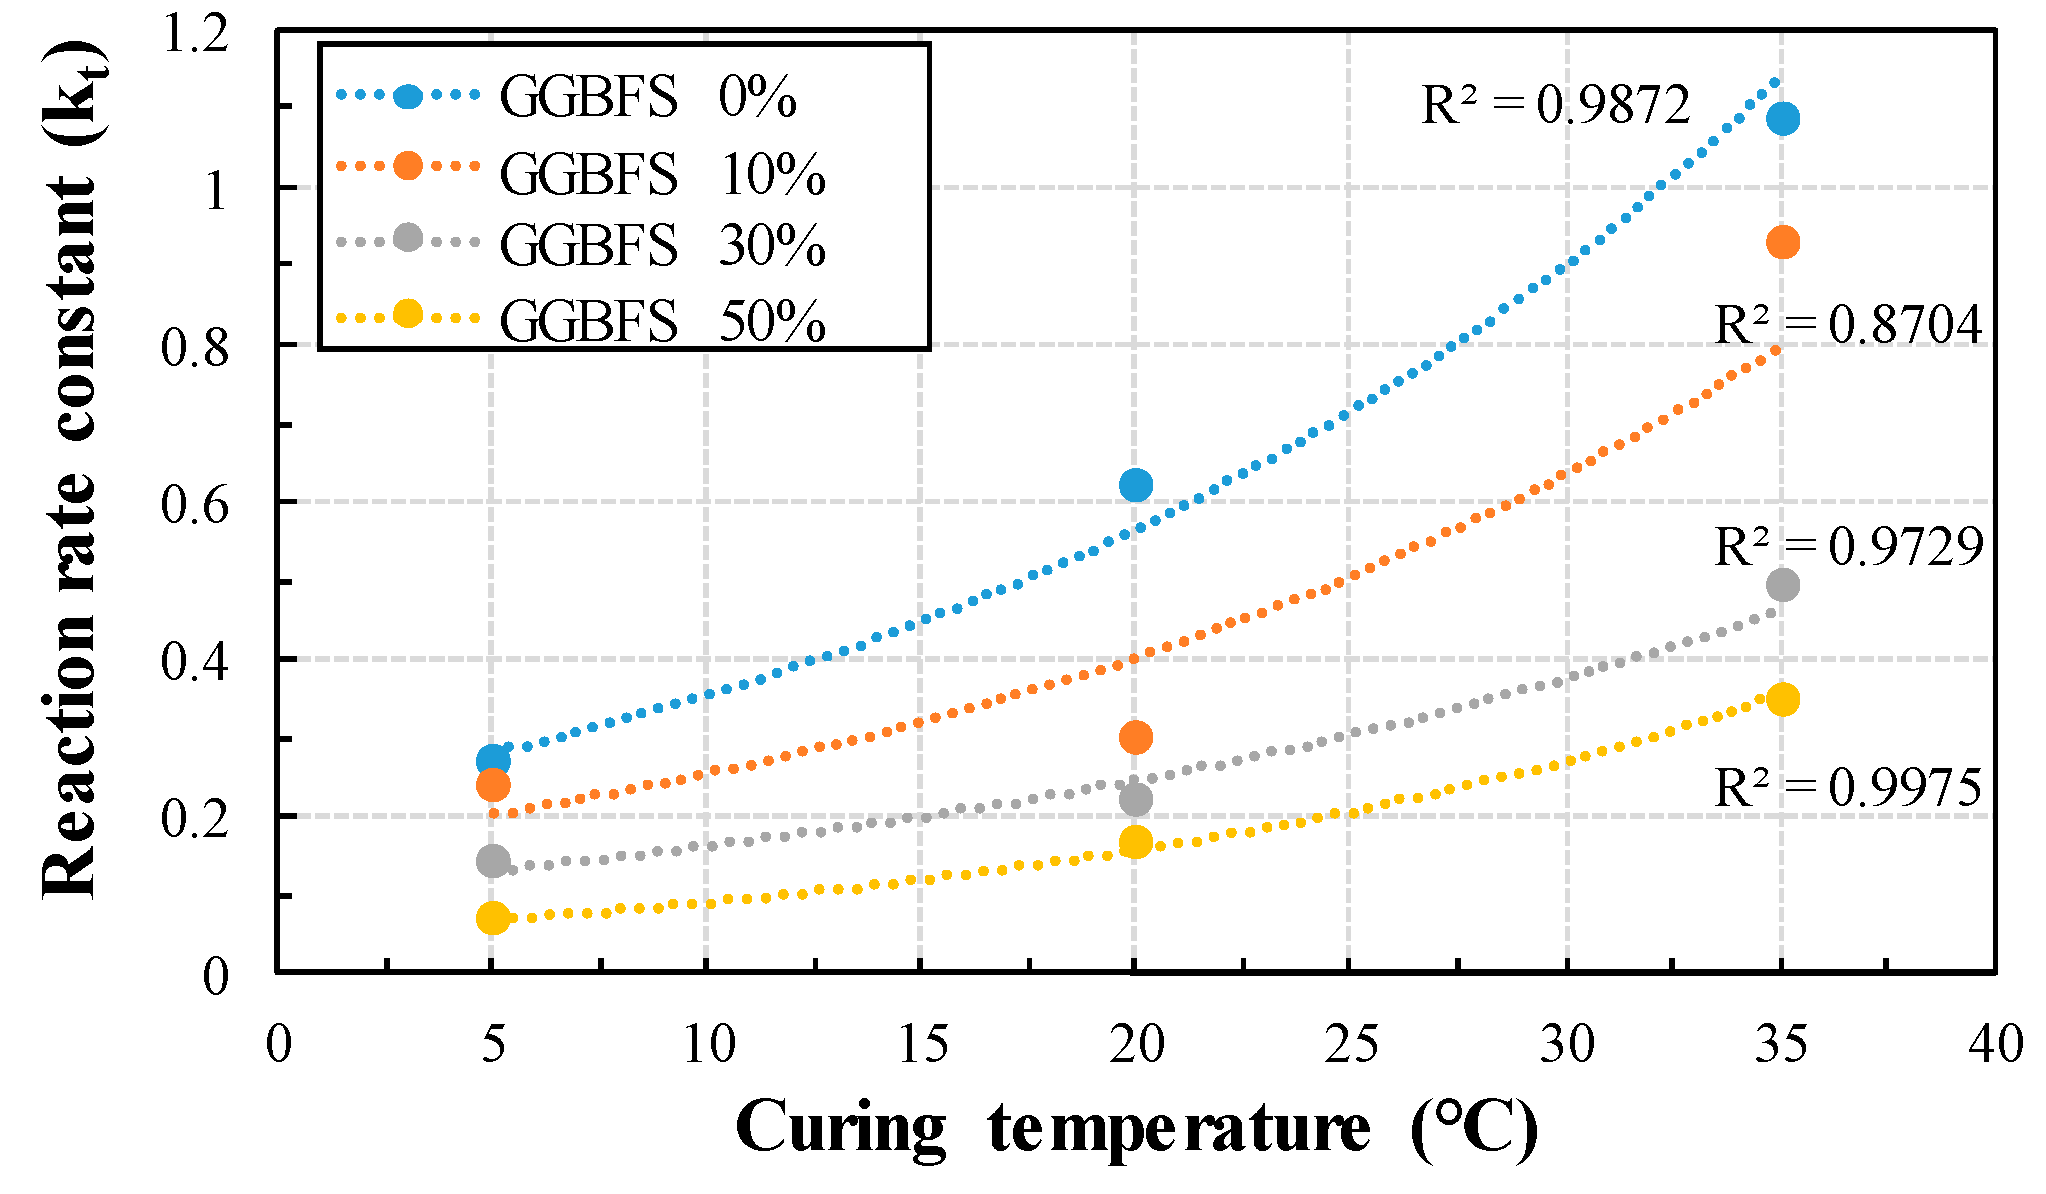
4.3. Calculation of Reaction Rate Constant (kT) and Apparent Activation Energy (Ea)

The relationship between age and compressive strength was analyzed, and kT was obtained according to the GGBFS replacement ratio. Figure 4 shows the reciprocal of compressive strength versus reciprocal age. By dividing the y-intercept of the linear regression line by the slope, we can derive the kT that takes the curing temperature and the replacement ratio as variables. Figure 5 shows kT according to the GGBFS replacement ratio at each curing temperature. As the curing temperature increased, the kT increased in the form of an exponential function and showed a high correlation between 0.87 and 0.99. In addition, the lower the GGBFS replacement ratio at the same curing temperature, the higher the kT. The kT of 50% GGBFS mortar is decreased by 75% and 70% at 5 °C and 35 °C curing temperature, respectively compared to OPC. In addition, the reaction rate constant of OPC and 50% GGBFS mortar is decreased by 76% and 81% at 5 °C compared to 35 °C curing temperature, respectively. Therefore, the curing temperature and GGBFS replacement ratio have a complex effect on the kT.
By taking the natural logarithm of the calculated kT and plotting the reciprocal of the curing temperature (K), we can represent the Arrhenius plot, as shown in Figure 6. The gradient of the linear regression line of each GGBFS replacement ratio represents Ea/R, and the y-intercept represents the value of ln(A). As the GGBFS replacement rate increases, the gradients of the linear regression line decreases to a negative value.
Figure 7 shows the Ea results of GGBFS replacement ratio. As the GGBFS replacement ratio increases, the Ea increases linearly, which considered as the result of an increase in the minimum energy for the chemical reaction of cement, GGBFS and water. For OPC mortar, Ea is estimated to be 33.475 kJ/mol, which is very similar to the proposed value of Freisleben-Hansen and Pederson, i.e., 33.5 kJ/mol [13]. Wirkin et al. have found that superplasticizer has a little role on the hydration kinetics of cement and the difference in Ea, with or without the superplasticizer, is insignificant, i.e., 3 kJ/mol [44]. In the present study, the Ea value of 10%, 30% and 50% GGBFS is found to be 37.325 kJ/mol, 41.958 kJ/mol and 45.541 kJ/mol, respectively.

4.4. Prediction of Compressive Strength of Concrete with GGBFS

4.4.1. Compressive Strength of Concretes

This study measured the compressive strength of concrete with GGBFS at the age of 3, 7, 14, and 28 days and used the average of compressive strength of three specimens as a result. The results of compressive strength with varying curing temperature and GGBFS replacement ratio are shown in Figure 8. At higher curing temperatures, the compressive strength increased, and as the GGBFS replacement ratio increased, the compressive strength decreased. In addition, the difference in compressive strength with the change of curing temperature is the largest at three days of age. As the GGBFS replacement ratio increased, the difference in compressive strength, due to curing temperature increased. Especially, 28 days of age, the difference in compressive strength of OPC concrete at curing temperature of 5 °C and 35 °C was about 2.6 MPa, and the difference in compressive strength of 50% GGBFS is about 7.9 MPa. At curing temperatures of 5 °C, the compressive strengths of OPC, 10%, 30% and 50% GGBGS at three days were 12.1 MPa, 8.6 MPa, 4.3 MPa and 2.4 MPa, respectively. By increasing the GGBFS replacement ratio at low curing temperature causes delayed development of compressive strength in early age. Therefore, GGBFS concretes have different compressive strengths than OPC concrete. Thus, accurate prediction is necessary.

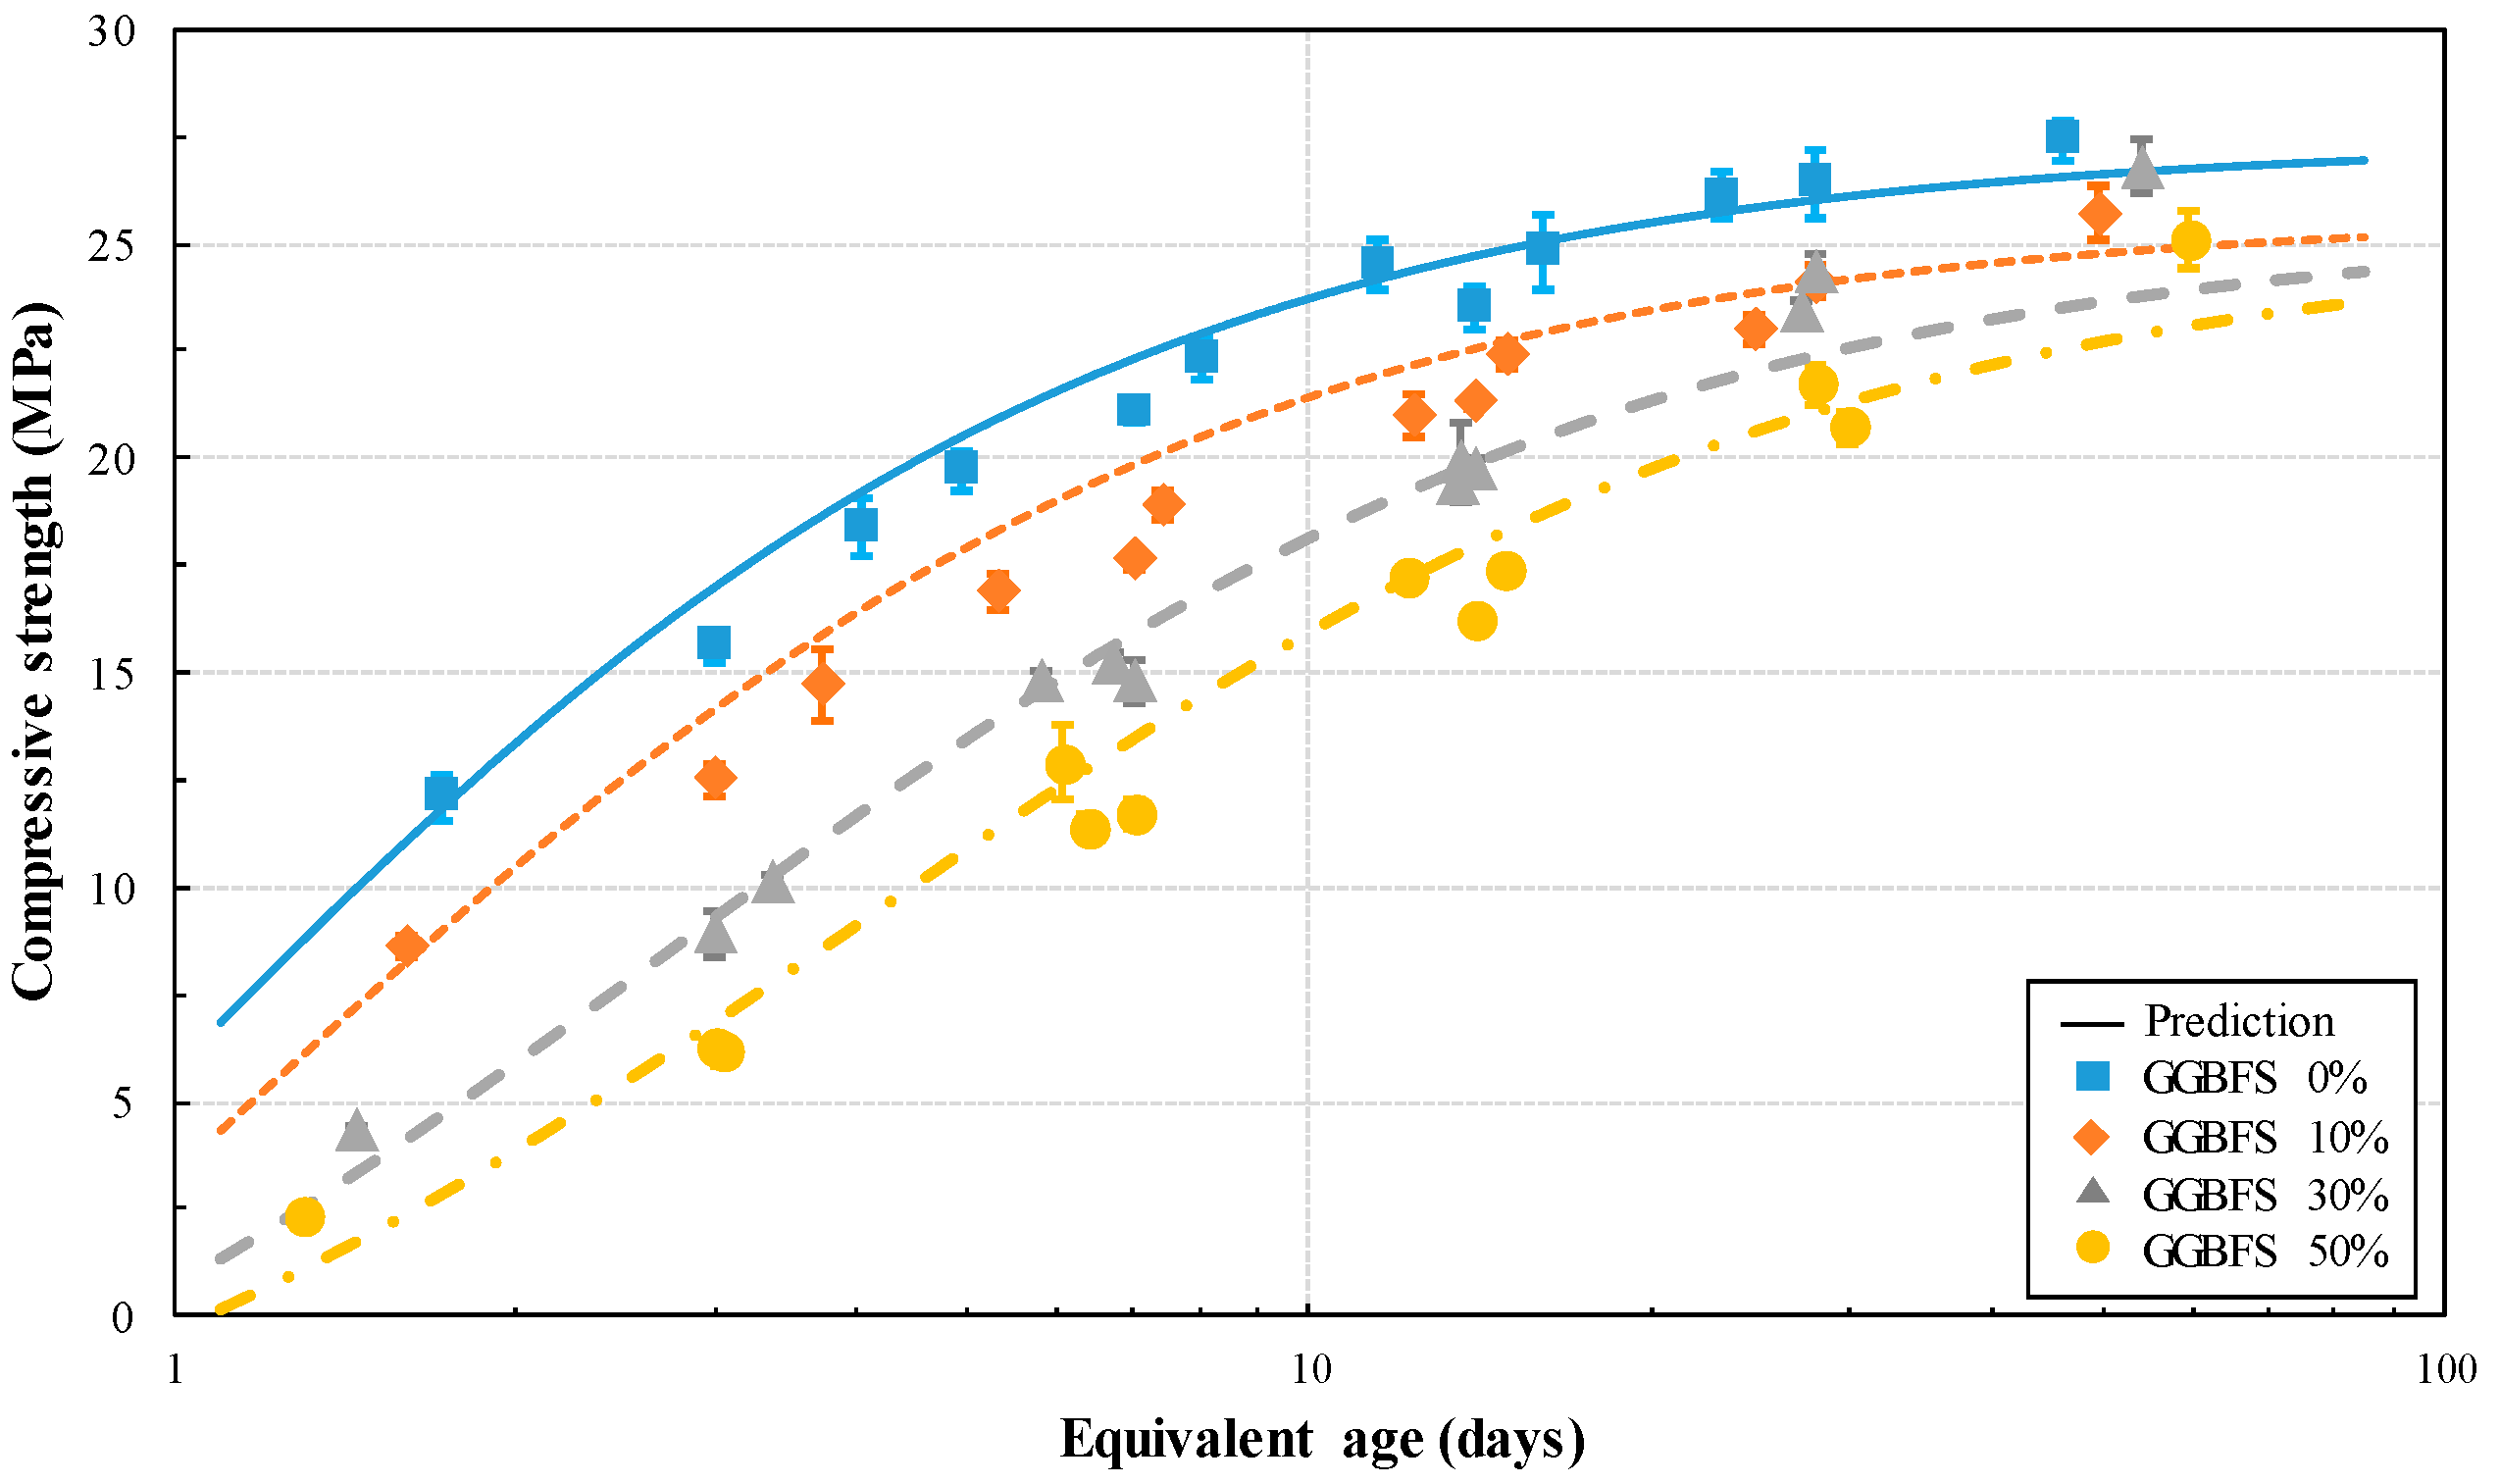
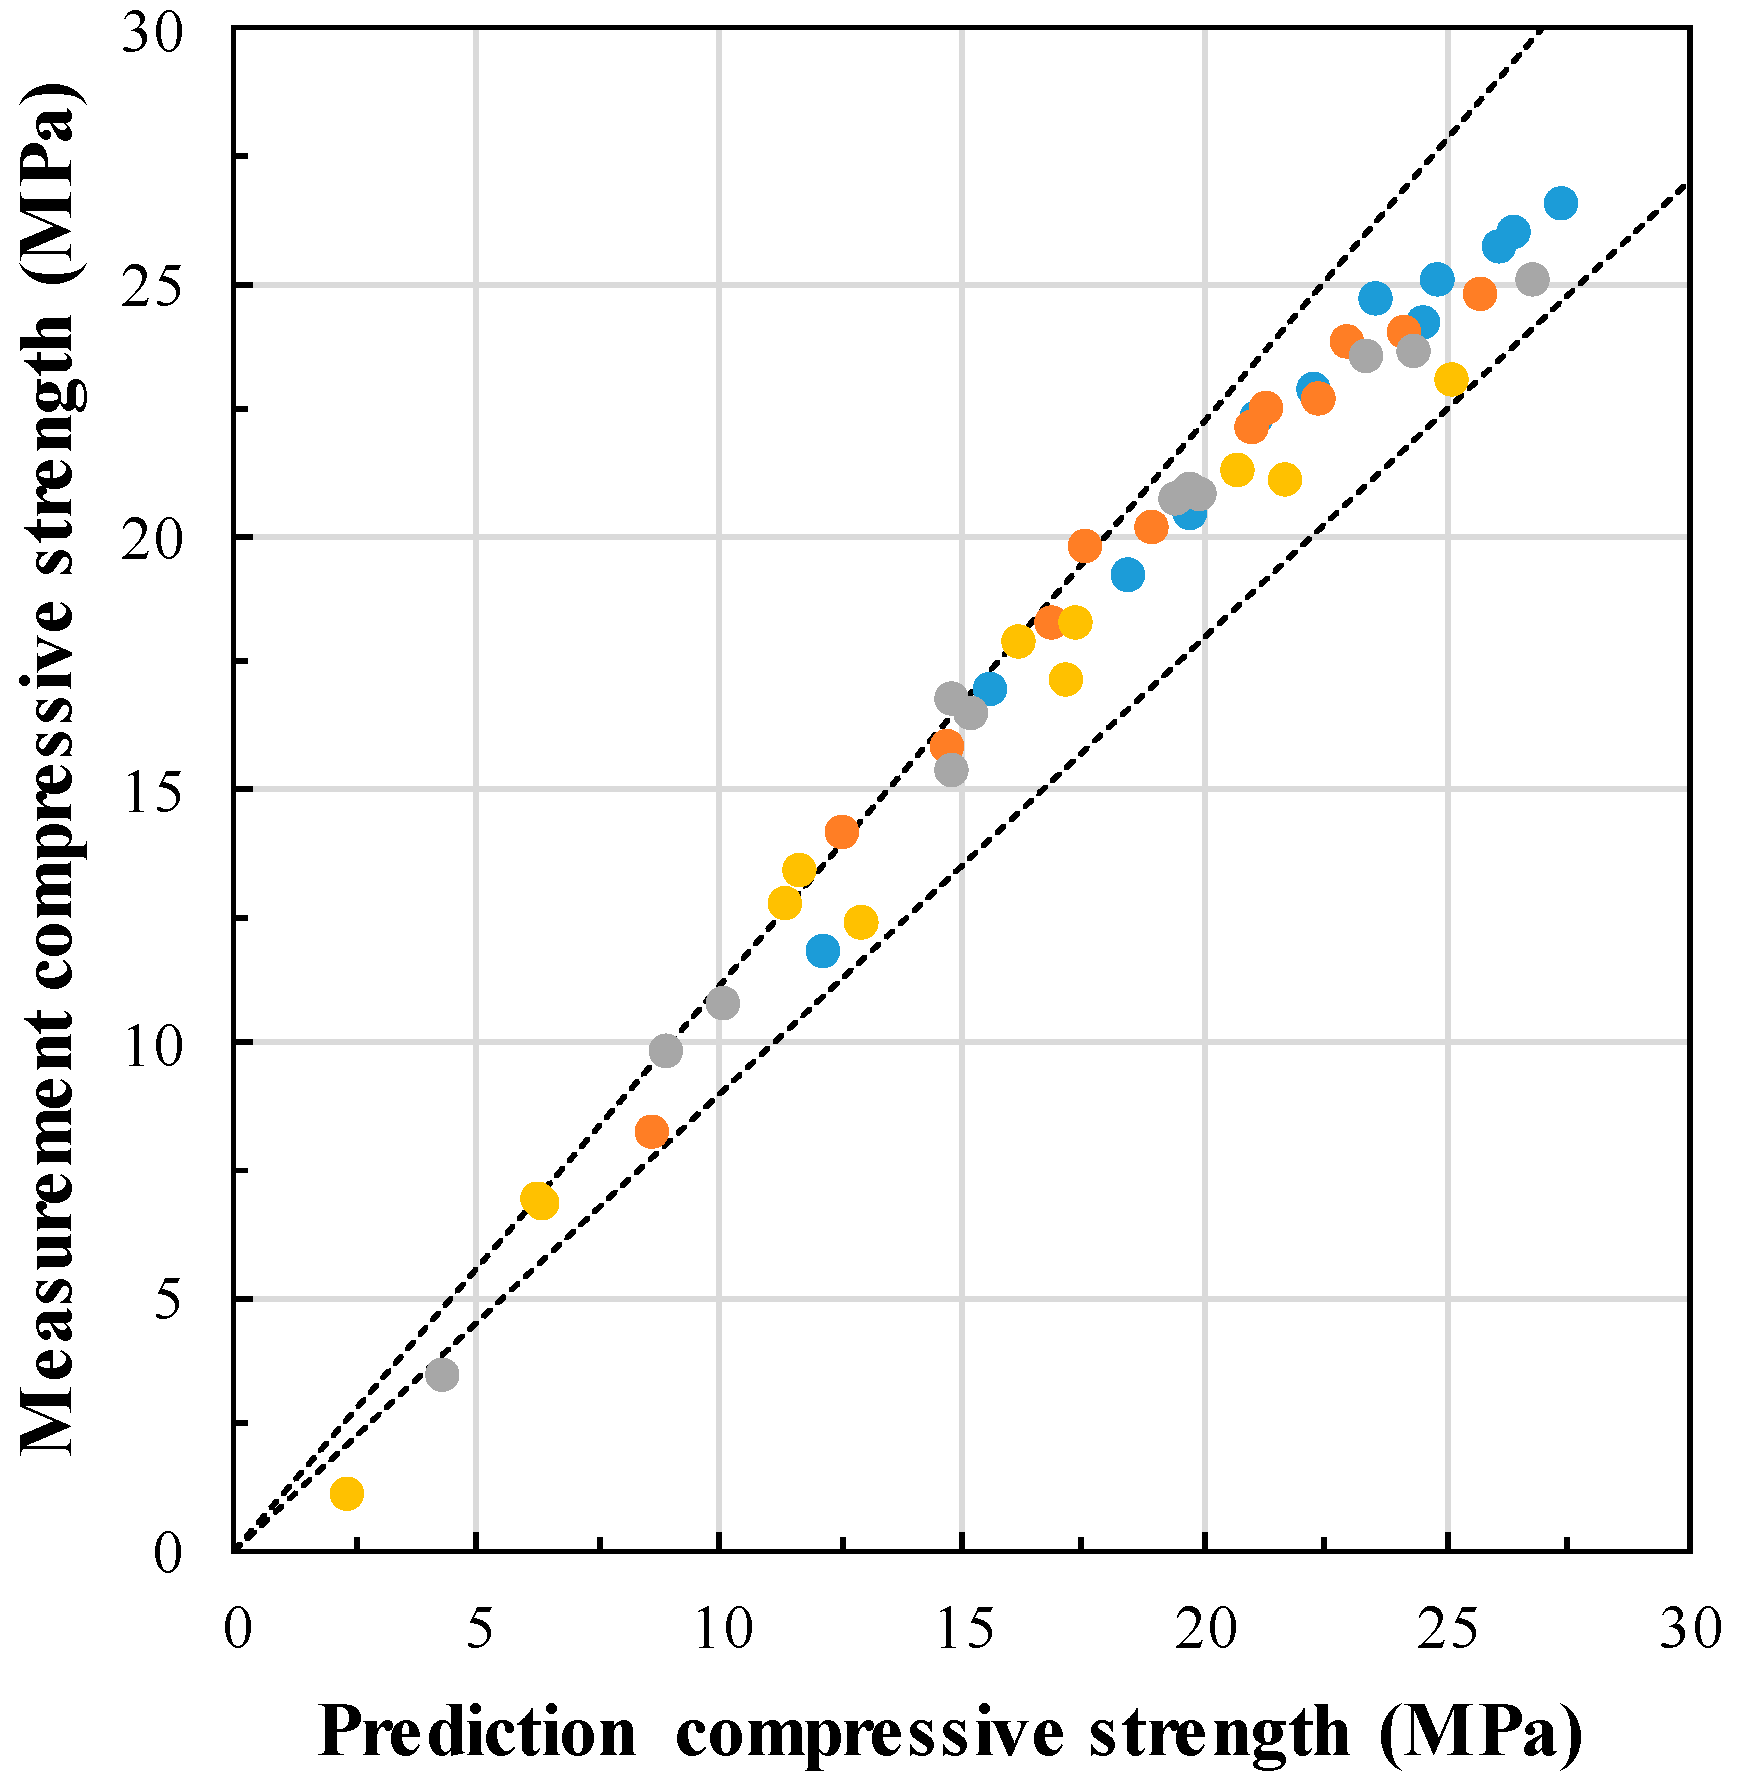
4.4.2. Prediction of Compressive Strength of Concrete with GGBFS

The maturity model applied in this study is the equivalent age model, as shown in Equation (5), and the equivalent age was derived using calculated Ea. The compressive strength prediction, according to the equivalent age by GGBFS replacement ratio, is shown in Figure 9. From this figure, it is found that the compressive strength at an early age is delayed as GGBFS replacement ratio increased. The compressive strength development prediction curve approximately overestimates the compressive strength, but similarly simulates the delayed expression of initial compressive strength, due to the increase of GGBFS replacement ratio. Figure 10 compares the predicted compressive strength with the measured compressive strength. The compressive strength is predicted similarly in all compressive strength regions. Thus, very high correlation (R2 = 0.91) is obtained. This proves that the compressive strength of concrete can be predicted in all strength at various curing temperatures and GGBFS replacement ratio.

5. Conclusions

From the above results and discussion, it is found that curing temperature and GGBFS replacement ratio have a significant effect on the development of concrete compressive strength. The addition of GGBFS also reduces the compressive strength of early age. As a result, the apparent activation energy and the compressive strength of concrete are affected by the GGBFS replacement ratio and curing temperature. Therefore, the existing compressive strength prediction model, i.e., Carino for OPC is not suitable for GGBFS concrete. The Ea of the proposed OPC, 10%, 30% and 50% of GGBFS are found to be 33.475 kJ/mol, 37.325 kJ/mol, 41.958 kJ/mol and 45.541 kJ/mol, respectively. Therefore, the equivalent age using Ea and a high level of accuracy (R2 = 0.91) is obtained.

Author Contributions

Data curation, H.-M.Y. and N.V.M.; Formal analysis, H.-M.Y. and S.-J.K.; Funding acquisition, H.-S.L.; Investigation, H.-M.Y., J.K.S. and S.M.; Methodology, H.-M.Y., H.-S.L.; Supervision, S.-J.K., N.V.M. and H.-S.L.; Writing—original draft, H.-M.Y., S.-J.K., N.V.M., J.K.S., H.-S.L. and S.M.; Writing—review and editing, H.-M.Y., S.-J.K., N.V.M., J.K.S., H.-S.L. and S.M. All authors have read and agreed to the published version of the manuscript.

Funding

There is no external funding for this work.

Acknowledgments

This research was supported by a basic science research program through the National Research Foundation (NRF) of Korea funded by the Ministry of Science, ICT and Future Planning (No. 2015R1A5A1037548).

Conflicts of Interest

The authors declare no conflict of interest.

References

  1. Lothenbach, B.; Scrivener, K.; Hooten, R.D. Supplementary cementitious materials. Cem. Concr. Res. 2011, 41, 1244–1256. [Google Scholar] [CrossRef]
  2. ACI Committee 233. Guide to the Use of Slag Cement in Concrete and Mortar; ACI 223 American Concrete Institute: Farmington Hills, MI, USA, 2017. [Google Scholar]
  3. Bijen, J. Blast Furnace Slag Cement for Durable Marine Structures; Stichting BetonPrisma: Den Bosch, The Netherlands, 1996; p. 62. [Google Scholar]
  4. Escalante, J.I.; Sharp, J.H. The microstructure and mechanical properties of blended cements hydrated at various temperatures. Cem. Concr. Res. 2001, 31, 695–702. [Google Scholar] [CrossRef]
  5. Escalante, J.I.; Gómez, L.Y.; Johal, K.K.; Mendoza, G.; Mancha, H.; Méndez, J. Reactivity of blast-furnace slag in portland cement blends hydrated under different conditions. Cem. Concr. Res. 2001, 31, 1403–1409. [Google Scholar] [CrossRef]
  6. Roy, D.M.; Idorn, G.M. Hydration, structure and properties of blast furnace slag cements. mortars and concrete. ACI J. 1982, 79, 444–457. [Google Scholar]
  7. Korde, C.; Cruickshank, M.; West, R.P.; Pellegrino, C. Activated slag as partial replacement of cement mortars: Effect of temperature and a novel admixture. Constr. Build. Mater. 2019, 216, 506–524. [Google Scholar] [CrossRef]
  8. Soutsos, M.; Hatzitheodorou, A.; Kwasny, J.; Kanavaris, F. Effect of in situ temperature on the early age strength development of concretes with supplementary cementitious materials. Constr. Build. Mater. 2019, 103, 105–116. [Google Scholar] [CrossRef] [Green Version]
  9. Mehta, P.K.; Monteiro, P. Concrete: Microstructure, Properties, and Materials, 4th ed.; McGraw-Hill Education: New York, NY, USA, 2014. [Google Scholar]
  10. Saul, A.G.A. Principles Underlying the Steam Curing of Concrete at Atmospheric Pressure. Mag. Concr. Res. 1951, 2, 127–140. [Google Scholar] [CrossRef]
  11. Nurse, R.W. Steam curing of concrete. Mag. Concr. Res. 1949, 1, 179–188. [Google Scholar] [CrossRef]
  12. Rastrup, E. Heat of Hydration in Concrete. Mag. Concr. Res. 1954, 6, 79–92. [Google Scholar] [CrossRef]
  13. Hansen, P.F.; Pedersen, E.J. Maturity Computer for Controlled Curing and Hardening of Concrete. Nord Betong 1977, 1, 21–25. [Google Scholar]
  14. Neville, A.M. Properties of Concrete; Addison Wesley Longman Limited Edinburgh Gate: Harlow, UK, 1996. [Google Scholar]
  15. Hansen, P.F.; Pedersen, E.J. Curing of concrete structure. CEB Bull. d’Inf. 1985, 166, 42. [Google Scholar]
  16. Xiong, X.; Breugel, K.V. Isothermal calorimetry study of blended cements and its application in numerical simulations. Heron. J. 2001, 46, 151–159. [Google Scholar]
  17. Schindler, A.K.; Folliard, K.J. Heat of hydration models for cementitious materials. ACI Mater. J. 2005, 102, 24–33. [Google Scholar]
  18. Poole, J.L. Modeling temperature Sensitivity and Heat Evolution of Concrete. Ph.D. Thesis, University of Texas, Austin, TX, USA, 2007. [Google Scholar]
  19. Mehdizadeh, H.; Kani, E.N. Rheology and apparent activation energy of alkali activated phosphorous slag. Constr. Build. Mater. 2018, 171, 197–204. [Google Scholar] [CrossRef]
  20. Carette, J.; Staquet, S. Monitoring and modelling the early age and hardening behaviour of eco-concrete through continuous non-destructive measurements: Part I. Hydration and apparent activation energy. Cem. Concr. Compos. 2016, 73, 10–18. [Google Scholar] [CrossRef]
  21. ASTM C1074-11. Standard Practice for Estimating Concrete Strength by the Maturity Method; ASTM International: West Conshohocken, PA, USA, 2011. [Google Scholar]
  22. Kolani, B.; Buffo, L.L.; Sellier, A.; Escadeillas, G.; Boutillon, L.; Linger, L. Hydration of slag-blended cements. Cem. Concr. Compos. 2012, 34, 1009–1018. [Google Scholar] [CrossRef]
  23. Sanjayan, J.G.; Sioulas, B. Strength of slag-cement concrete cured in place and in other conditions. ACI Mater. J. 2000, 97, 603–611. [Google Scholar]
  24. Tank, R.C.; Carino, N.J. Rate constant functions for strength development of concrete. ACI Mater. J. 1991, 88, 74–83. [Google Scholar]
  25. Carino, N.J. The maturity method: Theory and application. ASTM J. Cem. Concr. Aggreg. 1984, 6, 61–73. [Google Scholar]
  26. Carino, N.J.; Tank, R.C. Maturity functions for concrete made with various cements and admixtures. ACI Mater. J. 1992, 89, 188–196. [Google Scholar]
  27. Malhotra, V.M.; Carino, N.J. CRC Handbook on Nondestructive Testing of Concrete, 2nd ed.; CRC Press: Boca Raton, FL, USA, 2004. [Google Scholar]
  28. Soutsos, M.N.; Barnett, S.J.; Bungey, J.H.; Millard, S.G. Fast track construction with high strength concrete mixes containing ground granulated blast furnace slag. In Proceedings of ACI Seventh International Symposium on High Strength/High Performance Concrete, ACI SP-228; Russell, H.G., Ed.; American Concrete Institute: Farmington Hills, MI, USA, 2005; Volume 1, pp. 255–270. [Google Scholar]
  29. Wang, X.Y. Modeling of hydration, compressive strength, and carbonation of portland-limestone cement (PLC) concrete. Materials 2017, 10, 115. [Google Scholar] [CrossRef] [PubMed] [Green Version]
  30. Abdelrazig, B.E.I.; Bonner, D.G. Estimation of the degree of hydration in modified ordinary Portland cement pastes by differential scanning calorimetry Thermochim. Acta 1989, 145, 203–217. [Google Scholar]
  31. Lin, R.S.; Wang, X.Y.; Lee, H.S.; Cho, H.K. Hydration and microstructure of cement Pastes with Calcined Hwangtoh Clay. Materials 2019, 12, 458. [Google Scholar] [CrossRef] [PubMed] [Green Version]
  32. Narmluk, M.; Nawa, M.T. Effect of fly ash on the kinetics of Portland cement hydration at different curing temperatures. Cem. Concr. Res. 2011, 41, 579–589. [Google Scholar] [CrossRef] [Green Version]
  33. Pane, I.; Hansen, W. Investigation of blended cement hydration by isothermal calorimetry and thermal analysis. Cem. Concr. Res. 2005, 35, 1155–1164. [Google Scholar] [CrossRef]
  34. Krstulović, R.; Dabić, P. A conceptual model of the cement hydration process. Cem. Concr. Res. 2000, 30, 693–698. [Google Scholar] [CrossRef]
  35. Canut, M. Pore Structure in Blended Cement Pastes. Ph.D. Thesis, Technical University of Denmark, Kgs. Lyngby, Denmark, 2011. [Google Scholar]
  36. Beaudoin, J.J.; Gu, P.; Marchand, J.; Tamtsia, B.; Myers, R.E.; Liu, Z. Solvent replacement studies of hydrated Portland cement systems: The role of calcium hydroxide, advanced. Cem. Based Mater. 1998, 8, 56–65. [Google Scholar] [CrossRef]
  37. García, A.E.; Garcés, P.; Chinchón, S. General study of alkaline hydrolysis in calcium aluminate cement mortars under a broad range of experimental conditions. Cem. Concr. Res. 2000, 30, 1689–1699. [Google Scholar] [CrossRef]
  38. Cura, G.; Garcés, P.; Alcocel, E. Petrographical analysis of calcium aluminate cement mortars. Cem. Concr. Res. 1999, 29, 1881–1885. [Google Scholar] [CrossRef]
  39. Lachemi, M.; Hossain, K.M.A.; Anagnostopoulos, C.; Sabouni, A.R. Application of maturity method to slipforming operations: Performance validation. Cem. Concr. Comp. 2007, 29, 290–299. [Google Scholar] [CrossRef]
  40. Turcry, P.; Loukili, A.; Barcelo, L.; Casabonne, J.M. Can the maturity concept be used to separate the autogenous shrinkage and thermal deformation of a cement paste at early age. Cem. Concr. Res. 2002, 32, 1443–1450. [Google Scholar] [CrossRef] [Green Version]
  41. Garcia, A.; Castro-Fresno, D.; Polanco, J.A. Maturity approach applied to concrete by means of Vicat tests. ACI Mater. J. 2008, 105, 445–450. [Google Scholar]
  42. Barnett, S.J.; Soutsos, M.N.; Millard, S.G.; Bungey, J.H. Strength development of mortars containing ground granulated blast-furnace slag: Effect of curing temperature and determination of apparent activation energies. Cem. Concr. Res. 2006, 36, 434–440. [Google Scholar] [CrossRef]
  43. Voigt, T.; Sun, Z.; Shah, S.P. Comparison of ultrasonic wave reflection method and maturity method in evaluating early-age compressive strength of mortar. Cem. Concr. Comp. 2006, 28, 307–316. [Google Scholar] [CrossRef]
  44. Wirkin, E.; Broda, M.; Duthoit, B. Determination of the apparent activation energy of one concrete by calorimetric and mechanical means: Influence of a superplasticizer. Cem. Concr. Res. 2002, 32, 1207–1213. [Google Scholar] [CrossRef]
  45. Pinto, R.C.A.; Schindler, A.K. Unified modeling of setting and strength development. Cem. Concr. Res. 2010, 40, 58–65. [Google Scholar] [CrossRef]
  46. Saadoon, T.; Gomes-Meijide, B.; Garcia, A. New predictive methodology for the apparent activation energy and strength of conventional and rapid hardening concretes. Cem. Concr. Res. 2019, 115, 264–273. [Google Scholar] [CrossRef]
  47. Bie, Y.; Qiang, S.; Sun, X.; Song, J. A new formula to estimate final temperature rise of concrete considering ultimate hydration based on equivalent age. Constr. Build. Mater. 2017, 142, 514–520. [Google Scholar] [CrossRef]
  48. Li, Q.B.; Guan, J.F.; Wu, Z.M.; Dong, W.; Zhou, S.W. Equivalent maturity for ambient temperature effect on fracture parameters of site-casting dam concrete. Constr. Build. Mater. 2016, 120, 293–308. [Google Scholar] [CrossRef]
  49. Mi, Z.; Hu, Y.; Li, Q.; Gao, X.; Yin, T. Maturity model for fracture properties of concrete considering coupling effect of curing temperature and humidity. Constr. Build. Mater. 2019, 196, 1–13. [Google Scholar] [CrossRef]
  50. Standard Specification for Slag Cement for Use in Concrete and Mortars; ASTM C 989-18a; ASTM International: West Conshohocken, PA, USA, 2018.
  51. Standard Specification for Concrete Aggregates; ASTM C33; ASTM International: West Conshohocken, PA, USA, 2018.
  52. Standard Test Method for Time of Setting of Concrete Mixtures by Penetration Resistance; ASTM C403; ASTM International: West Conshohocken, PA, USA, 2016.
  53. Standard Test Method for Compressive Strength of Hydraulic Cement Mortars (Using 2-in. or [50-mm] Cube Specimens); ASTM C109; ASTM International: West Conshohocken, PA, USA, 2016.
  54. Standard Test Method for Compressive Strength of Cylindrical Concrete Specimens; ASTM C39; ASTM International: West Conshohocken, PA, USA, 2018.
  55. Karim, E.; El, H.K.; Abdelkader, B.; Rachid, B. Analysis of Mortar Long-Term Strength with Supplementary Cementitious Materials Cured at Different Temperatures. ACI Mater. J. 2010, 107, 323–331. [Google Scholar]
Figure 1. Calculation of Ea and estimation of compressive strength of concrete according to ASTM C 1074.
Materials 13 00442 g001
Figure 2. Setting time of mortar, according to curing temperature and replacement ratio of GGBFS.
Materials 13 00442 g002
Figure 3. Compressive strength of mortar, according to curing temperature and replacement ratio of GGBFS (a) 5 °C, (b) 20 °C, (c) 35 °C.
Materials 13 00442 g003
Figure 4. Regression analysis results for calculating kT (a) 0%, (b) 10%, (c) 30%, (d) 50%.
Materials 13 00442 g004
Figure 5. The effect of temperature on the rate constant with GGBFS replacement ratio.
Materials 13 00442 g005
Figure 6. Arrhenius plot of ASTM C 1074 for calculating Ea.
Materials 13 00442 g006
Figure 7. Apparent activation energy according to the GGBFS replacement ratio.
Materials 13 00442 g007
Figure 8. Compressive strength of concrete with curing temperature and GGBFS replacement ratio (a) 0%, (b) 10%, (c) 30%, (d) 50%.
Materials 13 00442 g008
Figure 9. Prediction of compressive strength in concrete using GGBFS based on equivalent age.
Materials 13 00442 g009
Figure 10. Comparison between predicted compressive strength and Measurement compressive strength.
Materials 13 00442 g010
Table 1. The experimental variables.
Experimental LevelItems
W/B0.60
Replacement ratio of BFS (%)0, 10, 30, 50
Curing temperature (°C)5, 20, 35
Fresh mortarsetting time (initial and final)
Hardened mortarcompressive strength
(2, 4, 8, 16, 32, 64 times of final setting time)
Hardened concretecompressive strength (3, 7, 14, 28 days)
Table 2. Chemical analysis of materials. GGBFS, ground granulated blast furnace slag.
ComponentPortland Cement %GGBFS %
SiO221.0735.35
Al2O35.0014
Fe2O32.920.36
CaO62.4041.91
MgO2.077.74
SO32.340.1
K2O0.59
Na2O0.26
LOI1.190.31
Insoluble0.410.21
Cl0.050.02
Free Lime1.70
Total (%)100100
Table 3. Concrete mixture proportions.
W/BGGBFS (%)S/a (%)Mix Composition (kg/m3)
W *GGBFSC *S *G *SP *
0.60046217.203627989121.156
1036.2325.87949100.976
30108.6253.47929080.659
501811817909060.481
* W = water, C = cement, S = sand, G = coarse aggregates, and SP = Superplasticizer.

