Photocatalytic and Pozzolanic Properties of Nano-SiO2/Al2O3-TiO2 Powder for Functional Mortar


1
Department of Convergence Systems Engineering, Chungnam National University, 99 Daehak-ro Yuseong-gu, Daejeon 34134, Korea
2
Department of Construction Engineering Education, Chungnam National University, 99 Daehak-ro Yuseong-gu, Daejeon 34134, Korea
3
Department of Civil Engineering, Daejeon University, 62 Daehak-ro Dong-gu, Daejeon 34520, Korea
*
Author to whom correspondence should be addressed.
Materials 2019, 12(7), 1037; https://doi.org/10.3390/ma12071037
Submission received: 24 January 2019
/
Revised: 22 March 2019
/
Accepted: 23 March 2019
/
Published: 28 March 2019
(This article belongs to the Section Construction and Building Materials)
Abstract
:The present study intended to find a way to use TiO2, one of the most widely used photocatalysts, as a construction material. To that end, nano-SiO2/Al2O3-TiO2 powder (NTCP) was synthesized by coating SiO2 and Al2O3 support materials with TiO2. The NTCP was anatase phase spherical particles, specific surface areas were 319 m2/g and 267 m2/g for the SiO2-TiO2 powder and Al2O3-TiO2 powder. UV absorption test results showed the developed NTCP had a light absorption peak at wavelengths of 380 nm or below, and its absorbance was much larger than that of commercial TiO2. The NTCP formed smaller pores on the surface than commercial TiO2. As a result, the flow of the mortar decreased as the adsorption strength increased and combined a large number of water molecules. In addition, the Pozzolanic reaction by SiO2 and Al2O3 used as support materials produced many calcium silicate hydrate (C-S-H) and calcium aluminate hydrate (C-A-H). This has shown an increased strength of mortar mixed with the NTCP by promoting a nucleation effect and reducing the filling effect and the number of harmful holes in the mortar.
1. Introduction
With rapid industrial development, the air pollution caused by factories fumes, SOx, exhaust emissions, and fine dust has been continuously increasing. Accordingly, environmental problems such as global warming have recently emerged as global issues of concern [1,2]. Vehicles are on-road mobile pollution sources, while industrial boilers and power generation facilities are major stationary pollution sources. Notably, NOx, a harmful air pollutant, comes from both pollution source types. Currently, NOx pollution produced by motor vehicle emissions have reached alarming levels in major cities, causing respiratory disease, photochemical smog, and acid rain [3]. Accordingly, there is increasing social demand for measures to reduce air pollution, and in particular, pollution caused by NOx including NO and NO2 from on-road mobile sources.
Measures for reducing NOx air pollution include the purification and detoxification of NOx via photocatalytic reactions. The method is based on the principle that a photocatalyst, while reacting with sunlight, tends to absorb air pollutants such as NOx and organic chlorine compounds [4,5,6,7].
The photocatalyst used for that purpose must have excellent optical activity, high absorbance of visible light and ultraviolet light, an optimal energy range suitable for reactions, biological and chemical inertness, optical stability, low cost, and more. Among all other candidates, TiO2 is known to be the most effective. TiO2 is superior to other photocatalysts, in particular, its chemical stability, and is not eroded by most acids, bases, or organic solvents. Due to these features, it is widely used in construction [8,9,10,11,12].
In the construction field, researchers have attempted to find methods of applying photo catalysts to self-cleaning structures, and to develop photocatalytic concrete for road pavement construction and paving blocks to reduce on-road mobile pollution caused by cars [13,14,15,16]. Since the mid-2000s, researchers mainly from Japan, Italy, Belgium, the US, and China have been engaged in research and development of concrete pavement construction and self-cleaning technologies using photocatalytic materials such as TiO2 [17,18]. When concrete pavement using TiO2 is illuminated by sunlight, the TiO2 on the surface reacts with the light and decomposes NOx into NO3− via photocatalytic reactions. Subsequently, the byproducts are washed away when it rains in HNO3 aqueous solution form. As a result, the concentration of NOx in the atmosphere is reduced. Additionally, NO3 can be eliminated when it reaches a groundwater basin via biological denitrifying oxidation. The method is likewise based on complex reaction mechanisms [19,20].
Based on these principles, mortar and concrete mixed with TiO2 are widely used for self-cleaning, deodorization, and air purification purposes, e.g., in road pavement, and in buildings, stadiums, and theaters as precast exterior materials. In the civil sector, road pavement and paving blocks which serve as public infrastructure have a higher ratio of surface area to volume than most other structures and, hence, they have an advantage in that they can maximize photocatalytic efficiency [3].
In the above cases where TiO2 was applied to structures, the construction was conducted using cement, part of which was replaced with TiO2. This partial replacement method, however, consumes a greater quantity of TiO2, and hinders the hydration reaction of cement, thus degrading the concrete’s strength [21]. Also, the TiO2 inside the concrete is never exposed to light sources or exhaust gases, so it is unable to trigger a photocatalytic reaction [22,23].
To overcome these problems, there has been extensive research on the use of new composite materials. Han et al. [24] coated nano-TiO2 with SiO2, and, as a result, the SiO2-coated nano-TiO2 exhibited improved dispersibility in water and a binder due to increased negative charges. The researchers applied the material to a designed mix of reactive powder concrete (RPC) to improve its mechanical properties. However, they focused more on strength enhancement by the filler effect than on the functionality of the TiO2. In contrast, Kummaruddin and Stephan [25] conducted research on the photocatalytic activity of sand and silica fume coated with TiO2 via the sol-gel process. They reported that the developed TiO2 coated sand and silica fume efficiently decomposed NOx and, thus, could be used as a photocatalytic material for the external walls of air purifying buildings.
Likewise, previous research [26,27,28,29,30] has focused on either exploring the photocatalytic characteristics of commercial TiO2 or improving the mechanical properties of concrete, but not in parallel. Unfortunately, little attention has been paid to the development of TiO2 materials that can serve as more effective photocatalysts when mixed into mortar without significantly degrading the strength of mortar and concrete.
This study is a basic step to develop functional mortar that can purify air pollution using TiO2, so in order to develop functional TiO2, we fabricated Nano-SiO2/Al2O3-TiO2 powder (NTCP) coated with TiO2 by using SiO2 and Al2O3 as supports and evaluated the performance. In addition, we fabricated mortar which can be applied to the shotcrete and surface of concrete secondary products with the NTCP, and analyzed the reaction to cement and the mechanical performance.
2. Materials and Methods
2.1. Materials
2.1.1. Nano-SiO2/Al2O3-TiO2 Powder (NTCP)
This study aims at finding optimal coating conditions by analyzing the efficiency and characteristics of surface coating methods through depositions, such as chemical vapor deposition (CVD), sol-gel, and atomic layer deposition (ALD), to derive the optimal coating method for producing NTCP. Results of the test showed that the Sol-gel method could maintain uniform status compared to CVD and ALD, and there were no deformations, making it possible to obtain highly pure and highly homogenous powders. It was also found that sol-gel method is the most superior in terms of economic feasibility when utilizing it as construction materials in future.
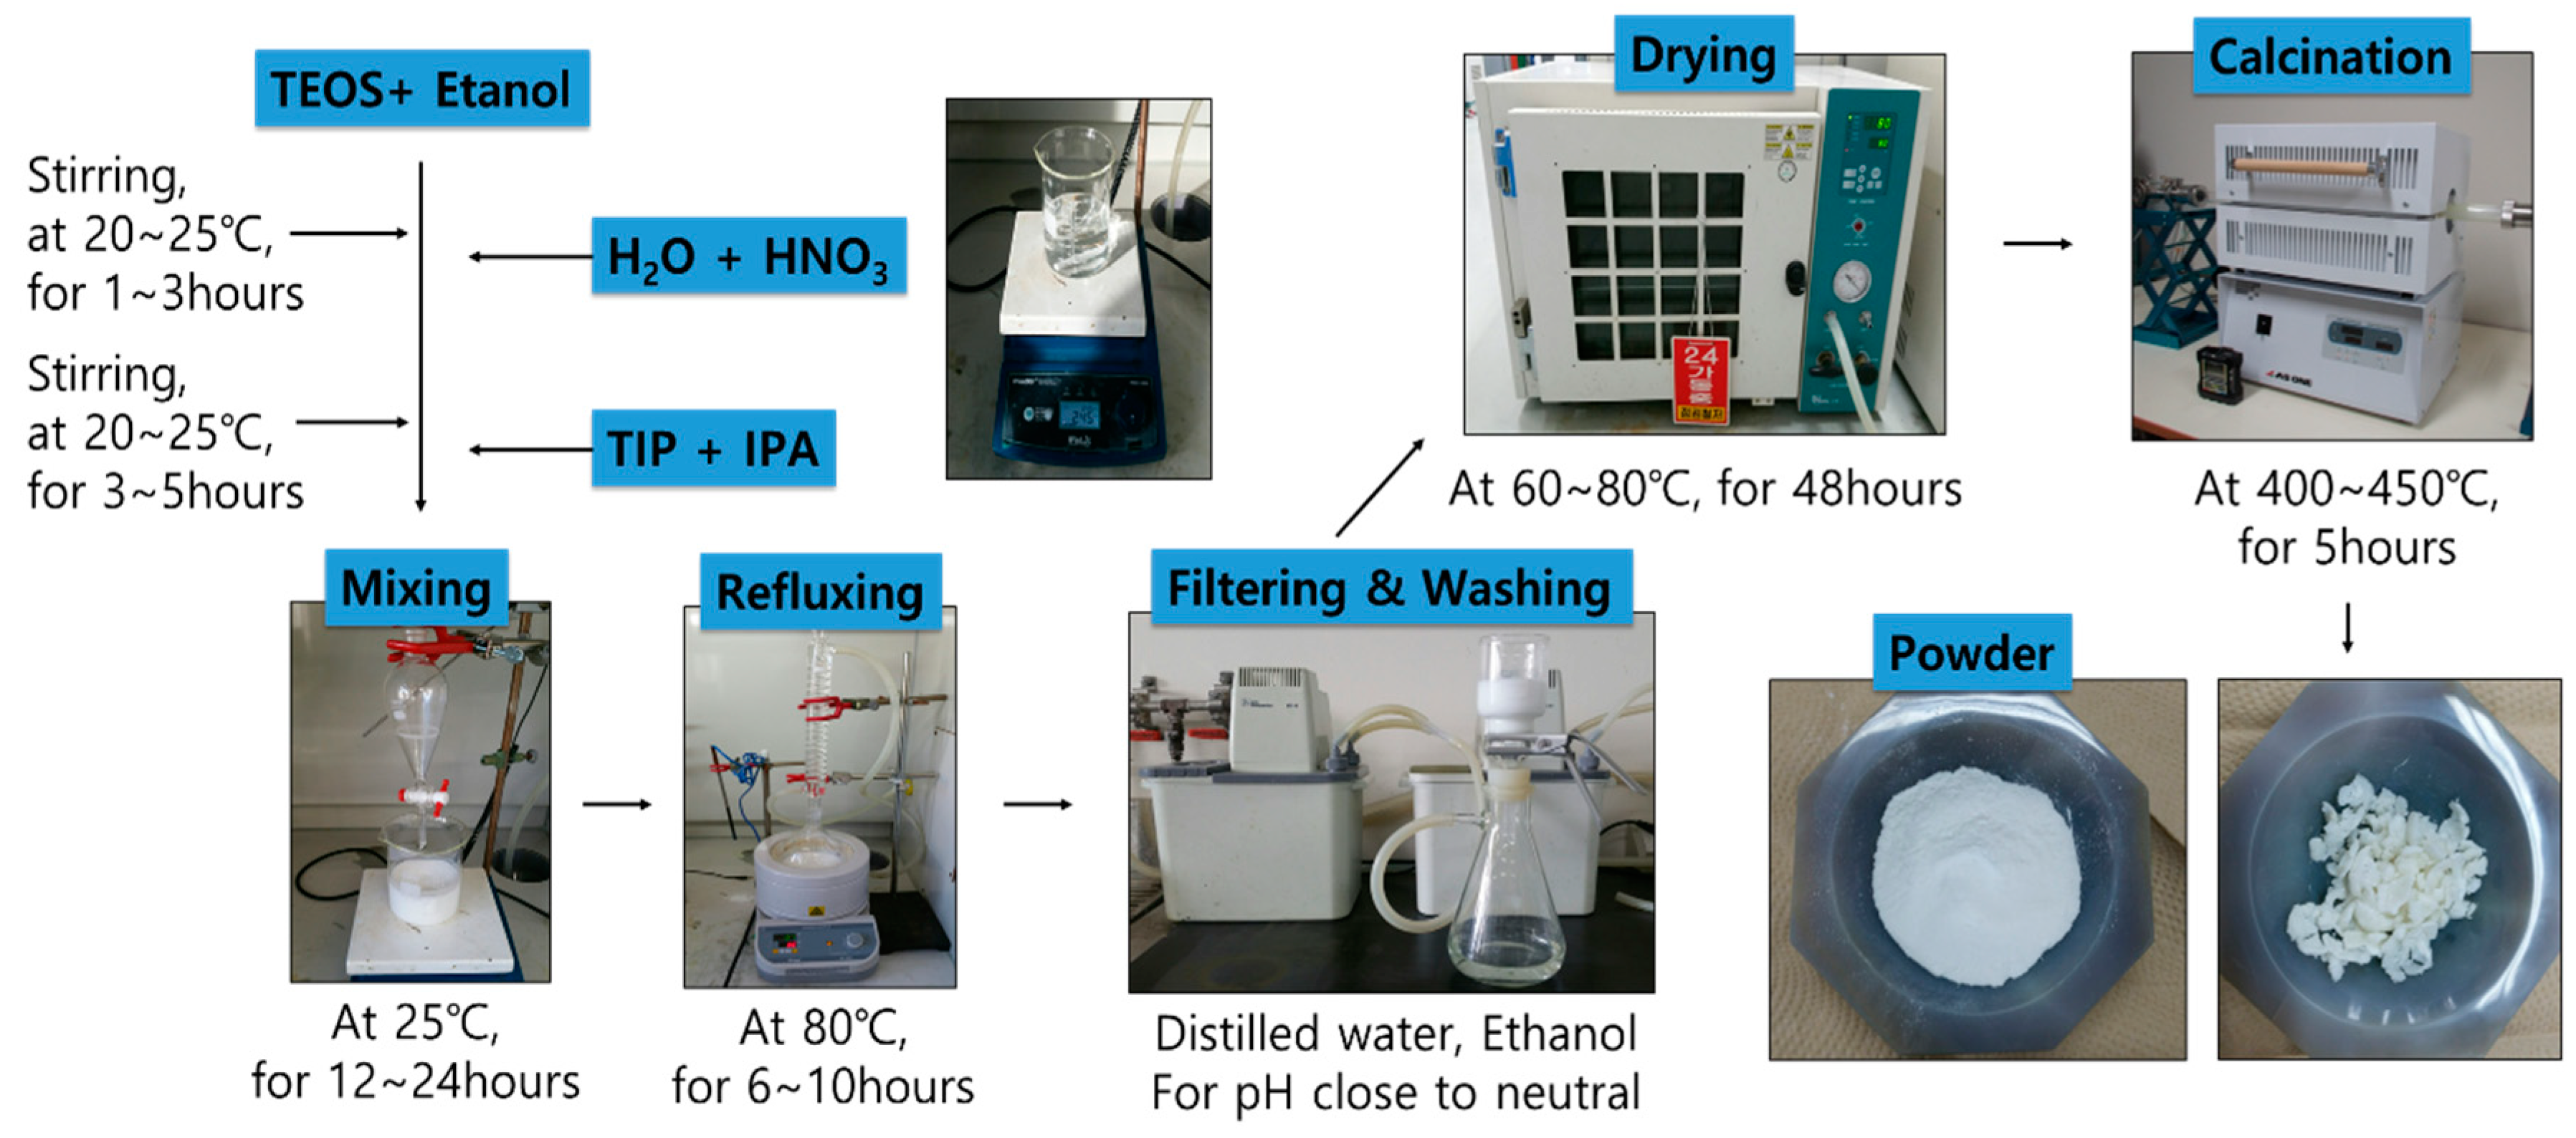
NTCP was developed via the sol-gel method using TTIP (Titanium isoproxide; Ti(OC3H7)4) as a precursor for TiO2, and TEOS (tetraethy-lorthosilicate; Si(OC2H5)4) and ALP (aluminum isopropoxide; Al(OCH2(CH3)2)3) as the precursors for SiO2 and Al2O3, respectively. Nitric acid and acetic acid were used as catalysts, and ethanol and iso-propanol were used as solvents. To determine the specific surface area of the NTCP that would be suitable for construction applications, various mix designs were developed, as shown in Table 1. The developed NTCP were heat treated at temperatures ranging from 400 to 800 °C for crystallographic analysis. Reagents used in testing are listed in Table 2. Figure 1 describes the synthesis method for the Nano-SiO2-TiO2 powder used in the present study.
2.1.2. Commercial TiO2
The commercial TiO2 used as the comparative of the NTCP prepared in this study is the nano-TiO2 of P company. The physical and chemical properties of the commercial TiO2 used are presented in Table 3.
2.1.3. Cement
The cement used for this study is Ordinary Portland Cement (OPC) which has density is 3.14 g/cm3, Blaine fineness is 3492 cm2/g. The physical and chemical properties of OPC are as shown in Table 4.
2.1.4. ISO Graded Standard Sand
The sand was rounded particles and content of silicon dioxide was 98% or more, and the particle size was in accordance with the specification of KS L ISO 679 Methods of testing cements-Determination of Strength. The particle size distribution of ISO graded standard sand are as shown in Table 5.
2.2. Experiment Method of NTCP
2.2.1. BET
The Brunauer–Emmett–Teller (BET) method was used to determine the specific surface area, presence and size of pores, and the pore volume of a given specimen. Specific surface area is one of the most important factors determining photocatalytic efficiency. To assess the effect of the SiO2 and Al2O3 addition on the specific surface area of a given specimen, the specific surface area was measured for both a commercial TiO2 specimen and the nano-TiO2 developed in the present study. BET surface analysis was performed using the Micrometrics ASAP 2010 system (Micrometrics, Norcross, GA, USA) in which specimens were heat treated at 200 °C for 4 h, and nitrogen absorbance was measured for the specimens at −196 °C.
2.2.2. XRD
Generally, TiO2 produced via the sol-gel method tends to be amorphous, but when it is heat treated, a phase transition occurs from amorphous to anatase and rutile phases. X-ray powder diffraction (XRD) analysis was conducted to confirm the occurrence of such phase transitions and their effect on phase transitions of the SiO2 and Al2O3.
The X-ray diffraction analysis was conducted using D8 Advance diffractometer (Bruker-AXS, Shibuya, Tokyo, Japan) attached with a Lynx Eye position sensitive detector and Cu target. The diffraction pattern was obtained in the conditions of 5° to 95° 2θ sectors, 0.01° step size, and 1 sec per step, and 0.3° divergence slit and 2.5° secondary Soller slit were used. In order to obtain qualitative analysis of specimens and fundamental parameters for device elements, X-ray diffraction patterns were obtained for the original specimen and standard specimen (LaB6, SRM 660b, NIST, Gaithersburg, MD, USA) under the same conditions.
2.2.3. SEM
Morphology of the NTCP was examined using a scanning electron microscope (SEM, Akishima, Tokyo, Japan) with voltages between 10–30 kV and a secondary electron detector. In combination, an energy dispersive X-ray spectroscope (EDS, Akishima, Tokyo, Japan) was used to obtain the elemental composition of the particle surface.
2.2.4. TEM
The morphology of NTCP was assessed by transmission (TEM) electron microscopy, coupled with for these analyses a Quanta Inspect F scanning electron microscope (1.2 nm resolution, Hillsboro, OR, USA) with EDX and a Tecnai TM G2 F30 S-TWIN high-resolution transmission electron microscope (HR-TEM, Hillsboro, OR, USA) equipped with STEM—HAADF detector (Hillsboro, OR, USA), EDX, and EELS were used.
2.2.5. UV-Vis
UV–VIS analysis was employed to evaluate the absorption rate of the developed NTCP in visible light, using a UV–VIS Spectrophotometer Solid Spec S-3100 of SCINCO (Gangnam, Seoul, Korea). The absorbance of the visible light photocatalysts was measured at wavelength ranges between 300 and 700 nm.
2.3. Mix Proportion and Preparation of Mortar Test Specimens
2.3.1. Mix Proportion
The mortar mix proportion had a binder to sand ratio of 1:3 and W/B = 50% in accordance with International Organization for Standardization (ISO) 679 Methods of testing cements determination of strength. To analyze the effect of NTCP on the hydration reaction of concrete, the amount of added NTCP was adjusted according to the replacement ratio of cement, and the resulting mix designs are shown in Table 6.
2.3.2. Preparation of Test Specimens
To measure mortar compressive strength, test specimens of 40 mm × 40 mm × 160 mm were prepared according to ISO 679. After curing for 24 h in a constant temperature and moisture room, the mortar underwent removal of form followed by water curing at 20 °C. Compressive strength was measured for test specimens at varying ages.
2.3.3. Mortar Test Method
The flow test was conducted after mixing of mortar in accordance with American Society for Testing and Materials (ASTM) Standards: C 1437 Standard Test Method for Flow of Hydraulic Cement Mortar. The flexural strengths and compressive strength tests were performed according to ISO 679, and measurements were taken at age 3, 7 and 28 days. A universal testing machine (UTM) of 100 ton was used to measure the compressive strength by age.
3. Experiment Results and Analysis
3.1. BET Analysis
The BET results for different precursor mixing ratios are shown in Table 7. When the ratio was 0.3 mol, both SiO2 and Al2O3 had a maximum specific surface area of 319 m2/g and 267 m2/g, respectively. These values tended to decrease when the ratio exceeded 0.5 mol. This phenomenon is ascribed to the varying solubility of alkoxide in the solvents at different mixing ratios. Namely, as the average particle size of NTCP increases, the relative specific surface area decreases.
Since the specific surface area is an important determining factor for photocatalytic efficiency, ST-2 and AT-2 mixing ratios, which exhibited the largest specific surface area, were considered to be the most suitable construction materials. Additionally, crystalline properties were studied while changing heat treatment temperature and thus crystal size.
The results showed that as the heat treatment temperature increased, the specific surface area decreased, and this was due to the enhanced crystal growth at increased temperatures, as well as the fact that the specific surface area of TiO2 is relatively smaller than that of SiO2 and Al2O3. At heat treatment temperatures of 700 °C and above sintering occurred, leading to a sudden decrease in specific surface area.
As a result, the optimal mix design for NTCP for construction purposes considering photocatalytic efficiency—was determined to be the mixture of 0.7 mol Ti and 0.3 mol precursor, heat treated at 450 °C. This combination exhibited the largest specific surface area.
3.2. XRD Analysis
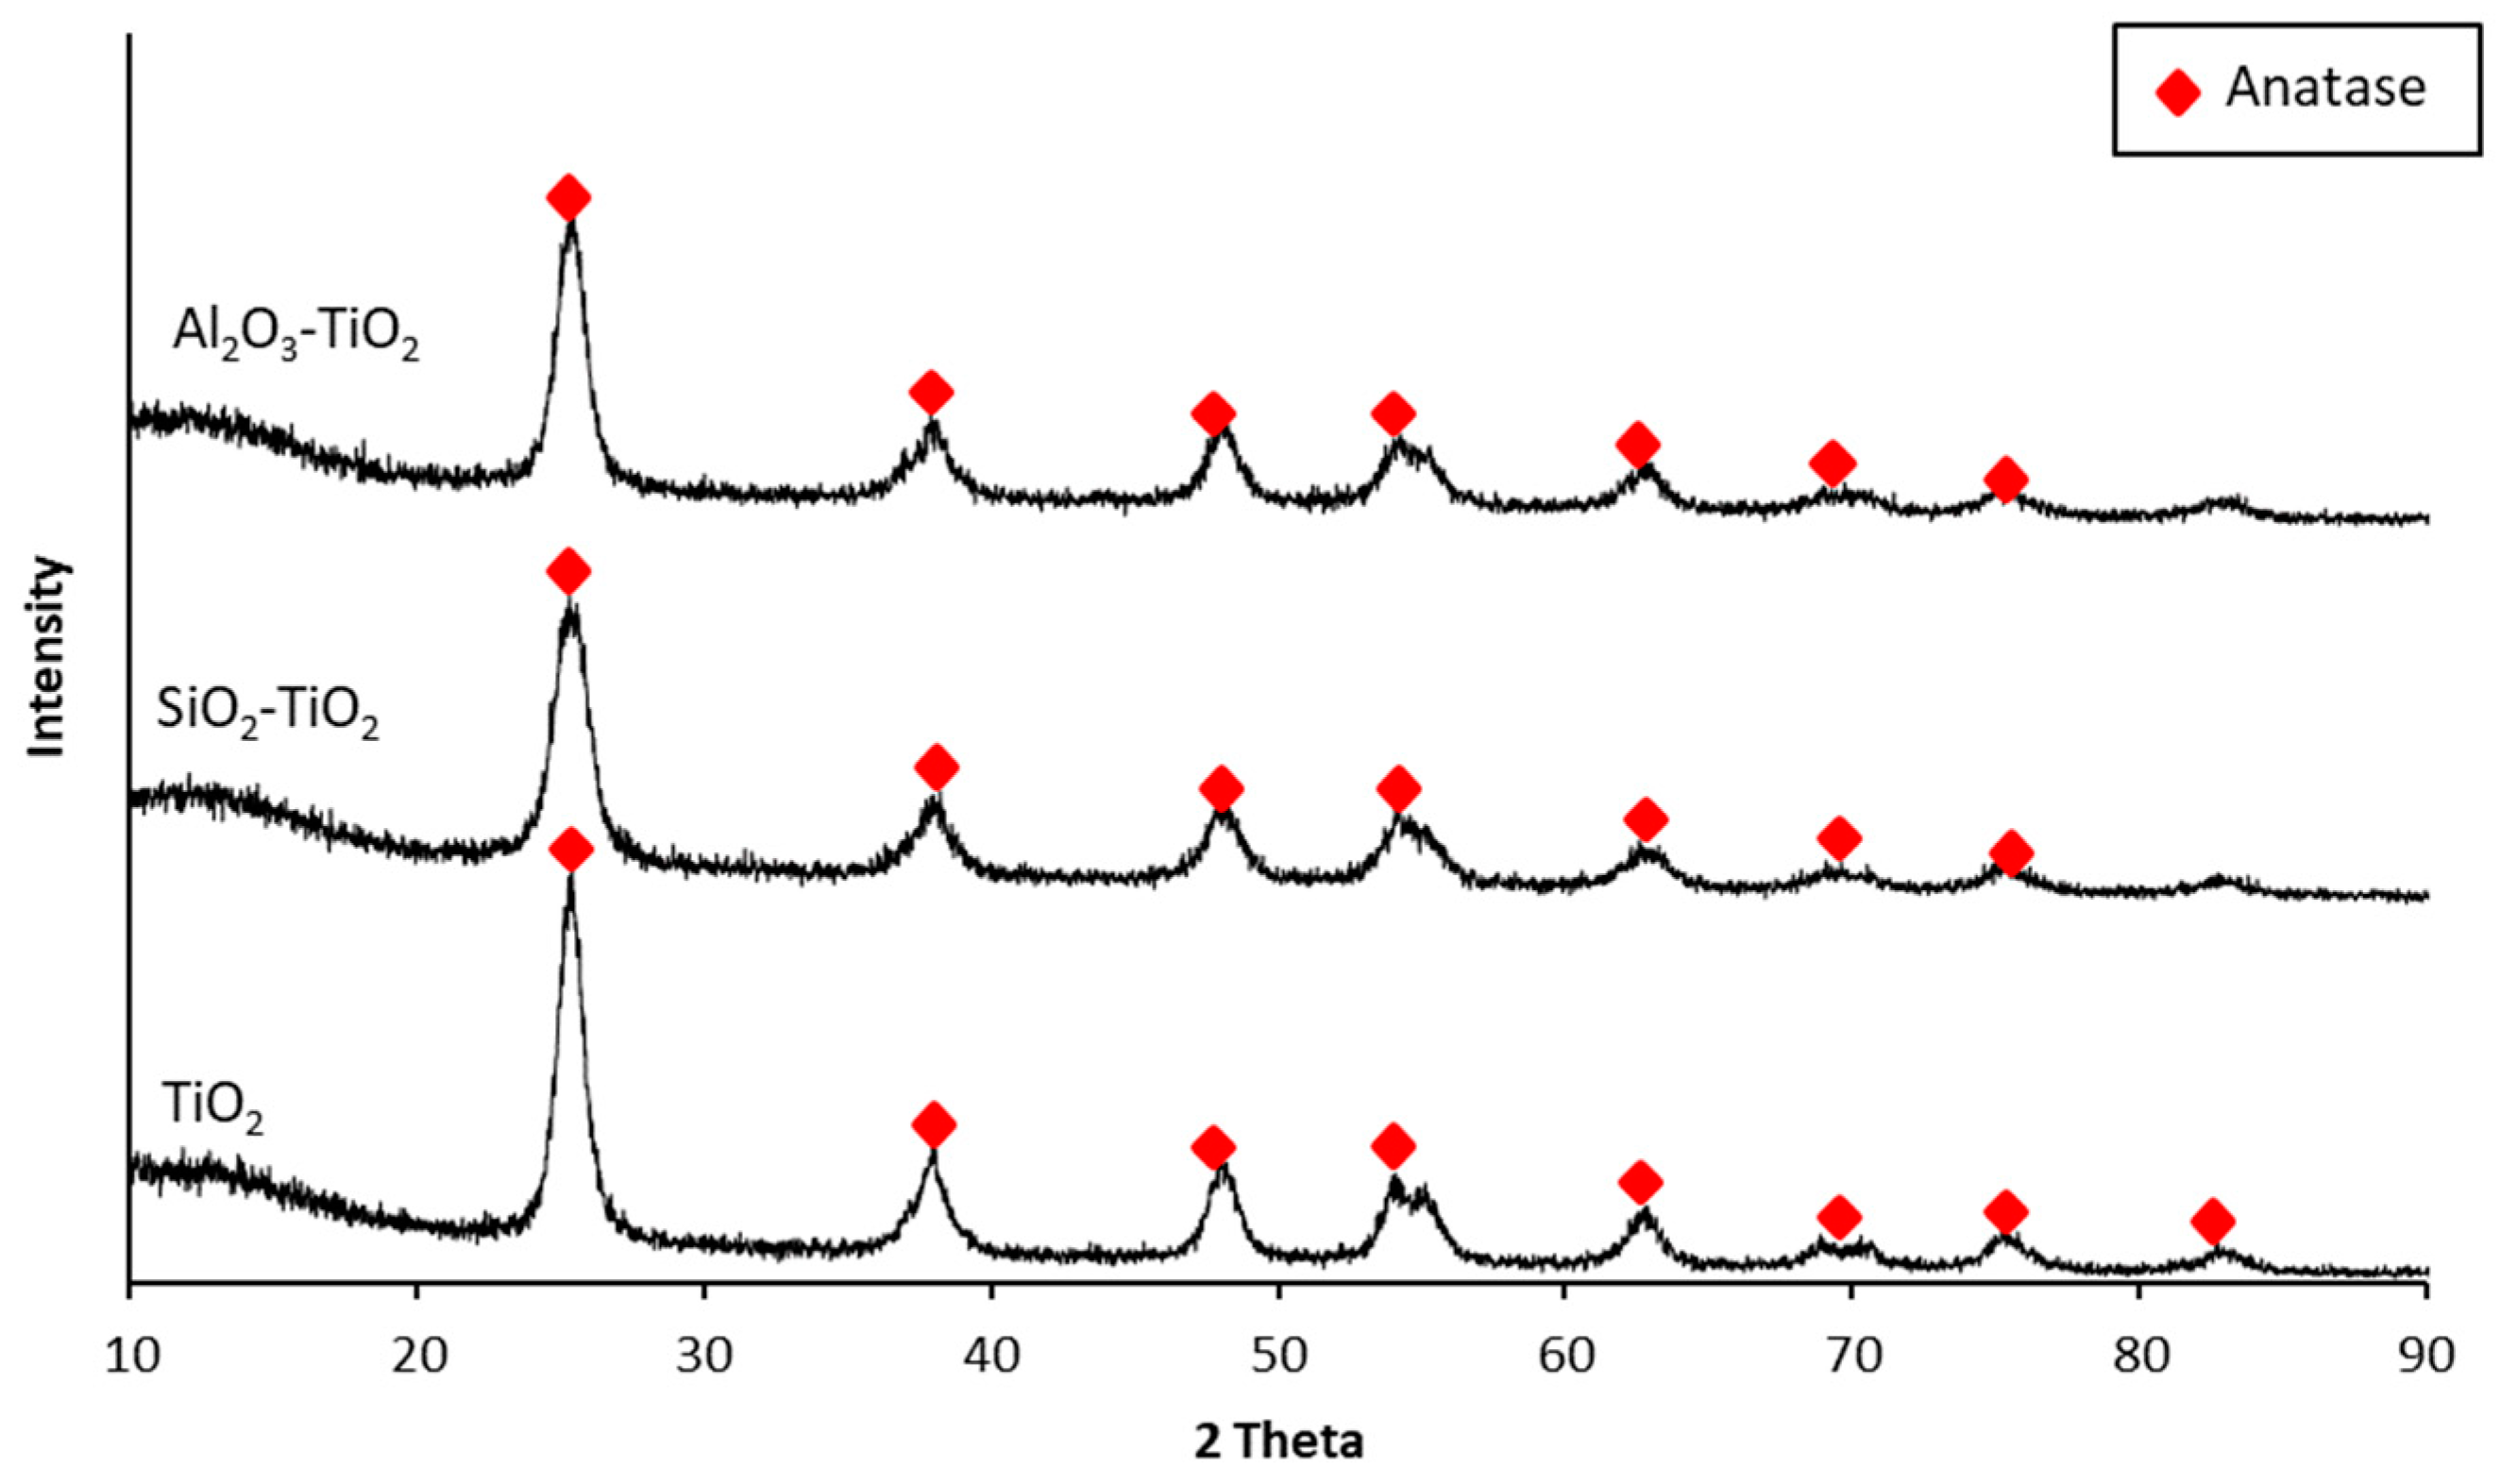
XRD analysis was performed both on commercial TiO2 and the NTCP produced using the optimal mixing ratio, and the analytical results are shown in Figure 2. TiO2 is classified according to crystal structure, as follows: anatase phase with excellent photodecomposition activity, rutile phase with excellent thermal stability, and brookite phase only found in minerals. The reference peaks for the anatase phase are peaks at 2θ = 25.302(101), 38.608(112), 48.091(200), 48.103(200); those for rutile phase are peaks at 2θ = 27.461(110), 36.116(101), 39.311(200); and those for brookite phase are peaks at 2θ = 42.375(221), 52.057(240), 57.736(232), 54.581(311). XRD analytical results confirmed that the NTCP developed in the present study had only anatase phase. No rutile or brookite phase peaks were observed. This phenomenon is ascribed to the fact that the more thermally stable SiO2 and Al2O3 effectively suppressed the phase transition of the TiO2.
3.3. SEM Analysis
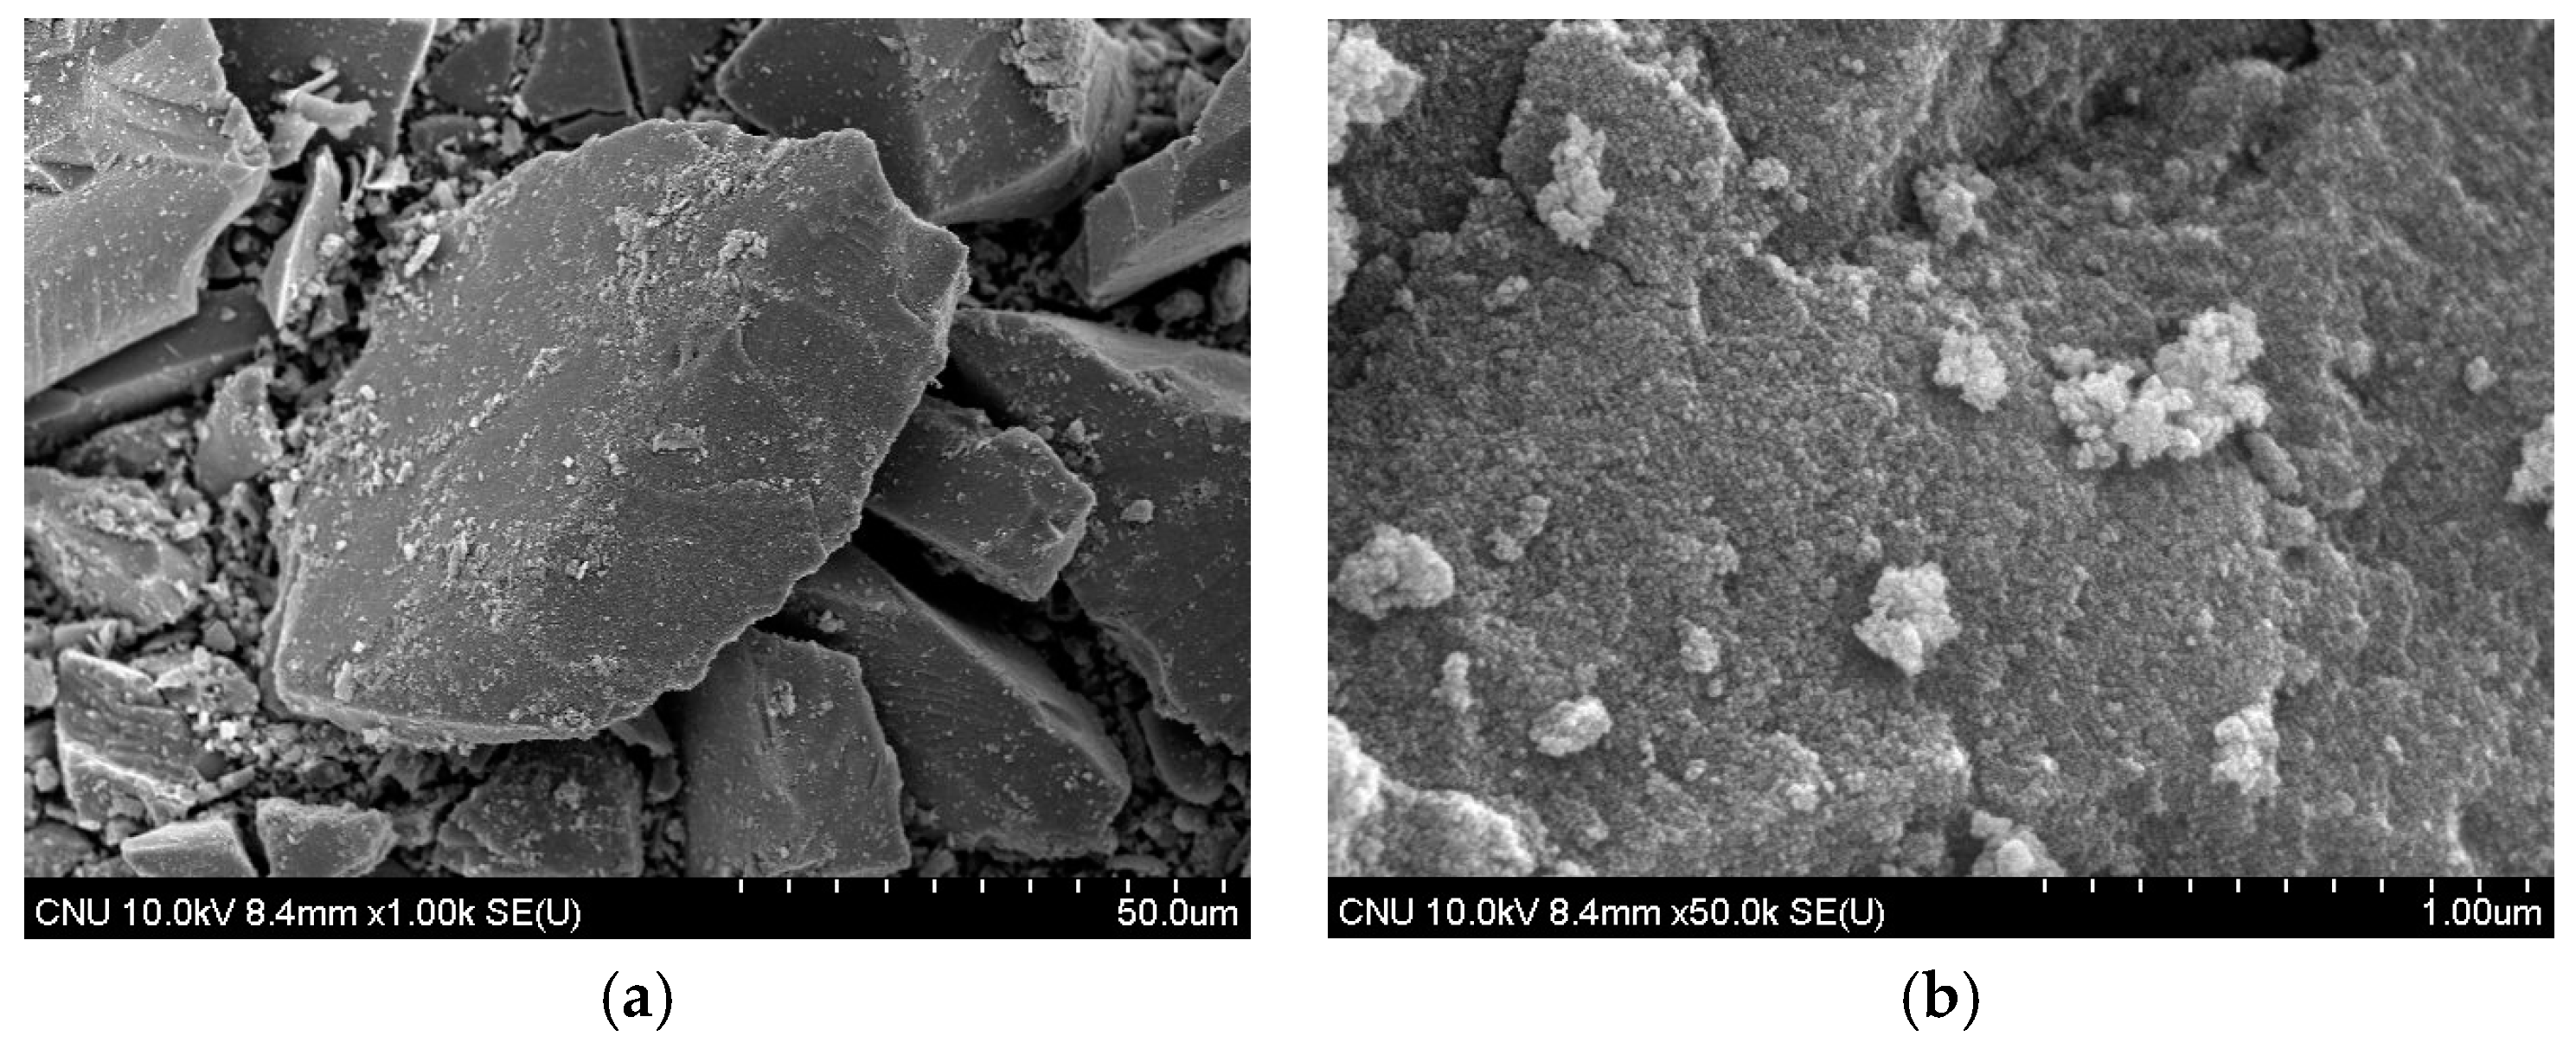
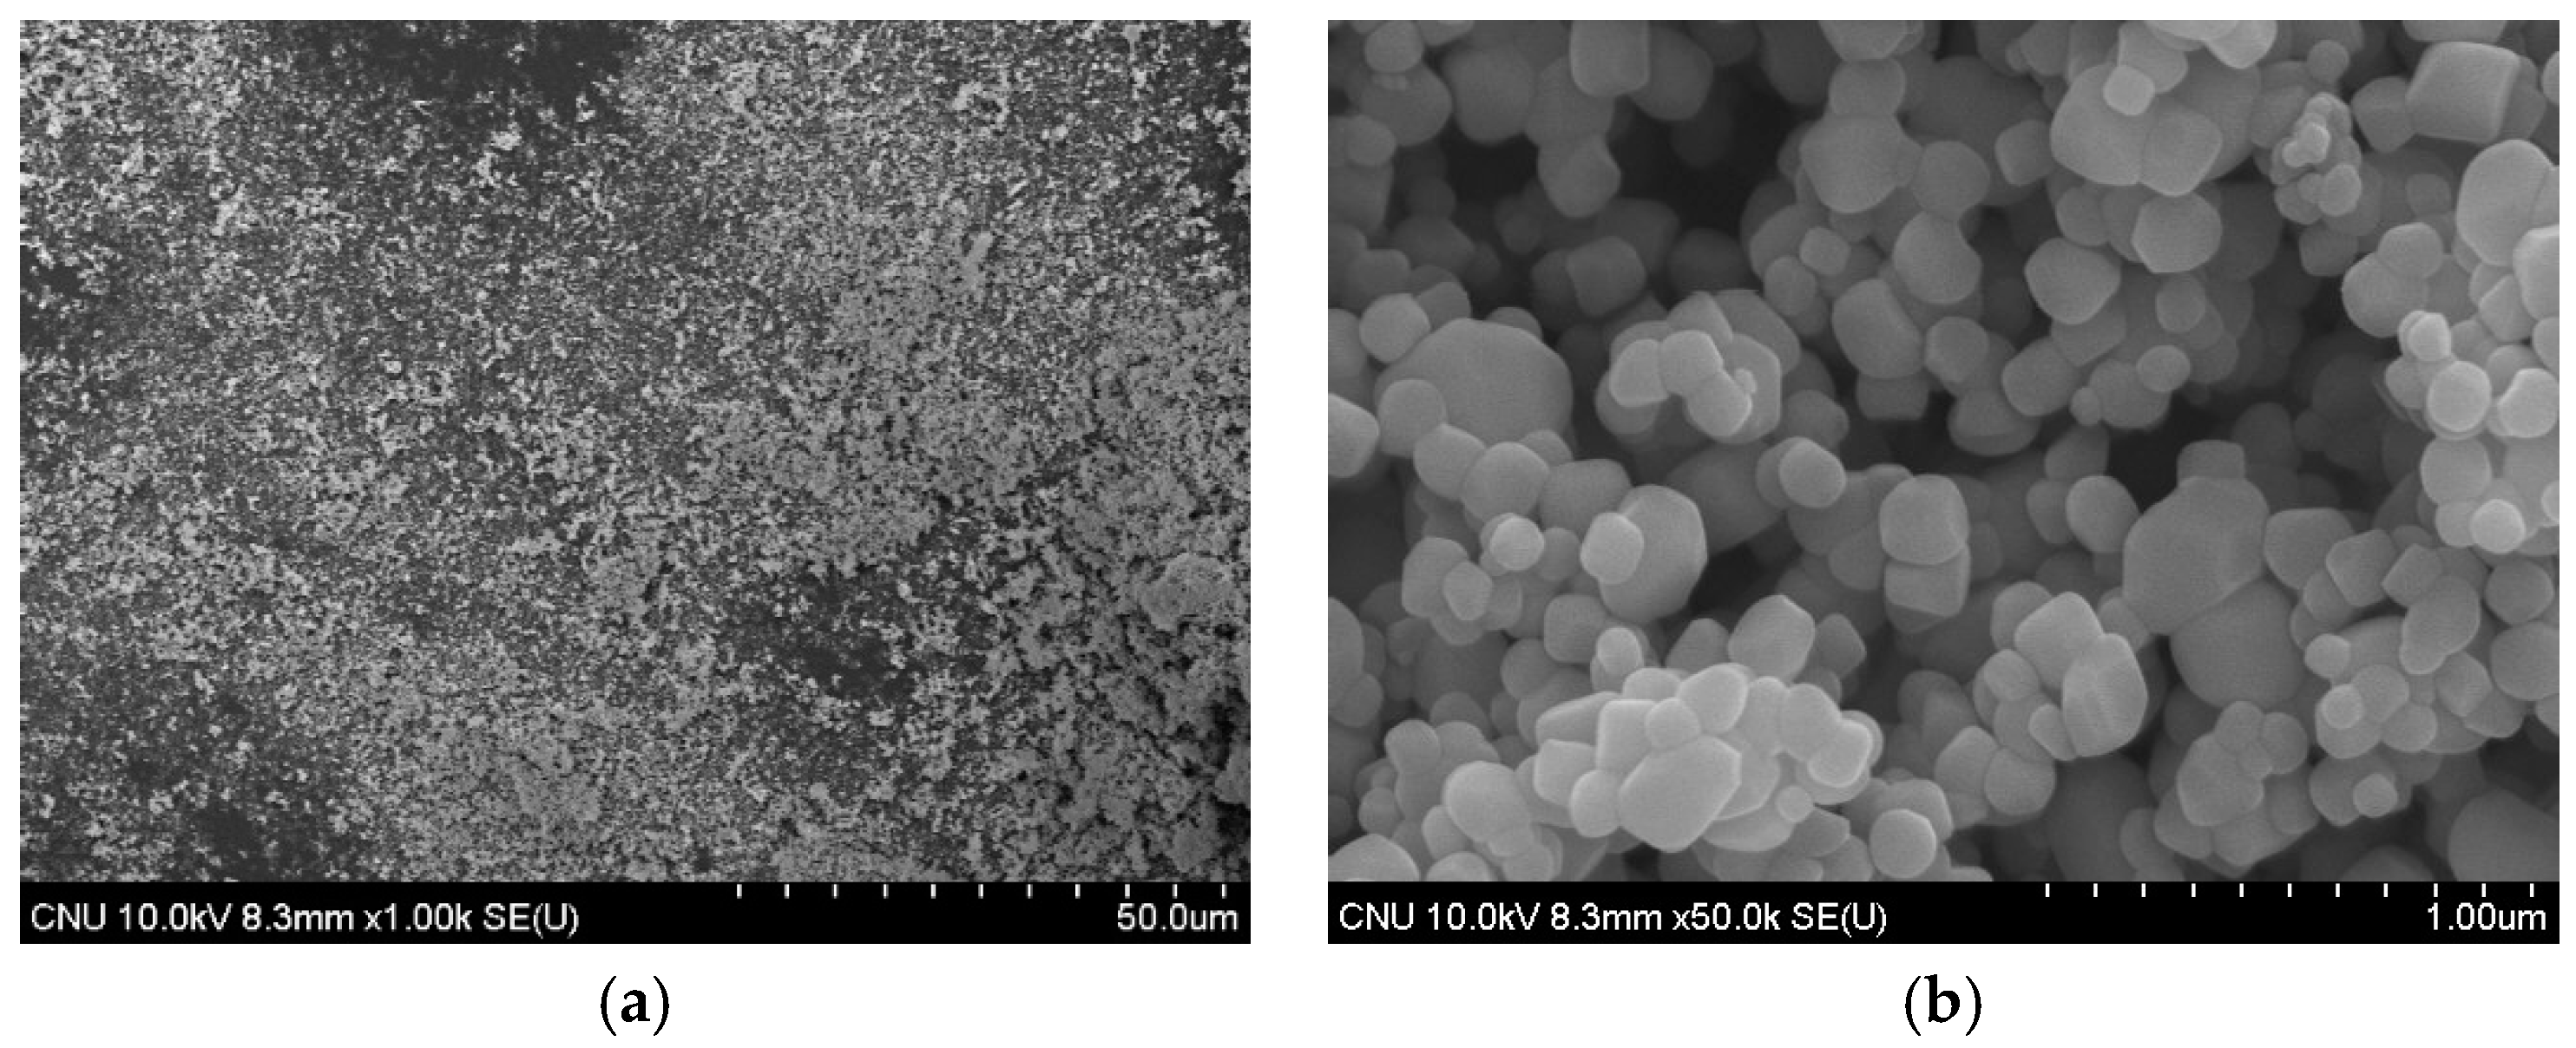
When SEM images of commercial TiO2 and the NTCP are shown in Figure 3 and Figure 4. In the commercial TiO2, the particle size was larger, and aggregation spots were more frequently observed. In contrast, neither aggregation spots nor single phases of TiO2, SiO2, and Al2O3 were observed in the NTCP developed in the present study. Also, no peaks were found for the Al2TiO5 phase, a compound of TiO2 and Al2O3, confirming that the NTCP had been successfully synthesized. In line with the XRD results, the NTCP was found to be anatase phase spherical particles, and no linear shaped particles of the rutile phase were observed.
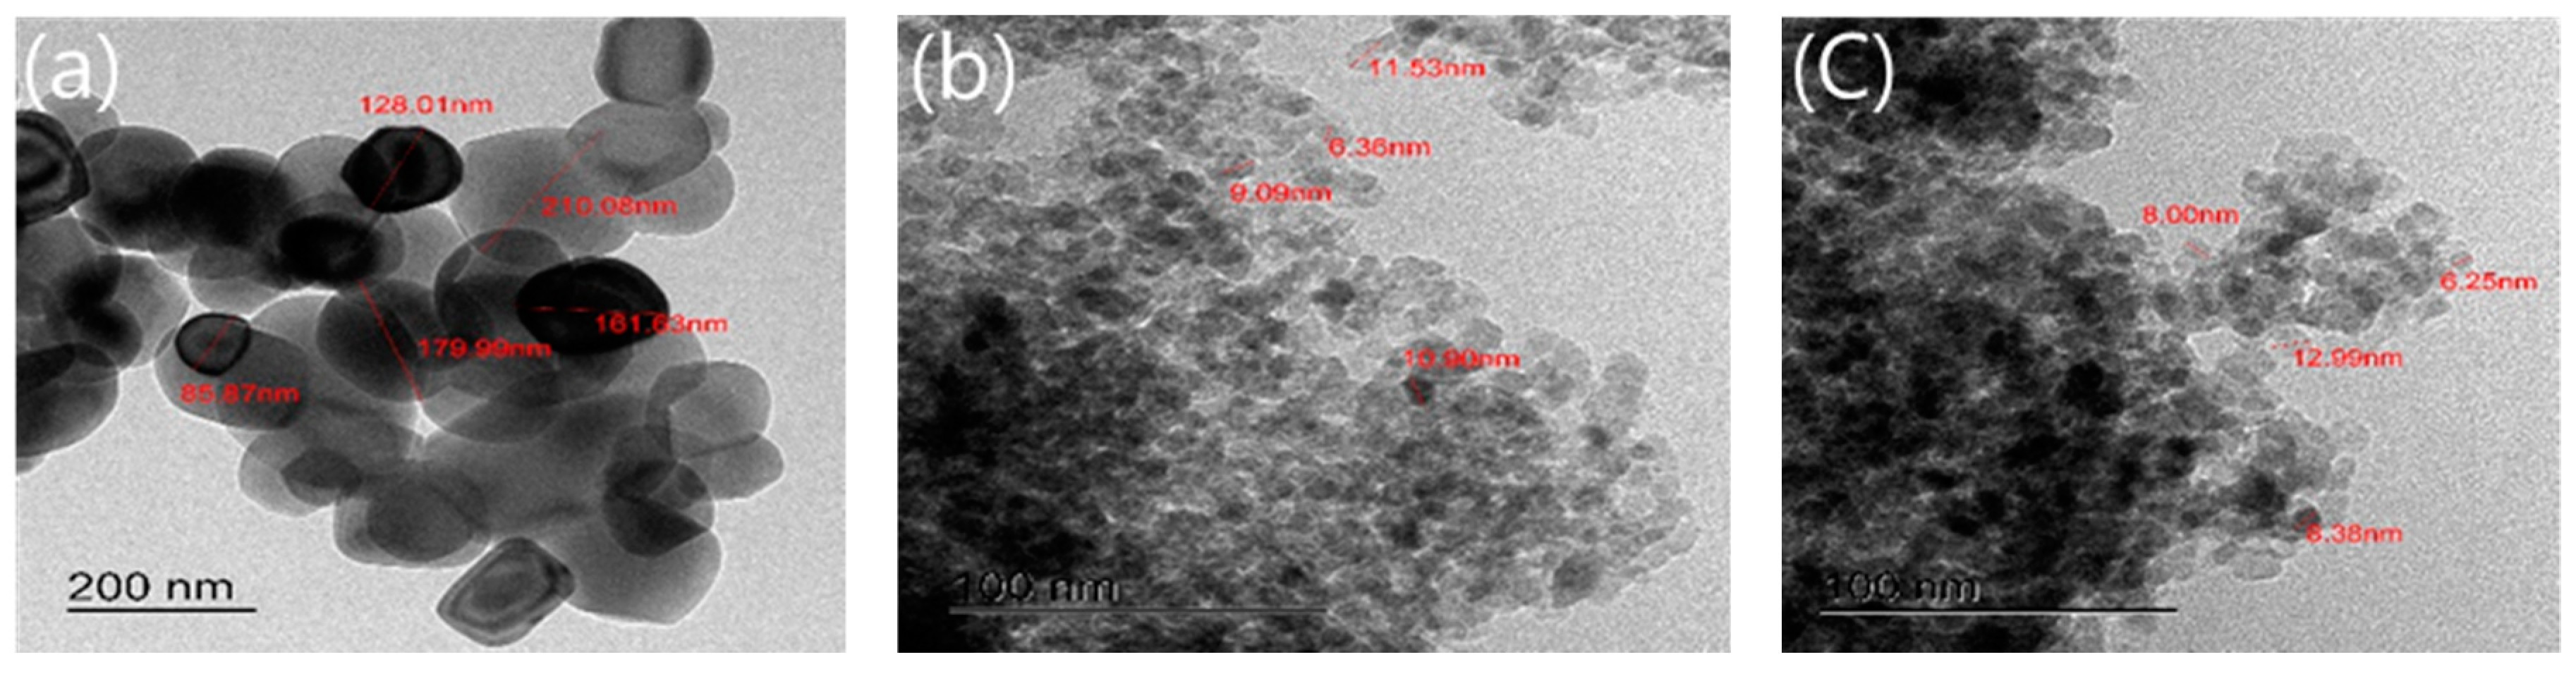
3.4. TEM Analysis
Figure 5 shows the results of TEM observation of the commercial TiO2 and the NTCP. Here, the particle size and shape of both specimens were compared. For commercial TiO2, the particle size was not uniform, varying from 85.87 to 210.08 nm. In contrast, for the NTCP, the particle size of the SiO2-TiO2 powder ranged between 6.36 and 11.53 nm, and the particle size of the Al2O3-TiO2 powder ranged between 6.25 and 12.99 nm. This means that the NTCP has a relatively more uniform particle size than commercial TiO2.
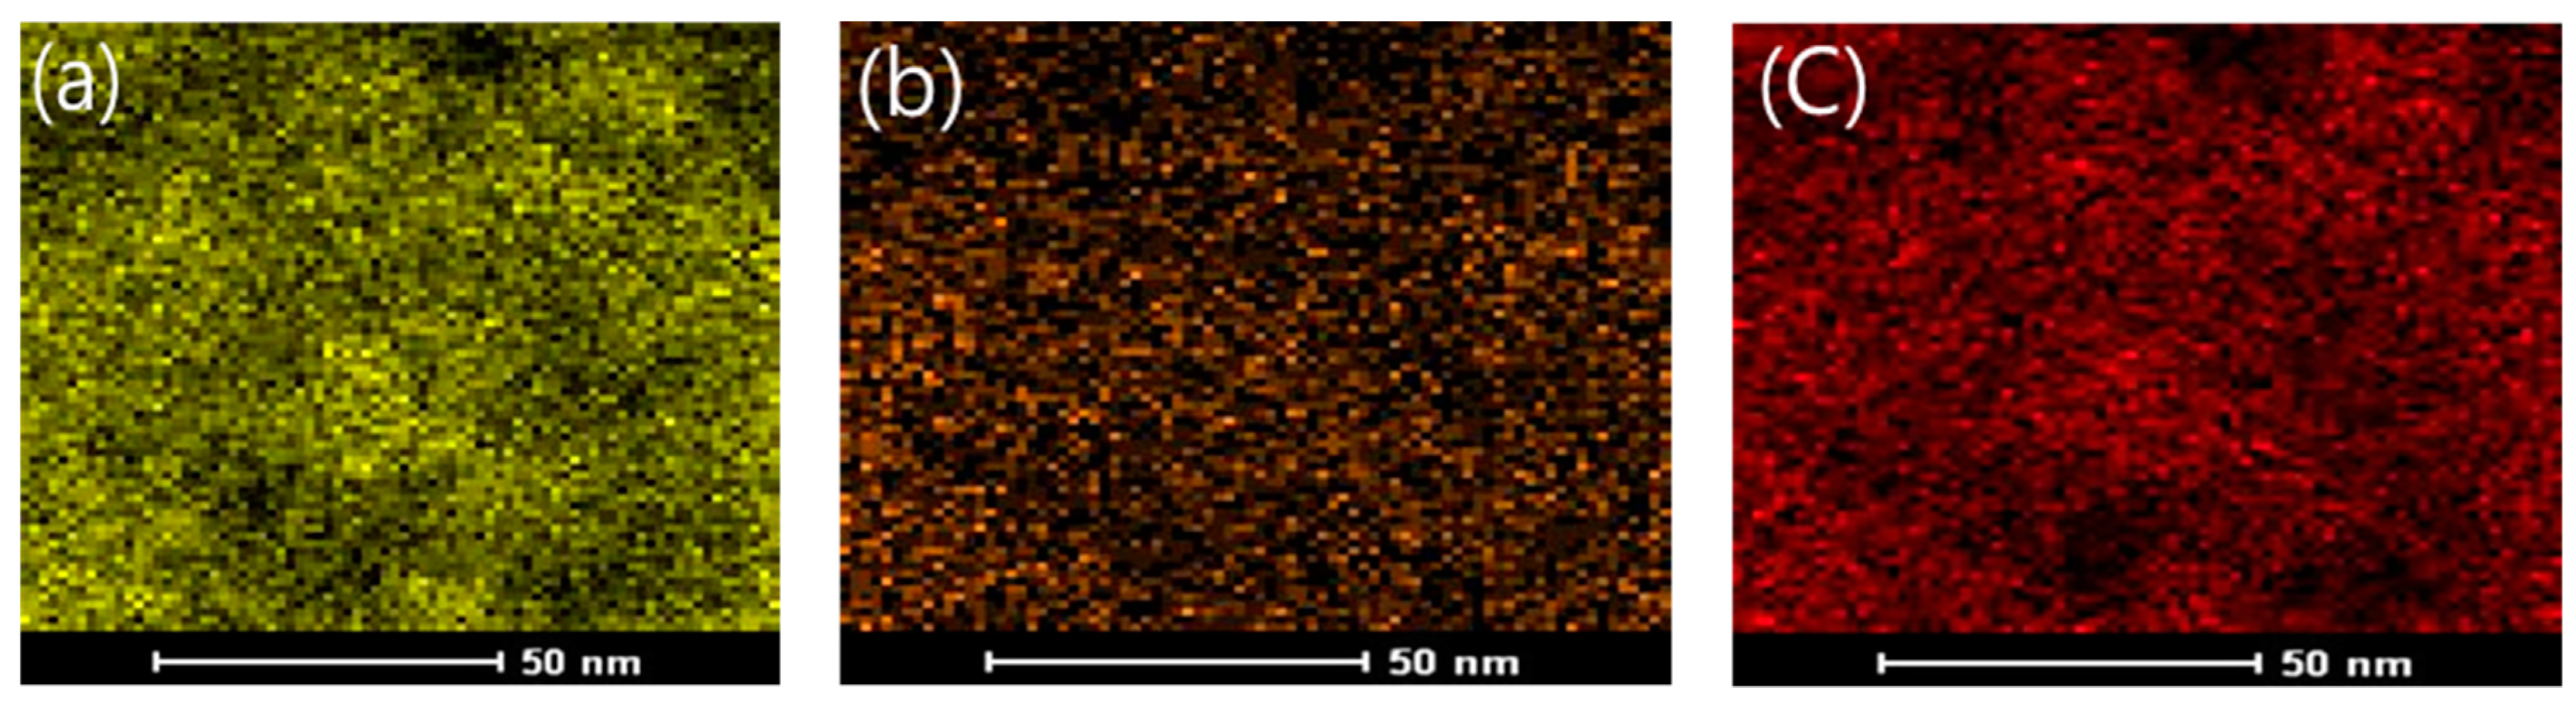
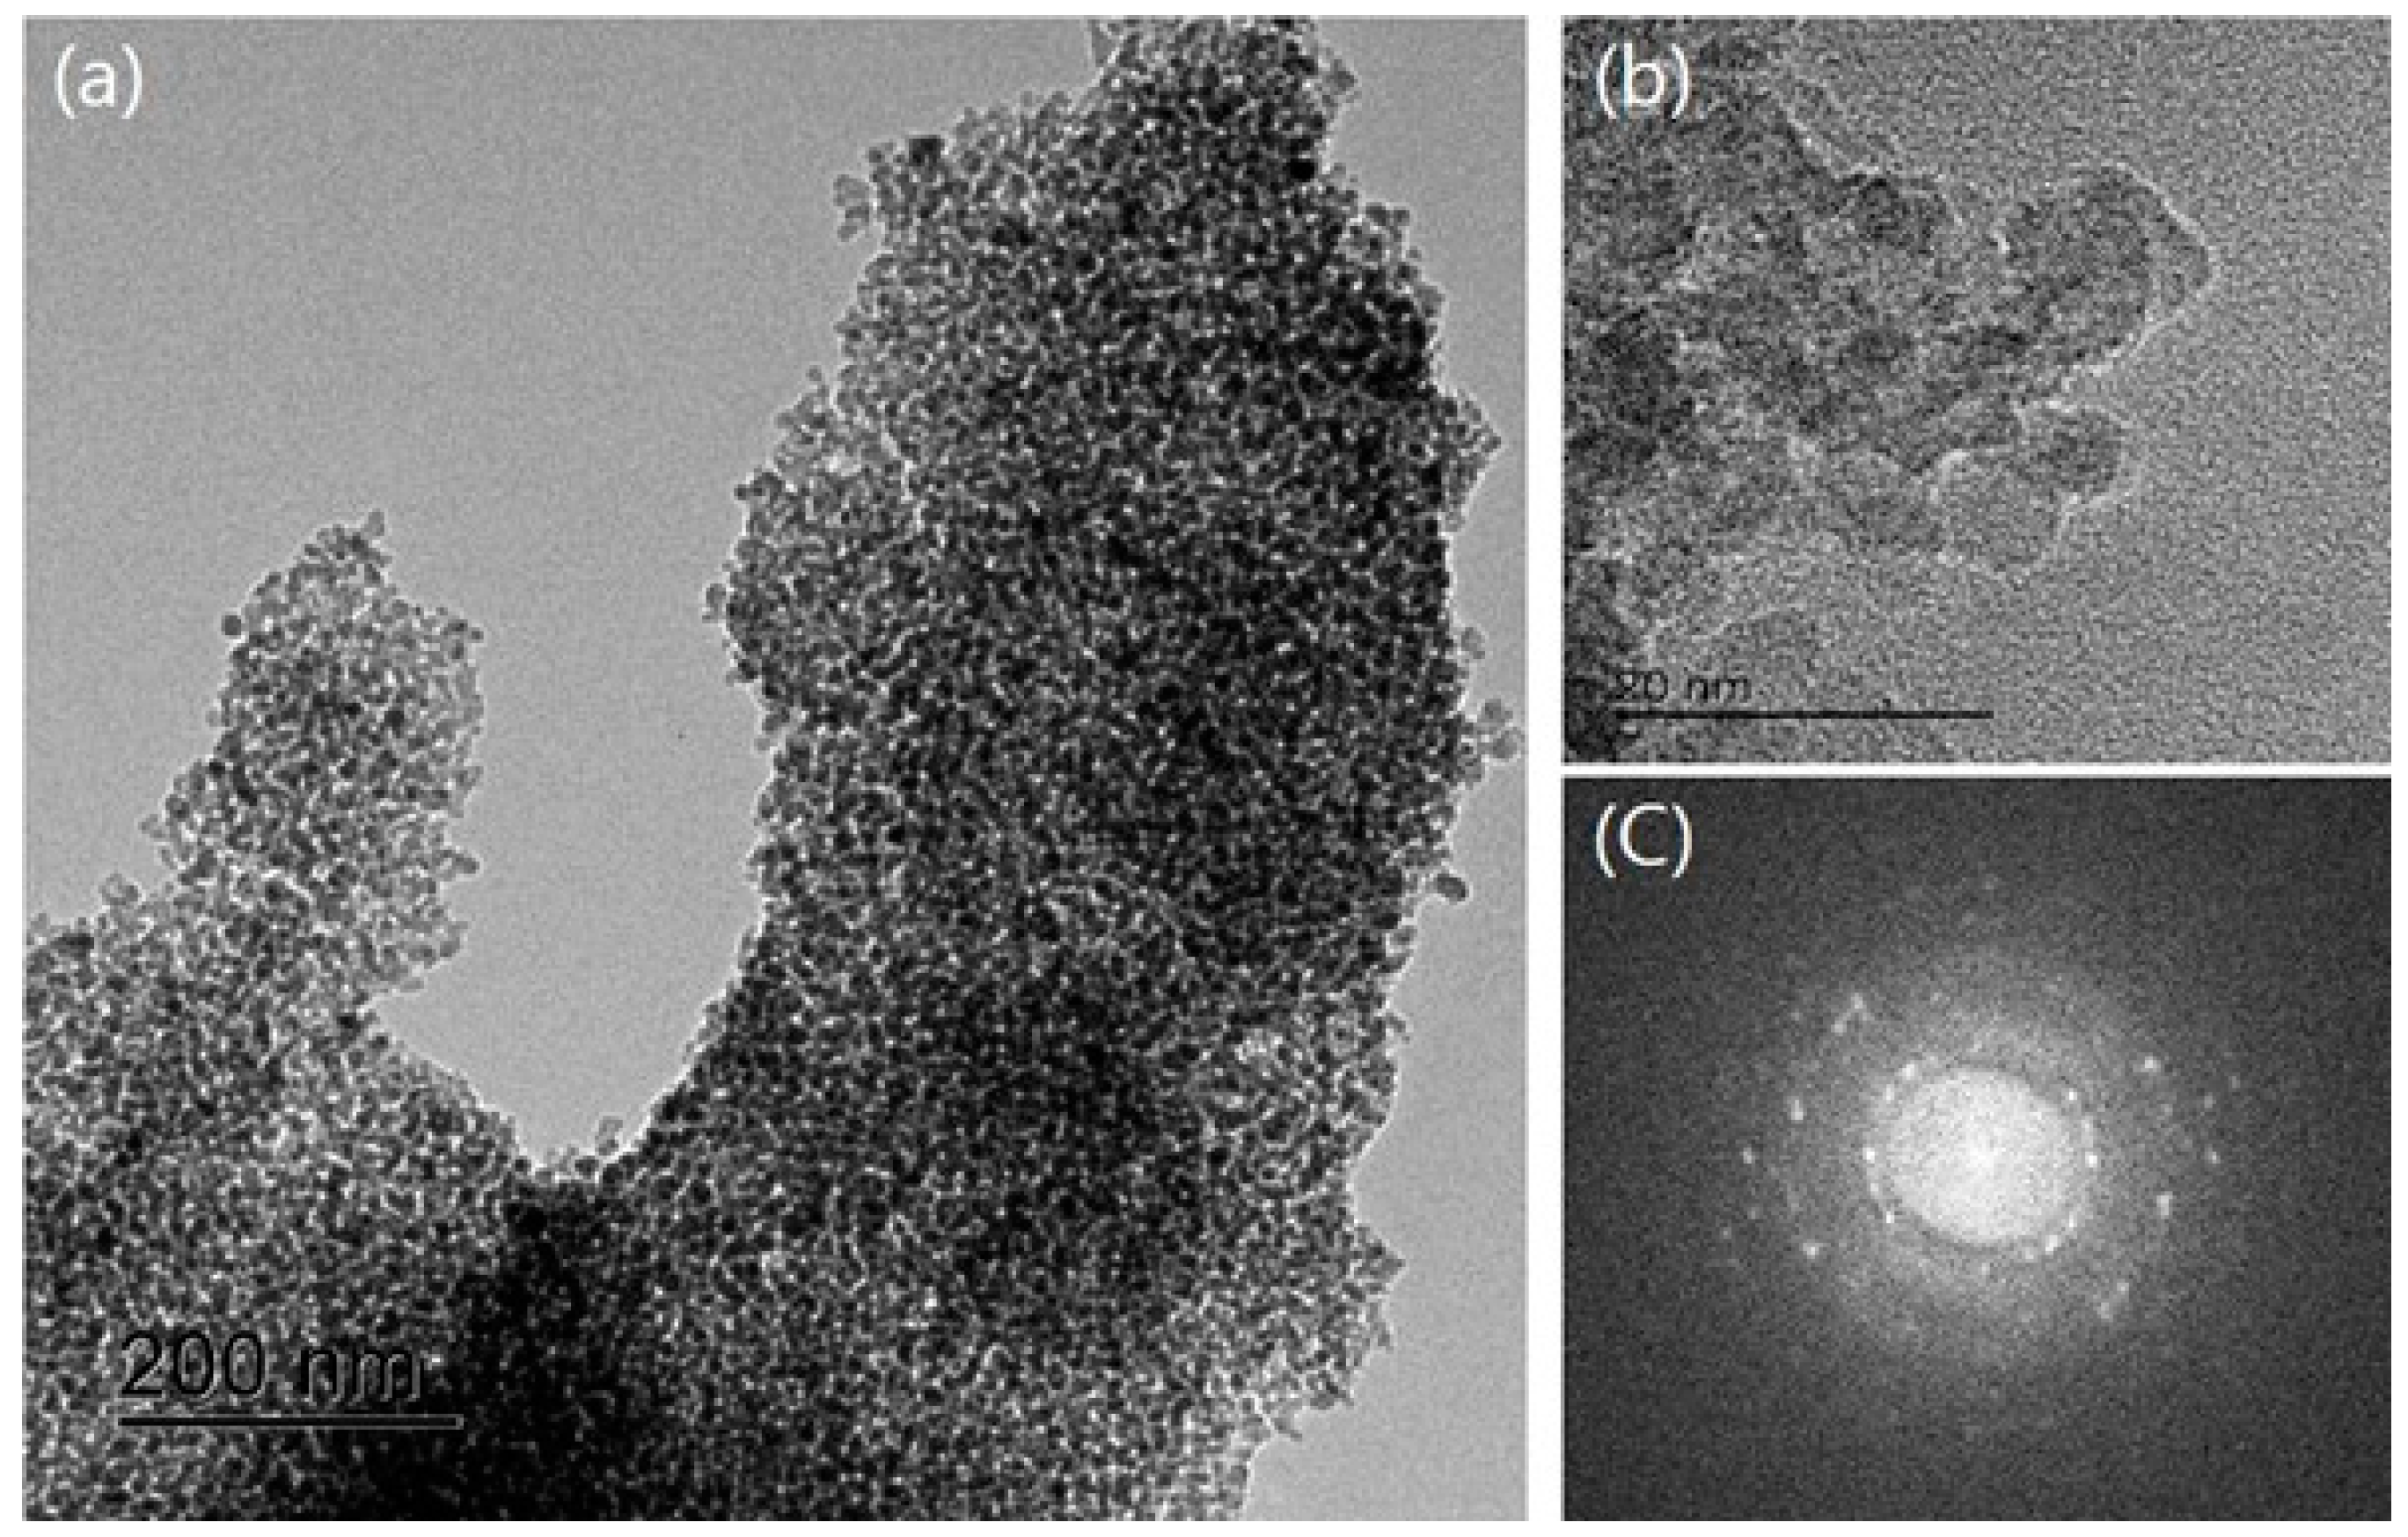
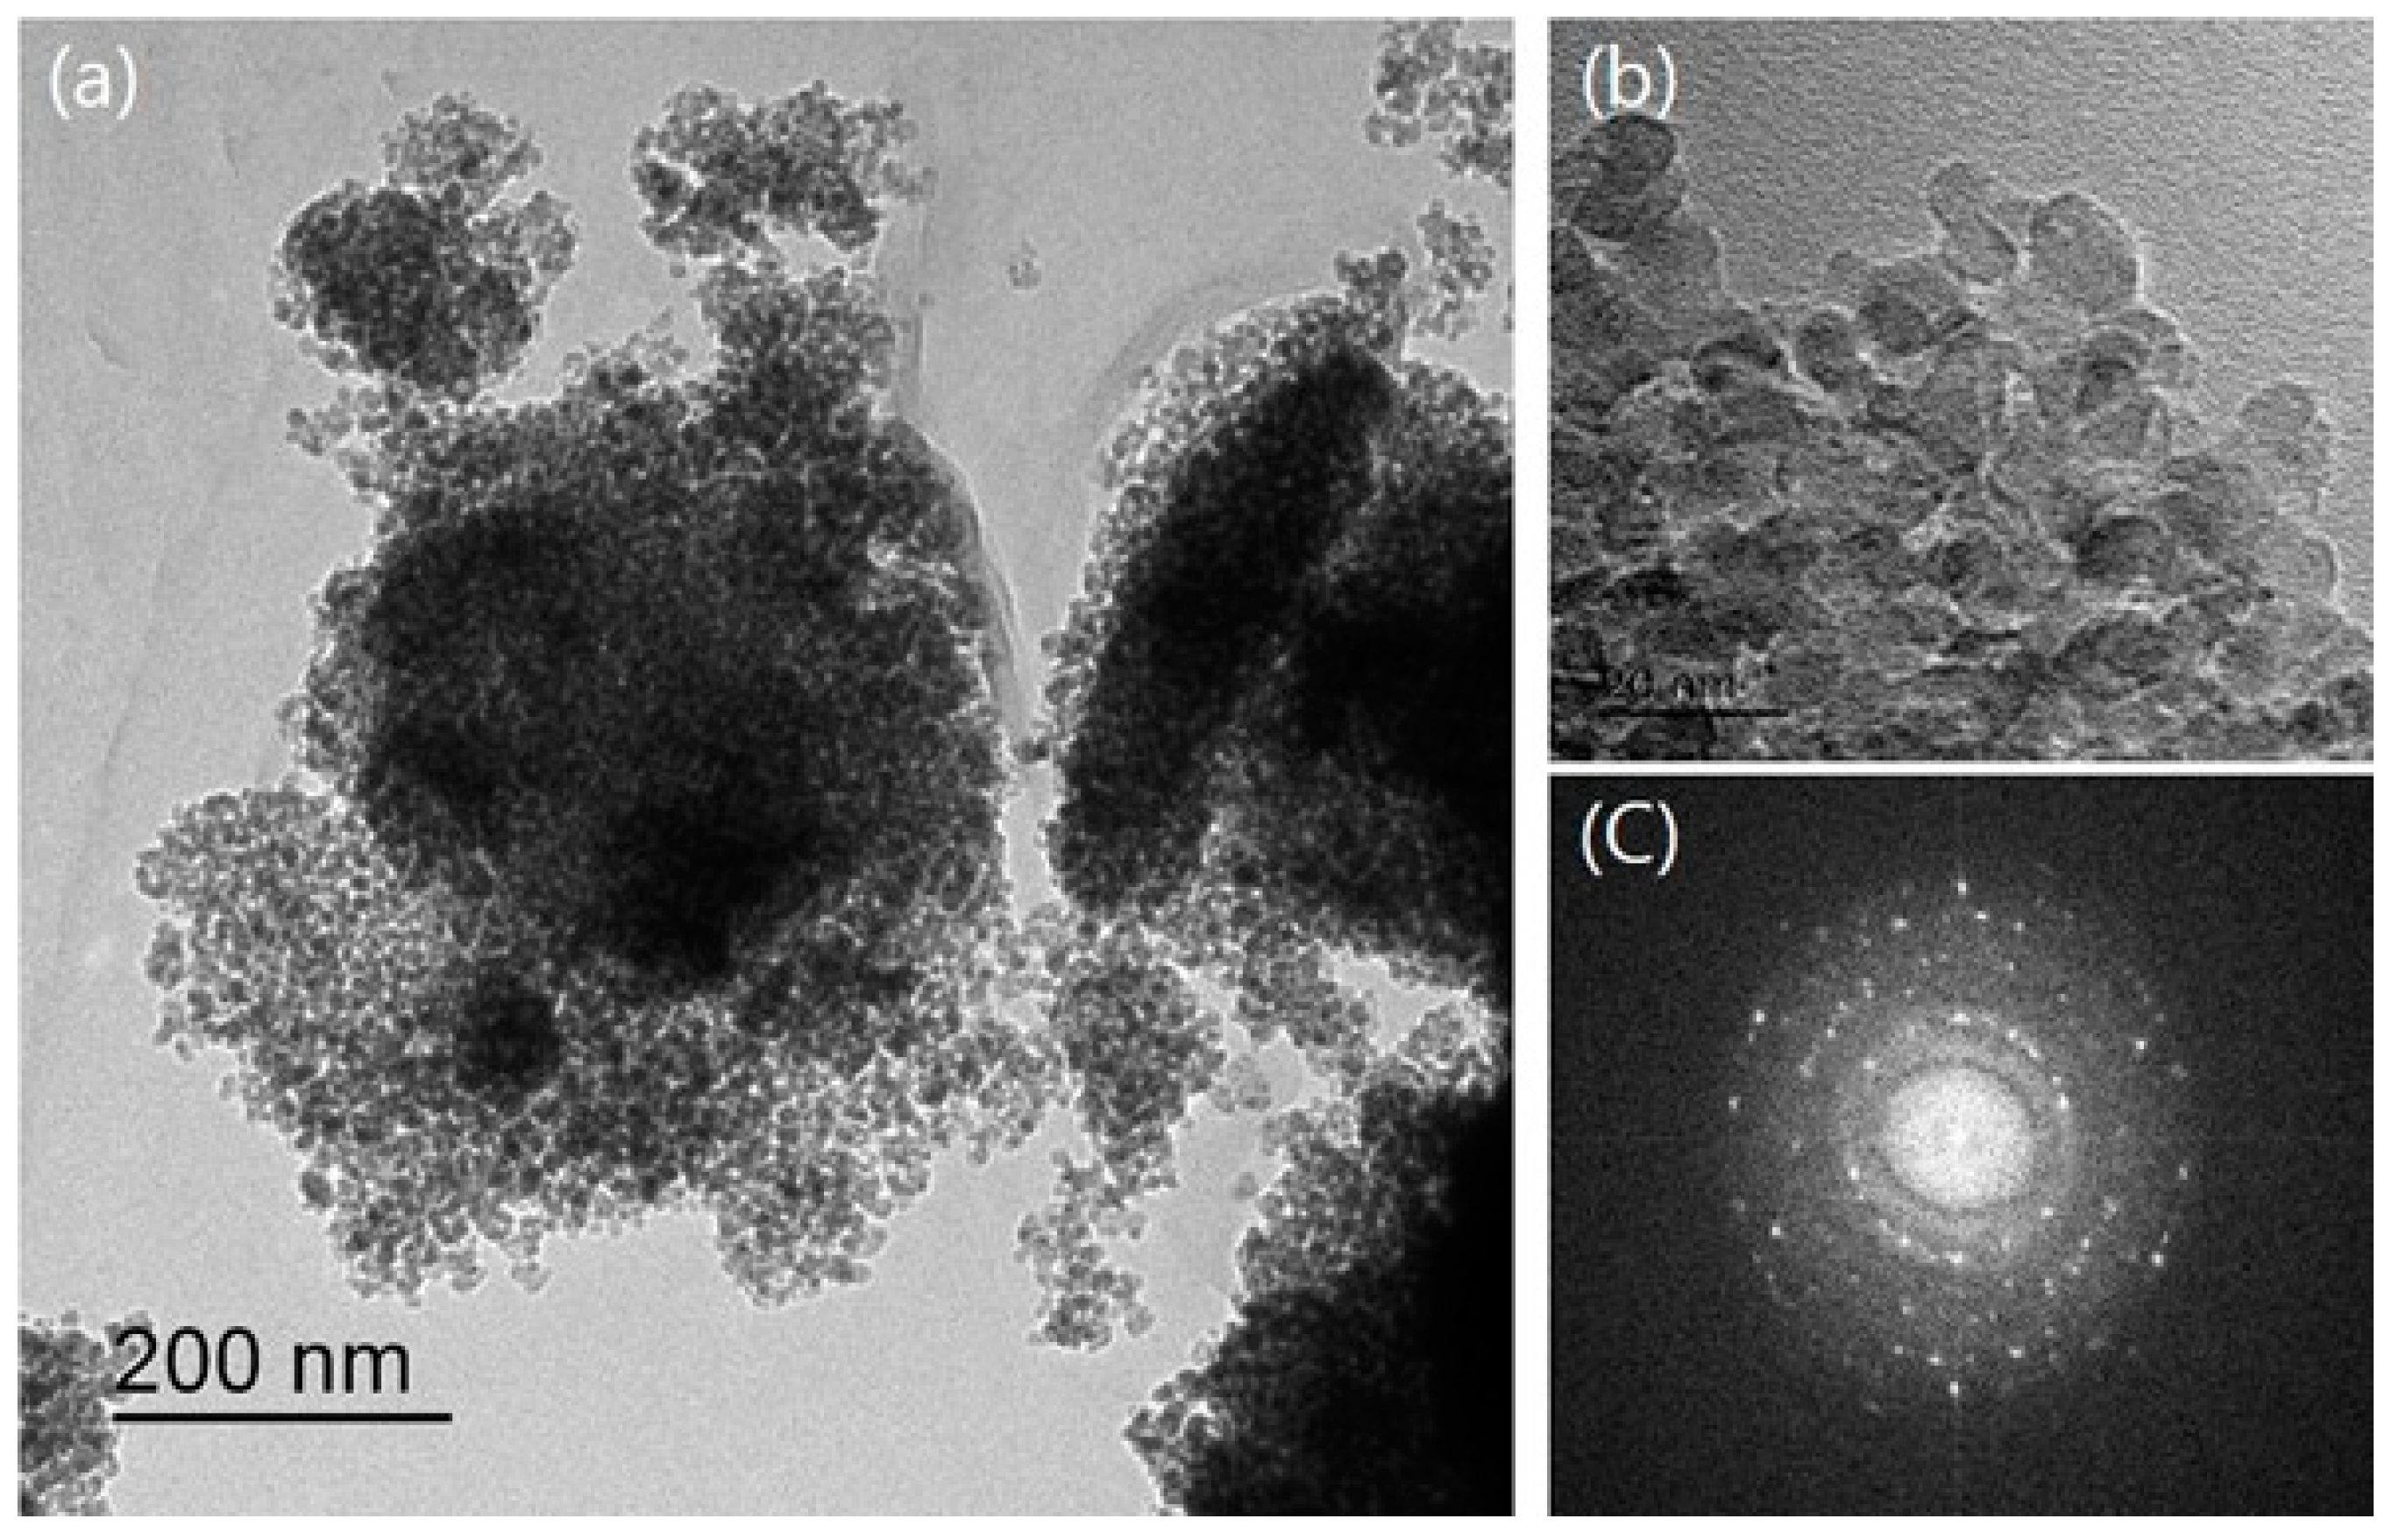
EDX analysis was carried out to visualize the structure of the NTCP’s coating layer according to element content. The EDX mapping results are shown in Figure 6. As shown in Figure 6a, element Ti was observed in the NTCP specimen. As shown in Figure 6b,c, element Si and element Al were found to be uniformly dispersed within the SiO2-TiO2 powder and Al2O3-TiO2 powder, respectively. TEM diffraction analysis was performed using Fast Fourier Transform (FFT). As shown in Figure 7 and Figure 8, the results confirmed that SiO2 and Al2O3 were the core materials of the NTCP. Additionally, the shell part was determined to be anatase TiO2 phase.
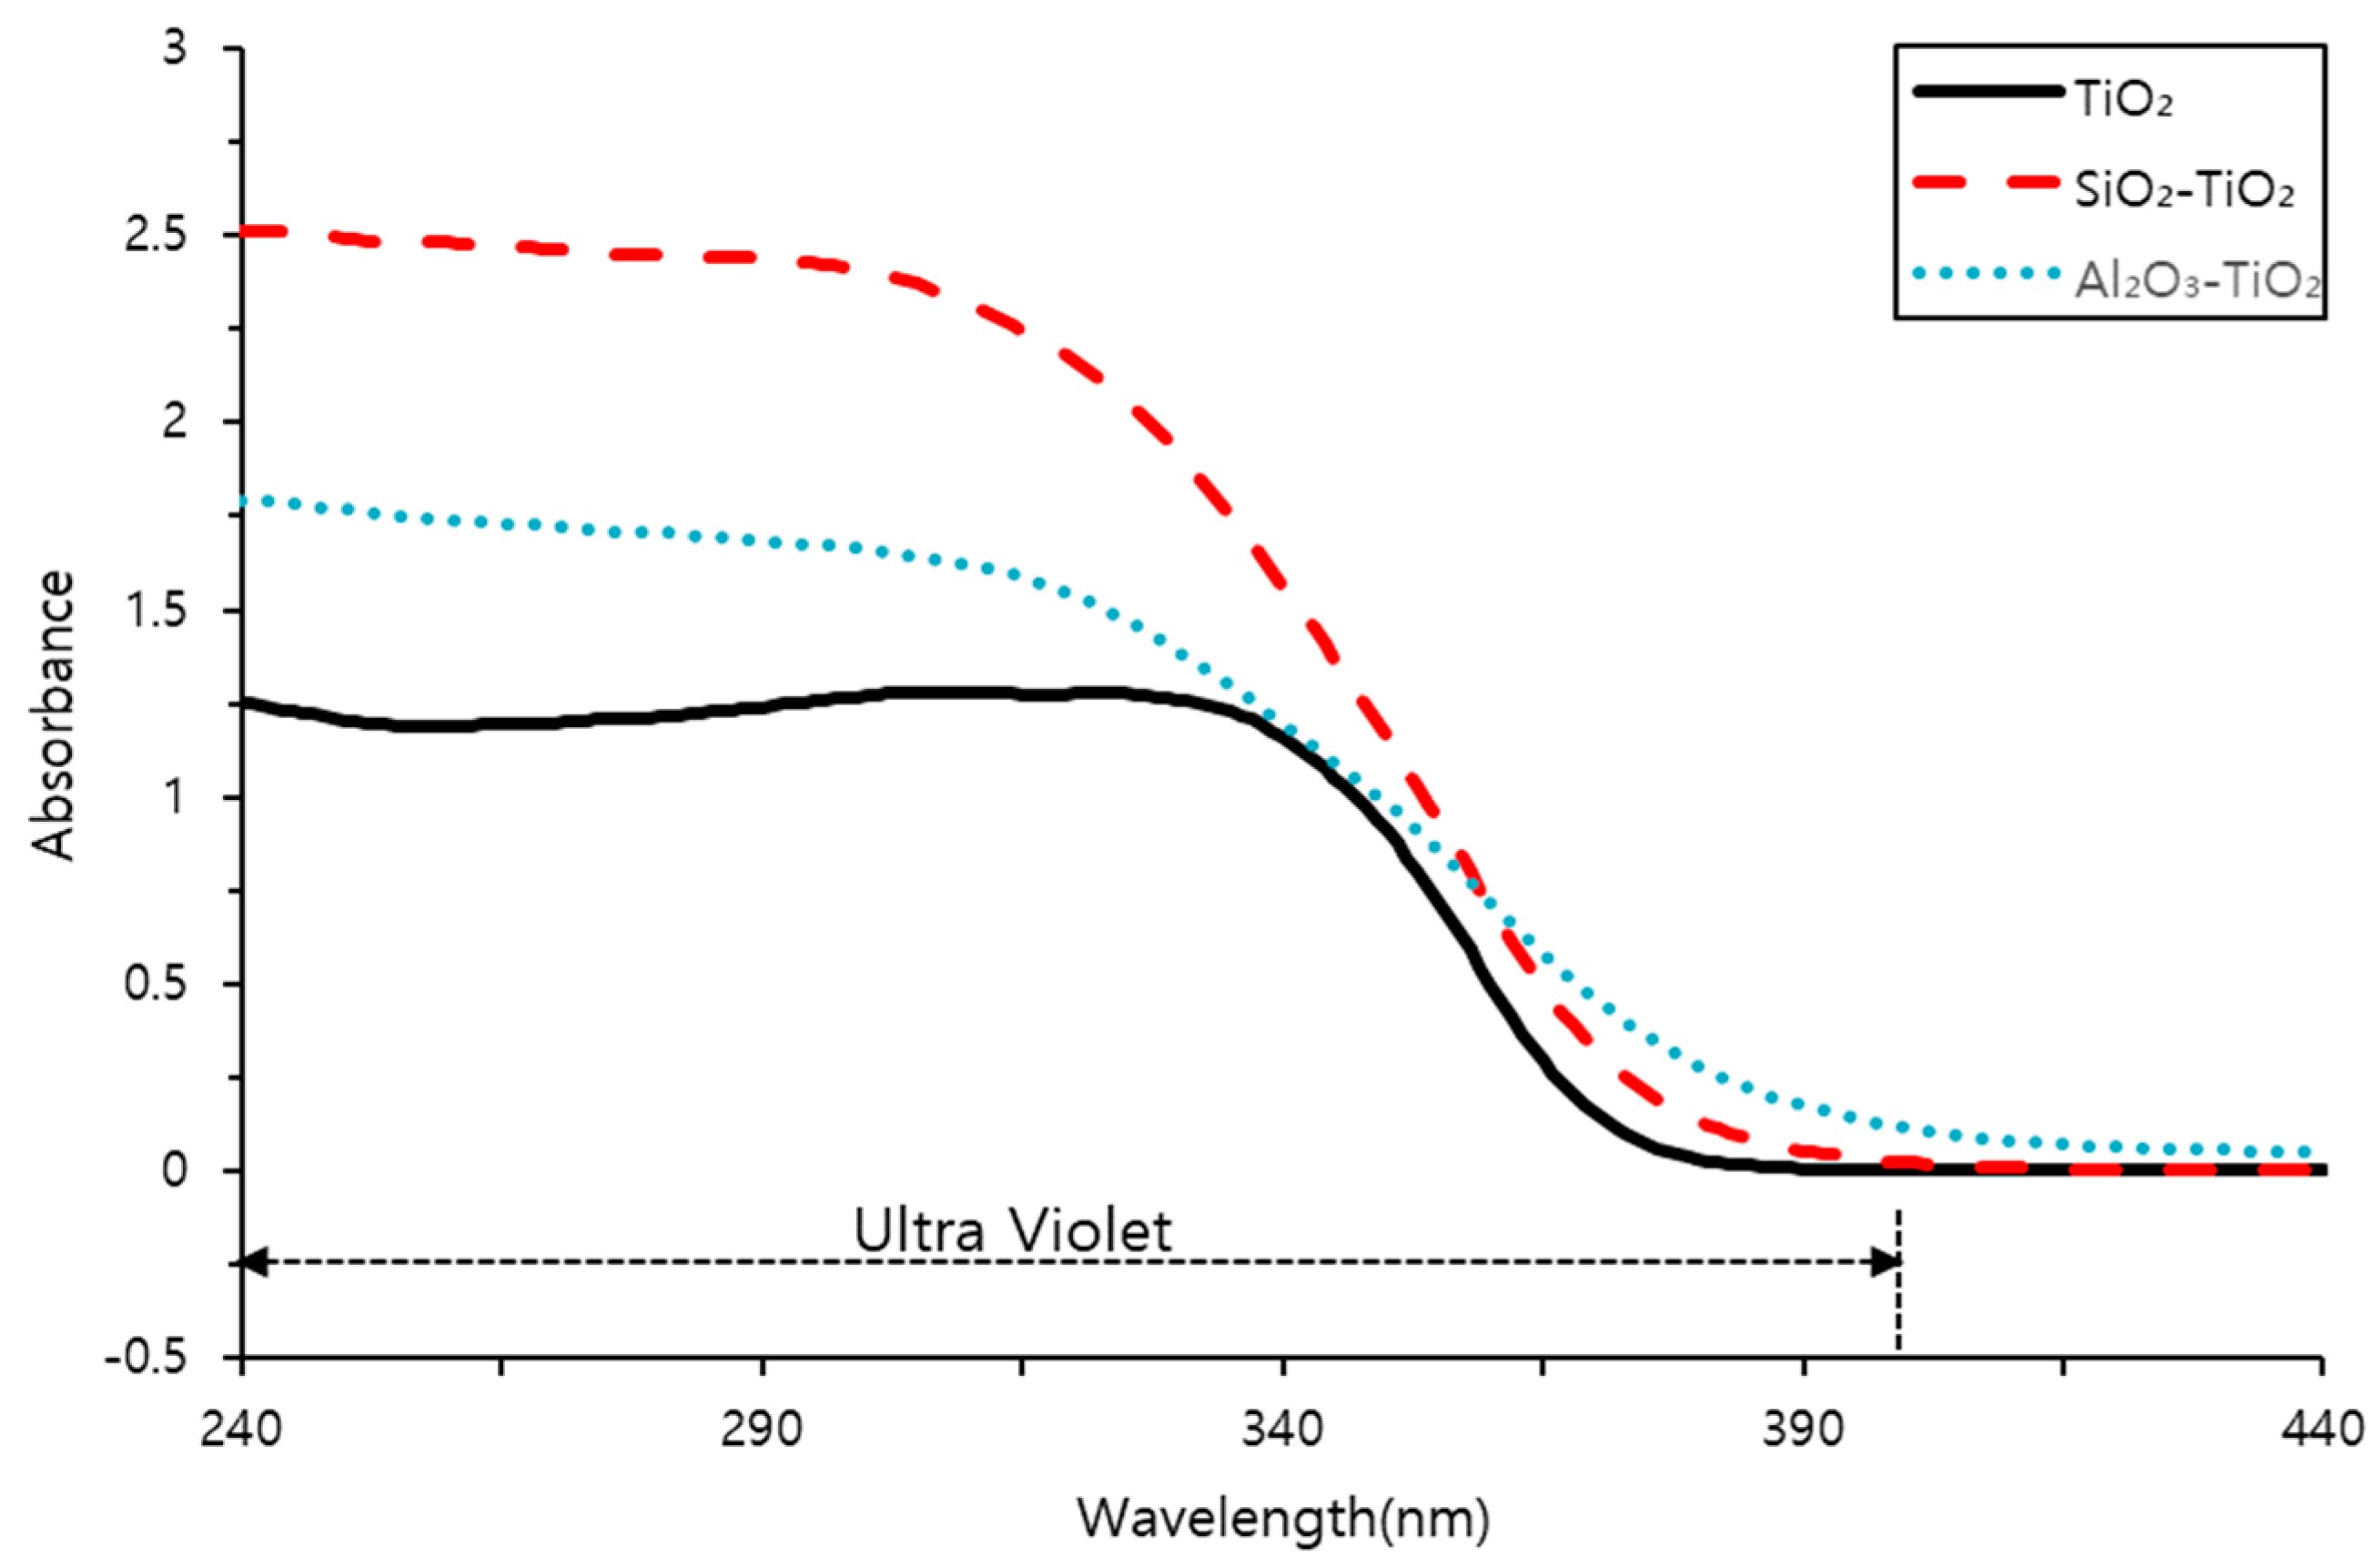
3.5. UV–VIS Analysis
UV fluorescence analysis was conducted on both commercial TiO2 and the NTCP, and the results are shown in Figure 9. A typical UV light induced photocatalyst is activated at wavelengths of 380 nm or below, triggering a photocatalytic reaction. The results show that the developed NTCP has a light absorption peak at wavelengths of 380 nm or below, and its absorbance is much larger than that of commercial TiO2.
The major findings of the present study confirmed that the developed NTCP is capable of being activated when illuminated by light at wavelengths of 380 nm or below (UV light spectrum) and, thus, will perform as an efficient photocatalyst to decompose NOx.
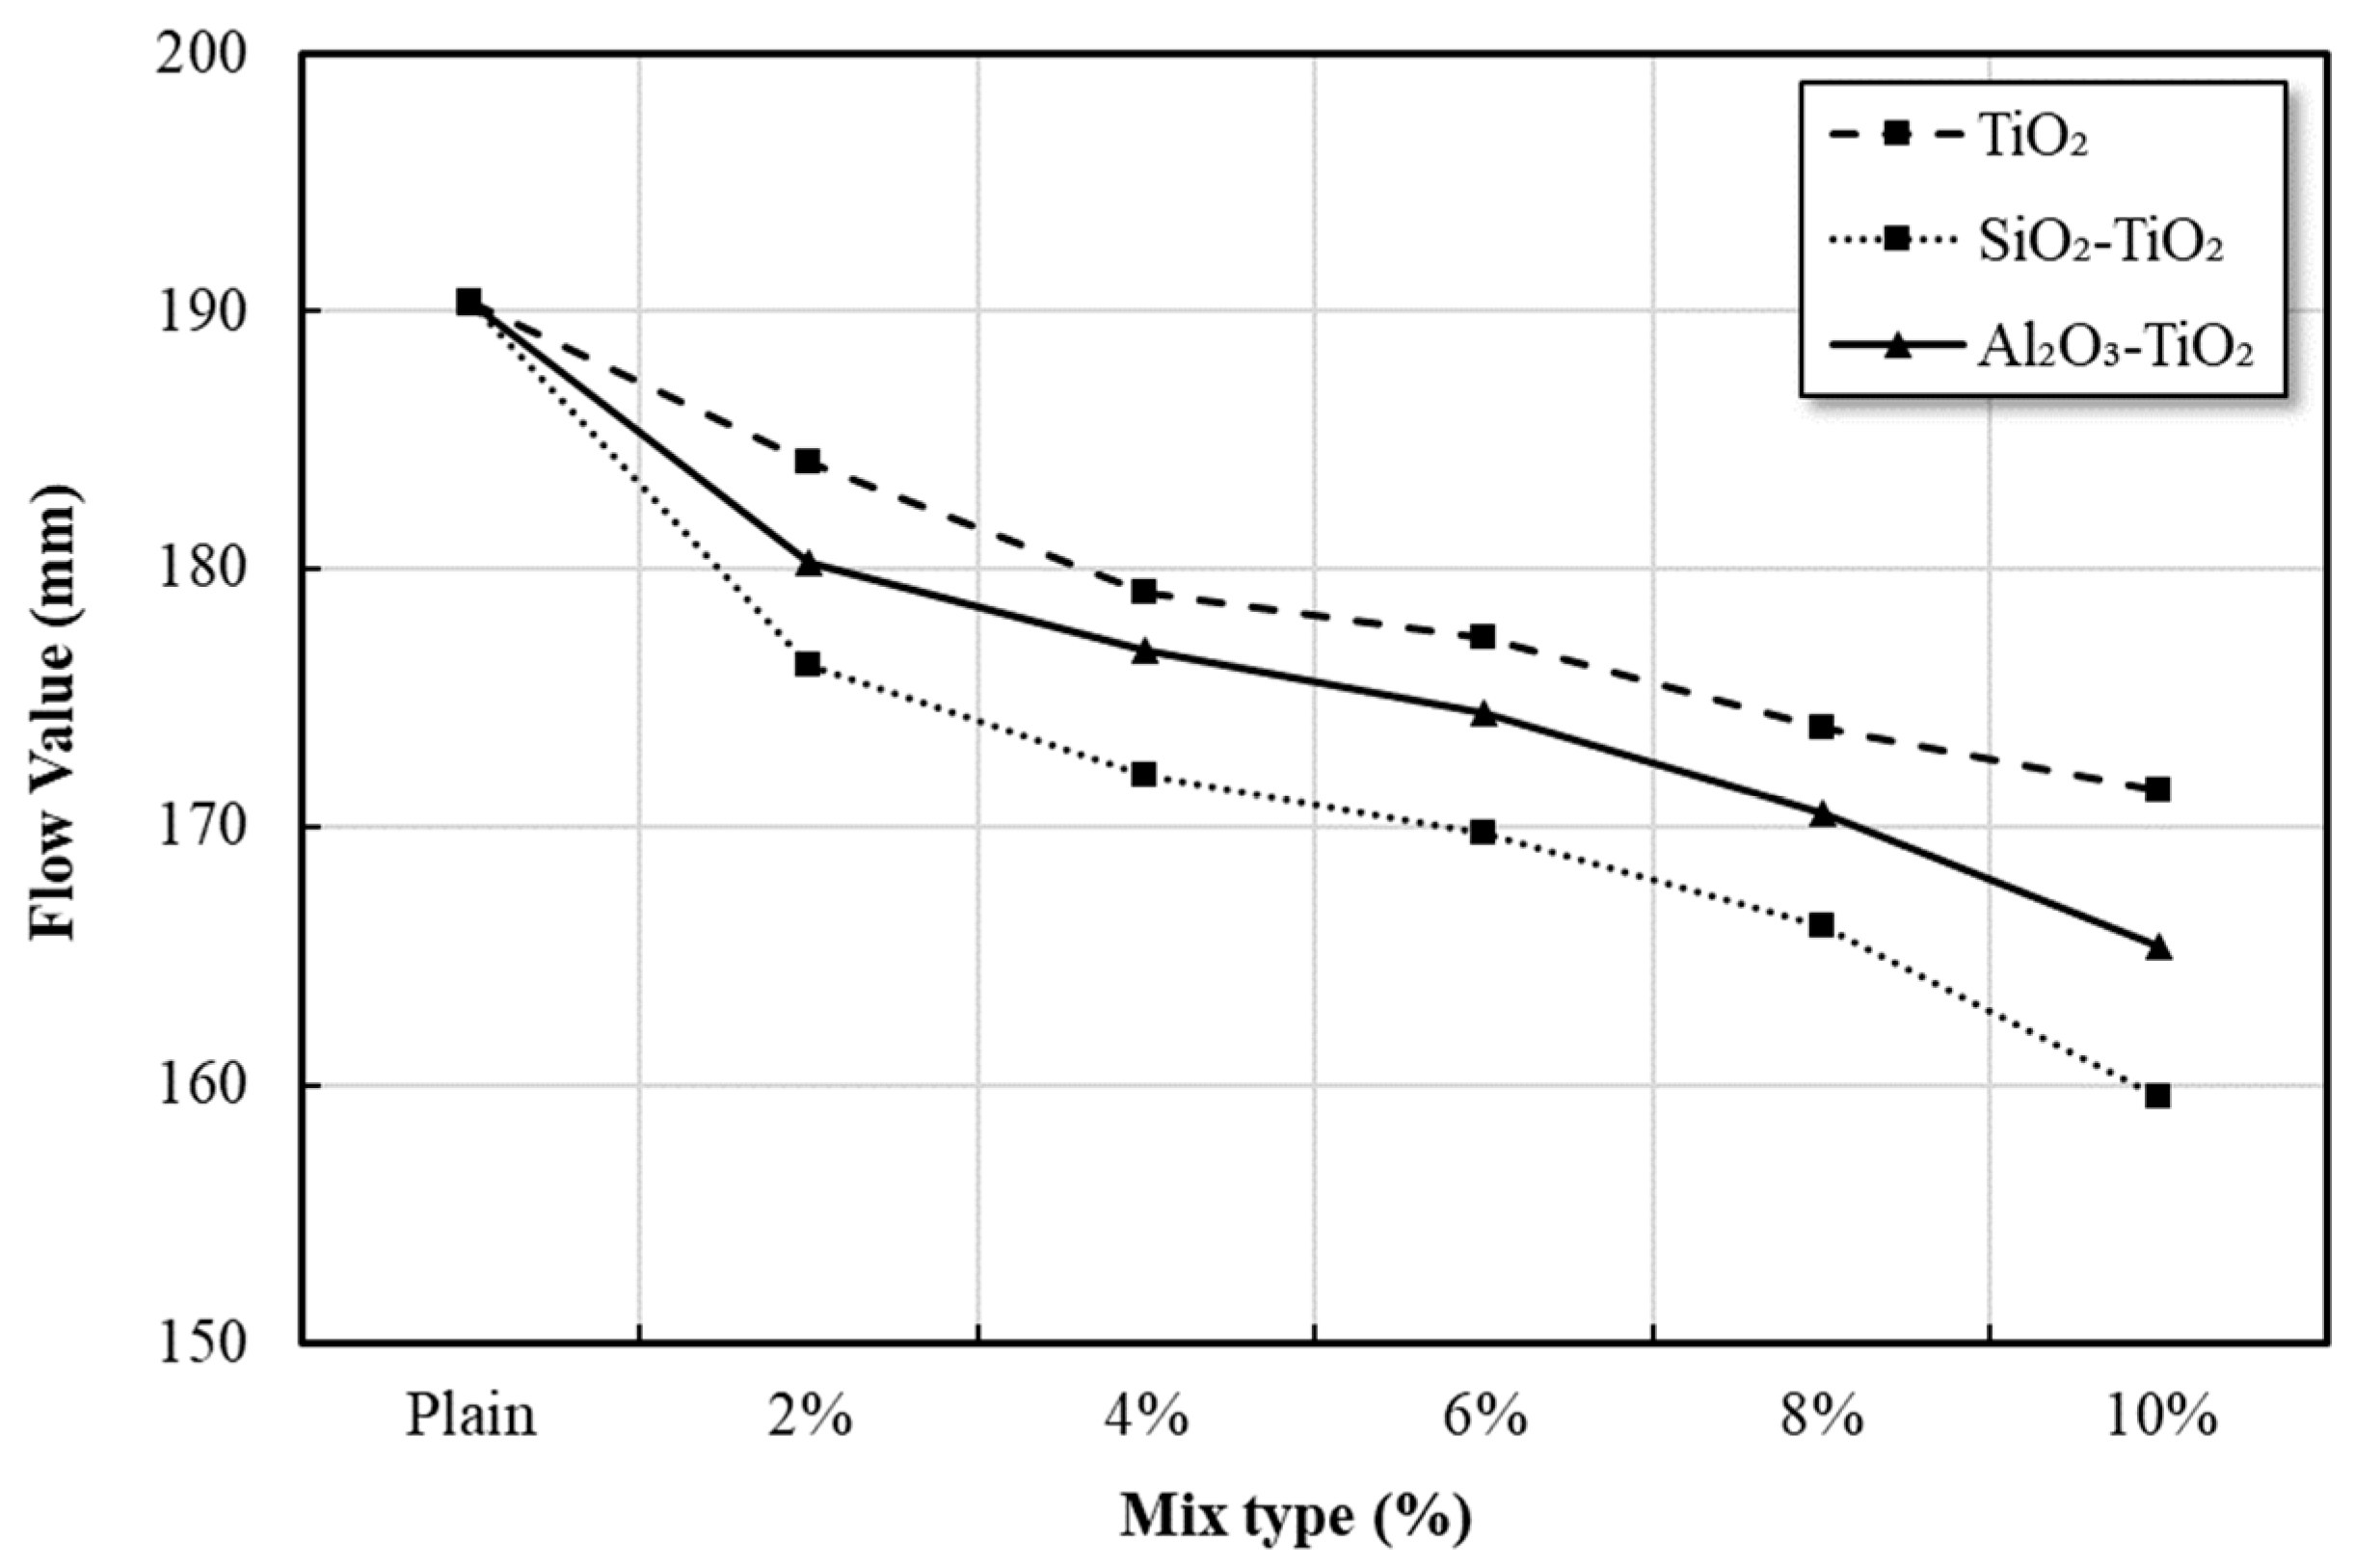
3.6. Flowability of Mortars
The flow ability characteristics of mortar mixed with commercial TiO2 and NTCP are shown in Figure 10. The Figure shows the influence of nano powder content on the flowability of mixtures at constant water to binder ratio of 50%. The results show that all the mixes blended with nano powder showed a decline in flow value as the percentage of nano powders increased in the mix. The decrease in the flowability was most evident in SiO2-TiO2 powder mortar mix.
The reason for this decrease in the flow value is because the specific surface area mixed with mortar and the surface of the nanoparticle with a large volume ratio binds a large number of water molecules, which rapidly reduces free water. In the case of nanoparticles, the larger the specific surface area, the more pronounced the adsorption or other reactions [31,32]. In particular, as the pore size decreases, the potentials in the pores overlap to increase the adsorption strength [33]. As shown in Table 7, the size of the pores of the SiO2-TiO2 and Al2O3-TiO2 powders used in the mortar mixtures was measured to be 48 Å and 55 Å, respectively, which were smaller than 82 Å of commercial TiO2. Therefore, the flowability decreased by rapidly reducing the free water in the mortar as the surface of the NTCP that has a relatively large specific surface area and volume ratio and stronger adsorption strength than the commercial TiO2 binds and adsorbs a large number of water molecules.
3.7. Strengths
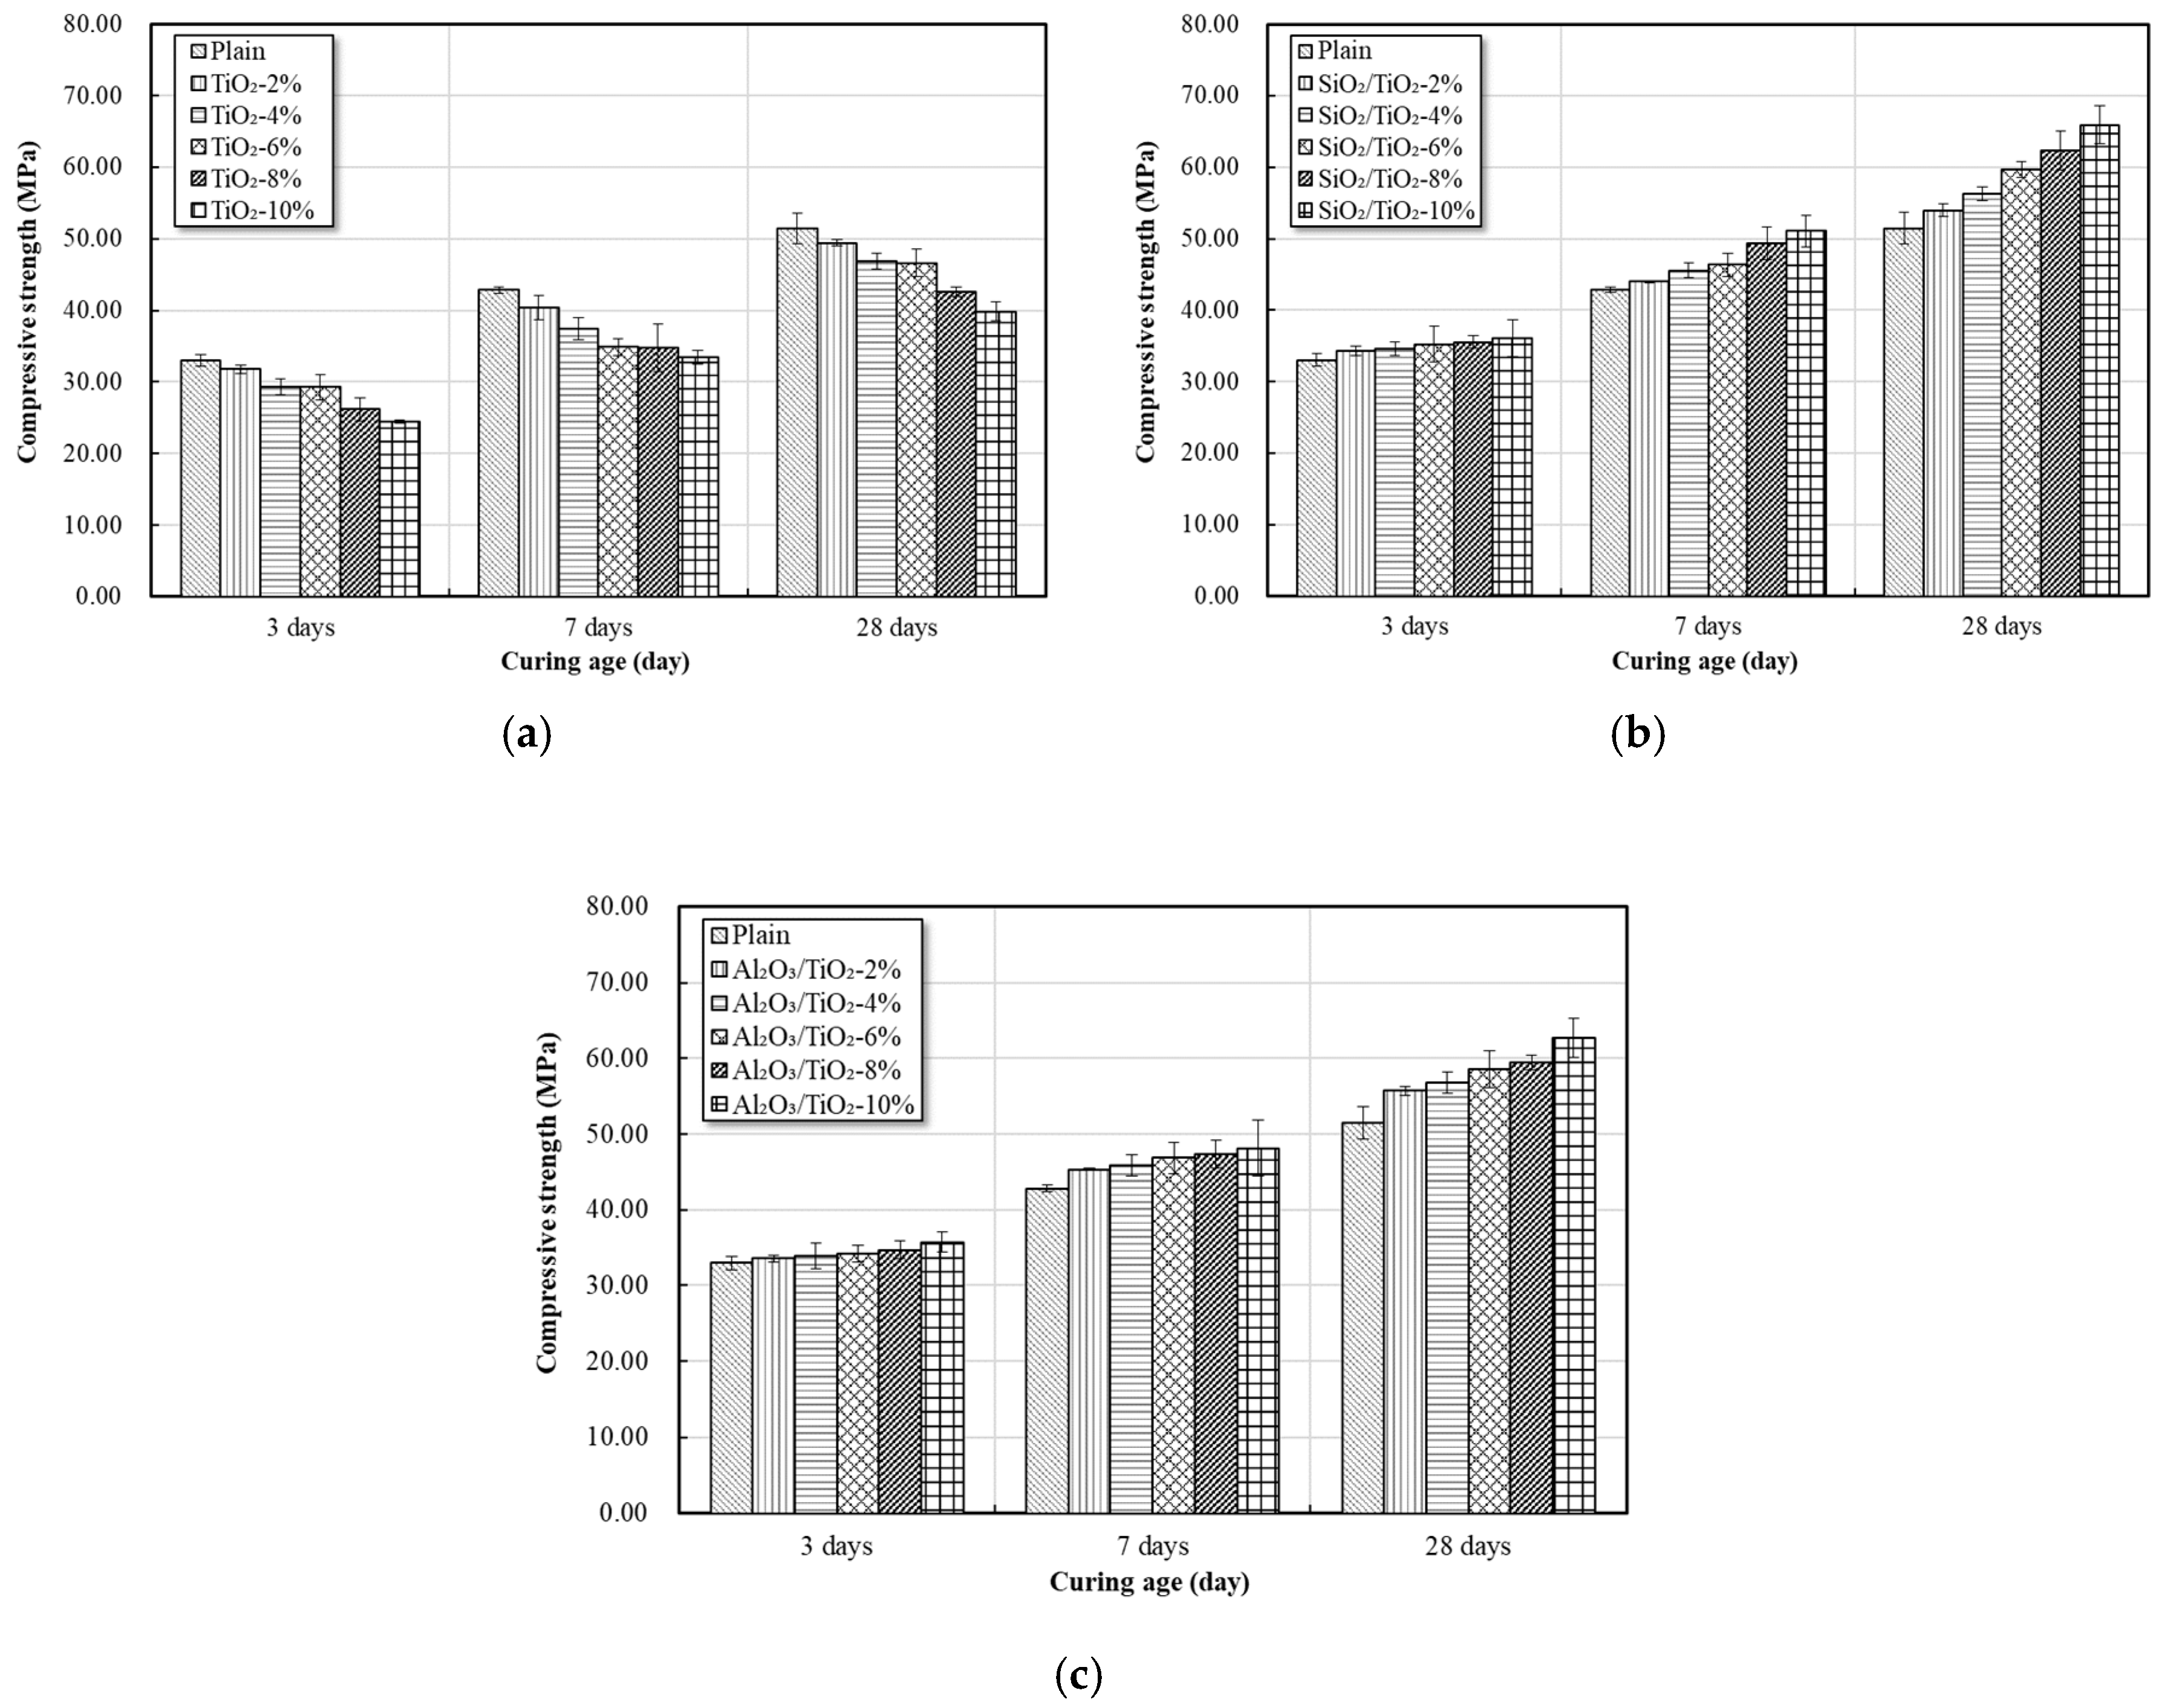
The seven-day, 14-day, and 28-day strengths of mortar produced with partial replacement of each mix (0 to 10%) were measured, as shown in Figure 11 and Figure 12.
As the replacement ratio of commercial TiO2 increased, a decrease in the compressive strength was observed, and the compressive strength increased according to the replacement ratio of the NTCP. In all mixes, the compressive strength tended to increase as the curing age increased.
In the case of replacing commercial TiO2 at the early curing age of three days, the compressive strength decreased by 3.6–25.8% compared to plain, and the compressive strength increased up to 9.3% when replacing SiO2-TiO2 powder and up to 8.3% when replacing Al2O3-TiO2 powder.
At the curing age of seven days, in the case of replacing commercial TiO2, the compressive strength decreased as the replacement ratio increased, showing a decrease in strength by 5.7–21.8% compared to plain. In the case of using SiO2-TiO2 powder, the compressive strength increased by 2.7–19.2% as the replacement ratio increased. The compressive strength also increased by 5.8–12.4% when using Al2O3-TiO2 powder.
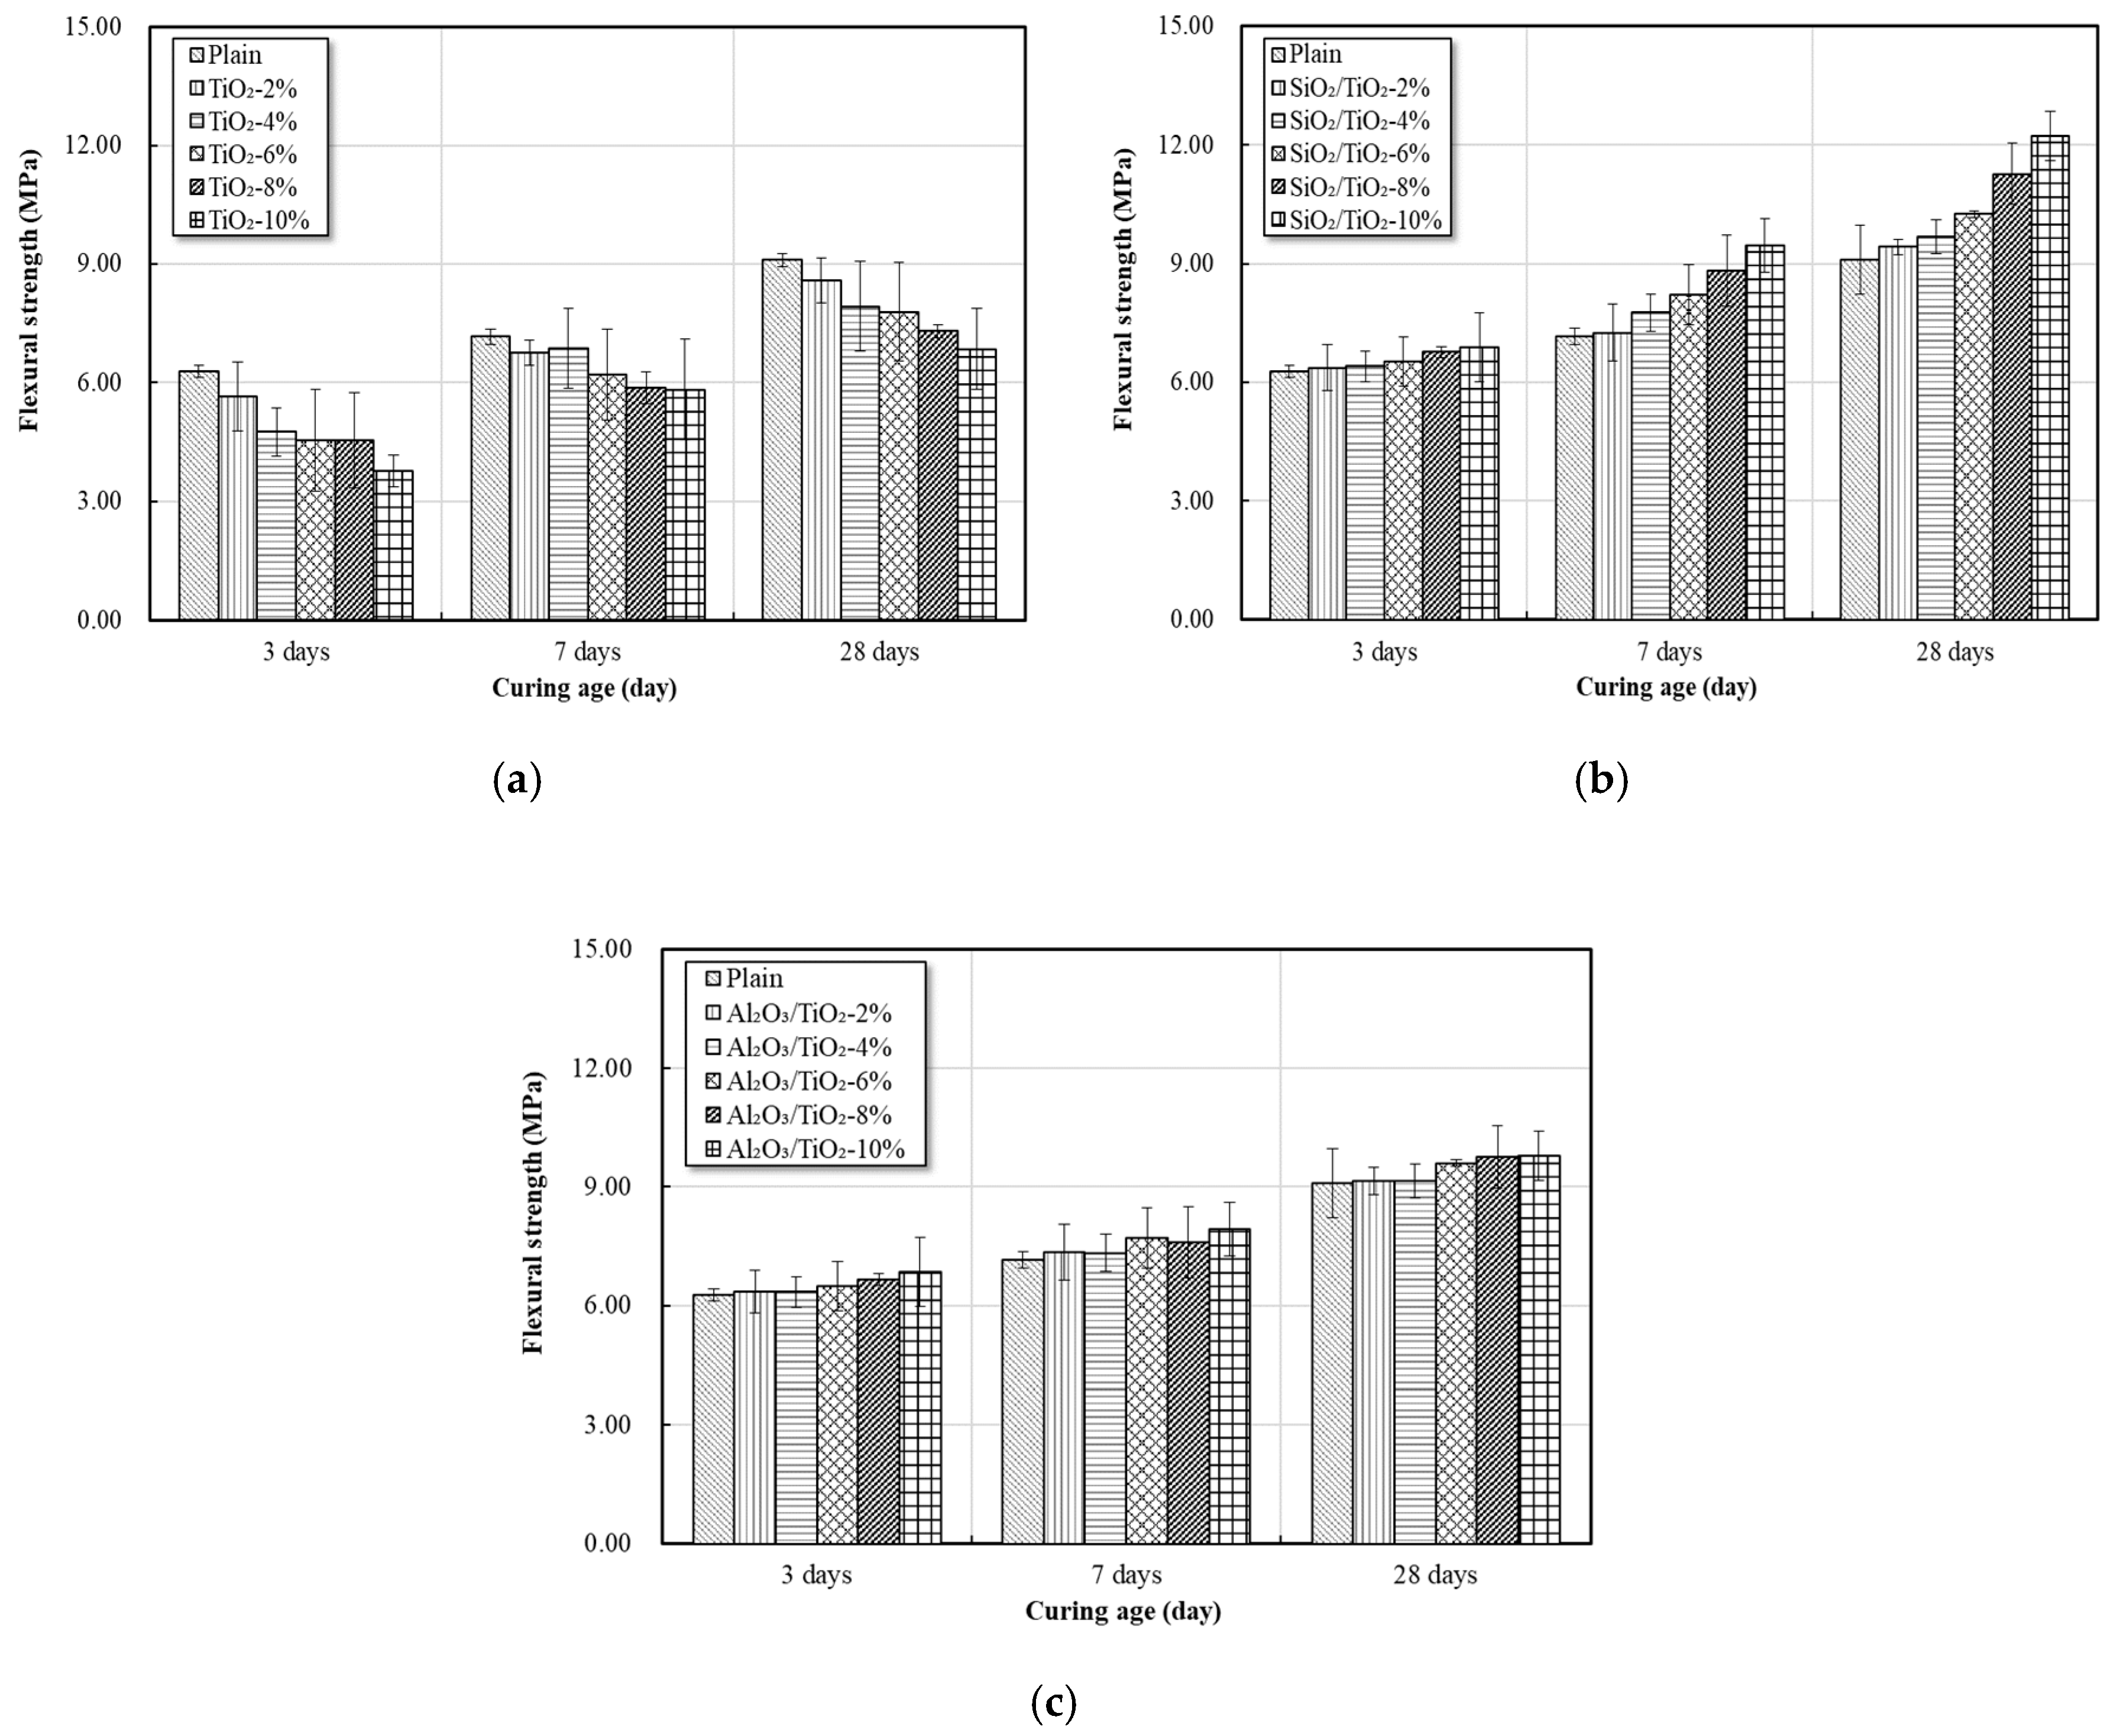
At the curing age of 28 days, the compressive strength decreased by 3.9–22.6% in the case of replacing commercial TiO2, and similar to the results of the third and seventh days, the compressive strength decreased as the replacement ratio increased. In the case of using SiO2-TiO2 powder, the compressive strength increased by 4.8–28% as the replacement ratio increased. The compressive strength also increased by 8.3–21.7% when using Al2O3-TiO2 powder. The flexural strength of each mix was similar to that of the compressive strength. The compressive strength and flexural strength decreased as the amount of replaced commercial TiO2 increased [34].
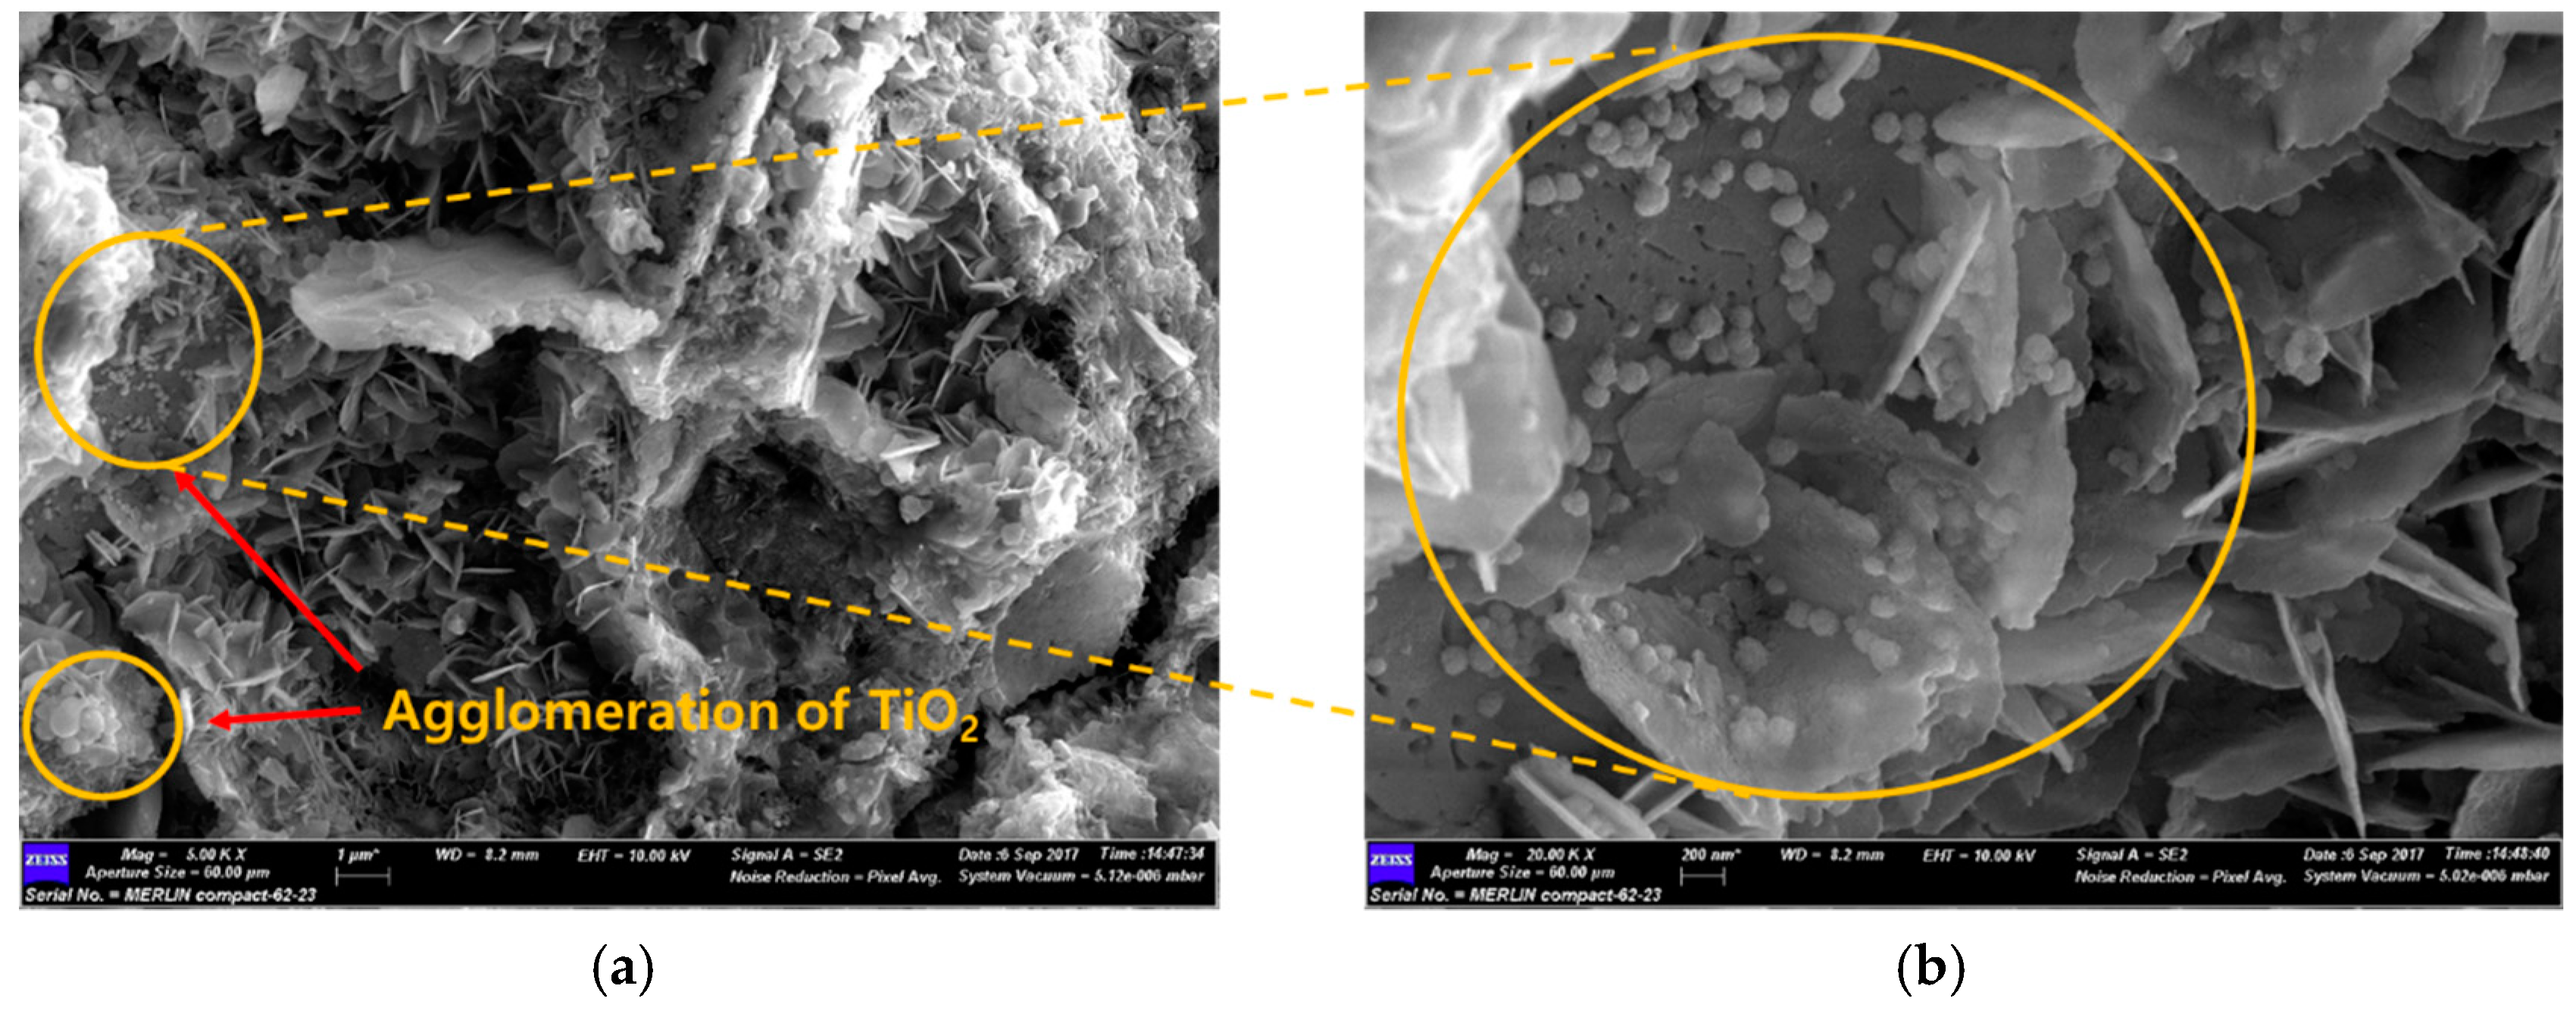
Figure 13 is a SEM image of mortar mixed with commercial TiO2. It is considered that commercial TiO2 is not uniformly distributed within the cement matrix, but exists in a concentrated form in the hydrate, which interferes with the hydration reaction of the cement and, therefore, the strength development is not achieved. In particular, as the mixing amount of commercial TiO2 increases, the size and number of aggregates increase, which is likely to contribute as stress raisers that reduce the strength of mortar [35].
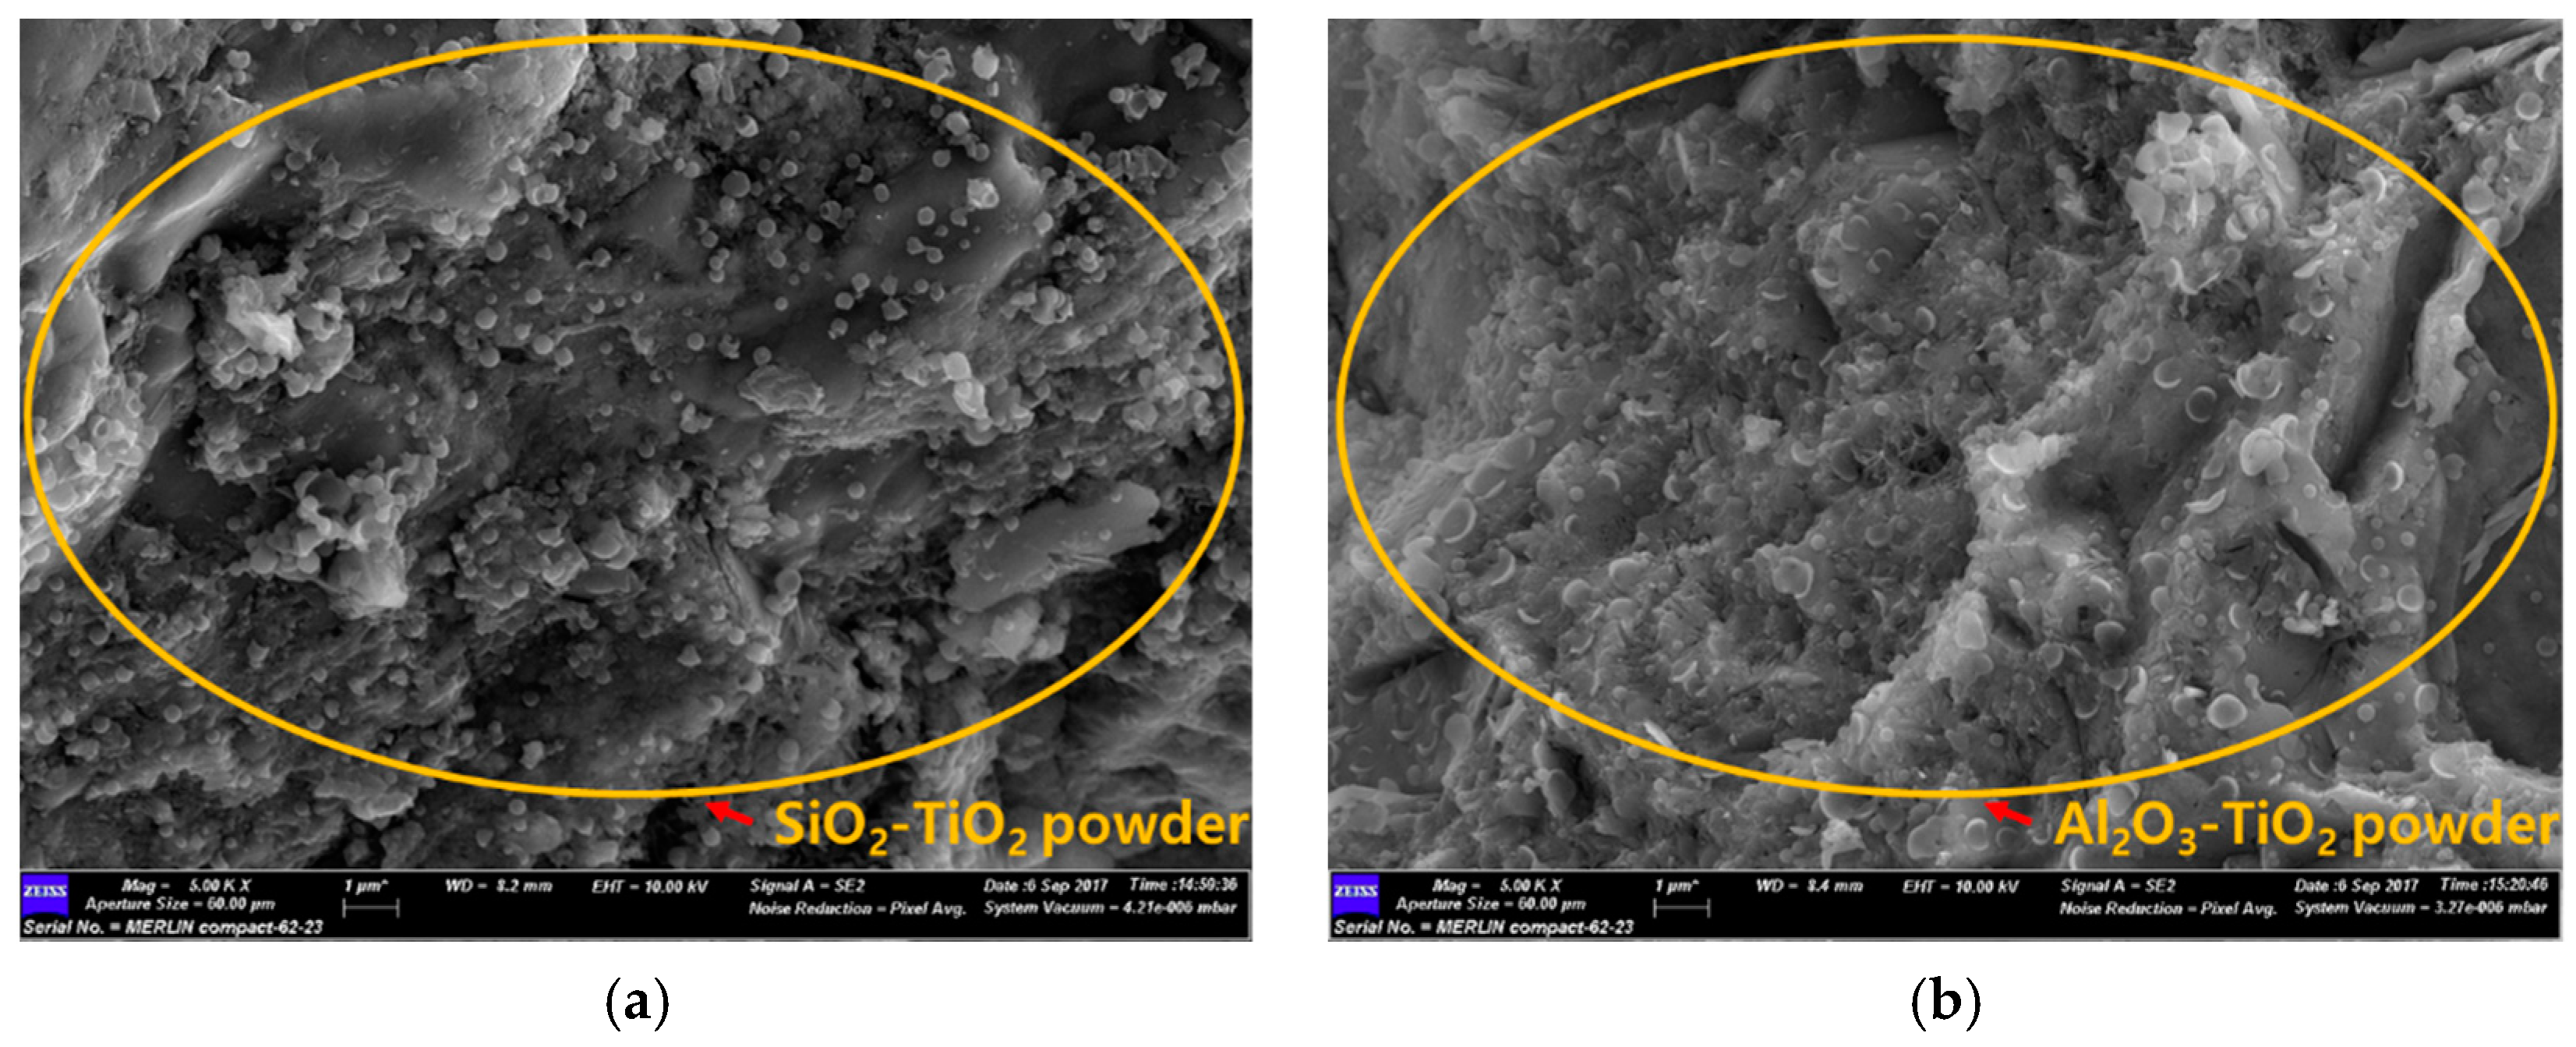
On the other hand, when replacing SiO2-TiO2 powder and Al2O3-TiO2 powder, the flexural strength and compressive strength tended to increase as the amount of replacement increased. Unlike commercial TiO2, the NTCP is uniformly dispersed within the cement matrix as shown in Figure 14. This is because the NTCP modified by SiO2 and Al2O3 used as support materials produces Ti-O-Si and Ti-O-Al bond and generates more negative charges that can be dispersed in the matrix.
In addition, the influence of the NTCP in the matrix can be determined by the Ca(OH)2 (CH) orientation. The CH orientation can be calculated according to the calculation given in [34]. After obtaining the CH (001) and (101) crystal face peak intensities through XRD, it is defined by the orientation index R according to the following Equation (1):
where I(001) and I(101) are the (001) and (101) crystal face peak intensities, respectively. The results are shown in Table 8. The orientation index of CH decreased when the NTCP was mixed. At day 1, the indices of CH in OPC, TiO2, SiO2-TiO2, and Al2O3-TiO2 are 3.7, 2.7, 2.1, and 2.3, respectively. At day 7, the indices of CH in OPC, TiO2, SiO2-TiO2, and Al2O3-TiO2 are 3.6, 3.5, 1.8, and 1.9, respectively. The results reveal that NTCP can decrease the orientation of CH crystals in matrix.
R = 1.35 I(001)/I(101)
This is due to the pozzolanic reaction between SiO2, Al2O3, and CH used as support materials. This reaction consumes some of the CH, promotes the hydration reaction, and can generate more calcium silicate hydrate (C-S-H) and calcium aluminate hydrate (C-A-H) [36,37].
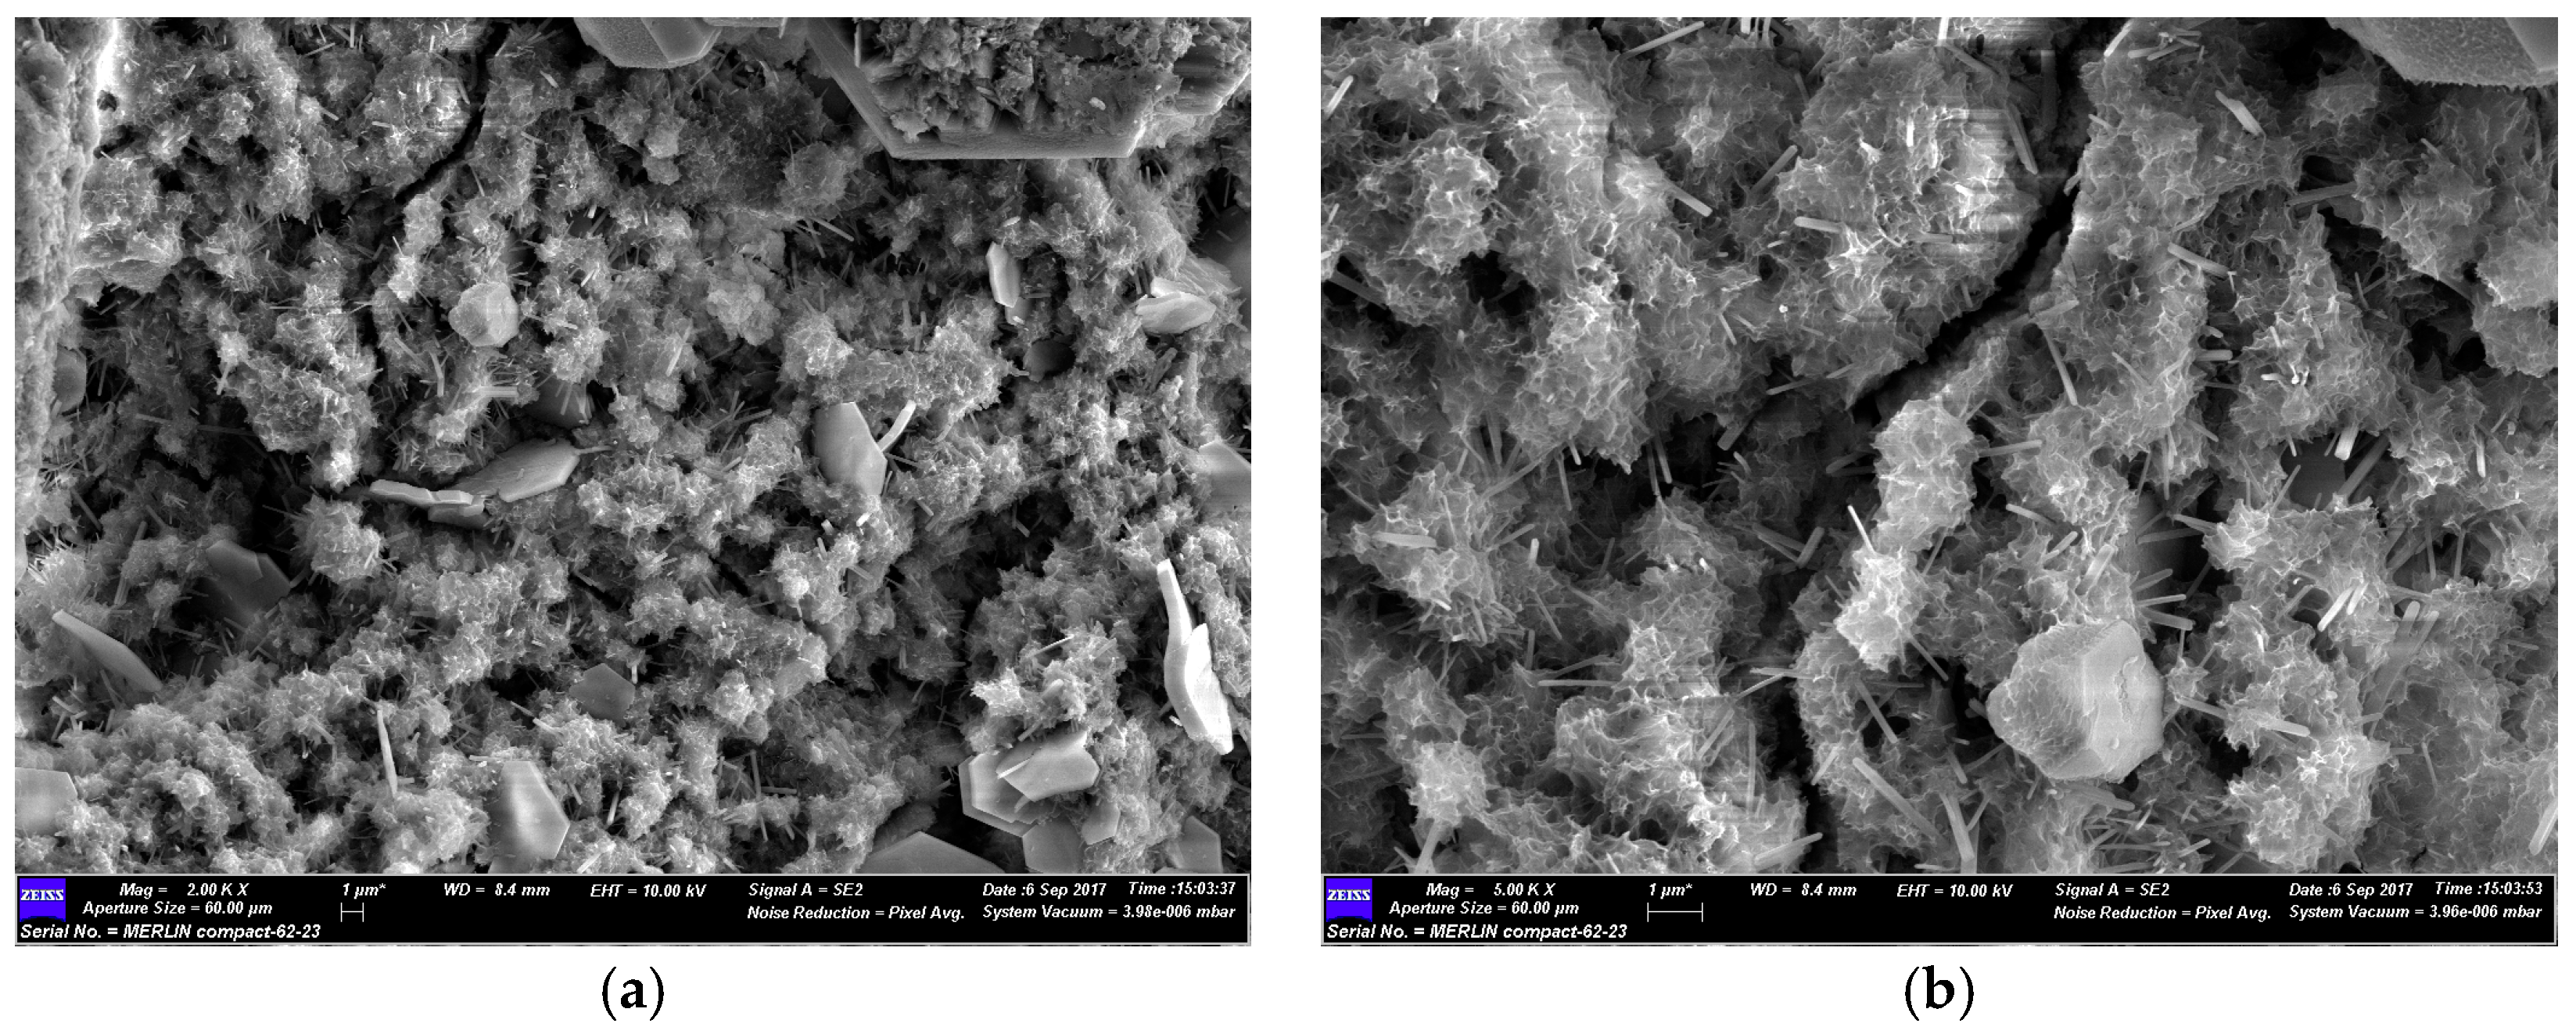
As shown in Figure 15, the C-S-H and C-A-H formed by the pozzolanic reaction attach to the surface of the NTCP and promote a nucleation effect. Therefore, the CH crystals in the mortar can be refined to reduce the negative impact on the matrix strength by CH. In addition, the strength of mortar is considered to be improved because the matrix is smaller which increases the density to reduce the filling effect and the number of harmful holes [38].
4. Conclusions
The purpose of this study is to increase the use of TiO2 as a construction material as part of the research to purify air pollution. To that end, NTCP was synthesized by coating SiO2 and Al2O3 support materials with TiO2. Subsequently, the developed NTCP and commercial TiO2 were analyzed and compared. Major finding of the present study are as follows:
- (1)
- XRD, SEM, and TEM analyses confirmed that the NTCP developed in the present study was anatase phase spherical particles. Its particles were smaller and more uniform in size than the commercial TiO2, and the average particle size of the SiO2-TiO2 powder and Al2O3-TiO2 powder was 8.36 nm and 9.42 nm, respectively. UV absorption test results showed the developed NTCP had a light absorption peak at wavelengths of 380 nm or below, and its absorbance was much larger than that of commercial TiO2.
- (2)
- As a result of the flow test, the flow value decreased as the replacement ratio of the NTCP increased. The reason for this decrease in the flow value is because the adsorption strength increased and combined a large number of water molecules. indicating that it is necessary to use a proper admixture according to each mix.
- (3)
- As a result of the strength test, the pozzolanic reaction by SiO2 and Al2O3 used as support materials produced many C-S-H and C-A-H. In addition, NTCP has shown an increased strength to that of plain and commercial TiO2 mortar by promoting a nucleation effect and reducing the filling effect and the number of harmful holes in the mortar.
- (4)
- This study fabricated a NTCP and evaluated the performance, and the results showed that the performance was equal to or better than the existing products when applied to mortar. In addition to quantitative studies on pozzolan reactions within the mortar matrix that applies NTCP, evaluation test on NOx removal performance should also be conducted for use on site.
Author Contributions
Methodology: J.-W.L. and Y.-I.J.; experiment: J.-W.L. and Y.-I.J.; validation: Y.-I.J.; formal analysis: J.-W.L., Y.-I.J., and B.-J.L.; investigation: J.-W.L. and Y.-I.J.; data curation: J.-W.L. and Y.-I.J.; writing—original draft preparation: J.-W.L., Y.-I.J., and B.-J.L.; writing—review and editing: S.-W.K., W.-S.P., B.-J.L., and Y.-I.J.; visualization: J.-W.L. and B.-J.L.; supervision: S.-W.K., W.-S.P., and Y.-I.J.; project administration: Y.-I.J.
Funding
This research was supported by Basic Science Research Program through the National Research Foundation of Korea (NRF) funded by the Ministry of Edu-cation (no. 2015R1D1A1A01058109 and 2018R1D1A1A09082743).
Conflicts of Interest
The authors declare no conflict of interest.
References
- Kan, H.; London, S.J.; Chen, G.; Zhang, Y.; Song, G.; Zhao, N.; Jiang, L.; Chen, B. Season, sex, age, and education as modifiers of the effects of outdoor air pollution on daily mortality in Shanghai, China: The Public Health and Air Pollution in Asia (PAPA) study. Environ. Health Perspect. 2008, 116, 1183–1188. [Google Scholar] [CrossRef]
- Chen, B.; Hong, C.; Kan, H. Exposures and health outcomes from outdoor air pollutants in China. Toxicology 2004, 198, 291–300. [Google Scholar] [CrossRef]
- Hong, S.J.; Lee, S.W. An Experimental Study for the Construction of Photocatalytic Method Concrete Road Structure. J. Korean Soc. Road Eng. 2013, 15, 1–9. [Google Scholar] [CrossRef]
- Fujishima, A.; Rao, T.N.; Tryk, D.A. Titanium dioxide photocatalysis. J. Photochem. Photobiol. C Photochem. Rev. 2017, 1, 5525. [Google Scholar] [CrossRef]
- Henderson, M.A. A surface science perspective on TiO2 photocatalysis. Surf. Sci. Rep. 2011, 66, 185–297. [Google Scholar] [CrossRef]
- Guo, M.-Z.; Ling, T.-C.; Poon, C.-S. TiO2-based self-compacting glass mortar: Comparison of photocatalytic nitrogen oxide removal and bacteria inactivation. Build. Environ. 2012, 53, 1–6. [Google Scholar] [CrossRef]
- Guo, M.-Z.; Ling, T.-C.; Poon, C.-S. Nano-TiO2-based architectural mortar for NO removal and bacteria inactivation: Influence of coating and weathering conditions. Cem. Concr. Compos. 2013, 36, 101–108. [Google Scholar] [CrossRef]
- Jameel, Z.N.; Haider, A.J.; Taha, S.Y.; Gangopadhyay, S.; Bok, S. Evaluation of hybrid sol-gel incorporated with nanoparticles as nano paint. In AIP Conference Proceedings; AIP Publishing: Beirut, Lebanon, 2016; Volume 1758, p. 020001. [Google Scholar]
- Haider, A.J.; Materials, A.; Materials, A. Synthesis and Characterization of TiO2 Nanoparticles via Sol-Gel Method by Pulse Laser Ablation. Eng. Technol. J. 2015, 33, 761–771. [Google Scholar]
- Sirimahachai, U.; Phongpaichit, S.; Wongnawa, S. Evaluation of bactericidal activity of TiO2 photocatalysts: A comparative study of laboratory-made and commercial TiO2 samples. Songklanakarin J. Sci. Technol. 2009, 31, 517–525. [Google Scholar]
- Qi, M.; Yang, D.; Zhang, J.; Forum, H.A.-M.S. Undefined Preparation and Characterization of Zn-Containing Hydroxyapatite/TiO2 Composite Coatings on Ti Alloys. Trans. Tech. Publ. 2011, 685, 367–370. [Google Scholar]
- Balbuena, J.; Sánchez, L.; Cruz-Yusta, M. Use of Steel Industry Wastes for the Preparation of Self-Cleaning Mortars. Materials 2019, 12, 621. [Google Scholar] [CrossRef] [PubMed]
- Poon, C.S.; Cheung, E. NO removal efficiency of photocatalytic paving blocks prepared with recycled materials. Constr. Build. Mater. 2007, 21, 1746–1753. [Google Scholar] [CrossRef]
- Chen, J.; Poon, C. Photocatalytic construction and building materials: From fundamentals to applications. Build. Environ. 2009, 44, 1899–1906. [Google Scholar] [CrossRef]
- Chen, J.; Poon, C.S. Photocatalytic activity of titanium dioxide modified concrete materials—Influence of utilizing recycled glass cullets as aggregates. J. Environ. Manag. 2009, 90, 3436–3442. [Google Scholar] [CrossRef]
- Guo, M.Z.; Poon, C.S. Photocatalytic NO removal of concrete surface layers intermixed with TiO2. Build. Environ. 2013, 70, 102–109. [Google Scholar] [CrossRef]
- Beeldens, A. An environmental friendly solution for air purification and self-cleaning effect: the application of TiO2 as photocatalyst in concrete. In Proceedings of the Transport Research Arena Europe–TRA, Göteborg, Sweden, 12–16 June 2006. [Google Scholar]
- Available online: http://www.italcementigroup.com/NR/rdonlyres/B5F973F4-8D01-4796-ACEC-1A960C71092E/0/QA_UK.Pdf (accessed on 18 January 2019).
- Verdier, T.; Coutand, M.; Bertron, A.; Roques, C. Antibacterial activity of TiO2 photocatalyst alone or in coatings on E. coli: The influence of methodological aspects. Coatings 2014, 4, 670–686. [Google Scholar] [CrossRef]
- Ba-Abbad, M.M.; Kadhum, A.A.H.; Mohamad, A.B.; Takriff, M.S.; Sopian, K. Synthesis and catalytic activity of TiO2 nanoparticles for photochemical oxidation of concentrated chlorophenols under direct solar radiation. Int. J. Electrochem. Sci. 2012, 7, 4871–4888. [Google Scholar]
- Kim, Y.K.; Hong, S.J.; Lee, K.B.; Lee, S.W. Evaluation of NOx Removal Efficiency of Photocatalytic Concrete for Road Structure. J. Korean Soc. Road Eng. 2014, 16, 49–58. [Google Scholar] [CrossRef]
- Murata, Y.; Kamitani, K.; Takeuchi, K. Air purifying blocks based on photocatalysis. In Proceedings of the Japan Interlocking Block Pavement Engineering Association World Congress, Tokyo, Japan, 16–19 July 2000. [Google Scholar]
- Guo, M.-Z.; Ling, T.-C.; Poon, C.S. Photocatalytic NOx degradation of concrete surface layers intermixed and spray-coated with nano-TiO2: Influence of experimental factors. Cem. Concr. Compos. 2017, 83, 279–289. [Google Scholar] [CrossRef]
- Han, B.; Li, Z.; Zhang, L.; Zeng, S.; Yu, X.; Han, B.; Ou, J. Reactive powder concrete reinforced with nano SiO2-coated TiO2. Constr. Build. Mater. 2017, 148, 104–112. [Google Scholar] [CrossRef]
- Kamaruddin, S.; Stephan, D. Sol-gel mediated coating and characterization of photocatalytic sand and fumed silica for environmental remediation. Water Air Soil Pollut. 2014, 225, 1948. [Google Scholar] [CrossRef]
- Park, O.K.; Kang, Y.S.; Jo, B.G. Synthesis of TiO2 nanoparticles coated with SiO2 for suppression of photocatalytic activity and increased dispersion stability. J. Industr. Eng. Chem. 2004, 10, 733–738. [Google Scholar]
- Liu, Y.L.; Cao, C.C.; Chen, J. Preparation of Photocatalyst of Nano-TiO2 Coating on SiO2 carriers and its Photocatalytic Activity. Adv. Mater. Res. 2013, 777, 77–81. [Google Scholar] [CrossRef]
- Rossi, E.M.; Pylkkänen, L.; Koivisto, A.J.; Vippola, M.; Jensen, K.A.; Miettinen, M.; Sirola, K.; Nykäsenoja, H.; Karisola, P.; Stjernvall, T.; et al. Airway Exposure to Silica-Coated TiO2 Nanoparticles Induces Pulmonary Neutrophilia in Mice. Toxicol. Sci. 2010, 113, 422–433. [Google Scholar] [CrossRef] [PubMed]
- Vohra, M.S.; Tanaka, K. Photocatalytic degradation of aqueous pollutants using silica-modified TiO2. Water Res. 2003, 37, 3992–3996. [Google Scholar] [CrossRef]
- Yuranova, T.; Sarria, V.; Jardim, W.; Rengifo, J.; Pulgarin, C.; Trabesinger, G.; Kiwi, J. Photocatalytic discoloration of organic compounds on outdoor building cement panels modified by photoactive coatings. J. Photochem. Photobiol. A Chem. 2007, 188, 334–341. [Google Scholar] [CrossRef]
- Alivisatos, A.P. Semiconductor Clusters, Nanocrystals, and Quantum Dots. Science 1996, 271, 933–937. [Google Scholar] [CrossRef]
- Vepřek, S. Electronic and mechanical properties of nanocrystalline composites when approaching molecular size. Thin Solid Films 1997, 297, 145–153. [Google Scholar] [CrossRef]
- Park, J.W.; Oh, H.C. Development of a Cost-Effective 20K Hydrogen BET Measurement for Nanoporous Materials. Korean J. Mater. Res. 2017, 27, 466–470. [Google Scholar] [CrossRef]
- Cerro-Prada, E.; García-Salgado, S.; Quijano, M.; Varela, F. Controlled Synthesis and Microstructural Properties of Sol-Gel TiO2 Nanoparticles for Photocatalytic Cement Composites. Nanomaterials 2019, 9, 26. [Google Scholar] [CrossRef]
- Collins, F.; Lambert, J.; Duan, W.H. The influences of admixtures on the dispersion, workability, and strength of carbon nanotube–OPC paste mixtures. Cem. Concr. Compos. 2012, 34, 201–207. [Google Scholar] [CrossRef]
- Qing, Y.; Zenan, Z.; Deyu, K.; Rongshen, C. Influence of nano-SiO2 addition on properties of hardened cement paste as compared with silica fume. Constr. Build. Mater. 2007, 21, 539–545. [Google Scholar] [CrossRef]
- Meng, T.; Yu, Y.; Qian, X.; Zhan, S.; Qian, K. Effect of nano-TiO2 on the mechanical properties of cement mortar. Constr. Build. Mater. 2012, 29, 241–245. [Google Scholar] [CrossRef]
- Qudoos, A.; Kim, H.; Ryou, J.S. Influence of Titanium Dioxide Nanoparticles on the Sulfate Attack upon Ordinary Portland Cement and Slag-Blended Mortars. Materials 2018, 11, 356. [Google Scholar] [CrossRef]
Figure 1.
Production process of NTCP.

Figure 2.
XRD pattern of commercial TiO2 and NTCP.

Figure 3.
SEM image of commercial TiO2, (a) commercial TiO2 (1000×); and (b) commercial TiO2 (50,000×).
Figure 3.
SEM image of commercial TiO2, (a) commercial TiO2 (1000×); and (b) commercial TiO2 (50,000×).

Figure 4.
SEM image of NTCP, (a) NTCP (1000×); and (b) NTCP (50,000×)

Figure 5.
TEM image of commercial TiO2 and NTCP (a) commercial TiO2 (b) SiO2-TiO2, and (c) Al2O3-TiO2.
Figure 5.
TEM image of commercial TiO2 and NTCP (a) commercial TiO2 (b) SiO2-TiO2, and (c) Al2O3-TiO2.

Figure 6.
Mapping image of NTCP (a) Ti (b) Si (c) Al.

Figure 7.
TEM image of Al2O3-TiO2 (a) TEM photo. (b) Magnifying TEM photo and (c) its fast Fourier transform (FFT) pattern.
Figure 7.
TEM image of Al2O3-TiO2 (a) TEM photo. (b) Magnifying TEM photo and (c) its fast Fourier transform (FFT) pattern.

Figure 8.
TEM image of SiO2-TiO2 (a) TEM photo. (b) Magnifying TEM photo and (c) its fast Fourier transform (FFT) pattern.
Figure 8.
TEM image of SiO2-TiO2 (a) TEM photo. (b) Magnifying TEM photo and (c) its fast Fourier transform (FFT) pattern.

Figure 9.
UV–VIS absorbance of commercial TiO2 and NTCP.

Figure 10.
Effects of addition ratio of commercial TiO2 and NTCP on cement mortar flow value.

Figure 11.
Effects of addition ratio of nano powder on compressive strength, (a) commercial TiO2; (b) SiO2-TiO2 powder; and (c) Al2O3-TiO2 powder.
Figure 11.
Effects of addition ratio of nano powder on compressive strength, (a) commercial TiO2; (b) SiO2-TiO2 powder; and (c) Al2O3-TiO2 powder.

Figure 12.
Effects of addition ratio of nano powder on flexural strength, (a) commercial TiO2; (b) SiO2-TiO2 powder; and (c) Al2O3-TiO2 powder.
Figure 12.
Effects of addition ratio of nano powder on flexural strength, (a) commercial TiO2; (b) SiO2-TiO2 powder; and (c) Al2O3-TiO2 powder.

Figure 13.
SEM image of mortar mixed with commercial TiO2 at day 3. (a) Agglomeration of TiO2 (5000×); and (b) agglomeration of TiO2 (20,000×).
Figure 13.
SEM image of mortar mixed with commercial TiO2 at day 3. (a) Agglomeration of TiO2 (5000×); and (b) agglomeration of TiO2 (20,000×).

Figure 14.
SEM image of mortar mixed with NTCP at day 3. (a) SiO2-TiO2 powder (5000×); and (b) Al2O3-TiO2 powder (5000×)
Figure 14.
SEM image of mortar mixed with NTCP at day 3. (a) SiO2-TiO2 powder (5000×); and (b) Al2O3-TiO2 powder (5000×)

Figure 15.
SEM image f nucleation effect by NTCP at day 3. (a) NTCP (2000×); and (b) NTCP (5000×).


Table 1.
Composition of nano SiO2-TiO2 powder and Al2O3-TiO2 powder.
| Mix ID | TiO2 (Mol) | SiO2 (Mol) | Al2O3 (Mol) |
|---|---|---|---|
| ST-1 | 0.9 | 0.1 | - |
| ST-2 | 0.7 | 0.3 | - |
| ST-3 | 0.5 | 0.5 | - |
| AT-1 | 0.9 | - | 0.1 |
| AT-2 | 0.7 | - | 0.3 |
| AT-3 | 0.5 | - | 0.5 |
Table 2.
Physical properties of materials.
| Starting Materials | Chemical Formula | Formula Weight | Density (g/mL) | Grade |
|---|---|---|---|---|
| TTIP (Titanium isopropoxide) | Ti(OC3H7)4 | 284.26 | 0.963 | Purity = 97% |
| TEOS (Tetraethy lorthosilicate) | Si(OC2H5)4 | 208.30 | 0.934 | Purity = 98% |
| ALP (Aluminum isopropoxide) | Al(OCH2CH3)2 | 204.24 | 1.035 | Purity = 98% |
Table 3.
Physical properties of commercial TiO2.
| Purity (TiO2) | Fe2O3 | H2O | Particle Size | pH | Ignition Loss |
|---|---|---|---|---|---|
| 98.0% | 0.008% | 0.4% | 250–350 nm | 7.0–8.0 | 0.3% |
Table 4.
Physical and chemical properties of OPC.
| Density (g/cm3) | Blaine Fineness (cm2/g) | Chemical Properties (%) | ||||||
|---|---|---|---|---|---|---|---|---|
| SiO2 | Al2O3 | Fe2O3 | CaO | MgO | SO3 | Ignition Loss | ||
| 3.14 | 3492 | 21.1 | 4.65 | 3.14 | 62.8 | 2.81 | 2.1 | 2.18 |
Table 5.
Particle size distribution of ISO graded standard sand.
| Sieve Size(mm) | 2.0 | 1.6 | 1.0 | 0.5 | 0.16 | 0.08 |
|---|---|---|---|---|---|---|
| Accumulated charge in the sieve (%) | 0 | 7 ± 5 | 33 ± 5 | 67 ± 5 | 87 ± 5 | 99 ± 5 |
Table 6.
Mix proportion.
| Test ID | W/B (%) | Mix Composition (g) | ||||
|---|---|---|---|---|---|---|
| Sand | Water | Cement | Powder | |||
| Plain | 50 | 1350 | 225 | 450 | - | |
| TiO2 | 2% | 441 | 9 | |||
| 4% | 432 | 18 | ||||
| 6% | 423 | 27 | ||||
| 8% | 414 | 36 | ||||
| 10% | 405 | 45 | ||||
| SiO2/TiO2 | 2% | 441 | 9 | |||
| 4% | 432 | 18 | ||||
| 6% | 423 | 27 | ||||
| 8% | 414 | 36 | ||||
| 10% | 405 | 45 | ||||
| Al2O3/TiO2 | 2% | 441 | 9 | |||
| 4% | 432 | 18 | ||||
| 6% | 423 | 27 | ||||
| 8% | 414 | 36 | ||||
| 10% | 405 | 45 | ||||
Table 7.
Result of BET.
| Powder | Surface Area (m2/g) | Pore Volume (cm3/g) | Pore Size (Å) | |
|---|---|---|---|---|
| TiO2 | 8.5 | 0.01 | 82 | |
| SiO2-TiO2 | ST-1 | 121 | 0.27 | 66 |
| ST-2 | 319 | 0.39 | 48 | |
| ST-3 | 241 | 0.31 | 60 | |
| Al2O3-TiO2 | AT-1 | 112 | 0.26 | 62 |
| AT-2 | 267 | 0.33 | 55 | |
| AT-3 | 149 | 0.29 | 60 | |
Table 8.
Diffraction intensity and orientation of CH at curing ages of one day and seven days.
| Powder | 1 Day | 7 Day | ||||
|---|---|---|---|---|---|---|
| (001) CH | (101) CH | CH Orientation | (001) CH | (101) CH | CH Orientation | |
| OPC | 409 | 150 | 3.7 (±0.2) | 478 | 178 | 3.6 (±0.1) |
| TiO2 | 288 | 144 | 2.7 (±0.3) | 396 | 154 | 3.5 (±0.2) |
| SiO2-TiO2 | 310 | 196 | 2.1 (±0.1) | 230 | 171 | 1.8 (±0.1) |
| Al2O3-TiO2 | 304 | 182 | 2.3 (±0.4) | 269 | 182 | 1.9 (±0.2) |
© 2019 by the authors. Licensee MDPI, Basel, Switzerland. This article is an open access article distributed under the terms and conditions of the Creative Commons Attribution (CC BY) license (http://creativecommons.org/licenses/by/4.0/).
Share and Cite
MDPI and ACS Style
Lee, J.-W.; Jang, Y.-I.; Park, W.-S.; Kim, S.-W.; Lee, B.-J. Photocatalytic and Pozzolanic Properties of Nano-SiO2/Al2O3-TiO2 Powder for Functional Mortar. Materials 2019, 12, 1037. https://doi.org/10.3390/ma12071037
AMA Style
Lee J-W, Jang Y-I, Park W-S, Kim S-W, Lee B-J. Photocatalytic and Pozzolanic Properties of Nano-SiO2/Al2O3-TiO2 Powder for Functional Mortar. Materials. 2019; 12(7):1037. https://doi.org/10.3390/ma12071037
Chicago/Turabian StyleLee, Jong-Won, Young-Il Jang, Wan-Shin Park, Sun-Woo Kim, and Byung-Jae Lee. 2019. "Photocatalytic and Pozzolanic Properties of Nano-SiO2/Al2O3-TiO2 Powder for Functional Mortar" Materials 12, no. 7: 1037. https://doi.org/10.3390/ma12071037
Note that from the first issue of 2016, this journal uses article numbers instead of page numbers. See further details here.