Application of a Wear Debris Detection System to Investigate Wear Phenomena during Running-In of a Gasoline Engine


1
Virtual Vehicle Research Center GmbH, Inffeldgasse 25F, 8010 Graz, Austria
2
Vera Campus, Universitat Politècnica de València, Camino de Vera, s/n, 46022 Valencia, Spain
*
Author to whom correspondence should be addressed.
Lubricants 2023, 11(6), 237; https://doi.org/10.3390/lubricants11060237
Submission received: 4 May 2023
/
Revised: 24 May 2023
/
Accepted: 25 May 2023
/
Published: 27 May 2023
(This article belongs to the Special Issue Tribology in Mobility, Volume II)
Abstract
:When a tribological system is operated for the first time, the first hours of operation are of the utmost importance as the surfaces of the contacting elements mate to each other, involving significant wear processes until the surfaces reach stable topological characteristics. This initial phase in a combustion engine is known as running-in and is of critical importance in the study of friction and wear phenomena. Despite this, there is little information in the literature dedicated to running-in and, therefore, data improving its understanding is greatly anticipated. In this work, a novel wear debris detection system measuring in real time was employed to investigate the running-in of an inline 4-cylinder gasoline engine; it consists primarily of an optical sensor with the capability of detecting very small particles from 4 m. For the tests, the engine was mounted on a test bench and operated under stationary working conditions. The results of the wear debris measurements showed interesting insights into the engine running-in process; although in general, the results followed the expected trend, they also showed an unexpected behavior: it was expected to obtain the highest amounts of wear debris at the beginning of the running-in, but instead the number of debris stagnated and only started to increase after about 20 h to then decrease again. The best operating conditions to run-in the engine were identified at the middle of the running-in period, without the presence of large wear debris that could lead to severe wear. Finally, it was found that the engine running-in was not finished until at least 75 h of operation, although commonly, a running-in time of 10 h is used in the industry.
1. Introduction
During a system’s running-in, complex changes occur in the components at the macro-, micro-, and nano-scales. As the surfaces conform to each other, elastic and plastic deformation of the asperities occur, wear debris is generated and accumulated, and even material transfer between the surfaces may occur [1]. These processes lead to changes in the shape and surface roughness of the components, as well as changes in the mechanical properties of the materials and variations in the friction coefficient. In a complex system such as an internal combustion engine, running-in is a process involving wear phenomena in the moving parts of the engine due to the interaction of multiple transient factors, including lubrication conditions, surface topography, wear debris generation, temperature, and applied load. These factors lead to the gradual conformance of the surfaces until wear reaches a steady-state condition that is ideally maintained for most of the useful engine life [2]. Due to the high variability in the engine operating conditions and the characteristics of each engine part, this running-in process may occur simultaneously on all of the tribo-pairs but at different rates [1].
These changes in the engine components’ characteristics after the running-in is finished will directly affect the lubrication conditions and final performance of the tribo-pairs. Therefore, an appropriate running-in procedure determines the engine’s efficiency and reliability [3,4]. The same applies to friction and wear research in internal combustion engines; an appropriate running-in ensures a stable engine operation, which is especially important when comparing engine oil formulations, materials, and surface finishes, where small variations are expected and, thus, repeatability and accuracy are essential.
Due to their importance for engine durability and maintenance, multiple techniques have been developed to study and monitor wear phenomena in internal combustion engines. These techniques have applications in real-time measurements (while the engine is running), in situ measurements, or analyses developed in laboratories. The use of these techniques is determined by the study’s characteristics, measurement accuracy, and expected wear debris size. The techniques used in situ and with online measurements are based on different principles and include the thin layer activation method (TLA), online visual ferrography (OLVF), optical counter sensors, and inductive sensors [5,6]. The TLA technique is based on the gamma ray detection principle and consists of pre-treating the surfaces of the engine to be measured by adding a layer of radiotracers; during the engine operation and when wear processes occur, wear debris particles are generated and released to the oil, which are then quantified with a gamma ray detector [7,8,9]. The main advantages of this online measurement technique are its high sensitivity and that there is no need to disassemble the engine; however, the associated costs to apply the technique are high, along with the awareness of additional safety concerns related to working with radioactivity [10]. The OLVF technique is also widely used in engine condition monitoring, and its measuring principle consists of a transparent channel for the oil flow, a magnetic system for the deposition of the wear debris, and an optical detection system. The disadvantages of the technique are that it only detects magnetic particles and the formation of debris chains and clusters, making it difficult to recognize the wear particles; thus, segmentation techniques are needed [11,12,13,14]. Another widespread technique in the field of combustion engines is based on inductive sensors, which are capable of quantifying ferrous particles in the oil and, depending on their design, they can also differentiate bubbles from actual wear particles. These sensors usually consist of a coil placed around a tube to create a magnetic field [15]. The major disadvantage of this technique is that it only detects particles larger than 60–100 m, which is a rather large particle size, characteristic of severe engine wear and onset of failure. Some examples of applications of this technique in internal combustion engines are the ones developed by [16,17]. The optical counter sensors, on the other hand, are generally focused on quantifying the number of particles according to their size, and for that, different measurement principles exist using photoelectric and imaging sensors. The photoelectric sensors use light extinction and light scattering optical phenomena, and the imaging sensors are based on obtaining digital images of the oil and processing algorithms that allow the determination of the size of the debris and differentiating it from air bubbles. These sensors have been extensively used in condition monitoring of wind turbines [18,19]. However, to date, and to the authors’ knowledge, there are no documented studies in the literature with applications in combustion engine wear.
This literature review shows that, overall, research has been mainly focused on the steady-state wear condition of the engine operation. Even though OEMs and R&D centers have developed extensive studies on the running-in stage [20,21,22,23,24,25,26,27], specific research on engine running-in and associated wear phenomena has been mainly dedicated to a specific tribo-pair, such as the piston-cylinder liner assembly [4,20,21,23,28,29], the cam-follower contact [30,31], and journal bearings [22,24,25,32]; and just a few studies have been focused on the running-in wear evaluation of the complete engine [26,33]. In practical applications in the industry, it is common to find running-in procedures based on experimental experience and of various duration times and operating conditions [34]. Some procedures even include idle, which can significantly harm the engine, leading to severe wear and damage.
From the literature review, the main knowledge gap in the engine running-in topic is the need for experimental data to support and expand the understanding of the wear phenomena occurring in this stage for the complete engine, along with the identification of the operating conditions that contribute to this process without risking severe wear generation or the engine’s efficient operation. To contribute to filling this knowledge gap, the study presented here evaluated and analyzed the wear phenomena of an internal combustion engine experimentally during the running-in stage in correlation with the engine’s operating conditions. This analysis represents the main scientific contribution of the research presented here, along with the application of a novel wear debris detection system, based on an optical counter sensor developed by the company Atten2 that has not been used in this type of application before.
2. Materials and Methods
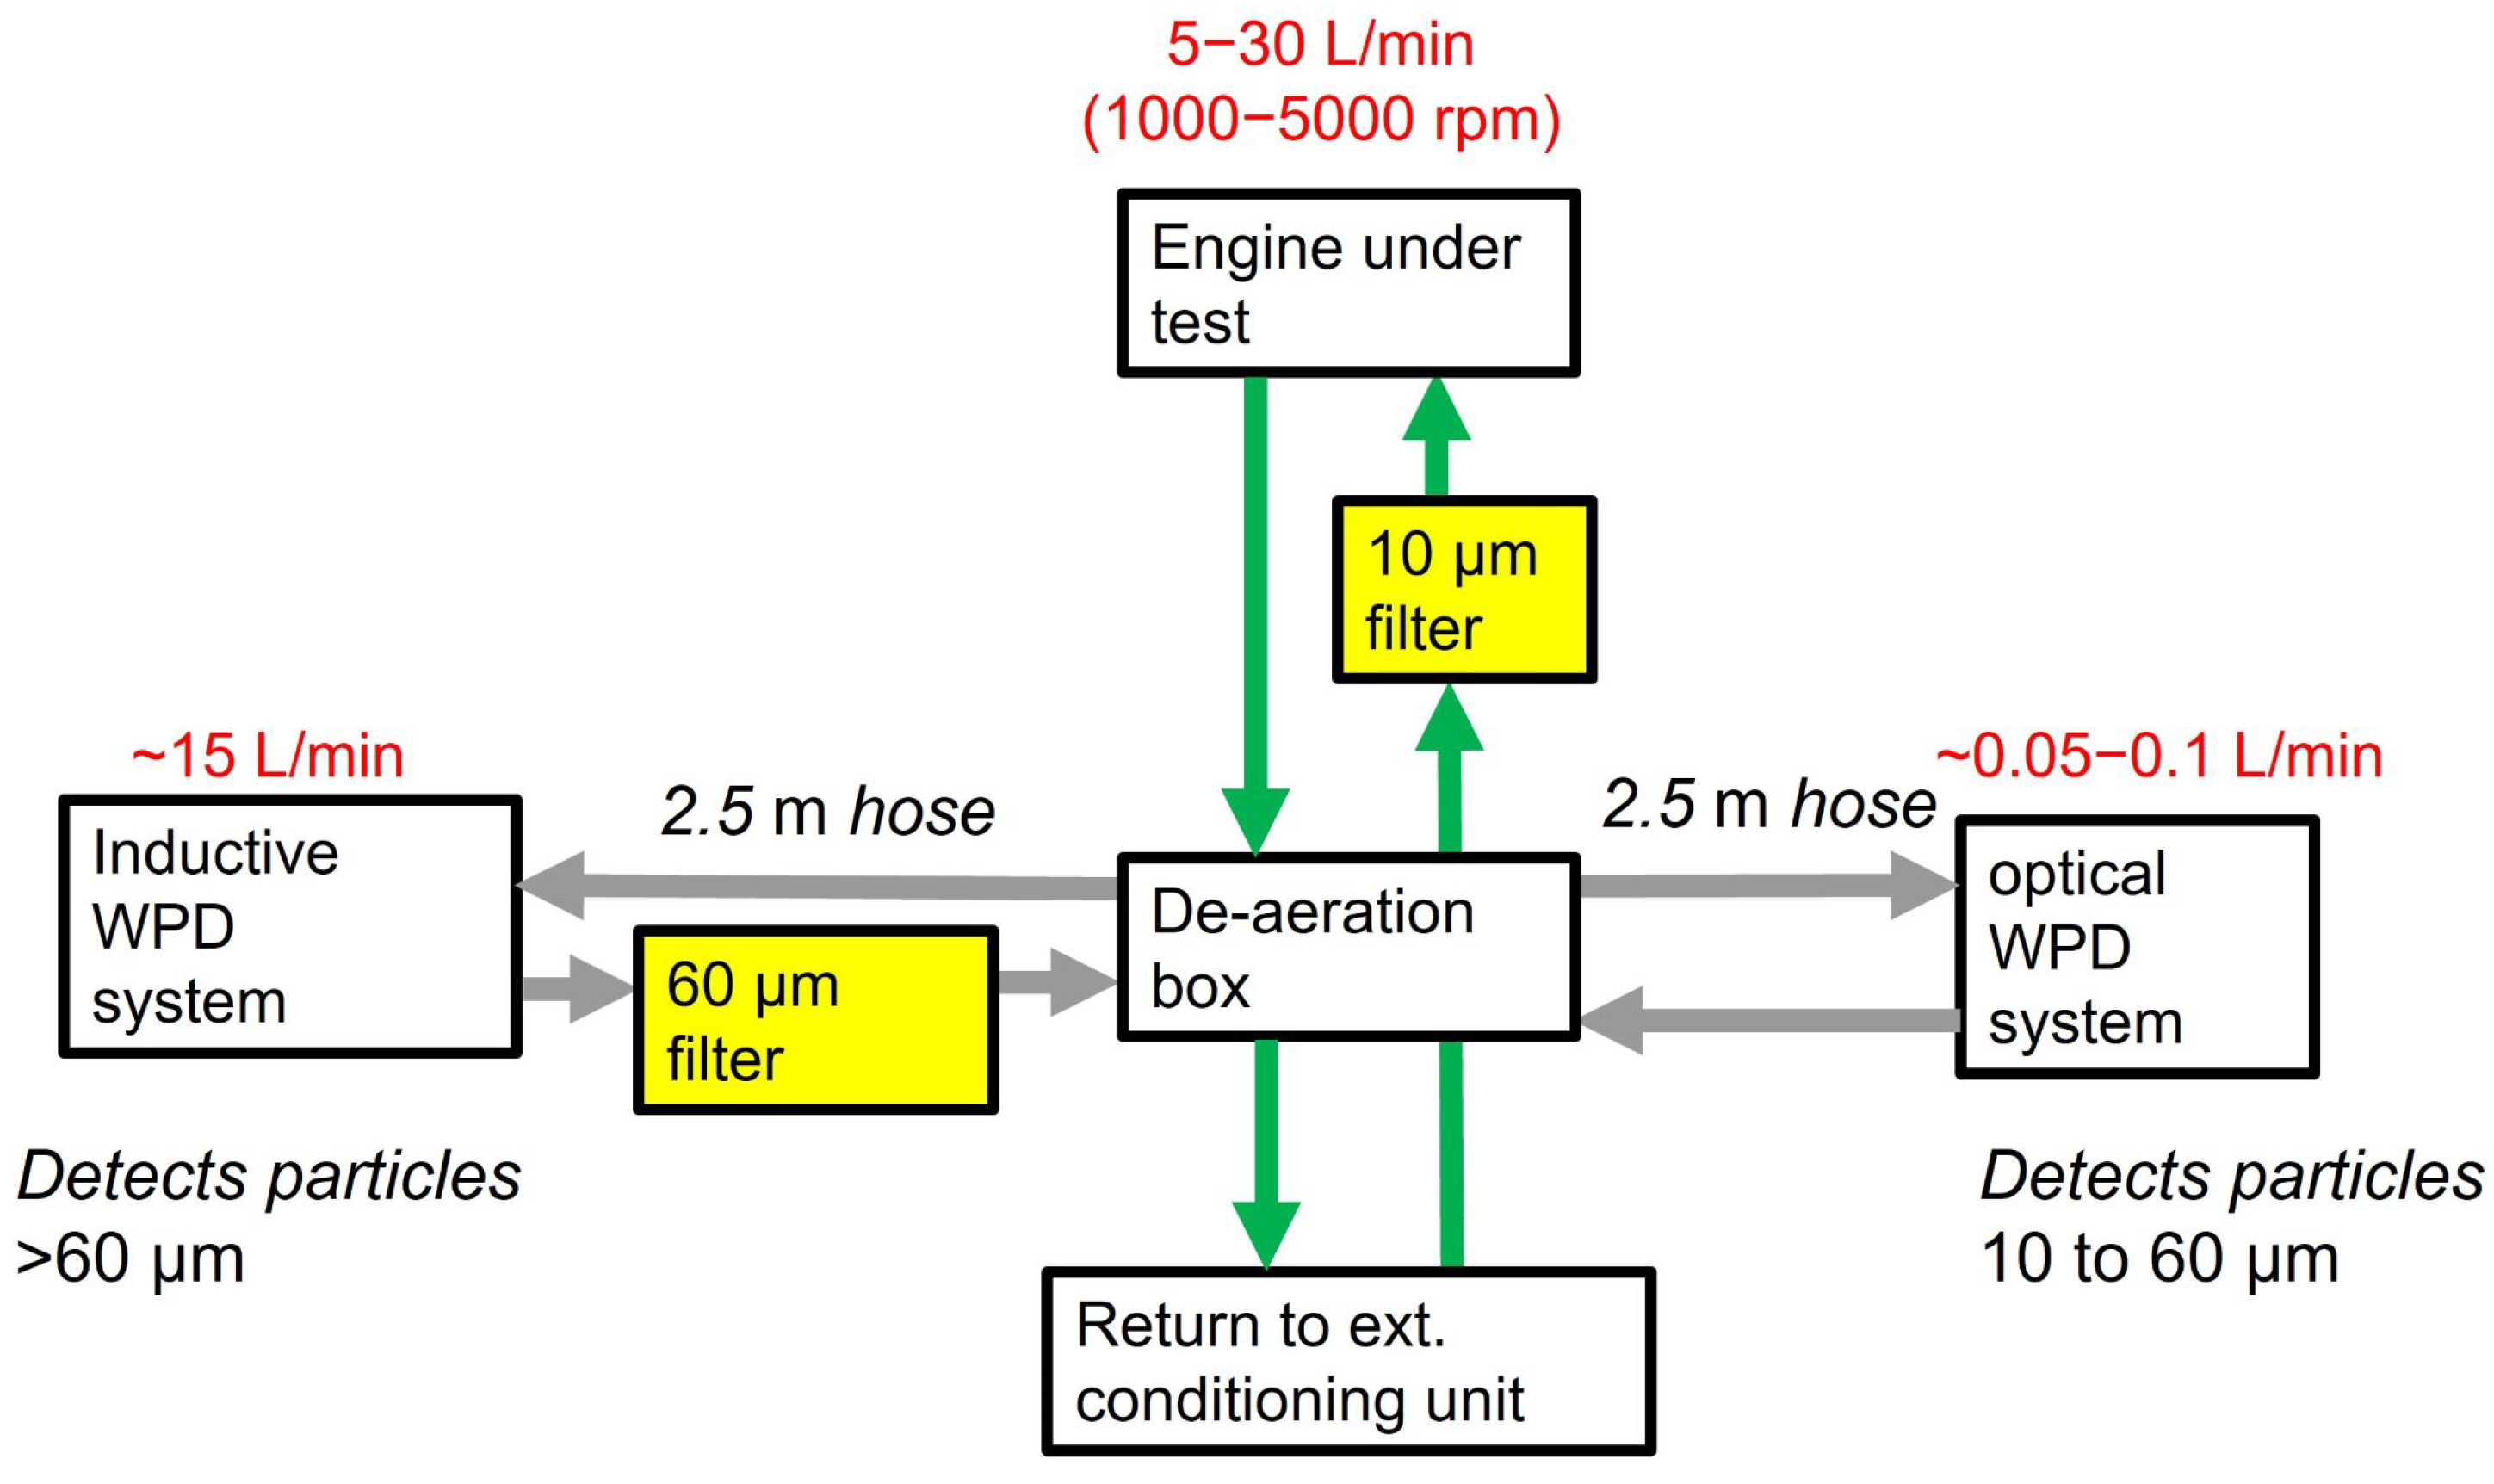
As mentioned in Section 1, the main goal of this work is to increase the knowledge and understanding of the running-in stage of a combustion engine from the wear perspective. To achieve this goal, a novel wear detection system was developed and installed in an engine test bench. This system allowed real-time measurements of the wear debris generated during the engine running-in to be obtained. In this way, the test setup, depicted in Figure 1, consisted of an inline 4-cylinder gasoline engine mounted on a friction test-rig, FRIDA (friction dynamometer), and a wear debris detection system, which included an optical sensor (described in Section 2.1), an inductive sensor, a de-aeration box, two oil pumps, and two oil filters of 10 and 60 m. The lubricating oil used for the tests was an SAE 0W20 with a dynamic viscosity of 22.78 mPa.s at 40 C and 5.12 mPa.s at 100 C.
As shown in Figure 1, the central component of the setup is the de-aeration box, located just below the engine. It collects the oil coming from the engine, removes as much air as possible from the oil, and then distributes the oil to the wear debris detection sensors. A pump was employed to supply the oil to the optical sensor with a flow set between ca. 0.05 and 0.1 L/min; the flow rate was increased or lowered depending on the engine speed. After the optical sensor, a 10 m filter was used to prevent particles larger than this size from returning to the engine. An oil flow of about 15 L/min for the inductive sensor was set and maintained for all the testing conditions. The maximum flow rate of this sensor is 16 L/min, or otherwise, the detected minimum particle size is increased. Due to this flow rate setting, at low engine speeds the amount of oil pumped through the inductive sensor was higher than that coming from the engine. In order to not interfere with the distribution of wear particles in the de-aeration box, and consequently with the remaining particles to be analyzed by the optical sensor, a coarse filter of 60 m was located right after the inductive sensor, offering some protection to the oil pump while still allowing smaller particles to return to the de-aeration box. The inductive wear detection sensor can only detect ferrous particles larger than 60 m, which already indicates the onset of severe engine damage, and therefore, measurements with this sensor are not employed in this study.
2.1. Optical Wear Particles Detection Sensor
In order to detect the wear particles generated during the engine running-in, a prototype optical sensor from the company Atten2 was employed. This sensor belongs to a family of products used in industrial applications such as wind turbines gearboxes and hydraulic systems. The sensor takes images (4 frames/s) of the oil flowing across the sensor and analyses them numerically to classify the wear particles into group sizes. Furthermore, given that the optical sensor cannot physically discern actual wear debris from air bubbles and other contaminants, it includes an algorithm that post-processes the images and differentiates the air bubbles from the wear particles. To this aim, the algorithm first identifies if the shape of the body is round; then, it checks whether the central part of the body is transparent with a darker border or if it is entirely dark. If the body has a transparent center, it forms a darker ring-like shape detected as two concentric circles and is classified as a bubble. Completely dark bodies are recognized as wear particles. This sensor can measure particles of sizes from 4 m with a maximum flow rate of 0.15 L/min. For the tests in this study, the flow rate was kept between ca. 0.05 and 0.1 L/min, as higher flow rates increase the minimum detected particle size. In addition to the wear particle count, the sensor also gives the corresponding ISO 4406:2021 cleanliness code [35].
Two situations were identified from the experimental measurements and considered for the analysis of results. First, when the testing point is changed, the sensor measures variations in the generated wear debris with some delay. This situation occurs because the optical sensor is not located right at the engine’s exit but about 2.5 m away, and the delay imposed by the small oil flow entering the sensor compared to that coming out from the engine. Second, changes in the operating point lead to increased air content in the oil. Therefore, to overcome these issues, it was decided to only use the last 5 min of the testing period for each point; this ensures that stable conditions have been reached and that the measurement is no longer strongly affected by changes in the operating conditions.
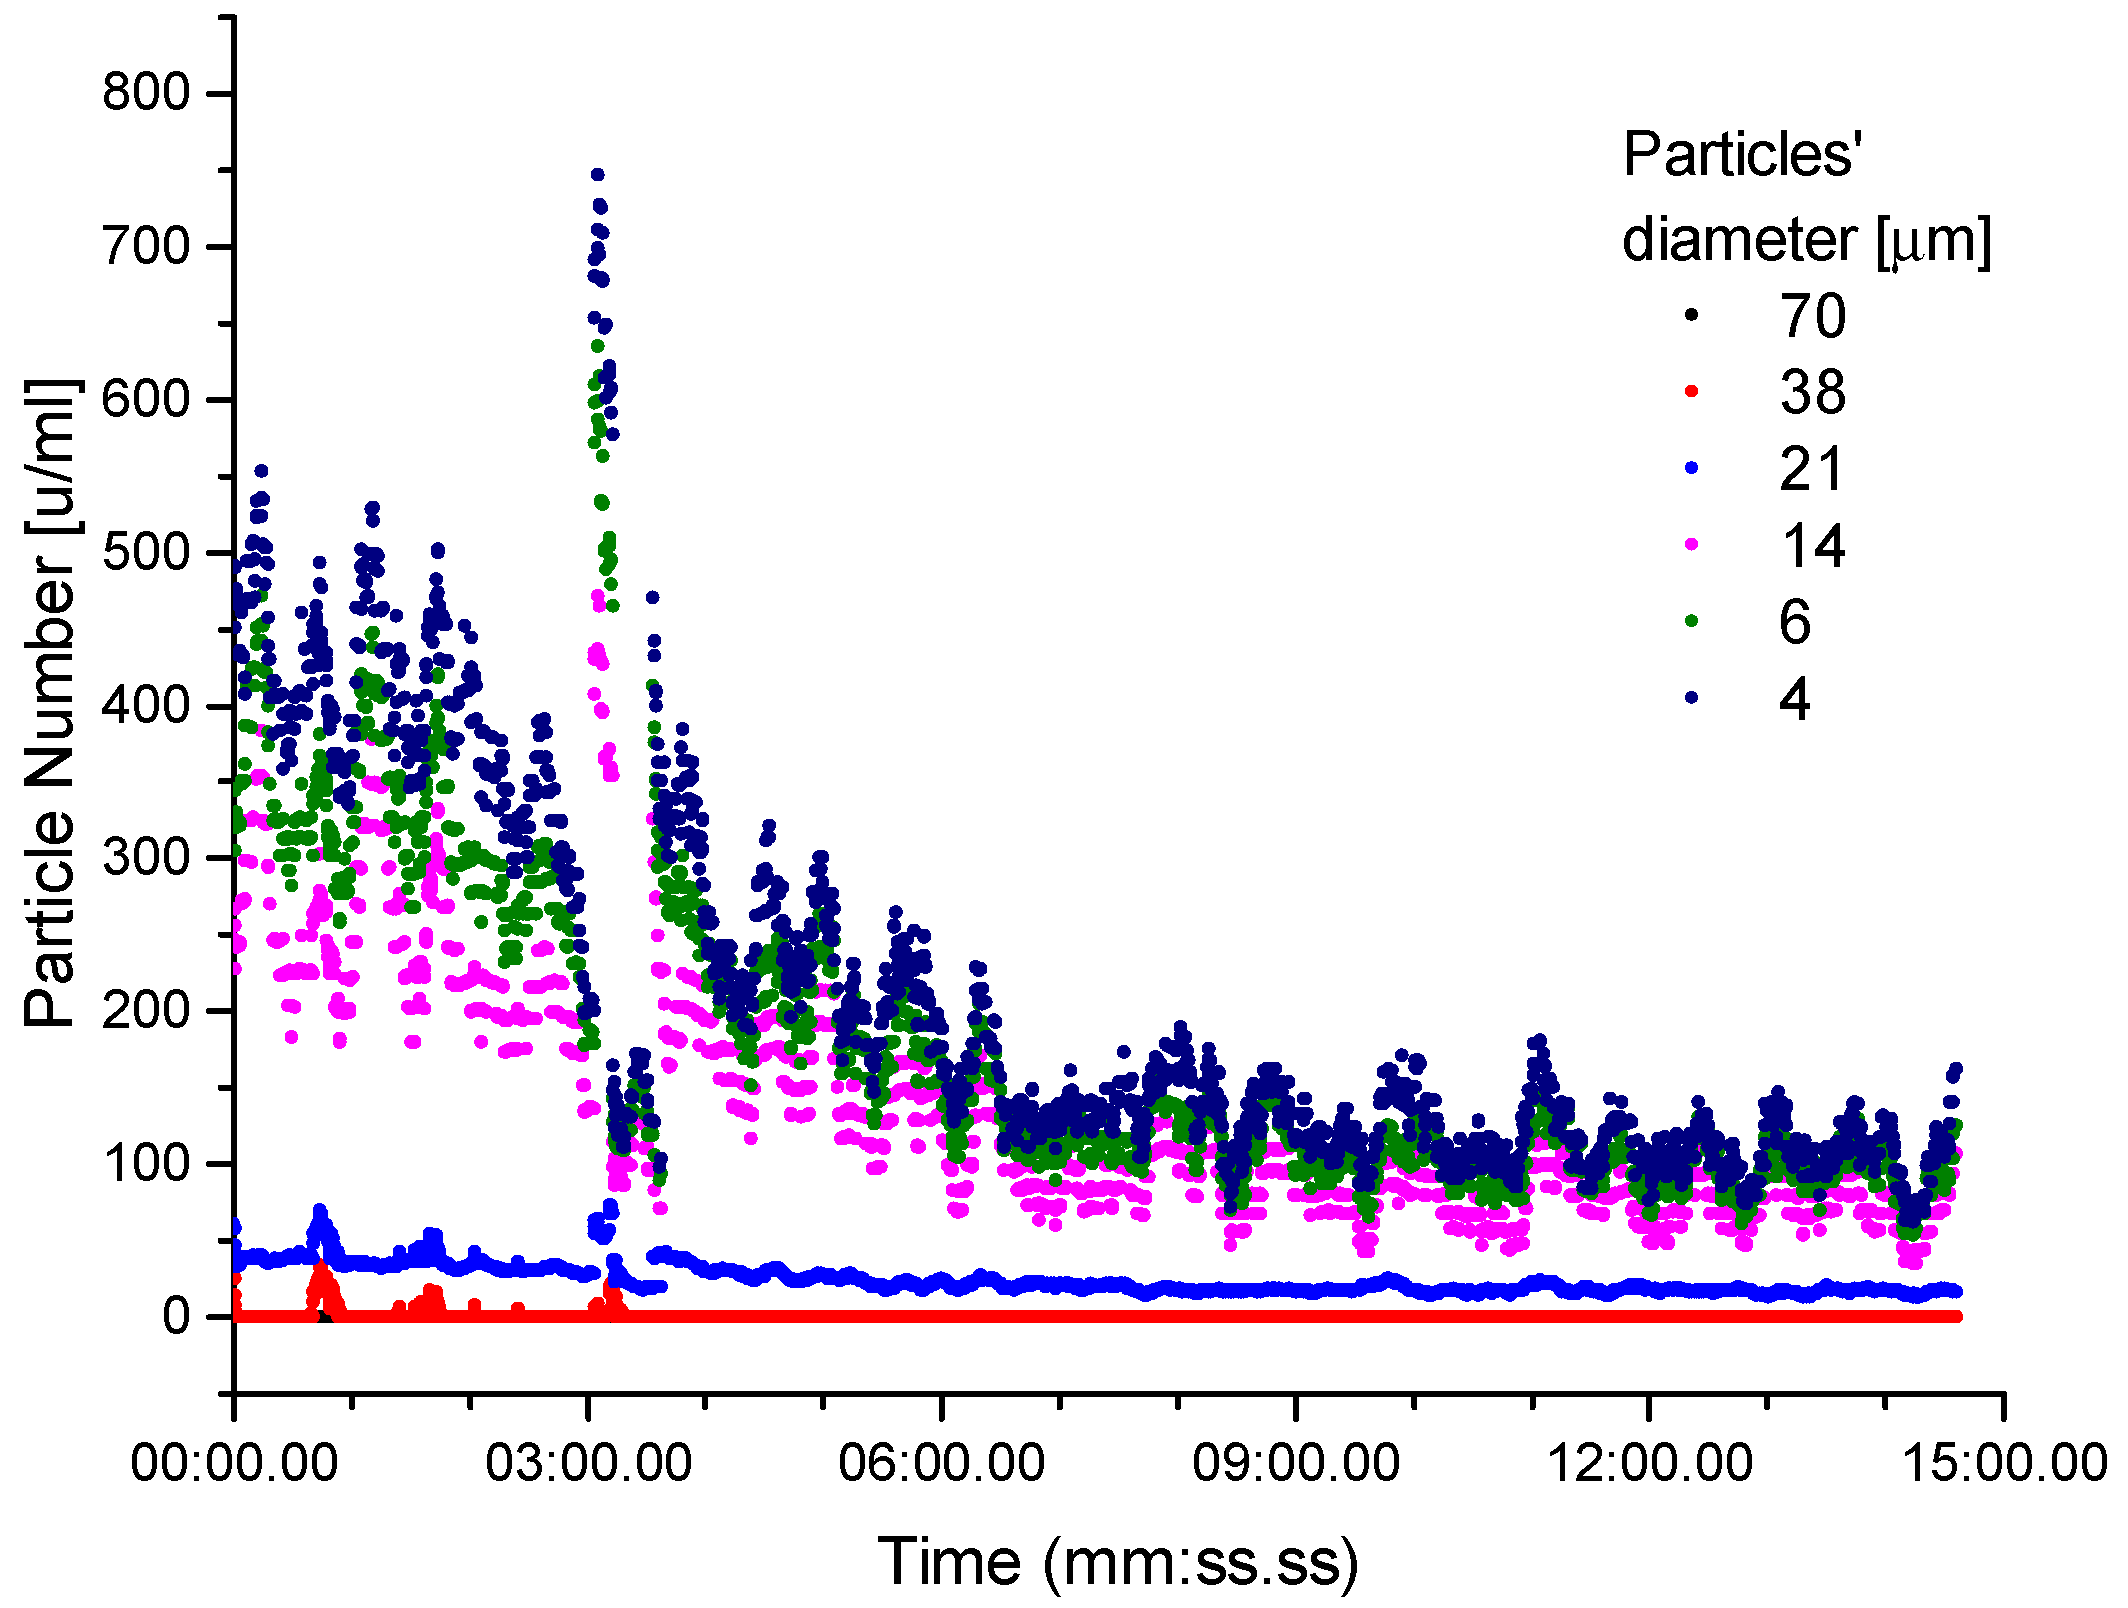
An example of the raw data obtained from the optical sensor is depicted in Figure 2; here, the classification of the wear debris particles according to their size (from 4 to 70 m) can be seen. The y axis shows the number of particles per milliliter of oil (u/mL), and the x axis is the total duration of the measurement. As can be seen from the plot, the initial part of the measurement presents significant variations, especially for the smaller particles (14 m and lower), to then reach more stable conditions at the last half of the measurement. It must be taken into account that these data are accumulated values; that is, the group of 4 m contains particles equal to and larger than this size; the group of 6 m contains particles equal to and larger than 6 m, and so on, up to the group of 70 m, that contains only particles equal to and larger than this size. As described in Section 2, a 60 m filter was located between the exit of the inductive sensor and the entrance of the de-aeration box, affecting to some extent the oil flowing towards the optical sensor and, therefore, reducing the detected amount of particles larger than 60 m.
2.2. Equivalent Wear Volume
As mentioned in Section 2.1, the wear debris detection sensor records the number of wear particles in groups of a defined size; however, the analysis of the results showed that this raw data could be complemented with the so-called equivalent wear volume, as it allows larger wear debris particles to have more relevance to the total quantified wear. This approach would agree with the experience that the severity of wear is directly correlated to the magnitude of wear debris; therefore, larger wear particles represent more severe wear conditions than a large number of small wear particles. The equivalent wear volume n was calculated from Equation (1), where is the number of detected wear particles of the k-th particle size group and is the radius of the particle assuming a spherical shape and taking the radius of the central dimension within a size group.
2.3. Testing Methodology
The testing methodology for the engine running-in consisted of a set of 22 operating points representative of the engine map, as shown in Table 1. They were executed in the order presented in the table. This set of points was repeated until the running-in was complete; in the first repetition, the testing period for each point was 15 min, but it was later modified to 30 min for the rest of the repetitions, as this allowed more time for the engine to reach stable operating conditions. All tests were performed at 90 C oil temperature, as this is representative of the temperature found in the engine in real applications.
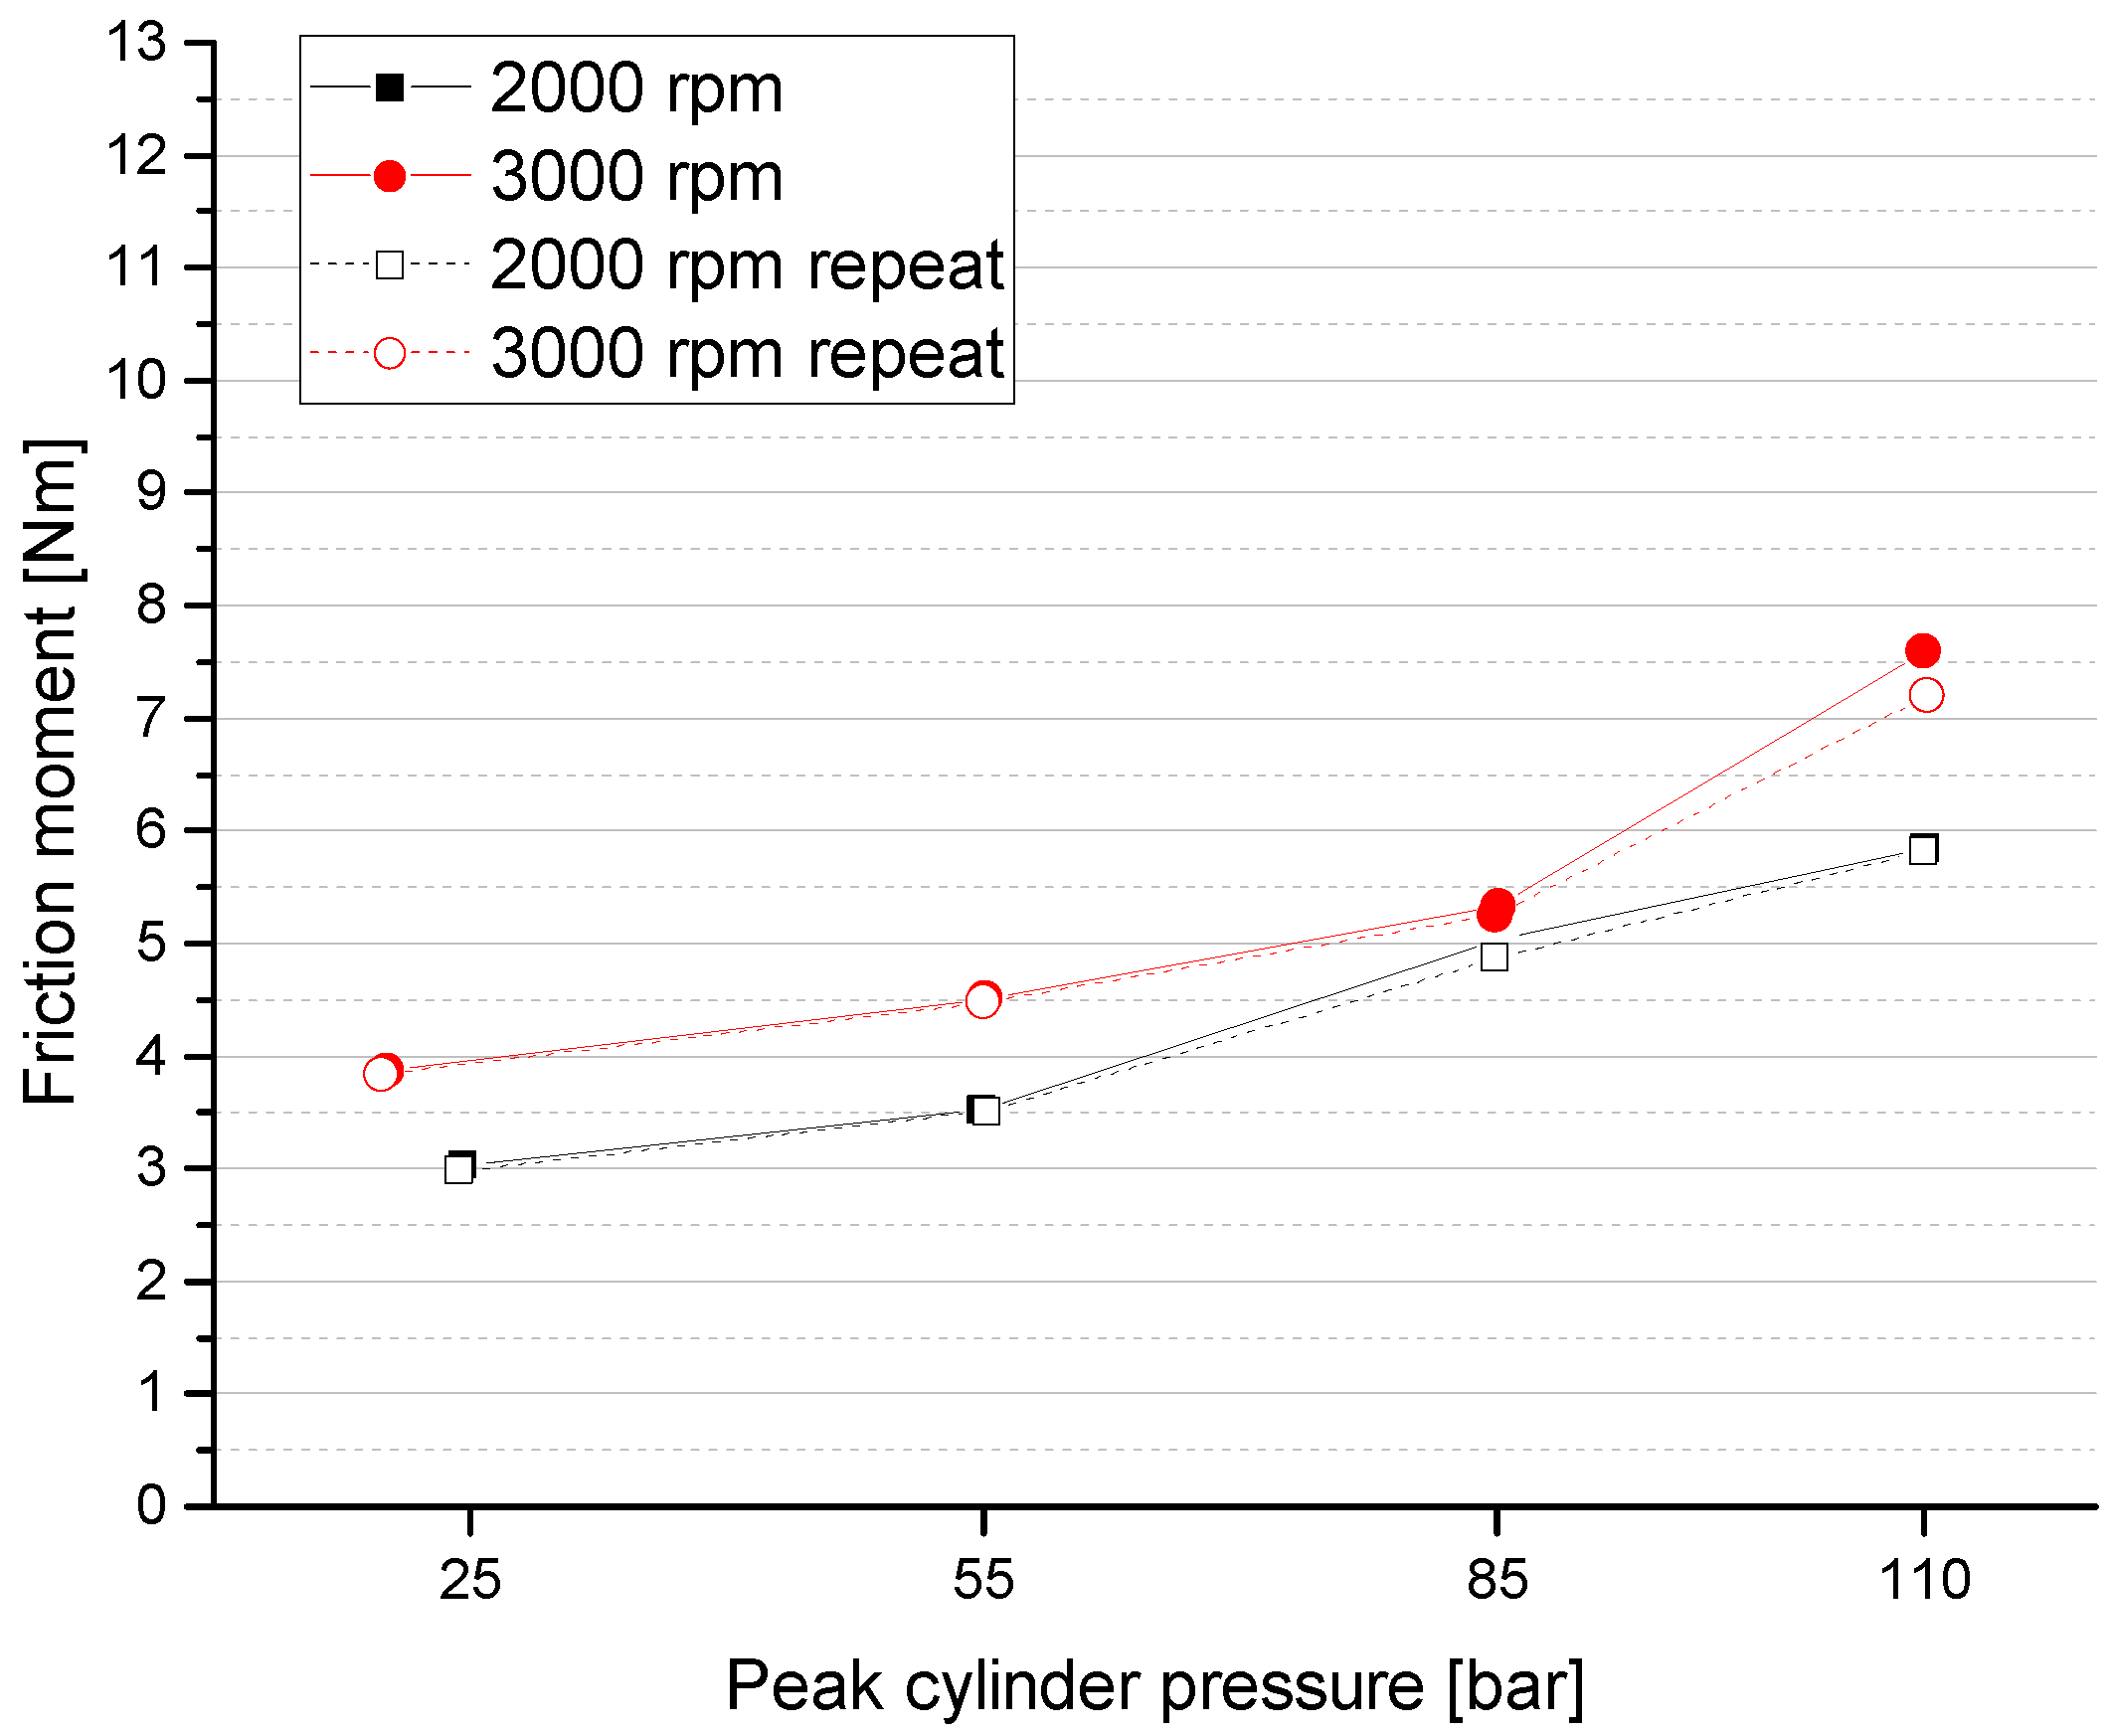
In order to evaluate if the engine running-in was complete, friction tests were performed in the FRIDA dynamometer and checked to ensure that the friction had stabilized and was repeatable. The following Figure 3 shows the final friction test results performed at 2000 and 3000 rpm and four levels of peak cylinder pressure. The results show no systematic differences in the obtained friction moment values, confirming that friction had reached a stable condition. This running-in process had a total duration of 75 h.
3. Results and Discussion
3.1. Engine Running-In: Complete Testing Period
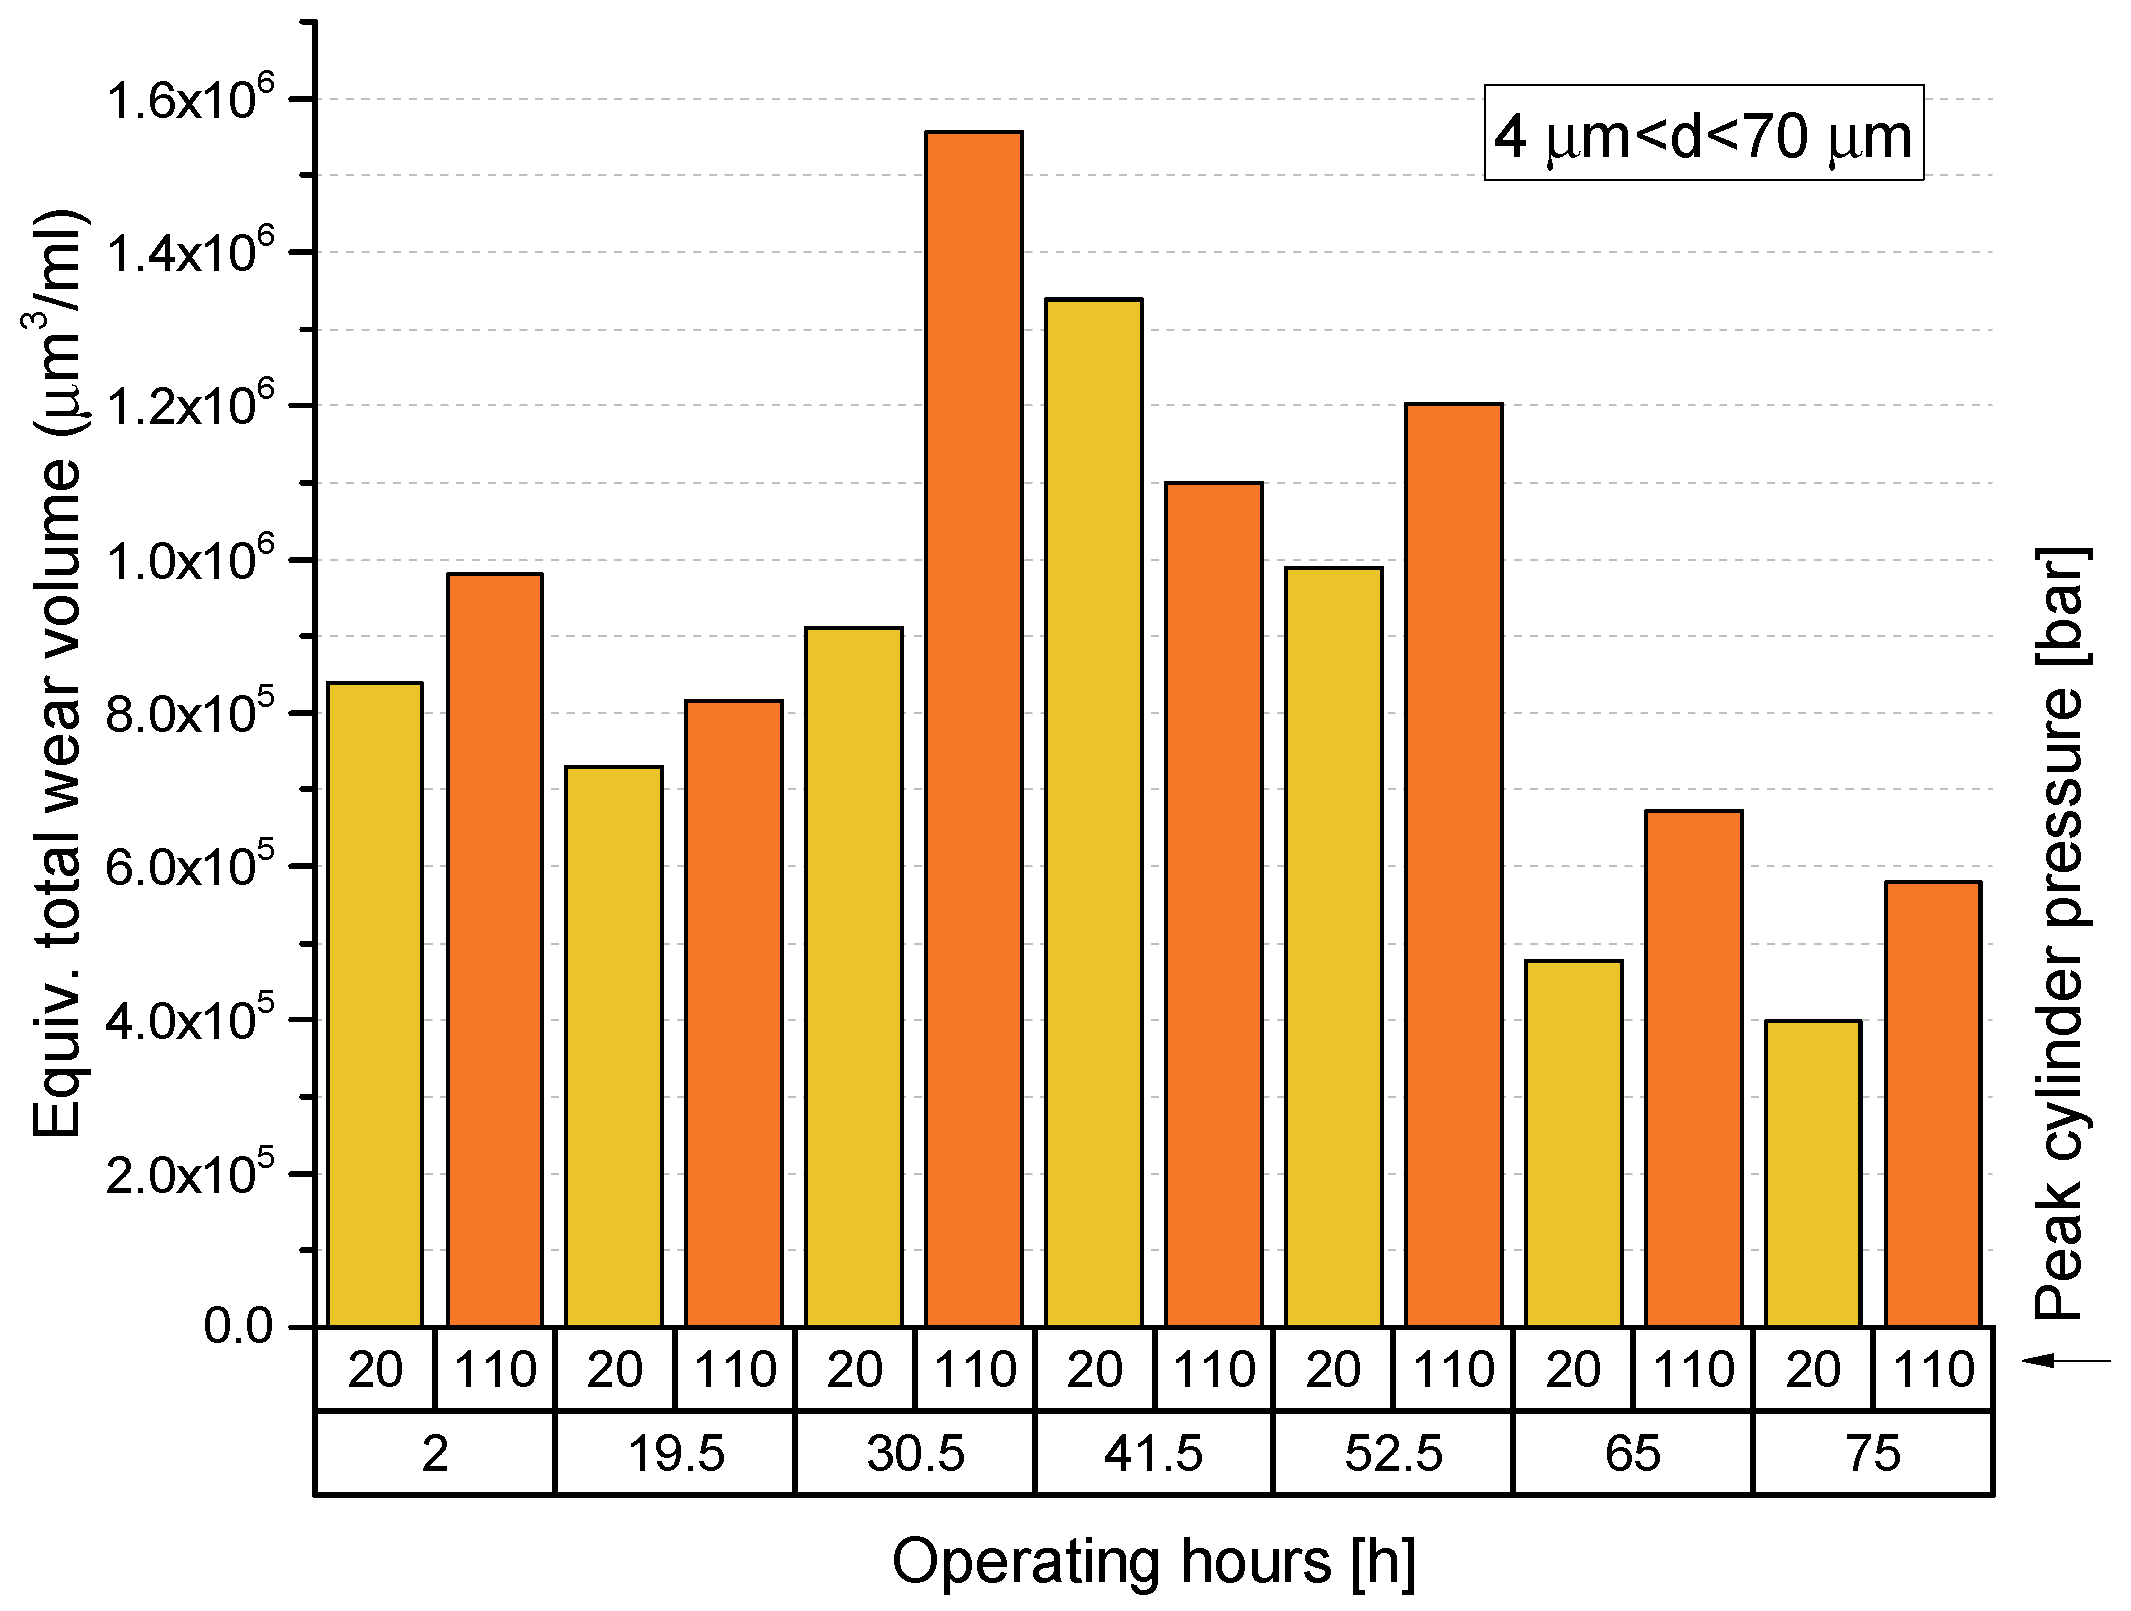
As mentioned previously in this manuscript, the main goal of developing and implementing the wear debris detection system was to evaluate the wear performance of the engine during its running-in. Consequently, this system continuously recorded data during the engine’s operation until the running-in was complete. The recorded data are presented in Figure 4; this shows the equivalent wear volume for the entire running-in period for one representative working condition: 2000 rpm and two peak cylinder pressures of 20 (motoring/no load) and 110 bar (full load/WOT operation). This condition was selected for the analysis presented here as it is the lowest engine speed where the full cylinder pressure is reached (110 bar). Therefore, mixed lubrication conditions are expected to dominate, with the associated increase in wear debris generation. Furthermore, given that during running-in the surfaces of the engine parts are in continuous change as they adapt and conform to each other, it was expected to observe a discernible trend in the amount of detected wear debris under the selected operating condition; that is, it was expected to observe higher values of wear volume at the beginning of the running-in, as the engine parts are still starting to conform to each other, followed by a continuous decrease in this value as the operating hours increase. This trend would finally reach a stable condition with low levels of wear, similar to the wear levels that the engine would experience during its useful life.
From Figure 4, however, it is clear that the expected trend is not entirely fulfilled; instead, the higher levels of wear are obtained in the middle of the running-in period, while the wear generated at the beginning of the running-in is lower and seems to stagnate for the first 20 h of operation. During the last 10 h of running-in, the wear volume is significantly reduced, to about 50% of the wear values detected at the beginning of the running-in.
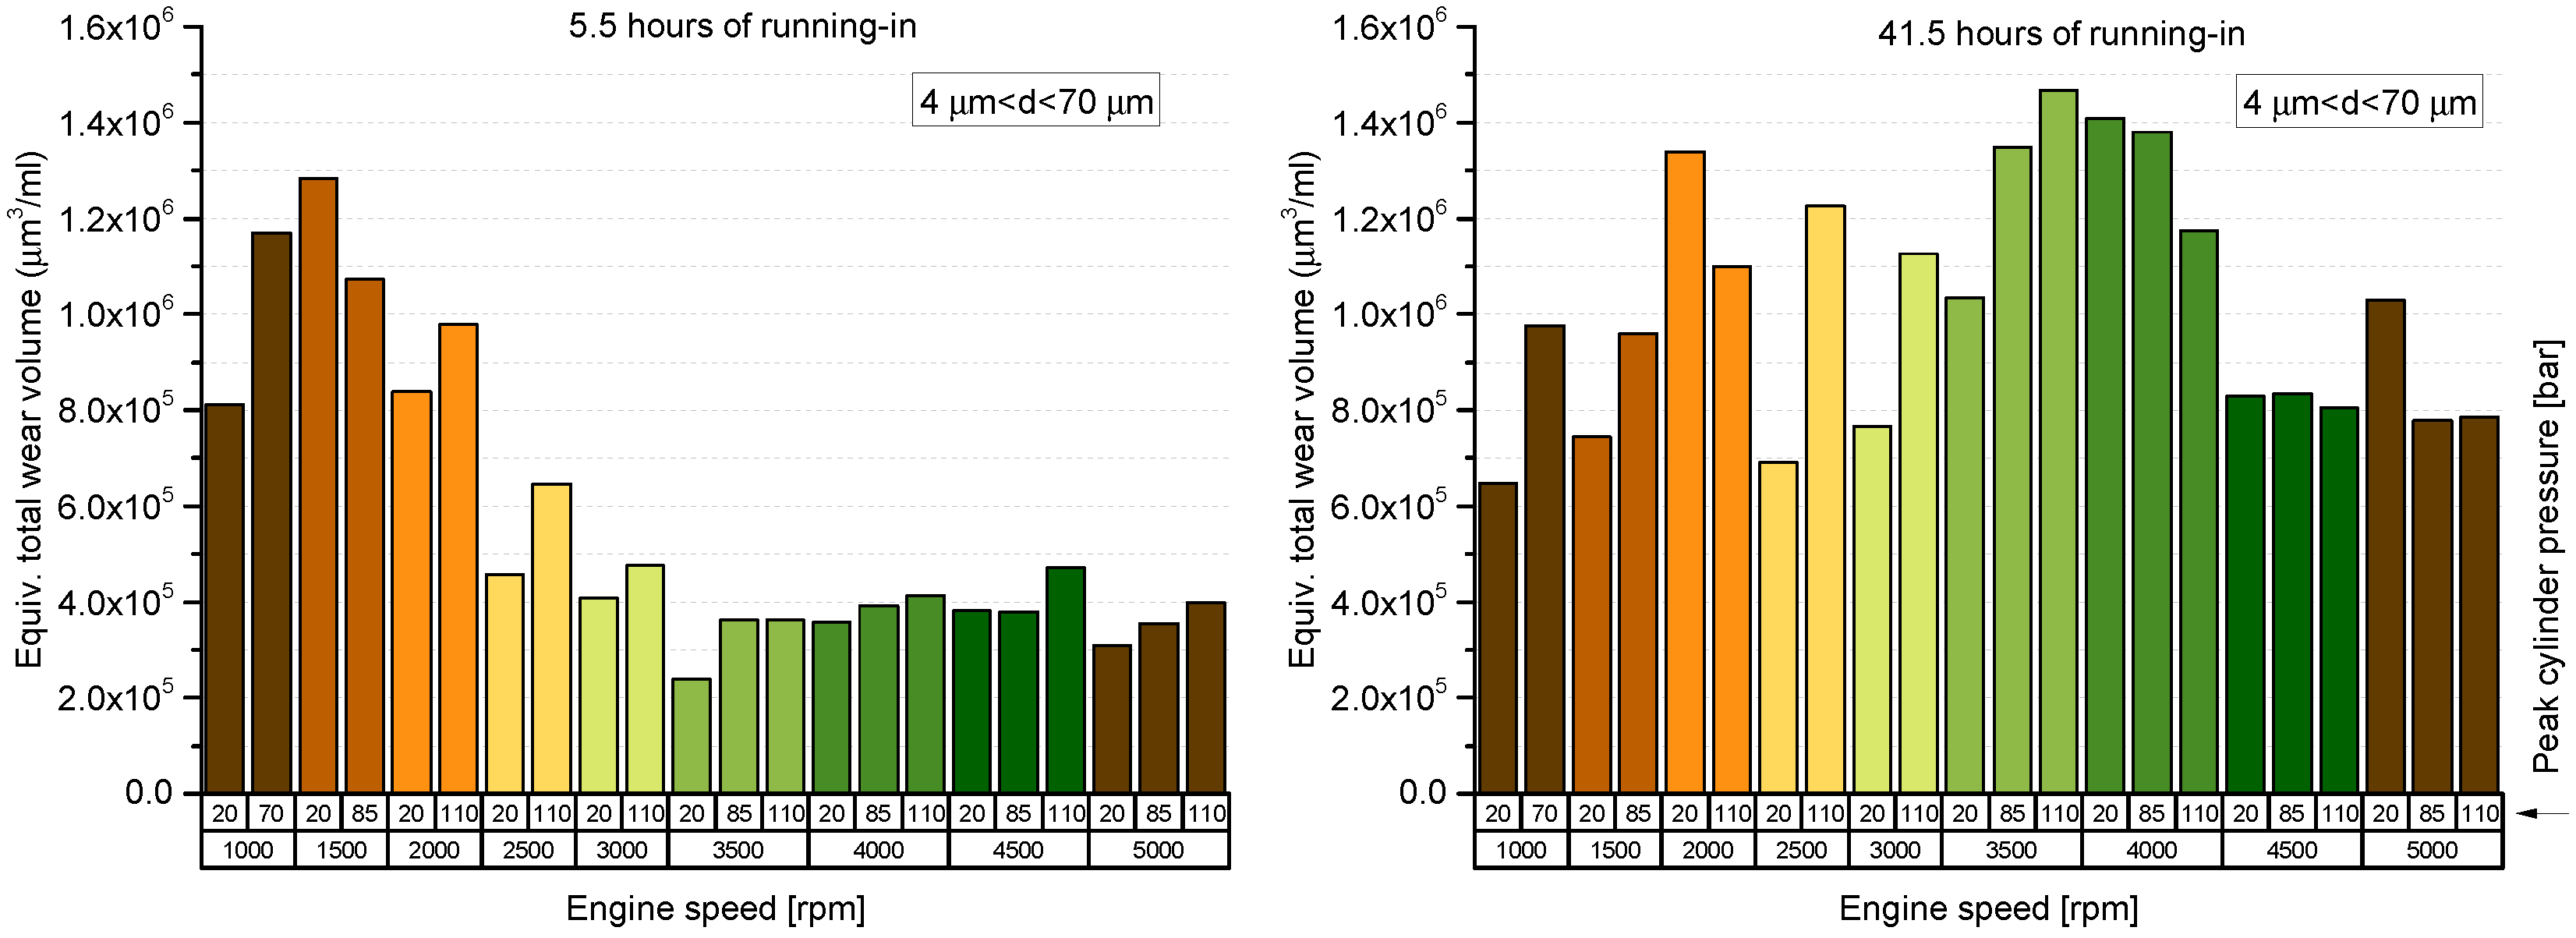
In order to analyze this finding in more detail, Figure 5 was obtained by comparing the equivalent wear volume between the first 5.5 h of running-in and after 41.5 h of operation, including all the testing conditions. Following the results of Figure 4, this plot shows that overall, during the first hours of operation, the generated wear debris volume is considerably lower than that obtained at the middle of the running-in, and that the wear volume depends significantly on the operating conditions, with variations along the running-in period. For instance, the left-hand panel in Figure 5 shows that the generated wear is higher under low engine speed conditions during the first 5.5 h; it reduces significantly at 2500 rpm, to then stabilize at comparatively low levels of wear for the rest of the testing time. Here, is important to note that the engine running-in was started with the testing points at low engine speed (Table 1), and, therefore, not only the mixed lubrication promoted by the low speed conditions would contribute to the higher wear volumes, but also the unused state of the engine parts. A completely different trend is observed in the middle of the running-in period (Figure 5, right panel), where the peak of generated wear volume was found at medium engine speeds (3500 and 4000 rpm) without a clear trend of the influence of the peak cylinder pressure.
Another interesting finding of these results is the total operating time required to complete the running-in. Commonly in the industry, a 10 h running-in period is considered to be sufficient; however, the results presented here demonstrate that, at least for the engine employed in this study, the running-in time is significantly longer.
3.2. Engine Running-In: Engine Operating Conditions
Another aspect of the running-in procedure that seems to be not well understood and lacks documentation in the literature is the identification of the engine operating points that are especially relevant for the running-in, and that could optimize the process. In the industry, for instance, it is common to run-in the engine under some representative operating conditions of the engine map for the same period of time and based on previous experimental experience. With this in mind, and with the data gathered during the engine running-in, it was decided to analyze in more detail the initial 5.5 h of the engine operation, which correspond to a complete test run (Table 1), to investigate the wear performance related to the engine operating conditions and the size of the measured wear debris.
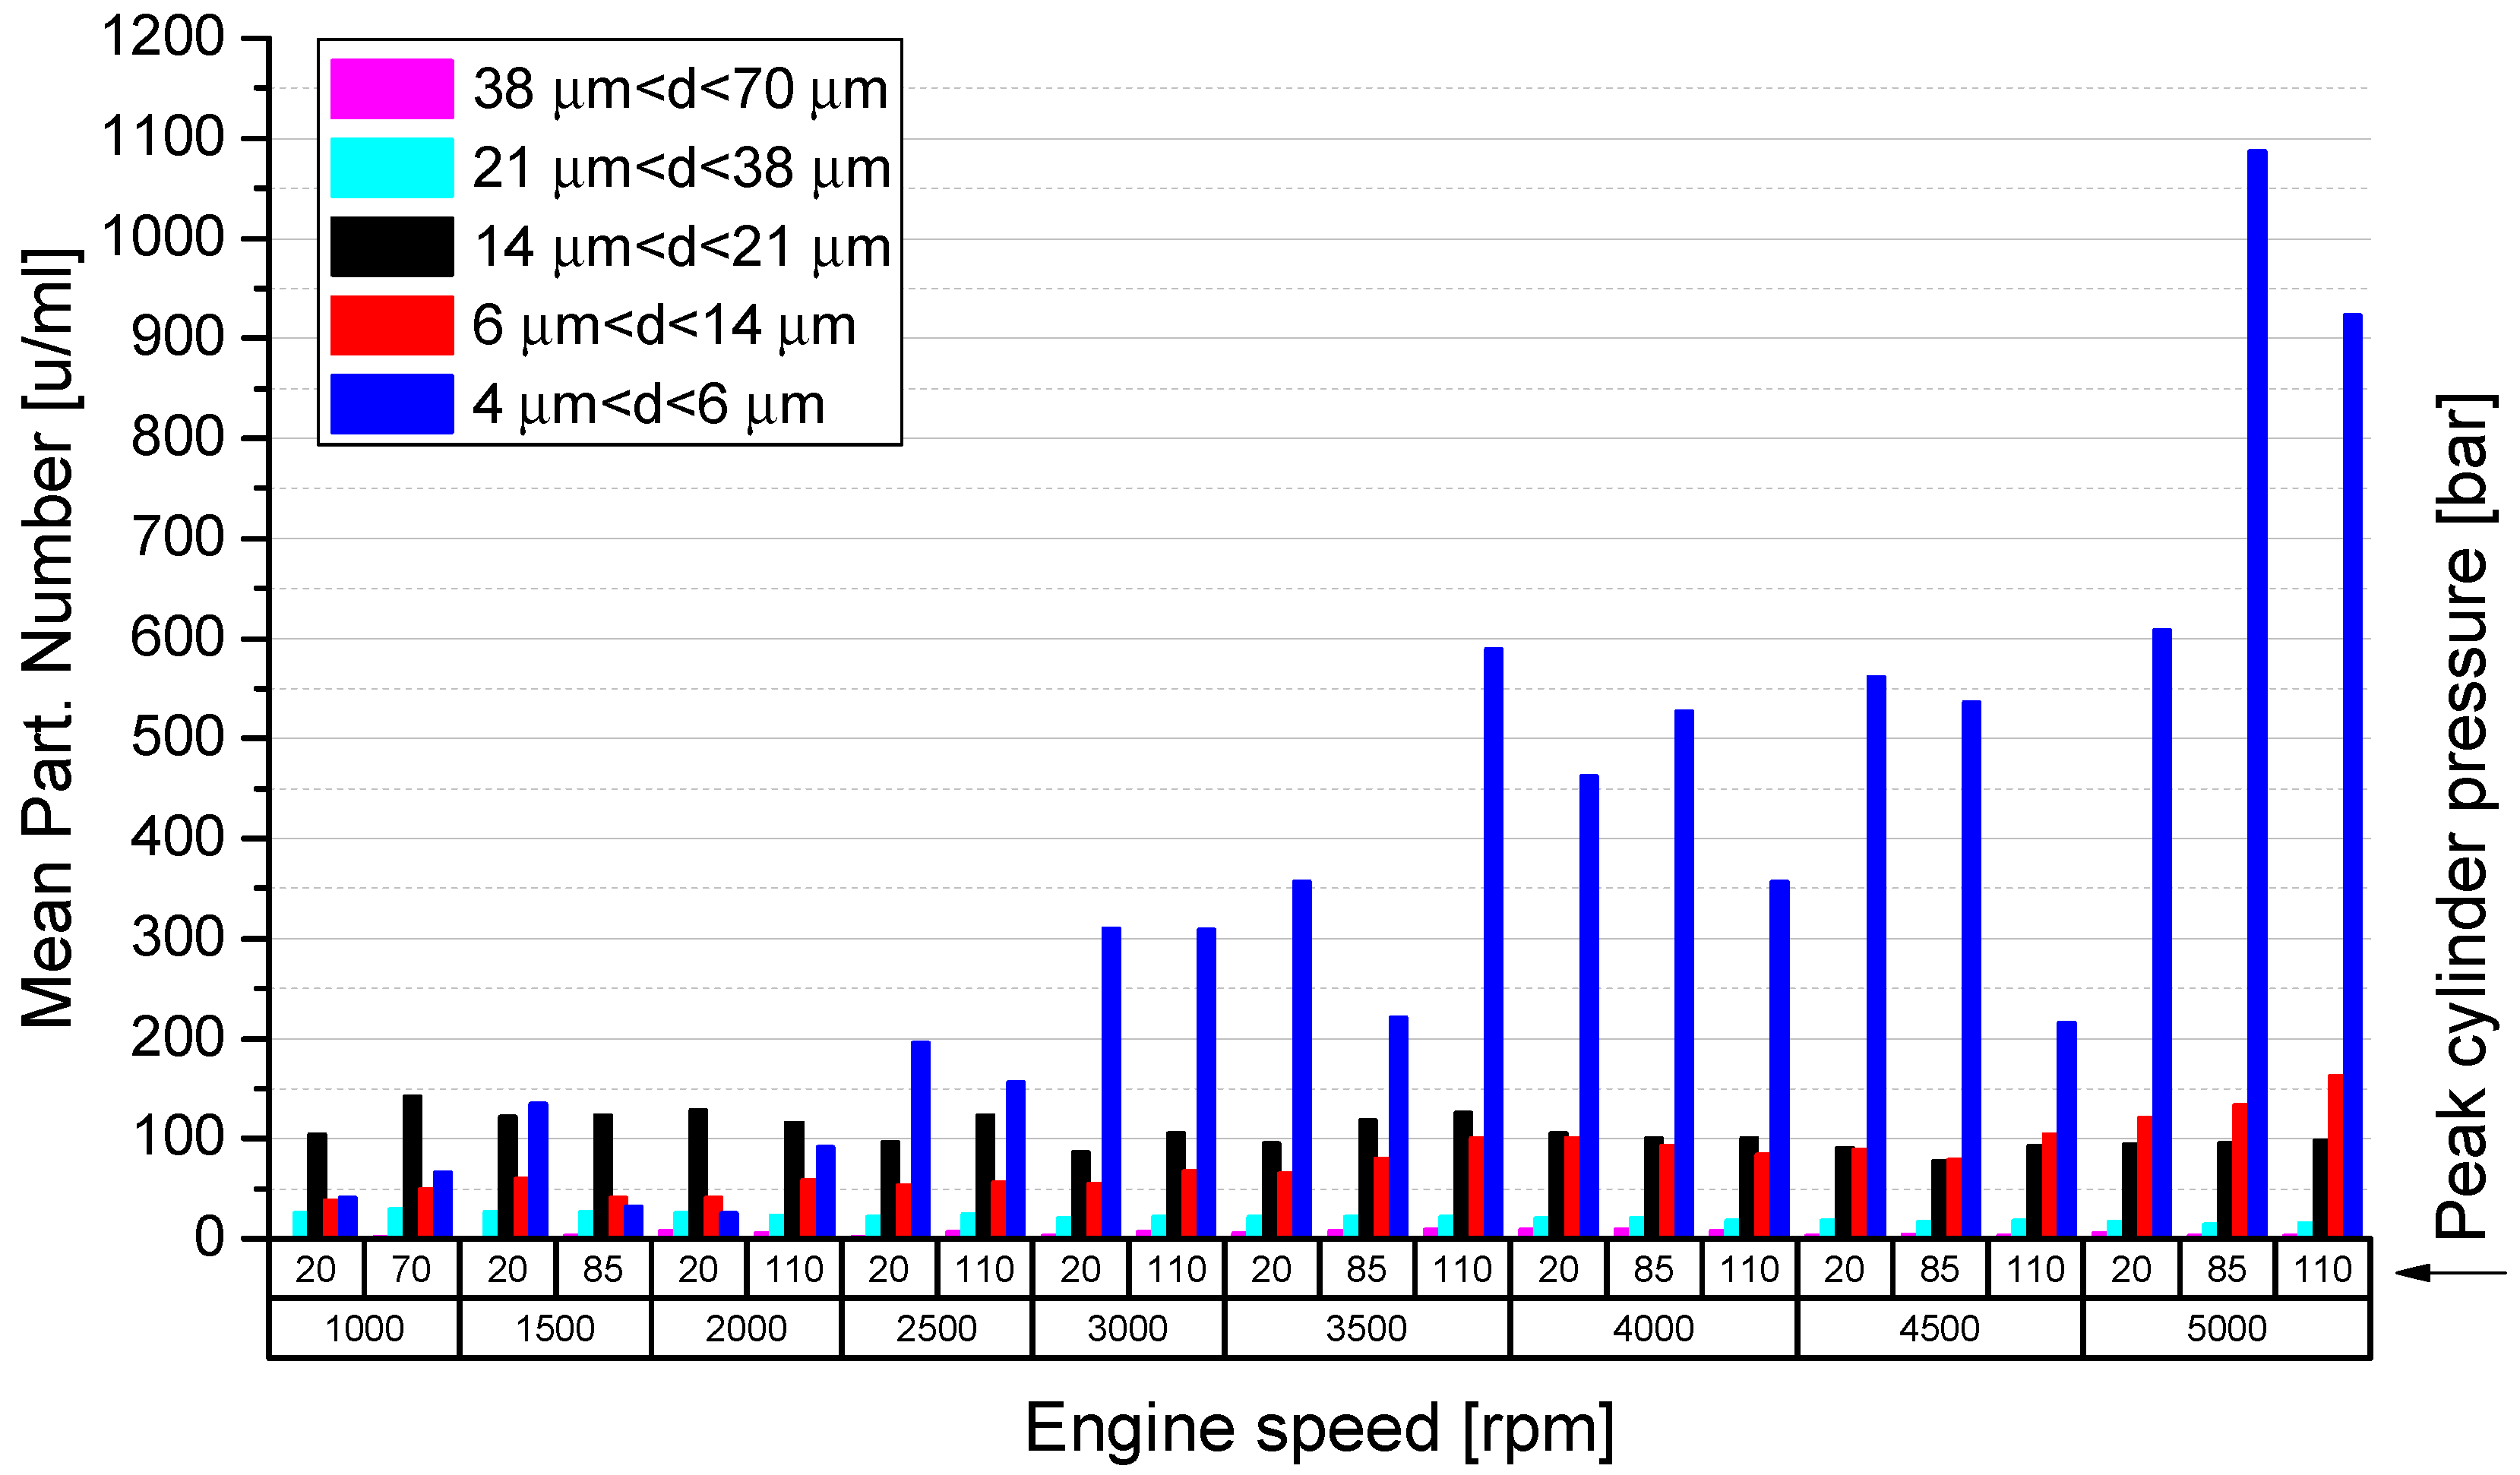
To this aim, the performed analysis consisted of taking the complete raw data set for all the testing points; the results are plotted in Figure 6. This shows the mean particle number classified into groups according to their diameter for each test point. It should be noted that, in contrast to the data shown in Figure 2 where the particle number was plotted as accumulated data, here, the data obtained from the optical sensor has been post-processed to classify the particles in groups of diameter size. For example, to obtain the first range (4 m < d < 6 m), the mean particle number per milliliter of the group of 6 m was subtracted from the mean of the group of 4 m, so only the desired range was left. The same procedure was applied to obtain the other ranges. This representation allows us to better identify the testing conditions with a higher or lower presence of one specific particle size.
Some trends can be extracted from Figure 6, especially for particles of smaller diameters, up to 21 m. Regarding the first group, with particles from 4 to 6 m, it is clear that the amount of generated particles of this size is concentrated mainly at the right-hand side of the plot, with operating conditions of high engine speed from 3500 rpm. In this region, the overall trend indicates a strong dependence between the increase in the mean particle number and the engine speed. For instance, at 5000 rpm and 110 bar, the mean particle number is about 50% higher than the one measured at 4500 rpm and the same peak cylinder pressure, which shows a significant influence of the engine speed on generating small particles. This influence is also observed from 3500 rpm, as the mean particle number roughyl doubles with the speed increase at 100 bar. In this right-hand part of the plot, the peak cylinder pressure seems to have a similar effect as the engine speed on the generation of small particles, with higher values of mean particle number as the cylinder pressure increases, except for the tests performed at 3500 rpm.
Moving on to the following group, 6 to 14 m, the trend described for the previous group is no longer present to the same extent, and instead, the mean particle number remains stable for most of the testing conditions with a slight increase at the higher engine speeds; nonetheless, the effect of the cylinder pressure on the increase in the particles is more visible at higher engine speeds, as observed for the previous group.
The next group, with particles from 14 to 21 m, presents a clear trend again; it is observed that generated particles of this size are mainly concentrated at lower engine speeds, especially at 1500 and 2000 rpm. Then, the particle number is reduced significantly and stabilizes at higher engine speeds. This trend was expected, considering that it corresponds to the first 5.5 h of the engine running-in, the engine parts are starting to conform to each other. Therefore, it was expected to observe a greater generation of debris as the materials were worn out, especially particles of greater diameter at low engine speeds, characteristic of mixed and boundary lubrication. Additionally, for this particle diameter, the cylinder pressure does not present an apparent effect on the generation of particles; only at higher engine speeds are slightly higher values of mean particle number observed with the increase in the cylinder pressure.
Given the results of Section 3.1, where it was observed that most of the engine wear volume was generated in the middle of the running-in period, the mean particle number was also plotted in Figure 7 (note the larger scale used in this figure in comparison to Figure 6). In this stage of the running-in, the generated wear debris particles are significantly more than at the beginning of the engine operation, especially for particles of diameter 4 to 6 m. For this diameter group, an increasing trend in the amount of wear particles with engine speed is also observed, and it even starts at the lowest engine speeds, following an overall constant increase. For larger particles in the group of 14 to 21 m, the levels of wear remain fairly constant for all the testing conditions; however, when compared to the results in Figure 6, it is interesting to observe that the values of mean particle number are of the same level as the ones obtained at lower engine speeds at the beginning of the engine operation.
On the other hand, from Figure 5, as the generated wear volume changes with both the working conditions and the stage of the running-in, it is complex to select the best working conditions to run-in the engine correctly and in the shortest time possible. Nonetheless, it is important to note that most of the wear volume is generated in the middle of the running-in. Therefore, optimization of this process should be performed centered in this region. Here, and according to the right-hand panel of Figure 5 and Figure 7, the best conditions to run-in the engine used in this study would be at medium to high engine speeds, without much influence from varying the cylinder pressure, as the generation of wear debris between 4 and 21 m is the highest without a significant presence of wear debris of larger diameters.
4. Conclusions
- The novel wear debris detection system based on an optical counter sensor proved to be a valuable tool for studying the engine wear performance during running-in. Given that an appropriate running-in is essential for the future efficient operation of the engine, the information supplied by the sensor is highly valuable to monitor the wear generation in real time during this stage and to analyze and determine the best operation conditions that could optimize the running-in process. Additionally, the optical counter sensor is an available technology that could be implemented in any test-rig for academic and industrial applications, not limited to the running-in topic.
- In terms of equivalent wear volume, the results showed some unexpected trends. Overall, from Figure 4, it was found that most of the wear generation takes place in the middle of the running-in period, contrary to the expected situation where higher wear volumes would be observed at the beginning of the engine operation. Furthermore, during the first 5.5 h of operation (Figure 5, left panel), the equivalent wear volume remained constant for engine speeds higher than 2500 rpm.
- The results in terms of mean particle number showed that the generation of small wear debris with diameters between 4 and 6 m is significantly higher than the rest of the particle diameters, and its generation increases with the engine speed, both in the beginning and in the middle of the running-in. These small particles, however, do not represent severe wear conditions occurring in the engine. Instead, the generation of larger particles, of diameter 14 to 21 m, showed a more significant relevance; they were generated under all the testing conditions and, due to their size, contributed to the total equivalent wear volume to a greater extent.
- From the results obtained in terms of equivalent wear volume and mean particle number, it was found that for the engine used in this study, the best operation conditions that would optimize the engine running-in are medium to high engine speeds, without much influence from the selected peak cylinder pressure. These operating conditions would reduce the time needed to complete the engine running-in without promoting the generation of large wear debris that could lead to severe wear conditions and failure.
- A further conclusion of the study is that the engine running-in appears to be largely finished only after 75 h of operation. Commonly, a running-in time of 10 h is utilized in industry. Thus, the obtained results contradict this general rule and demonstrate that, at least for the engine used in this project, a much longer running-in operational period is required.
- Due to the measuring principle of the optical counter sensor and the possibility that some air bubbles may be identified as wear debris, the analysis of the results in this study is made by comparing trends rather than the measured absolute numbers.
Author Contributions
Formal analysis, S.B.; investigation, S.B. and H.A.; methodology, S.B. and H.A.; supervision, H.A.; writing—original draft, S.B.; writing—review and editing, H.A. All authors have read and agreed to the published version of the manuscript.
Funding
The publication was written at Virtual Vehicle Research GmbH in Graz, Austria. The authors would like to acknowledge the financial support within the COMET K2 Competence Centers for Excellent Technologies from the Austrian Federal Ministry for Climate Action (BMK), the Austrian Federal Ministry for Labour and Economy (BMAW), the Province of Styria (Dept. 12), and the Styrian Business Promotion Agency (SFG). The Austrian Research Promotion Agency (FFG) has been authorised for the programme management. Additionally, author Sophia Bastidas also acknowledges the Margarita Salas grant from the Universitat Politècnica de València, Ministerio de Universidades of Spain and the Plan de Recuperación, Transformación y Resiliencia funded by the European Union—NextGenerationEU.
Data Availability Statement
Data available on request.
Conflicts of Interest
The authors declare no conflict of interest.
References
- Blau, P. On the nature of running-in. Tribol. Int. 2005, 38, 1007–1012. [Google Scholar] [CrossRef]
- Khonsari, M.M.; Ghatrehsamani, S.; Akbarzadeh, S. On the running-in nature of metallic tribo-components: A review. Wear 2021, 474–475, 203871. [Google Scholar] [CrossRef]
- Taylor, R.; Morgan, N.; Mainwaring, R.; Davenport, T. How much mixed/boundary friction is there in an engine—And where is it? Proc. Inst. Mech. Eng. Part J J. Eng. Tribol. 2020, 234, 1563–1579. [Google Scholar] [CrossRef]
- Miao, C.; Guo, Z.; Yuan, C. Tribological behavior of co-textured cylinder liner-piston ring during running-in. Friction 2022, 10, 878–890. [Google Scholar] [CrossRef]
- Miró, G.; Tormos, B.; Allmaier, H.; Sander, D.; Knauder, C. Current trends in ICE wear detection technologies: From lab to field. ASRO J. Appl. Mech. 2017, 2, 32–41. [Google Scholar]
- Rao, X.; Sheng, C.; Guo, Z.; Yuan, C. A review of online condition monitoring and maintenance strategy for cylinder liner-piston rings of diesel engines. Mech. Syst. Signal Process. 2022, 165, 108385. [Google Scholar] [CrossRef]
- Gauthier, A.; Delvigne, T. Soot Induced Cam Wear in Diesel Engines: An Investigation Using Thin Layer Activation; SAE Technical Paper 2000-01-1990; SAE International: Warrendale, PA, USA, 2000. [Google Scholar] [CrossRef]
- Donghui, H.; Pingsheng, W.; Weizhi, T.; Dequan, Z.; Guangzhou, C.; Bangfa, N.; Xiuhua, Z.; Lin, L.; Guiying, Z.; Cunxiong, L.; et al. Study on real-time wear measurement of piston-ring and cylinder-bore in an engine using thin layer activation method. Appl. Radiat. Isotopes 2008, 66, 1073–1078. [Google Scholar] [CrossRef]
- Carden, P.; Pisani, C.; Andersson, J.; Field, I.; Lainé, E.; Bansal, J.; Devine, M. The effect of low viscosity oil on the wear, friction and fuel consumption of a heavy duty truck engine. SAE Int. J. Fuels Lubr. 2013, 6, 311–319. [Google Scholar] [CrossRef]
- Pant, H. Applications of the radiotracers in the industry: A review. Appl. Radiat. Isotopes 2022, 182, 110076. [Google Scholar] [CrossRef]
- Zhang, Y.; Mao, J.; Xie, Y. Engine Wear Monitoring with OLVF. Tribol. Trans. 2011, 54, 201–207. [Google Scholar] [CrossRef]
- Wu, J.; Mi, X.; Wu, T.; Mao, J.; Xie, Y. A wavelet-analysis-based differential method for engine wear monitoring via on-line visual ferrograph. Proc. Inst. Mech. Eng. Part J J. Eng. Tribol. 2013, 227, 1356–1366. [Google Scholar] [CrossRef]
- Cao, W.; Dong, G.; Chen, W.; Wu, J.; Xie, Y. Multisensor information integration for online wear condition monitoring of diesel engines. Tribol. Int. 2015, 82, 68–77. [Google Scholar] [CrossRef]
- Cao, W.; Dong, G.; Xie, Y.; Peng, Z. Prediction of wear trend of engines via on-line wear debris monitoring. Tribol. Int. 2018, 120, 510–519. [Google Scholar] [CrossRef]
- Sun, J.; Wang, L.; Li, J.; Li, F.; Li, J.; Lu, H. Online oil debris monitoring of rotating machinery: A detailed review of more than three decades. Mech. Syst. Signal Process. 2021, 149, 107341. [Google Scholar] [CrossRef]
- Miller, J.; Kitaljevich, D. In-line oil debris monitor for aircraft engine condition assessment. In Proceedings of the 2000 IEEE Aerospace Conference, Proceedings (Cat. No.00TH8484), Big Sky, MT, USA, 25 March 2000; Volume 6, pp. 49–56. [Google Scholar] [CrossRef]
- Talebi, A.; Hosseini, S.; Parvaz, H.; Heidari, M. Design and fabrication of an online inductive sensor for identification of ferrous wear particles in engine oil. Ind. Lubr. Tribol. 2021, 73, 666–675. [Google Scholar] [CrossRef]
- Hamilton, A.; Quail, F. Detailed state of the art review for the different online/inline oil analysis techniques in context of wind turbine gearboxes. J. Tribol. 2011, 133, 044001. [Google Scholar] [CrossRef]
- Hamilton, A.; Cleary, A.; Quail, F. Development of a novel wear detection system for wind turbine gearboxes. IEEE Sens. J. 2014, 14, 465–473. [Google Scholar] [CrossRef]
- Braithwaite, E.; Greene, A.; Train, B. The influence of MoS2 on the mechanism of piston-ring wear during the running-in process. Ind. Lubr. Tribol. 1999, 51, 274–286. [Google Scholar] [CrossRef]
- Mezghani, S.; Demirci, I.; Yousfi, M.; El Mansori, M. Running-in wear modeling of honed surface for combustion engine cylinderliners. Wear 2013, 302, 1360–1369. [Google Scholar] [CrossRef]
- Sander, D.; Allmaier, H.; Priebsch, H.; Reich, F.; Witt, M.; Skiadas, A.; Knaus, O. Edge loading and running-in wear in dynamically loaded journal bearings. Tribol. Int. 2015, 92, 395–403. [Google Scholar] [CrossRef]
- Yousfi, M.; Mezghani, S.; Demirci, I.; El Mansori, M. Smoothness and plateauness contributions to the running-in friction and wear of stratified helical slide and plateau honed cylinder liners. Wear 2015, 332–333, 1238–1247. [Google Scholar] [CrossRef]
- Sander, D.; Allmaier, H.; Priebsch, H.; Witt, M.; Skiadas, A. Simulation of journal bearing friction in severe mixed lubrication-Validation and effect of surface smoothing due to running-in. Tribol. Int. 2016, 96, 173–183. [Google Scholar] [CrossRef]
- Allmaier, H.; Sander, D.; Priebsch, H.; Witt, M.; Füllenbach, T.; Skiadas, A. Non-Newtonian and running-in wear effects in journal bearings operating under mixed lubrication. Proc. Inst. Mech. Eng. Part J J. Eng. Tribol. 2016, 230, 135–142. [Google Scholar] [CrossRef]
- Knauder, C.; Allmaier, H.; Salhofer, S.; Sams, T. The impact of running-in on the friction of an automotive gasoline engine and in particular on its piston assembly and valve train. Proc. Inst. Mech. Eng. Part J J. Eng. Tribol. 2018, 232, 749–756. [Google Scholar] [CrossRef]
- Zhmud, B. In-manufacture Running-in of Engine Components by Using the Triboconditioning® Process. In Proceedings of the 7th International Conference on Fracture Fatigue and Wear, Ghent, Belgium, 9–10 July 2018; pp. 671–681. [Google Scholar] [CrossRef]
- Akbarzadeh, A.; Khonsari, M.M. Effect of untampered plasma coating and surface texturing on friction and running-in behavior of piston rings. Coatings 2018, 8, 110. [Google Scholar] [CrossRef]
- Meng, Z.; Zhang, L.; Tian, T. Study of break-in process and its effects on piston skirt lubrication in internal combustion engines. Lubricants 2019, 7, 98. [Google Scholar] [CrossRef]
- Lindholm, P.; Björklund, S.; Calvo Cortes, M. Characterisation of wear on a cam follower system in a diesel engine. Wear 2003, 254, 1199–1207. [Google Scholar] [CrossRef]
- Torabi, A.; Akbarzadeh, S.; Salimpour, M.; Khonsari, M. On the running-in behavior of cam-follower mechanism. Tribol. Int. 2018, 118, 301–313. [Google Scholar] [CrossRef]
- Bartel, D.; Bobach, L.; Illner, T.; Deters, L. Simulating transient wear characteristics of journal bearings subjected to mixed friction. Proc. Inst. Mech. Eng. Part J J. Eng. Tribol. 2012, 226, 1095–1108. [Google Scholar] [CrossRef]
- Wu, T.; Peng, Y.; Du, Y.; Wang, J. Dimensional description of on-line wear debris images for wear characterization. Chin. J. Mech. Eng. 2014, 27, 1280–1286. [Google Scholar] [CrossRef]
- Blau, P. Running-in: Art or engineering? J. Mater. Eng. 1991, 13, 47–53. [Google Scholar] [CrossRef]
- ISO 4406:2021; Hydraulic Fluid Power—Fluids—Method for Coding the Level of Contamination by Solid Particles. ISO International Organization for Standardization: Geneva, Switzerland, 2021.
Figure 1.
Schematic diagram of the experimental setup.

Figure 2.
Raw data obtained from the optical wear debris sensor at 3000 rpm and 20 bar of maximum cylinder pressure.
Figure 2.
Raw data obtained from the optical wear debris sensor at 3000 rpm and 20 bar of maximum cylinder pressure.

Figure 3.
Repeatability tests after completing the engine running-in.

Figure 4.
Equivalent wear volume measured during the engine running-in at 2000 rpm and 20 and 110 bar peak cylinder pressures. d = wear particles’ size.
Figure 4.
Equivalent wear volume measured during the engine running-in at 2000 rpm and 20 and 110 bar peak cylinder pressures. d = wear particles’ size.

Figure 5.
Equivalent wear volume at 5.5 (left) and 41.5 h (right) of running-in.

Figure 6.
Total particle number per milliliter of oil, classified by size (d) for the first 5.5 h of running-in.
Figure 6.
Total particle number per milliliter of oil, classified by size (d) for the first 5.5 h of running-in.

Figure 7.
Total particle number per milliliter of oil classified by size (d) in the middle of the running-in period (41.5 h).
Figure 7.
Total particle number per milliliter of oil classified by size (d) in the middle of the running-in period (41.5 h).


Table 1.
Testing points for the engine running-in.
| Engine Speed [rpm] | Cylinder Pressure [bar] | Oil Pressure [bar] | Oil and Coolant Temperature [°C] | |
|---|---|---|---|---|
| 1 | 1000 | 20 | 2 | 90 |
| 2 | 1000 | 70 | 2 | 90 |
| 3 | 1500 | 20 | 2 | 90 |
| 4 | 1500 | 85 | 2 | 90 |
| 5 | 2000 | 20 | 2 | 90 |
| 6 | 2000 | 110 | 2 | 90 |
| 7 | 2500 | 20 | 4 | 90 |
| 8 | 2500 | 110 | 4 | 90 |
| 9 | 3000 | 20 | 4 | 90 |
| 10 | 3000 | 110 | 4 | 90 |
| 11 | 3500 | 20 | 4 | 90 |
| 12 | 3500 | 85 | 4 | 90 |
| 13 | 3500 | 110 | 4 | 90 |
| 14 | 4000 | 20 | 4 | 90 |
| 15 | 4000 | 85 | 4 | 90 |
| 16 | 4000 | 110 | 4 | 90 |
| 17 | 4500 | 20 | 4 | 90 |
| 18 | 4500 | 85 | 4 | 90 |
| 19 | 4500 | 110 | 4 | 90 |
| 20 | 5000 | 20 | 4 | 90 |
| 21 | 5000 | 85 | 4 | 90 |
| 22 | 5000 | 110 | 4 | 90 |
Disclaimer/Publisher’s Note: The statements, opinions and data contained in all publications are solely those of the individual author(s) and contributor(s) and not of MDPI and/or the editor(s). MDPI and/or the editor(s) disclaim responsibility for any injury to people or property resulting from any ideas, methods, instructions or products referred to in the content. |
© 2023 by the authors. Licensee MDPI, Basel, Switzerland. This article is an open access article distributed under the terms and conditions of the Creative Commons Attribution (CC BY) license (https://creativecommons.org/licenses/by/4.0/).
Share and Cite
MDPI and ACS Style
Bastidas, S.; Allmaier, H. Application of a Wear Debris Detection System to Investigate Wear Phenomena during Running-In of a Gasoline Engine. Lubricants 2023, 11, 237. https://doi.org/10.3390/lubricants11060237
AMA Style
Bastidas S, Allmaier H. Application of a Wear Debris Detection System to Investigate Wear Phenomena during Running-In of a Gasoline Engine. Lubricants. 2023; 11(6):237. https://doi.org/10.3390/lubricants11060237
Chicago/Turabian StyleBastidas, Sophia, and Hannes Allmaier. 2023. "Application of a Wear Debris Detection System to Investigate Wear Phenomena during Running-In of a Gasoline Engine" Lubricants 11, no. 6: 237. https://doi.org/10.3390/lubricants11060237
Note that from the first issue of 2016, this journal uses article numbers instead of page numbers. See further details here.