Cavitation Morphology Study between Hemispherical Textured Rotating Friction Pairs


1
School of Mechanical Engineering, Jiangsu University, Zhenjiang 212013, China
2
School of Mathematics and Computational Science, Tangshan Normal University, Tangshan 063000, China
3
The State Key Laboratory of Fluid Power and Mechatronic Systems, Zhejiang University, Hangzhou 310027, China
*
Author to whom correspondence should be addressed.
Lubricants 2022, 10(10), 249; https://doi.org/10.3390/lubricants10100249
Submission received: 19 August 2022
/
Revised: 20 September 2022
/
Accepted: 29 September 2022
/
Published: 3 October 2022
(This article belongs to the Special Issue Microstructure, Anti-wear Properties and Numerical Simulation of Lubricants)
Abstract
:A non-direct contact rotary interface uses a viscous fluid as the lubricant working medium. Because the oil film friction coefficient formed is extremely small, so it has great application potential in sealing, fluid transmission, thermosolutal convection, and bionics. Research on mechanical seals, wet clutches, and dynamic load bearing have proven that micro-textures can effectively improve friction and lubrication performance. However, when the fluid flows through the texture boundary, pressure disturbances can induce hydrodynamic cavitation. A pair of rotating disks are selected as our research objects. From the simulation and experiment research, we found that cavitation volume does not always increase with an increase in the texture rate, and cavitation always occurs preferentially at the outer diameter, so it is necessary to avoid machining the texture structure at the outer diameter of the mechanical seal end. Once the conditions for cavitation are met, a complete cavity is formed in approximately 0.015 s. The study also verifies that the cavitation gas originates from the phase change of the oil.
1. Introduction
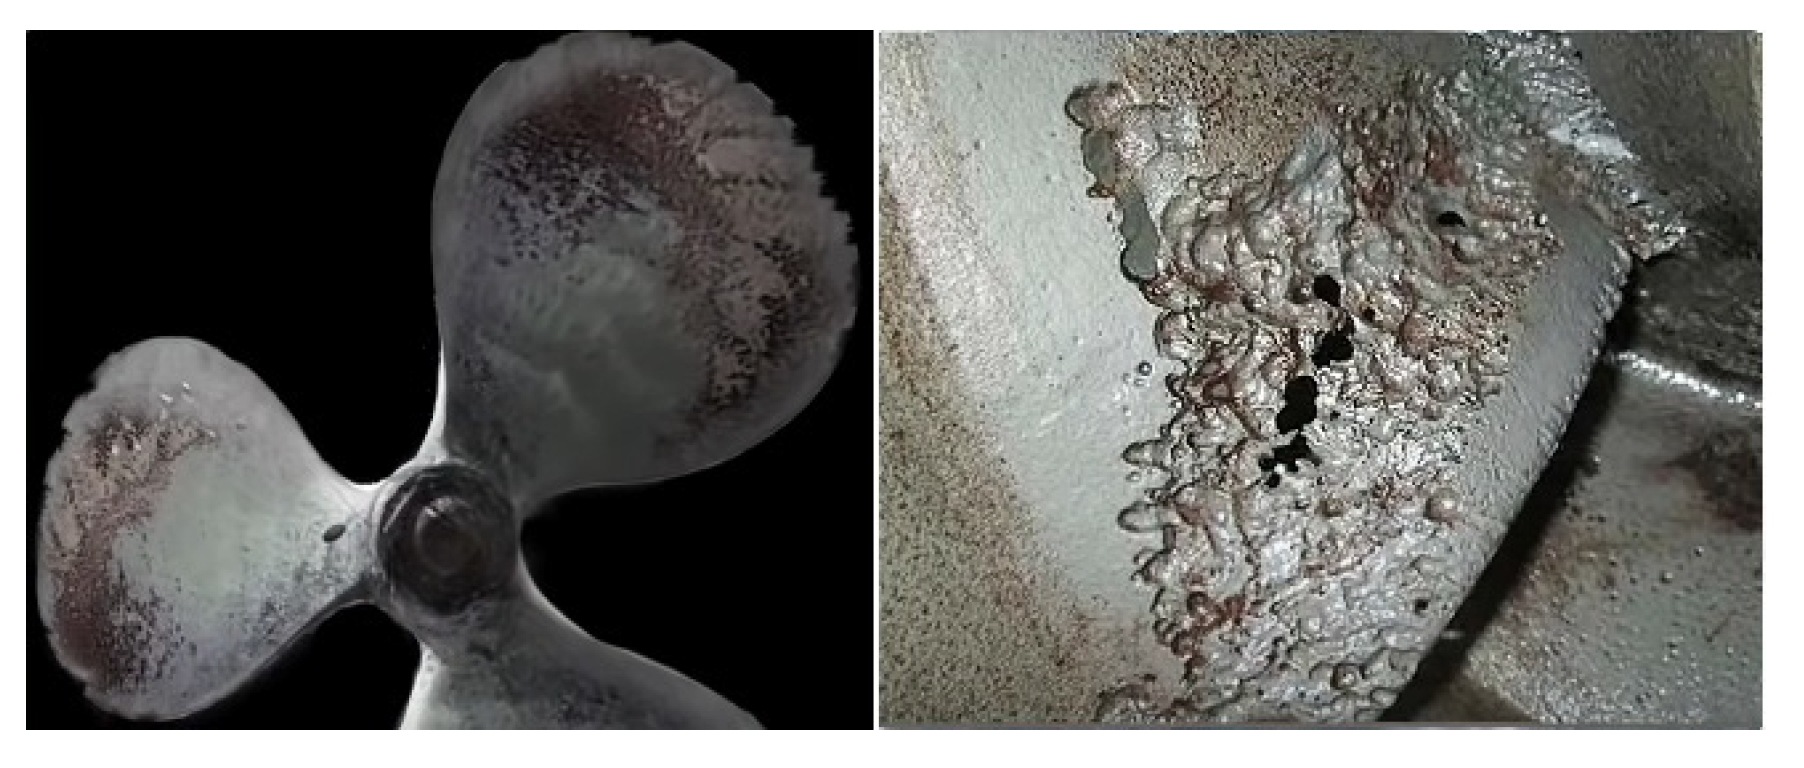
The first step in our perceptual understanding of cavitation came in 1893, when the speed of a British destroyer suddenly dropped during a voyage. A later inspection found that there were several perforations caused by cavitation effects on the propeller. Hydrodynamic cavitation is actually a phase transformation and an intricate transient microscopic phenomenon. Cavitations are usually detrimental to hydraulic machinery. When cavitation bubbles collapse, they can release tremendous energy into the surrounding fluid [1], produce local high temperatures (2300 K–4600 K) [2] and high pressures (1000 bar) [3], produce shock waves [4], damage the mechanical surface [5] (Figure 1), corrode the flow channel, and affect the service life and safety of hydraulic machinery. Therefore, it is of great significance to study the mechanism of cavitation and reduce cavitation occurrence in hydraulic machinery.
To date, there has been abundant research on the effects of flow fields and cavitation on hydraulic machinery. In 1998, Schouveiler et al., studied oil flow between the stationary disk and the rotating disk and found that when the Reynolds value was high, the turbulent flow broke the periodicity of the oil flow, and secondary flow appeared at the outer diameter [6]. Subsequently, Soong et al., analyzed the flow structure of oil between disks by the paraffin fluorescence method and found that, when the rotational speed of two disks is the same and the Reynolds number is increased, the flow field will be stable then complex and then stable again, which verified the secondary flow phenomenon discovered by Schouveiler [7]. Bilal [8] found that the fluid momentum response decreases with Reynolds number and Deborah number. Shah [9,10,11] revealed the characteristics of water-based hybrid nanofluid flows dispersed by single-walled carbon nanotubes and found that the concentration distribution decreases with increasing Reynolds number due to the dominant effect of inertial forces. In 2016, Pahlovy et al. established a mathematical model of drag torque based on two rotating coaxial disks and analyzed the influence of speed difference, clearance of friction pairs, and other parameters on drag torque [12]. They set up a visual test bed and collected the flow states between friction pairs and eventually found that the theoretical results were basically consistent with the change trends of the test results [13]. Pratomo et al. studied cavitation using the Zwart–Gerber–Belamri model based on the commercial computational fluid dynamics (CFD) software ANSYS. It was found that the cavitation model has a great influence on the performance of the system and that neglecting cavitation leads to the misalignment of the pressure distribution and verified the importance of considering cavitation effects when studying hydrodynamic systems [14]. Thomas Neupert et al., established a torque transfer model that considered the radial grooves of friction disks and analyzed the influence of oil viscosity temperature characteristics and gas–liquid two-phase flow on the transfer torque. It was found that groove structural parameters influence the transfer torque [15]. Liangyan et al., studied the performance characteristics of journal bearings lubricated with coupled stress fluid and established a modified Reynolds equation of coupled stress lubrication that considered the viscous effect and found that the viscous effect can improve the viscosity, friction coefficient, and maximum film pressure [16]. S. Klingl et al., demonstrated that different types of rotating disk boundary layers are absolutely unstable, and for radial inward and outward flow, no absolute instability is found for narrow disc spacing and merging boundary layers [17].
Cavitation is generally considered to have negative effects on hydraulic machinery. Muhammad Yusvika et al., analyzed that cavitation on ship propellers would cause vibrations and noise [18]. Matevž Dular et al., used two high-speed cameras to capture the movement and collapse process of cavitation bubbles, which produce circular dimples in the aluminum film when they collapse [19]. Marcio Abreu et al., found that heavy diesel engines are most likely to be destroyed by cavitation erosion in the part exposed to liquid [20]. Xinping Long et al., found that intensive cavitation phenomenon in a jet fish pump causes dangerous flow in the surrounding flow field and increases the pressure [21]. Conversely, cavitation also has many promising applications, such as surface cleaning [22], emulsification [23], sonophoresis [24], etc. Simulations and experiments are usually used to analyze cavitation effects. Hidalgo used the Zwart–Gerber–Belamri cavitation model to analyze the three-dimensional unsteady cavitation flow around the plane convex hydrofoil, and the numerical results clearly showed the processes of cavitation development, shedding, and collapse under high-speed cavitation [25]. Qureshi et al. [26] studied flow behavior of non-Newtonian fluid through orthogonal porous surfaces, and researched the heat flux and mass transfer source of non-Newtonian CNT fluid. Pahlovy et al., observed the flow state of oil between friction disks on rough surfaces using a visual wet clutch test rig and found that few long strip bubbles appeared under low rotational speed and that the number and volume of bubbles increased with an increase in rotational speed [27]. Ebrahim et al. researched high-speed visualization of cavitation using a cavitation generator, analyzed the spatial structure and time evolution of local cavitation in non-constant flow regime, and found that for a cylindrical vacuole generator can effectively mitigate large-scale cloud cavitation [28]. Boubendir et al. investigated the effect of using non-Newtonian fluids as lubricants to analyze the performance of multi-self-lubricating porous plain bearings and found that non-Newtonian fluids reduced the bearing load-bearing performance compared to Newtonian lubricants [29]. Batchelor [30] and Stewartson [31] were the first to study the fluid flow in a system of infinitely large double rotating disks based on the study of single-disk flow. Batchelor simplified the control equations for incompressible axisymmetric flow and obtained the corresponding set of ordinary differential equations. He pointed out that in co-rotating and rotor-stator systems, a fluid boundary layer is formed on the surface of both disks, and radial flow occurs mainly inside the boundary layer. In the “inviscid core” between the two boundary layers, the fluid rotates with constant angular velocity as a rigid body without radial flow, and Stewartson solves a similar set of equations for the flow of two infinitely large rotating disks in Reynolds number power form. A different conclusion from Batchelor was obtained. He proposed that in a system of rotating disks, the boundary layer is formed only on the surface of the rotating disk, while the fluid between the disks remains stationary.
Prior work found that the surface texturing of friction pairs can effectively improve the lubrication performance and increase the bearing capacity. Mizuki et al., visualized the flow of lubricating oil on the texture surface using fluorescent particles as tracking targets. By observing particles’ movement, they found that the flow speed of lubricating oil in texture dimples decreased significantly [32]. Lbatan et al., studied the boundary friction of friction pairs and subsequently found that oil stored in the micro-cavity of negative surface texture dimples can effectively trap abrasive particles to reduce further wear. At high speeds, the dynamic pressure generated by micro-dimples can effectively prevent direct contact with the friction disk [33]. Fan et al. studied the working performance of surface texture with uncertain size using a statistical model and found that the most critical geometric parameter affecting liquid film lubrication is texture dimple depth, and the key parameter affecting liquid film bearing capacity is the proportion of texture area [34]. Slawomir et al. carried out friction tests on textured surfaces and polished surfaces at room temperature and high temperature (80 °C) using a needle disc friction test machine. The tested components were lubricated with different oils, and it was found that texture always produced beneficial lubrication performance [35]. Weili et al. proposed a method that combined surface deformation with longitudinal or transverse micro-vibration and found that vibration could pull out the lubricating oil trapped in texture dimples, thus increasing the thickness of the lubricating oil film and improving the bearing capacity [36].
Due to the literature summary, cavitation in hydromechanics has been extensively studied, but most of them focus on groove cavitation and cavitation macroscopic morphology. In this paper, the mechanism of cavitation induced by hemispherical texture is studied from microscopic view, and the relationship between pressure and cavitation, and the phase change law of vapor and oil fluid are visualized. The method of weakening cavitation is also proposed, which can provide reference for the design of surface structure of internal combustion engine cylinder, dynamic pressure bearing, and mechanical seal.
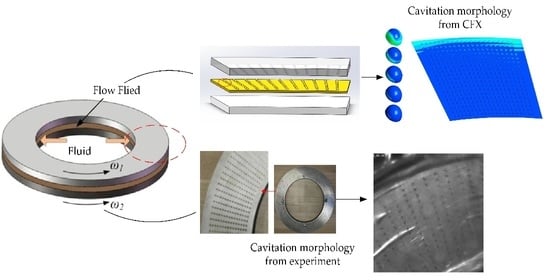
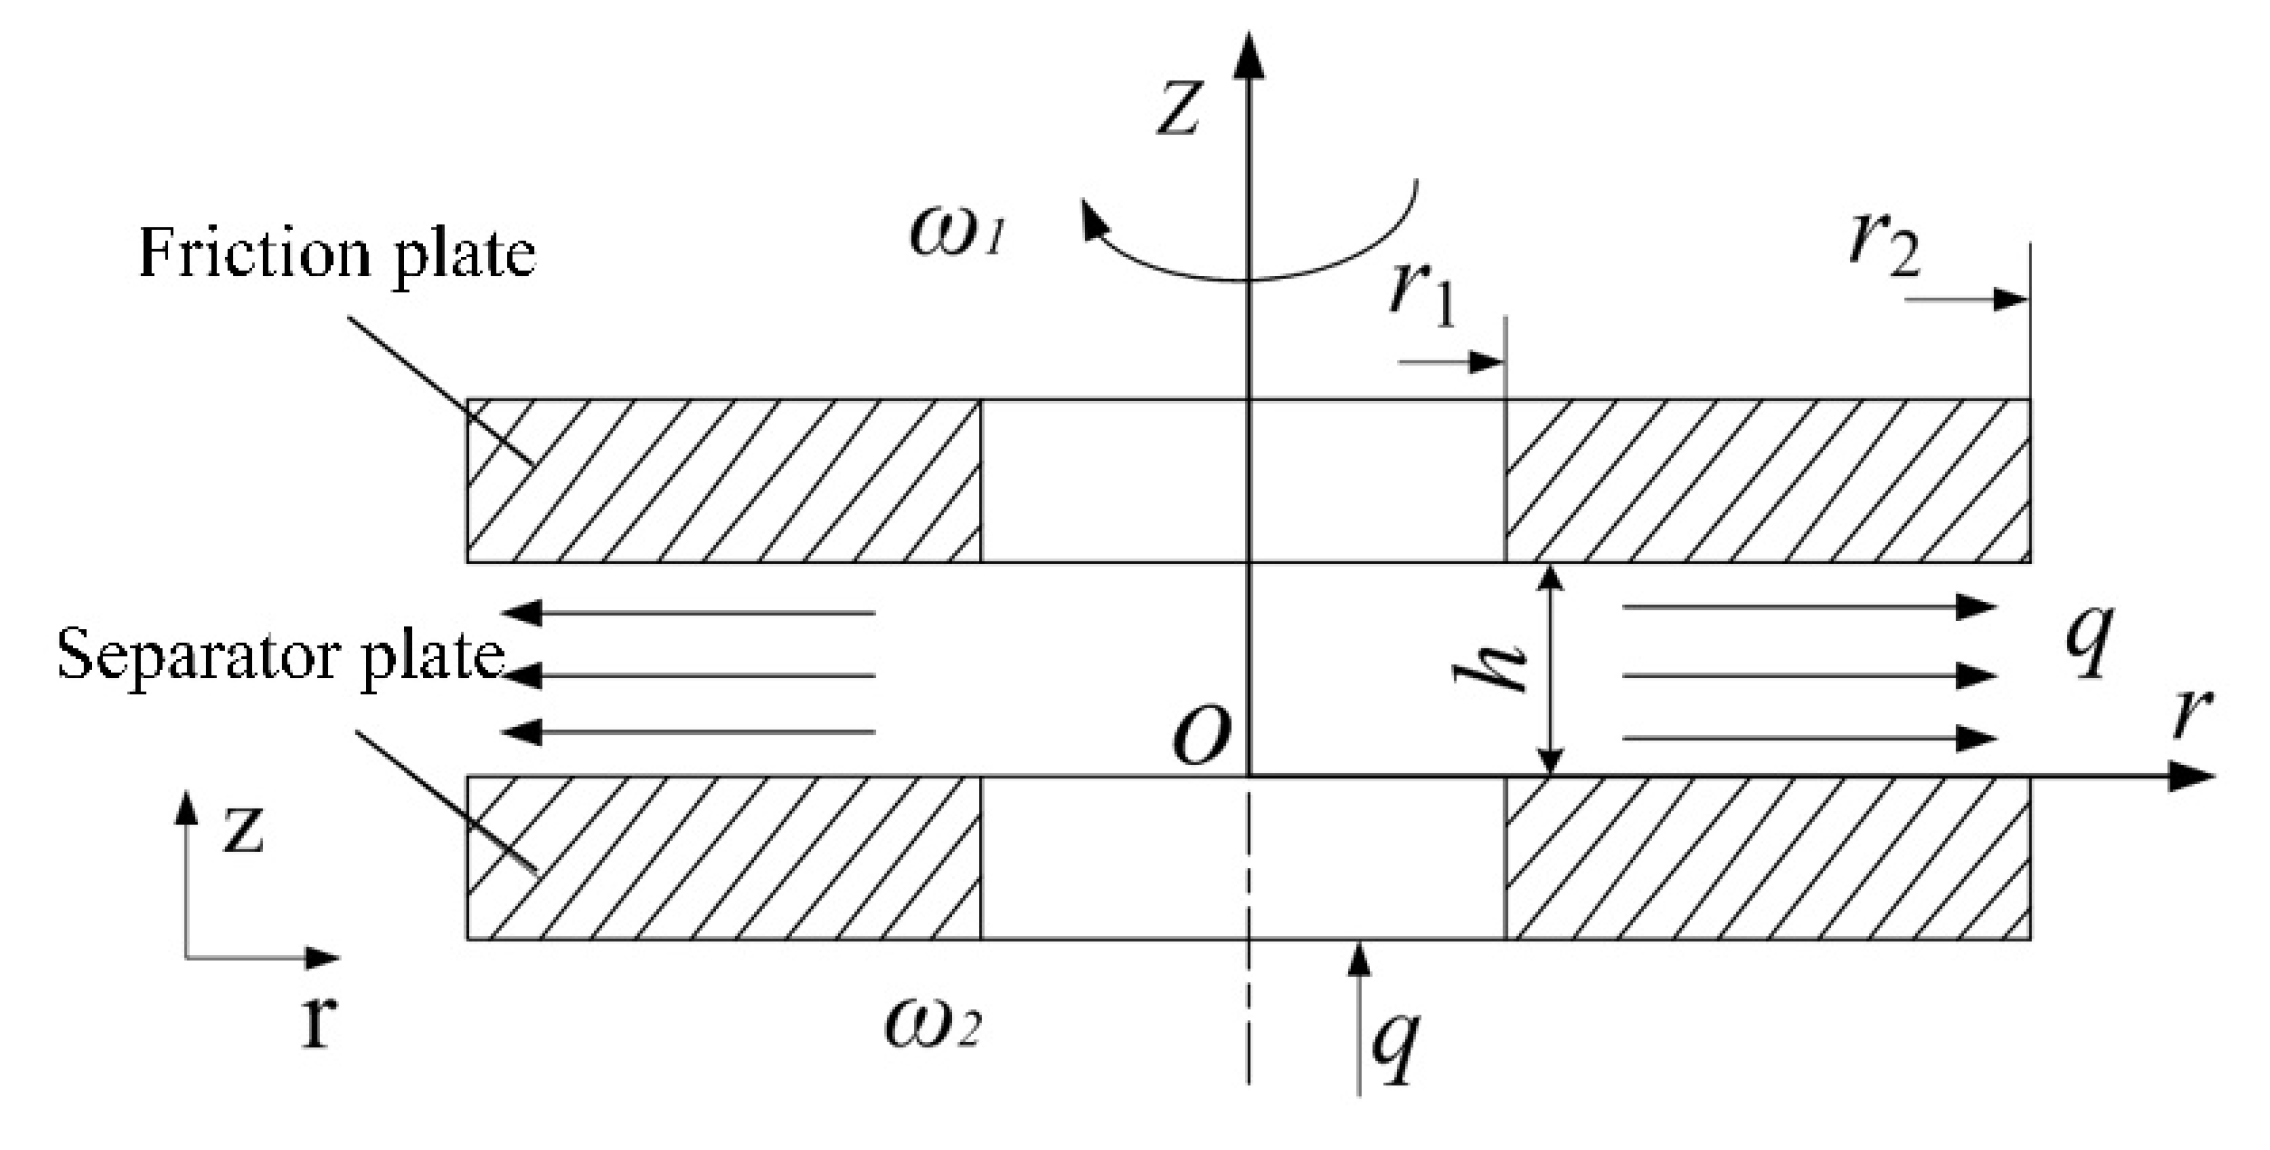
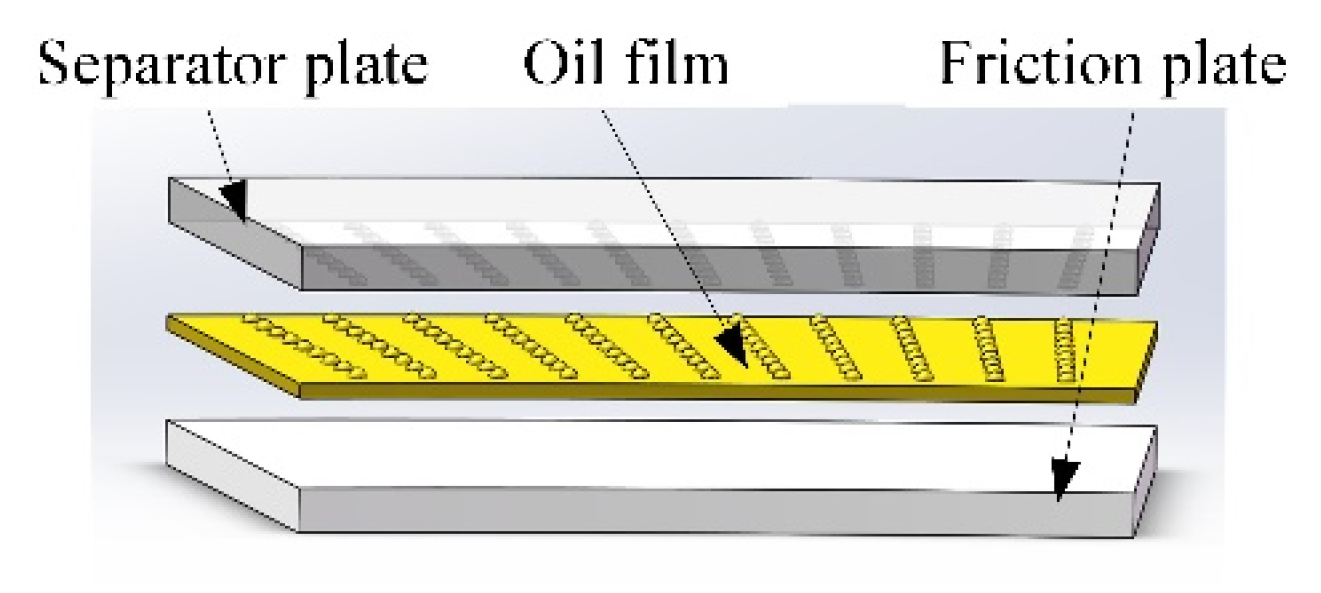
The simplified friction pair model is shown in Figure 2. The cavitation phenomena were simulated and experimentally analyzed. The specific implemented methodologies include governing equations analysis, geometric and CFD model study, CFX simulation research, test bench construction, and experimental result analysis. In addition, the change in cavitation bubble morphology, transfer between gas phase and liquid phase, and change in cavitation bubble structure were also systematically studied.
2. Modeling Analysis
2.1. Multiphase Model
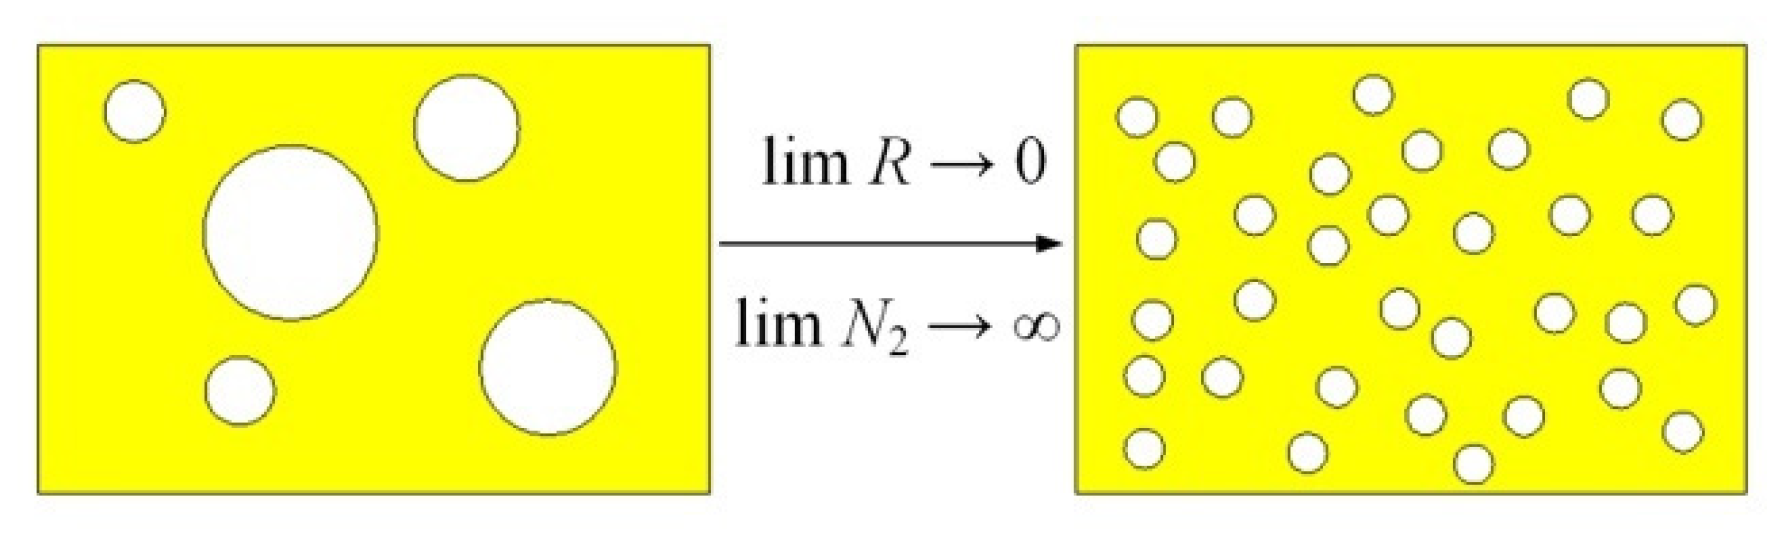
In cavitation flow calculation, the homogeneous flow model ignores the difference in gas–liquid two-phase flow parameters, so it is easier to converge [37], and the gas and liquid phases are treated as a single phase flow, as is shown in Figure 3, where R is the radius of the cavitation bubble and N2 is the number of cavitation bubbles.
In addition, it is assumed that the gas phase and liquid phase have the same velocity and saturation temperature and that the parameter transport volume between the two phases is the same:
where φ is a general scalar of the flow field, χ is the different phase of fluid and is generally presented as a subscript, ρ is the fluid density in kg/m3, NP is the phase number in the fluid, λ is the volume fraction of each phase, U is the vector velocity in m/s, Γ is the phase diffusion ability in kg/(m·s), and SM is the mass source in kg/(m3·s).
2.2. Turbulence Model
The shear stress transport (SST) turbulence model is one of the best comprehensive vortex viscosity models available and has been very widely used in recent years. Therefore, it is highly respected by model researchers and those who have experience in using turbulence models. The basic principle of the standard SST turbulence model is to use the k-ω model near the wall, and the k-ε model in the outer boundary layer and free shear. With the development of computational power in recent years, computational fluid dynamics has also developed rapidly, allowing one to use finer meshes and more accurate algorithms to compute more complex cases, such as large Eddy simulations. The application of the SST turbulence model to computational chemistry is more in the areas of combustion, explosions, and aerodynamic thermodynamics.
When oil flows into the dimple, vortex flow will be generated [38,39], so we select the turbulence model in the simulation calculation. The gap between the two friction plates is small, so the film thickness is very thin here, and since the SST model [39,40,41] has excellent applicability to the boundary layer and free shear layer of the film flow field, we selected this model for our research. The turbulent viscosity equation, k equation, ω equation, and weighting function equation are as follows [41]:
where ωh is the turbulence frequency, Pk is the incidence of turbulence caused by viscous forces in kg/(m·s3), μt and μ are the turbulent viscosity and dynamic viscosity, respectively, in kg/(m·s), υ is the kinematic viscosity in m2/s, y is the distance near the wall in m, Pkb and Pωb are buoyant turbulence terms, S′ is the strain rate, and the other constants are β″ = 0.09, β′ = 0.075, α = 5/9, σk = σω =2, σω2 =1/0.856.
2.3. Cavitation Model
In cavitation flow, there is convective exchange of mass and volume fractions between the gas phase and the liquid phase [37], where the transport equation of the gas volume is:
where λv is the volume fraction of the gas phase, ρv is the gas density of the gas phase in kg/m3, u is the vector velocity of the gas phase in m/s, and is the source term for evaporation and condensation.
The Rayleigh–Plesset equation describes the growth of bubbles in liquids:
where RB is the cavitation bubble radius in m, pv is the pressure (saturated vapor pressure of liquid) in the cavitation bubble in Pa, p is the liquid pressure around the cavitation bubble in Pa, ρf and ρv are the liquid and vapor density, respectively, in kg/m3, and τ is the coefficient of the surface tension between the liquid and vapor in N∙m.
By ignoring the second derivative term and the surface tension term, Equation (11) can be simplified as:
The change rates of bubble volume and mass can be calculated as follows:
If the number of bubbles per unit volume in fluid is NB, then the volume fraction of vapor in the fluid λv can be expressed as:
then the total mass transfer rate between different phases (evaporation or condensation) per unit volume is:
where F is the empirical correction coefficient, which means the difference in evaporation or condensation rate. Generally, evaporation is faster than condensation. Empirically, evaporation mainly occurs at the nucleation point and decreases the density at this location. Therefore, the mass transfer rate equation of the evaporation process needs to be modified [41].
where λnuc is the volume fraction in the nucleation center.
When p ≤ pv, the evaporation process is shown in Equation (12) when p ≥ pv, the condensation process is shown in Equation (11). In the CFX simulations, we set the parameters in the Rayleigh–Plesset cavitation model as: RB = 2μm, λnuc = 5 × 10⁻⁴, Fvap = 50, Fcoud = 0.01.
2.4. Mesh Model
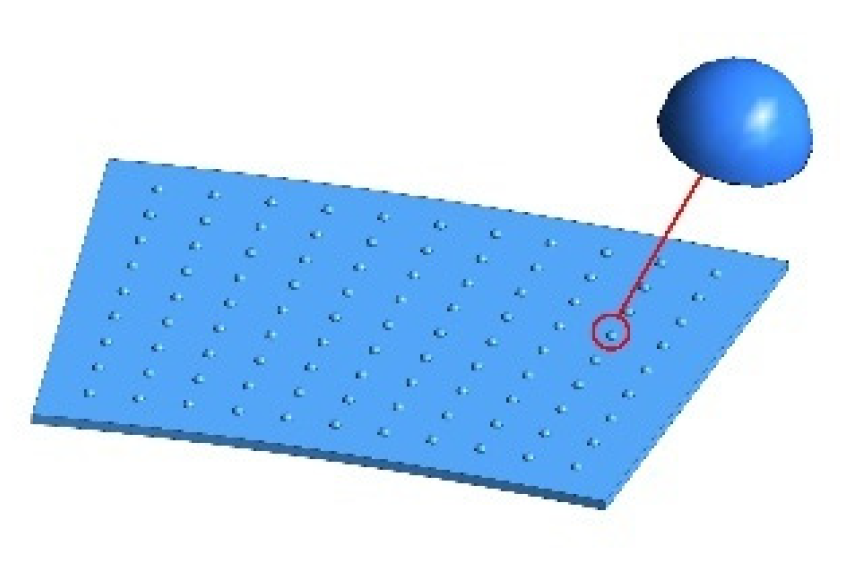
As the flow is circumferential, the finite element model is designed as a sector with a center angle of 12°, inner radius of 27 mm, and outer radius of 32 mm. The default film thickness h0 is 0.1 mm and the default texture depth ht is 0.0564 mm. The flow field model is shown in Figure 4.
When a separator plate is textured with regularly arranged micro-dimples, there will be a corresponding micro-convex, as is shown in Figure 5. When the texture rate is 3.205%, the distance between the two micro-convexes is 0.5 mm in the radial direction, and in the circumferential direction, the center angle of the two neighboring micro-dimples is 1°.
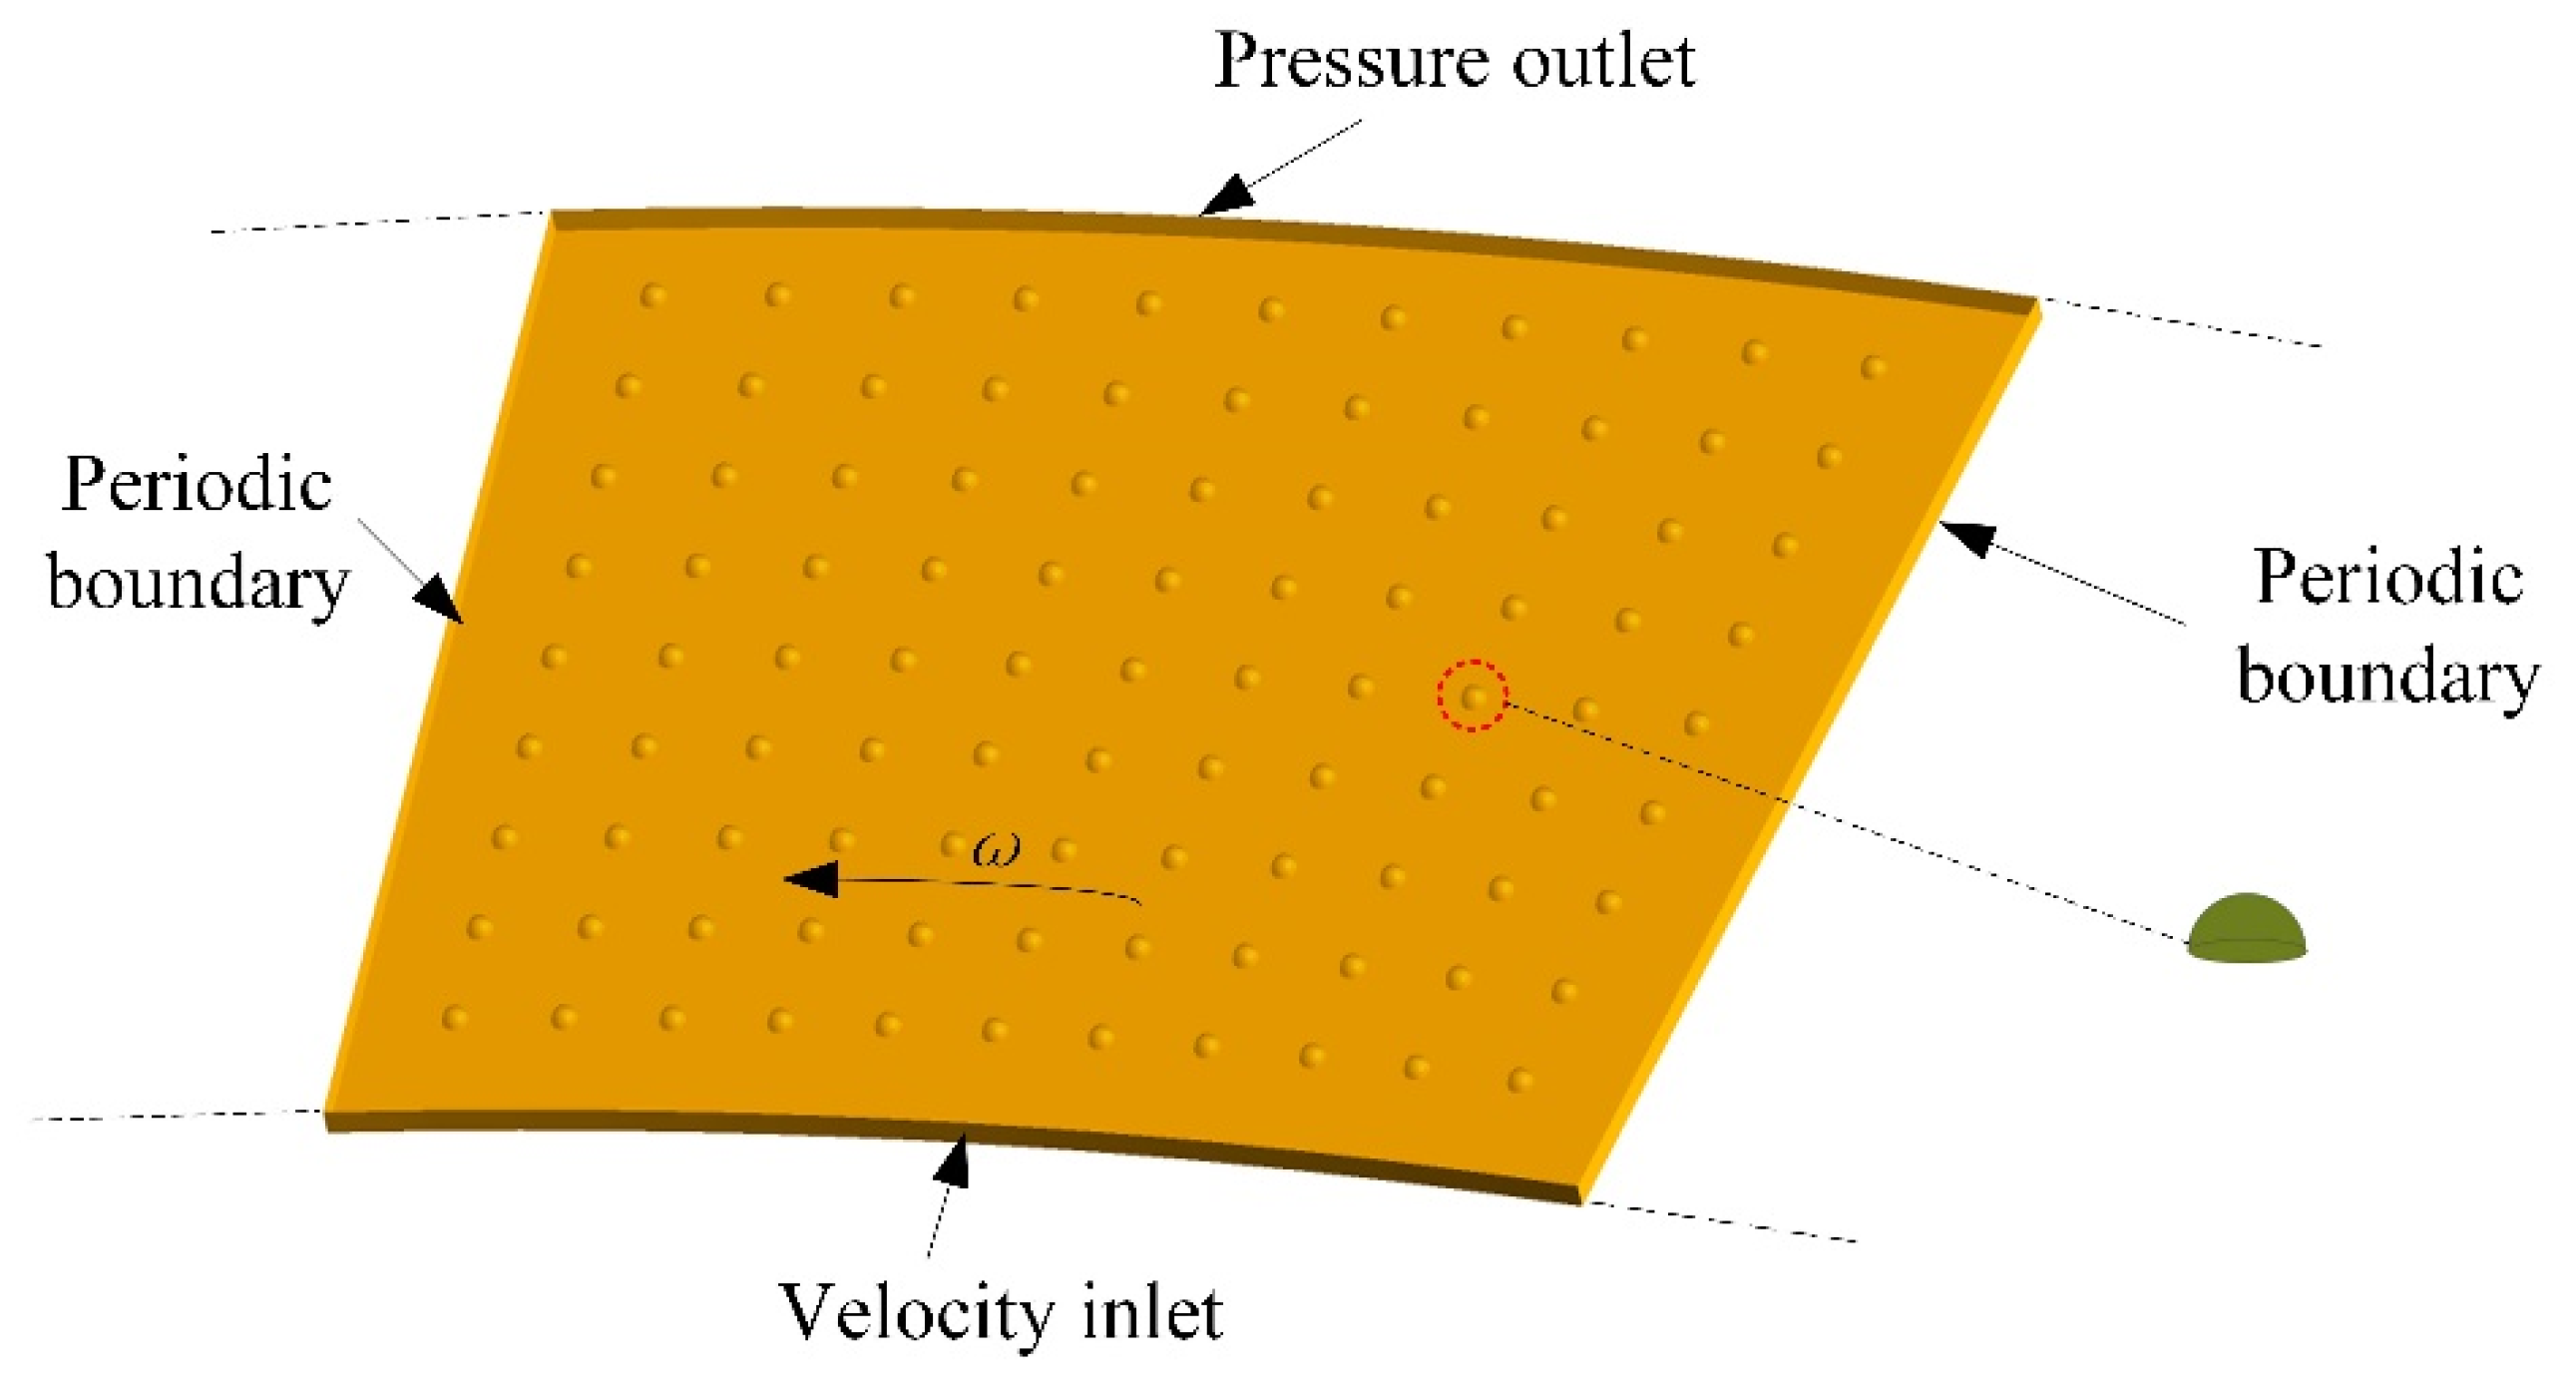
Cavitation mainly occurs under high-speed conditions, so the default rotation speed n is 6000 rpm, inlet pressure p0 is 0.08 MPa, and initial oil temperature T0 is 293 K. Figure 6 shows the boundary conditions in the flow field.
The properties of the oil and its vapor are shown in Table 1. Since temperature has a great influence on oil viscosity, a linear interpolation function is used to define the relationship between oil viscosity and temperature in CFX software [42].
where μx = 0.18 × 10⁻³ Pa·s, T is the temperature in Celsius, and μ40 is the oil dynamic viscosity at a temperature of 40 °C in Pa∙s.
3. Simulation Analysis
3.1. Cavitation under Different Texture Rate
In order to test the influence of the quality of mesh division on the accuracy and convergence of the calculation results, different mesh division schemes were made. The cavitation volume fraction was chosen as a measure of computational convergence and stability, and the total volume fraction of cavitation of a single oil film under the default operating conditions was calculated using the CFX steady-state simulation method. As shown in Table 2, five meshing schemes were designed, and different O-grid layers were used in Scheme 1 and Scheme 2, and it was found that the cavitation volume increased significantly with more O-grid layers. In Schemes 3 and 4, the number of circumferential layers in the non-texture region has been increased and the cavitation volume fraction has remained essentially stable. In Scheme 5, the number of meshes increased significantly after the number of O-grid layers was continued to be increased, and the cavitation volume fraction remains unchanged. Therefore, in order to save computational time and take into account the convergence and stability of the calculation, Scheme 4 is chosen as the final meshing division. The selected meshing parameters in this paper are as follows: 121 layers in the texture region, 124 layers in the non- texture region, and 11 layers in the O-grid.
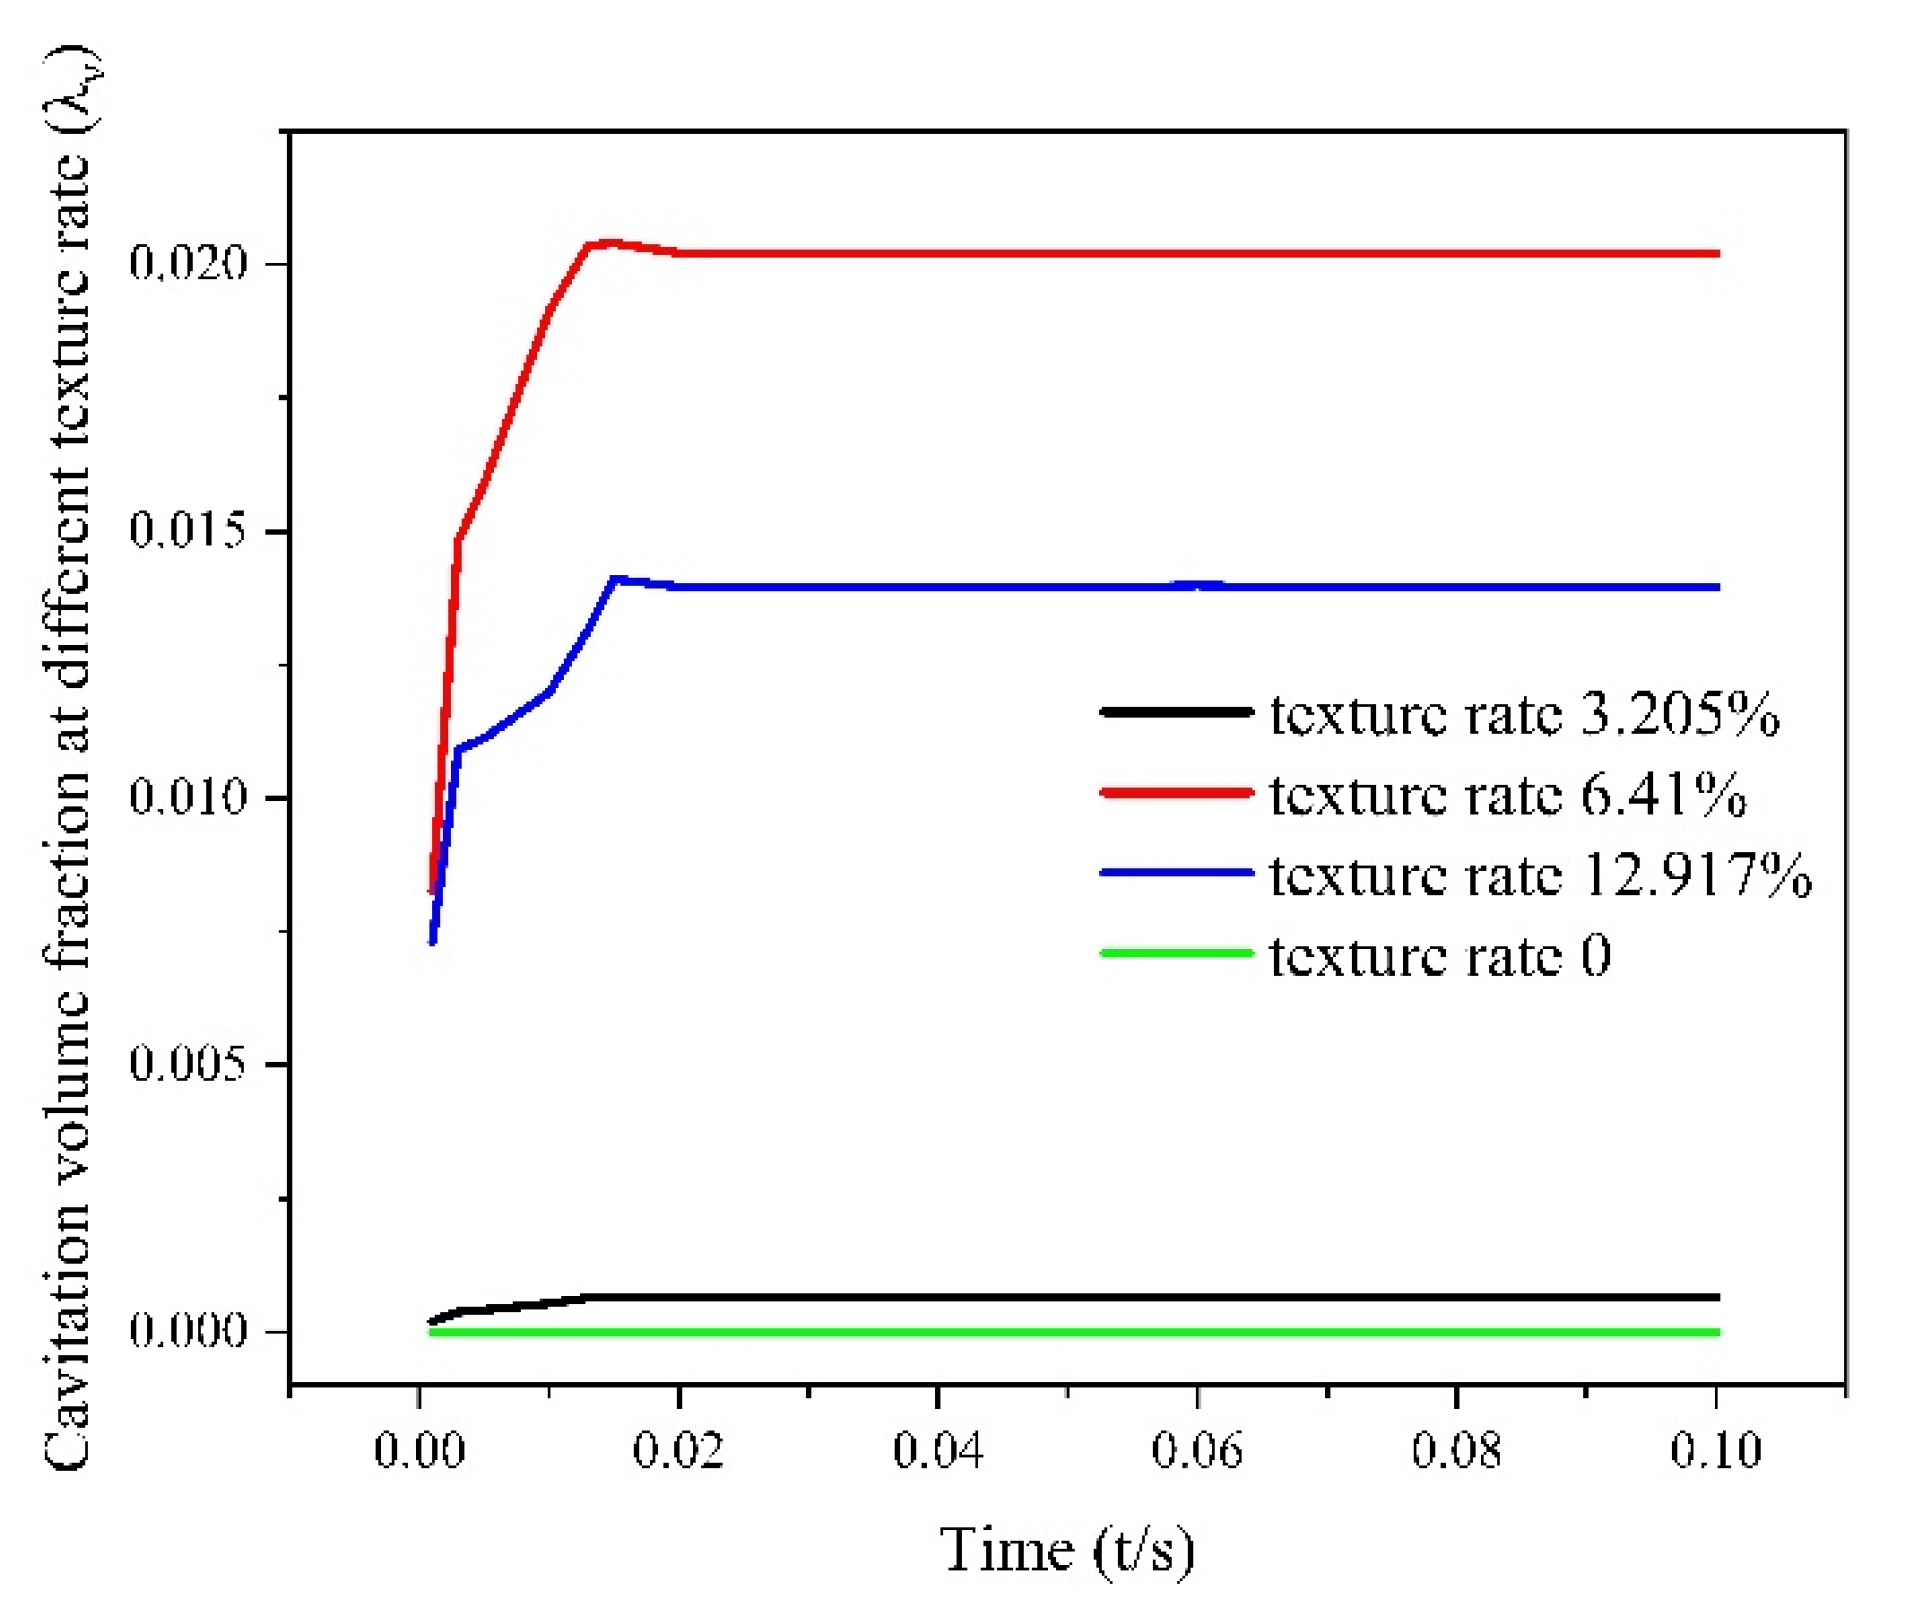
Texture, as a roughness element, is the leading cause of cavitation. The volume fraction is directly proportional to the cavitation intensity. First, the volume fraction of oil film cavitation is analyzed at the texture rates of 3.205%, 6.41%, and 12.917%. As is shown in Figure 7, when the texture rate is 0, there is no cavitation. Cavitation occurs when the texture ratio is 3.205%, but it is not obvious. When the texture rate is 6.41%, the cavitation volume fraction increases significantly, but when the texture rate is 12.917%, the value decreases, indicating that cavitation does not increase with an increase in texture rate. Therefore, we can surmise that there is an optimal texture rate that can reduce the occurrence of cavitation. Surface texture technology is widely used to increase the oil film load-bearing capacity in dynamic bearings and mechanical seals, but cavitation caused by texture is an unavoidable problem. Based on the results above, we can assume that there is an optimal weave rate that can combine the increase of oil film load capacity and the weakening of cavitation.
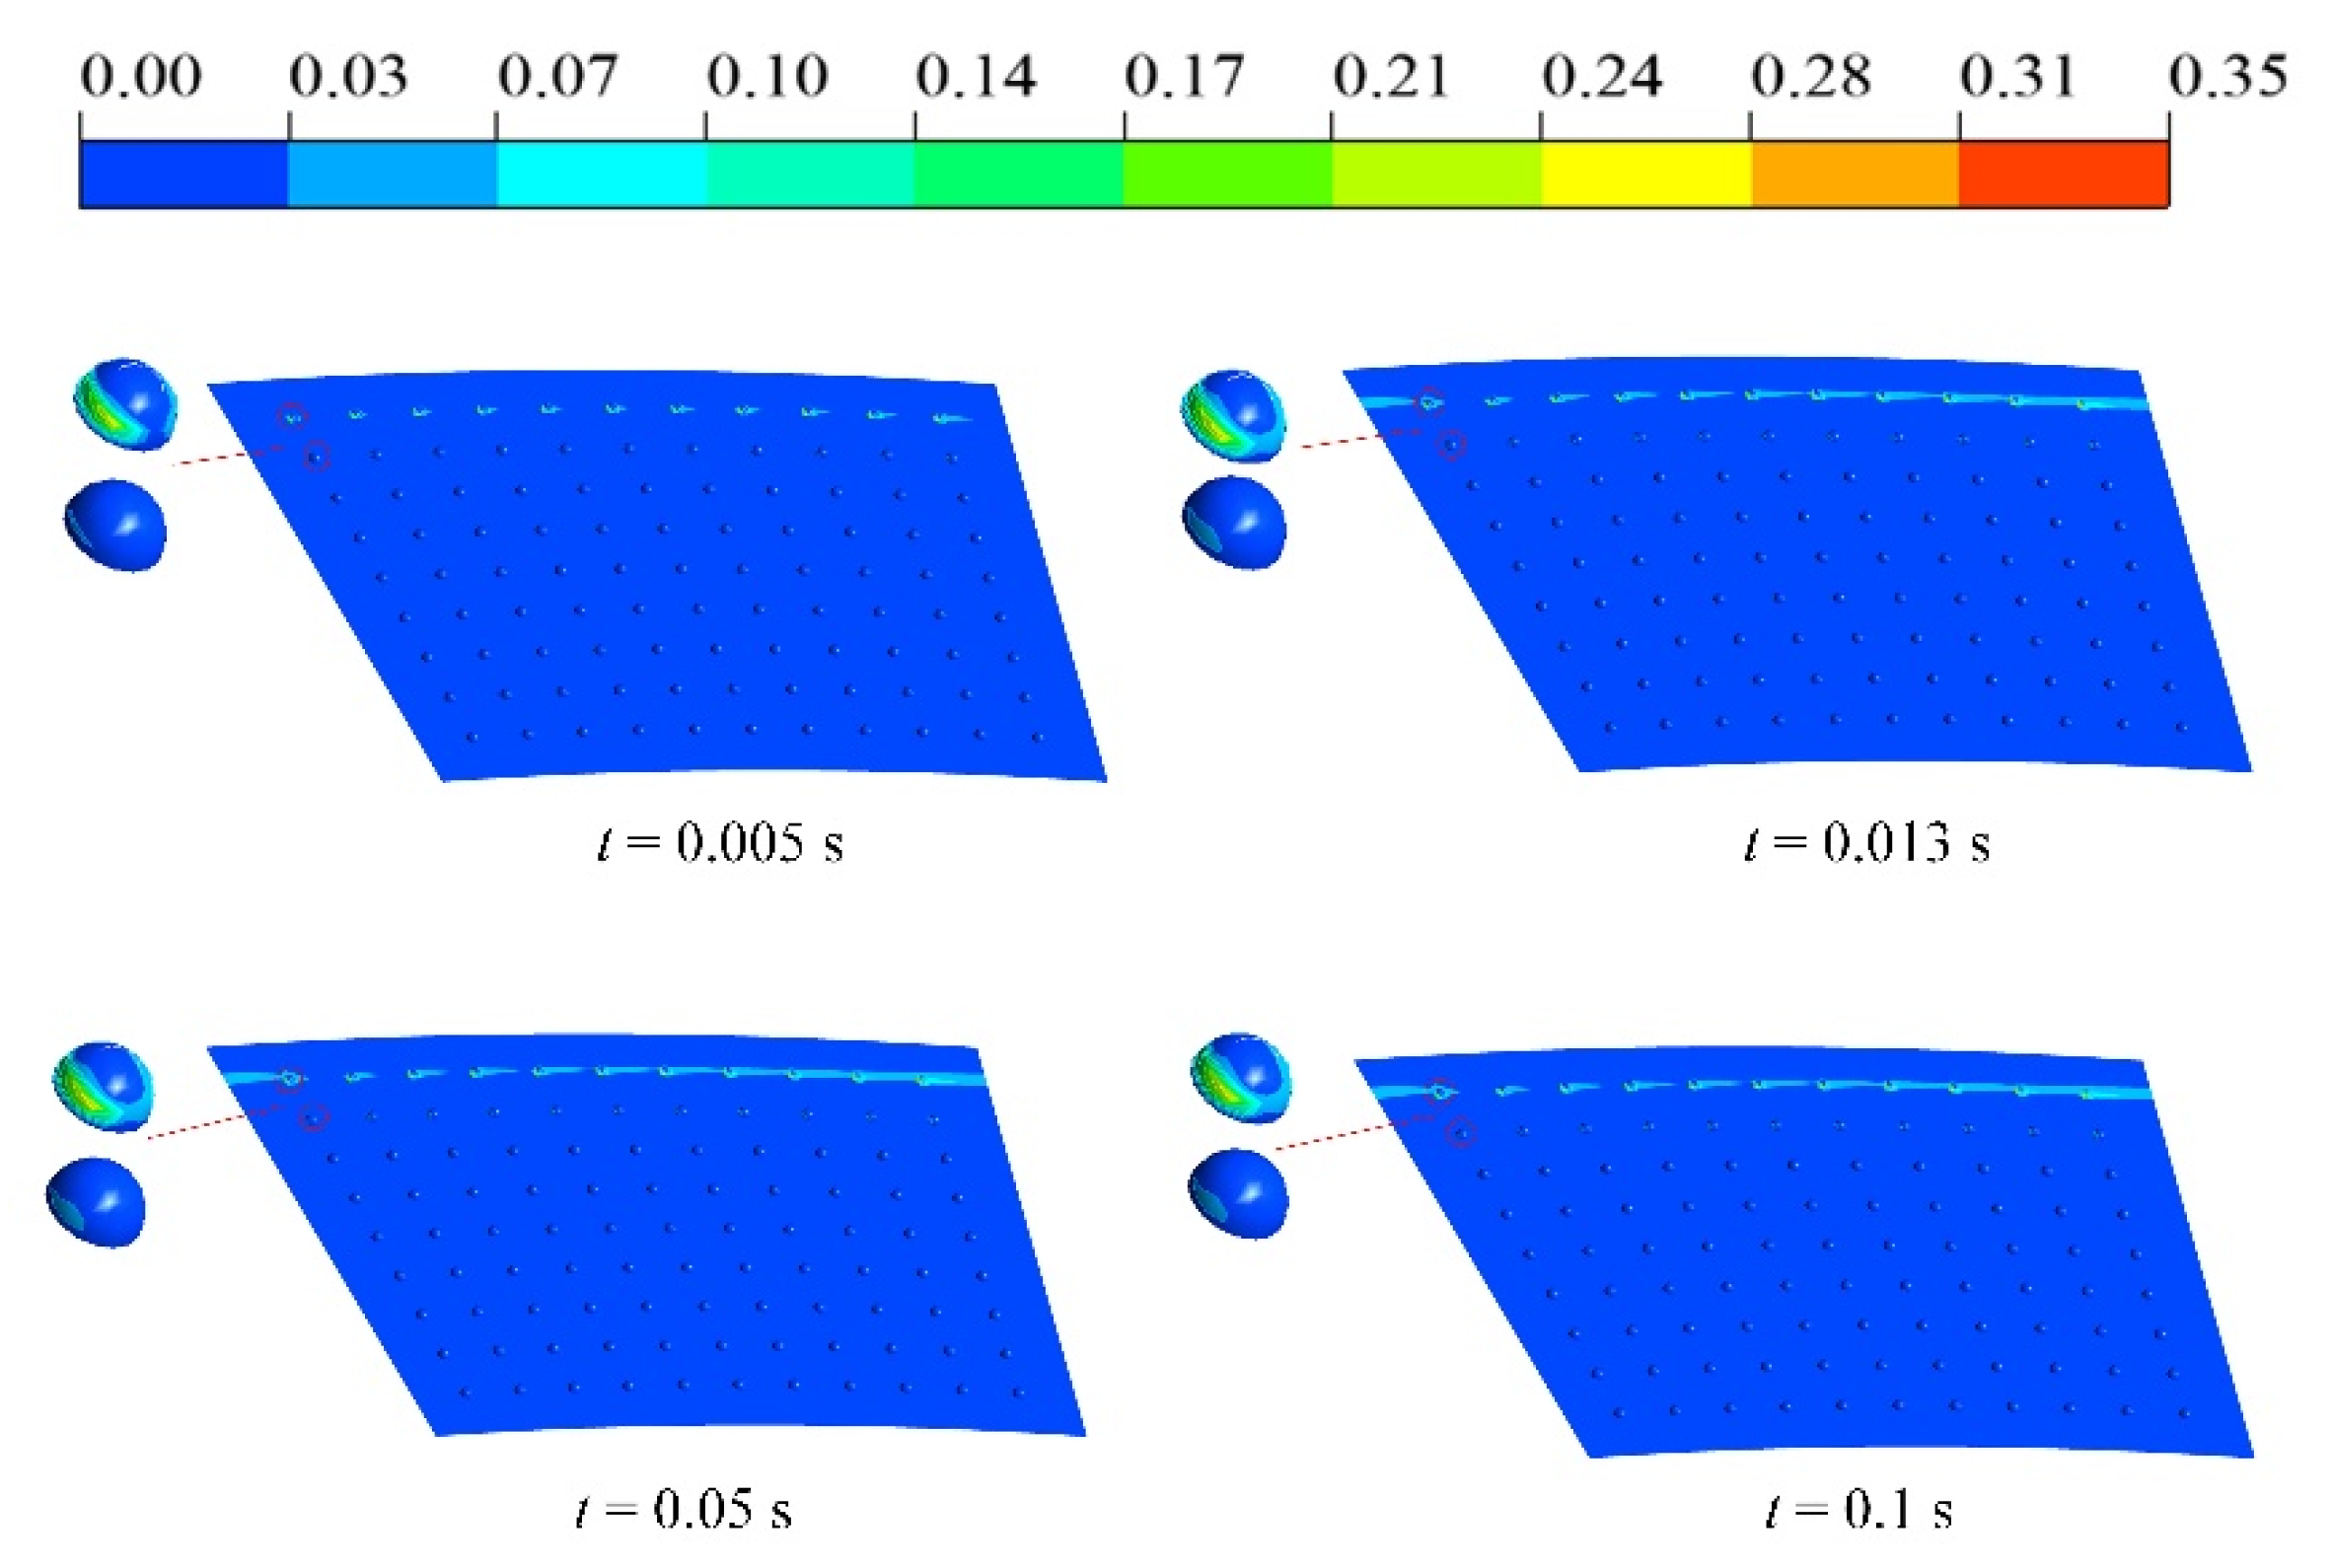
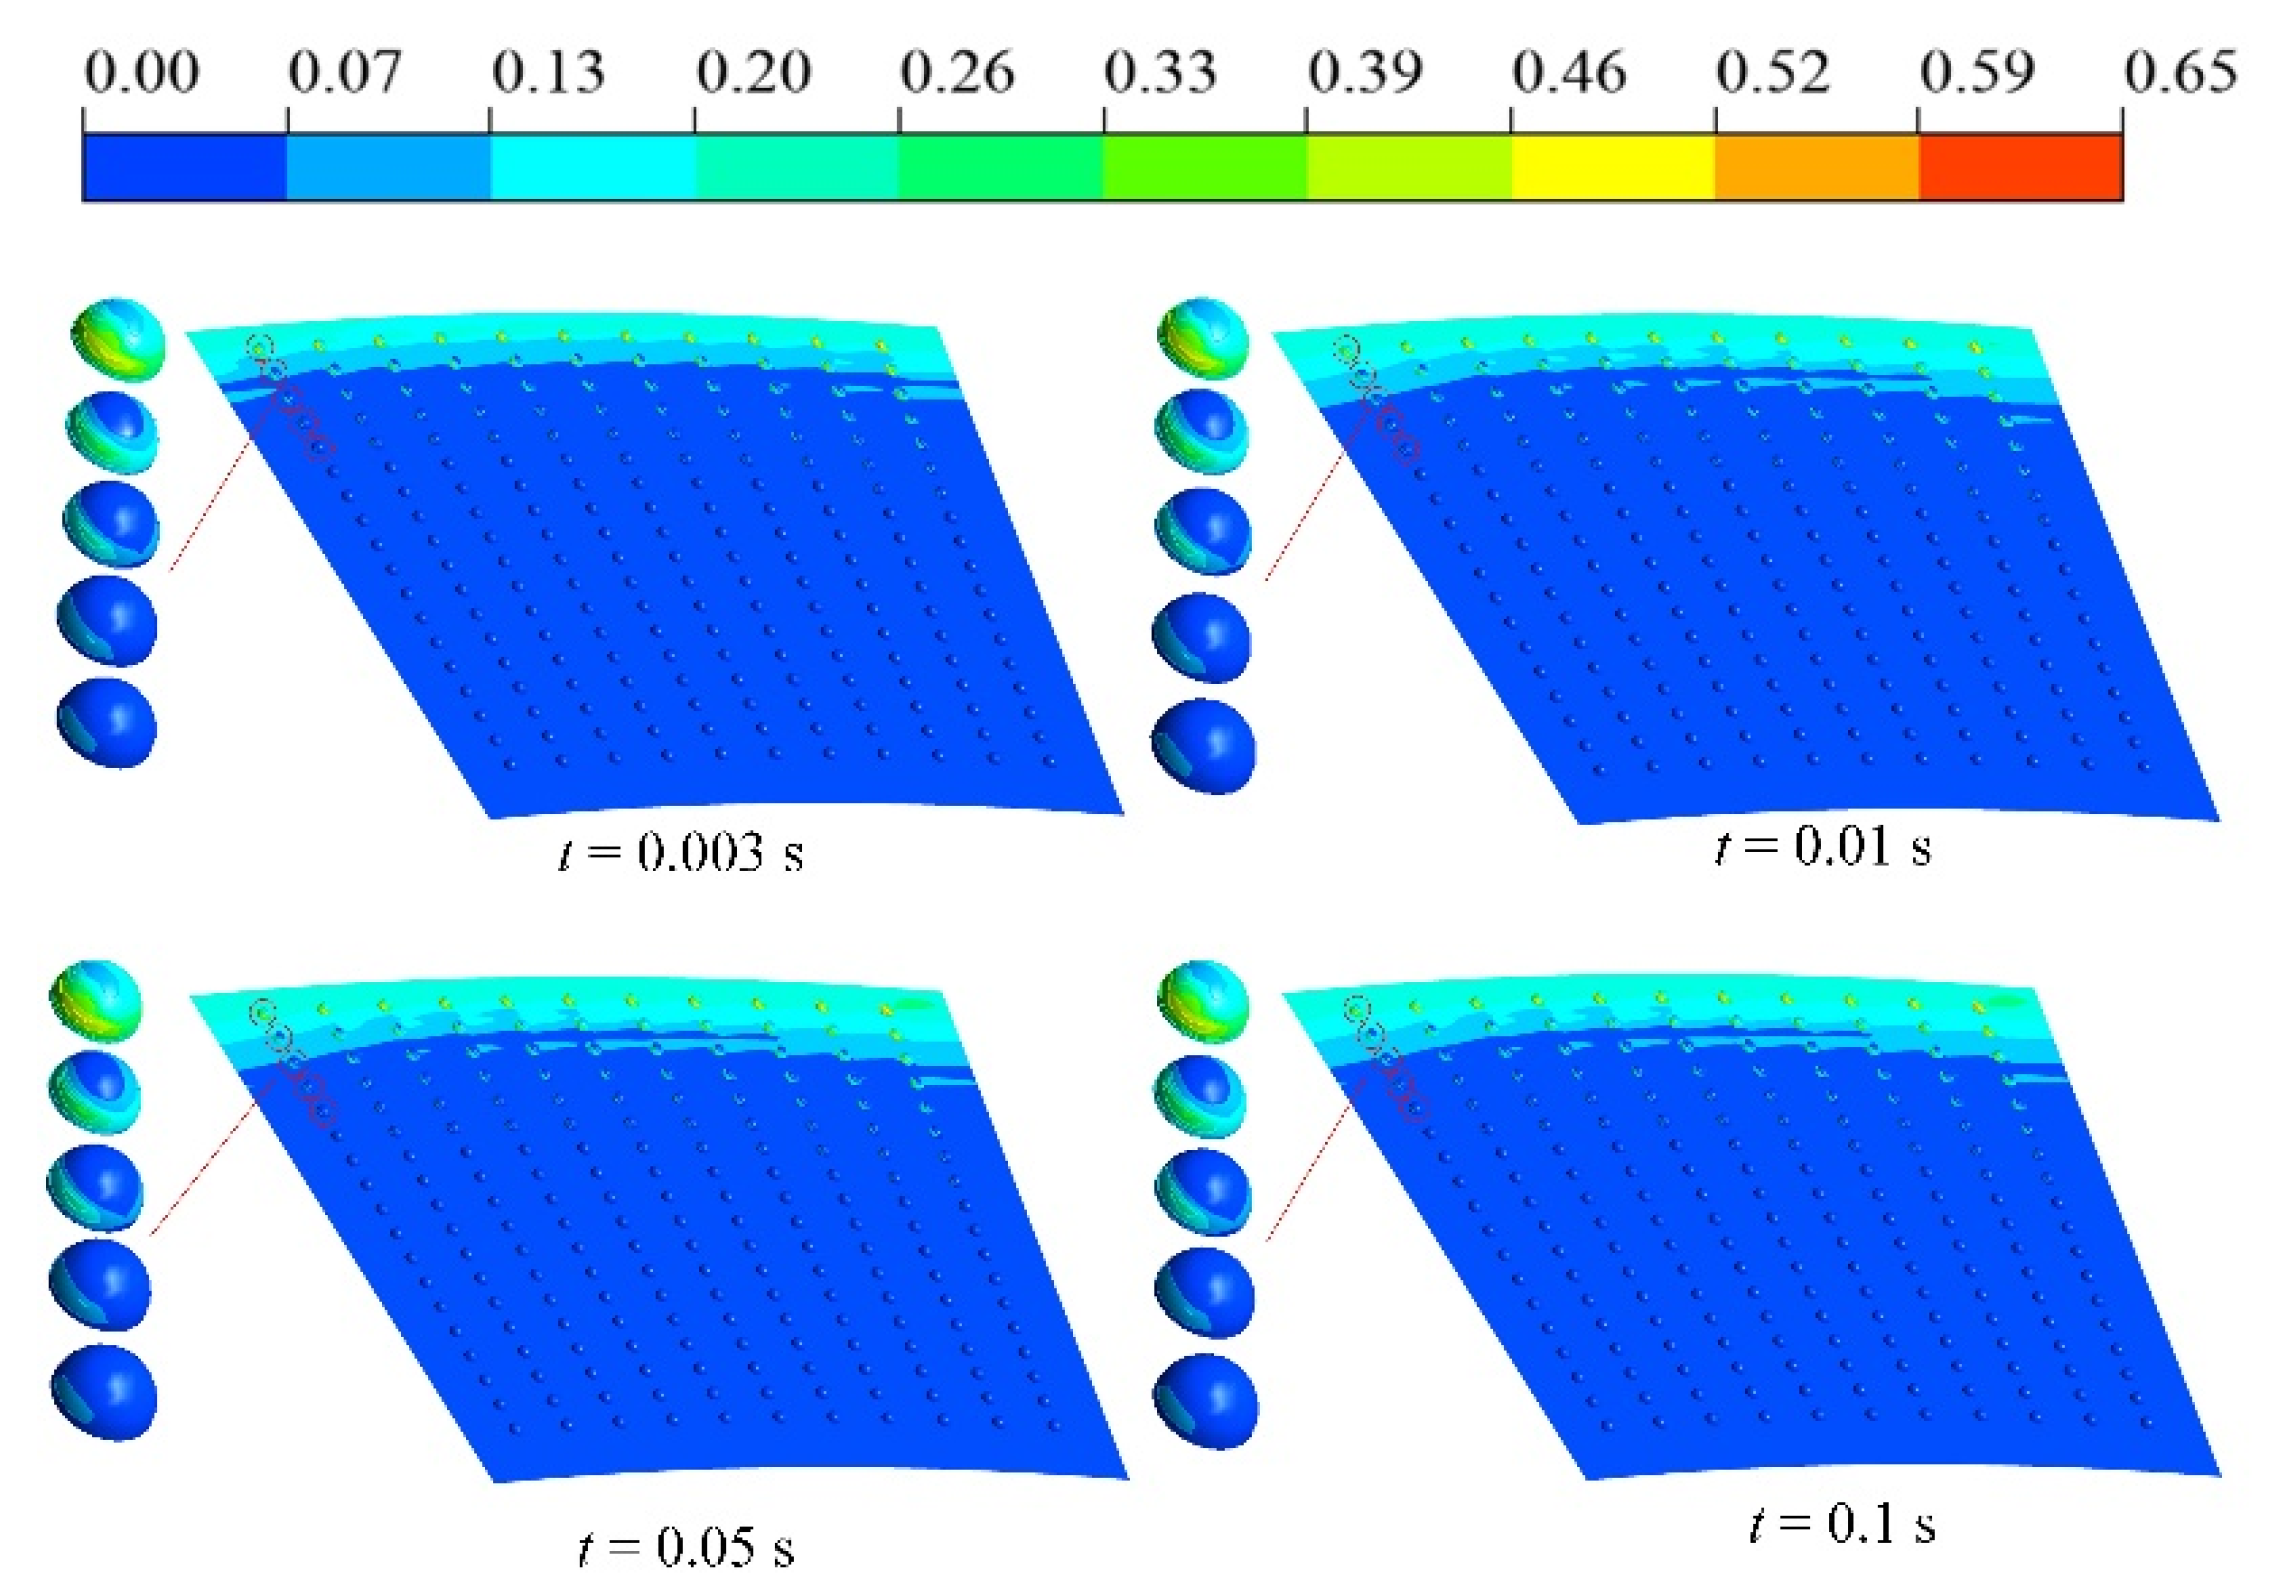
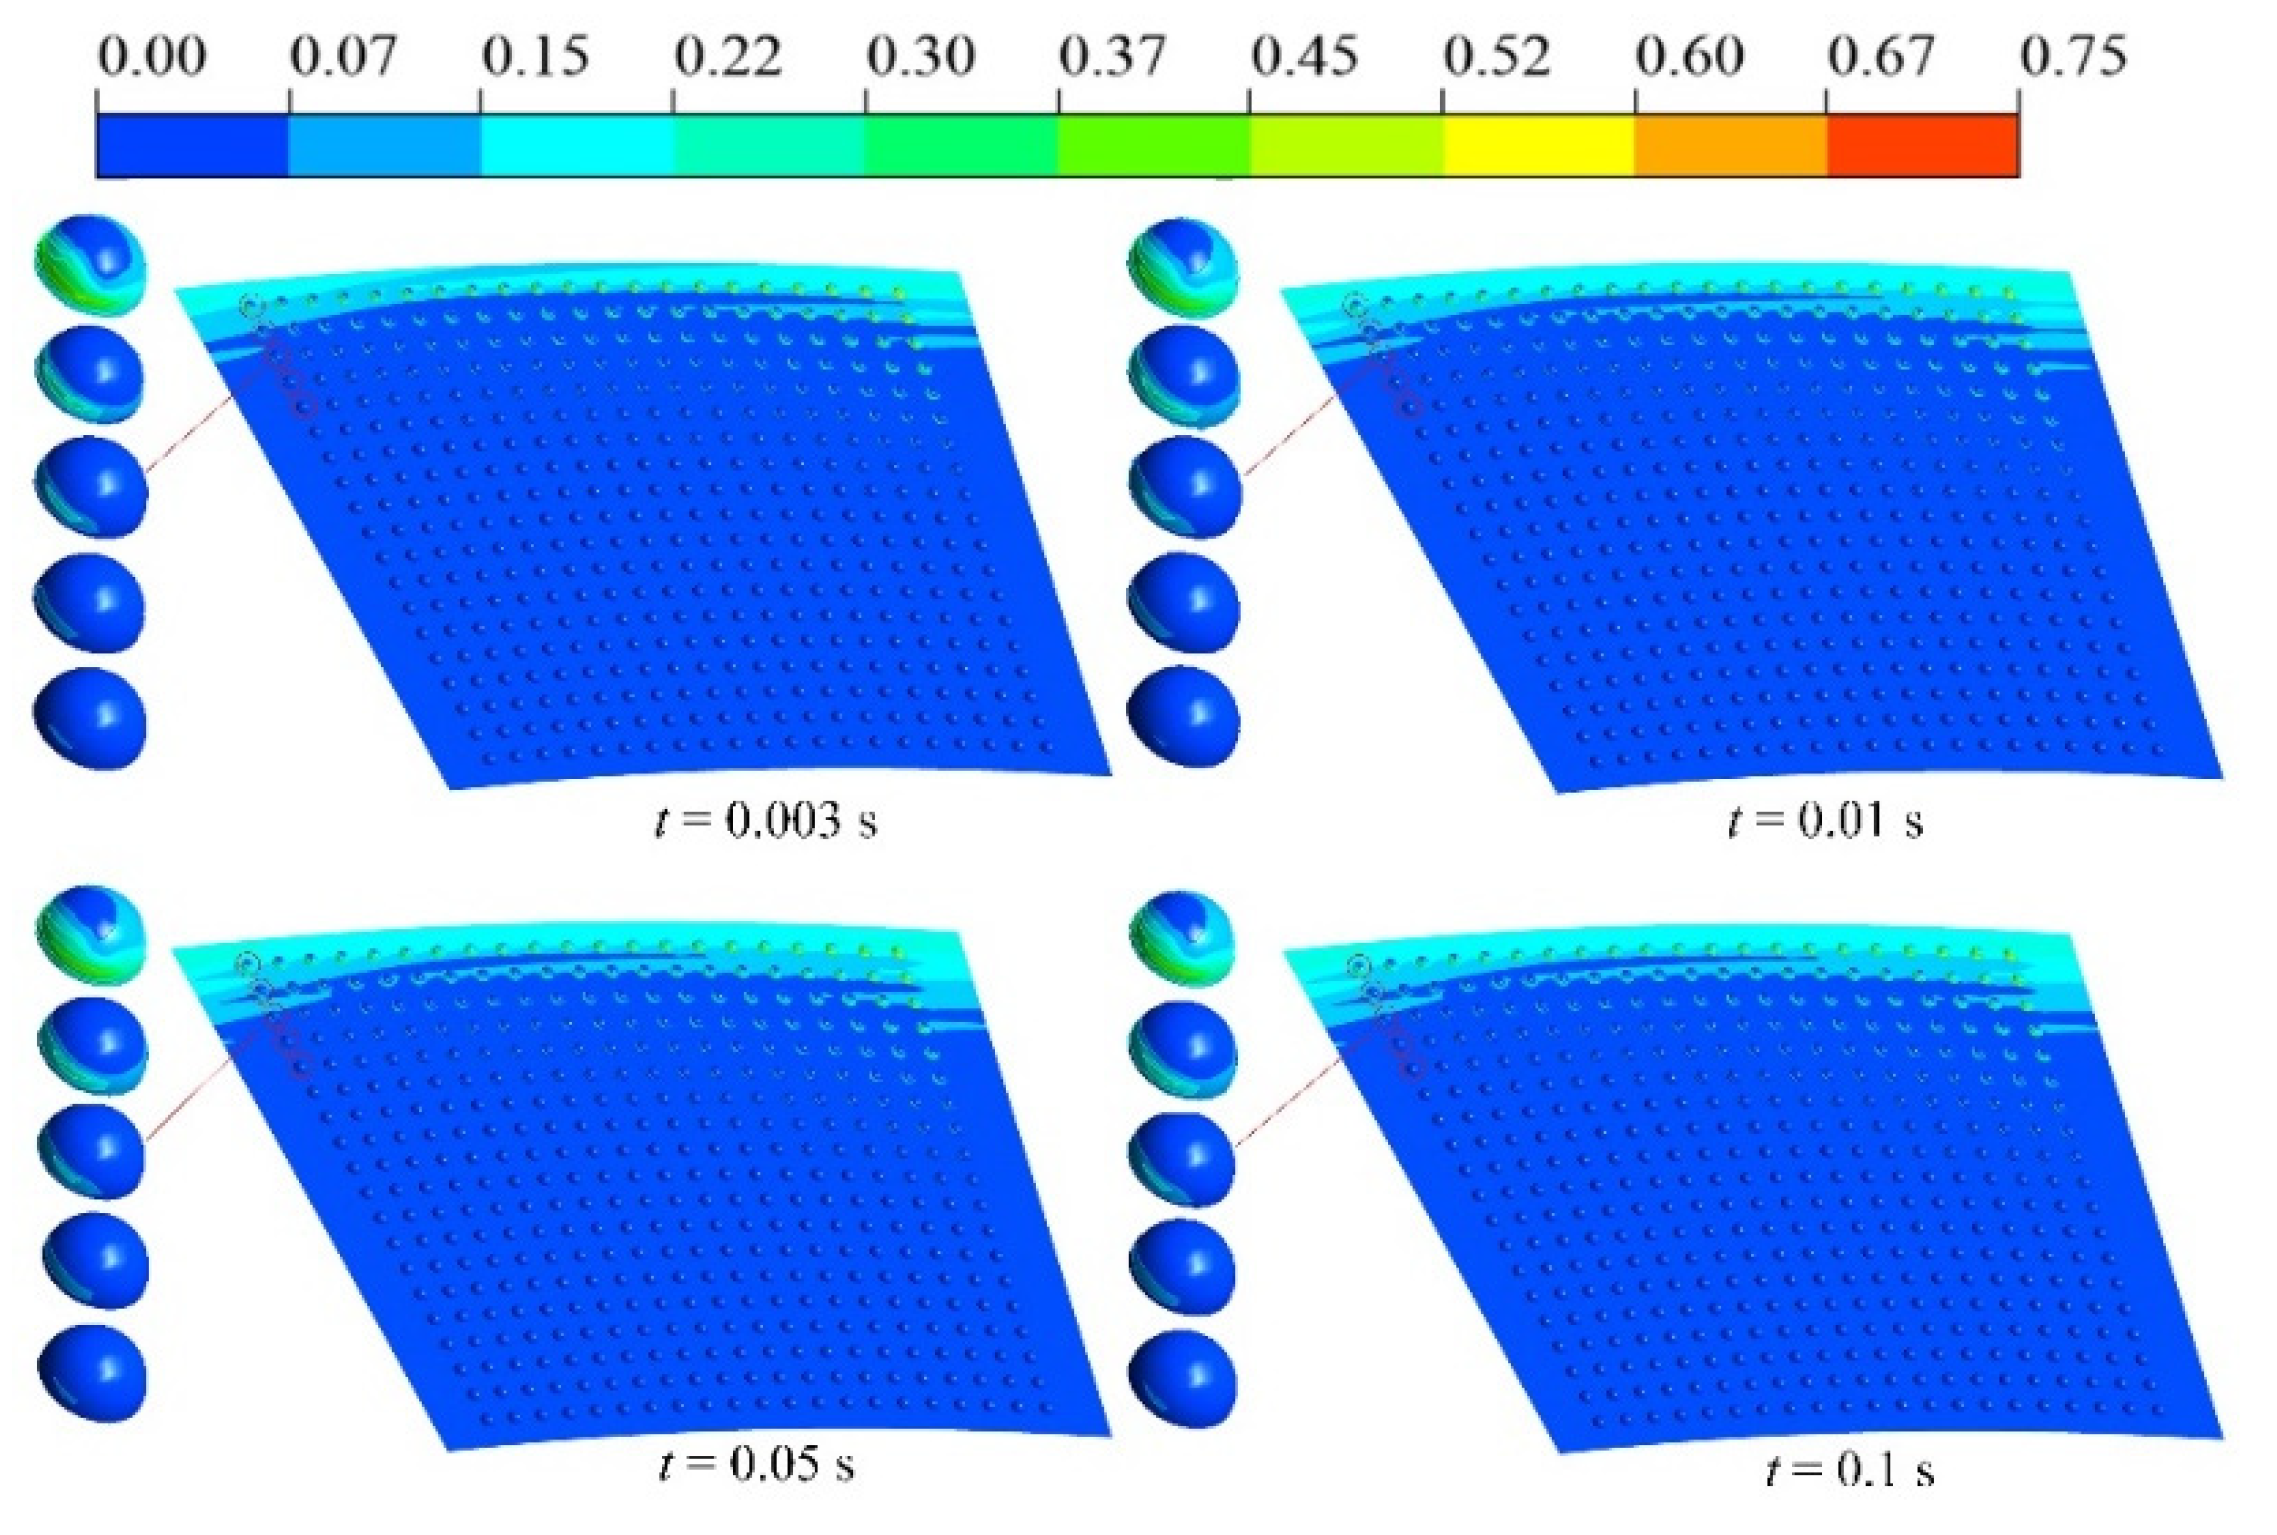
From Figure 7, Figure 8, Figure 9 and Figure 10, we can see that cavitation generation was very fast and reached the highest level within 0.01 s. Figure 8 shows the morphology development of cavitation over time over 0.1 s. When the texture rate is 3.205%, the cavitation diffused along textured dimples into non-textured regions and developed rapidly between 0 and 0.013 s, with a volume fraction of 0.00063409. After 0.014 s, the cavitation volume fraction finally stabilizes at 0.00064191. After increasing the texture rate, the cavitation extends along the weave to the surrounding area. Figure 9 and Figure 10 show similar patterns to Figure 8, so it is unnecessary to describe them.
3.2. Velocity Analysis in Cavitation Area
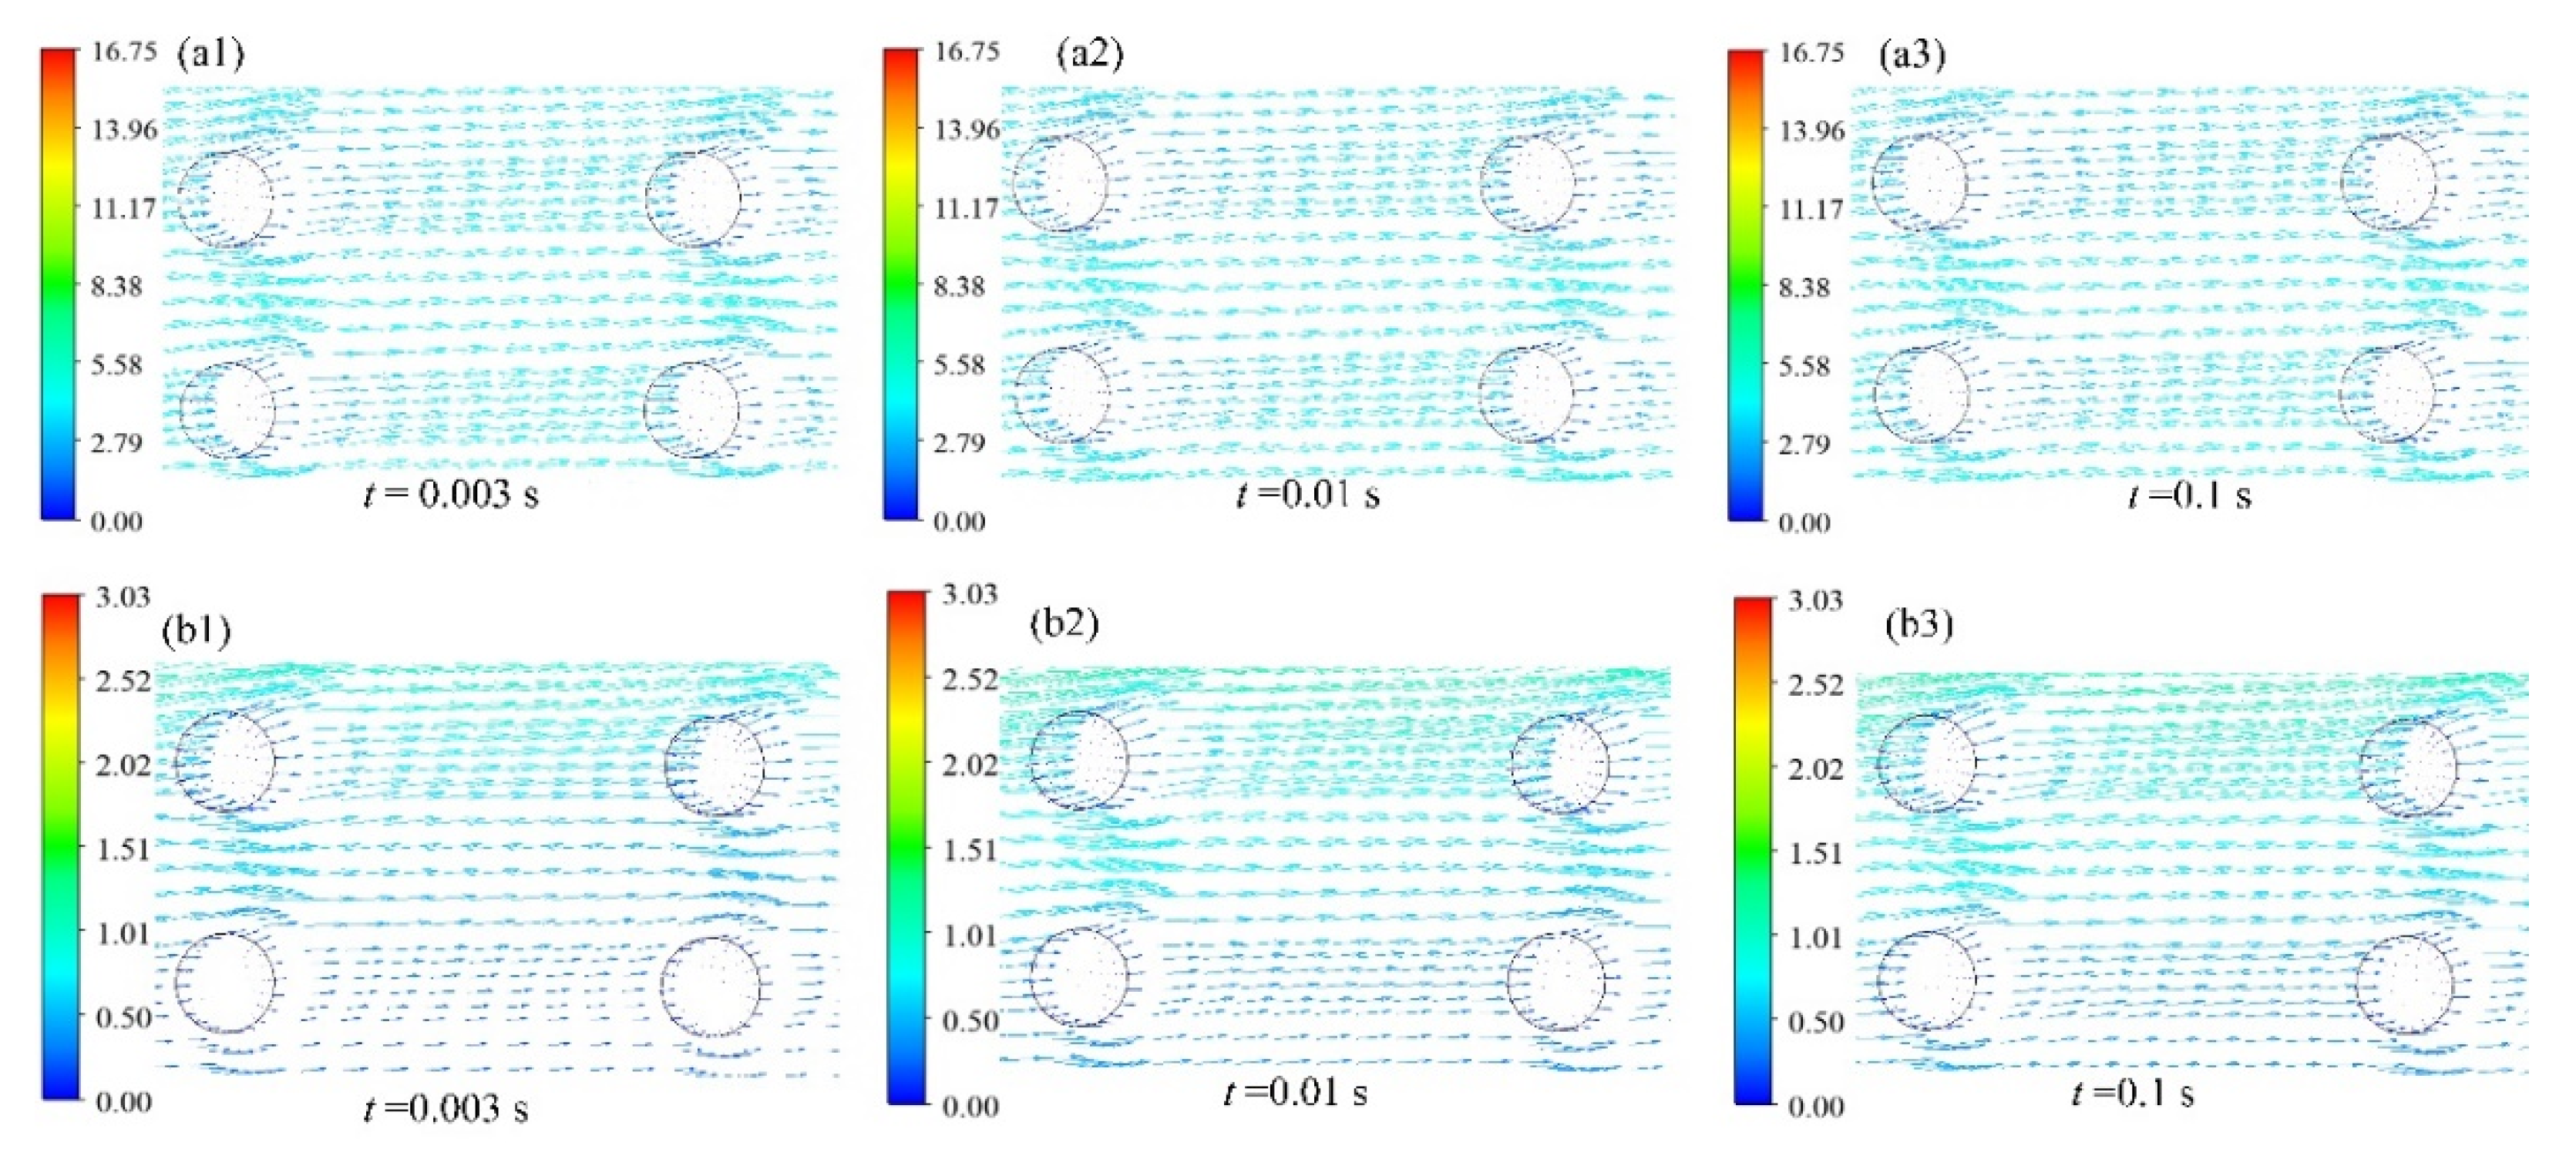
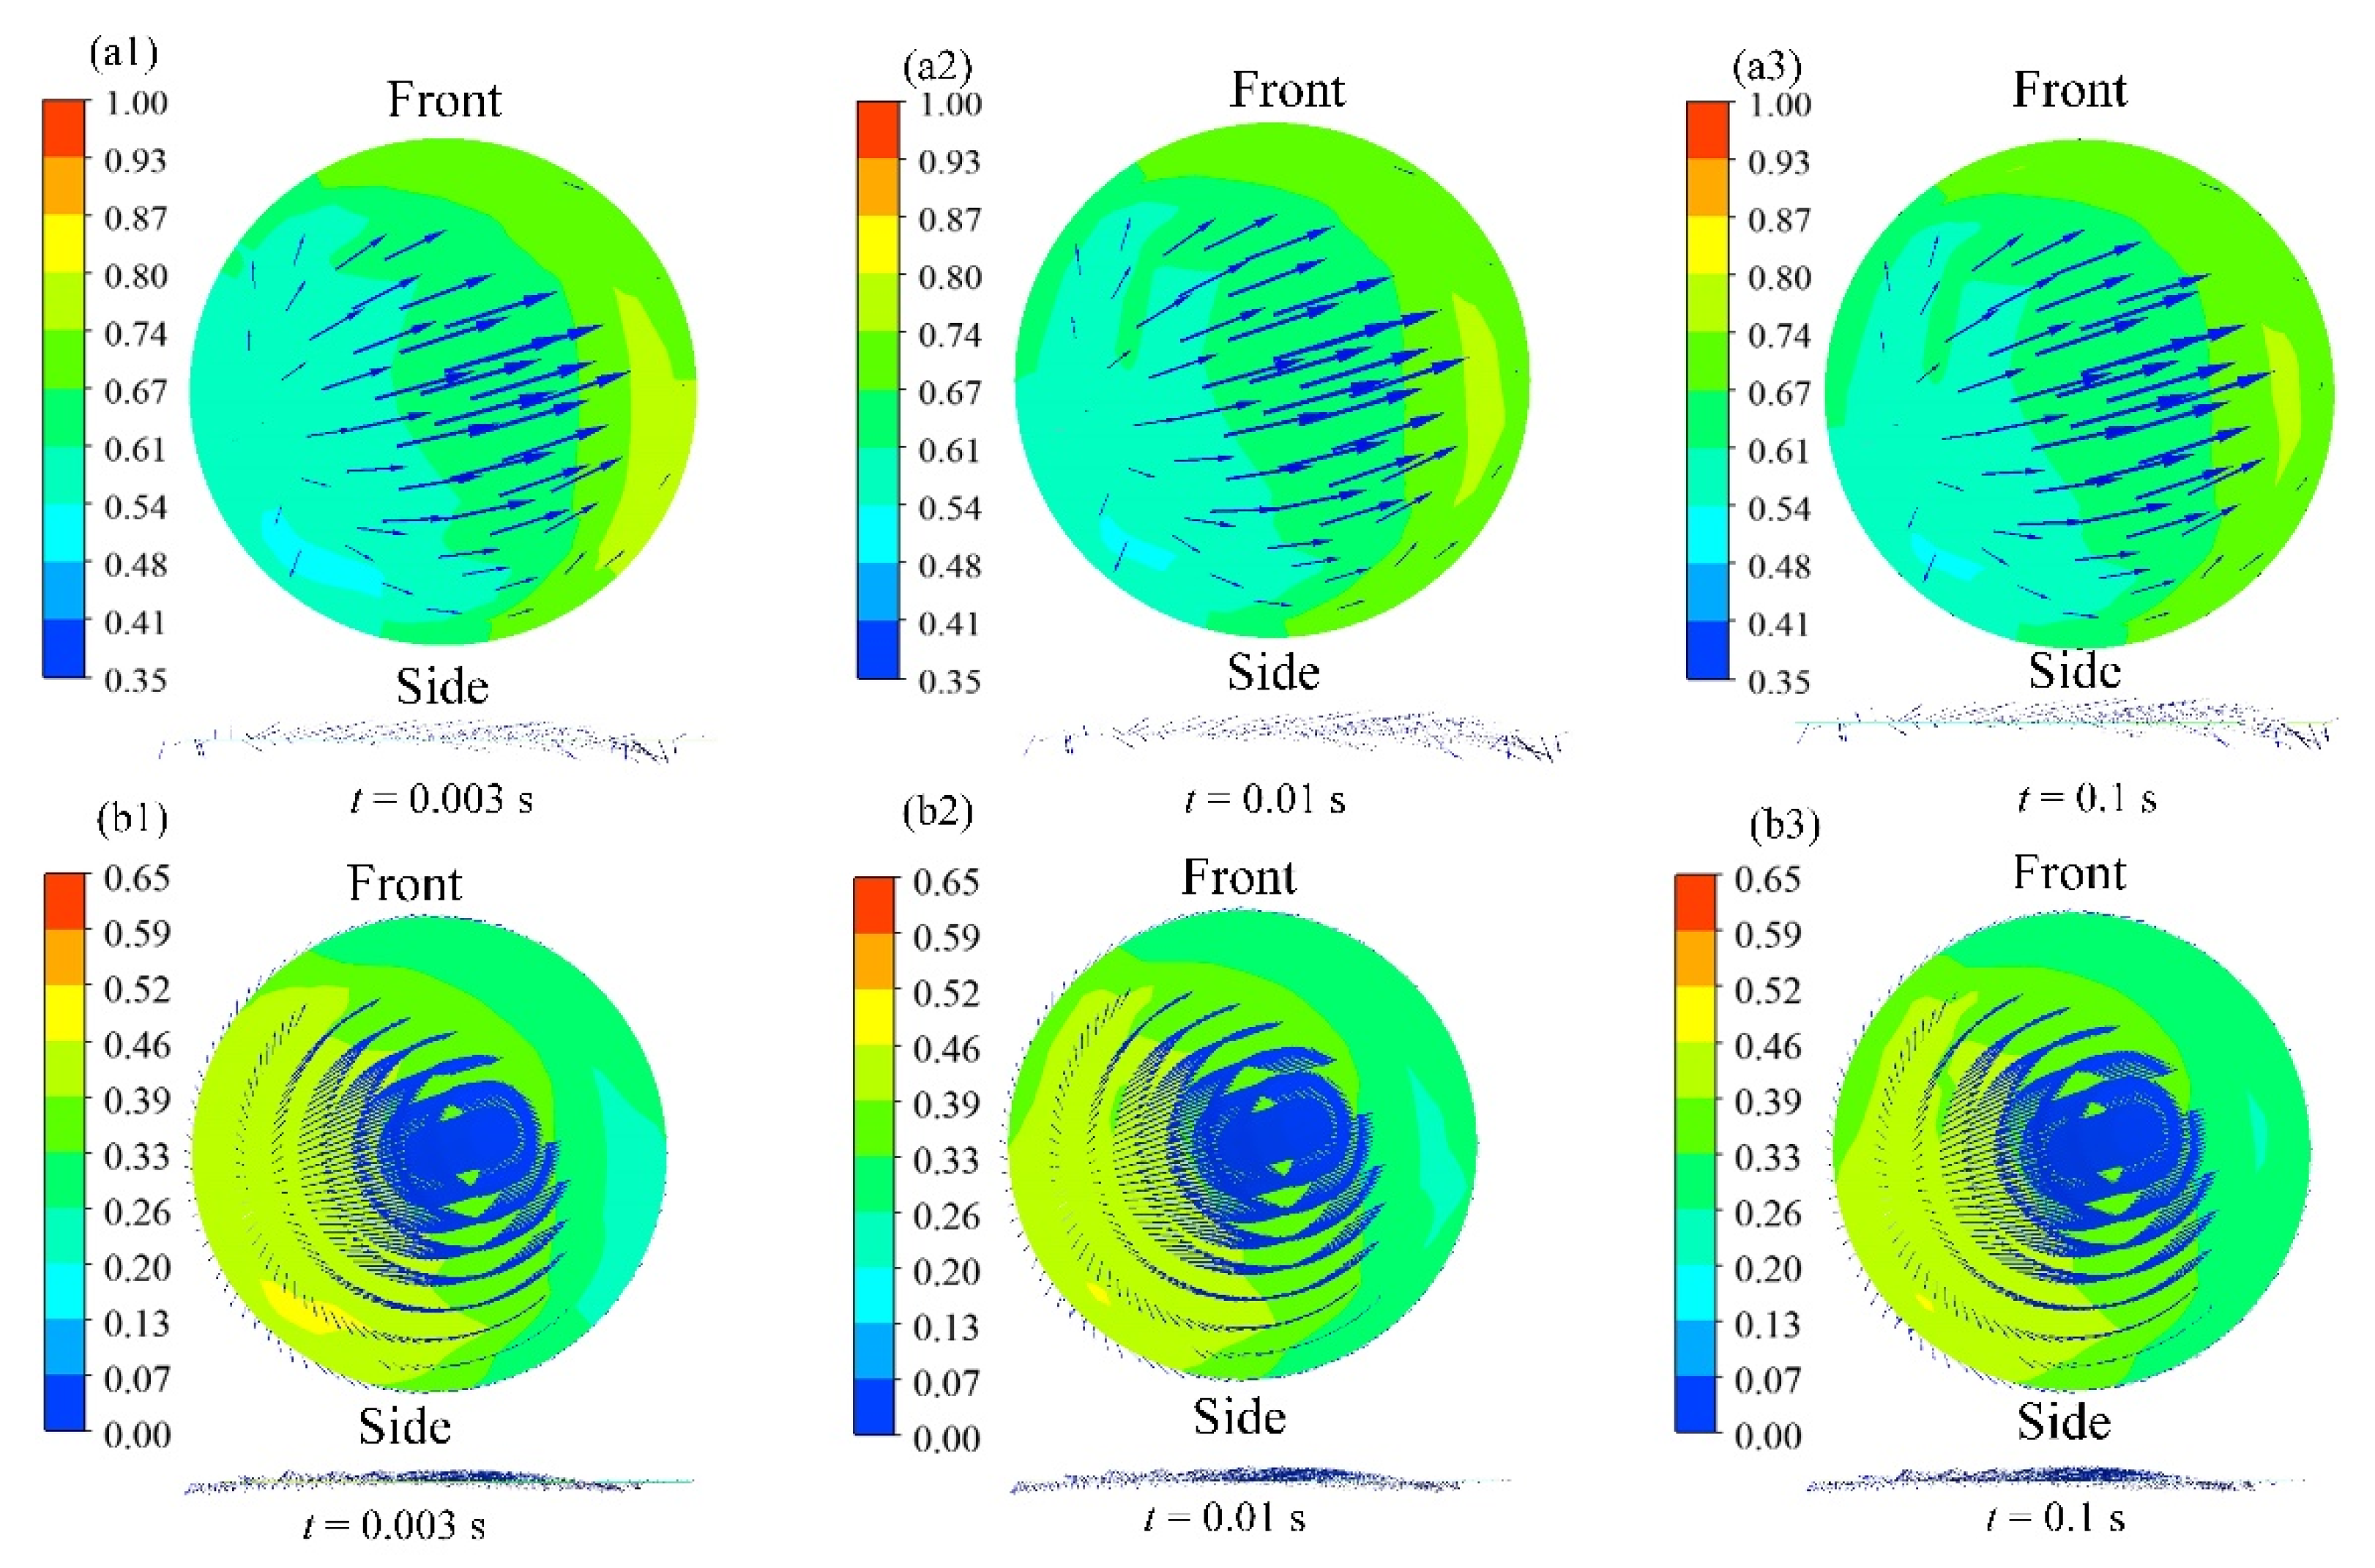
When the texture rate was 6.41% and the rotating speed was 6000 rpm, we researched the instantaneous relative velocity of the oil and cavitation gas in a specific area of the oil film. Part of the area in the upper left corner of the oil film was selected as the research object. In Figure 11, a1, a2, and a3 are velocity vectors of oil at different time nodes. Ripples around circles mean that hemispherical dimples cause severe flow field disturbance, and the flow field tends to be stable when away from the dimples. Accordingly, b1, b2, and b3 are velocity vectors of cavitation gas at the same position. By comparison, it can be clearly concluded that the direction of oil flow is strictly consistent with that of the cavitation gas. The gas flows with the oil, and the oil flows faster than the cavitation gas.
Figure 12 shows the oil velocity vector on a section of an oil film micro-convex at different time nodes. “Front” is the top view of the velocity vector flowing through the plane. “Side” is the side view of the velocity vector at the same position. According to a1, a2, and a3, the oil velocity increased with time. The velocity vector arrow shows that the oil flowed into the plane and flowed out at the far right of the plane. The reason may be that the hemispheric dimple is less bound to oil, and the oil flowing into the dimple produces little or no vortexes and then directly flows out. We can infer from Figure 11 and Figure 12 that the gas appearing in the flow field is a result of the phase transformation of oil from liquid to oil vapor under the action of shear effects.
3.3. Pressure Analysis in Cavitation Area
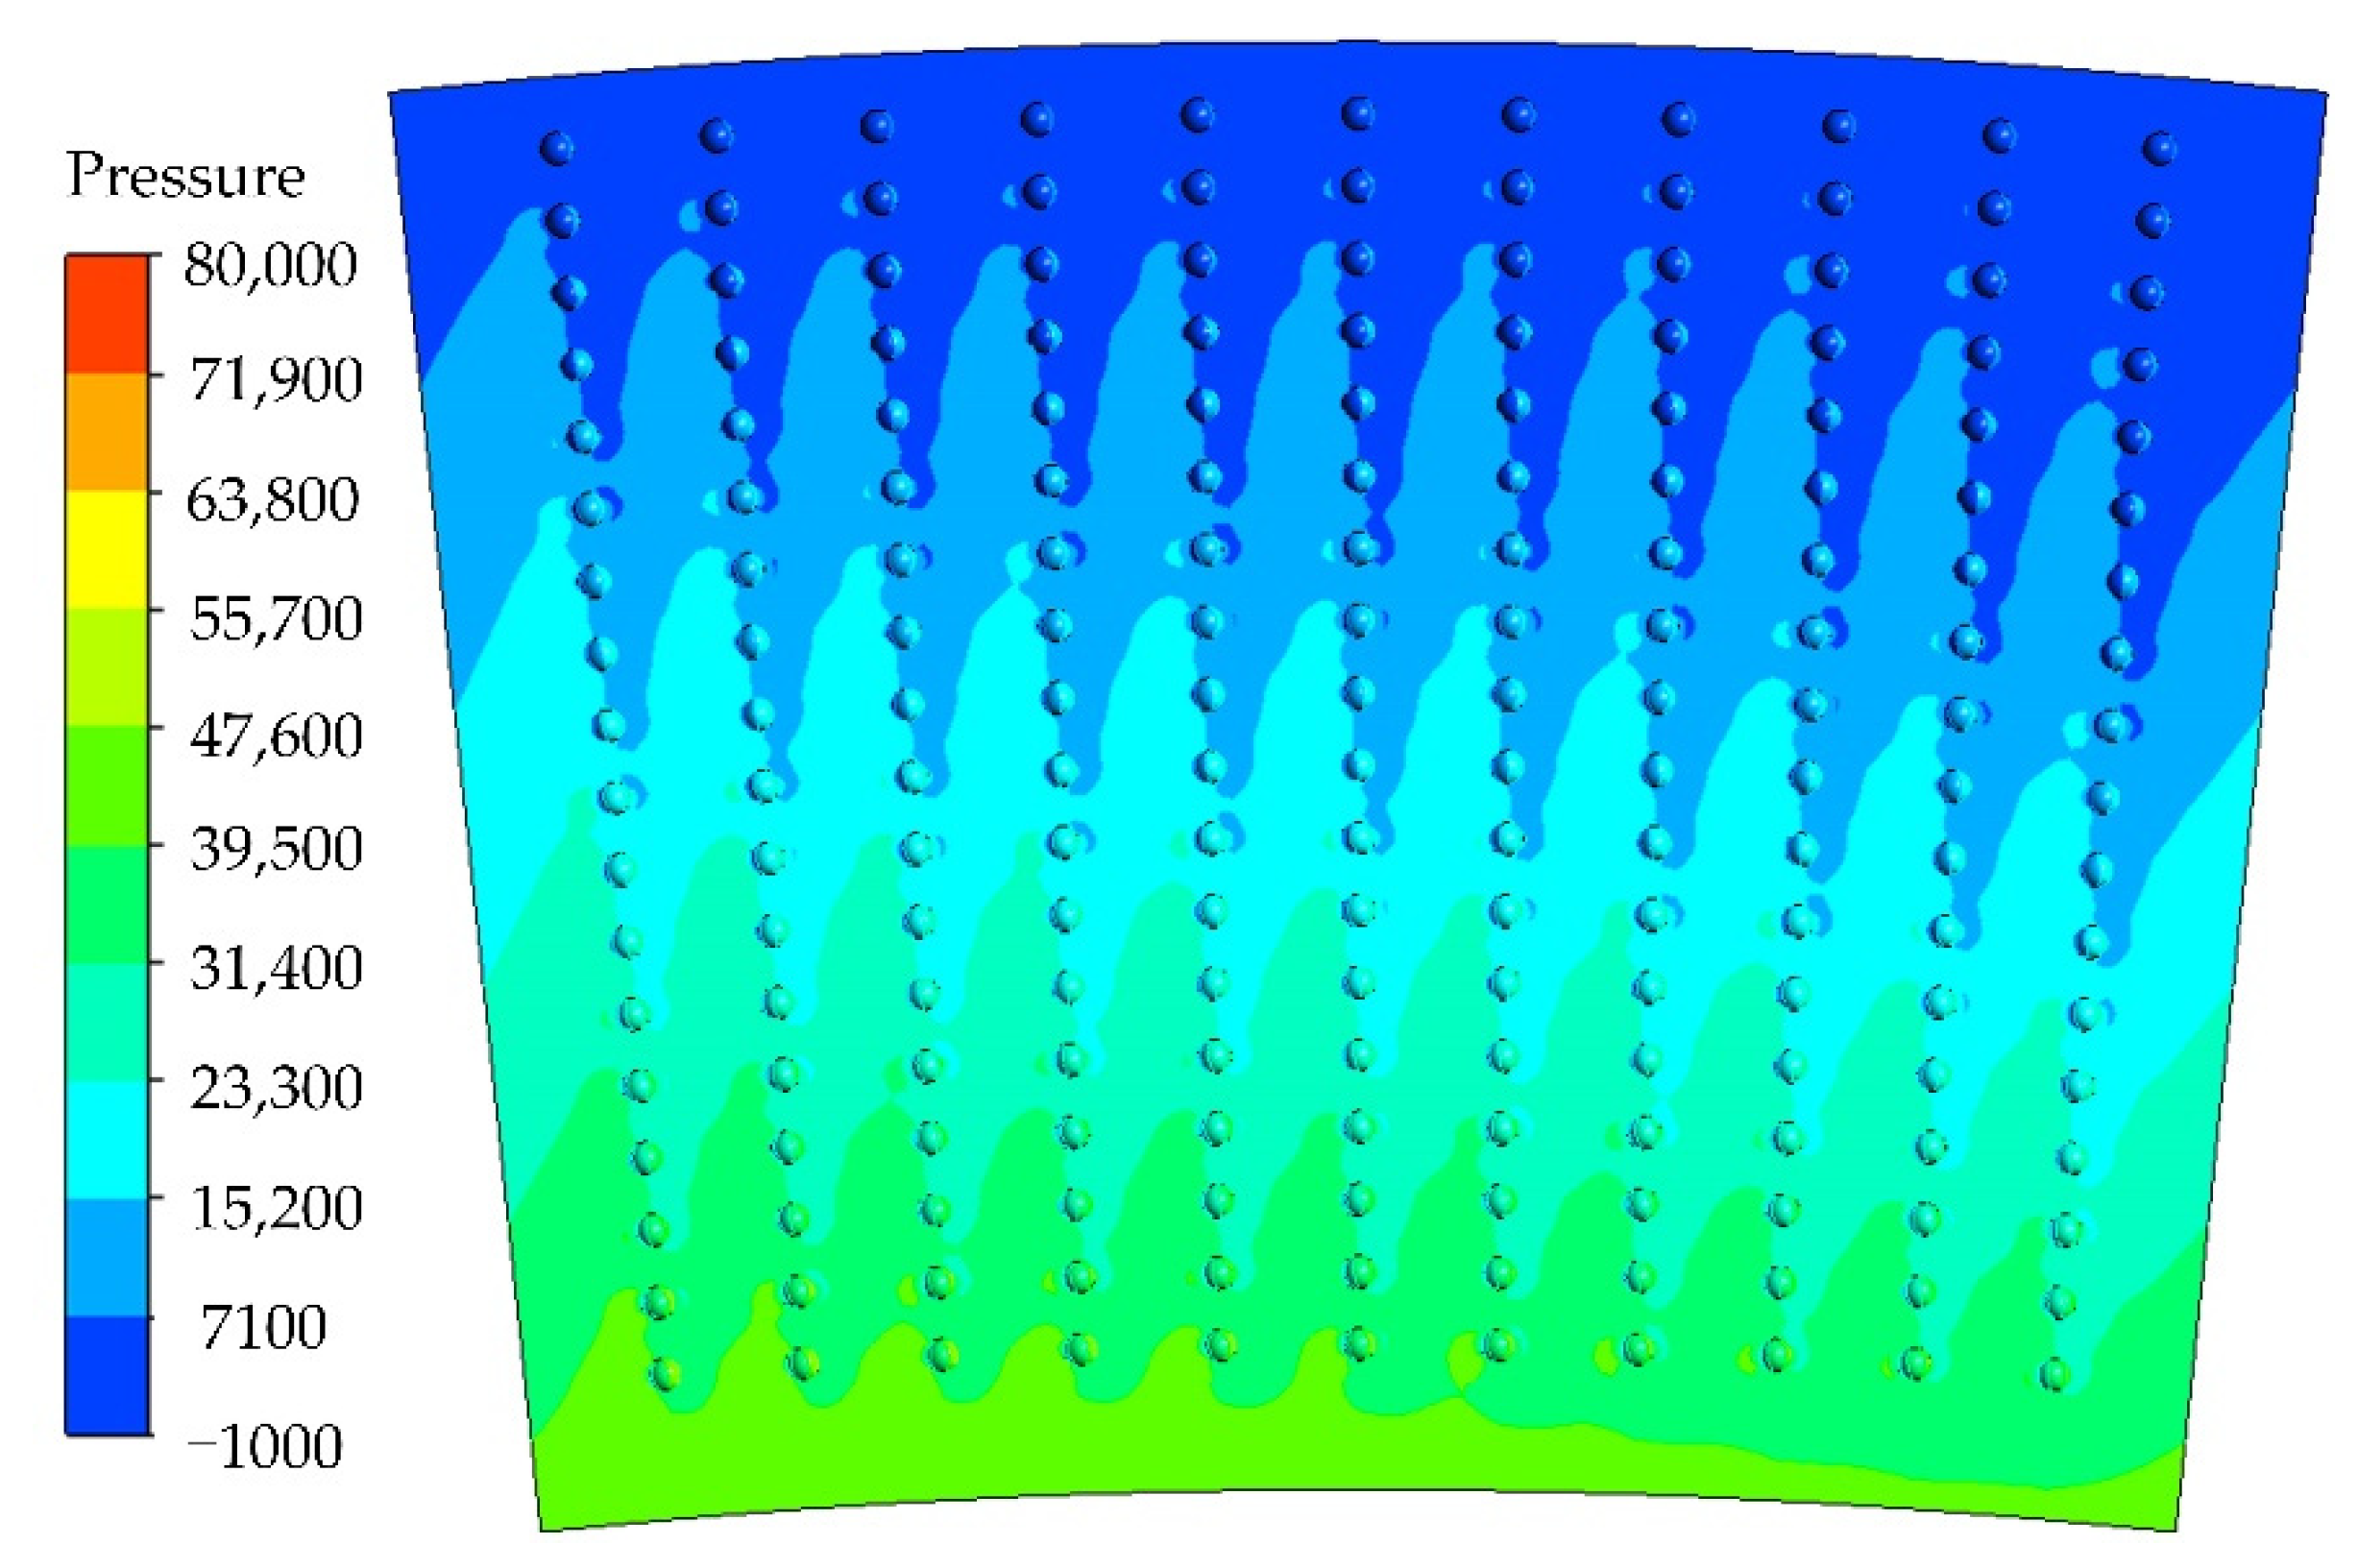
Low pressure is an essential and significant element of cavitation occurrence. In our research, the saturated vapor pressure pv of oil was determined to be 1000 Pa; that is, cavitation occurs when the pressure in the flow field is lower than 1000 Pa. From Figure 9 and Figure 13, we can see that texture dimples can definitely disturb the pressure distribution; however, except for the oil near the texture boundaries or dimples, the oil pressure distribution in other positions was evenly consistent, and the cavitation location was consistent with the low pressure area.
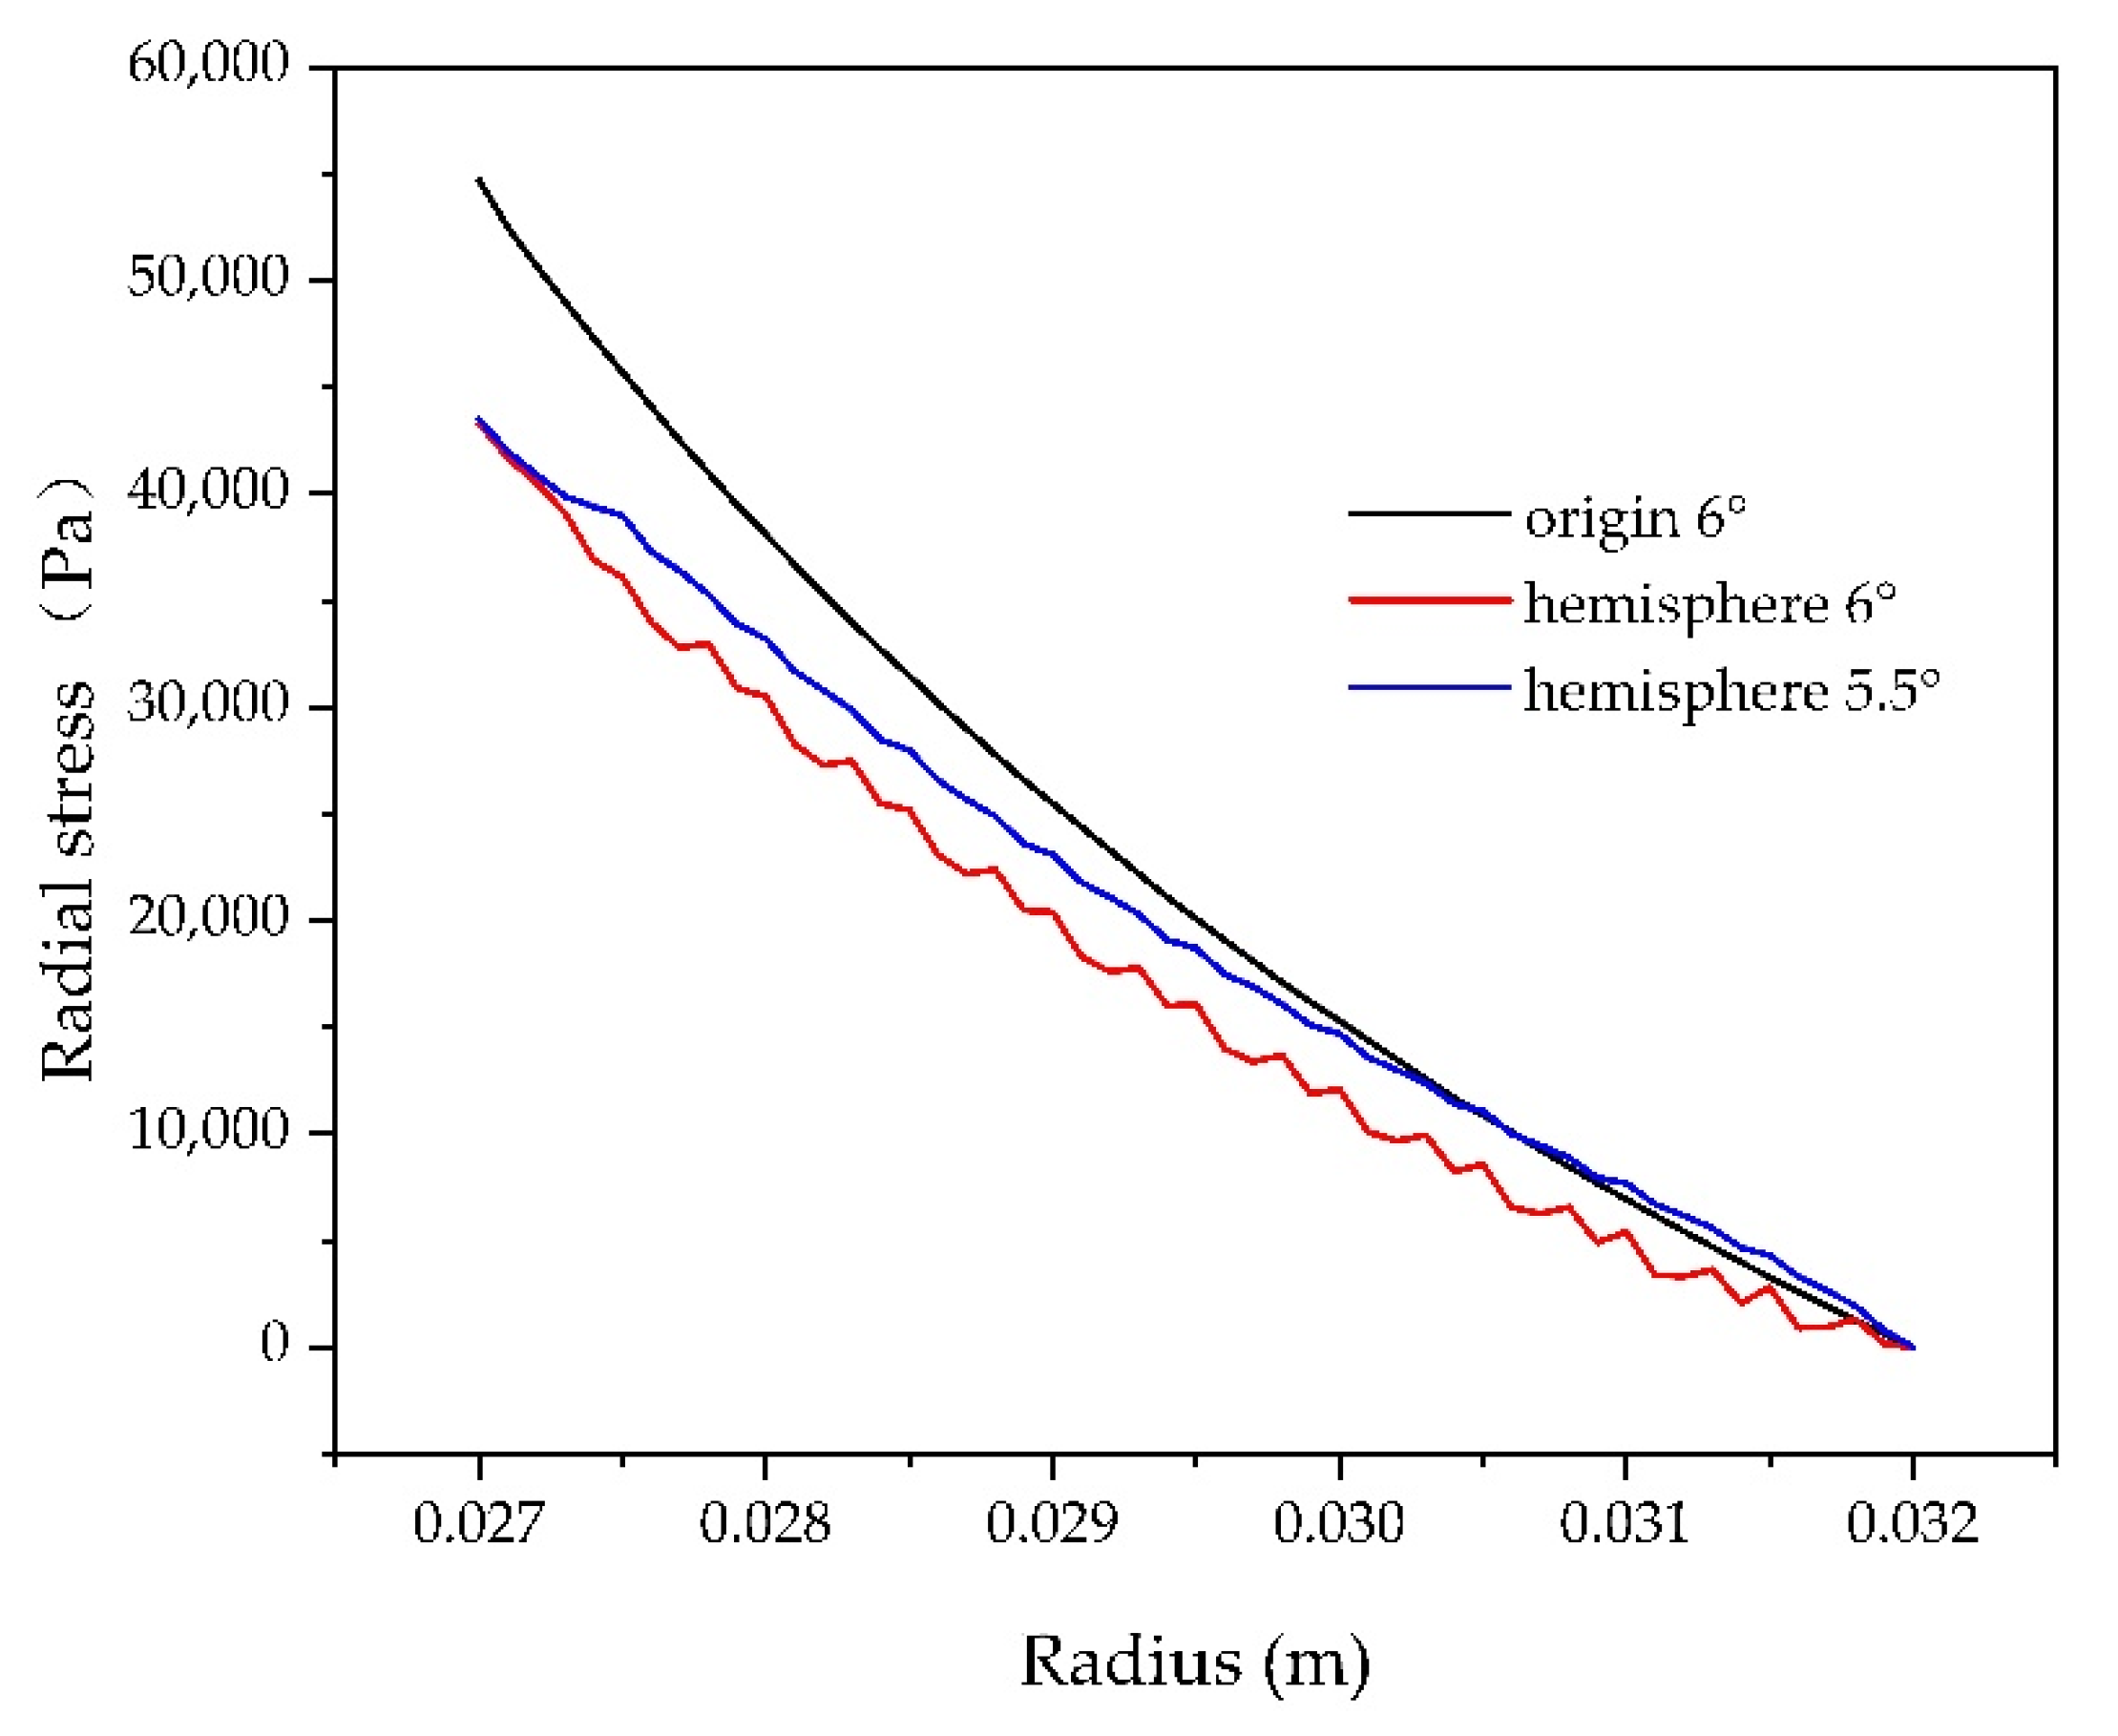
The radial flow of oil is mainly driven by inlet pressure and centrifugal force, and flow velocity increases along the radial direction. According to Bernoulli’s principle, the pressure distribution has the opposite trend from that of flow velocity distribution. It is known that the circular angle θ of an oil film model is 12°, and the radius of θ = 6° is on the center line of the radial texture dimple. Figure 14 shows that when there is no texture, the pressure decreases uniformly along the radial direction, and the pressure curve was smooth (origin 6°). When textured, the pressure drop curve was smooth in the non-textured area, and there were pressure fluctuations in the textured area.
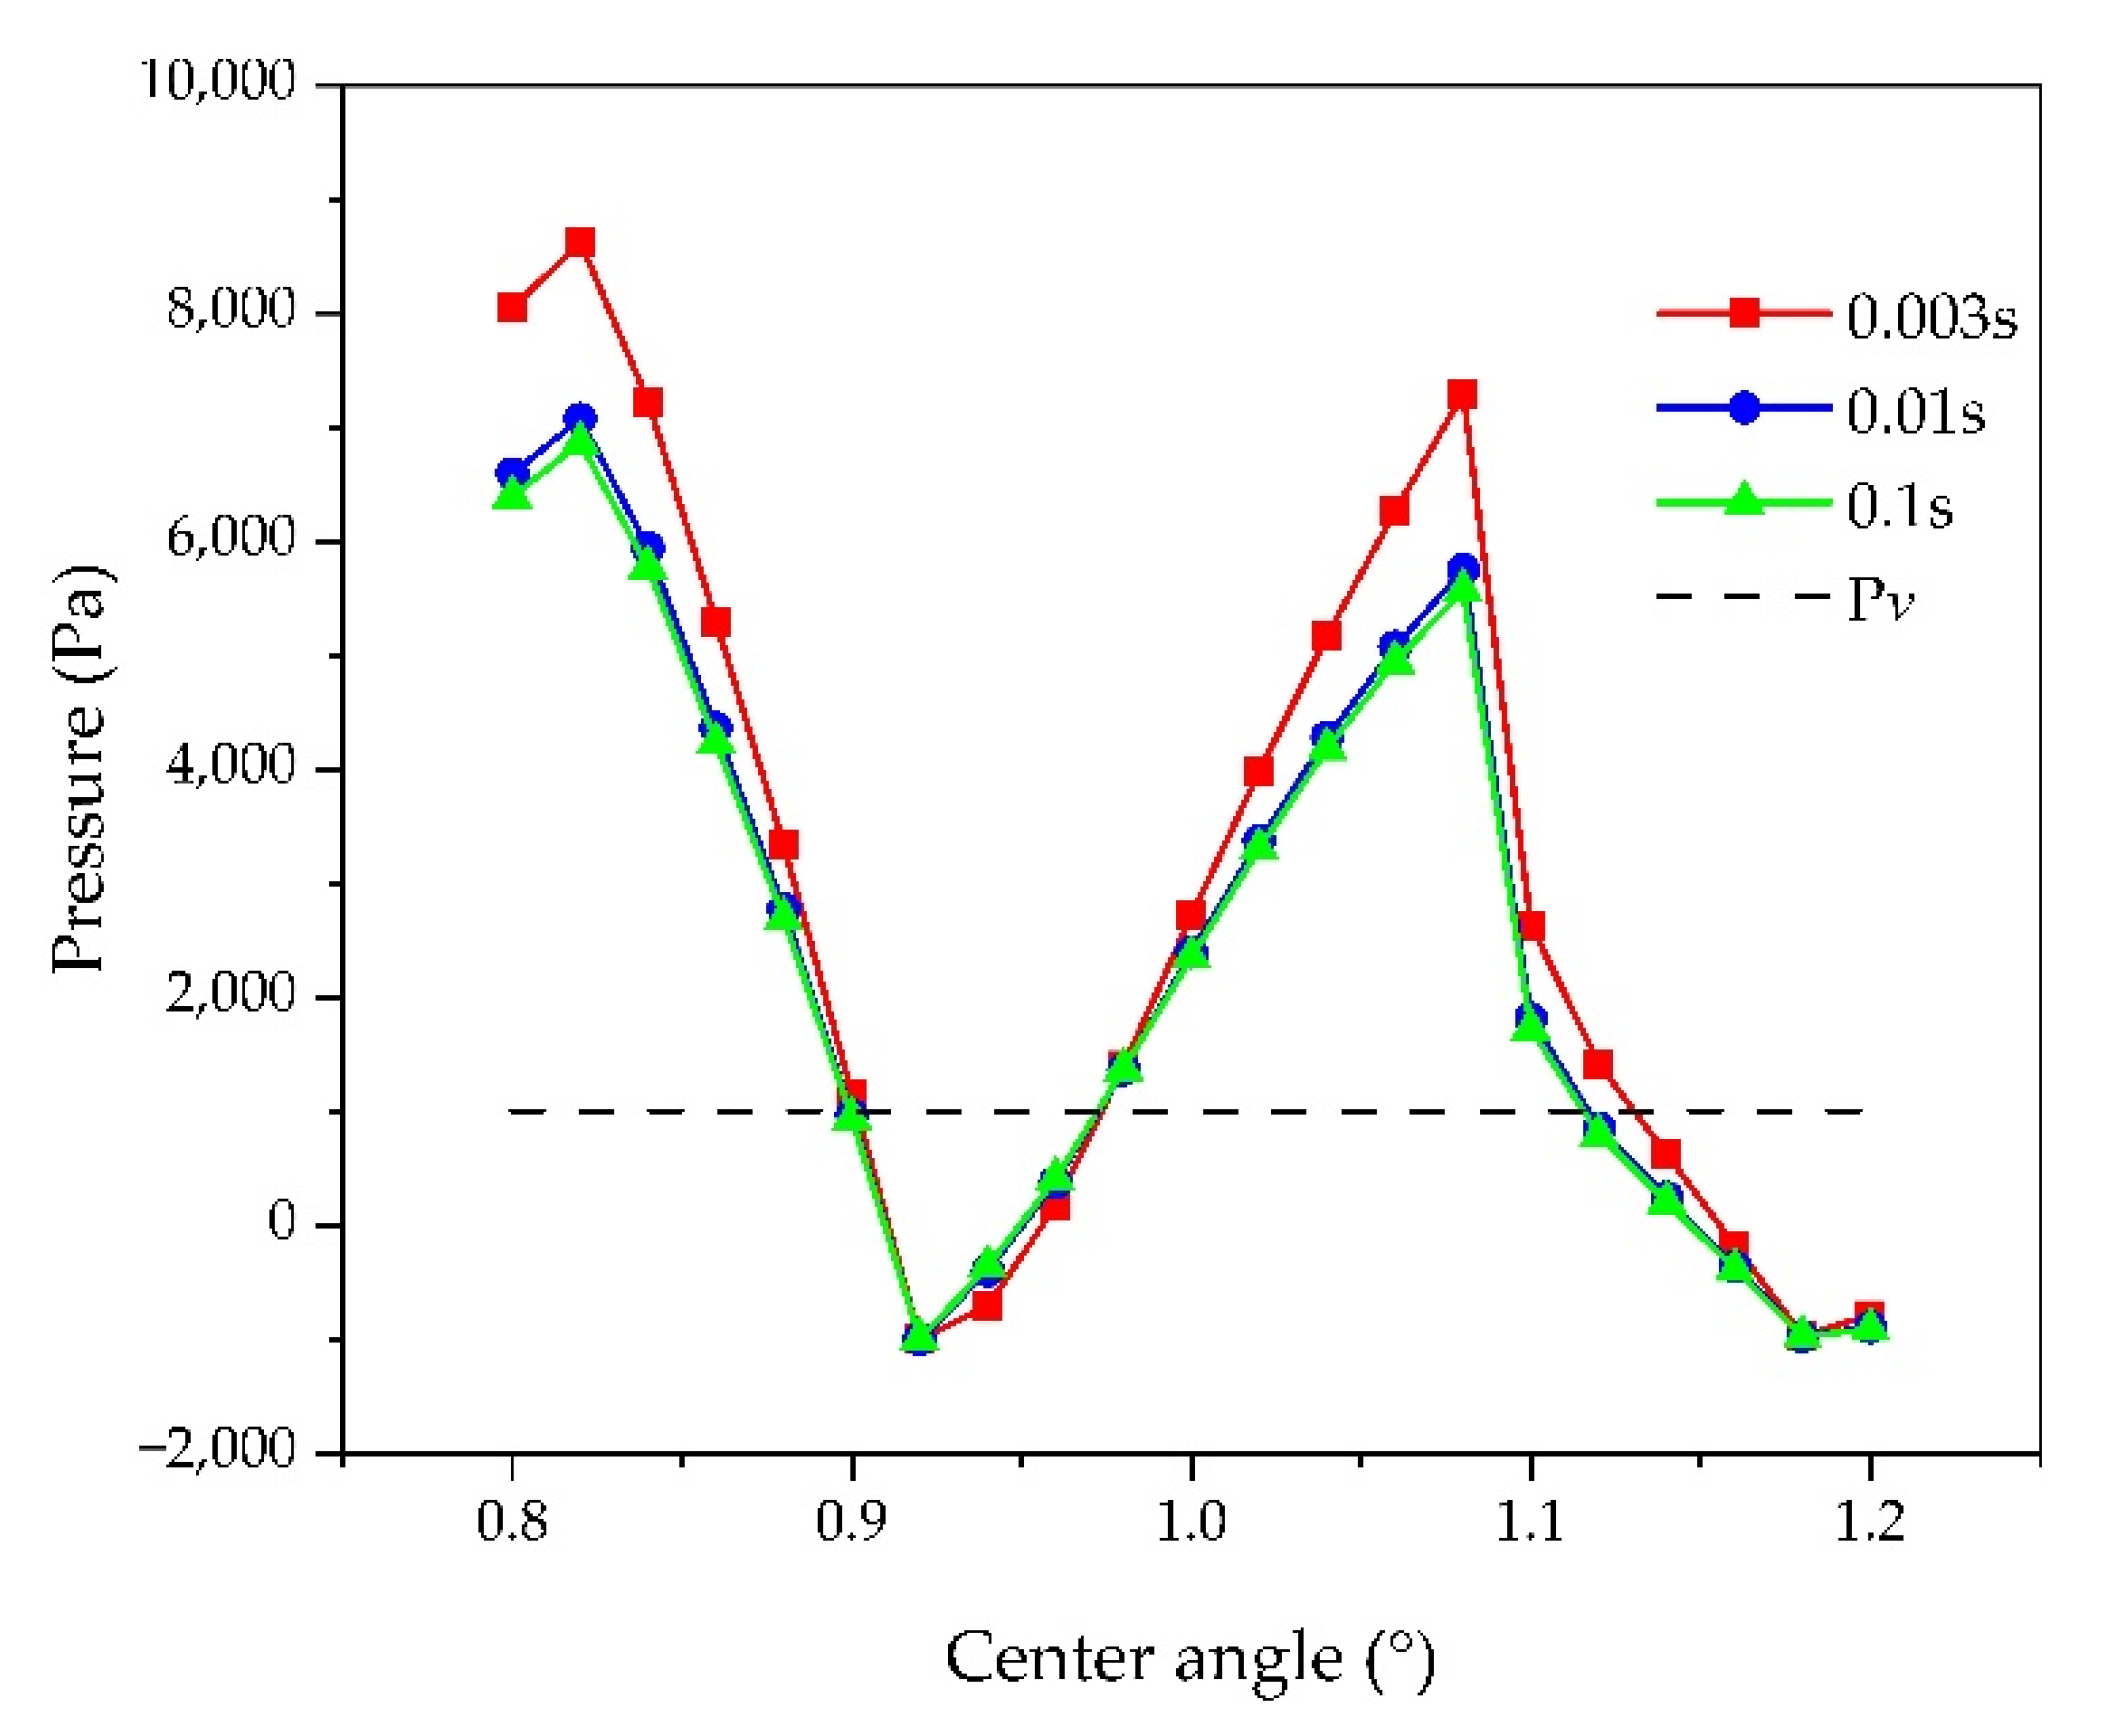
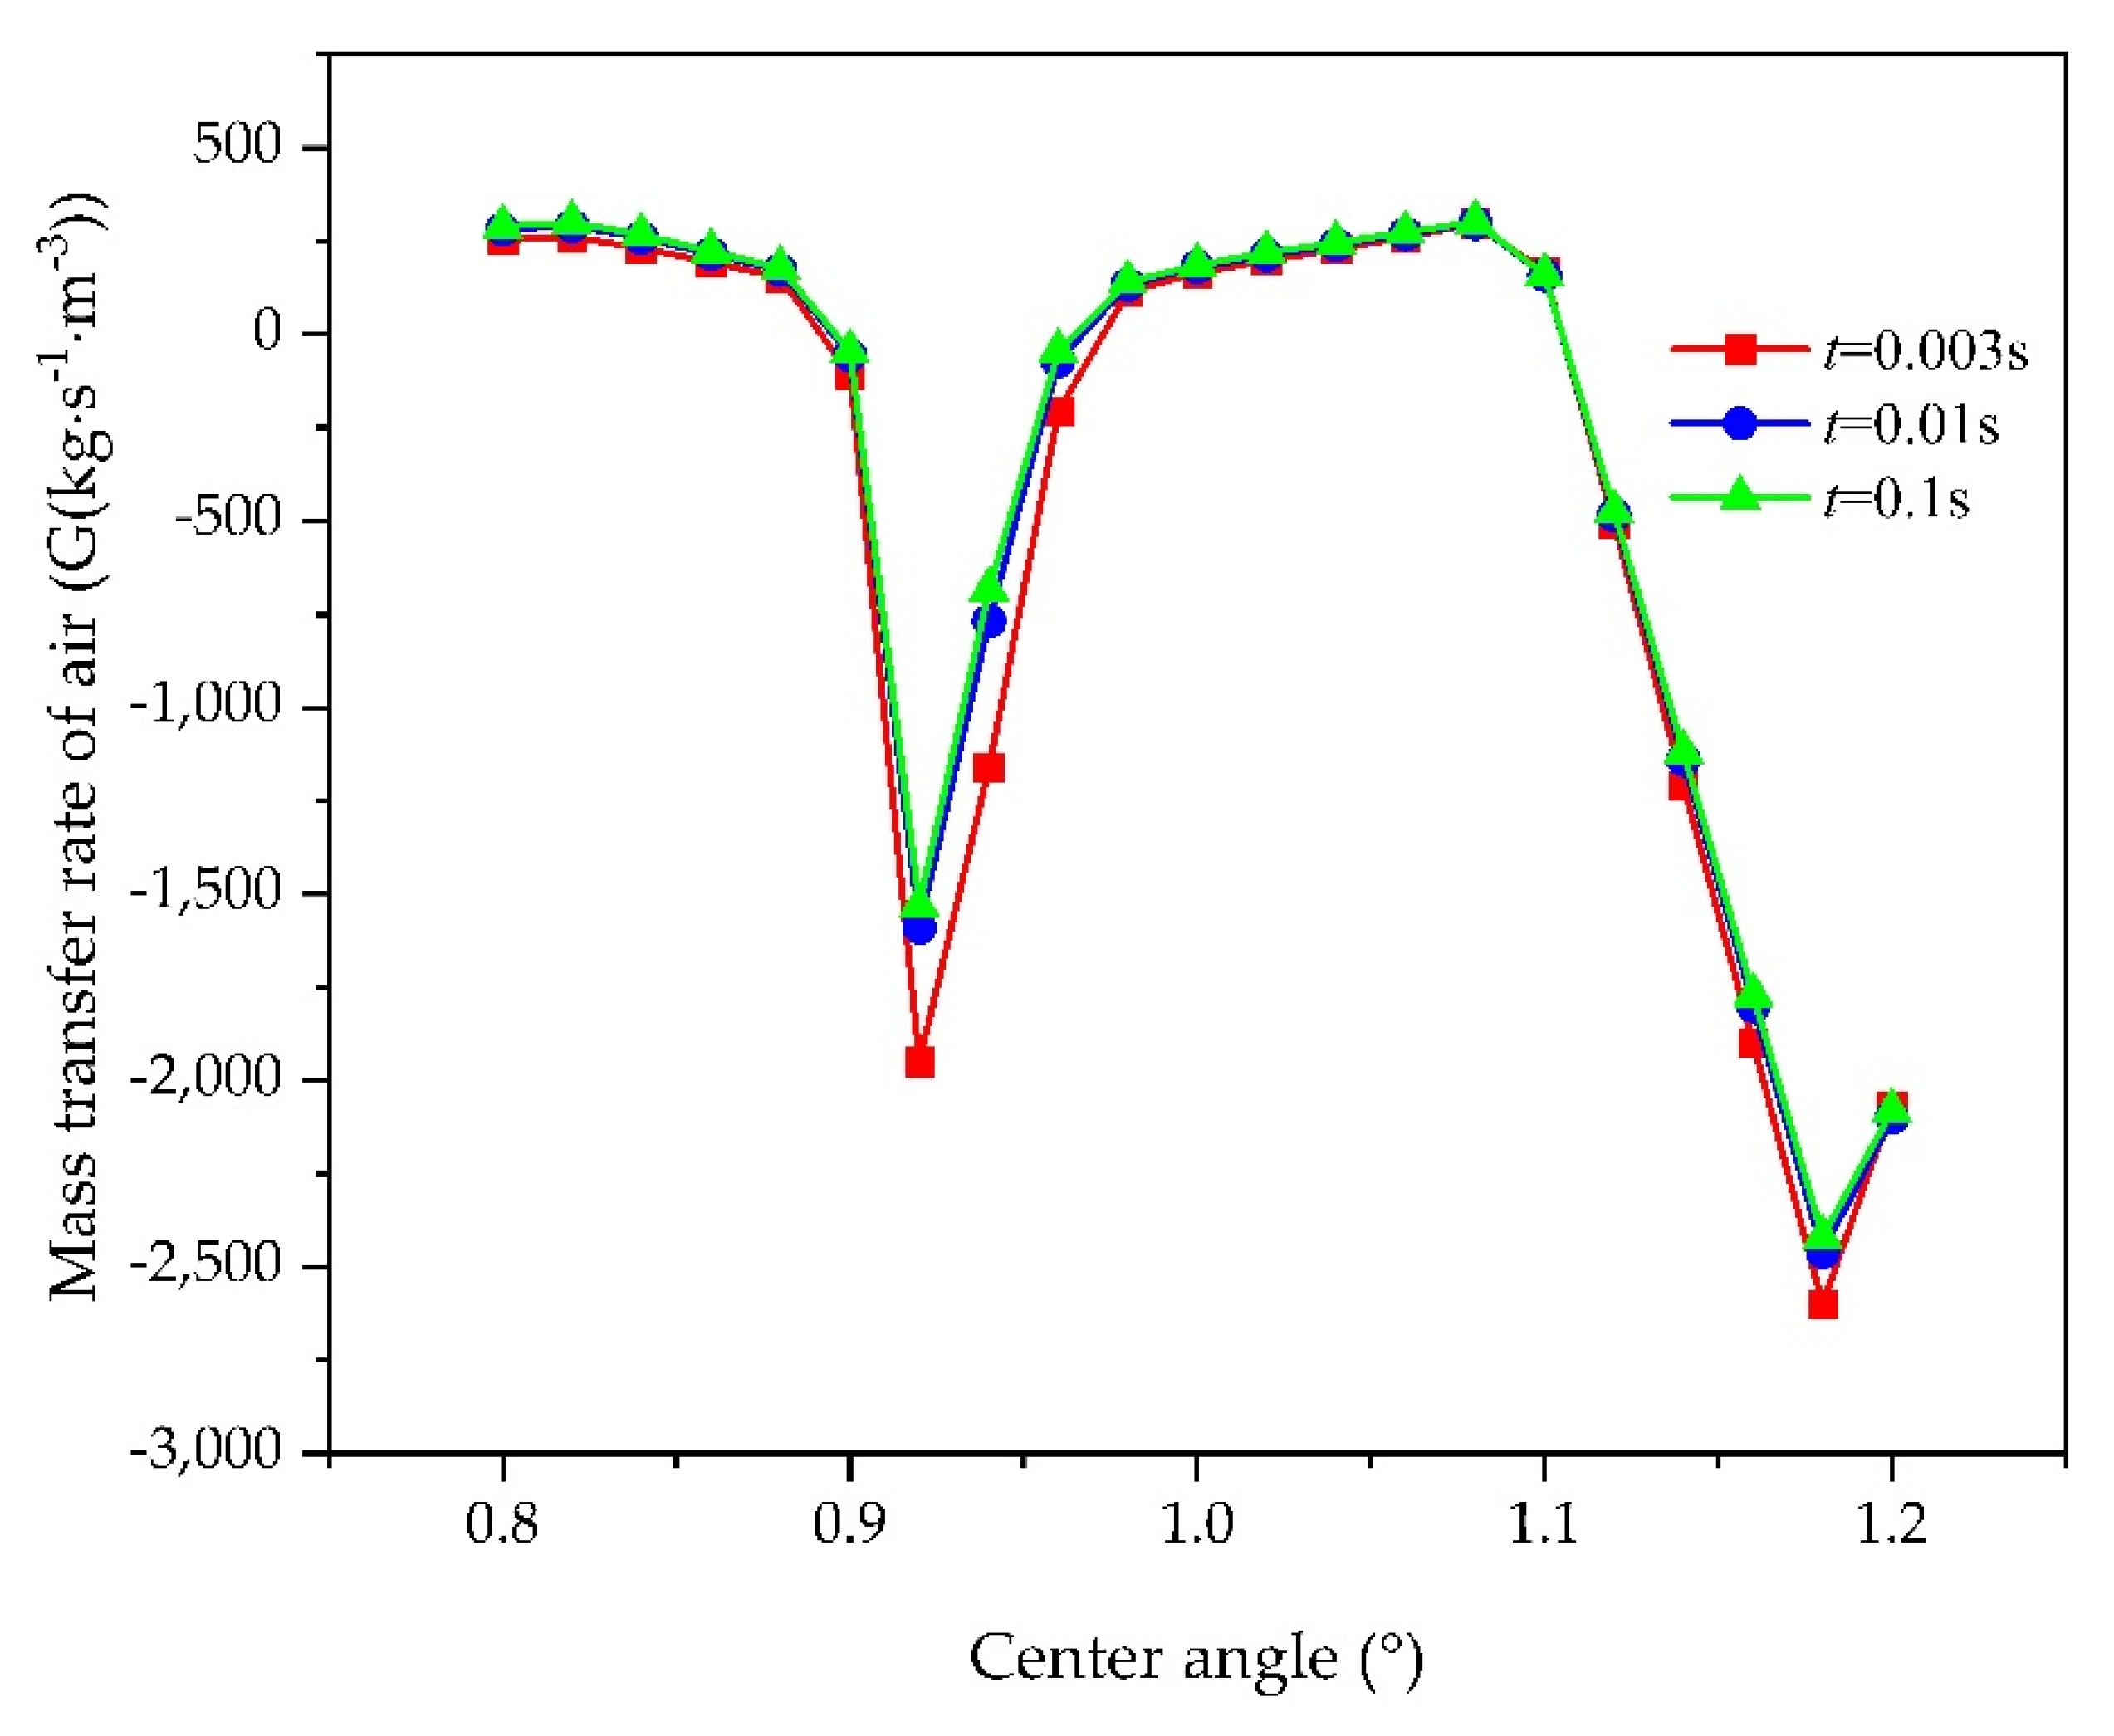
Figure 15 shows the pressure distribution in a single texture dimple (0.9–1.1° is a non-texture area; 0.8–0.9° and 1.1–1.2° are texture areas). It can be seen that cavitation was induced by local low pressure that is lower than pv at the downstream boundary of the texture, local high pressure was generated in the upstream area of the texture boundary, and the peak value of local high pressure gradually decreased with time. It is worth mentioning that the analysis of cavitation pressure is concentrated on the pressure analysis of the whole flow field, and there is very little analysis of the pressure inside the weave at the micron scale.
3.4. Mass Transfer Analysis
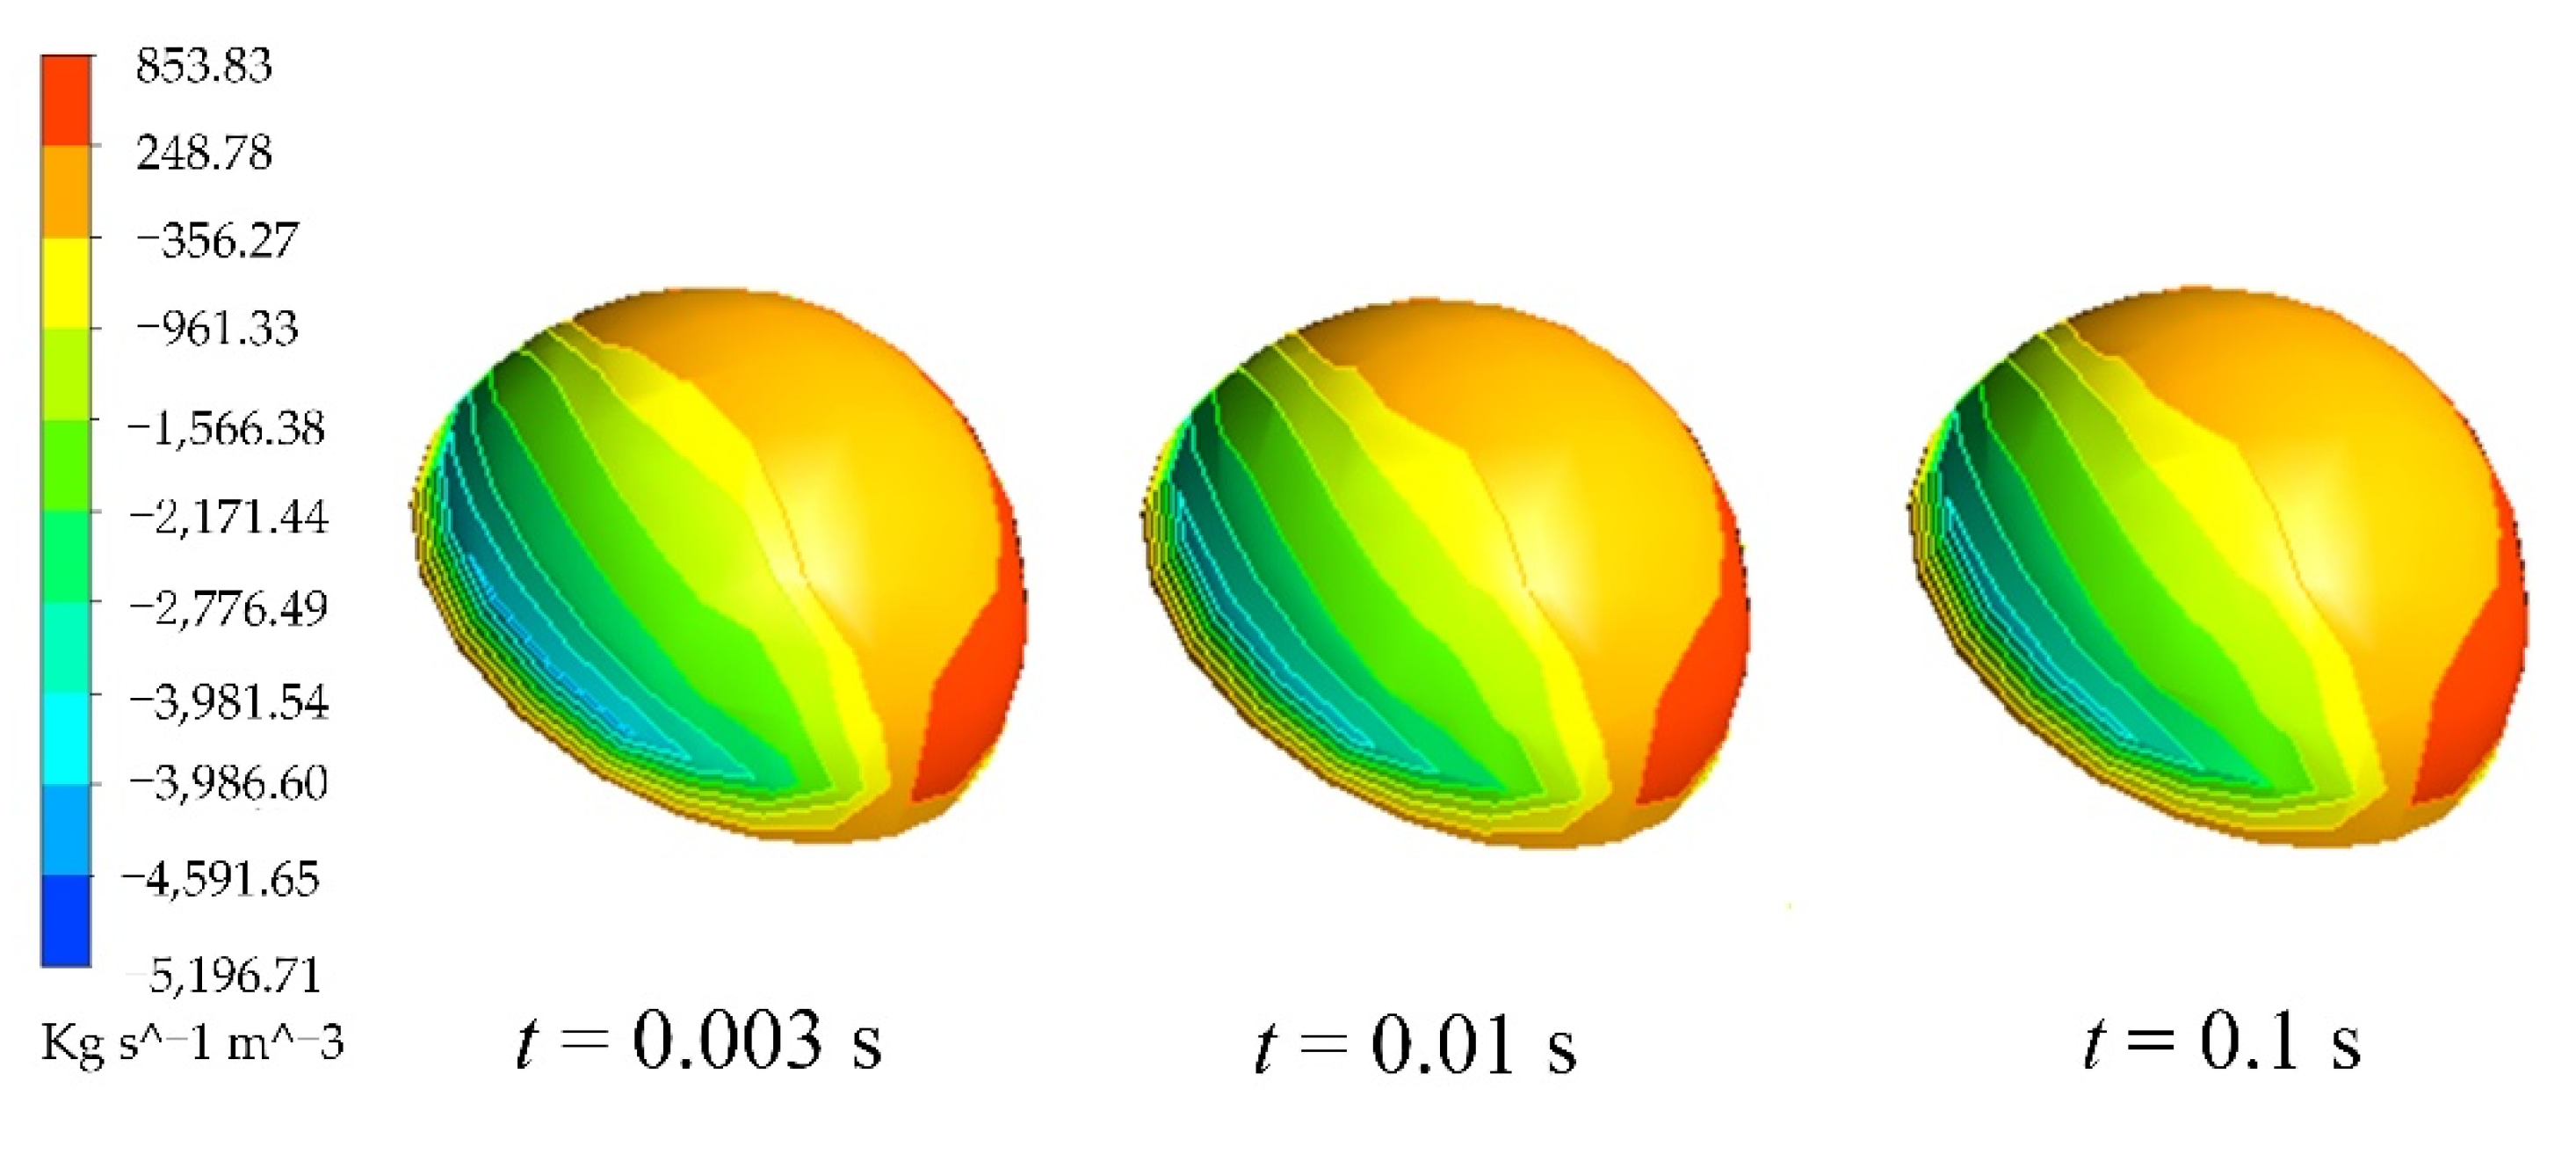
Combined with the above analysis, we can conclude that cavitation occurs when the pressure in the texture dimple is lower than the saturation vapor pressure. The cavitation bubble gradually disappears when the pressure increases as cavitation is generated in the outer diameter (30.5 mm < r < 32 mm) and the cavitation volume fraction disappears around inner diameter (27 mm < r < 30.5 mm). That is, there are no directly observed bubbles. It is assumed that the gas-phase mass generation rate is negative and that the gas-phase mass disappearance rate is positive to analyze the mass transfer between the gas and liquid phases when cavitation is generated. Figure 16 shows the cloud diagram of the instantaneous mass transfer rate of the gas phase in a single texture dimple over time.
Figure 17 reveals more details about the phenomenon shown in Figure 16. Cavitation developed rapidly during t = 0–0.01 s, and the gas mass generation rate reached the maximum at t = 0.003 s. Then, the gas mass generation rate gradually decreased, and the gas mass disappearance rate remained basically unchanged. Simultaneously, the generation of the gas phase was accompanied by a disappearance; that is, the collapse of the cavitation bubble was accompanied by cavitation generation, and the peak value of the disappearance rate of the gas phase was smaller than the generation rate, so the cavitation area gradually increased with time.
4. Experiment Analysis
4.1. Experimental Facilities
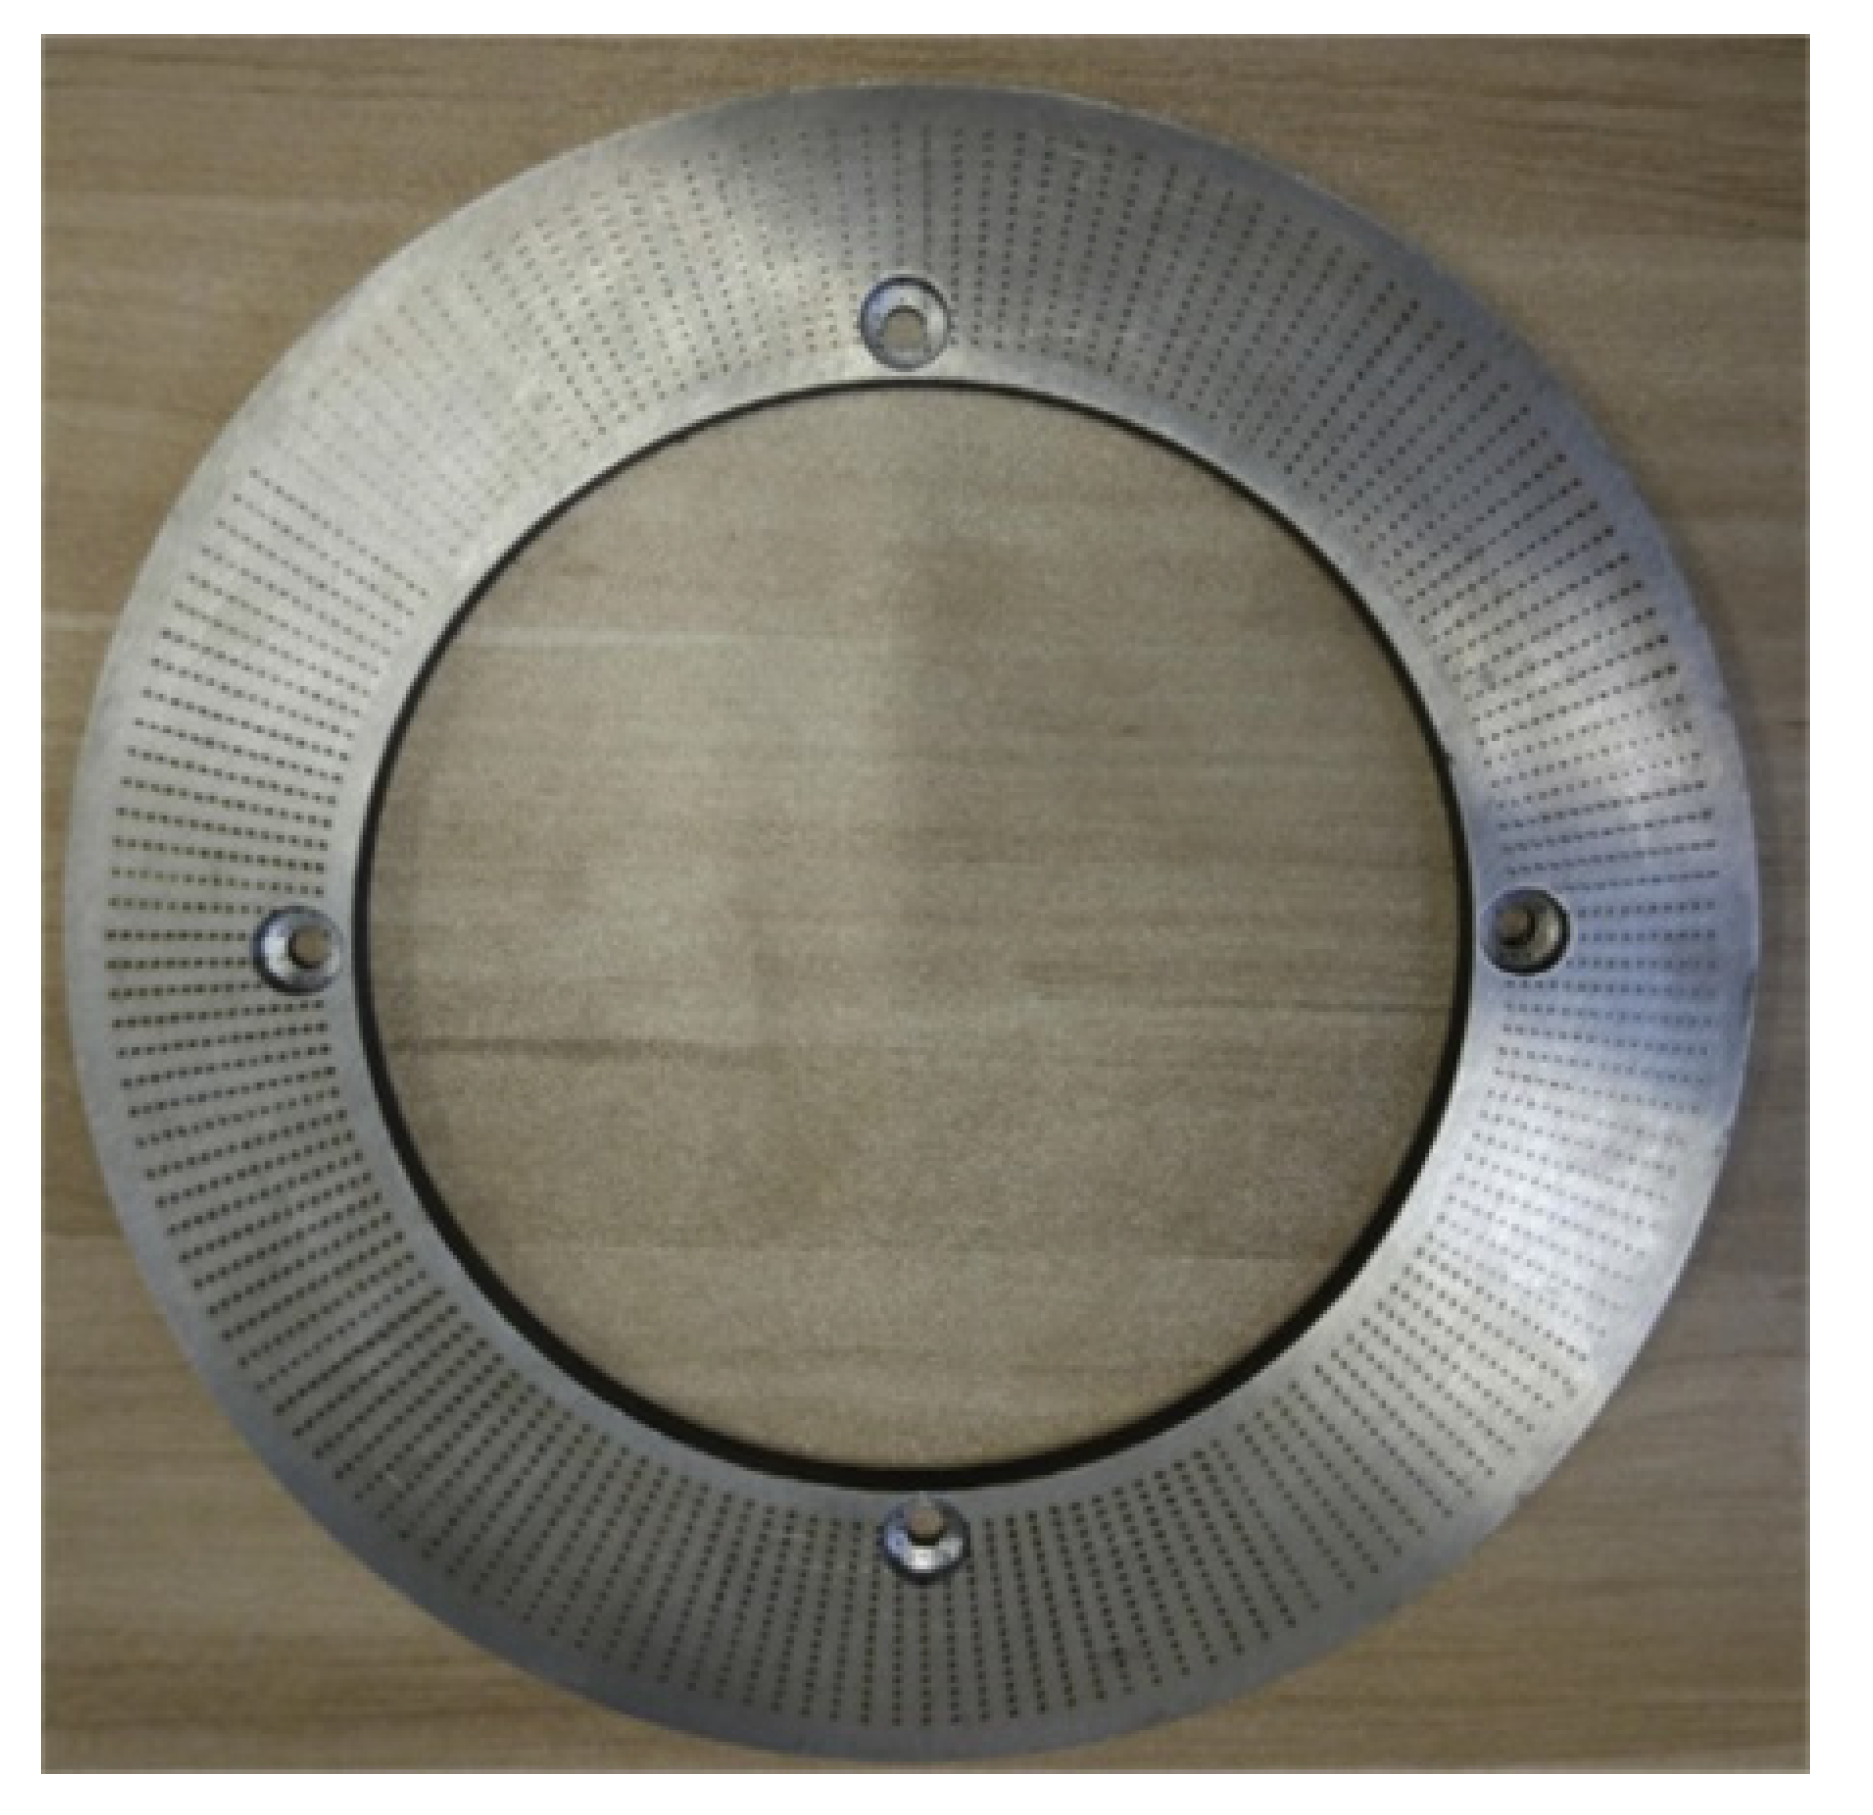
In order to further analyze the cavitation phenomena between rotating friction pairs, we processed a separator disk with a texture ratio of 6% using a laser marking machine (Figure 18).
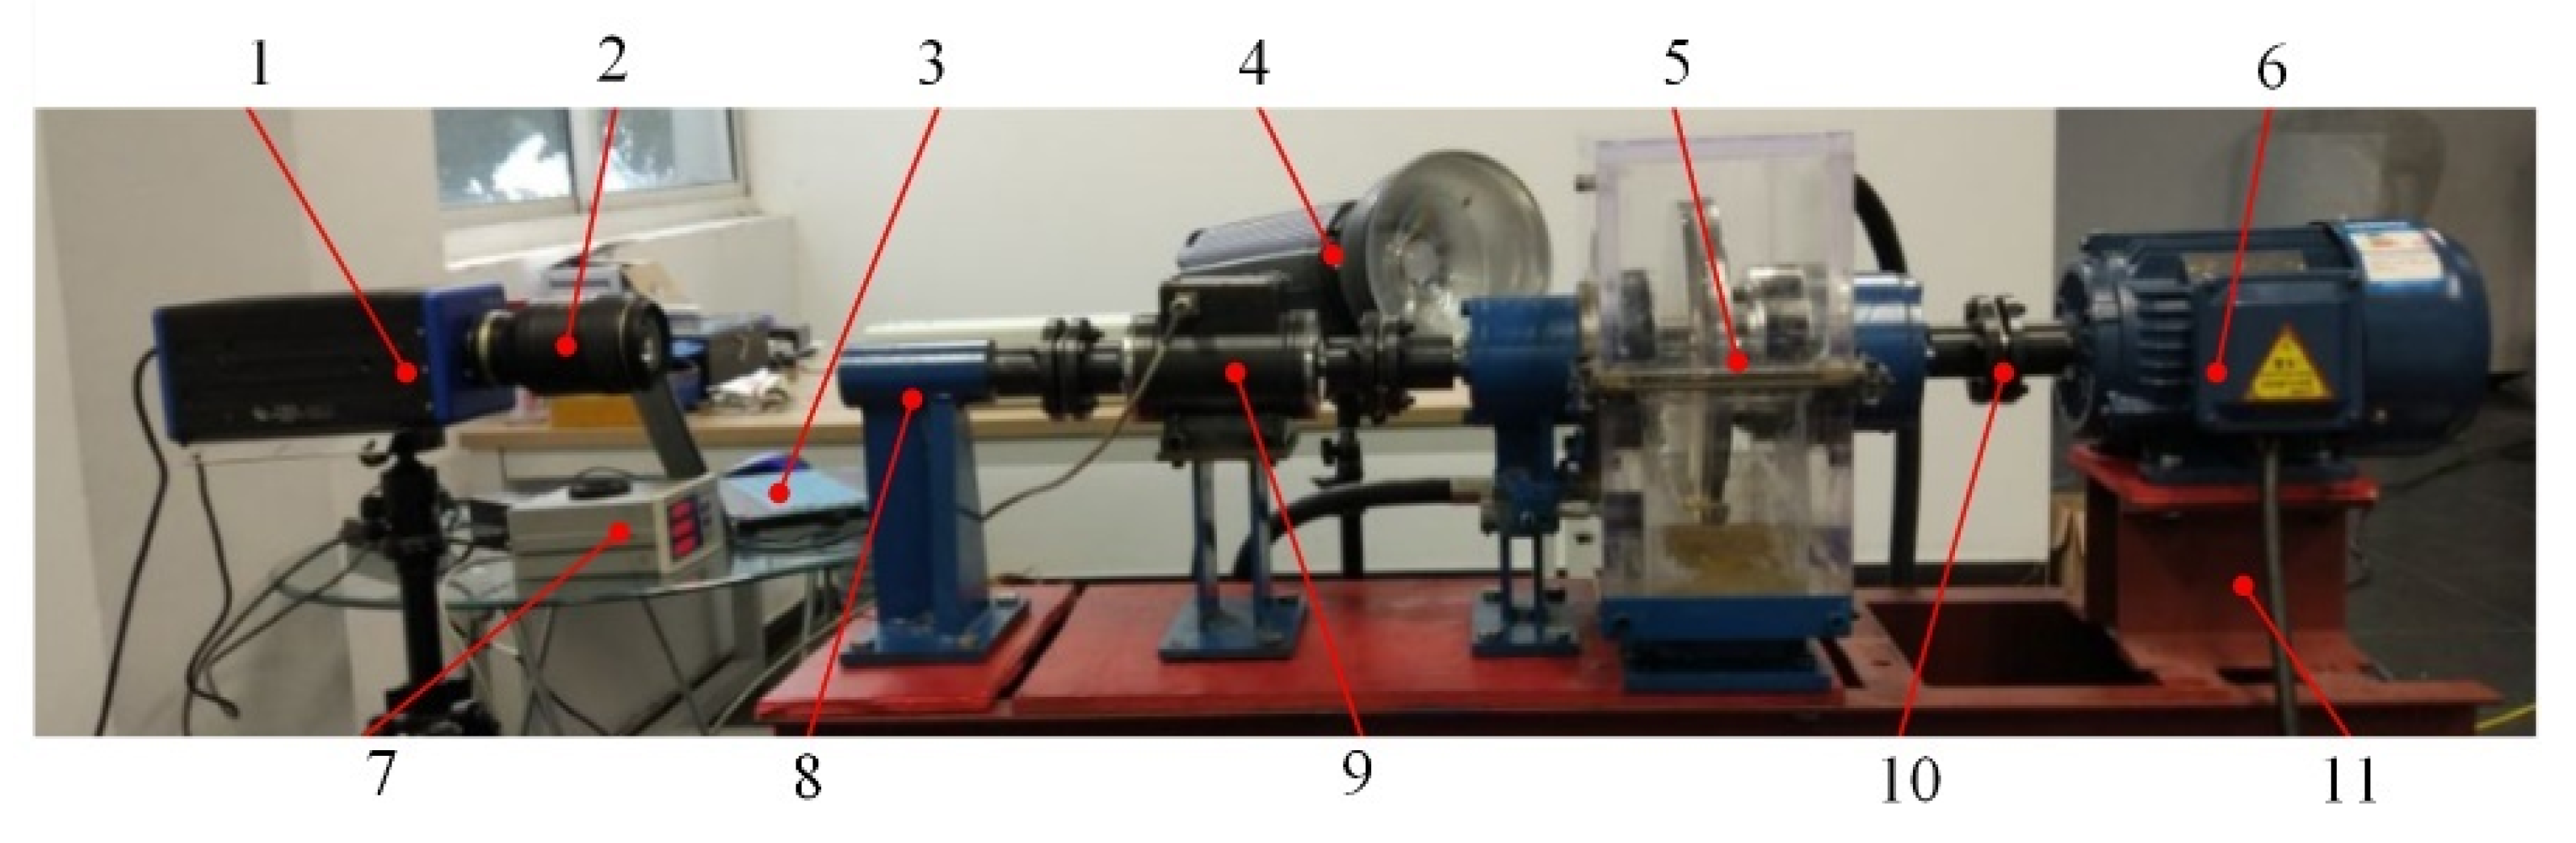
Our research team has extensive experience in building friction test rigs [43]. We set up a visual transparent testbed, which included a transparent host, hydraulic system, and data acquisition system. The transparent host is the main object of power input and output, which is mainly composed of a frequency converter, a three-phase asynchronous motor, and a host. We can observe oil film morphology through it. As is shown in Figure 19, the motor speed is controlled by the frequency converter to adjust the input speed, and the evolution process of cavitation morphology is mainly filmed using a high-speed camera. The fill light illuminates the host directly to measure the driven plate, and the light source is added to obtain the clear flow field motion pattern.
4.2. Experimental Results
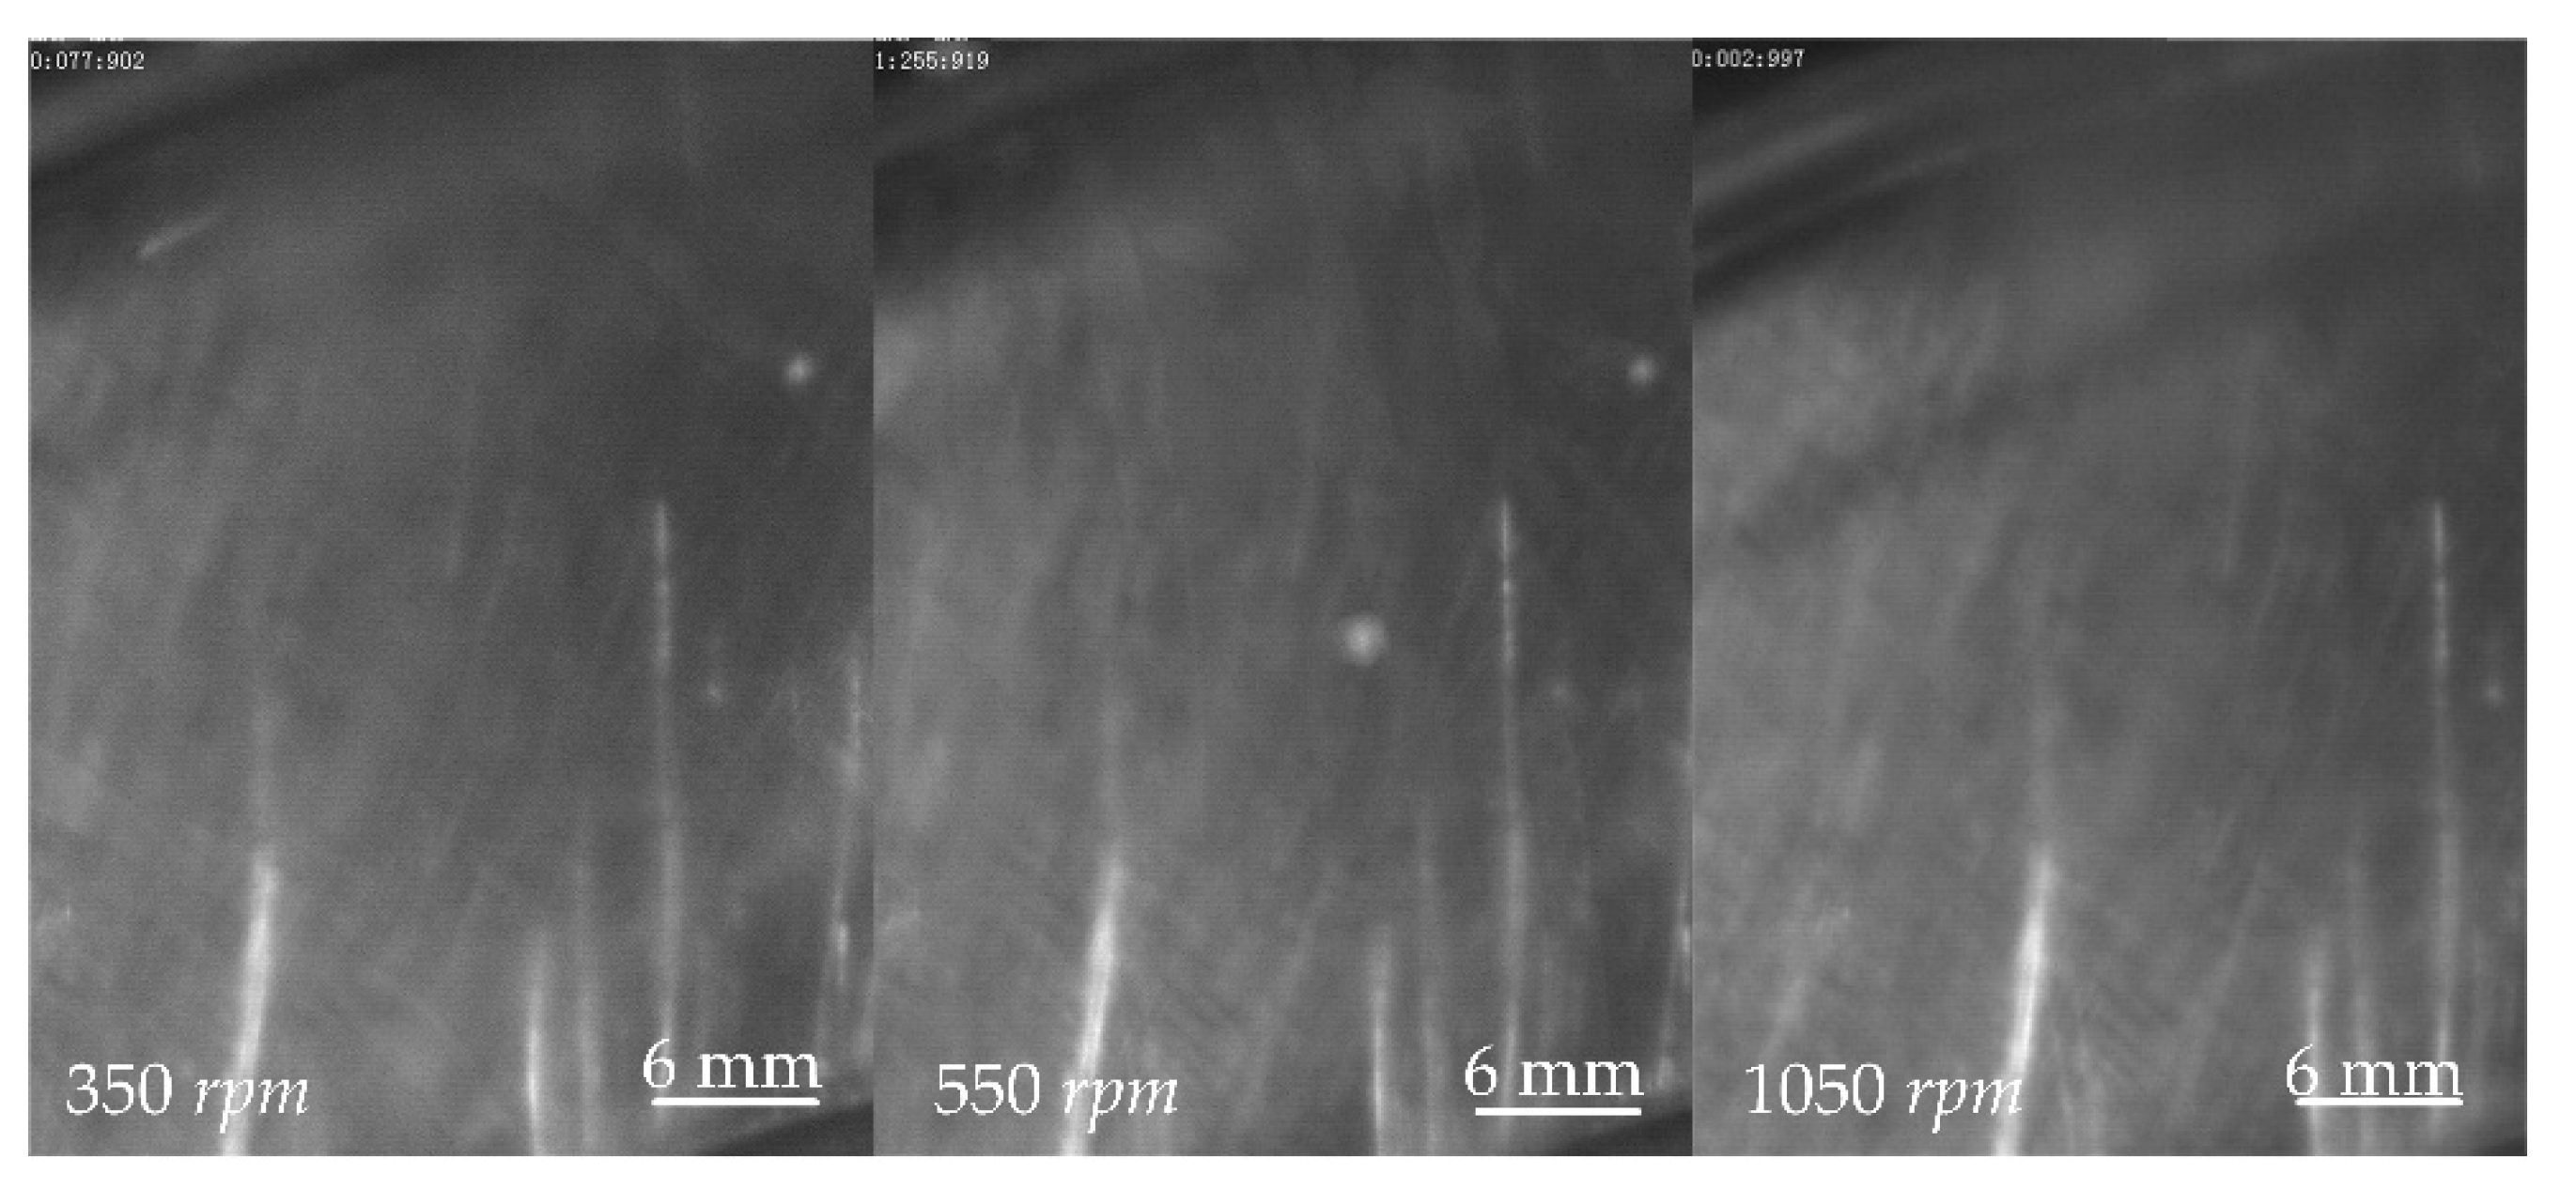
In our experiment, we first selected the non-texture friction disk as the object, and the motor speed was adjusted to 350 rpm, 550 rpm, and 1050 rpm using the frequency converter. The flow field morphology is shown in Figure 20. It can be seen that although the speed increased, the oil film remained intact during the whole test cycle, and there were no cavitation bubbles. Therefore, the pressure pulsation of texture dimples is considered to be an important factor of cavitation. It should be noted that a few linear highlighted areas along the radial direction in the figure were scratches left by transparent box processing. In the next experiment, when the shot angle was adjusted, the linear highlighting area was no longer present.
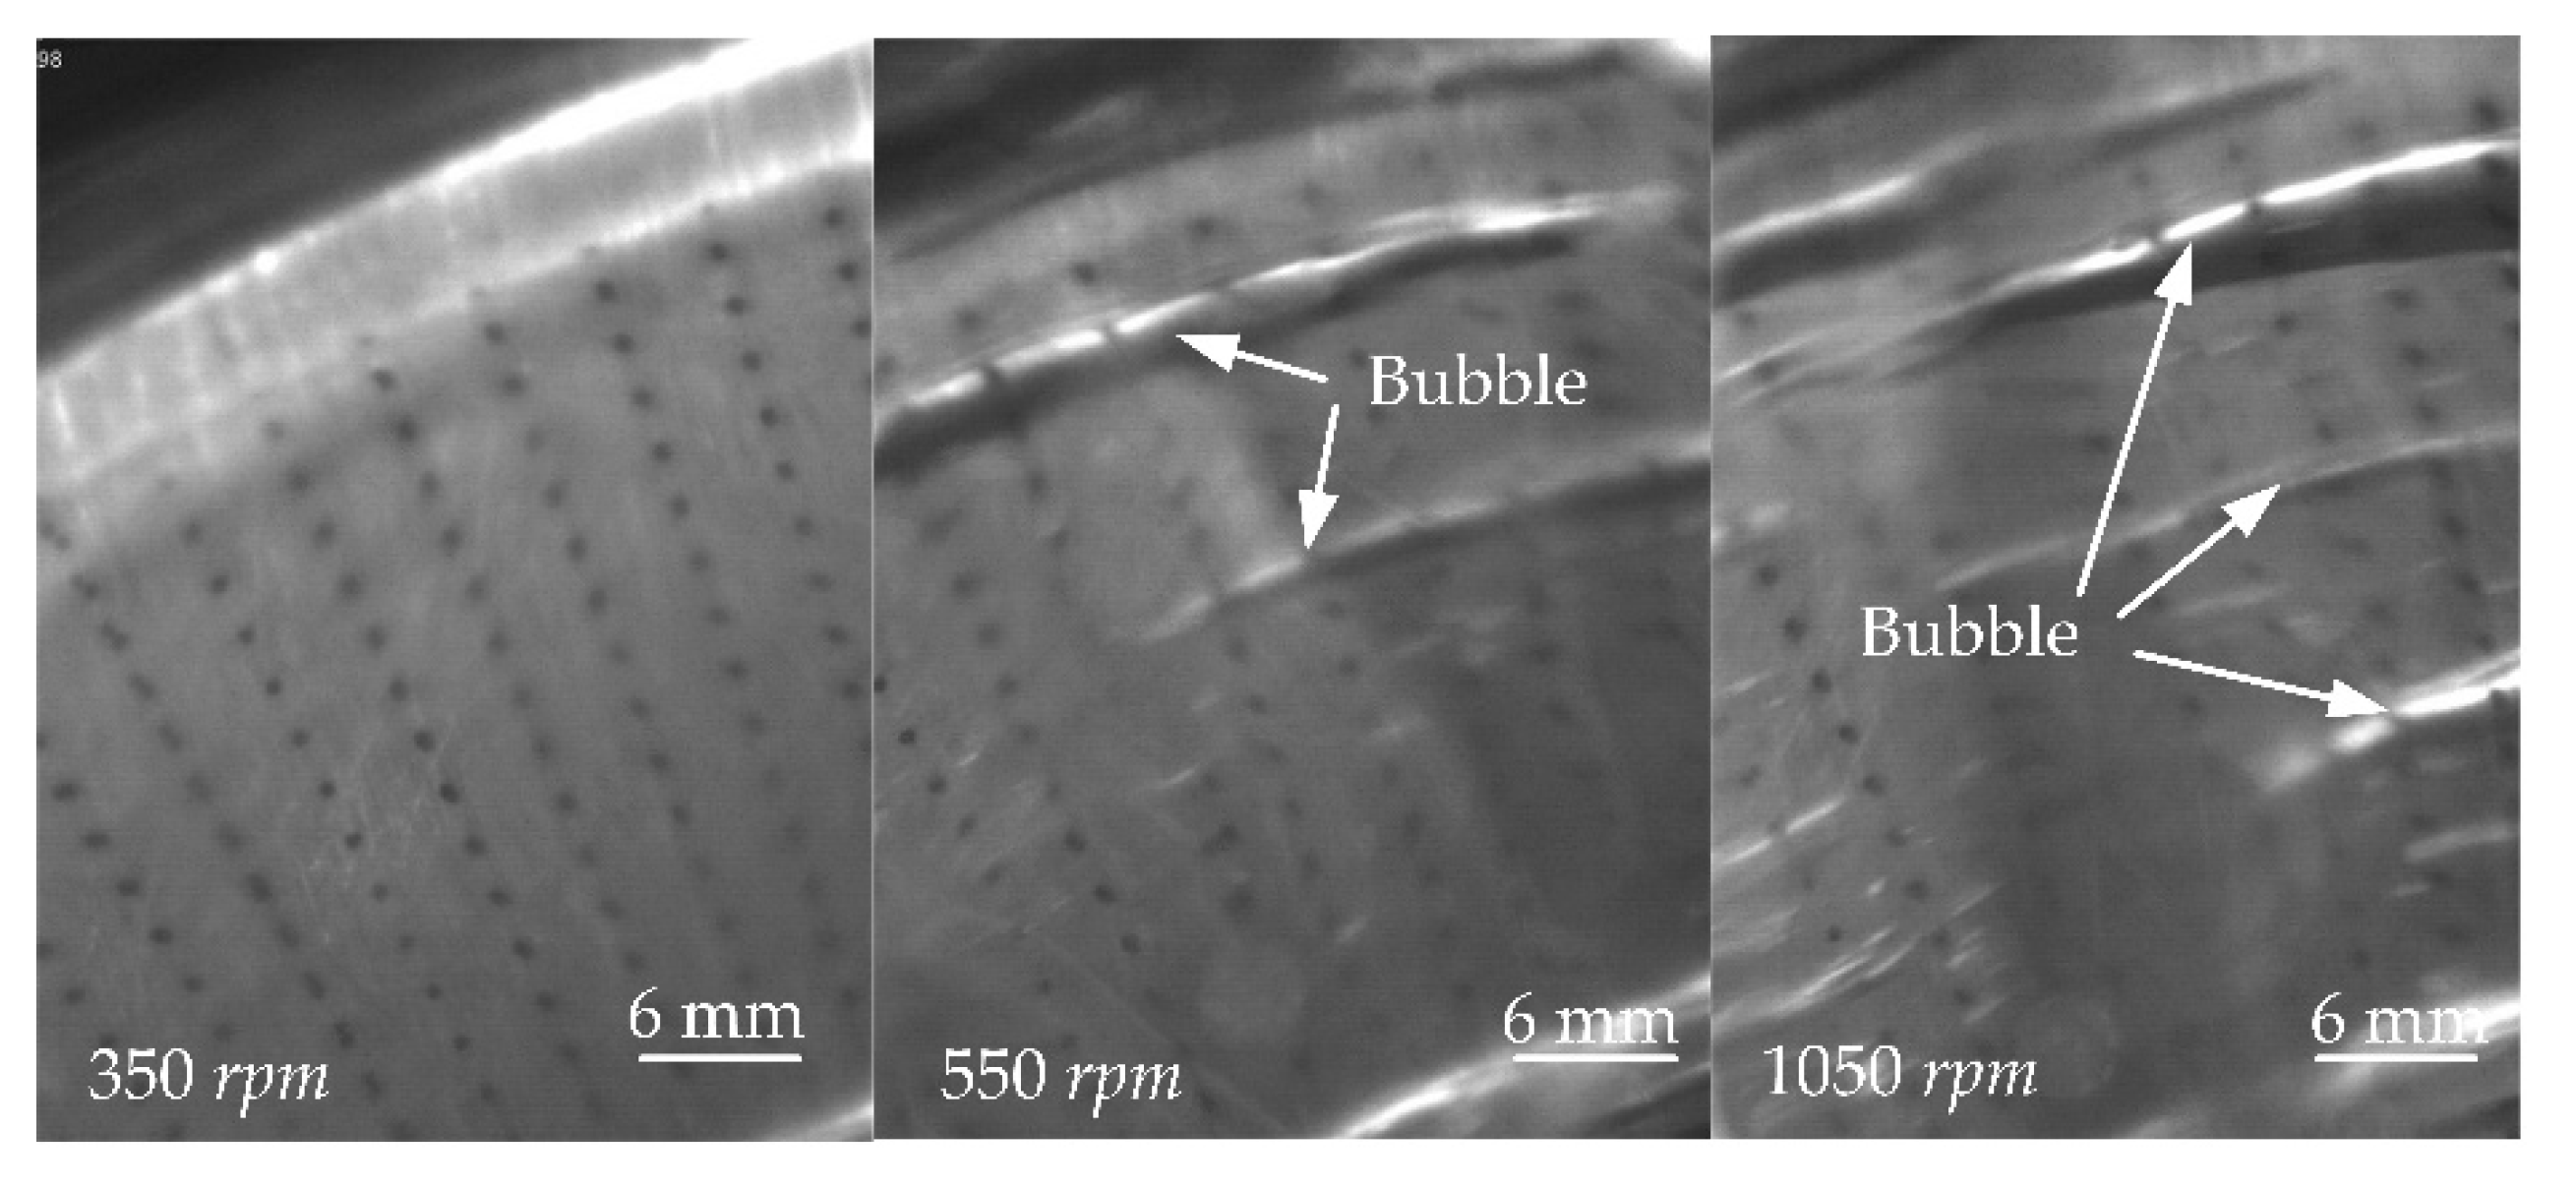
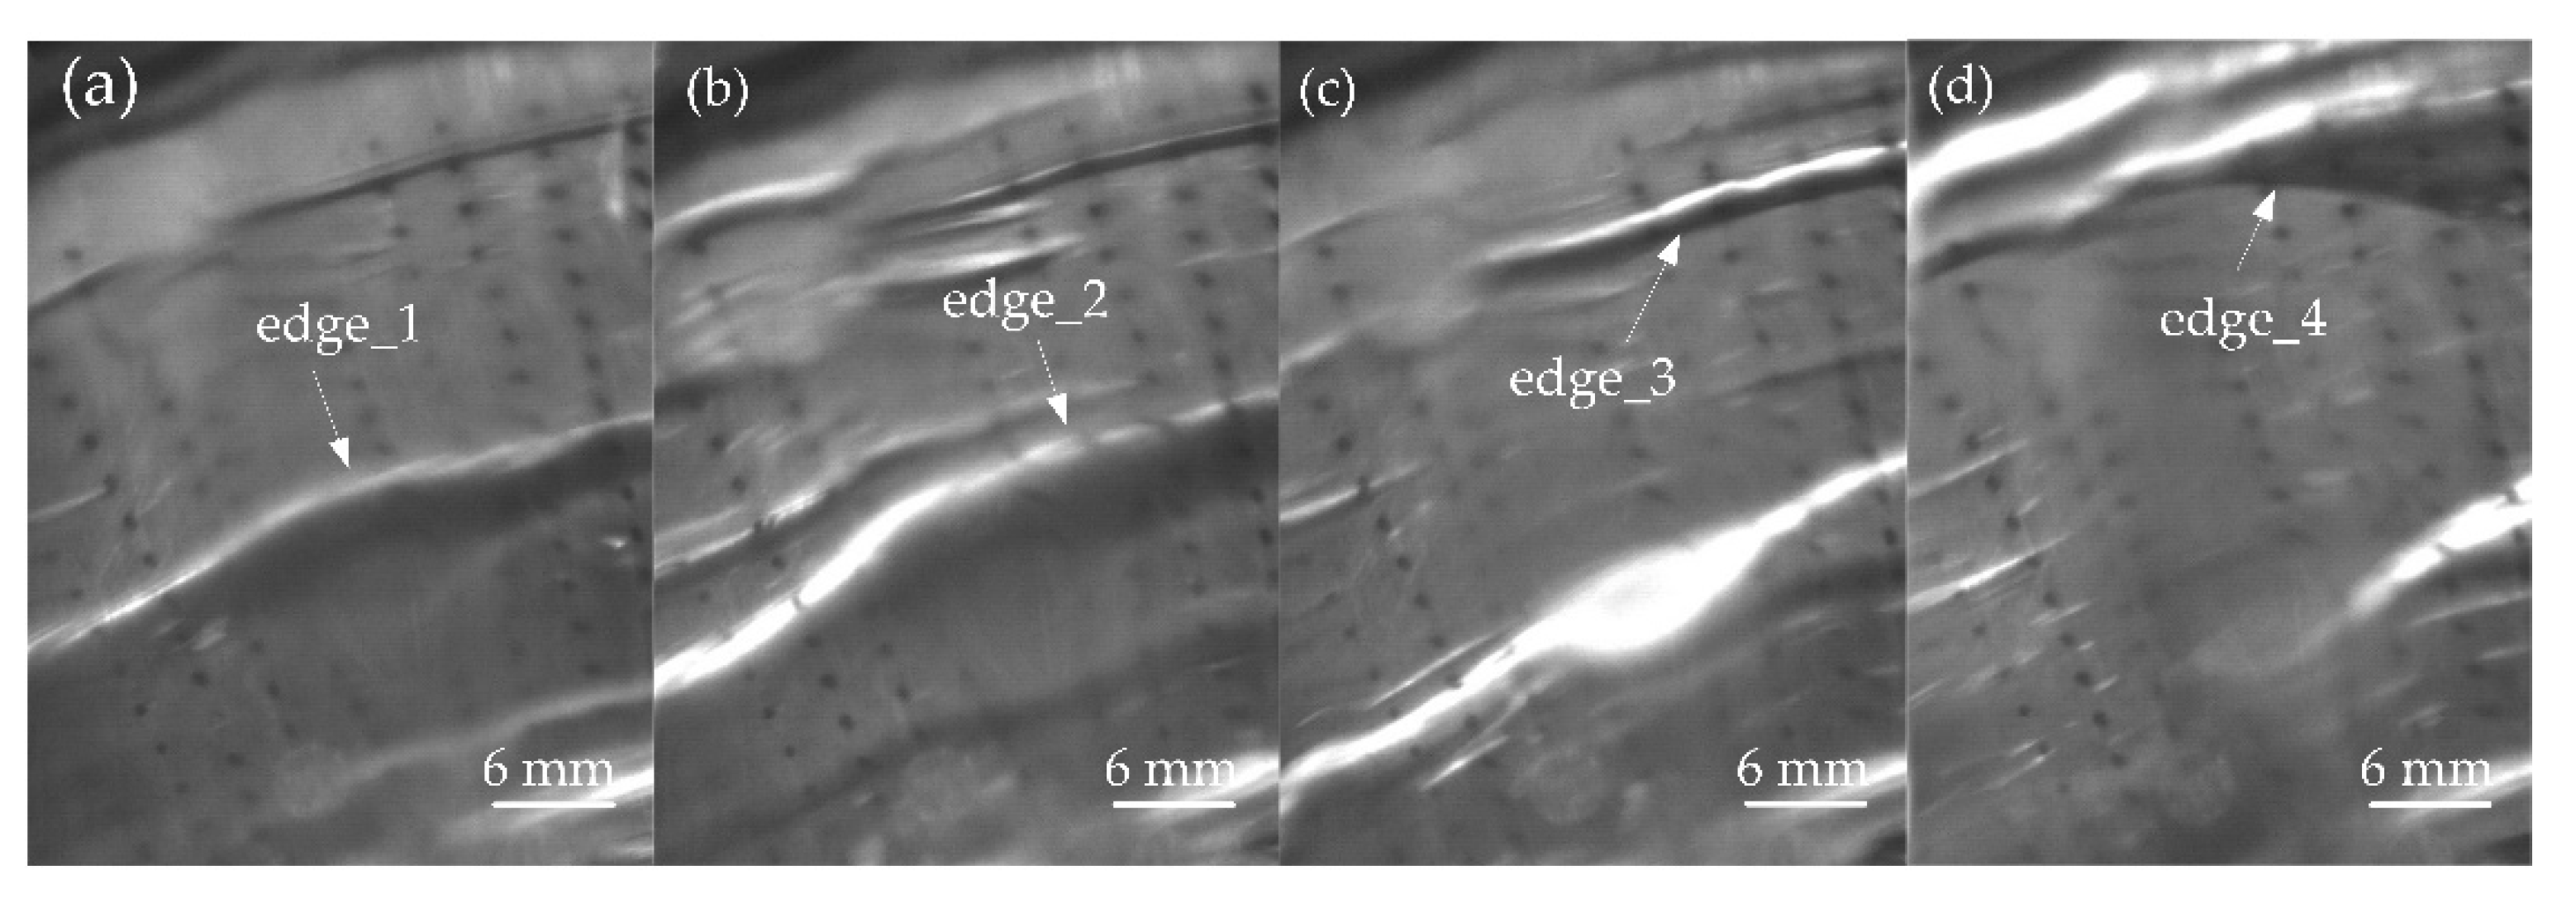
Then, we repeated the experiment with a textured disk (Figure 21). When the rotation speed was 350 rpm, the oil film remained intact and no cavitation phenomenon occurred. When the speed was increased to 550 rpm, the circumferential velocity increased, and cavitation happened obviously. Due to the joint action of wall adsorption and oil film shear, the two “Bubble” areas appeared as narrow arcs. When the rotation speed increased to 1050 rpm, compared with 550 rpm, the bubble sizes increased, and the number of narrow bubbles increased. The cavitation area at the outer diameter increased and gradually moved in the inner diameter’s direction.
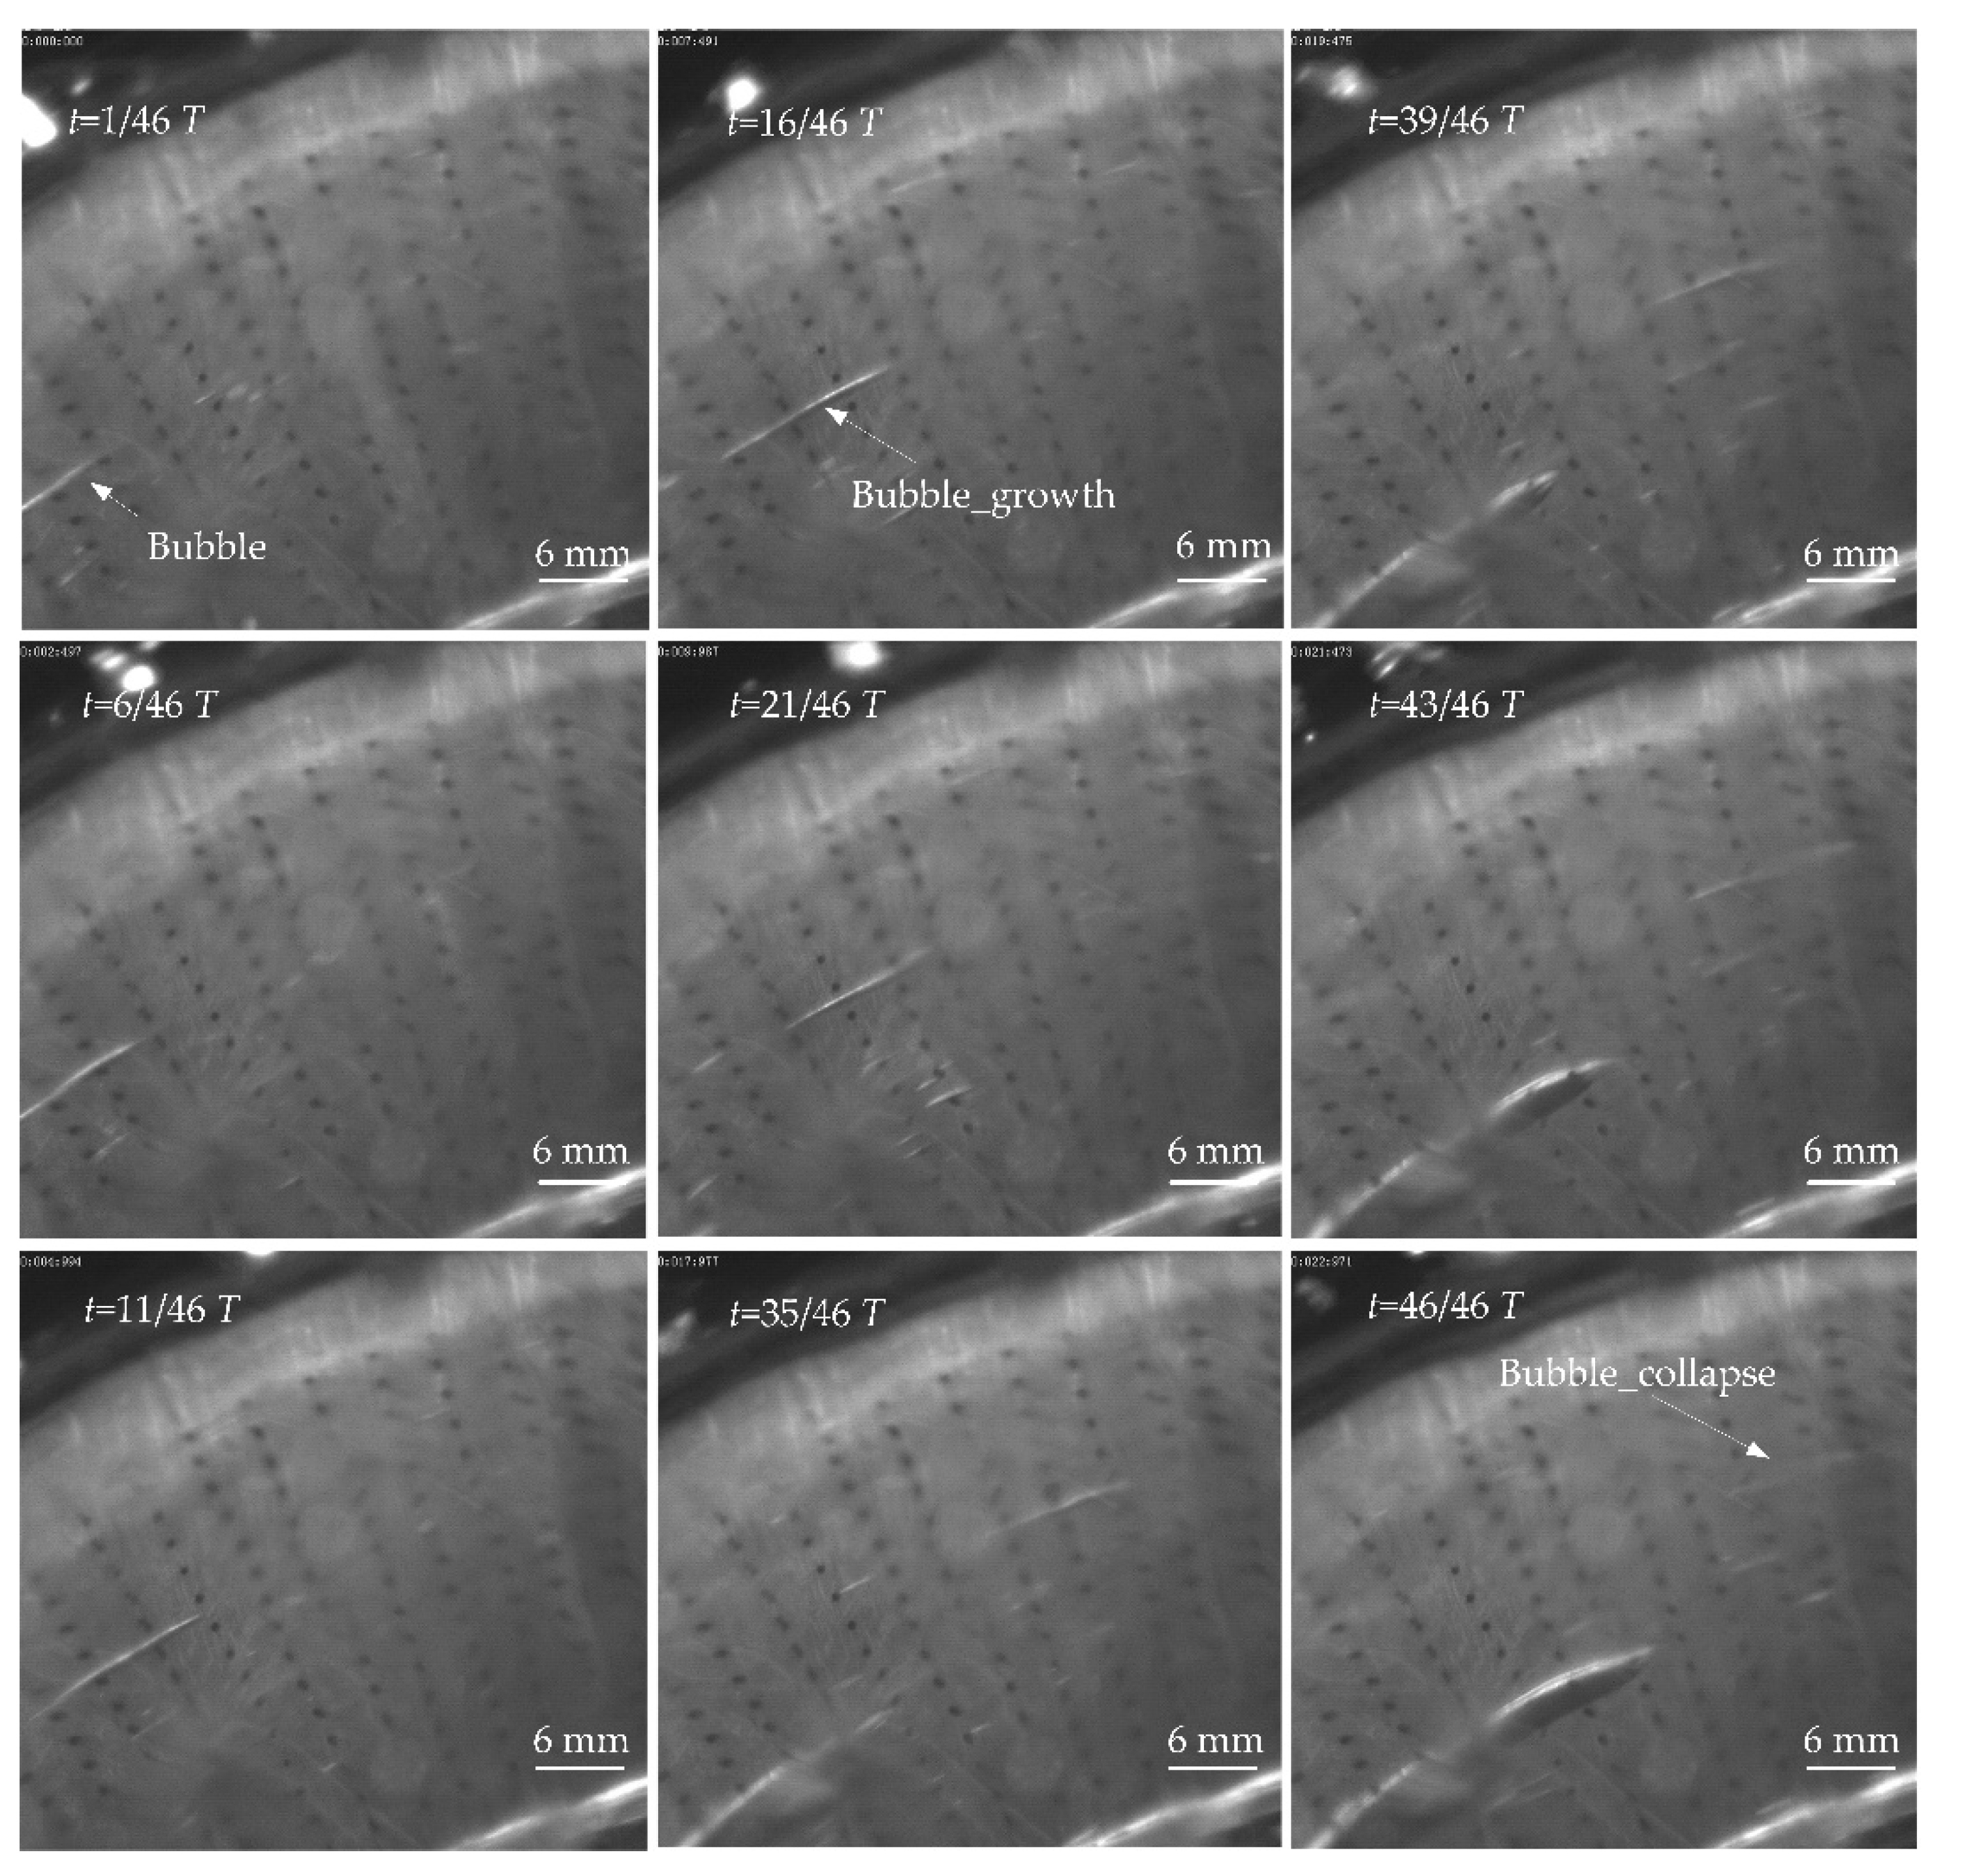
It can be seen in Figure 21 that there were obvious cavitation bubbles when the rotation speed was 550 rpm. In order to conduct a more detailed study, high-speed cameras were used to catch cavitation morphology. We took 3218 photos in total. We took the time from a single cavitation bubble’s debut to its regeneration to be period T. We focused on a single bubble and observed a total of 46 photos in T. The cavitation evolution pattern is shown in Figure 22.
As is shown in Figure 22, when t = 1/46 T, the cavitation bubble looks like a sheet with a fixed and obvious boundary attached to the disk surface in a long and narrow arc shape. The cavitation bubble was very thin. From t = 1/46 T to 35/46 T, the cavitation bubble moved clockwise along the oil flow direction and got closer to the outer diameter. In the free state, the cavitation bubble grew bigger and longer. When t = 35/46 T, the cavitation bubble reached its maximum spanwise width (spanwise is the direction perpendicular to the incoming flow direction and parallel to the surface of the disk). When t = 39/46 T, the bubble’s oncoming surface burst first, possibly because the bubble entered into negative pressure gradient region and squeezed the oncoming surface first. Simultaneously, the front end of the cavitation bubble started to fall off from the initial sheet cavitation into tiny bubbles in a process called cloud cavitation. The cavitation bubble split into a front-end cloud cavitation and a back-end sheet cavitation and started to collapse. From t = 39/46 T to 43/46 T, the cavitation morphology changed from sheet cavitation to cloud cavitation along the front to back end, and the bubble’s boundary became totally fuzzy. The spanwise width reached its maximum, and the cavitation bubble completely changed from sheet cavitation to cloud cavitation and free bubble cavitation. At t = 46/46 T, the cavitation bubble disappeared. The cavitation collapse is extremely rapid, accounting for 7/46 of the cycle of a single cavitation bubble. However, this time ratio is still very high. The possible reason is that the viscosity of the hydraulic oil used in the test slows down the collapse rate.
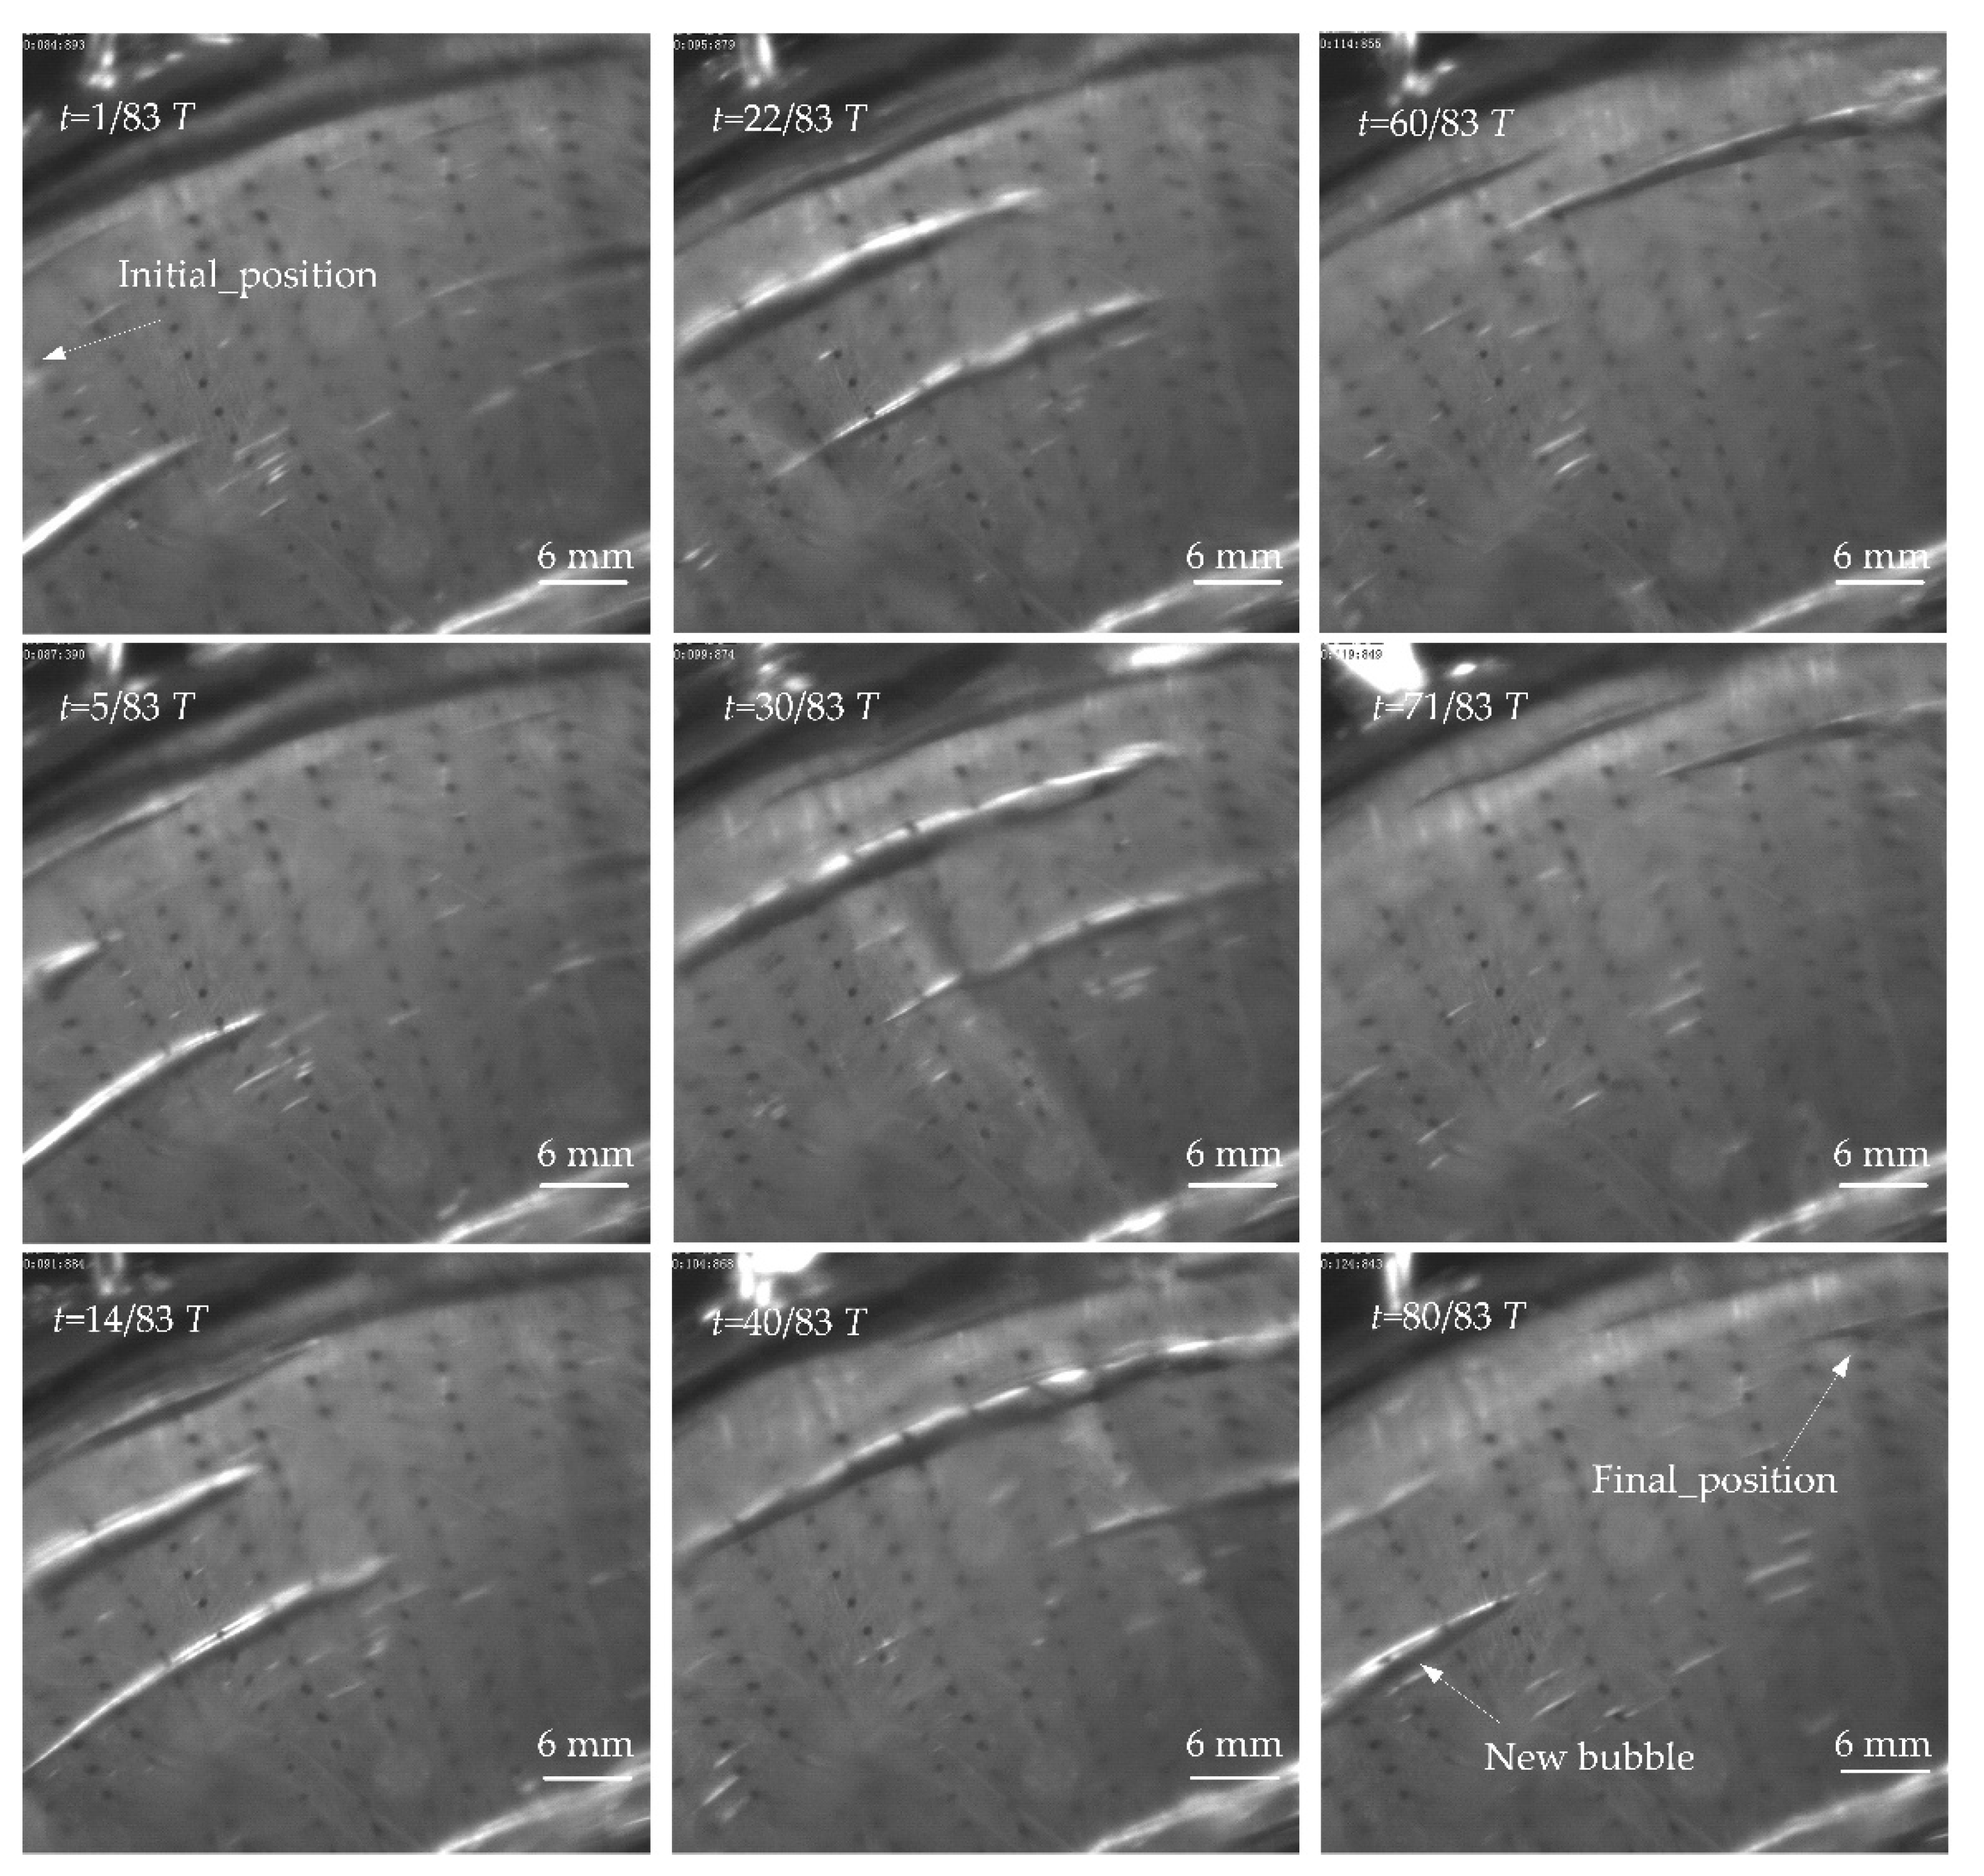
When the rotational speed was 550 rpm, another larger cavitation bubble was selected for monitoring. According to our test results, 83 photos of this cavitation bubble survived in our view, as shown in Figure 23. In contrast to Figure 22, the larger bubble did not completely collapse during the cycle. The cavitation bubble expanded to the maximum width and then decreased, and finally moved out of the monitoring window.
In Figure 23, when t = 1/83 T, the bubble was just coming into view. From t = 1/83 T to t = 30/83 T, the integral shape of the cavitation bubble appeared in the monitoring window and moved to the outer diameter gradually. The bubble’s length was close to the characteristic length of the friction disk, so this can be defined as supercavitation. When t = 40/83 T, the supercavitation bubble reached its maximum size and burst into numerous small bubbles at the front. From t = 40/83 T to t = 71/83 T, the cavitation bubble gradually moved to the outer diameter and fell off, and a new generation bubble appeared at t = 80/83 T. Compared with Figure 22, it can be seen that the bubbles of large structures can survive longer and are less prone to collapse than those of small structures.
At 1050 rpm, the cavitation was more intense, and the survival law of a single cavitation bubble was similar to that shown in Figure 22 and Figure 23, so it will not be repeated. Figure 24 shows that cavitation occurred periodically, and the oil film shrunk. The oil film shrink expanded to the outer diameter and was accompanied by the debut and growth of fresh cavitation. When the cavitation collapsed, a new round of oil film shrinkage occurred. In particular, a gas–liquid two-phase flow region was generated at the outer diameter of the textured disk.
5. Conclusions
In this study, first, the governing equations and models used in the simulation analysis are discussed, including the homogeneous flow model, turbulence model, and cavitation model. Second, a flow field model was established to analyze the cavitation morphology of a 3D textured surface. The cavitation law was analyzed from the perspectives of pressure distribution, cavitation gas fraction, and gas–liquid mass transfer, simultaneously. Third a transparent test device was built to capture the cavitation morphology, and it was found that the photos taken during the experiment were consistent with the simulation results. The research results can be applied to the optimal design of mechanical seals and wet clutches, and after extension, can be further applied to internal combustion engine cylinders and bionics equipment. It can improve the sliding performance and weaken the cavitation effect in practical applications.
By analyzing the cavitation flow field, the pressure in the cavitation region is always found to be lower than the saturated steam pressure. By comparing the velocity vector arrows of the two-phase flow, it was found that the motion directions of the liquid phase and vapor phase are consistent, and there is mass transfer between the two phases, so it is verified that cavitation bubbles originate from the phase transition. At the same time, cavitation debut and collapse exist simultaneously, and cavitation generation is faster than cavitation collapse, so the cavitation area expands.
In application scenarios requiring high bearing capacities and low torque, such as mechanical seals, the treatment of the end texture is already a mature technology. The cavitation sum caused by texture is not proportional to the texture ratio. Therefore, it is worth analyzing the optimal texture ratio in future research to provide guidance for engineering projects. It was also found that cavitation was more likely to occur at the outer diameter of the rotating disk, i.e., the region of higher radial velocity. Therefore, in order to obtain the beneficial effect of the texture structure, it is possible to consider processing the micro-texture in the range of the inner diameter region.
Low pressure and cavitation core are the most influential factors. This study verifies that uneven surfaces of machinery equipment are key inducers of cavitation, we used non-texture friction pair as a reference experiment, and the simulation analysis and experimental study both verify that smooth surfaces do not generate cavitation. The surface of the textured friction pair shows a severe cavitation phenomenon. Therefore, more attention should be paid to surface roughness when machining micro-textures. Cavitation is more likely to occur at high rotational speeds.
6. Patents
The patent number is CN201810435987.8.
Author Contributions
Conceptualization, J.S.; methodology, J.S.; software, J.S.; validation, L.C., B.Z., and P.Q.; formal analysis, J.S.; investigation, J.S.; resources, J.S.; data curation, H.H.; writing—original draft preparation, J.S.; writing—review and editing, J.S.; visualization, J.S.; supervision, L.C.; project administration, B.Z.; funding acquisition, B.Z. and P.Q. All authors have read and agreed to the published version of the manuscript.
Funding
This research was funded by the National Natural Science Foundation of China (51805215, 51605194), in part by the Starting Foundation of Jiangsu University Advanced Talent (14JDG048), in part by the Open Foundation of the State Key Laboratory of Fluid Power and Mechatronic Systems (GZKF-201819), and in part by the Scientific Research Foundation of Tangshan Normal University of China (Grant No. 2021A02).
Data Availability Statement
The data that support the findings in this study are available from the author J.S. upon reasonable request.
Acknowledgments
In addition to the efforts of the co-authors, I need to thank the School of Mechanical Engineering of Jiangsu University for providing the experimental apparatus and experimental materials. As well as colleagues from the Institute of Mechatronic and Hydraulic Control for their help in the experiments.
Conflicts of Interest
The authors declare no conflict of interest.
Nomenclature
| φ | General scalar of the flow field |
| χ | Subscript |
| ρ | Fluid density |
| ρv | Gas density of gas phase |
| NP | phase number |
| λ | Volume fraction |
| U | Vector velocity |
| Γ | Phase diffusion ability |
| SM | Mass source |
| ωh | Turbulence frequency |
| Pk | Incidence of turbulence |
| μt | Turbulent viscosity |
| μ | Dynamic viscosity |
| υ | Kinematic viscosity |
| y | Distance near the wall |
| Pkb | Buoyant turbulence term |
| Pωb | Buoyant turbulence term |
| S′ | Strain rate |
| λv | Volume fraction of gas phase |
| u | Vector velocity of gas phase |
| Source term for evaporation and condensation | |
| RB | Cavitation bubble radius |
| pv | Saturated vapor pressure of liquid |
| p | Liquid pressure around the cavitation bubble |
| ρf | Liquid density |
| ρv | Vapor density |
| τ | Coefficient of the surface tension |
| F | Empirical correction coefficient |
| λnuc | Volume fraction in the nucleation center |
References
- Toshihiko, Y.; Shunta, W.; Masataka, I.; Satoshi, O. Development of processing technology using extremely high concentration cavitation energy by strong magnetic field. Results Mater. 2022, 14, 100289. [Google Scholar]
- Rae, J.; Ashokkumar, M.; Eulaerts, O.; Sonntag, C.V.; Grieser, F. Estimation of ultrasound induced cavitation bubble temperatures in aqueous solutions. Ultrason. Sonochem. 2005, 12, 325–329. [Google Scholar] [CrossRef]
- Sun, X.; Jia, X.; Liu, J.; Wang, G.; Zhao, S.; Ji, L.; Yoon, J.Y.; Chen, S. Investigation on the characteristics of an advanced rotational hydrodynamic cavitation reactor for water treatment. Sep. Purif. Technol. 2020, 251, 117252. [Google Scholar] [CrossRef]
- Hyunhee, L.; Gojaniardian, B.; Han, T.H. Dynamics of laser-induced bubble collapse visualized by time-resolved optical shadowgraph. J. Visual. 2011, 14, 331–337. [Google Scholar]
- Choi, J.W.; Choi, Y.D.; Kim, C.G. Flow uniformity in a multi-intake pump sump model. J. Mech. Sci. Technol. 2010, 24, 1389–1400. [Google Scholar] [CrossRef]
- Schouveiler, L.; Gal, P.L.; Chauve, M.P. Stability of a traveling roll system in a rotating disk flow. Phys. Fluids 1998, 10, 2695–2697. [Google Scholar] [CrossRef]
- Soong, C.Y.; Wu, C.C.; Liu, T.P.; Liu, T.P. Flow structure between two co-axial disks rotating independently. Exp. Therm. Fluid Sci. 2003, 27, 295–311. [Google Scholar] [CrossRef]
- Bilal, S.; Shah, I.A.; Akgül, A.; Tekin, M.T.; Botmart, T.; Yousef, E.S.; Yahia, I.S. A comprehensive mathematical structuring of magnetically effected Sutterby fluid flow immersed in dually stratified medium under boundary layer approximations over a linearly stretched surface. Alex. Eng. J. 2022, 61, 11889–11898. [Google Scholar] [CrossRef]
- Shah, I.A.; Bilal, S.; Akgül, A.; Tekin, M.T.; Botmart, T.; Zahran, H.Y.; Yahia, I.S. On analysis of magnetized viscous fluid flow in permeable channel with single wall carbon nano tubes dispersion by executing nano-layer approach. Alex. Eng. J. 2022, 61, 11737–11751. [Google Scholar] [CrossRef]
- Shah, I.A.; Bilal, S.; Akgül, A.; Omri, M.; Bouslimi, J.; Khan, N.Z. Significance of cold cylinder in heat control in power law fluid enclosed in isosceles triangular cavity generated by natural convection: A computational approach. Alex. Eng. J. 2022, 61, 7277–7290. [Google Scholar] [CrossRef]
- Shah, I.A.; Bilal, S.; Noeiaghdam, S.; Fernandez-Gamiz, U.; Shahzad, H. Thermosolutal natural convection energy transfer in magnetically influenced casson fluid flow in hexagonal enclosure with fillets. Results Eng. 2022, 15, 100584. [Google Scholar] [CrossRef]
- Pahlovy, S.A.; Mahmud, S.F.; Masamitsu, K.; Makoto, O.; Norio, T. New development of a gas cavitation model for evaluation of drag torque characteristics in disengaged wet clutches. SAE Int. J. Engines 2016, 9, 1910–1915. [Google Scholar] [CrossRef]
- Pahlovy, S.; Mahmud, S.F.; Kubota, M.; Ogawa, M.; Takakura, N. Multiphase drag modeling for prediction of the drag torque characteristics in disengaged wet clutches. SAE Int. J. Commer. Veh. 2016, 9, 441–447. [Google Scholar] [CrossRef]
- Pratomo, A.W.; Romadhon, R.R.; Muchammad. CFD analysis of artificial slippage and surface texturing in lubricated sliding contact considering cavitation. AIP Conf. Proc. 2017, 1788, 30–68. [Google Scholar]
- Thomas, N.; Elisabeth, B.; Dirk, B. Parameter study on the influence of a radial groove design on the drag torque of wet clutch discs in comparison with analytical models. Tribol. Int. 2018, 119, 809–821. [Google Scholar]
- Zheng, L.; Zhu, H.; Zhu, J.; Deng, Y. Effects of oil film thickness and viscosity on the performance of misaligned journal bearings with couple stress lubricants. Tribol. Int. 2020, 146, 106229. [Google Scholar] [CrossRef]
- Klingl, S.; Lecheler, S.; Pfitzner, M. Absolute and convective stability of flow between closely spaced co-rotating disks with imposed throughflow. Eur. J. Mech. B-Fluids 2022, 91, 226–232. [Google Scholar] [CrossRef]
- Yusvika, M.; Prabowo, A.R.; Baek, S.J.; Tjahjana, D.D.D.P. Achievements in observation and prediction of cavitation: Effect and damage on the ship propellers. Procedia Struct. Integr. 2020, 27, 109–116. [Google Scholar] [CrossRef]
- Matevž, D.; Tomaž, P.; Jure, Z.; Rok, P. High speed observation of damage created by a collapse of a single cavitation bubble. Wear 2019, 418, 13–23. [Google Scholar]
- Abreu, M.; Sundberg, J.; Elfsberg, J.; Jonsson, S. Morphology and mechanisms of cavitation damage on lamellar gray iron surfaces. Wear 2020, 456, 203324. [Google Scholar] [CrossRef]
- Long, X.P.; Xu, M.S.; Wang, J.; Zou, J.L.; Ji, B. An experimental study of cavitation damage on tissue of Carassius auratus in a jet fish pump. Ocean Eng. 2019, 174, 43–50. [Google Scholar] [CrossRef]
- Ohl, C.D.; Arora, M.; Dijkink, R.; Janve, V.; Lohse, D. Surface cleaning from laser-induced cavitation bubbles. Appl. Phys. Lett. 2006, 89, 074102. [Google Scholar] [CrossRef] [Green Version]
- Ji, J.; Wang, J.; Li, Y.; Yu, Y.; Xu, Z. Preparation of biodiesel with the help of ultrasonic and hydrodynamic cavitation. Ultrasonics 2006, 44, 411–414. [Google Scholar] [CrossRef] [PubMed]
- Miller, D.L.; Pislaru, S.V.; Greenleaf, J.F. Sonoporation: Mechanical DNA delivery by ultrasonic cavitation. Somat. Cell Mol. Genet. 2002, 27, 115–134. [Google Scholar] [CrossRef] [PubMed]
- Hidalgo, V.; Escaler, X. Implicit large eddy simulation of unsteady cloud cavitation around a plane-convex hydrofoil. J. Hydrodyn. Ser. B 2015, 27, 815–823. [Google Scholar] [CrossRef]
- Qureshi, Z.A.; Bilal, S.; Khan, U.; Akgül, A.; Sultana, M.; Botmart, T.; Zahran, H.Y.; Yahia, I.S. Mathematical analysis about influence of Lorentz force and interfacial nano layers on nanofluids flow through orthogonal porous surfaces with injection of SWCNTs. Alex. Eng. J. 2022, 61, 12925–12941. [Google Scholar] [CrossRef]
- Pahlovy, S.A.; Mahmud, S.F.; Kubota, M.; Ogawa, M.; Takakura, N. Prediction of Drag Torque in a Disengaged Wet Clutch of Automatic Transmission by Analytical Modeling. Tribol. Online 2016, 11, 121–129. [Google Scholar] [CrossRef] [Green Version]
- Kadivar, E.; Timoshevskiy, M.V.; Pervunin, K.S.; Moctar, O.E. Cavitation control using cylindrical cavitating-bubble generators (ccgs): Experiments on a benchmark cav2003 hydrofoil. Int. J. Multiph. Flow 2020, 125, 103186. [Google Scholar] [CrossRef]
- Boubendir, S.; Larbi, S.; Malki, M.; Bennacer, R. Hydrodynamic self-lubricating journal bearings analysis using Rabinowitsch fluid lubricant. Tribol. Int. 2019, 140, 105856. [Google Scholar] [CrossRef]
- Batchelor, G.K. Note on a class of solutions of the navier-stokes equations representing steady rotationally-symmetric flow. Q. J. Mech. Appl. Math. 1951, 1, 29–41. [Google Scholar] [CrossRef]
- Stewartson, K. On the flow between two rotating coaxial disks. Math. Proc. Camb. 1953, 49, 333–341. [Google Scholar] [CrossRef]
- Mizuki, K.; Ryo, T.; Shinya, S. A Study on In situ Observation of the Micro Flow of Lubricant on the Textured Surface. Procedia Eng. 2013, 68, 12–18. [Google Scholar]
- Labtan, T.; Uddin, M.S.; Chowdhury, M.A.K. Recent development on surface texturing in enhancing tribological performance of bearing sliders. Surf. Coat. Technol. 2015, 272, 102–120. [Google Scholar]
- Fan, M.; Shen, C.; Zhou, J. Statistical Analysis of Surface Texture Performance With Provisions With Uncertainty in Texture Dimensions. IEEE Access 2017, 5, 5388–5398. [Google Scholar]
- Slawomir, W.; Waldemar, K.; Pawel, P. Effects of surface texturing and kind of lubricant on the coefficient of friction at ambient and elevated temperatures. Tribol. Int. 2018, 117, 174–179. [Google Scholar]
- Welab, C.; Hna, B.; Peng, W. Investigation on the Tribological Performance of Micro-dimples Textured Surface Combined with Longitudinal or Transverse Vibration under Hydrodynamic Lubrication. Int. J. Mech. Sci. 2020, 174, 105474. [Google Scholar]
- Giorgi, M.G.D.; Bello, D.; Ficarella, A. An artifificial neural network approach to investigate cavitating flow regime at different temperatures. Measurement 2014, 47, 971–981. [Google Scholar] [CrossRef]
- Watanabe, T.; Oyama, T. Magneto hydrodynamic boundary layer flow over a rotating disk. Z. Angew. Math. Und Mech. 1991, 71, 522–524. [Google Scholar] [CrossRef]
- Tewartson, K.; Ng, T.W.; Brown, S.N. Viscous Centre Modes in the Stability of Swirling Poiseuille Flow. Philos. T. R. Soc. B 1988, 324, 473–512. [Google Scholar]
- Menter, F.R. Zonal two-equation k-ω turbulence models for aerodynamic flows. AIAA Paper 1993, 93, 1993–2006. [Google Scholar]
- Menter, F.R.; Kuntz, M.; Langtry, R. Ten years of industrial experience with the SST turbulence model. Heat Mass Transf. 2003, 4, 625–632. [Google Scholar]
- Jen, T.C.; Nemecek, D.J. Thermal analysis of a wet-disk clutch subjected to a constant energy engagement. Int. J. Heat Mass Transf. 2008, 51, 1757–1769. [Google Scholar] [CrossRef]
- Qian, P.; Pu, C.; Liu, L.; Li, X.; Zhang, B.; Gu, Z.; Meng, D. Development of a new high-precision friction test platform and experimental study of friction characteristics for pneumatic cylinders. Meas. Sci. Technol. 2022, 33, 065001. [Google Scholar] [CrossRef]
Figure 1.
Cavitation damage on propeller.

Figure 2.
Simplified model of friction pair.

Figure 3.
Schematic diagram of homogeneous model.

Figure 4.
Schematic diagram of friction pair structure.

Figure 5.
Schematic diagram of oil film with hemisphere texture.

Figure 6.
Boundary conditions of the flow field.

Figure 7.
Cavitation volume fraction at various texture rates.

Figure 8.
Development of cavitation when texture rate is 3.205%.

Figure 9.
Development of cavitation when texture rate is 6.41%.

Figure 10.
Development of cavitation when texture rate is 12.917%.

Figure 11.
Vector diagram of local velocity of oil film ((a1) is velocity vectors of oil when t = 0.003 s; (a2) is velocity vectors of oil when t = 0.01 s; (a3) is velocity vectors of oil when t = 0.1 s; (b1) is velocity vectors of gas when t = 0.003 s; (b2) is velocity vectors of gas when t = 0.01 s; (b3) is velocity vectors of gas when t = 0.1 s).

Figure 12.
Velocity vector diagram of oil flow overlaid by the contours of oil volume fraction ((a1) is velocity vectors of oil when t = 0.003 s; (a2) is velocity vectors of oil when t = 0.01 s; (a3) is velocity vectors of oil when t = 0.1 s; (b1) is velocity vectors of gas when t = 0.003 s; (b2) is velocity vectors of gas when t = 0.01 s; (b3) is velocity vectors of gas when t = 0.1 s).

Figure 13.
Pressure contour of oil film.

Figure 14.
Radial pressure distribution of oil films.

Figure 15.
Pressure distribution at different times in a single hemispheric texture dimple.

Figure 16.
Mass transfer countors of gas at different times in a single hemispheric dimple.

Figure 17.
Mass transfer curves of gas at different times in a single hemispheric dimple.

Figure 18.
Surface texture of separator disk.

Figure 19.
Transparent test platform (1 = high-speed camera; 2 = lens; 3 = computer; 4 = fill light; 5 = host; 6 = motor; 7 = data collection unit; 8 = magnet powder brake; 9 = torque sensor; 10 = coupling; 11 = base).
Figure 19.
Transparent test platform (1 = high-speed camera; 2 = lens; 3 = computer; 4 = fill light; 5 = host; 6 = motor; 7 = data collection unit; 8 = magnet powder brake; 9 = torque sensor; 10 = coupling; 11 = base).

Figure 20.
Cavitation morphology of oil film without texture.

Figure 21.
Cavitation morphology of textured oil film.

Figure 22.
Growth and collapse of cavitation bubbles (direction: clockwise).

Figure 23.
Shedding and regeneration of cavitation bubbles (direction: clockwise).

Figure 24.
Shrinkage of oil film at 1050 rpm ((a–d) are cavitation morphologies changes with time).


Table 1.
Parameters of working medium.
| Parameter | Oil | Vapor |
|---|---|---|
| Density (kg/m3) | 865 | 0.023 |
| Specific heat capacity (J/kg·K−1) | 2093.5 | 1911.6 |
| Coefficient of heat conduction (m·K) | 0.12 | 0.0185 |
| Dynamic viscosity (Pa·s) | interpolation function | 9.86 × 10⁻⁶ |
| Saturated vapor pressure (Pa) | 1000 | 1000 |
Table 2.
Independence test of structural grids.
| Scheme | Radial Layer | Circumferential Layer | Number of O-Grid LAYERS | Number of Grids | λυ | |
|---|---|---|---|---|---|---|
| Texture Area | Non-Texture Area | |||||
| 1 | 142 | 77 | 124 | 6 | 391,840 | 0.000467 |
| 2 | 142 | 77 | 124 | 7 | 438,463 | 0.0005012 |
| 3 | 210 | 121 | 124 | 11 | 988,637 | 0.0006212 |
| 4 | 210 | 121 | 160 | 11 | 1,607,374 | 0.0006417 |
| 5 | 210 | 165 | 160 | 15 | 2,017,702 | 0.0006419 |
Publisher’s Note: MDPI stays neutral with regard to jurisdictional claims in published maps and institutional affiliations. |
© 2022 by the authors. Licensee MDPI, Basel, Switzerland. This article is an open access article distributed under the terms and conditions of the Creative Commons Attribution (CC BY) license (https://creativecommons.org/licenses/by/4.0/).
Share and Cite
MDPI and ACS Style
Sun, J.; Chen, L.; Zhang, B.; Huang, H.; Qian, P. Cavitation Morphology Study between Hemispherical Textured Rotating Friction Pairs. Lubricants 2022, 10, 249. https://doi.org/10.3390/lubricants10100249
AMA Style
Sun J, Chen L, Zhang B, Huang H, Qian P. Cavitation Morphology Study between Hemispherical Textured Rotating Friction Pairs. Lubricants. 2022; 10(10):249. https://doi.org/10.3390/lubricants10100249
Chicago/Turabian StyleSun, Junyu, Liyu Chen, Bing Zhang, Hua Huang, and Pengfei Qian. 2022. "Cavitation Morphology Study between Hemispherical Textured Rotating Friction Pairs" Lubricants 10, no. 10: 249. https://doi.org/10.3390/lubricants10100249
Note that from the first issue of 2016, this journal uses article numbers instead of page numbers. See further details here.