Article

Optimization of Air Conditioning Performance with Al2O3-SiO2/PAG Composite Nanolubricants Using the Response Surface Method

by
Nurul Nadia Mohd Zawawi
1,
Wan Hamzah Azmi
1,2,*,
Abd Aziz Mohamad Redhwan
3,
Anwar Ilmar Ramadhan
4 and
Hafiz Muhammad Ali
5,6
1
Centre for Research in Advanced Fluid and Processes, Lebuhraya Tun Razak, Gambang, Kuantan 26300, Pahang, Malaysia
2
Faculty of Mechanical and Automotive Engineering Technology, Universiti Malaysia Pahang, Pekan 26600, Pahang, Malaysia
3
Faculty of Manufacturing Engineering Technology, TATI University College (TATIUC), Kemaman 24000, Terengganu, Malaysia
4
Department of Mechanical Engineering, Faculty of Engineering, Universitas Muhammadiyah Jakarta, Jl. Cempaka Putih Tengah No 27, Jakarta 10510, Indonesia
5
Mechanical Engineering Department, King Fahd University of Petroleum and Minerals, Dhahran 31261, Saudi Arabia
6
Interdisciplinary Research Center for Renewable Energy and Power Systems (IRC-REPS), King Fahd University of Petroleum and Minerals, Dhahran 31261, Saudi Arabia
*
Author to whom correspondence should be addressed.
Lubricants 2022, 10(10), 243; https://doi.org/10.3390/lubricants10100243
Submission received: 18 August 2022 / Revised: 16 September 2022 / Accepted: 22 September 2022 / Published: 29 September 2022

Abstract

:
A variety of operational parameters can influence the operation of an automobile air-conditioning (AAC) system. This issue is solved by using optimization techniques that can recommend the ideal parameters for the best results. To improve the performance of AAC system usings Al2O3-SiO2/PAG composite nanolubricants, the response surface method (RSM) was employed. RSM was used to design the experimental work, which was based on a face composite design (FCD). The RSM quadratic models were helpful in determining the links between the input parameters and the responses. The addition of composite nanolubricants improved the overall performance of AAC systems. The parameters were optimized using the RSM’s desirability approach, with the goal of increasing cooling capacity and the coefficient of performance (COP), while reducing compressor work and power consumption. The ideal parameters for the AAC system were found to be 900 rpm compressor speed, 155 g refrigerant charge, and 0.019% volume concentration, with a high desirability of 81.60%. Test runs based on the optimum circumstances level were used to estimate and validate cooling capacity, compressor work, COP, and power consumption. Both predicted and measured values were in good agreement with each other. A new RSM model was successfully developed to predict the optimal conditions for AAC system performance.

1. Introduction

Optimization approaches using various methods are useful in determining the optimum parameters to achieve the desired performance. The investigation of the refrigeration system is time-consuming and costly when all experiments must be conducted. Thus, an optimization approach on refrigeration system parameters to find the optimum performance should be evaluated. The most commonly used methods for optimization are the RSM [1,2], Taguchi method [3,4], artificial neutral network (ANN) [5], multi-response optimization method [6], and regression analysis. Recently, improving and optimizing refrigeration system performance using software networks or modeling has begun receiving increasing attention from researchers [7,8]. This is plausible due to improved computer technology, as well as the accessibility of simulation software. RSM is a mathematical and statistical method for improving, enhancing, and optimizing independent parameters in a set of experiments, as well as their interactions with response variables, in a process that allows it to enhance and optimize development [9,10]. RSM is devoted to estimating interactions and quadratic effects, and it is a solution to the multi-variable statistical method problem, providing an idea of the response surface local shape [11]. Likewise, RSM can aid in the quantitative and routine modification of elements that influence the AAC system’s performance. The RSM has an advantage over the complete factorial approach in that it requires fewer tests to construct the experiment and less time to answer the objective problem. Therefore, computing resources are reduced.
Many studies have used the RSM optimization approach to determine the optimum working conditions. The surface roughness of EN31 steel was analyzed by Abhang and Hameedullah [12] using RSM. The feed rate, followed by the cutting speed and depth of the cut, had the greatest impact on surface roughness. During the turning process, RSM was utilized by Makadia and Nanavati [13] to generate a mathematical model for surface roughness. The feed rate had the largest impact on surface roughness, followed by the tool nose radius. The electrical discharge machining (EDM) process was modeled and optimized using RSM [14]. They discovered that RSM could be employed in most optimization-related tasks, and the advantage of RSM-based response parameter analysis was that each working parameter’s effect on the value of the resultant response parameter could be explained individually. Table 1 provides a list of previous studies using a range of optimization approaches in various applications.
Software solutions for optimization techniques have been used to optimize the properties of nanolubricants [32,33,34], vapor compression refrigeration systems (VCRS) [26,35,36,37,38,39], and AAC systems [40]. Artificial intelligence approaches for modeling and optimizing refrigeration systems were evaluated by Ahmed et al. [8]. They discovered that the COP is the most important cost function to optimize, followed by overall cost, energy consumption, and cooling capacity, according to trend analysis. To date, there are previous studies available which employ RSM approaches in order to optimize refrigeration [7,26,30] and AAC system performance [41]. Costa and Garcia [7] optimized the parameters of the refrigeration system using RSM. Parameters such as the temperature and flow rate of evaporators and condensers were considered. The behavior of R450A in VCRS was investigated by Zendehboudi et al. [26] using modeling and multi-objective optimization. They used RSM’s central composite design (CCD) to calculate the impact of each variable, model the system, and develop cost functions. The compressor’s power consumption was lowered by 18.39%, the discharge temperature was increased by 53.31%, and the refrigerant mass flow rate was increased by 215.57%. Huirem and Sahoo [30] used a combined Box–Behnken statistical design (BBD) and RSM technique to maximize the COP, exergetic COP (ECOP), and total exergy destruction (TED) of a LiBr-H2O vapor absorption refrigeration system.
A concept of using two or more metal oxide nanoparticles in existing lubricants—known as composite nanolubricants—is adapted due to the limited contribution of single nanolubricants in terms of the stability, compressor operations, wear rates, and performance of AAC system. Nanofluids/nanolubricants have distinct thermal physical and tribological properties, as well as performance, compared to base fluids, according to several investigations [42,43,44,45]. Previous studies on the thermal physical and tribological properties, along with the performance and optimization of AAC using PAG based single-component nanolubricants with SiO2, Al2O3, and TiO2 metal oxides, are available in the literature [46,47,48,49,50]. Zawawi et al. [51] examined the thermal conductivity of single Al2O3, SiO2, and metal oxide composite nanolubricants. Based on the comparison, metal oxide composite nanolubricants have a substantially higher thermal conductivity than single nanolubricants. Additionally, few studies investigated the performance of single nanolubricants and composite nanolubricants in refrigeration and AAC systems [41,52,53]. Sharif et al. [53] examined the performance of the AAC system employing SiO2/PAG nanolubricants. They discovered a maximal COP enhancement of up to 24%. In another study, Redhwan et al. [41] claimed that COP and cooling capacity were improved by up to 31% and 32%, respectively, in another experiment. Meanwhile, Zawawi et al. [54] found that Al2O3-SiO2/PAG composite nanolubricants showed greater COP and cooling capacity increases than single nanolubricants, with values of 28.10% and 65.21%, respectively, at 0.015% volume concentration. For the optimization of nanolubricants, Redhwan et al. [24] used the RSM approach to study the AAC system performance using single-component Al2O3 nanolubricants in a PAG based nanolubricant in AAC systems. They found that the compressor speed, initial refrigerant charge, and nanolubricant volume concentration all have a significant impact on the AAC system’s efficiency. The literature on the use of composite nanolubricants to improve the performance of AAC systems is scarce [55]. Despite this, no further research into the performance improvement of AAC systems using composite nanolubricants by employing RSM has been done in recent years.
Previous studies have reported on the impact of single-component nanolubricants on refrigeration and AAC system performance; however, more research into the effects of AAC system parameters operating with Al2O3-SiO2/PAG using RSM is still essential. Therefore, in this study, the effects of operational parameters on COP, cooling capacity, compressor work (Win), and power consumption for Al2O3-SiO2/PAG nanolubricants in AAC systems were explored using RSM. The current study makes use of Design–Expert software, and the experiments are designed employing the FCD procedure. For maximum augmentation in COP and cooling capacity, as well as maximum decrease in Win and power consumption, optimal operating settings, such as speed, initial refrigerant charge, and composite nanolubricants volume concentration, were determined.

2. Materials and Methods

2.1. Preparation of Al2O3-SiO2 Composite Nanolubricants

In this investigation, Al2O3 and SiO2 nanoparticles in dry powder form, as well as polyalkylene glycol (PAG) 46, were employed. Table 2 lists the features of these nanoparticles [46,56], and Table 3 illustrates the characteristics of PAG 46 lubricant at atmospheric pressure [57]. To confirm the existence of the nanoparticles, a chemical composition test was performed. The chemical composition of both nanoparticles was assessed by EDX analysis, as shown in Figure 1. In Figure 1a,b, the elemental composition of the materials for Al2O3 and SiO2 nanoparticles, respectively, was validated. TEM evaluation was carried out for the composite nanolubricant to observe the colloidal nanoparticle dispersion in nanolubricants. Figure 2 shows TEM imaging of the Al2O3-SiO2/PAG composite nanolubricants. Both nanoparticles were discovered to be spherical. In addition, the graph demonstrates the presence of two groups of nanoparticles with various diameters. Al2O3 nanoparticles are represented by the smaller diameter particles, while SiO2 nanoparticles are represented by the larger diameter particles. The appearance of nanoparticles in grayscale shades may be caused by overlap particles and small aggregation. The formulation and characterization of composite nanolubricants was previously addressed in the literature. Therefore, this study focused on the preparation and formulation procedures for composite nanolubricants.
In this study, the Al2O3-SiO2/PAG composite nanolubricants were made utilizing a two-step procedure, and their stability was then investigated using UV-Vis and zeta potential. Zawawi et al. [51] found that the best combination for both nanolubricants used is a composition ratio of 60:40. The Al2O3-SiO2/PAG composite nanolubricants in a 60:40 ratio, according to the authors, produces better thermal characteristics [58], tribological behavior [59], and AAC system performance [54] compared to other combination ratios. Therefore, the optimum ratio for Al2O3-SiO2/PAG composite nanolubricants is chosen for the current work as a continuation of the prior work. The nanolubricants of Al2O3/PAG and SiO2/PAG were first prepared separately. A total volume of 63 mL of Al2O3/PAG nanolubricants was then mixed with 42 mL SiO2/PAG using a magnetic stirrer. The desired volume concentrations used in this study are 0.005% up to 0.045%. Equation (1) is used to compute the volume concentration of the composite nanolubricants.
ϕ = m p / ρ p m p / ρ p + m L / ρ L × 100
where ϕ is the volume concentration of nanolubricants (%), m p is the nanoparticle mass (g), ρ p is the nanoparticle density (kg/m3), m L   is the lubricant mass (g), and ρ p is the lubricant density (kg/m3). The prepared composite nanolubricants were then sonicated in an ultrasonic bath for 2 h for a uniform dispersion and stable suspension, based on previous works [51,55,58,60,61,62], and shown in the Figure 3. The absorbance ratio of the mixed nanolubricant dispersions, measured at various sonication durations (0 to 2.0 h) up to 700 h, is shown in Figure 3. The graph is used to determine the ideal sonication duration required to preserve the stability of Al2O3-SiO2/PAG composite nanolubricants. With the most stable composite nanolubricants, the absorbance ratio with the highest value indicates the ideal sonication time. According to the graph, two hours of sonication sustained the concentration ratio beyond 90%, even after up to 700 h of sedimentation.
The zeta potential and zeta sizer were used in the study to analyze the zeta potential reading and polydispersity index (PDI) of the composite nanolubricants. The current absolute zeta potential reading for the Al2O3-SiO2/PAG is up to 61.1 mV. The zeta potential for Al2O3-SiO2/PAG was found to be beyond the stable limit, thus proving an excellent stability. The current absolute zeta potential reading for the Al2O3-SiO2/PAG is up to 61.1 mV, whereas other combination of metal oxides, i.e., Al2O3-TiO2/PAG and TiO2-SiO2/PAG composite nanolubricants, which were studied prior to this work [51], recorded up to 31.7 mV and 22.7 mV, respectively. Previously, Redhwan et al. [41] reported that the zeta potential for Al2O3/PAG single nanolubricants was 37.8 mV. When compared to single-component nanolubricants, the Al2O3-SiO2/PAG composite nanolubricants employed in this study showed improved stability. The present results were compared to the stability classification suggested by Lee et al. [63], as shown in Figure 4. The zeta potential for Al2O3-SiO2/PAG was found to be beyond the stable limit, thus proving an excellent stability. The breadth or spread of the particle size distribution is described by the PDI, which is another crucial metric [64]. The maximum PDI value was found to be 0.86 for the Al2O3-TiO2/PAG composite nanolubricants, while the lowest PDI value was found to be 0.22 for the Al2O3-SiO2/PAG, as can be seen in Figure 4. In light of this, it should be observed that the lowest PDI value is quite comparable to that of the monodisperse state. A suspension will be monodisperse, according to Sadeghi et al. [65], if the PDI value is less than 0.3, and the size distribution curve has a single peak.

2.2. Design of Experiment with RSM

The initial step in RSM is to confirm a range with the optimal condition. Secondly, the relationship model between response and the group of independent factors must be established. The last stage is to optimize the process with the model. A selection of elements in RSM study included batch tests on AAC performance with parameters of composite nanolubricants including volume concentrations, compressor speeds, and refrigerant charges. Meanwhile, cooling capacity, compressor work, COP, and power consumption were selected for the output responses of the experiment. The RSM is used to optimize all AAC system performance responses simultaneously by incorporating them into a single objective function. The objective of RSM in the current study is to examine the effect of the compressor speed, initial refrigerant charge, and volume concentration of composite nanolubricants on the AAC system performance.
The CCD was used to optimize the model, and it worked well for fitting a quadratic surface and for process optimization in general. In this study, FCD is used because there is a common area of interest and operability, and the trials are based on the design matrix. Each parameter includes three levels of variation: (i) high (+1), (ii) low (−1), and (iii) center points (coded as level 0). Six central points, six axial points, and eight factorial points were used in this study, with alpha α = 1 . The α value is denoted as the distance between each axial point and the CCD’s center [24]. Multi-objective responses of AAC performance optimization of optimum design, with the highest desirability, are sought. Three AAC system parameters, with their levels according to RSM analysis, were investigated. Twenty experimental runs, including six replicates at the center point, were used in an FCD with three factors and three levels. The factor levels of the independent variables for AAC system performance were previously shown in Table 4. Table 5 illustrates the complete design matrix for the experiments to be conducted, as well as the collected findings, which were analysed using analysis of variance (ANOVA) by Design–Expert Software (V13, Stat-Ease Inc., Minneapolis, MN, USA).

2.3. Data Analysis Using RSM

The model’s adequacy is further determined using ANOVA. The significance of each term in the model equation is used to calculate the goodness of fit in each case. The data is subjected to regression analysis to obtain the coefficient of the regression equation. Three-dimensional surface plots are then generated from the validated models. The normal plot of the residuals, predicted against the actual plots for all responses, were presented to ensure that the chosen model was suitable for predicting the response variables in the experimental values. Good agreement of both values is important for verification of the model [25]. The distribution of the close points along the straight lines indicates a good agreement between the test values and the calculated response values [22]. The normal probability is plotted to check for the residual range. Response surface plots as a function of two independent variables or factors, with the other parameters held constant, are useful tools for evaluating the interaction and correlation of the variables, as well as comprehending the main and interactive effects [66,67]. These surface plots are used to locate the optimum points of operating parameters to attain maximum performance of the AAC system. The desirability technique of RSM can ultimately be used to find the best combination of speed, refrigerant charge, and volume concentration of composite nanolubricants.

3. Results and Discussion

3.1. ANOVA Analysis

A summary of p-value and model statistics for cooling capacity are shown in Table 6. The CCD module suggested that a linear and 2FI model to be use for analysis. In order to analyse the cooling capability, linear and two-way interaction (2FI) models were both employed. The model has been improved by the addition of linear and interaction components, as shown by the low p-value (Prob > F). The quadratic model is not suggested for this case. The Qubic model was noted as aliased because of the existence of aliased terms. The Qubic model was not suggested, due to the insufficient running of experiments to independently estimate all the terms. Table 7 shows ANOVA analysis for cooling capacity. The model F value is noted at 25.16. This indicates that the proposed model is significant. A 95% significant level was used throughout all response analyses. Model terms with p-values less than 0.05 are considered as significant. The model terms are not significant if the value is larger than 0.10. All terms except AC, which is the combination of volume concentration and refrigerant charge, were significant. The fitness of model equation is validated by referring to the coefficient of regression R2. R2 = 92.07% for cooling capacity, demonstrating that the model could accurately predict the response. The closer the R2 value to 1, the better the models fits the experimental data [68]. Pred R2 of 0.3576 showed a great difference to the adj R2 of 0.8841. Thus, model reduction was suggested. The signal-to-noise ratio is measured by Adeq precision, and a ratio greater than 4 is desired [22]. The signal was adequate in this case, with a ratio of 21.986.
Table 8 represents p-value and model summary statistics for compressor work. The CCD module suggested that a quadratic model be use for analysis. The Qubic model was not suggested for this case. The ANOVA analysis for compressor work was recorded in Table 9. The model F value = 536.88 implicated that the model was significant. All terms were significant. The fitness of the model equation is validated by referring to the coefficient of regression R2. For compressor work, with an R2 of 99.79%, the model was able to accurately predict the response. The Pred R2 of 0.9852 was in reasonable agreement with the adj R2 of 0.9961. An adequate signal was confirmed by the Adeq precision of 84.751.
Table 10 represents p-value and model summary statistics for COP. The CCD module suggested that a quadratic model be use for analysis. The Qubic model was not suggested for this case. The ANOVA analysis for COP was recorded in Table 11. The model F value = 4604.92 implicated that the model was significant. Only the combination of A (volume concentration), B (compressor speed), C (refrigerant charge), and between the AB, BC, A2 and B2 terms, were considered significant. Thus, all insignificant terms were eliminated. R2 = 99.98% for COP, indicating that the model was capable of accurately predicting the response. The adj R2 of 0.9974 and the Pred R2 of 0.9995 were in reasonable agreement. A signal with a precision of 225.476 was considered adequate.
The summary of p-value and model statistics for power consumption are shown in Table 12. The CCD module suggested that a linear and quadratic model be used for analysis. Due to their superior accuracy over linear models, quadratic models were chosen. The Qubic model was noted as aliased and was not suggested due to insufficient running experiments to independently estimate all the terms. Table 13 shows the ANOVA analysis for power consumption. The F value for the model is 151.49, implying that the model is adequate. A 95% significant level was used throughout all response analyses. Model terms with p-values less than 0.05 are considered significant. All values greater than 0.10, on the other hand, imply that the model terms are not significant. In this case A, B, C, BC, and A2 are significant model terms. The fitness of the model equation is validated by referring to the coefficient of regression R2. The model was able to predict the reaction with a high accuracy for power consumption, with R2 = 99.27%. Pred R2 of 0.9862 showed a great difference compared to the Adj R2 of 0.9181. Thus, model reduction was suggested. Adeq presicion was noted at 41.908, which indicated an adequate signal model.

3.2. Regression Analysis

Regression analysis was used to fit the supplied RSM response to a quadratic equation, to analyse the link between the inputs and outputs of the models, and to determine the ideal input parameters [25]. All insignificant terms are deleted to reduce the regression model. For cooling capacity, only A, B, C, and AB are chosen as significant model terms. Meanwhile, for compressor work, all terms are significant model terms. Significant model terms A, B, C, AB, BC, A2, and B2 were selected for COP, and A, B, C, BC, and A2 were chosen for power consumption. The difference between Pred R2 and the Adj R2 of less than 0.2 was desired [24]. The final equation in terms of coded factors can be completed after removing insignificant terms, as shown in Equations (2)–(5) as follows:
Cooling capacity = 0.84 − 0.11 A + 0.11 B + 0.20 C − 0.087 AB
Compressor   work = 31.13 + 0.89 A + 7.66 B     3.00 C + 0.50 AB     0.35 AC     0.95 BC + 1.73 A 2 + 1.73 A 2   1.69 B 2     1.52 C 2
COP = 5.87     0.21 A     1.83 B + 0.38 C + 0.036 AB     0.13 BC     0.051 A 2 + 0.77 B 2
Power   consumption = 0.84     ( 9.041   ×   10 0.03 ) A + 0.28 B + 0.10 C + 0.052 BC + 0.096 A 2
where A is the volume concentration of the composite nanolubricants (%), B is the speed (rpm), and C is the refrigerant charge (g).

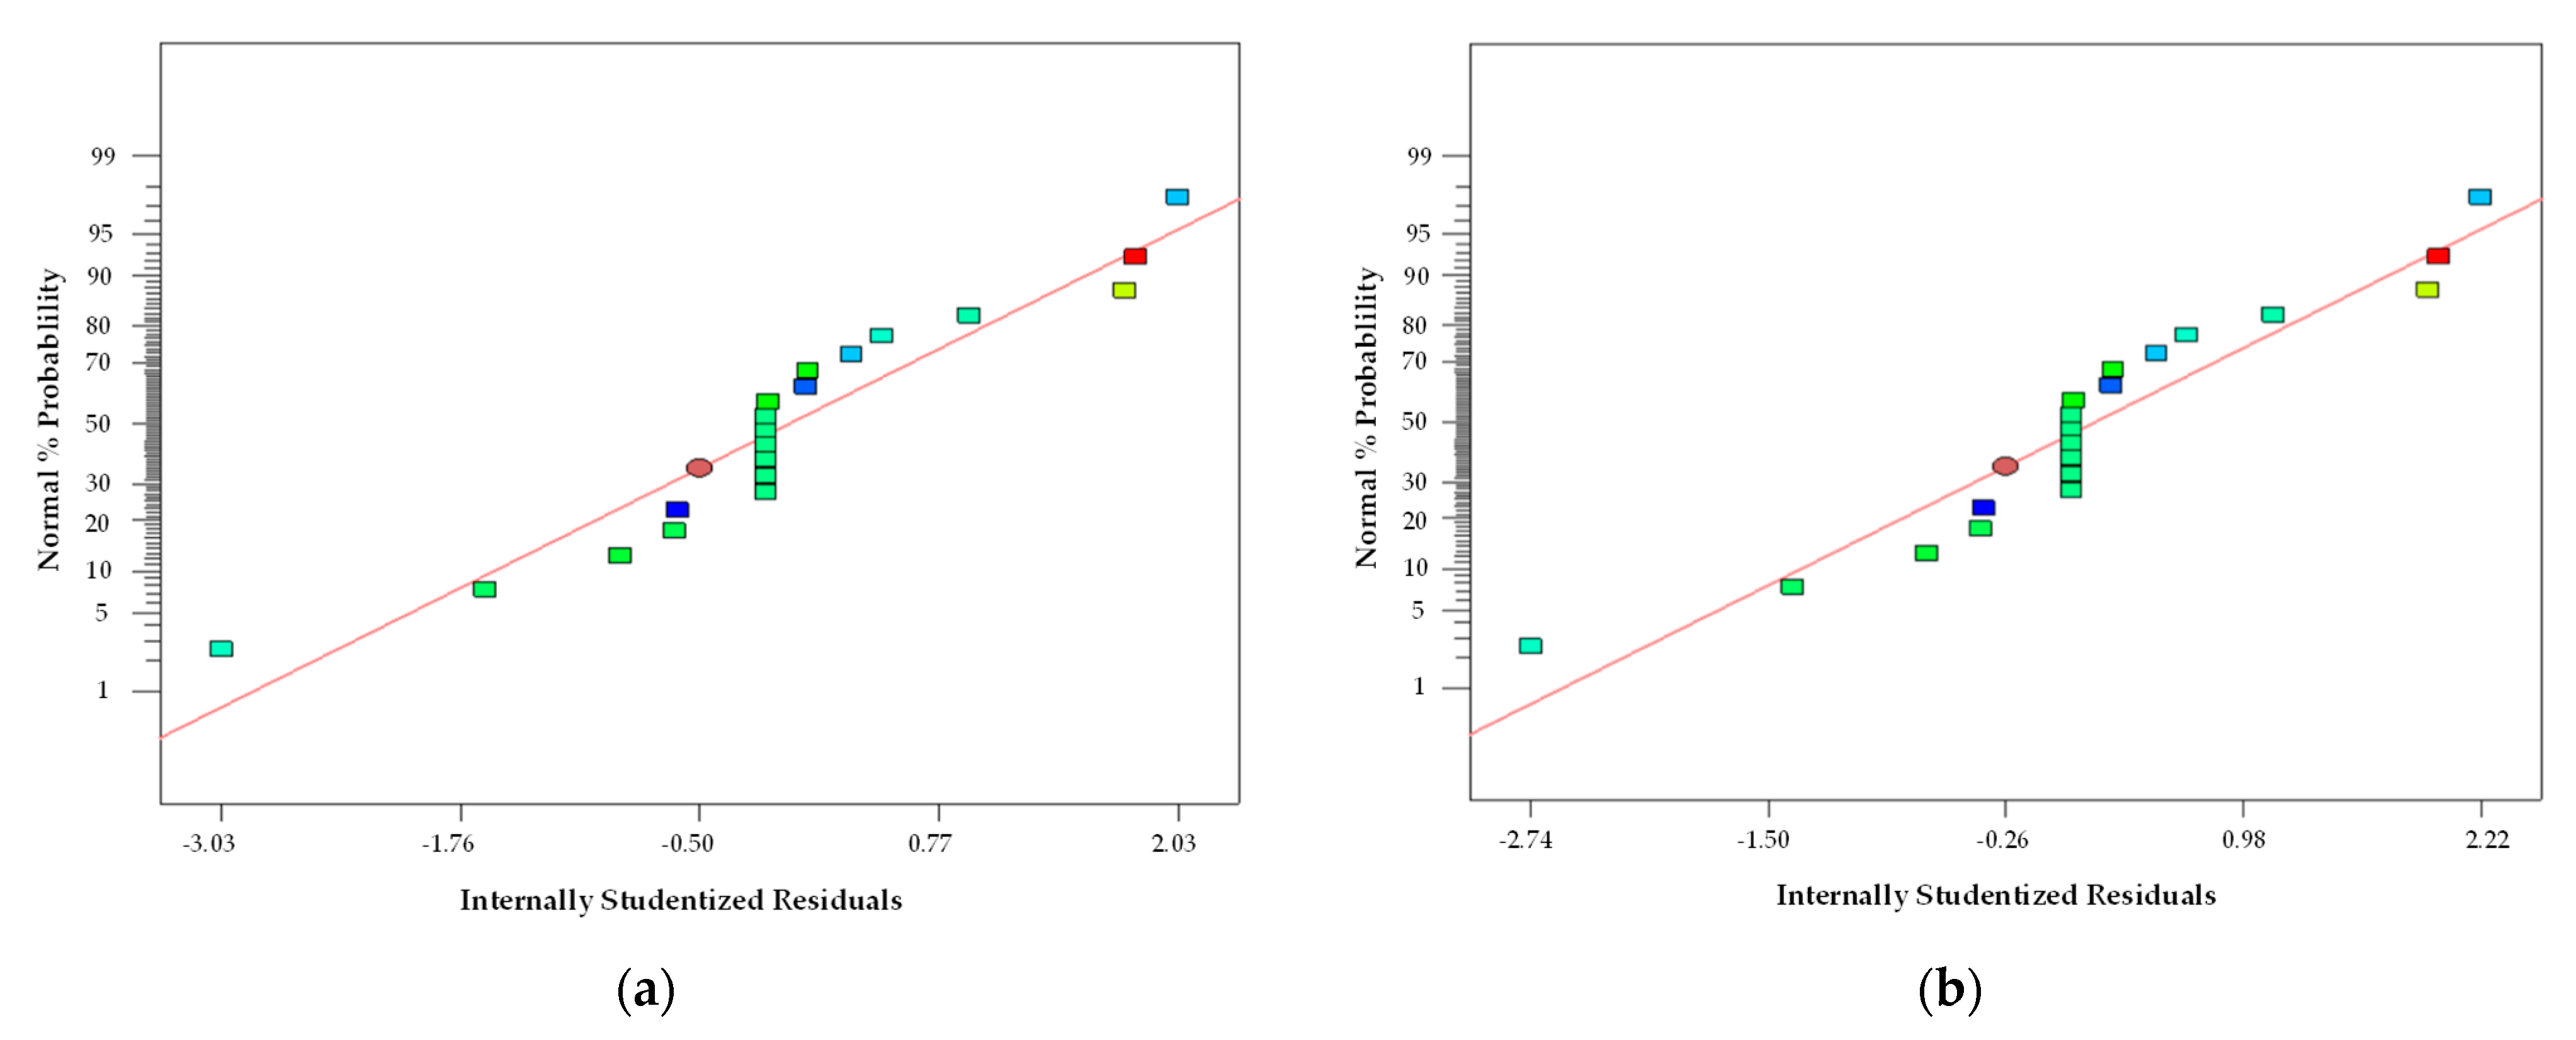
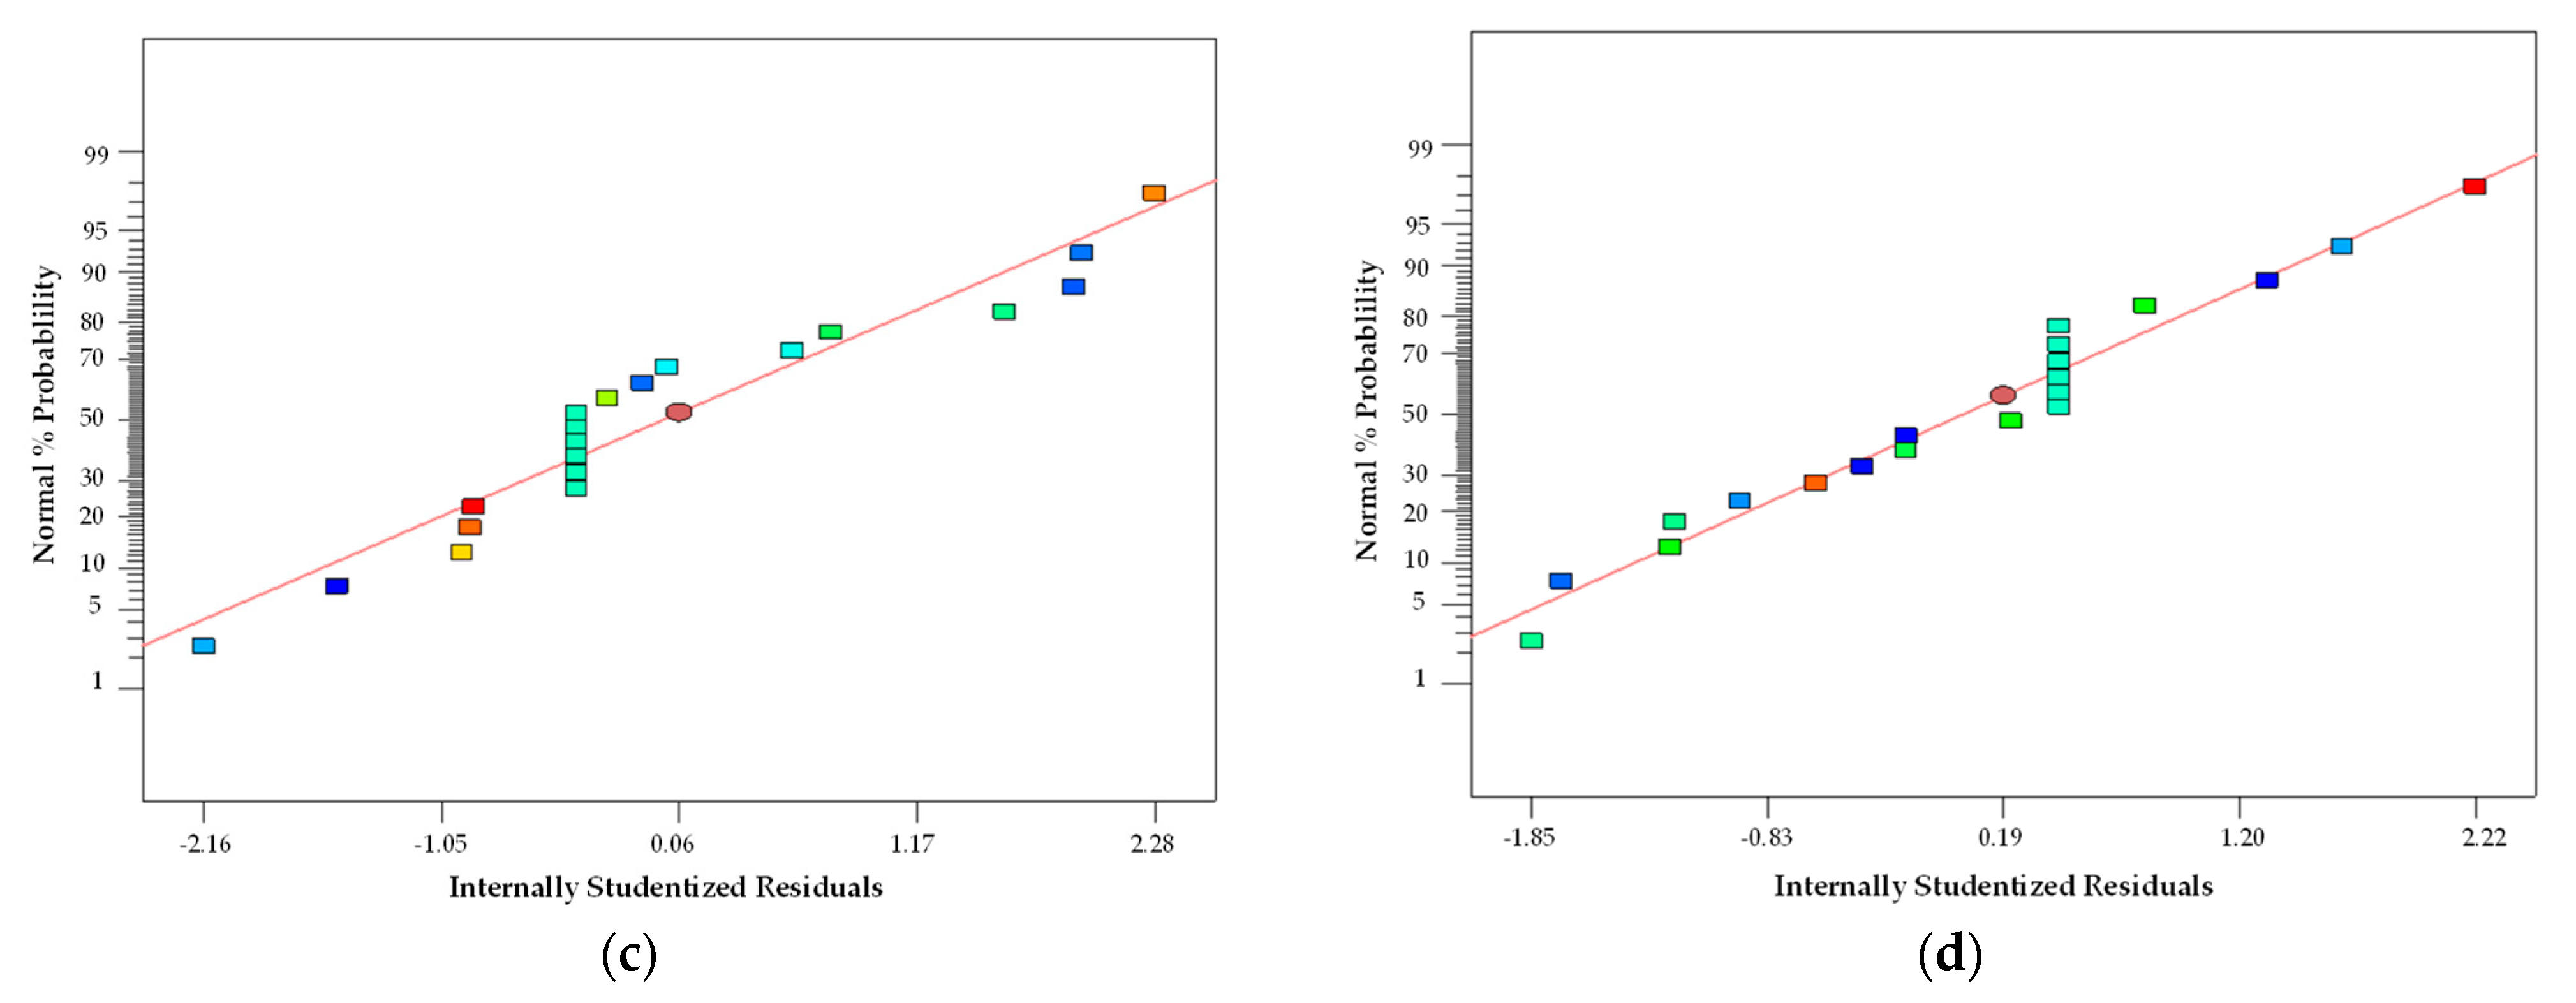
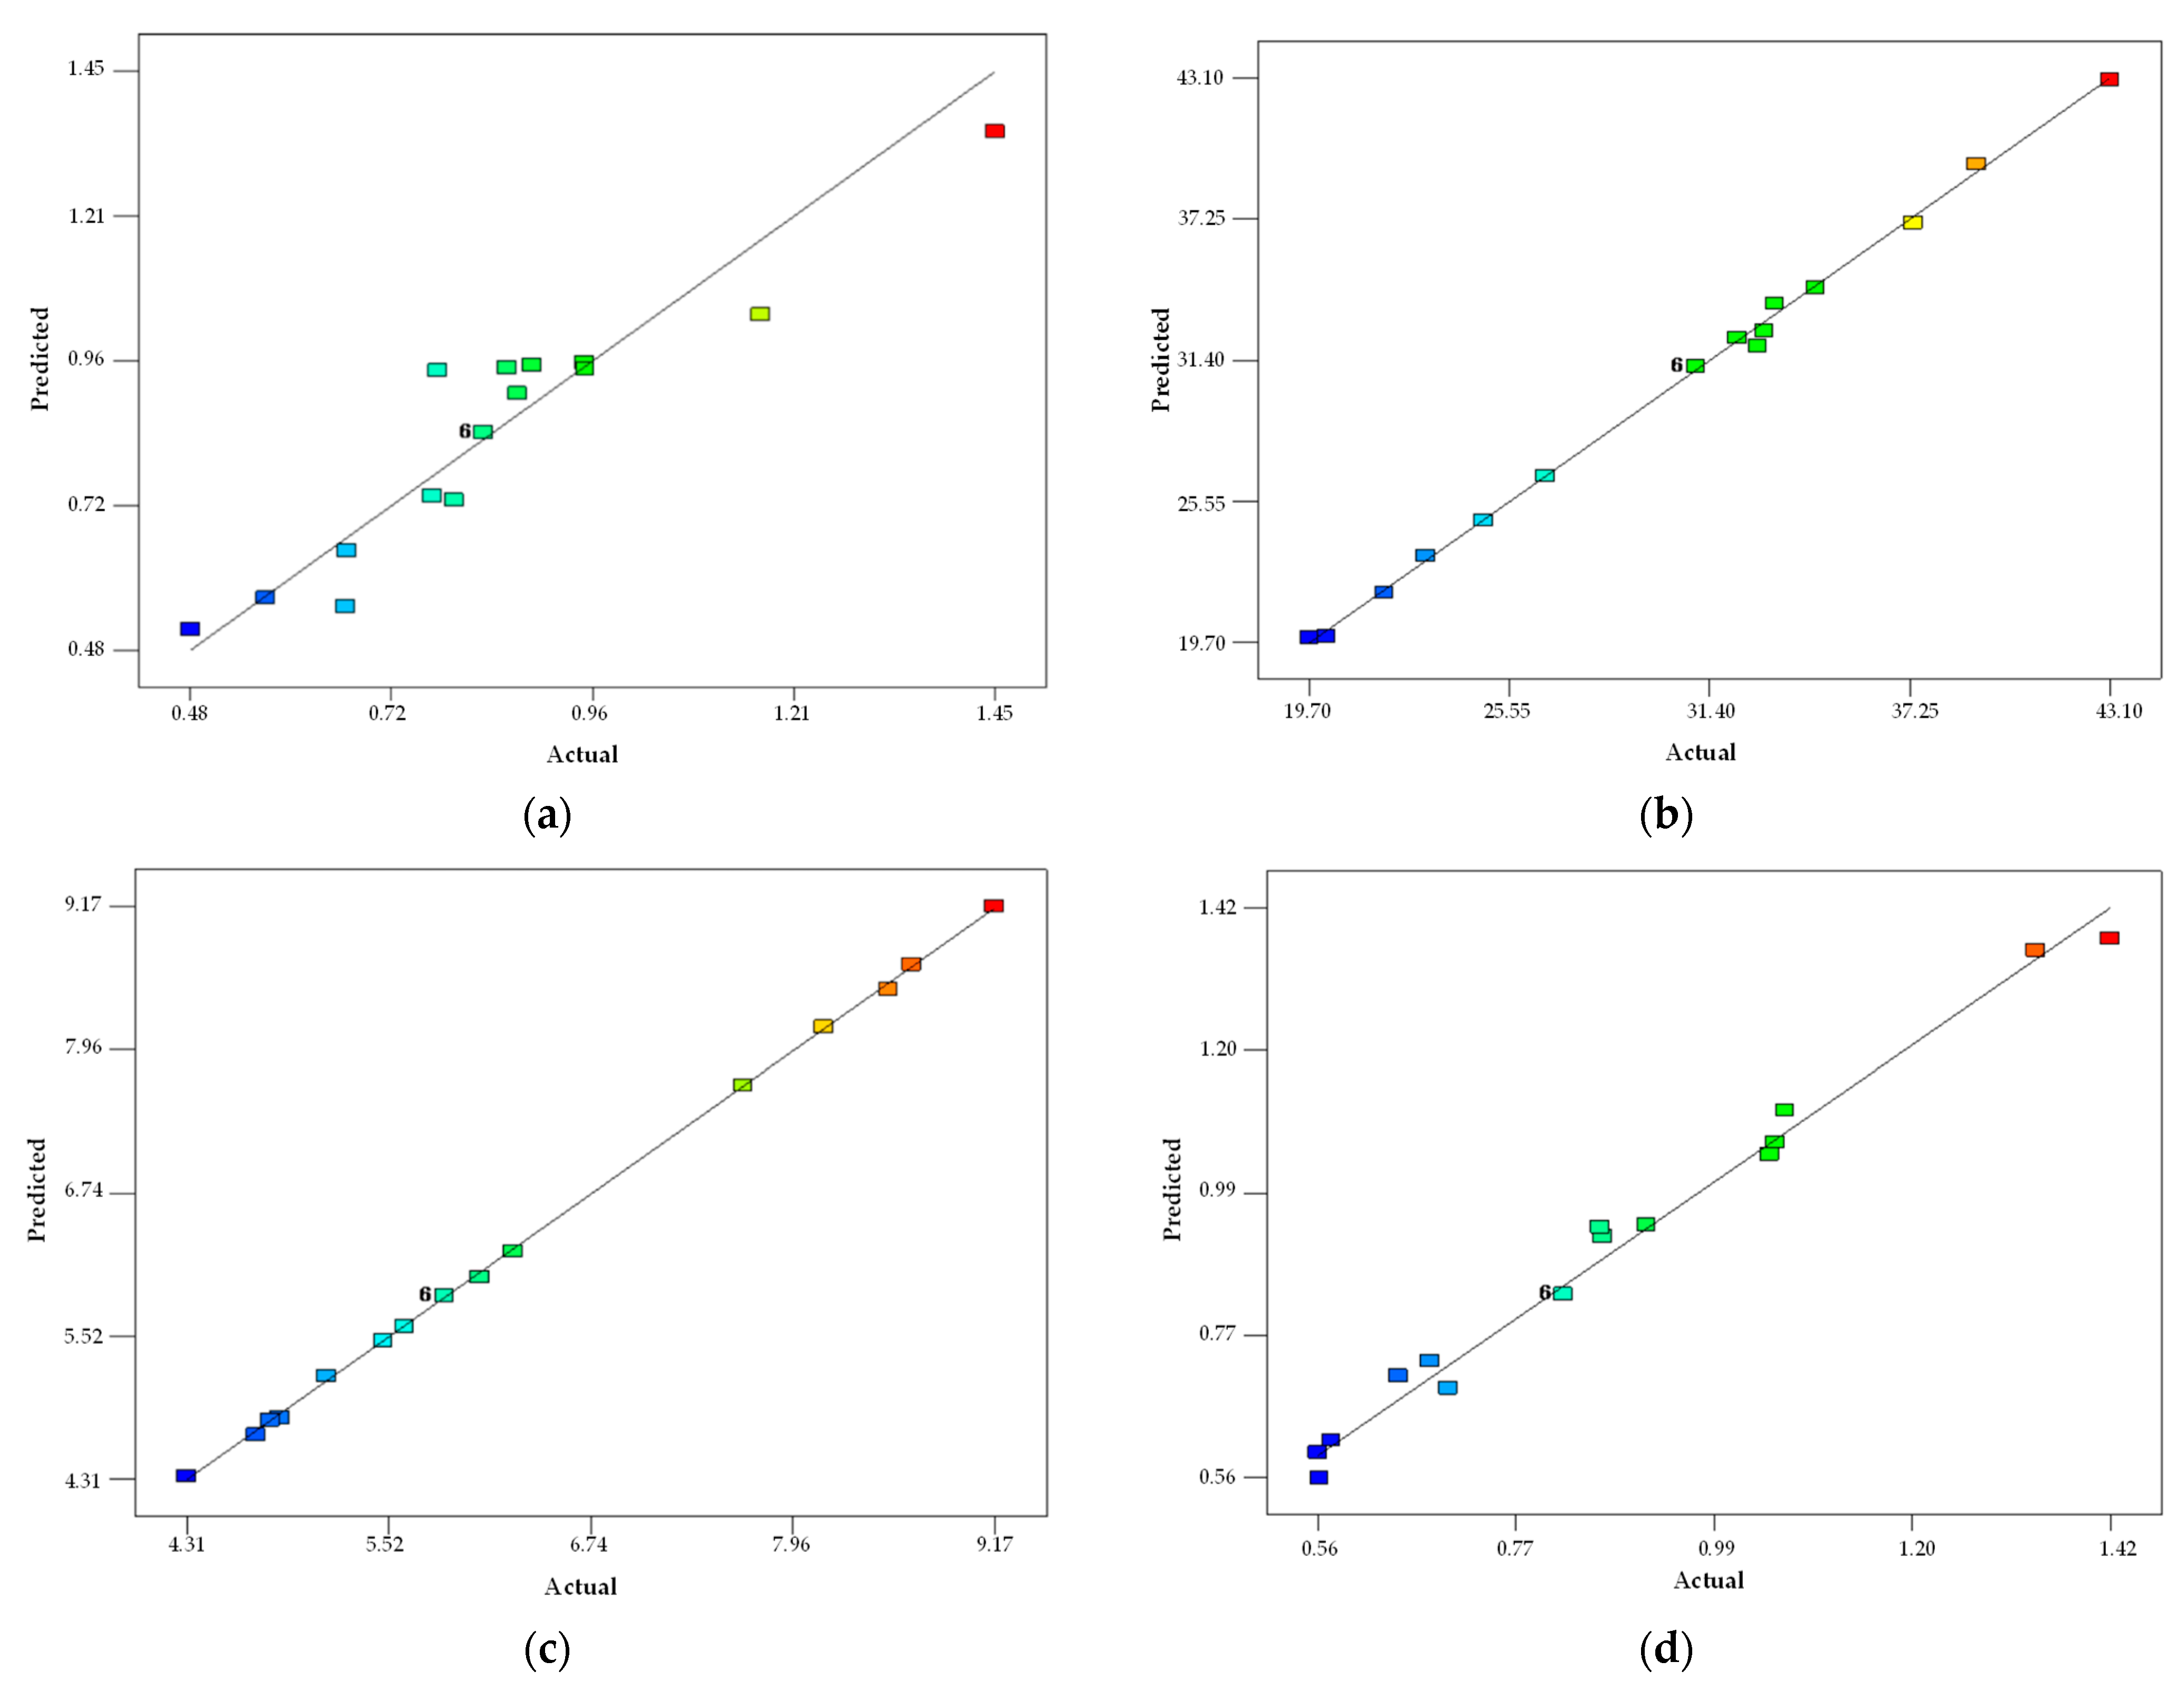
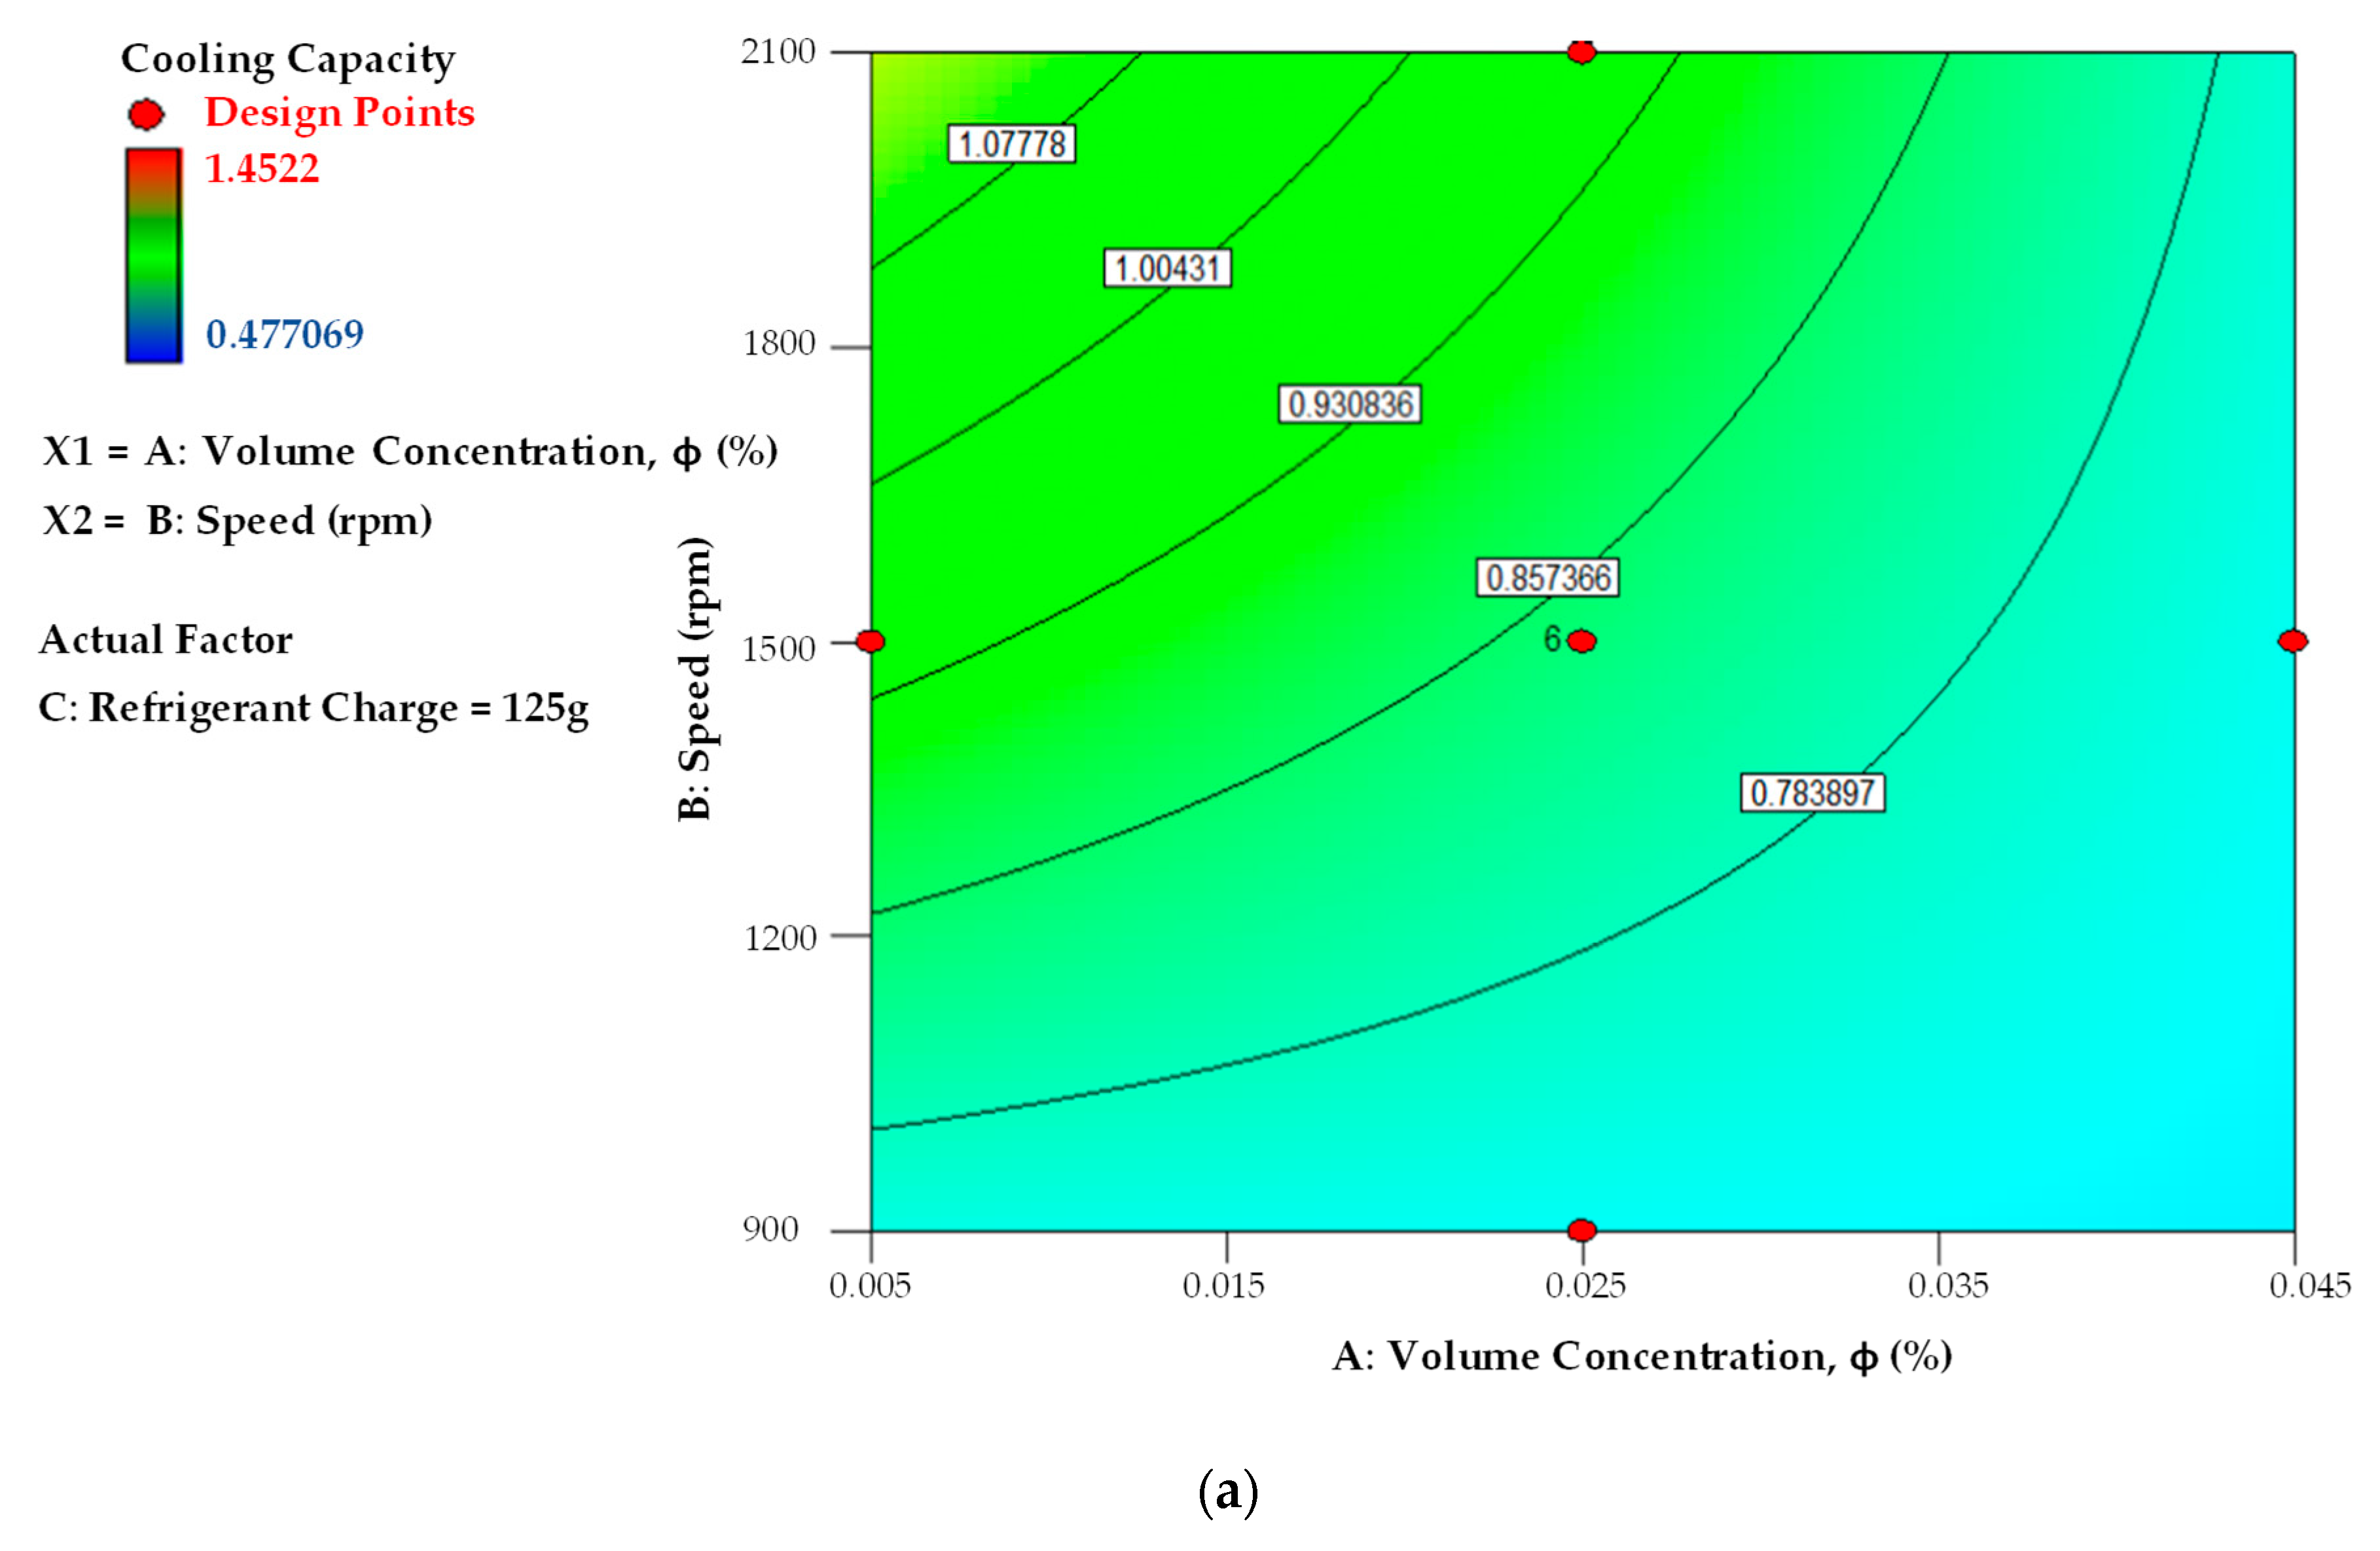
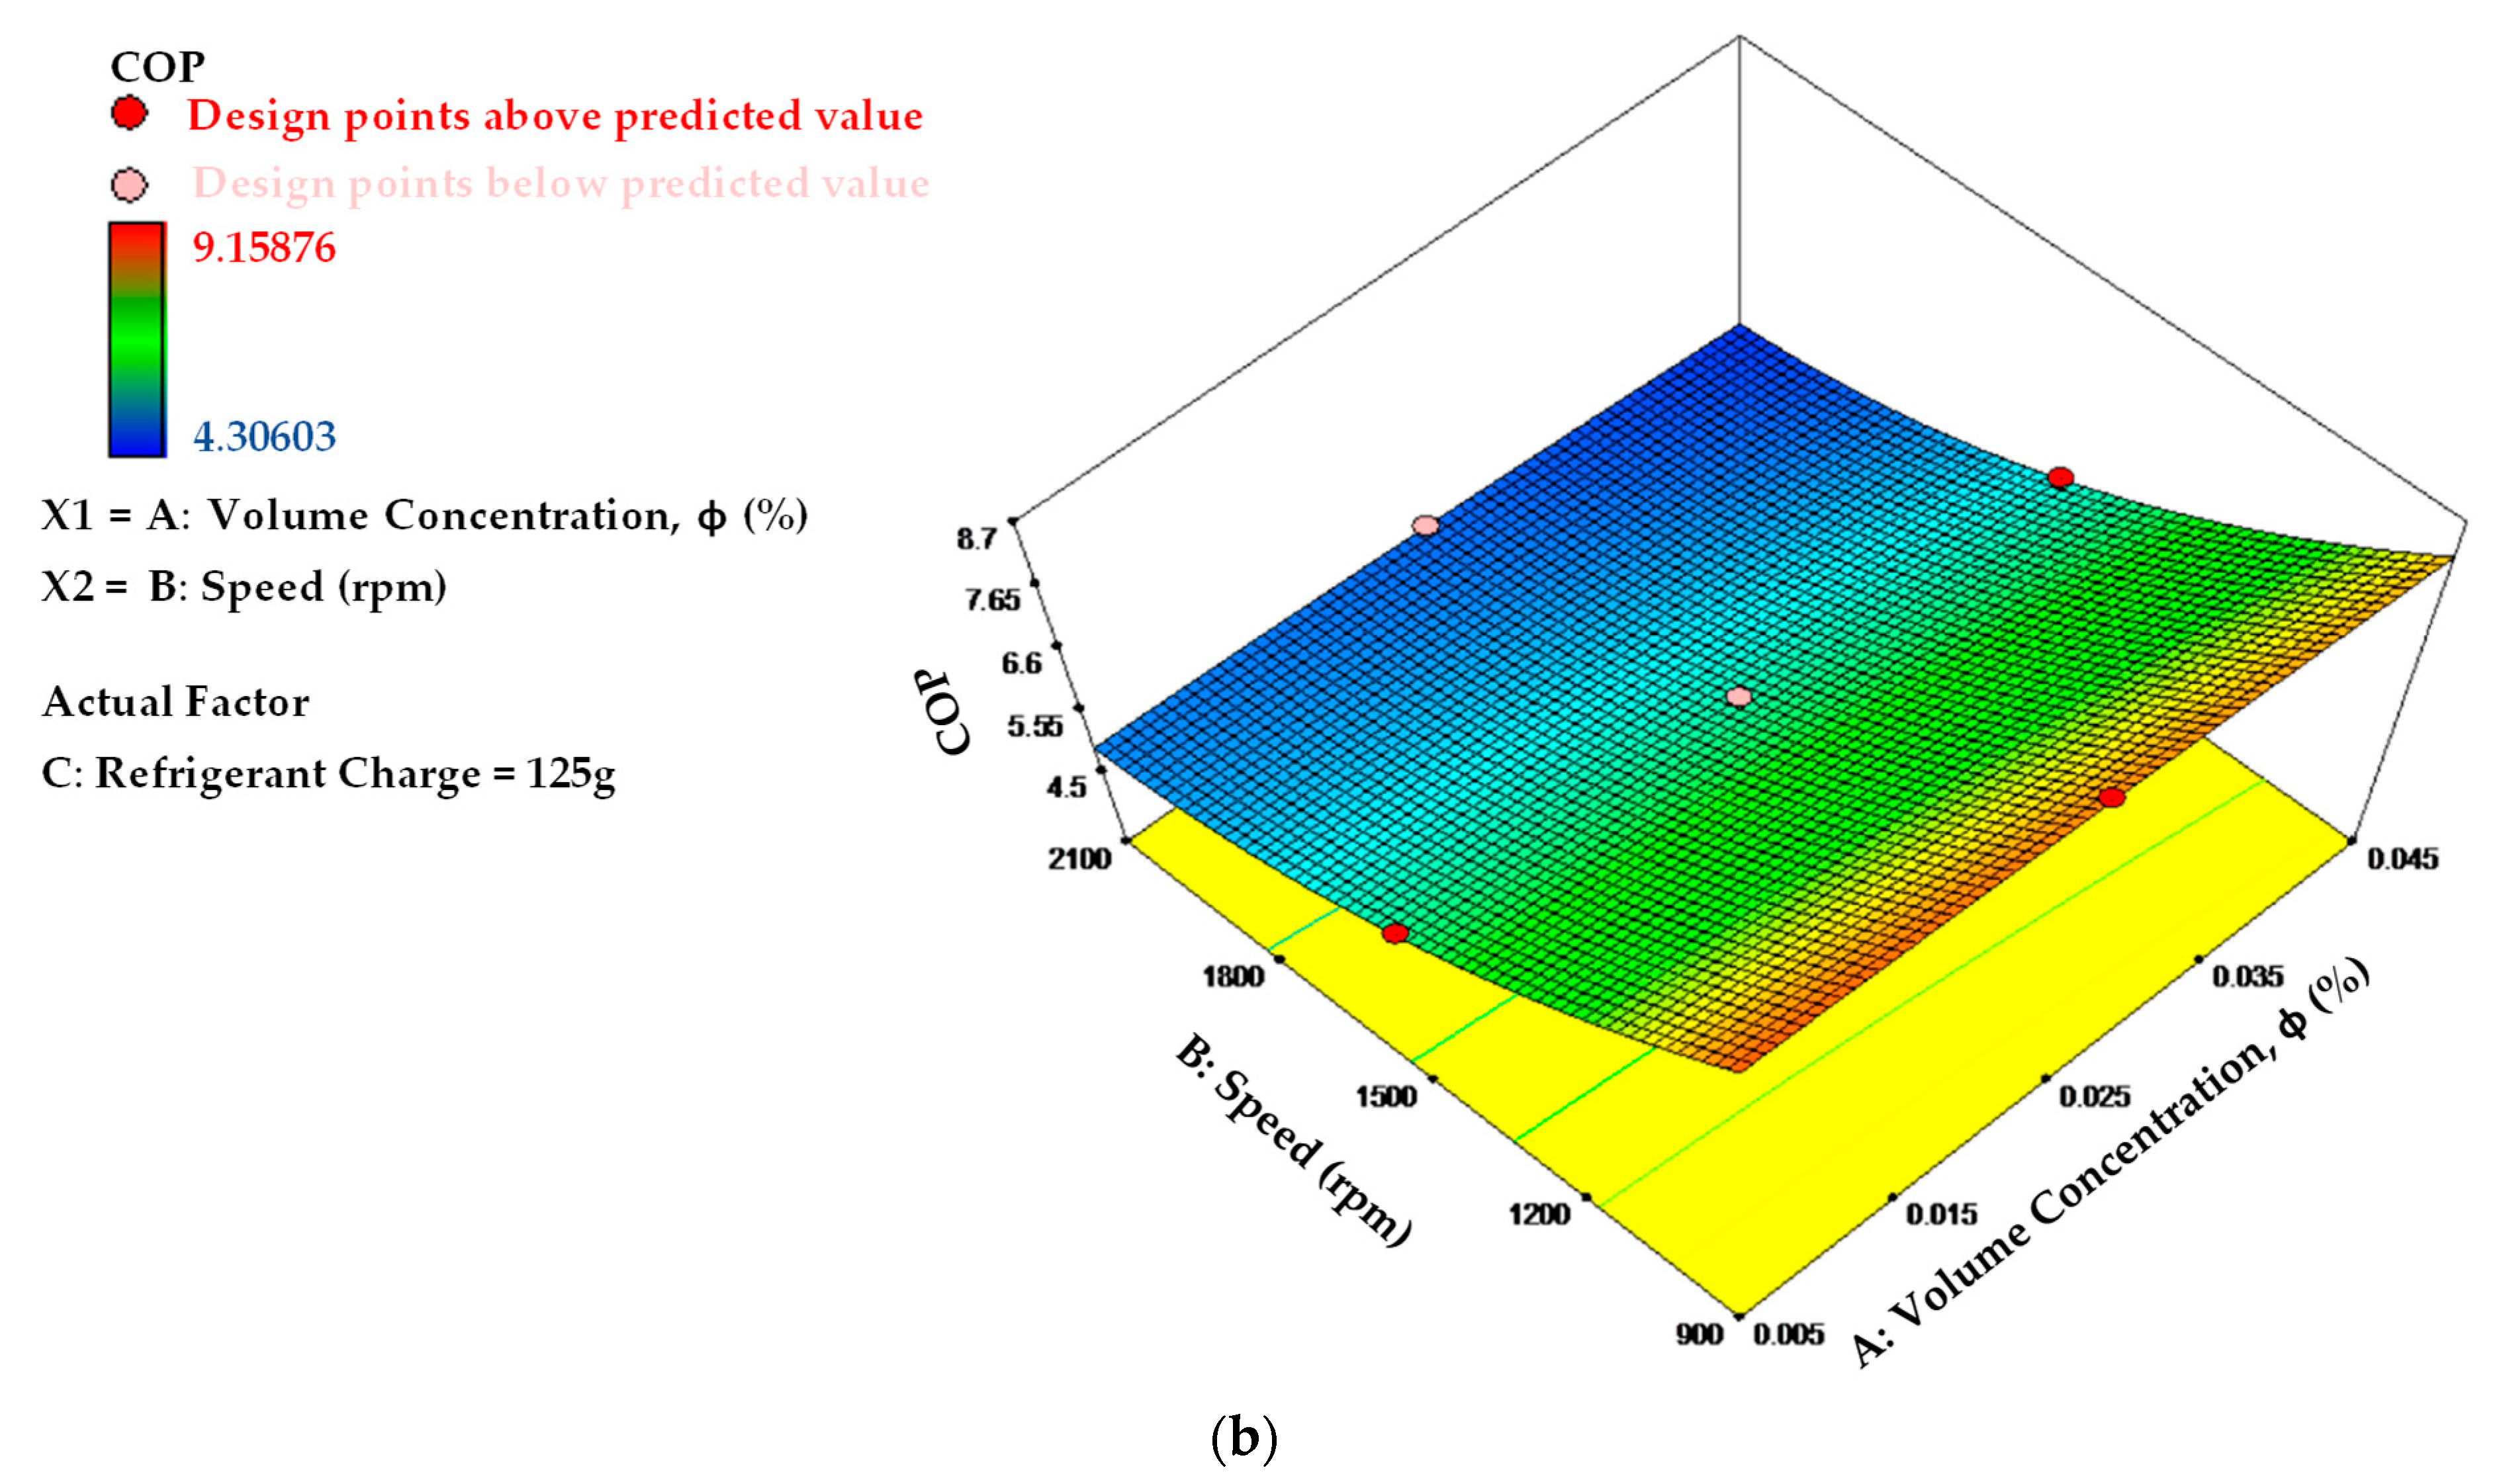
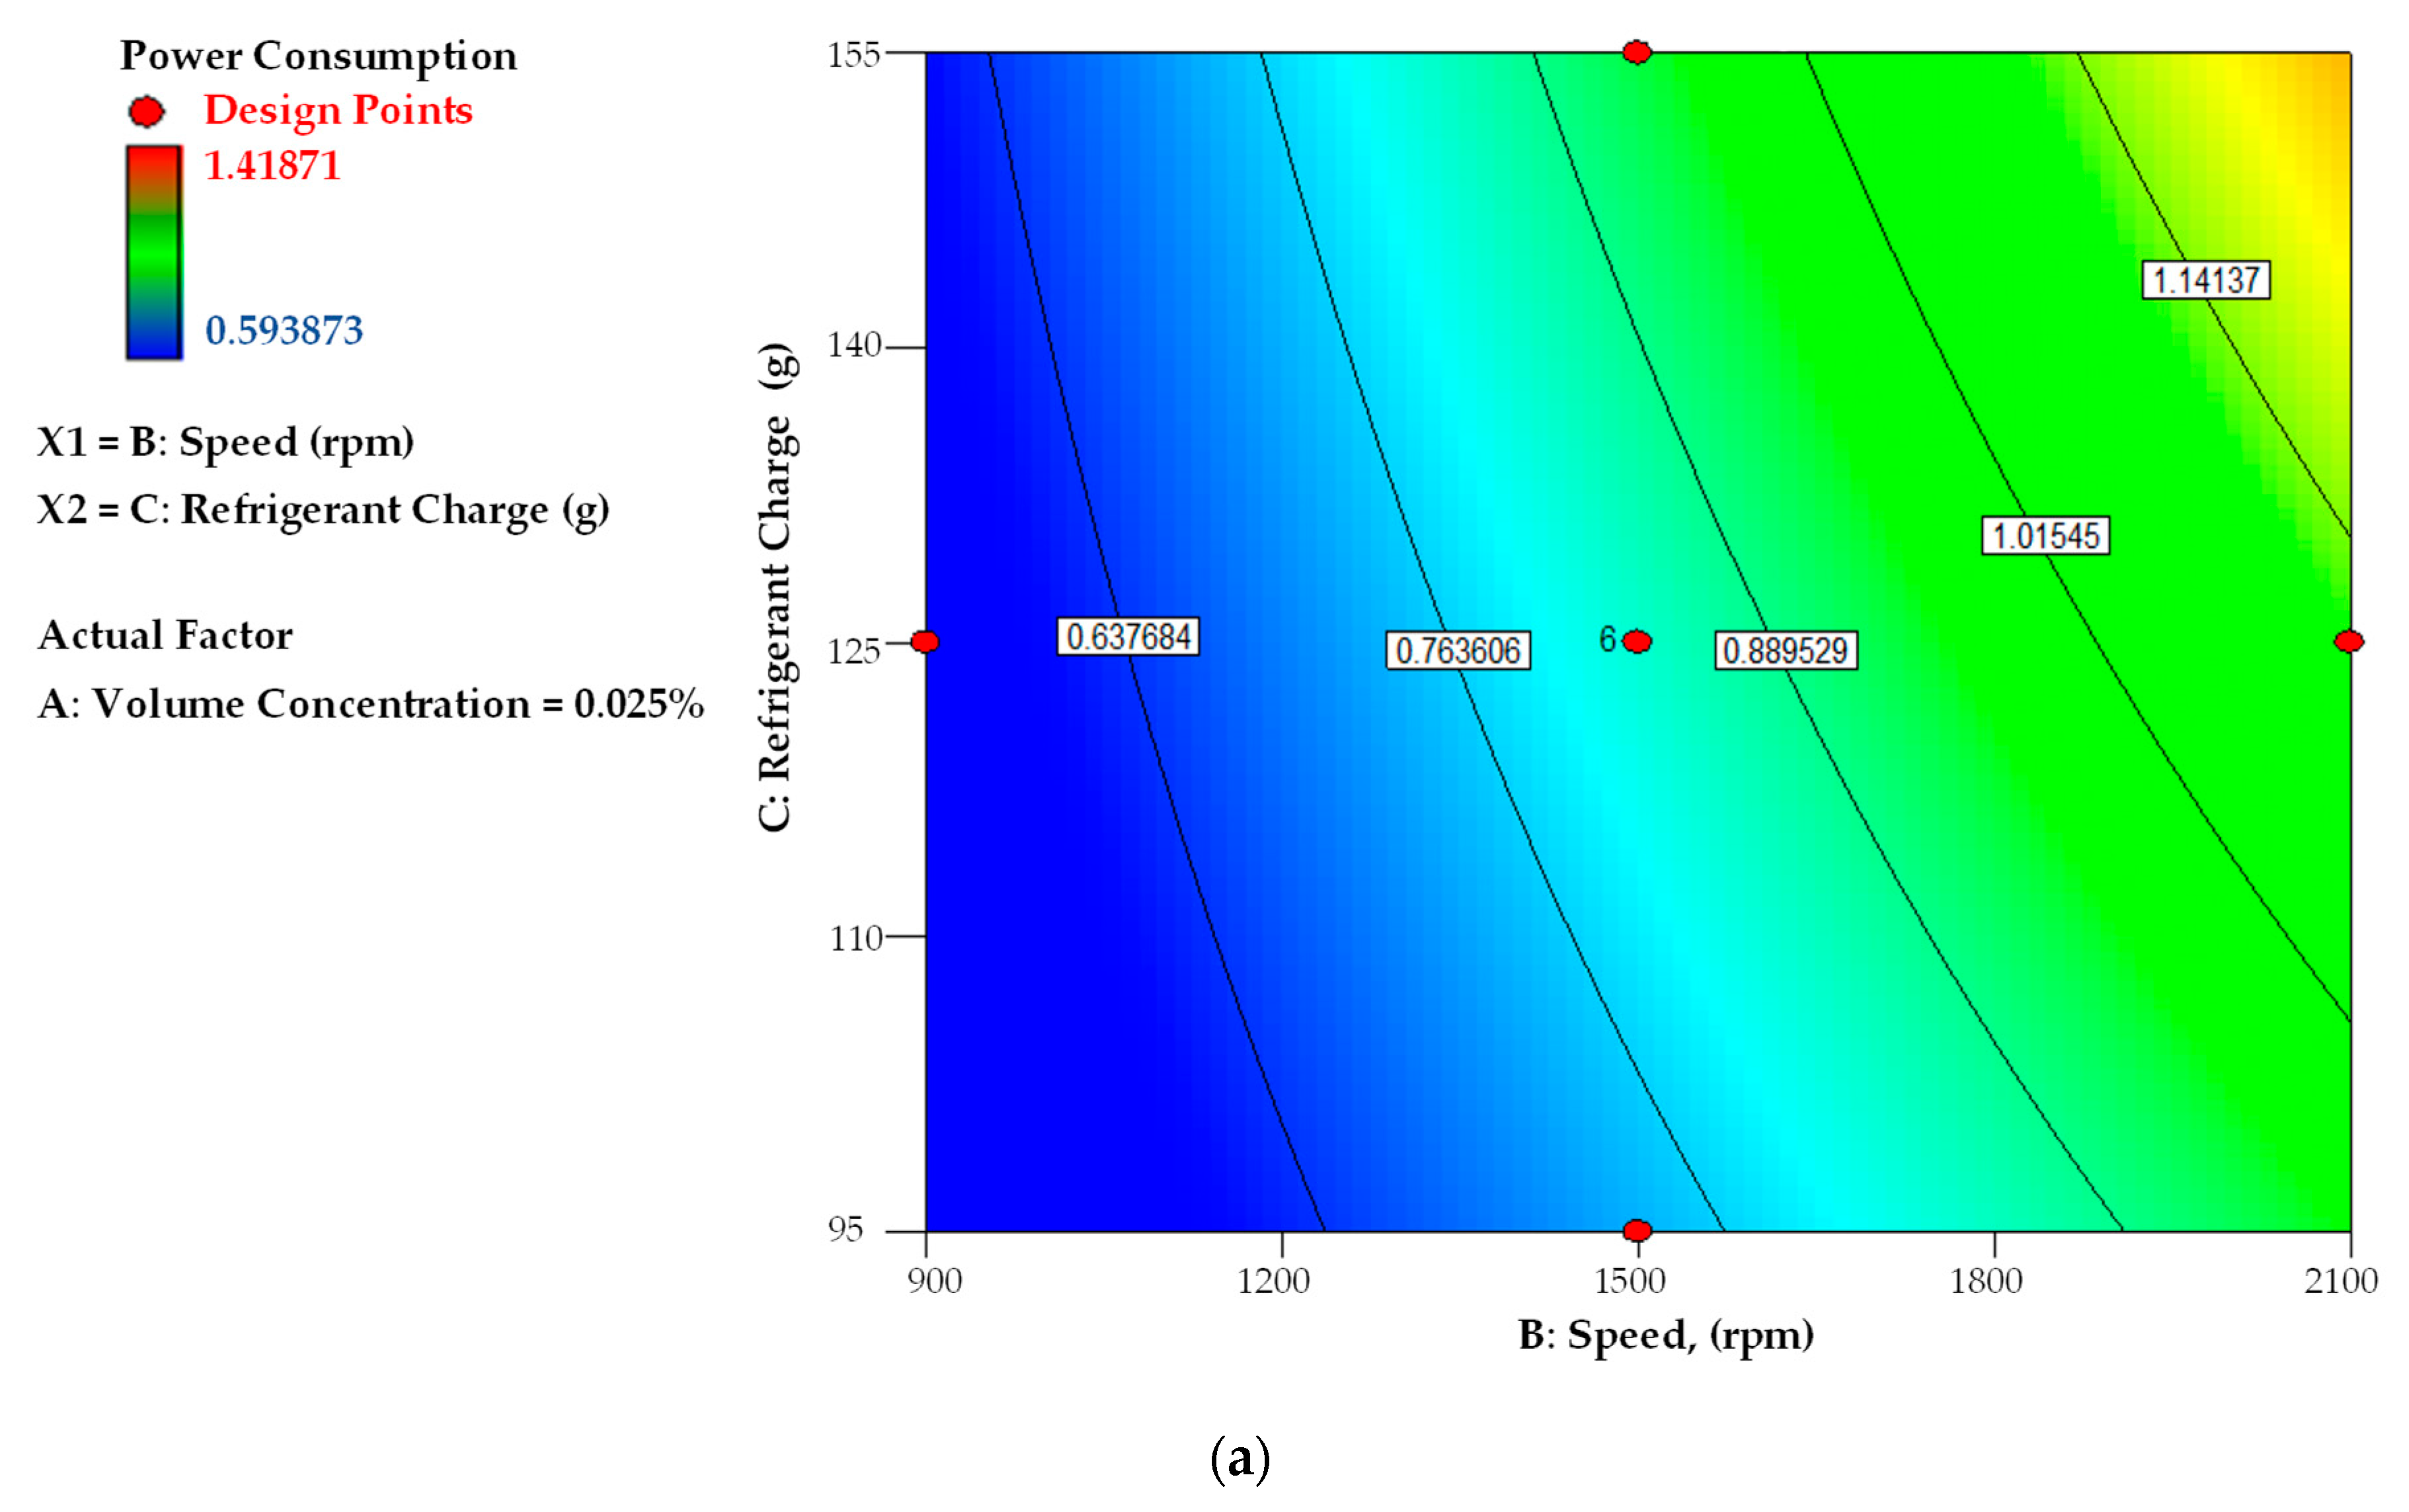
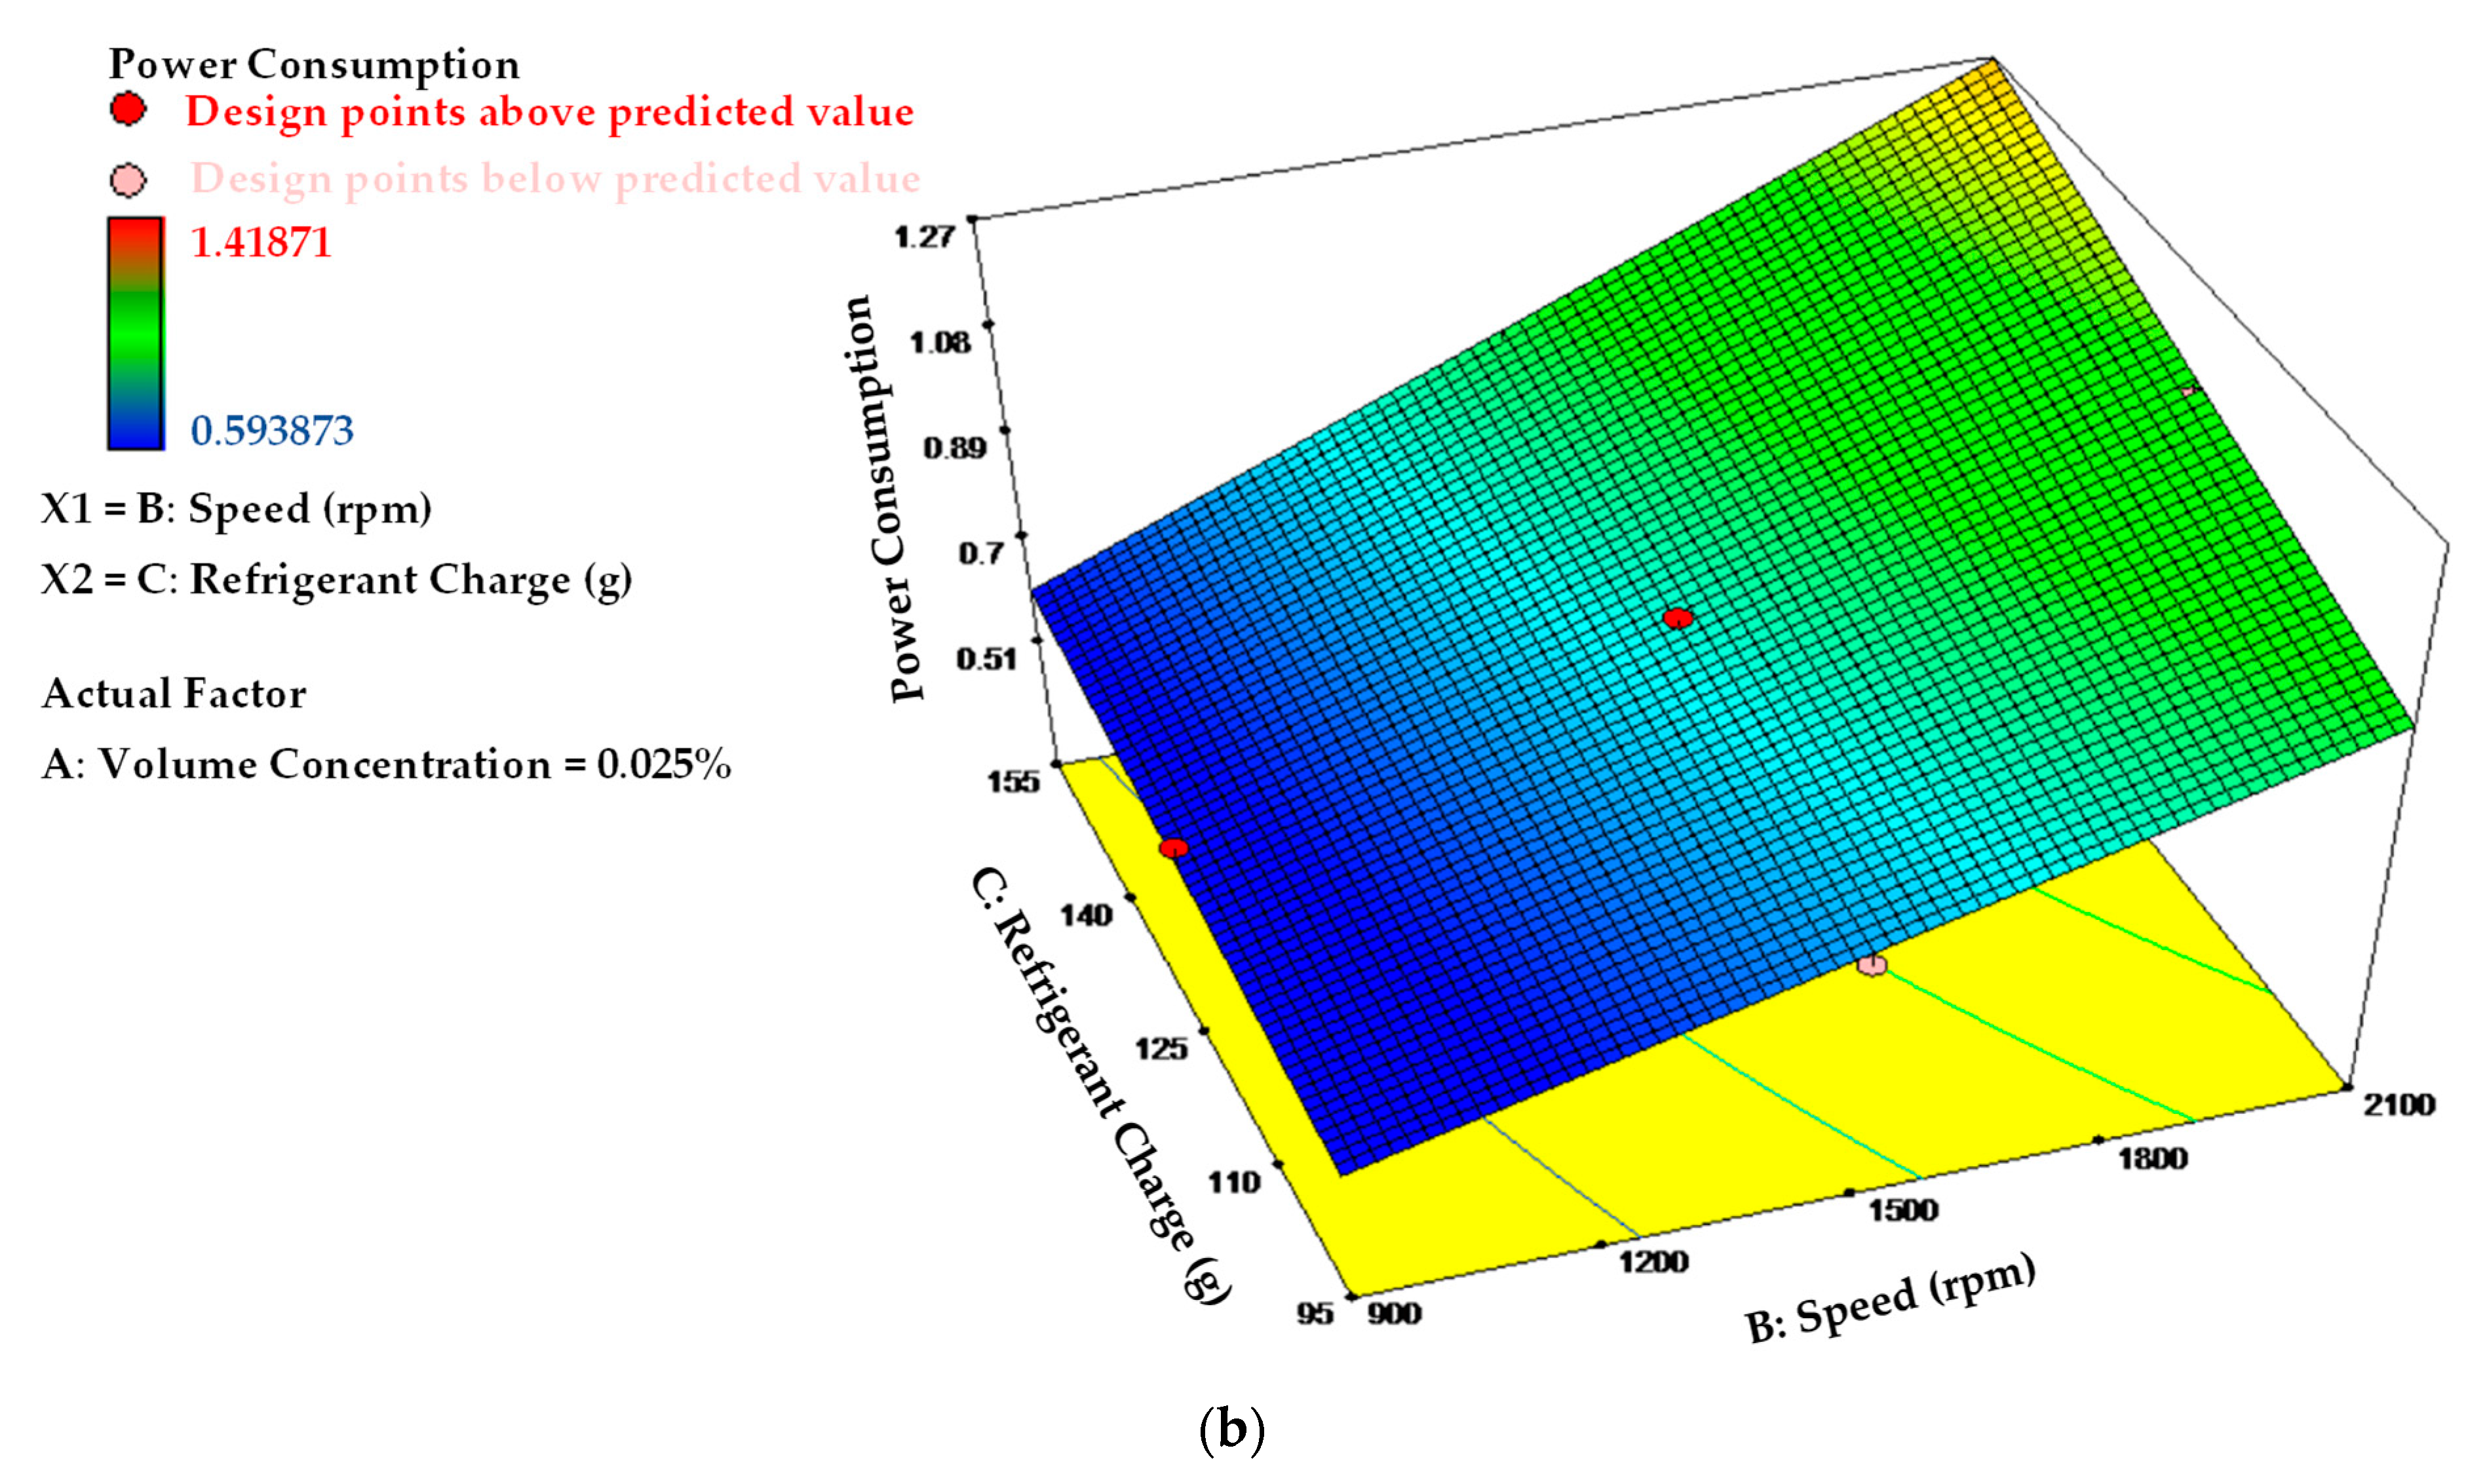
3.3. Residual and Response Surface Plots

Figure 5 and Figure 6 depict a normal plot of residuals, as well as the normal plot projected against the actual plots for all responses. To compare the two values and examine the distribution of the residuals, the predicted and actual values of cooling capacity, compressor work, COP, and power consumption were plotted. All residuals in the graphs are located on a straight line, indicating that the errors have a normal distribution. The normal probability plot for any ANOVA should be evaluated for the range of residuals near the mean line, showing that residuals are generally fitted for all responses. Therefore, it can be concluded that the model for predicting AAC performance using RSM’s design factors, when applied to a specific set of parameters, has a high level of accuracy.
Response surface plots as a function of two independent variables or factors, with the other parameters held constant, are useful tools for evaluating the interaction and correlation of the variables, as well as for comprehending their main and interactive effects [66,67]. Figure 7 represents the interaction of volume concentration (0.005 to 0.045%) and speed (900 to 2100 rpm) and its effect on cooling capacity when the refrigerant charge is kept constant at 125 g. Increasing volume concentrations with increment of speed reduced the cooling capacity rate. Compressor speed has a greater effect on cooling capacity, as shown through the comparison of the slope between the volume concentration of composite nanolubricants and speed. Figure 8 shows the variation of the compressor work with speed for different refrigerant charges, while volume concentration is fixed at 0.025%. From the figure, compressor work increases against the increasing speed, but decreases with refrigerant charge. The interaction of volume concentration and speed on COP is shown in Figure 9. Refrigerant charge was fixed at 125 g. It was observed that volume concentration had a greater influence on COP, as increasing volume concentrations increased COP, whereas an increase in speed lowered the COP. Figure 10 shows the variation in the power consumption for different refrigerant charges and speeds, with the volume concentration fixed at 0.025%. An increase in refrigerant charge and speed resulted in significant increments in power consumption.

3.4. Optimization and Validation

A confirmation experiment of the control parameters [69] indicated by the RSM optimization technique is required for confirming the improved conditions [70]. Table 14 represents the optimal conditions, with a high desirability of 81.6%. As stated in Table 15, five trial runs at the optimal level were carried out to test and evaluate the reliability of the constructed regression model against the experimental results. The expected and experimental values in the table are quite close to each other. For valid statistical analysis, error values should be less than 20% [71,72]. For all runs, the computed error values were less than 10% and were within acceptable bounds. The validation results were consistent with the current experimental data, reflecting a successful optimization.

4. Conclusions

The effects of experimental operating conditions, such as by volume concentration of composite nanolubricant, the compressor speed, and refrigerant charge, on cooling capacity, compressor work, COP, and power consumption were assessed. The optimization of operating conditions for an AAC system was performed in the present work using the RSM method. Based on the results of the RSM model, the optimal operation suggested for optimal AAC performance were found at a compressor speed of 900 rpm, refrigerant charge of 155g, and volume concentration of 0.019%; cooling capacity = 0.9346 kW, compressor work = 19.2296 kJ/kg, COP = 9.051, and power consumption = 0.6209 kW. The validation test runs were carried out to validate predicted results against the experimental results. The developed model shows that the predicted results are in excellent agreement with the experimental results, with an error value of less than 10%. Therefore, it was recommended to use Al2O3-SiO2/PAG composite nanolubricants with these operating conditions for optimum performance in the AAC system.

Author Contributions

Conceptualization, W.H.A.; data curation, N.N.M.Z. and H.M.A.; formal analysis, N.N.M.Z.; investigation, N.N.M.Z., A.A.M.R. and A.I.R.; methodology, W.H.A.; project administration, W.H.A.; software, A.A.M.R. and H.M.A.; supervision, W.H.A.; validation, A.A.M.R. and A.I.R.; visualization, A.I.R. and H.M.A.; writing—original draft, N.N.M.Z.; writing—review and editing, A.I.R. All authors have read and agreed to the published version of the manuscript.

Funding

This research was funded by Universiti Malaysia Pahang, grant number RDU213302.

Institutional Review Board Statement

Not applicable.

Informed Consent Statement

Not applicable.

Data Availability Statement

The data that support the findings of this study are available from the corresponding author (W.H. Azmi) upon reasonable request.

Acknowledgments

The authors are appreciative for the financial support provided by the Universiti Malaysia Pahang under the International Publication Grant. The authors further acknowledge the contributions of the research teams from the Center for Research in Advanced Fluid and Processes (Pusat Bendalir) and the Advanced Automotive Liquids Laboratory (AALL), who provided valuable insight and expertise for the current study.

Conflicts of Interest

The authors declare no conflict of interest.

References

  1. Bouajila, W.; Shimoda, M.; Riccius, J. Design optimization of a rocket engine’s inner liner with improved response surface methodology. Eng. Optim. 2021, 54, 1143–1159. [Google Scholar] [CrossRef]
  2. Eshghi, A.T.; Lee, S. Adaptive improved response surface method for reliability-based design optimization. Eng. Optim. 2019, 51, 2011–2029. [Google Scholar] [CrossRef]
  3. Lin, C.-H. Mended grey wolf optimization and Taguchi method with multi-goal optimization for six-phase copper rotor induction motor design. Eng. Optim. 2020, 1–20. [Google Scholar] [CrossRef]
  4. Kuo, Y.; Yang, T.; Huang, G.-W. The use of a grey-based Taguchi method for optimizing multi-response simulation problems. Eng. Optim. 2008, 40, 517–528. [Google Scholar] [CrossRef]
  5. Darvishvand, L.; Kamkari, B.; Kowsary, F. Optimal design approach for heating irregular-shaped objects in three-dimensional radiant furnaces using a hybrid genetic algorithm–artificial neural network method. Eng. Optim. 2018, 50, 452–470. [Google Scholar] [CrossRef]
  6. Khoshbin, F.; Bonakdari, H.; Ashraf Talesh, S.H.; Ebtehaj, I.; Zaji, A.H.; Azimi, H. Adaptive neuro-fuzzy inference system multi-objective optimization using the genetic algorithm/singular value decomposition method for modelling the discharge coefficient in rectangular sharp-crested side weirs. Eng. Optim. 2016, 48, 933–948. [Google Scholar] [CrossRef]
  7. Costa, N.; Garcia, J. Using a multiple response optimization approach to optimize the coefficient of performance. Appl. Therm. Eng. 2016, 96, 137–143. [Google Scholar] [CrossRef]
  8. Ahmed, R.; Mahadzir, S.; Rozali, N.E.B.; Biswas, K.; Matovu, F.; Ahmed, K. Artificial intelligence techniques in refrigeration system modelling and optimization: A multi-disciplinary review. Sustain. Energy Technol. Assess. 2021, 47, 101488. [Google Scholar] [CrossRef]
  9. Baş, D.; Boyacı, İ.H. Modeling and optimization I: Usability of response surface methodology. J. Food Eng. 2007, 78, 836–845. [Google Scholar]
  10. Myers, R.H.; Montgomery, D.C.; Vining, G.G.; Borror, C.M.; Kowalski, S.M. Response surface methodology: A retrospective and literature survey. J. Qual. Technol. 2004, 36, 53–77. [Google Scholar]
  11. Elfghi, F.M. A hybrid statistical approach for modeling and optimization of RON: A comparative study and combined application of response surface methodology (RSM) and artificial neural network (ANN) based on design of experiment (DOE). Chem. Eng. Res. Des. 2016, 113, 264–272. [Google Scholar] [CrossRef]
  12. Abhang, L.B.; Hameedullah, M. Modeling and analysis for surface roughness in machining EN-31 steel using response surface methodology. Int. J. Appl. Res. Mech. Eng. 2011, 1, 33–38. [Google Scholar] [CrossRef]
  13. Makadia, A.J.; Nanavati, J. Optimisation of machining parameters for turning operations based on response surface methodology. Measurement 2013, 46, 1521–1529. [Google Scholar] [CrossRef]
  14. Gangil, M.; Pradhan, M.K. Modeling and optimization of electrical discharge machining process using RSM: A review. Mater. Today: Proc. 2017, 4, 1752–1761. [Google Scholar] [CrossRef]
  15. Barik, C.R.; Mandel, N.K. Parametric effect and optimization of surface roughness of EN 31 in CNC dry turning. Int. J. Lean Think. 2012, 3, 54–66. [Google Scholar]
  16. Krishankant, J.T.; Bector, M.; Kumar, R. Application of Taguchi method for optimizing turning process by the effects of machining parameters. Int. J. Eng. Adv. Technol. 2012, 2, 263–274. [Google Scholar]
  17. Rao, C.M.; Venkatasubbaiah, K. Optimization of surface roughness in CNC turning using Taguchi Method and ANOVA. Int. J. Adv. Sci. Technol. 2016, 93, 1–14. [Google Scholar] [CrossRef]
  18. Li, C.; Xiao, Q.; Tang, Y.; Li, L. A method integrating Taguchi, RSM and MOPSO to CNC machining parameters optimization for energy saving. J. Clean. Prod. 2016, 135, 263–275. [Google Scholar] [CrossRef]
  19. Parpas, D.; Amaris, C.; Sun, J.; Tsamos, K.M.; Tassou, S.A. Numerical study of air temperature distribution and refrigeration systems coupling for chilled food processing facilities. Energy Procedia 2017, 123, 156–163. [Google Scholar] [CrossRef]
  20. Belman-Flores, J.M.; Mota-Babiloni, A.; Ledesma, S.; Makhnatch, P. Using ANNs to approach to the energy performance for a small refrigeration system working with R134a and two alternative lower GWP mixtures. Appl. Therm. Eng. 2017, 127, 996–1004. [Google Scholar] [CrossRef]
  21. Nataraj, M.; Balasubramanian, K.; Palanisamy, D. Optimization of machining parameters for CNC turning of Al/Al2O3 MMC using RSM approach. Mater. Today Proc. 2018, 5, 14265–14272. [Google Scholar] [CrossRef]
  22. Ocholi, O.; Menkiti, M.; Auta, M.; Ezemagu, I. Optimization of the operating parameters for the extractive synthesis of biolubricant from sesame seed oil via response surface methodology. Egypt. J. Pet. 2018, 27, 265–275. [Google Scholar] [CrossRef]
  23. Mao, N.; Song, M.; Pan, D.; Deng, S. Comparative studies on using RSM and TOPSIS methods to optimize residential air conditioning systems. Energy 2018, 144, 98–109. [Google Scholar] [CrossRef]
  24. Redhwan, A.A.M.; Azmi, W.H.; Najafi, G.; Sharif, M.Z.; Zawawi, N.N.M. Application of response surface methodology in optimization of automotive air-conditioning performance operating with SiO2/PAG nanolubricant. J. Therm. Anal. Calorim. 2018, 135, 1269–1283. [Google Scholar] [CrossRef]
  25. Qader, B.S.; Supeni, E.E.; Ariffin, M.K.A.; Talib, A.R.A. RSM approach for modelling and optimization of designing parameters for inclined fins of solar air heater. Renew. Energy 2018, 136, 48–68. [Google Scholar] [CrossRef]
  26. Zendehboudi, A.; Mota-Babiloni, A.; Makhnatch, P.; Saidur, R.; Sait, S.M. Modeling and multi-objective optimization of an R450A vapor compression refrigeration system. Int. J. Refrig. 2019, 100, 141–155. [Google Scholar]
  27. Canbolat, A.S.; Bademlioglu, A.H.; Arslanoglu, N.; Kaynakli, O. Performance optimization of absorption refrigeration systems using Taguchi, ANOVA and Grey Relational Analysis methods. J. Clean. Prod. 2019, 229, 874–885. [Google Scholar] [CrossRef]
  28. Zaman, M.A. Photonic radiative cooler optimization using Taguchi’s method. Int. J. Therm. Sci. 2019, 144, 21–26. [Google Scholar] [CrossRef]
  29. Vyas, M.; Jain, M.; Pareek, K.; Garg, A. Multivariate Optimization for Maximum Capacity of Lead Acid Battery Through Taguchi Method. Measurement 2019, 148, 106904. [Google Scholar] [CrossRef]
  30. Huirem, B.; Sahoo, P.K. Thermodynamic Modeling and Performance Optimization of a Solar-Assisted Vapor Absorption Refrigeration System (SAVARS). Int. J. Air-Cond. Refrig. 2020, 28, 2050006. [Google Scholar] [CrossRef]
  31. Zawawi, N.N.M.; Azmi, W.H.; Ghazali, M.F.; Ramadhan, A.I. Performance Optimization of Automotive Air-Conditioning System Operating with Al2O3-SiO2/PAG Composite Nanolubricants using Taguchi Method. Automot. Exp. 2022, 5, 121–136. [Google Scholar] [CrossRef]
  32. Esfe, M.H.; Afrand, M.; Yan, W.-M.; Yarmand, H.; Toghraie, D.; Dahari, M. Effects of temperature and concentration on rheological behavior of MWCNTs/SiO2 (20–80)-SAE40 hybrid nano-lubricant. Int. Commun. Heat Mass Transf. 2016, 76, 133–138. [Google Scholar] [CrossRef]
  33. Esfe, M.H.; Yan, W.-M.; Afrand, M.; Sarraf, M.; Toghraie, D.; Dahari, M. Estimation of thermal conductivity of Al2O3/water (40%)–ethylene glycol (60%) by artificial neural network and correlation using experimental data. Int. Commun. Heat Mass Transf. 2016, 74, 125–128. [Google Scholar] [CrossRef]
  34. Afrand, M.; Nadooshan, A.A.; Hassani, M.; Yarmand, H.; Dahari, M. Predicting the viscosity of multi-walled carbon nanotubes/water nanofluid by developing an optimal artificial neural network based on experimental data. Int. Commun. Heat Mass Transf. 2016, 77, 49–53. [Google Scholar] [CrossRef]
  35. Atik, K.; Aktaş, A.; Deniz, E. Performance parameters estimation of MAC by using artificial neural network. Expert Syst. Appl. 2010, 37, 5436–5442. [Google Scholar] [CrossRef]
  36. Kamar, H.M.; Ahmad, R.; Kamsah, N.; Mustafa, A.F.M. Artificial neural networks for automotive air-conditioning systems performance prediction. Appl. Therm. Eng. 2013, 50, 63–70. [Google Scholar] [CrossRef]
  37. Tian, Z.; Qian, C.; Gu, B.; Yang, L.; Liu, F. Electric vehicle air conditioning system performance prediction based on artificial neural network. Appl. Therm. Eng. 2015, 89, 101–114. [Google Scholar] [CrossRef]
  38. Roy, R.; Bhowal, A.J.; Mandal, B.K. Exergy and Cost Optimization of a Two-Stage Refrigeration System Using Refrigerant R32 and R410A. J. Therm. Sci. Eng. Appl. 2020, 12, 031024. [Google Scholar] [CrossRef]
  39. Deymi-Dashtebayaz, M.; Maddah, S.; Fallahi, E. Thermo-economic-environmental optimization of injection mass flow rate in the two-stage compression refrigeration cycle (Case study: Mobarakeh steel company in Isfahan, Iran). Int. J. Refrig. 2019, 106, 7–17. [Google Scholar] [CrossRef]
  40. Redhwan, A.A.M.; Azmi, W.H.; Sharif, M.Z.; Zawawi, N.N.M.; Ariffin, S.Z. Utilization of Response Surface Method (RSM) in Optimizing Automotive Air Conditioning (AAC) Performance Exerting Al2O3/PAG Nanolubricant. Proc. J. Phys. Conf. Ser. 2020, 1691, 012003. [Google Scholar] [CrossRef]
  41. Redhwan, A.A.M.; Azmi, W.H.; Sharif, M.Z.; Mamat, R.; Samykano, M.; Najafi, G. Performance improvement in mobile air conditioning system using Al2O3/PAG nanolubricant. J. Therm. Anal. Calorim. 2019, 135, 1299–1310. [Google Scholar] [CrossRef]
  42. Bhiradi, I.; Hiremath, S.S. Energy efficient and cost effective method for generation of in-situ silver nanofluids: Formation, morphology and thermal properties. Adv. Powder Technol. 2020, 31, 4031–4044. [Google Scholar] [CrossRef]
  43. Ying, Z.; He, B.; He, D.; Kuang, Y.; Ren, J.; Song, B. Comparisons of single-phase and two-phase models for numerical predictions of Al2O3/water nanofluids convective heat transfer. Adv. Powder Technol. 2020, 31, 3050–3061. [Google Scholar] [CrossRef]
  44. Singh, S.K.; Sarkar, J. Improving hydrothermal performance of hybrid nanofluid in double tube heat exchanger using tapered wire coil turbulator. Adv. Powder Technol. 2020, 31, 2092–2100. [Google Scholar] [CrossRef]
  45. Anitha, S.; Thomas, T.; Parthiban, V.; Pichumani, M. What dominates heat transfer performance of hybrid nanofluid in single pass shell and tube heat exchanger? Adv. Powder Technol. 2019, 30, 3107–3117. [Google Scholar] [CrossRef]
  46. Sharif, M.Z.; Azmi, W.H.; Redhwan, A.A.M.; Mamat, R. Investigation of thermal conductivity and viscosity of Al2O3/PAG nanolubricant for application in automotive air conditioning system. Int. J. Refrig. 2016, 70, 93–102. [Google Scholar] [CrossRef]
  47. Redhwan, A.A.M.; Azmi, W.H.; Sharif, M.Z.; Mamat, R. Comparative study of thermo-physical properties of SiO2 and Al2O3 nanoparticles dispersed in PAG lubricant. Appl. Therm. Eng. 2017, 116, 823–832. [Google Scholar] [CrossRef]
  48. Redhwan, A.; Azmi, W.; Sharif, M. Thermal conductivity enhancement of Al2O3 and SiO2 nanolubricants for application in automotive air conditioning (AAC) system. MATEC Web Conf. 2017, 90, 01051. [Google Scholar] [CrossRef]
  49. Sanukrishna, S.S.; Prakash, M.J. Experimental studies on thermal and rheological behaviour of TiO2-PAG nanolubricant for refrigeration system. Int. J. Refrig. 2018, 86, 356–372. [Google Scholar] [CrossRef]
  50. Sanukrishna, S.; Vishnu, S.; Prakash, M.J. Experimental investigation on thermal and rheological behaviour of PAG lubricant modified with SiO2 nanoparticles. J. Mol. Liq. 2018, 261, 411–422. [Google Scholar] [CrossRef]
  51. Zawawi, N.N.M.; Azmi, W.H.; Redhwan, A.A.M.; Sharif, M.Z.; Samykano, M. Experimental investigation on thermo-physical properties of metal oxide composite nanolubricants. Int. J. Refrig. 2018, 89, 11–21. [Google Scholar] [CrossRef]
  52. Sanukrishna, S.S.; Prakash, M.J. Thermal and rheological characteristics of refrigerant compressor oil with alumina nanoparticles—an experimental investigation. Powder Technol. 2018, 339, 119–129. [Google Scholar] [CrossRef]
  53. Sharif, M.Z.; Azmi, W.H.; Redhwan, A.A.M.; Mamat, R.; Yusof, T.M. Performance analysis of SiO2/PAG nanolubricant in automotive air conditioning system. Int. J. Refrig. 2017, 75, 204–216. [Google Scholar] [CrossRef]
  54. Zawawi, N.N.M.; Azmi, W.H.; Ghazali, M.F. Performance of Al2O3-SiO2/PAG composite nanolubricants in automotive air-conditioning system. Appl. Therm. Eng. 2022, 204, 117998. [Google Scholar] [CrossRef]
  55. Zawawi, N.N.M.; Azmi, W.H.; Sharif, M.Z.; Shaiful, A.I.M. Composite nanolubricants in automotive air conditioning system: An investigation on its performance. In Proceedings of the IOP Conference Series: Materials Science and Engineering, Pahang, Malaysia, 31 October 2018; IOP Publishing: Bristol, UK, 2019; p. 012078. [Google Scholar]
  56. Zakaria, I.; Azmi, W.H.; Mohamed, W.A.N.W.; Mamat, R.; Najafi, G. Experimental investigation of thermal conductivity and electrical conductivity of Al2O3 nanofluid in water-ethylene glycol mixture for proton exchange membrane fuel cell application. Int. Commun. Heat Mass Transf. 2015, 61, 61–68. [Google Scholar] [CrossRef] [Green Version]
  57. Sharif, M.Z.; Azmi, W.H.; Redhwan, A.A.M.; Zawawi, N.N.M. Preparation and stability of silicone dioxide dispersed in polyalkylene glycol based nanolubricants. MATEC Web Conf. 2017, 90, 01049. [Google Scholar] [CrossRef]
  58. Zawawi, N.N.M.; Azmi, W.H.; Sharif, M.Z.; Najafi, G. Experimental investigation on stability and thermo-physical properties of Al2O3–SiO2/PAG nanolubricants with different nanoparticle ratios. J. Therm. Anal. Calorim. 2019, 135, 1243–1255. [Google Scholar] [CrossRef]
  59. Zawawi, N.; Azmi, W.; Ghazali, M. Tribological performance of Al2O3–SiO2/PAG composite nanolubricants for application in air-conditioning compressor. Wear 2022, 492, 204238. [Google Scholar] [CrossRef]
  60. Zawawi, N.N.M.; Azmi, W.H.; Redhwan, A.A.M.; Sharif, M.Z.; Sharma, K.V. Thermo-physical properties of Al2O3-SiO2/PAG composite nanolubricant for refrigeration system. Int. J. Refrig. 2017, 80, 1–10. [Google Scholar] [CrossRef]
  61. Zawawi, N.N.M.; Azmi, W.H. Performance of Al2O3-SiO2/PAG employed composite nanolubricant in automotive air conditioning (AAC) system. In Proceedings of the IOP Conference Series: Materials Science and Engineering, Kuantan, Malaysia, 1–2 October 2019; IOP Publishing: Bristol, UK, 2020; p. 012052. [Google Scholar]
  62. Zawawi, N.N.M.; Azmi, W.H.; Redhwan, A.A.M.; Sharif, M.Z. Thermo-physical properties of metal oxides composite Nanolubricants. J. Mech. Eng. 2018, 15, 28–38. [Google Scholar]
  63. Lee, J.H.; Hwang, K.S.; Jang, S.P.; Lee, B.H.; Kim, J.H.; Choi, S.U.S.; Choi, C.J. Effective viscosities and thermal conductivities of aqueous nanofluids containing low volume concentrations of Al2O3 nanoparticles. Int. J. Heat Mass Transf. 2008, 51, 2651–2656. [Google Scholar] [CrossRef]
  64. Raval, N.; Maheshwari, R.; Kalyane, D.; Youngren-Ortiz, S.R.; Chougule, M.B.; Tekade, R.K. Importance of physicochemical characterization of nanoparticles in pharmaceutical product development. In Basic Fundamentals of Drug Delivery; Elsevier: Amsterdam, The Netherlands, 2019; pp. 369–400. [Google Scholar]
  65. Sadeghi, R.; Etemad, S.G.; Keshavarzi, E.; Haghshenasfard, M. Investigation of alumina nanofluid stability by UV–vis spectrum. Microfluid. Nanofluid. 2015, 18, 1023–1030. [Google Scholar] [CrossRef]
  66. Tan, Y.H.; Abdullah, M.O.; Nolasco-Hipolito, C.; Zauzi, N.S.A. Application of RSM and Taguchi methods for optimizing the transesterification of waste cooking oil catalyzed by solid ostrich and chicken-eggshell derived CaO. Renew. Energy 2017, 114, 437–447. [Google Scholar] [CrossRef]
  67. Prabhu, M.V.; Karthikeyan, R. Comparative studies on modelling and optimization of hydrodynamic parameters on inverse fluidized bed reactor using ANN-GA and RSM. Alex. Eng. J. 2018, 57, 3019–3032. [Google Scholar] [CrossRef]
  68. Choi, J.M.; Kim, Y.C. The effects of improper refrigerant charge on the performance of a heat pump with an electronic expansion valve and capillary tube. Energy 2002, 27, 391–404. [Google Scholar] [CrossRef]
  69. Kıvak, T. Optimization of surface roughness and flank wear using the Taguchi method in milling of Hadfield steel with PVD and CVD coated inserts. Measurement 2014, 50, 19–28. [Google Scholar] [CrossRef]
  70. Mandal, N.; Doloi, B.; Mondal, B.; Das, R. Optimization of flank wear using Zirconia Toughened Alumina (ZTA) cutting tool: Taguchi method and Regression analysis. Measurement 2011, 44, 2149–2155. [Google Scholar] [CrossRef]
  71. Derdour, F.Z.; Kezzar, M.; Khochemane, L. Optimization of penetration rate in rotary percussive drilling using two techniques: Taguchi analysis and response surface methodology (RMS). Powder Technol. 2018, 339, 846–853. [Google Scholar] [CrossRef]
  72. Cetin, M.H.; Ozcelik, B.; Kuram, E.; Demirbas, E. Evaluation of vegetable based cutting fluids with extreme pressure and cutting parameters in turning of AISI 304L by Taguchi method. J. Clean. Prod. 2011, 19, 2049–2056. [Google Scholar] [CrossRef]
Figure 1. The elemental composition of the nanoparticles (a) Al2O3; (b) SiO2.
Lubricants 10 00243 g001
Figure 2. TEM image of composite nanolubricants.
Lubricants 10 00243 g002
Figure 3. Composite nanolubricant with various sonication times.
Lubricants 10 00243 g003
Figure 4. Zeta potential measurement and polydispersity index (PDI). * Redhwan et al. [41]. ** Lee et al. [63].
Lubricants 10 00243 g004
Figure 5. Normal plot of residuals: (a) cooling capacity; (b) compressor work; (c) COP; (d) power consumption.
Lubricants 10 00243 g005aLubricants 10 00243 g005b
Figure 6. Comparison of numerical and predicted values of the RSM model: (a) cooling capacity; (b) compressor work; (c) COP; (d) power consumption.
Lubricants 10 00243 g006
Figure 7. Effects of speed and refrigerant charge on cooling capacity: (a) contour plot; (b) 3D contour plot.
Lubricants 10 00243 g007aLubricants 10 00243 g007b
Figure 8. Effects of speed and refrigerant charge on compressor work: (a) contour plot; (b) 3D contour plot.
Lubricants 10 00243 g008aLubricants 10 00243 g008b
Figure 9. Effects of speed and refrigerant charge on COP: (a) contour plot; (b) 3D contour plot.
Lubricants 10 00243 g009aLubricants 10 00243 g009b
Figure 10. Effects of speed and refrigerant charge on power consumption: (a) contour plot; (b) 3D contour plot.
Lubricants 10 00243 g010aLubricants 10 00243 g010b
Table 1. Previous studies on optimization method approaches in various applications.
Author (s)YearFields/Applications/SystemsOptimization Methods
Abhang and Hameedullah [12]2011EN31 steel turning processRSM
Barik and Mandel [15]2012EN31 steel turning processRSM
Krishankant et al. [16]2012EN34 steel turning processTaguchi Method
Makadia and Nanavati [13]2013EN31 steel turning processRSM
Rao and Venkatasubbaiah [17]2016Surface roughness in CNC turningTaguchi and ANOVA
Li et al. [18]2016CNC machiningTaguchi, RSM, and MOPSO
Costa and Garcia [7]2016Refrigeration systems RSM
Parpas et al. [19]2017Refrigeration systemsRSM
Gangil and Pradhan [14]2017Electrical discharge machining (EDM) processRSM
Parpas et al. [19]2017Air distribution and refrigeration systemsCFD/EES model
Belman-Flores et al. [20]2017Refrigeration systemsANN
Nataraj et al. [21]2018CNC turningRSM
Ocholi et al. [22]2018Sesame biolubricant pilot plantRSM
Mao et al. [23]2018Resident air-conditioning (TAC) systemsRSM
Redhwan et al. [24]2018AAC systemsRSM
Qader et al. [25]2018Solar air heatersRSM
Zendehboudi et al. [26]2019VCRSRSM
Canbolat et al. [27]2019Absorption refrigeration systemsTaguchi and ANOVA
Zaman [28]2019Photonic radiative coolersTaguchi
Vyas et al. [29]2019Capacity of lead acid batteryTaguchi
Huirem and Sahoo [30]2020Solar-Assisted Vapor Absorption Refrigeration Systems (SAVARS)RSM
Ahmed et al. [8]2021Refrigeration systemsMultiple Methods
Zawawi et al. [31]2022Automotive air-conditioning SystemsTaguchi
Table 2. Properties of nanoparticles [46,56].
PropertiesAl2O3SiO2
Molecular mass (g/mol)101.9660.08
Average particle diameter (nm)1330
Density (kg/m3)40002220
Thermal Conductivity (W/m.k)361.4
Specific heat (J/kg·K)773745
Table 3. Properties of PAG 46 lubricant [57].
PropertiesPAG 46
Density, g/cm3 @ 20 °C0.9954
Flash Point, °C174
Kinematic viscosity, cSt @ 40 °C41.4–50.6
Pour point, °C−51
Table 4. AAC system design parameter.
LevelA-Volume Concentration, φ (%)B-Compressor Speed (rpm)C-Refrigerant Charge (g)
−10.00590095
00.0251500125
10.0452100155
Table 5. The design of the experiment (DOE) and the results from the experiments.
φ (%)Speed (rpm)Refrigerant Charge (g)Cooling Capacity (kW)Compressor Work (kJ/kg)COPPower Consumption (kW)
0.005900950.66523.108.130.61
0.045900950.47724.807.650.59
0.0052100950.86039.204.721.07
0.0452100950.56843.104.311.06
0.0059001550.77719.709.160.68
0.0459001550.87320.208.660.73
0.00521001551.45232.205.151.42
0.04521001550.95434.504.871.34
0.00515001250.95632.806.060.94
0.04515001250.77033.305.620.89
0.0259001250.79721.908.520.60
0.02521001250.89137.354.811.08
0.0251500950.66733.005.490.71
0.02515001551.16826.606.270.89
0.02515001250.83231.005.850.85
0.02515001250.83231.005.850.85
0.02515001250.83231.005.850.85
0.02515001250.83231.005.850.85
0.02515001250.83231.005.850.85
0.02515001250.83231.005.850.85
Table 6. P-value and model summary statistics for cooling capacity.
Sourcep-ValueStd. DevR2Adj R2 (%)Pred R2 (%)Remark
Linear<0.00010.0970.80750.77140.5784suggested
2FI0.00760.0690.92070.88410.3576suggested
Quadratic0.75440.0750.92930.8656−0.1099not suggested
Qubic0.00880.0350.99050.9698−10.7188aliased
Table 7. ANOVA response for cooling capacity.
SourceSum of SquaresdfMean SquareF Valuep-Value
Model 0.7060.1725.16<0.0001significant
A0.1110.1123.620.0003
B0.1310.1326.840.0002
C0.3910.3981.94<0.0001
AB0.06110.06112.660.0035
AC7.849 × 10−417.849 × 10−40.160.6931
BC0.02810.0285.70.0325
Residual0.063134.819 × 10−3
Lack of fit0.06387.830 × 10−3
Pure error0.00050.000
R2 0.9207
Adj R2 0.8841
Pred R2 0.3576
Adeq Precision 21.986
Table 8. P-value and model summary statistics for compressor work.
Sourcep-ValueStd. DevR2Adj R2 (%)Pred R2 (%)Remark
Linear<0.00011.470.95200.94290.9133not suggested
2FI0.19471.370.96610.95050.8683not suggested
Quadratic<0.00010.390.99790.99610.9852suggested
Qubic0.03770.240.99950.99850.4299aliased
Table 9. ANOVA response for compressor work.
SourceSum of SquaresdfMean SquareF Valuep-Value
Model718.55979.84536.88<0.0001significant
A7.9217.9253.27<0.0001
B587.521587.523950.82<0.0001
C90.00190.00605.21<0.0001
AB2.0012.0013.450.0043
AC0.9810.986.590.0280
BC7.2217.2248.55<0.0001
A28.2518.2555.46<0.0001
B27.8817.8853.02<0.0001
C26.3416.3442.62<0.0001
Residual1.49100.15
Lack of fit1.4950.30
Pure error0.00050.000
R2 0.9979
Adj R2 0.9961
Pred R2 0.9822
Adeq Precision 84.751
Table 10. P-value and model summary statistics for COP.
Sourcep-ValueStd. DevR2Adj R2 (%)Pred R2 (%)Remark
Linear<0.00010.430.92360.90930.8706not suggested
2FI0.87000.460.92760.89410.5939not suggested
Quadratic<0.00010.0300.99980.99950.9974suggested
Qubic0.19510.0250.99990.99970.8774aliased
Table 11. ANOVA response for COP.
SourceSum of SquaresdfMean SquareF Valuep-Value
Model38.2194.254604.92<0.0001significant
A0.4510.45489.34<0.0001
B33.40133.4036228.04<0.0001
C1.4511.451570.68<0.0001
AB0.01010.01011.220.0074
AC1.886 × 10−311.886 × 10⁻³ 2.050.1831
BC0.1410.14149.91<0.0001
A26.006 × 10−316.006 × 10−36.510.0288
B21.6611.661798.26<0.0001
C23.415 × 10−413.415 × 10−40.370.5564
Residual9.220 × 10−3109.220 × 10−4
Lack of fit9.220 × 10−351.844 × 10⁻³
Pure error0.00050.000
R2 0.9998
Adj R2 0.9995
Pred R2 0.9974
Adeq Precision 225.476
Table 12. P-value and model summary statistics for power consumption.
Sourcep-ValueStd. DevR2Adj R2 (%)Pred R2 (%)Remark
Linear<0.00010.0240.95560.94730.9230suggested
2FI0.57460.0250.96170.94400.8285not suggested
Quadratic0.00060.0120.99270.98620.9181suggested
Qubic0.31240.0110.99640.9885−3.4727aliased
Table 13. ANOVA response for power consumption.
SourceSum of SquaresdfMean SquareF Valuep-Value
Model0.2190.023151.49<0.0001significant
A6.882 × 10−516.882 × 10−50.450.005179
B0.1810.181176.19<0.0001
C0.02110.021135.83<0.0001
AB2.977 × 10−412.977 × 10−41.940.1935
AC5.249 × 10−515.249 × 10−50.340.5713
BC9.312 × 10−419.312 × 10−46.080.0334
A25.971 × 10−315.971 × 10−338.97<0.0001
B22.481 × 10−412.481 × 10−41.620.2320
C25.313 × 10−415.313 × 10−43.470.0922
Residual1.532 × 10−3101.532 × 10−41.532 × 10⁻³
Lack of fit1.532 × 10−353.064 × 10−41.532 × 10−3
Pure error0.00050.0000.000
R2 0.9927
Adj R2 0.9862
Pred R2 0.9181
Adeq precision 41.908
Table 14. Optimum operating condition.
ParameterOptimum Operating Condition
A—Volume Concentration, φ (%)0.019
B—Compressor Speed (rpm)900
C—Initial Refrigerant Charge (g)155
Table 15. Validation Results.
No.Responses
Cooling CapacityCompressor WorkCOPPower Consumption
Pred.Exp.%Pred.Exp.%Pred.Exp.%Pred.Exp.%
10.9350.9764.2319.2319.61.899.059.343.100.6210.6504.43
20.8974.2318.63.399.878.310.6555.23
30.8687.7319.93.379.191.520.6565.33
40.9875.2719.30.369.474.440.6747.86
50.8746.9321.39.728.555.850.6717.38
Avg 5.68 3.74 4.64 6.05
Publisher’s Note: MDPI stays neutral with regard to jurisdictional claims in published maps and institutional affiliations.

