


Modelling a Logistics and Financial Supply Chain Network during the COVID-19 Era
by
 , , and
Sina Abbasi
1,
Ilias Vlachos
2,*,
Ali Samadzadeh
3,
Shayan Etemadifar
4 ,
,
Mohamad Afshar
5 and
Mohsen Amra
3
1
Department of Industrial Engineering, Lahijan Branch, Islamic Azad University, Lahijan 1616, Iran
2
Excelia Business School, CERIIM, Excelia Group, 17000 La Rochelle, France
3
Department of Industrial Engineering, South Tehran Branch, Islamic Azad University, Tehran 1343864331, Iran
4
Department of Industrial Engineering and Management Systems, Amirkabir University of Technology, Tehran 1343864331, Iran
5
Department of Industrial Engineering, Central Tehran Branch, Islamic Azad University, Tehran 1343864331, Iran
*
Author to whom correspondence should be addressed.
Logistics 2024, 8(1), 32; https://doi.org/10.3390/logistics8010032
Submission received: 23 November 2023
/
Revised: 24 February 2024
/
Accepted: 28 February 2024
/
Published: 19 March 2024
(This article belongs to the Special Issue Multi-Criteria Decision-Making and Its Application in Sustainable Smart Logistics)
Abstract
:Background: Supply chain networks (SCNs) have been interrupted by the COVID-19 pandemic, leaving them open to financial losses. SCs have been impacted by the pandemic, necessitating the adoption of sustainable practices and dynamic capacities to ensure resilience and performance. Several studies have focused on this subject, offering insights into the importance of sustainable supply-chain management, corporate governance, big data management activities, and digital technology in minimising the consequences of the pandemic and fostering sustainability. Methods: This study suggests an analytical framework for assessing environmentally friendly procedures and dynamic capacities to assure performance in a disruptive environment. Results: The following are some of the important details and contributions in this article: (1) developed a conceptual framework for assessing dynamic capacities and sustainable behaviours considering COVID-19, (2) concentrates on financial ratios during COVID-19, and (3) established drivers for sustainable practices and competencies during disruption and unpredictable business settings. Conclusions: The suggested model can assist practitioners in creating and implementing sustainable supply chain (SC) activities and tracking and assessing their effects on the sustainability of businesses. So, the proposed model can assist managers in creating and implementing sustainable supply-chain activities and tracking and analysing their effects on the sustainability of businesses.
1. Introduction
During COVID-19, financial supply-chain management and logistics faced various difficulties. The epidemic has caused supply-chain disruptions, leading to a resurgence of transportation and logistics modalities and a shift in supplier and customer mind-sets [1]. In the dietary supplement sector, small- and medium-sized businesses (SMEs) have to deal with risks related to supply, demand, operations, logistics, and finances [2]. The epidemic has had a major impact on the logistics and transportation industries, affecting customer satisfaction and the ongoing supply of commodities [3].
The COVID-19 pandemic has exposed vulnerabilities in public health infrastructure and supply-chain management systems [4,5]. In particular, the global spread of the virus and subsequent disruptions to transcontinental supply chains have resulted in shortages of raw materials, manufacturing and shipping delays, and the separation of people early in the pandemic [6]. The crisis presents several challenges for supply chains and logistics financial management, including disruptions to manufacturing and distribution networks and shifts in supply and demand that impact profitability and cash flow. Robust and flexible supply-chain networks that can adapt to unforeseen disruptions are needed to meet these challenges [7].
In the past, the variety and volume of goods and services were more limited, and there was less separation between producers and consumers. Thus, the distribution of commodities received less attention since shopkeepers could readily access needed inventory. However, managing appropriate production and distribution systems has become more critical in the modern era, given the diversity of items, the number of customers, and their distance from manufacturers. Additionally, as market competition intensifies, businesses strive harder to secure a stronger positioning. As a result, outperforming and differentiating from rivals is a key goal [8].
Due to intense modern-day competition, managers and leaders of enterprises and organizations leverage contemporary science and technology to gain a larger market share [9]. Raising efficiency and reducing expenses have emerged as two critical elements. This drove the development of supply-chain management techniques, compelling businesses to adopt and integrate these strategies within their organizational structures. In summary, factories aim to apply and optimized SC flows in the workplace to boost productivity.
The COVID-19 pandemic has severely disrupted global supply networks and the international movement of goods and services. The crisis highlighted the need for resilient and flexible supply-chain networks to respond to unforeseen disruptions [10]. This research presents a financial and logistics supply-chain network model that considers the challenges posed by the COVID-19 pandemic.
This paper considers how the pandemic may affect S.C. activities, including manufacturing, distribution, and transportation delays. We also examine the pandemic’s financial effects, including how it will affect cash and physical flow. In the COVID-19 age, our model offers decision makers a framework to assess the effects of various scenarios and make well-informed decisions to improve their SCN.
The purpose of this study is to examine the topic of financial and material flow in the supply chain during the COVID-19 epidemic. Research-associated financial supply chains are relatively low and not regarded with material flow during the current epidemic. Thus, this problem represents a void in supply-chain studies.
The remainder of the paper is structured as follows: In Section 2, the literature on supply-chain management during pandemics is reviewed; in Section 3, the problem is described; in Section 4, the computational experiment results are presented; in Section 5, the sensitivity analysis is defined; and in Section 6, management insights and the implications of our findings are covered. A discussion of the findings, restrictions, and recommendations for further study is included in Section 7.
2. Literature Review
The prior research is categorised into two primary groups in this section. The bulk of the earlier research falls under the first group, which deals with the material flow of the supply chain. The second area, which is quite narrow, is investigations on the supply chain’s financial flow.
2.1. SCN Considering Material Flow
Businesses seek ways to provide them a competitive advantage over rivals in global marketplaces. Utilising economic order value methodologies, Sharma et al. [11] suggested a deterministic mixed integer non-linear programming (MINLP) problem. They broadened the policy of adequate resource allocation in their study. Through the model’s goal function, the profits were maximised after paying taxes for the manufacturing and distribution infrastructure. In addition, consideration was given to raw material needs, fixed logistic constraints, managerial constraints, and appropriate allocation.
An objective model for making a two-level distribution network that considers consumers, distribution channels, and manufacturing plants was presented by [12] in research. This research provides a crucial improvement in the literature by considering the unpredictability of consumer preferences and the use of modes of transport vehicles among chain layers. The study also considers cost minimisation and excellent client service, taking full advantage of the chain’s performance standards.
In different research, Müller and Fransoo [13] developed a model for planning the manufacturing supply chain for commands. The model determines the distribution centres’ locations and which retailer is assigned to which centre. The demand is based on the progress time and how well they match the logistical expenses. Lagrange-based algorithms were suggested as solutions to this problem since it is hard to find a precise solution.
Bidhandi et al. [14] suggested a different method for expressing industrial network design issues. Features like product structure, manufacturing procedure, multi-commodity, and multiechelon were considered characteristics of the environment under study. They also said that possibilistic theory incorporates uncertainty elements into the model. Moreover, their study did not incorporate any financial concerns.
To create a multilevel, multiproduct supply chain that considers timing disparities for tactical and strategic choices, Baud-Lavigne et al. [15] presented a model. The suggested approach expands the chain in exchange for the accrued total profit and assets gained from outside sources. This model took into account a variety of attributes, including the lowest and highest average rates of facility usage and using both rental and public storage. Furthermore, a technique based on Lagrange’s relaxation method is created for resolving it.
In the research, Khalilabadi et al. [16] examined a chain in which the manufacturer set the product’s pricing and the supply chain’s layout to optimise the predicted output, given the likely price-based demand. To address it, they suggested using L-shaped decomposition, a marketing technique, and demonstrated that the initial issue still falls under the category of planning issues. Furthermore, the price choice harmonised the projected earnings and the anticipated operating cost by raising the predicted profits. The instance indicates that when price and operational planning are integrated, predicted earnings are higher than when choices are made separately.
After researching and contrasting SC’s current supply, manufacturing, and distribution models, Lin et al. [17] developed a model incorporating supply-chain management (SCM) requirements. They provide a novel approach to computing the genetic algorithm’s (GA) fitness function. This study also modelled the company’s SC operations and identified the best operational and tactical guidelines for a successful SC method. This model’s outcome demonstrates its robustness. With minor adjustments, this model may also be used in various industrial settings.
They are establishing an adequate SC due to the enormous work toward improving efficiency and lowering related costs. Researchers have employed heuristic algorithms or mathematical programming to address the complex issue of supply chains. Creating decision-making frameworks, cosnsidering the various interests of several supply-chain participants, is difficult in global supply-chain management. Much work has gone into creating decision models for SC. issues by Ivanov et al. [18]. The challenge was solved by Ivanov et al. [19] by utilising integer and multiobjective programming for a two-echelon factory–warehousing complex. Hosseini et al. [20] solved the supply-chain network design problem by implementing performance-based strategic resource allocation. Sawik et al. [21] employed simulated annealing and Lagrangian relaxation, a meta-heuristic technique, to optimise costs in a multiechelon supply-chain network setting. Scholars and practitioners alike have expressed great interest in the challenges of concurrently integrating production and distribution systems in a multiobjective supply chain [22].
Shaheen et al. [23] suggested a deterministic, mixed integer, nonlinear programming approach with economic order quantity. The model’s output offers a worldwide resource deployment strategy for the client zones, distribution centres, and manufacturers.
Dubey et al. implemented a nonlinear multiobjective mathematical model for supply-chain networks [24]. Ivanov [25] suggested entropy-based analysis, quantification, and maximum entropy to solve the linear function issue. Interactive techniques for mixed integer and multiobjective integer programming were discussed by Vlachos et al. [26]. The multiobjective home health care scheduling and routing with sharing service were designed by Fu et al. [27] using an artificial bee colony algorithm based on problem-specific knowledge. Song et al. [28] created a modularised design strategy for smart warehouses based on digital twins. Using a bipopulation evolutionary algorithm, a dual-objective stochastic hybrid flow shop was programmed with degrading workloads [29]. A fuzzy multiobjective linear programming model that uses a piecewise linear membership function was created by Vlachos et al. [30].
2.2. SCN Considering the Financial Flow
Researchers have not given the financial flow of the supply chain much thought up to now. Thus, it is challenging to categorise the literature on the financial flow of the supply chain because academics are divided on this matter. The earlier research on this topic is summarised in the following sections [31].
Chen et al. [32] address the broad and comparatively thorough descriptions of key financial supply-chain management ideas. To provide a thorough and understandable background, the authors of this study attempt to define and explain terms related to the financial supply chain, cash leadership, order–payment cycles, purchase–payment cycles, and the monetary supply chain. The findings of database searches and management interviews conducted in small- and medium-sized construction enterprises in Slovakia and the Netherlands are reported later in the research.
According to Abbasi et al. [33], the primary goal of supply-chain management (SCM) has been efficiently managing the flows across intricate networks of suppliers, manufacturers, and customers for years of research. To address the trade-offs between financial and environmental concerns and lessen the detrimental effects that rising industrialisation has on the environment, they suggested a new green supply chain (GSC) design strategy.
Priya et al. [34] assessed the financial support of a supply chain that included a seller and a manufacturer using a restricted amount of money given by a lending financial organisation. The model was tested in two different situations in their study. (1) The financial institution is aware of the relationship (referred to as a collaborative venture) between the seller and the manufacturer, and (2) the link is unknown to the financial institution. Using numerical studies and mathematical evidence, it is later demonstrated in the research that joint ventures would improve the mobility of the three chain participants when the beginning capital of the maker and seller is modest. One of the first studies in the field of supply-chain network design to take the financial elements into account in the event of uncertainty is the one conducted by [35].
This study aimed to increase the chain’s economic value proposition. The problem’s variables are the distribution of a four-tier supply chain and the locations of the storage spaces. The scenario-based approach is utilised to express the degree of uncertainty in the programming model, which is the mixed-integer linear programming (MILP) method. The authors solve the problem using normal branch and bound techniques [36]. Adjei-Boateng et al. [37] marked most of the organisation’s liquidity by consulting the literature on inventories. Stated differently, the organisation’s cash input and output flows are analogous to its final product’s flow. One of the most recent research projects integrating inventory and financial principles was provided by Altabsh and Almaktoom [38]. Therefore, much like the amount of cash accessible inside the company, the level of liquidity needs to be at its ideal level.
The writers simulate the reduction of overall expenses in a three-tier supply chain comprising producers, retailers, and financial institutions. These expenses consist of financial charges for the bank, supplier, and seller and include, among other things, the expenses associated with purchases and orders, inventories, storage, borrowings, financial transactions, opportunities, and capital constraints [39]. The research suggested by Liu et al. [40] for designing the SCN concept, by taking unpredictable requests keeping in mind and including financial difficulties like financial ratios, broadens the scope of existing models.
Additionally, Abbasi et al. [41] assessed the issue of utilising cash management integration to identify ideal operations. They view the issue as nonlinear and suggest a method for locating the best answer during COVID-19. Yan et al. [42] asserted that cooperative financing of investments by supply-chain participants is permitted under the joint economic lot size model. They assume that the vendor can invest in raising its production rate and keep in mind a two-stage supply chain with a single vendor and one buyer. However, the outcome of these efforts to increase production capacities is unknown and depends on the likelihood that the investment will succeed. The buyer and seller may split the risk of the unknown result and the investment due to their differing financial availability, which can benefit both. The research above is used in this study to identify the target function of the financial flow and financial elements [7,43].
2.3. SCN during the COVID-19 Pandemic
In 2020, there were significant disruptions to the supply chain, forcing numerous firms to suspend operations temporarily. It has a significant influence even on the global air transportation network, according to reports by Ivanov and Dolgui (2020) [18]. Demand has changed significantly as a result of lockdowns in some nations. The situation was generally complicated, making it hard to forecast how the illness would spread in the future or when new medications and vaccinations would be developed to treat it. Furthermore, there were still a lot of manufacturing and distribution difficulties, since the S.C.’s internationalisation may have had negative effects [8]. Every business experienced the COVID-19 lockout differently. A few businesses have had difficulties and have even filed for bankruptcy [44]. Many bankruptcies have resulted from the COVID-19 pandemic [8]. The businesses on the list cannot adapt to extended outages and shifts in customer demand [18]. Ivanov [45] talked about how COVID-19 has affected the SC. generally globally. Many scholars have also examined how the COVID-19 lockout affected supply networks, as seen in the following instances. According to the findings, businesses with various supply sources have experienced less disruption and have made more money than comparable businesses with a restricted supplier base. In addition to monitoring their social media accounts, Sarraf et al. [46] performed qualitative interviews with representatives of small Polish businesses. Their study aimed to evaluate the interactions between businesses during the COVID-19 epidemic. If the agreements that the partners signed may be changed, the outcomes point to a benefit. Furthermore, the findings indicate a detrimental impact in the event of debt with key firms.
Wang et al. [47] examined unexpected surges in demand and strategies for handling them, citing the surge in home-delivery requests amid the COVID-19 epidemic as an example. At the conclusion, they offered solution models. Other writers looked at how the COVID-19 shutdown affected certain goods and services offered by SCs, like the one below. Akram et al. [48] have been simulating the distinct effects of the COVID-19 pandemic on the supply of neodymium, iron, and boron magnets. They created a two-stage stochastic programming model limited by opportunities to optimise profit and protect the network from disruption threats. Gonzalez et al. [49] concentrated on the issue of patients’ access to plasma during the COVID-19 epidemic.
Burgos and Ivanov [50] examined retail food SC conditions in Germany during the COVID-19 epidemic. Consequently, they created a discrete-event simulation model to investigate the mechanisms and their dynamics in S.C.s. It showed exceptional adaptability in providing and selling retail food items during turbulent times, even during lockdowns. They also observed that while transportation delays had a minimal influence, sudden jumps in demand had the greatest impact. Lastly, the impact of the COVID-19 pandemic on poultry SCs was covered [51].
2.4. Research-Gap Analysis and Contributions
As the literature review states, most of the earlier research focuses on the material flow of supply chains and networks of multiproduct and multilevel supply chains that aim to achieve certain goals like cost reduction or profit maximisation during the COVID-19 era. However, not much study has been done in the field of financial flow, and the majority of papers in this field focus on financing and economic value chain optimisation. Much research ignores financial aspects like interest rates and asset liability; interest plays a crucial role in a company’s revenue and is crucial for meaningful analysis to provide meaningful conclusions.
The relationships between suppliers, manufacturers, distributors, and retailers from the supply chain make it easier to transform raw materials into finished goods. The reciprocal effects between these participants are part of the supply chain. The three main tiers of the supply chain are typically distributor, producer, and supplier. These levels may be expanded to accommodate more merchants, storage, and financial intermediaries, among other elements. Any of these layers may contain one or more completely independent units. For instance, several distinct facilities supply different components and components that come together to form a single product at the supplier level. The relationships, exchanges, and reciprocal effects between different supply-chain participants are referred to by academics and researchers as the flow, which they categorise into three primary domains: (1) material or physical flow, (2) information flow, and (3) financial flow. The tangible and observable goods, parts, and shipments transferred across the chain’s members and levels are referred to as material flow. Physical flow, which represents the process of transforming raw materials into the finished product that the client requires, is always the most visible flow throughout the chain. The physical flow from the supplier to the final client is often one way.
The money exchanges between the network’s participating businesses are a significant supply-chain issue. Manufacturers, distributors, wholesalers, carriers, merchants, banks, credit associations, and others are among these people and large raw-material suppliers. Generally speaking, money flows upstream while materials, components, and goods flow downstream. As a result, controlling the cash flow upstream in a supply-chain system is just as crucial as controlling the flow of commodities and products downstream. The upstream money flow and the downstream flow of products vary fundamentally. While holding money will result in gains in the upstream financial flow, keeping items and materials will raise inventory costs in the downstream flow.
This problem relates to the kinds of relationships and data that enterprises and other SC participants have.
This flow begins the instant of consumer requests or even sooner if the demand in the market and the order are anticipated. Bidirectional feedback travels up the chain in both directions.
3. Statement of the Problem
Multinational and international firms must evaluate and shape their production techniques and delivery frameworks in today’s expanding global marketplace to reduce costs, maximise net profit, and shorten delivery times. To achieve greater consistency between the suggested models and the real-world events, it appears important to consider every aspect impacting the chain under these circumstances.
One of the things that ties different organisational components together is transportation, often known as the combined production and distribution system. The following are some of the organisation’s logistical components:
- Supplier;
- Manufacturers;
- Distribution centres;
- Customer centres.
In today’s competitive climate, the effective and efficient transportation of goods from the raw-material locations to the production and assembly factories, distribution hubs, merchants, and customers has become increasingly important. For many private and public firms, facility location decisions are crucial to their strategic planning. Furthermore, tactical choices like arranging the flow of products, organising the production process, and figuring out how much inventory to keep in storage are all crucial.
Current research aims to offer a combined model incorporating several decisions at different levels to construct a multilevel supply chain. However, as previously stated, the supply chain encompasses the movement of goods and production and the falls. The suggested model generally considers production and financial flows in addition to decision integration. By taking into account several variables, this model will incorporate financial flows. It will then assess the link between manufacturing and financial flows and the impact of these flows on other chain choices and activities.
It is important to note that the flows in the aforementioned financial method are regarded as financial flows after the money is obtained or the transaction is made rather than accounting flows. Additionally, portability cannot always be positioned as the desired function since, while it could optimise the management of the company’s profitability, doing so would put the business in undue danger. As a result, the model’s target function will be equity changes, represented by the financial method used in this investigation. Several theories have been proposed to explain variations in equity; the idea of property is applied in this research.
3.1. Assumptions for the Problem
To sum up, the suggested study fills in certain gaps in the literature and classifies innovation into the following groups:
- The model considers the number of located and no located layers as the supplier and consumer centres;
- Formulating the assumptions prevents material and product flow across facilities in a single layer. Additionally, each facility will have equal input and output flows in and out;
- The product flow that enters every facility at every supply-chain tier is limited by its operational capacity;
- The chain will be subject to the effective presence of money flows, constraining the production flows and other network decisions.
- There are cash and financial constraints in this model, making these flows inseparable from manufacturing flows; this allows decisions regarding input and output monetary moves to be made in every phase by considering a set of variables.
3.2. The Proposed Model
The study’s model is an absolute single-product multiperiod model with fixed parameters. Additionally, the distributors charge varying rates for their items to clients at different times. Figure 1 shows the framework for the supply-chain network. This image illustrates the relationships and connections that exist between suppliers and customers through several tiers of intermediaries, such as storage facilities, distributors, and factories.
The supply chain proposed in this research works in such a way that it delivers the raw materials prepared through the suppliers to the factories. The production process is done in manufacturing, and they are sent to distribution centres. Distribution centres are responsible for storing goods and delivering them to the customers. In this research, two physical and financial factors have been considered during the COVID-19 era.
3.3. Formulation of Problem
The material flow in this network is limited to two successive network layer levels. Furthermore, there is no communication between the layers’ facilities. The suggested model is a multiperiod supply-chain design model for a single product that accounts for facility integration. This model takes into account the network’s finance flows in addition to product flows. First, we talk about the logistical limitations. Next, the limitations related to money will be examined. Table A1, Table A2, Table A3, Table A4 and Table A5 contain (Appendix A) basic information for problem modelling.
At this stage, the study’s modelling will be completed. The logistical and financial constraints are then combined, and lastly, the intended roles of material flow and money flow in the supply chain will be covered. In “Appendix A” the sets, parameters, variables, and Greek letters in the S.C. model are explained. The parameters and variables included physical and financial parameters and the decision and binary variables.
3.4. Objective Functions (OFs) and Constraints
The objective functions (OF) are specified mathematically in Equations (1) and (2). The second Equation consists of two parts (2a,2b). The first OF (Maximize Profit) has to do with material flow. The goal should be to maximise earnings. Profit, as can be observed, is the difference between the cash flow from sales of the items and the cash flow from production, shipping, inventory processing, and raw-material expenses. The second OF has to do with money movement (ΔE). The changes in equity are the OF in the financial flow. Using this OF helps us to:
- i.
- Calculate all the short-term and long-term liabilities during the COVID-19 pandemic;
- ii.
- Calculate all the short-term and long-term assets during the COVID-19 pandemic;
- iii.
- Establish an optimal OF between the liabilities and the assets of the company in a way that changes in equity can be maximised during the COVID-19 pandemic.
This is subject to:
According to Equation (3), the total goods that flow into the plant from all suppliers are equal to the total products that flow out of the plant to the distribution and storage centres for each machine and each time.
Equation (4) demonstrates that the total product flows from a plant’s storage to all its distribution centres, plus the residual inventory is equal for every plant and every period. It also shows that the total product flows from a plant’s storage to the inventory left over from the previous period.
The goods that flow from all of the plant’s inventory and equipment to the distribution centre for each distribution centre are identical to the product flows from the distribution centre to all of its customers, as demonstrated by Equation (5).
Equation (6) demonstrates the need to satisfy the customer’s requests each time.
Equation (7) demonstrates that the total product flows from each supplier to all of the machinery cannot be greater than the supplier’s capacity for each supplier and each time.
Equation (8) demonstrates that the total product flows from the plant to the storage facilities and distribution hubs cannot exceed the production capacity.
The plant’s inventory capacity for each time is displayed in Equation (9). The entire input flow into each distribution centre cannot be more than the matching equipment’s capacity, as demonstrated by Equation (10).
Equations (11)–(13) demonstrate that equipment installations cannot be stopped.
The cash in each period, according to Equation (14), is equal to the cash in the previous period (), exogenous cash from the sale of goods, fixed assets, and accounts obtained as collateral (), net cash from loans or credit card deposits (), net cash from stock trades (), payments for materials, travel, and manufacturing expenses incurred during earlier periods on the plant (, , , ), dividends (), as well as net funds from other sources.
According to Equation (15), the total amount of receivable accounts that correspond to the t − tdel time and have a deadline in period t less the total amount of receivable accounts that were secured in the time from t − tdel to t − tdel − 1, which is part of the t − tdel period, plus the cash received from the security of receivable accounts of the t − tdel + 1 period, which have a deadline in time t, represents the exogenous cash in each time the financial source known as securities are based on transferring accounts receivable from one creditor to another. Securities are only employed when we cannot get further bank financing. Merely 80% of the total amount owed will have a deadline within the same time frame if our future accounts receivable is secured.
According to Equation (16), the entire amount of receivable accounts in time t cannot be more than that of time t, which has been secured from period t to time t − tdel + 1.
According to Equation (17), the sum of credit in a given period is determined by the credit in the preceding period, the amount borrowed for capital supply in period t, the amount of cash redeposited into the credit account, and the interest on the credit from the previous period.
The net liquidity acquired from funding expenses and reimbursements in period t is shown in Equation (18).
In addition to securities, another funding source might be a bank loan taken out at the start of the term, with the interest rate (θ) decided upon between the bank and the firm. In this scenario, the bank will compel the business to restrict its cash receipts from the bank to the maximum amount (MXC) and a minimum amount (MIC). This cash requirement and the maximum credit amount agreed upon with the bank are specified in Equations (19) and (20).
Equation (21) states that the total amount of funds received from the initial marketable share portfolio, less the funds invested as securities in the most recent period, the proceeds from the sale of marketable securities in the most recent period, and all of the funds obtained in the most recent time frame from assets invested with the investing coefficient of () minus the proceeds from the sale of resources with the coefficient of () in previous periods, which time limit is the period in question, constitute the cash related to securities in each period.
According to Equation (22), the total amount of shares sold in earlier periods whose deadline falls within the current period cannot, in any given period, exceed the cash received from both the initial marketable share portfolio and the cash received from investing the marketable shares from earlier periods.
Equations (23)–(26) indicate raw-material costs, manufacturing, processing, and transportation expenses. The technical coefficients (,,,) are added to the limits in order to determine the associated levels indicating whether our financial information payable is delayed or paid on time because it may be on time or late. Discounts are presumed to be earned if payments are made on time; discounts are not guaranteed elsewhere.
Equations (27)–(30) describe the material, manufacturing, processing, transfer, installation facility, and inventory expenses that must be calculated to get the cash output flows needed to compute the profits and changes in equity. Equation (31) demonstrates that the accounts receivable for each period equal the total amount of items sold to customers during that same time.
4. Computational Experiment
4.1. Input Parameters
This study aims to maximise changes in equity throughout COVID-19 while also increasing earnings. The chosen model is optimised based on the specified parameters and the variables and constraints that have been addressed. We utilise Lingo 19 software (version 19) to solve the mixed-integer linear programming (MILP) model. In addition to applying the model, the outcomes will be contrasted after being presented from a material flow perspective without taking the financial flow into account and from a financial perspective.
To solve the extra parameters provided in each model, a laptop equipped with an Intel Core i7 CPU clocked at 2.40 GHz and 8.0 GB of RAM (Intel Corporation, Santa Clara, CA, USA) was employed, and Lingo19 was employed to solve the model itself. Table A6 (see Appendix A) displays the model’s random parameters.
Additionally, the best course of action among the chosen decision factors will be suggested, and we will talk about which strategy might yield more superior and agreeable outcomes. Table 1 illustrates the supply chain’s financial flow. Figure 2 shows the results achieved from the model. This harmony among physical and financial flows gives us acceptable results and enables decision makers to use the financial and material flows in the supply chain to achieve superior and more respectable outcomes, significantly boosting the plant’s efficiency. It is also important to note that long-term responsibilities are not considered in this study.
4.2. Case Study
A case study in Iran has been adjusted and used to evaluate the model’s results. The model’s accuracy and usefulness are assessed using case study data. The facilities, based on this report, consist of one supplier (|s| = 1), four manufacturers (|p| = 4), three distribution centres (|d| = 3), and two customer centres (|c| = 2) in two periods of time (|t| = 2). In general, Figure 3 shows the schematic of the real case study for the proposed model (look at Appendix A)
During the COVID-19 epidemic, analysts utilise financial measures to assess a company’s financial health. Financial ratios are a fairly easy way to quickly and readily cast light on certain essential information regarding a company’s financial state and operational outcomes. Thus, various ratios may be examined while considering the goal and the applications. Examining and calculating the final ratio can reveal the efficiency of the study model. Conversely, it can aid in evaluating the business’s financial records. The model’s effectiveness is presented and contrasted with the fluctuating quantity of cash in the receiving account by computing the financial ratio detailed below. Figure 4 shows the results obtained from the model during COVID-19 with a real case by comparing the results obtained.
5. Sensitivity Analysis
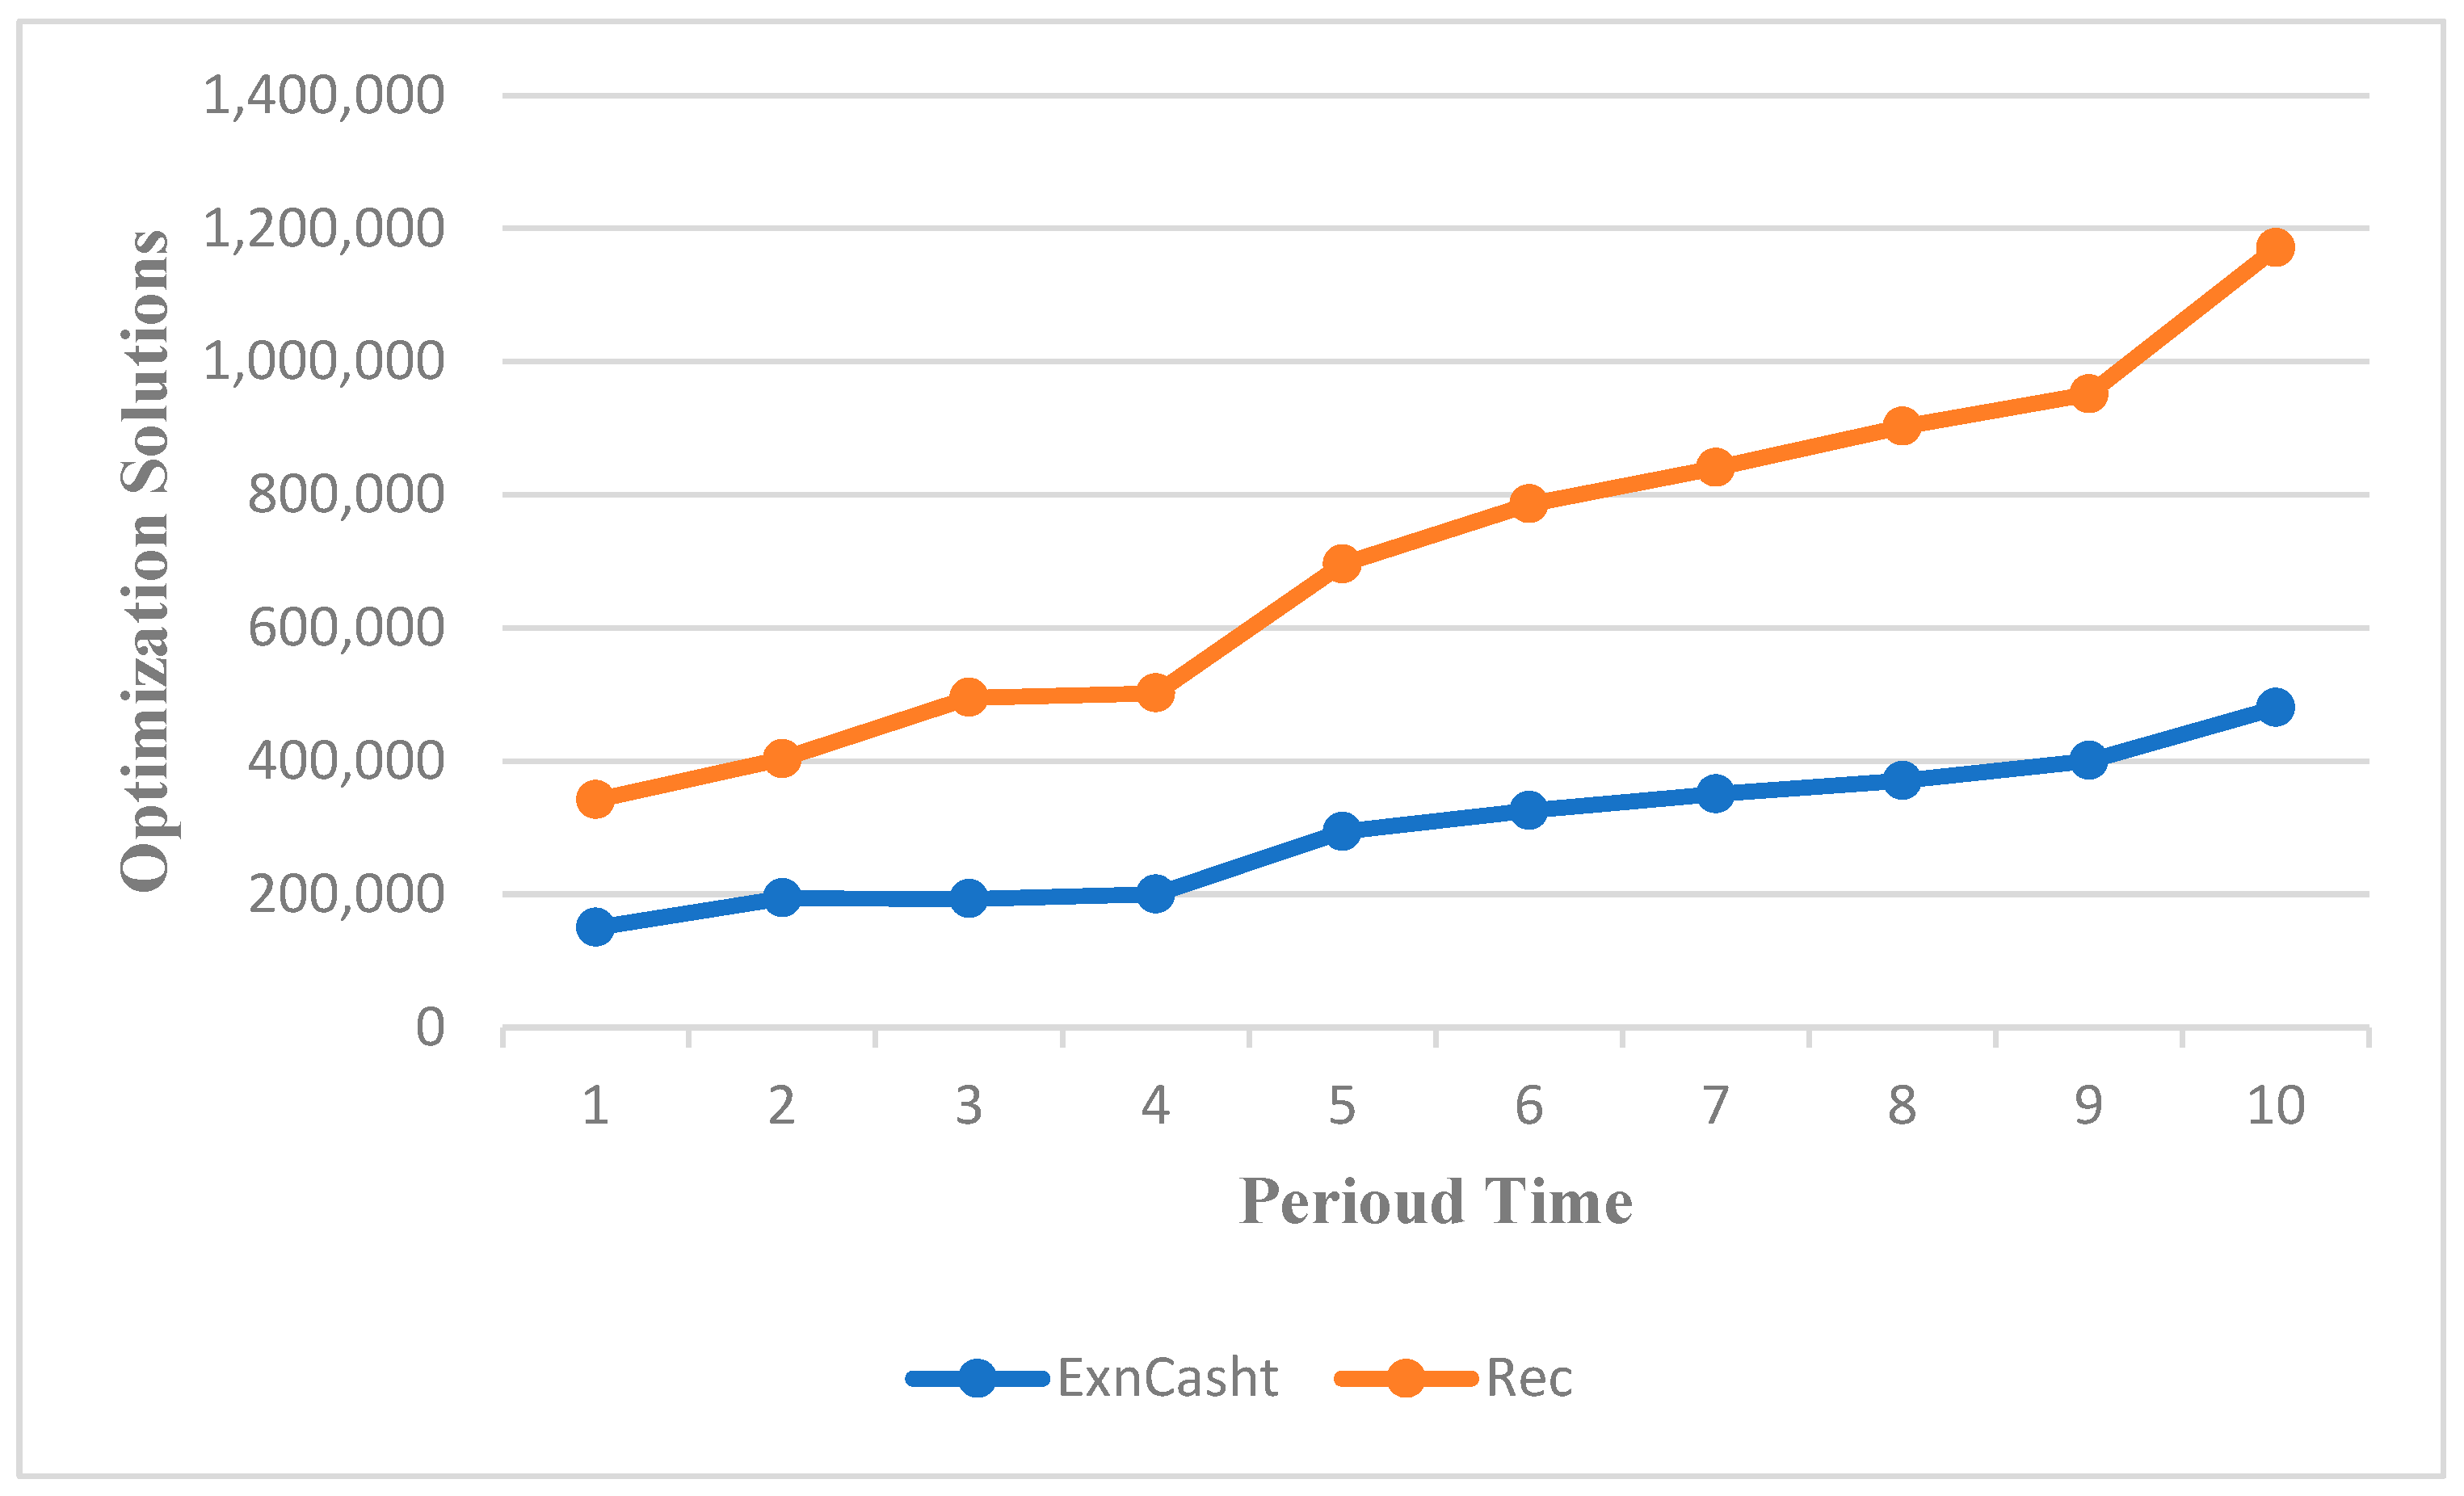
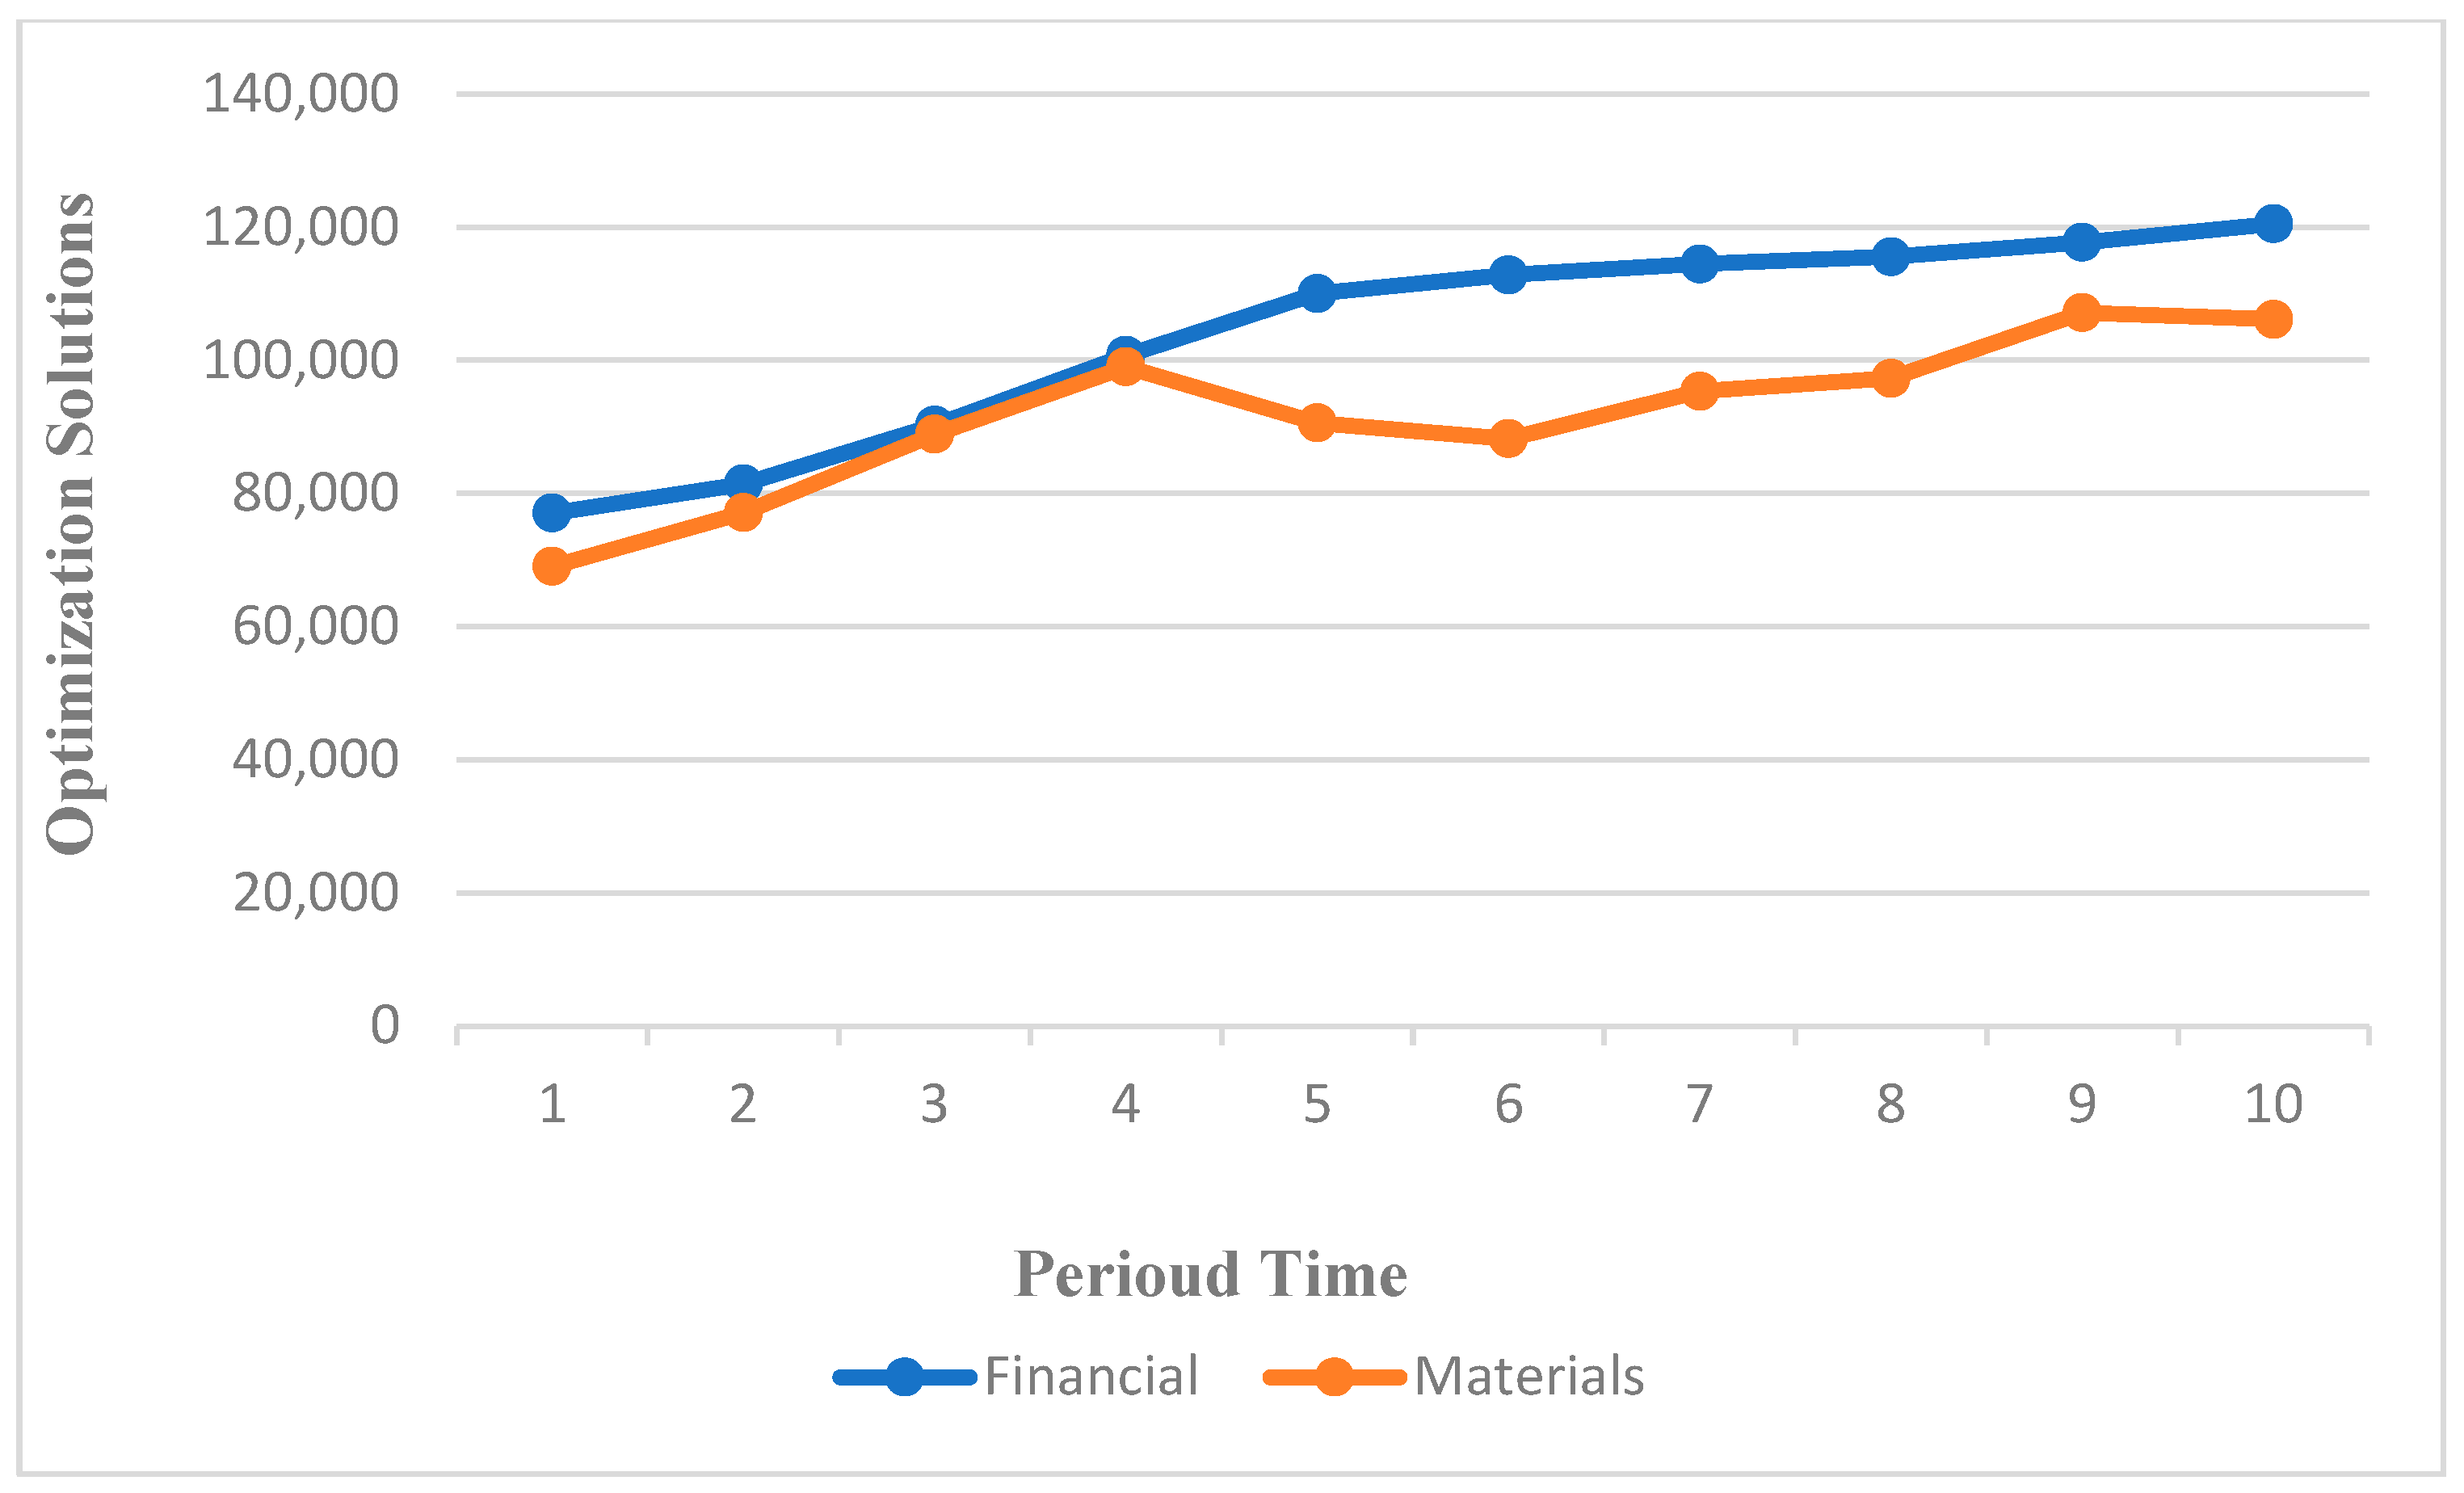
We now assess the exogenous cash and accounts receivable. It is evident from Table 2 and Table 3 that there is a clear correlation between these two variables. Put another way, the company’s exogenous liquidity can serve as evidence of the suggested model’s correctness if it has a bigger accounts receivable, which includes sales of securities or finished goods. Table 2 shows the pattern of shifts in receivables accounts and incoming cash throughout the COVID-19 period, and Table 3 illustrates all the liabilities for material and financial flows during the COVID-19 period.
Figure 5 illustrates how the liability in the financial flow mode varies somewhat and is larger for each period than the material flow. Figure 6 shows the pattern of variations in receivables and exogenous cash. On the contrary, exogenous cash entered the company through the sale of investments or the acquisition of a bank loan, which can increase the company’s liquidity so that it can carry out its obligations; this is the reason why the cash amount in financial flow is higher than that of material ow. Analysts use financial ratios to assess a company’s financial situation. Financial ratios may readily illuminate key details of an organisation’s financial situation and operational outcomes. Thus, various ratios may be examined while considering the goal and the applications. Examining and computing financial ratios can reveal whether or not the research model is effective. Conversely, however, it might aid in evaluating the business’s financial records. By computing the financial ratios shown below, one may assess the model’s effectiveness and contrast how the quantity of cash changes in the received account.
6. Insight for Managers
- Managers coping with supply-chain interruptions during the COVID-19 outbreak found useful information from this search;
- Due to labour shortages, travel limitations, and other circumstances, the COVID-19 pandemic has caused disruptions in supply-chain networks;
- Research trends and possibilities may be found, and there is an analysis of the impacts of COVID-19 on supply chains using text analytics;
- During the pandemic, supply-chain networks may be examined to examine the effects of reduced product demand and material supply using underload cascading failure models;
- Based on these results, managers should consider introducing supply-chain management techniques, utilising A.I. and ML to reduce disruptions, and using text analytics to assess how COVID-19 will affect their supply chains;
- By employing underload cascading failure models, they may investigate how reduced supply and demand affect their supply-chain networks;
- Managers should consider exchanges and interactions between different supply-chain participants in the material or physical flow, information flow, and financial flow of goods;
- Managers should consider the effects of the coronavirus epidemic on money exchanges between businesses participating in a financial network;
- Managers should consider the effects of upstream cash-flow controls in a supply-chain system as much as downstream product flow controls.
7. Conclusions, Limitations and Recommendations for Future Works
7.1. Result and Finding
This research assesses the two primary supply-chain flows that support a company’s capacity to relocate and models these two flows using an integration approach for COVID-19. The aim of the current study is changes in equity, and it is creative since it considers financial aspects, including interest rates. Variables include loans taken out, receivables, and short- and long-term assets and liabilities. However, one more of the study’s breakthroughs is integrating these variables and logistical constraints. In this analysis of the supply chain’s material flow, we optimised the company’s portability due to the discrepancy between sales and chain expenses, raising the chain’s productivity during the COVID-19 epidemic.
The supply chain’s financial flow goal was to raise equity based on the company’s short- and long-term assets and obligations. We improved the company’s short- and long-term assets and liabilities while maximising equity. The supply chain’s financial flow optimised and raised the company’s profitability.
Conversely, the material flow, which aimed to maximise profits, helped achieve that goal. Though not significantly different, the material yield showed higher profits than the financial yield. We conclude that because the financial flow considers all financial aspects, in addition to the chain’s material movement, maximising the financial flow can lead to a productive and efficient chain that generates the highest possible profits.
On the other hand, it was found that although the company’s debt ratio is low, its equity change is high. It was also found that while net profit has grown over time, return on sales has not decreased much, and its process is steady. The financial ratios, which may be helpful in a company’s productivity and yield results suitable for the firm’s administration, were outlined at the study’s conclusion. Examining the financial ratios obtained from this research, it was discovered that the corporation can pay its obligations and that creditors can have more security than present assets.
- The pandemic resulted in a decline in demand, sales, and profit risks, which impacted the financial supply-chain model;
- The epidemic’s economic instability has significantly impacted the financial supply chain;
- This research has suggested mitigation techniques to alleviate the effect of COVID-19 on the financial supply chain.
7.2. Limitations and Recommendations for Future Works
This research may be broadened by incorporating financial variables into the model, considering multiproduct manufacturing, or analysing the financial flow model using metaheuristic algorithms and expanding it into higher dimensions.
This study may have several limitations:
- First, it could concentrate on an area, industry, or supply chain. Consequently, the conclusions might not be as applicable in other situations;
- The supply-chain network or financial components may be simplified or assumptions may be made in the paper that may not hold in practice;
- The study could depend on hard-to-get or unavailable data, which could reduce the analysis’s precision or thoroughness;
- The report might not consider how the COVID-19 epidemic evolves and affects supply chains;
- The accuracy and validity of the results might be impacted by the paper’s potential use of a particular modelling technique, which has constraints and assumptions of its own.
These suggestions for further research on this paper are based on the search results:
- i.
- Examine how the COVID-19 scenarios affect various supply chains, including those for fresh produce, air-freight logistics, and SMEs’ sustainable supply chains;
- ii.
- Examine how big-data analytics and machine learning may enhance supply-chain resilience during and after the COVID-19 epidemic;
- iii.
- Examine how artificial intelligence (AI) may be used to mitigate the risk associated with the agricultural supply chain to combat the COVID-19 pandemic;
- iv.
- Create a forecasting model to evaluate how sharing data impacts supply-chain efficiency amid the COVID-19 outbreak;
- v.
- Examine the variables influencing the ability of sustainable supply chains to withstand the COVID-19 pandemic, with a focus on SMEs;
- vi.
- It is significant to highlight that these limitations may apply to any research on supply-chain networks conducted during the COVID-19 epidemic and are not exclusive to the publication.
Author Contributions
Conceptualization, S.A., S.E. and M.A. (Mohsen Amra); methodology, S.A. and A.S.; software, S.A., M.A. (Mohsen Amra), and A.S.; validation, S.A. and I.V.; formal analysis, S.A.; investigation, A.S., S.E., M.A. (Mohsen Amra), and M.A. (Mohamad Afshar); resources, S.A., S.E., M.A. (Mohsen Amra), and M.A. (Mohamad Afshar); Supervising, S.A. and I.V. All authors have read and agreed to the published version of the manuscript.
Funding
This research received no external funding.
Institutional Review Board Statement
Not applicable.
Informed Consent Statement
Not applicable.
Data Availability Statement
The data presented in this study are available on request from the corresponding author.
Conflicts of Interest
The authors declare no conflicts of interest.
Appendix A

Table A1.
Sets for the problem.
| Sets | ||
|---|---|---|
| s | Suppliers | s = 1, 2, …, S |
| p | Manufacturers | p = 1, 2, …, P |
| d | Distribution centres | d = 1, 2, …, D |
| c | Customer centres | c = 1, 2, …, C |
| t | Time | t = 1, 2, …, T |
Table A2.
Parameters for problem.
| Physical Parameters | Distributions |
|---|---|
| The demand of customer c in time t | |
| The capacity of the supplier s in time t | |
| The capacity of the manufactory p in time t | |
| The capacity of the distribution centre d in time t | |
| The capacity of the distribution centre d in time t | |
| The cost per unit of production in the manufactory p in time t | |
| The cost per unit of operating in the distribution centre d in period t | |
| The cost per unit of shipping material from the supplier s to the manufactory p in time t | |
| The cost per unit of shipping production from the manufactory p to the distribution centre d in time t | |
| The cost per unit of shipping production from the distribution centre d to the customer centre c in time t | |
| The fixed cost of creating the manufactory p in time t | |
| The fixed cost of creating the distribution centre d in time t | |
| The cost per unit of processing in the manufactory p in time t | |
| The cost per unit of storing/testing in the distribution centre d in time t | |
| The cost per unit of purchasing from the supplier s in time t | |
| The price per unit of the customer c in time t | |
| Other net cash achieved in time t | |
| Financial Parameters | Distributions |
| Marketable securities of initial portfolio maturing during the COVID-19 in period t | |
| Maximum debt allowed from the bank during COVID-19 | |
| Minimum cash imposed from the bank during COVID-19 | |
| Dividends in time t | |
| The interest rate during COVID-19 |
Table A3.
Decision variables for the problem.
| Decision Variables | Distributions |
|---|---|
| The quantity of row material shipping from the supplier s to the manufactory p in time t | |
| The quantity of product shipping from the manufactory p to the distribution centre d in time t | |
| The quantity of product shipping from the distribution centre d to the customer c in time t | |
| The quantity of product shipping from shipping to the store in time t | |
| The residual inventory at the store of the manufactory p in time t | |
| Cash in time t during COVID-19 | |
| Exogenous cash in time t during COVID-19 | |
| The net cash achieved for borrowing was repaid to the credit line in time t | |
| Net cash received in securities transactions in time t | |
| The total payment for costs of production or reproduction executed in time t on accounts payable incurred in time t′ | |
| The total payment for costs of material executed in time t on accounts payable incurred in time t′ | |
| The total payment for costs of handling product in facilities executed in time t on accounts payable incurred in time t′ | |
| The total payment for costs of transportation executed in time t on accounts payable incurred in time t′ | |
| Accounts receivable in time t | |
| Amount of accounts receivable pledged from time t′ to time t | |
| Debt in time t during the COVID-19 | |
| Amount of cash borrowed in time t during the COVID-19 | |
| Amount of cash repaid in time t during the COVID-19 | |
| Total cash obtained in time t′ by the marketable securities invested in time t during the COVID-19 | |
| Total marketable securities sold in time t to t′ | |
| Expense of material in time t | |
| The expense of production or reproduction in time t | |
| The expense of handling product in facilities in time t | |
| The expense of shipping in time t | |
| The profit of enterprise during the COVID-19 | |
| The change in equity of enterprise during the COVID-19 | |
| The change in assets of the enterprise during the COVID-19 | |
| The change in short-term liabilities of the enterprise during the COVID-19 |
Table A4.
Binary variables for the problem.
| Binary variables | Distributions |
|---|---|
| If manufactory p created in time t = 1 Otherwise = 0 | |
| If distribution centre d e created in time t = 1 Otherwise = 0 |
Table A5.
Greek letters for the problem.
| Greek Letters | Distributions |
|---|---|
| The technical discount coefficient relevant to the payment of material costs executed in time t incurred in time t′ | |
| The technical discount coefficient relevant to the payment of production/reproduction costs executed from time t to time t′ | |
| The technical discount coefficient relevant to the payment of handling costs executed from time t to time t′ | |
| The technical discount coefficient relevant to the payment of transportation costs executed from time t to time t′ | |
| The percentage of accounts receivable pledged corresponding to this value during COVID-19. | |
| The technical coefficient related to the sale of marketable securities from time t to time t′ | |
| The technical coefficient connected to the investment of marketable securities from time t to time t′ |
Table A6.
Settings for the model’s parameters.
| Parameters | Values |
|---|---|
| Uniform (1,1000) | |
| Uniform (1,1000) | |
| Uniform (1,1000) | |
| Uniform (1,1000) | |
| Uniform (1,1000) | |
| Uniform (1,1000) | |
| Uniform (1,1000) | |
| Uniform (1,1000) | |
| Uniform (1,1000) | |
| Uniform (1,1000) | |
| Uniform (1,1000) | |
| Uniform (1,1000) | |
| Uniform (1,1000) | |
| Uniform (1,1000) | |
| Uniform (1,1000) | |
| Uniform (1,1000) | |
| Uniform (1,900) | |
| Uniform (1,900) | |
| Uniform (0,1) | |
| Uniform (0,1) | |
| Uniform (1,1000) | |
| Uniform (1,1000) |
References
- Alla, L.; Bentalha, B.; Bouhtati, N. Assessing supply chain performance in the COVID-19 context: A prospective model. In Proceedings of the 2022 14th International Colloquium of Logistics and Supply Chain Management (LOGISTIQUA), El Jadida, Morocco, 25–27 May 2022; pp. 1–6. [Google Scholar]
- Mohezar, S.; Mohamad, M.N.; Mohd Nor, M.N. Supply chain risk and SME business continuity strategies in the food industry during COVID-19 pandemic. Contin. Resil. Rev. 2023, 5, 116–134. [Google Scholar] [CrossRef]
- Jelti, F.; Saadani, R.; Rahmoune, M. The impact of COVID-19 on the logistics and transportation sectors in Morocco. In Proceedings of the 2023 3rd International Conference on Innovative Research in Applied Science, Engineering and Technology (IRASET), Mohammedia, Morocco, 18–19 May 2023; pp. 1–4. [Google Scholar]
- Montoya-Torres, J.R.; Muñoz-Villamizar, A.; Mejia-Argueta, C. Mapping research in logistics and supply chain management during the COVID-19 pandemic. Int. J. Logist. Res. Appl. 2023, 26, 421–441. [Google Scholar] [CrossRef]
- Burrell, D.N. Supply Chain and Logistics Management in Public Health Surveillance and Protection during COVID-19. Sci. Bull. 2022, 27, 12–20. [Google Scholar] [CrossRef]
- Choi, T.M. Risk analysis in logistics systems: A research agenda during and after the COVID-19 pandemic. Transp. Res. Part E Logist. Transp. Rev. 2021, 145, 102190. [Google Scholar] [CrossRef]
- Burgos, D.; Ivanov, D. Food retail supply chain resilience and the COVID-19 pandemic: A digital twin-based impact analysis and improvement directions. Transp. Res. Part E Logist. Transp. Rev. 2021, 152, 102412. [Google Scholar] [CrossRef] [PubMed]
- Malik, A.I.; Sarkar, B.; Iqbal, M.W.; Ullah, M.; Khan, I.; Ramzan, M.B. Coordination supply chain management in flexible production system and service level constraint: A Nash bargaining model. Comput. Ind. Eng. 2023, 177, 109002. [Google Scholar] [CrossRef]
- Gangwar, H.; Mishra, R.; Kamble, S. Adoption of big data analytics practices for sustainability development in the e-commerce supply chain: A mixed-method study. Int. J. Qual. Reliab. Manag. 2023, 40, 965–989. [Google Scholar] [CrossRef]
- Orlando, B.; Tortora, D.; Pezzi, A.; Bitbol-Saba, N. The disruption of the international supply chain: Firm resilience and knowledge preparedness to tackle the COVID-19 outbreak. J. Int. Manag. 2022, 28, 100876. [Google Scholar] [CrossRef]
- Sharma, M.; Luthra, S.; Joshi, S.; Kumar, A.; Jain, A. Green logistics driven circular practices adoption in industry 4.0 Era: A moderating effect of institution pressure and supply chain flexibility. J. Clean. Prod. 2023, 383, 135284. [Google Scholar] [CrossRef]
- Rodríguez-Espíndola, O.; Dey, P.; Albores, P.; Chowdhury, S. Sustainability and intermodality in humanitarian logistics: A two-stage multi-objective programming formulation. Ann. Oper. Res. 2023, 1–30. [Google Scholar] [CrossRef]
- Müller, J.; Hoberg, K.; Fransoo, J.C. Realising supply chain agility under time pressure: Ad hoc supply chains during the COVID-19 pandemic. J. Oper. Manag. 2023, 69, 426–449. [Google Scholar] [CrossRef]
- Bidhandi, H.M.; Yusuff, R.M.; Ahmad, M.M.H.M.; Bakar, M.R.A. Development of a new approach for deterministic supply chain network design. Eur. J. Oper. Res. 2009, 198, 121–128. [Google Scholar] [CrossRef]
- Baud-Lavigne, B.; Agard, B.; Penz, B. Simultaneous product family and supply chain design: An optimisation approach. Int. J. Prod. Econ. 2016, 174, 111–118. [Google Scholar] [CrossRef]
- Khalilabadi SM, G.; Zegordi, S.H.; Nikbakhsh, E. A multi-stage stochastic programming approach for supply chain risk mitigation via product substitution. Comput. Ind. Eng. 2020, 149, 106786. [Google Scholar] [CrossRef]
- Lin, H.; Lin, J.; Wang, F. An innovative machine learning model for supply chain management. J. Innov. Knowl. 2022, 7, 100276. [Google Scholar] [CrossRef]
- Ivanov, D.; Dolgui, A.; Sokolov, B. Ripple effect in the supply chain: Definitions, frameworks and future research perspectives. In Handbook of Ripple Effects in the Supply Chain; Springer: Berlin/Heidelberg, Germany, 2019; pp. 1–33. [Google Scholar]
- Ivanov, D.; Sokolov, B. A Model of an Integrated Analytics Decision Support System for Situational Proactive Control of Recovery Processes in Service-Modularized Supply Chain. In Handbook of Ripple Effects in the Supply Chain; Springer: Berlin/Heidelberg, Germany, 2019; pp. 129–144. [Google Scholar] [CrossRef]
- Hosseini, S.; Sarder, M.D. Ripple effect analysis of two-stage supply chain using probabilistic graphical model. In Handbook of Ripple Effects in the Supply Chain; Springer: Berlin/Heidelberg, Germany, 2019; pp. 181–191. [Google Scholar]
- Sawik, T. A multi-portfolio approach to integrated risk-averse planning in supply chains under disruption risks. In Handbook of Ripple Effects in the Supply Chain; Springer: Berlin/Heidelberg, Germany, 2019; pp. 35–63. [Google Scholar]
- Scheibe, K.P.; Blackhurst, J. Systemic risk and the ripple effect in the supply chain. In Handbook of Ripple Effects in the Supply Chain; Springer: Berlin/Heidelberg, Germany, 2019; pp. 85–100. [Google Scholar]
- Shaheen, I.; Azadegan, A.; Hooker, R.; Lucianetti, L. Leadership for mitigating ripple effects in supply chain disruptions: A paradoxical role. In Handbook of Ripple Effects in the Supply Chain; Springer: Berlin/Heidelberg, Germany, 2019; pp. 101–128. [Google Scholar]
- Dubey, R. Resilience and agility: The crucial properties of humanitarian supply chain. In Handbook of Ripple Effects in the Supply Chain; Springer: Berlin/Heidelberg, Germany, 2019; pp. 287–308. [Google Scholar]
- Ivanov, D. Entropy-Based Analysis and Quantification of Supply Chain Recoverability. In Handbook of Ripple Effects in the Supply Chain; Springer: Berlin/Heidelberg, Germany, 2019; pp. 193–208. [Google Scholar]
- Vlachos, I.P.; Thiesset, E.; Singh, R.; Malindretos, G. The role of wholesale markets in food supply chain resilience. Int. J. Value Chain Manag. 2023, 14, 346–375. [Google Scholar] [CrossRef]
- Fu, Y.; Ma, X.; Gao, K.; Li, Z.; Dong, H. Multi-Objective Home Health Care Routing and Scheduling with Sharing Service via a Problem-Specific Knowledge-Based Artificial Bee Colony Algorithm. IEEE Trans. Intell. Transp. Syst. 2023, 25, 1706–1719. [Google Scholar] [CrossRef]
- Wu, Z.; Zhou, R.; Goh, M.; Wang, Y.; Xu, Z.; Song, W. (DT4Smart) a digital twin-based modularised design approach for smart warehouses. Int. J. Comput. Integr. Manuf. 2023, 1–22. [Google Scholar] [CrossRef]
- Fu, Y.; Zhou, M.; Guo, X.; Qi, L. Scheduling dual-objective stochastic hybrid flow shop with deteriorating jobs via bi-population evolutionary algorithm. IEEE Trans. Syst. Man Cybern. Syst. 2019, 50, 5037–5048. [Google Scholar] [CrossRef]
- Vlachos, I.; Polichronidou, V. Multi-demand supply chain triads and the role of Third-Party Logistics Providers. Int. J. Logist. Manag. 2024, 35, 136–157. [Google Scholar] [CrossRef]
- Zhou, L.; Chen, M.; Lee, H. Supply Chain Finance: A Research Review and Prospects Based on a Systematic Literature Analysis from a Financial Ecology Perspective. Sustainability 2022, 14, 14452. [Google Scholar] [CrossRef]
- Chen, X.; Wang, C.; Li, S. The impact of supply chain finance on corporate social responsibility and creating shared value: A case from the emerging economy. Supply Chain Manag. Int. J. 2023, 28, 324–346. [Google Scholar] [CrossRef]
- Ivanov, D.; Das, A. Coronavirus (COVID-19/SARS-CoV-2) and supply chain resilience: A research note. Int. J. Integr. Supply Manag. 2020, 13, 90–102. [Google Scholar] [CrossRef]
- Priya, B.; Biswas, I.; Thürer, M.; Avittathur, B. How to finance the supply chain when you are small? Clearance sale and loan payment timing in financially constrained supply chains. Int. J. Prod. Econ. 2023, 263, 108934. [Google Scholar] [CrossRef]
- Gupta, S.; Modgil, S.; Choi, T.M.; Kumar, A.; Antony, J. Influences of artificial intelligence and blockchain technology on financial resilience of supply chains. Int. J. Prod. Econ. 2023, 261, 108868. [Google Scholar] [CrossRef]
- Amir, S.; Salehi, N.; Roci, M.; Sweet, S.; Rashid, A. Towards circular economy: A guiding framework for circular supply chain implementation. Bus. Strategy Environ. 2023, 32, 2684–2701. [Google Scholar] [CrossRef]
- Adjei-Boateng, E.S. A Literature Review on Management Practices among Small and Medium-Sized Enterprises. J. Eng. Appl. Sci. Humanit. 2023, 8, 1–23. [Google Scholar]
- Altabsh, M.; Almaktoom, A.T. Integrating Healthcare Processes Through Supply Chain Principles. In Proceedings of the International Conference on Industrial Engineering and Operations Management, Manila, Philippines, 7–9 March 2023. [Google Scholar]
- Gupta, R.; Goswami, M.; Daultani, Y.; Biswas, B.; Allada, V. Profitability and pricing decision-making structures in presence of uncertain demand and green technology investment for a three tier supply chain. Comput. Ind. Eng. 2023, 179, 109190. [Google Scholar] [CrossRef]
- Liu, H.; Yang, B.; Xiong, X.; Zhu, S.; Chen, B.; Tolba, A.; Zhang, X. A financial management platform based on the integration of blockchain and supply chain. Sensors 2023, 23, 1497. [Google Scholar] [CrossRef]
- Abbasi, S.; Moosivand, M.; Vlachos, I.; Talooni, M. Designing the Location–Routing Problem for a Cold Supply Chain Considering the COVID-19 Disaster. Sustainability 2023, 15, 15490. [Google Scholar] [CrossRef]
- Yan, N.; He, X.; Liu, Y. Financing the capital-constrained supply chain with loss aversion: Supplier finance vs. supplier investment. Omega 2019, 88, 162–178. [Google Scholar] [CrossRef]
- Höflinger, P.J.; Nagel, C.; Sandner, P. Reputation for technological innovation: Does it actually cohere with innovative activity? J. Innov. Knowl. 2018, 3, 26–39. [Google Scholar] [CrossRef]
- Hansson, J.; MacEachen, E.; Landstad, B.J.; Vinberg, S.; Tjulin, Å. A comparative study of governmental financial support and resilience of self-employed people in Sweden and Canada during the COVID-19 pandemic. Int. J. Circumpolar Health 2024, 83, 2298015. [Google Scholar] [CrossRef]
- Ivanov, D. Predicting the impacts of epidemic outbreaks on global supply chains: A simulation-based analysis on the coronavirus outbreak (COVID-19/SARS-CoV-2) case. Transp. Res. Part E Logist. Transp. Rev. 2020, 136, 101922. [Google Scholar] [CrossRef] [PubMed]
- Sarraf, S.; Kushwaha, A.K.; Kar, A.K.; Dwivedi, Y.K.; Giannakis, M. How did online misinformation impact stockouts in the e-commerce supply chain during COVID-19–A mixed methods study. Int. J. Prod. Econ. 2024, 267, 109064. [Google Scholar] [CrossRef]
- Wang, M.; Jie, F.; Frederico, G.F. Measuring supply chain agility during the COVID-19 pandemic: Empirical evidence from the firms in UAE. Int. J. Agil. Syst. Manag. 2024, 17, 1–14. [Google Scholar] [CrossRef]
- Akram, M.W.; Akram, N.; Shahzad, F.; Rehman, K.U.; Andleeb, S. Blockchain technology in a crisis: Advantages, challenges, and lessons learned for enhancing food supply chains during the COVID-19 pandemic. J. Clean. Prod. 2024, 434, 140034. [Google Scholar] [CrossRef]
- Gonzalez ED, S.; Abbasi, S.; Azhdarifard, M. Designing a Reliable Aggregate Production Planning Problem during the Disaster Period. Sustain. Oper. Comput. 2023, 4, 158–171. [Google Scholar] [CrossRef]
- Abbasi, S.; Vlachos, I.; Rekabi, S.; Talooni, M. Designing the Distribution Network of Essential Items in the Critical Conditions of Earthquakes and COVID-19 Simultaneously. Sustainability 2023, 15, 15900. [Google Scholar] [CrossRef]
- Ivanov, D.; Dolgui, A. Viability of intertwined supply networks: Extending the supply chain resilience angles towards survivability. A position paper motivated by COVID-19 outbreak. Int. J. Prod. Res. 2020, 58, 2904–2915. [Google Scholar] [CrossRef]
Figure 1.
The suggested supply chain.

Figure 2.
Results obtained from the model during COVID-19 with uniform distribution.

Figure 3.
Schematic of the case study for the suggested model.

Figure 4.
Results obtained from the model during the COVID-19 with real cases.

Figure 5.
The trend of exogenous cash and accounts receivable changes during the COVID-19 era.

Figure 6.
Liabilities in periods for both financial and material flows during COVID-19.

Table 1.
Results obtained from solving the model during the COVID-19.
| First OF | Second OF | |
|---|---|---|
| Financial flow during the COVID-19 | 391,000 | 680,640 |
| Material flow during the COVID-19 | 440,551 | 732,055 |
Table 2.
The pattern of shifts in receivables accounts and incoming cash throughout the COVID-19 period.
Table 2.
The pattern of shifts in receivables accounts and incoming cash throughout the COVID-19 period.
| Time | Rec | ExnCash |
|---|---|---|
| t = 1 | 150,040 | 191,910 |
| t = 2 | 194,400 | 208,955 |
| t = 3 | 193,200 | 301,990 |
| t = 4 | 200,100 | 302,003 |
| t = 5 | 294,000 | 402,000 |
| t = 6 | 325,800 | 460,200 |
| t = 7 | 350,440 | 490,100 |
| t = 8 | 370,550 | 532,000 |
| t = 9 | 400,701 | 550,509 |
| t = 10 | 480,512 | 690,510 |
Table 3.
Liabilities for material and financial flows during COVID-19.
| Time | Financial | Materials |
|---|---|---|
| t = 1 | 77,040 | 69,040 |
| t = 2 | 81,405 | 77,090 |
| t = 3 | 90,200 | 88,878 |
| t = 4 | 100,700 | 98,999 |
| t = 5 | 110,000 | 90,559 |
| t = 6 | 112,800 | 88,214 |
| t = 7 | 114,440 | 95,315 |
| t = 8 | 115,550 | 97,277 |
| t = 9 | 117,701 | 107,122 |
| t = 10 | 120,512 | 106,144 |
Disclaimer/Publisher’s Note: The statements, opinions and data contained in all publications are solely those of the individual author(s) and contributor(s) and not of MDPI and/or the editor(s). MDPI and/or the editor(s) disclaim responsibility for any injury to people or property resulting from any ideas, methods, instructions or products referred to in the content. |
© 2024 by the authors. Licensee MDPI, Basel, Switzerland. This article is an open access article distributed under the terms and conditions of the Creative Commons Attribution (CC BY) license (https://creativecommons.org/licenses/by/4.0/).
Share and Cite
MDPI and ACS Style
Abbasi, S.; Vlachos, I.; Samadzadeh, A.; Etemadifar, S.; Afshar, M.; Amra, M. Modelling a Logistics and Financial Supply Chain Network during the COVID-19 Era. Logistics 2024, 8, 32. https://doi.org/10.3390/logistics8010032
AMA Style
Abbasi S, Vlachos I, Samadzadeh A, Etemadifar S, Afshar M, Amra M. Modelling a Logistics and Financial Supply Chain Network during the COVID-19 Era. Logistics. 2024; 8(1):32. https://doi.org/10.3390/logistics8010032
Chicago/Turabian StyleAbbasi, Sina, Ilias Vlachos, Ali Samadzadeh, Shayan Etemadifar, Mohamad Afshar, and Mohsen Amra. 2024. "Modelling a Logistics and Financial Supply Chain Network during the COVID-19 Era" Logistics 8, no. 1: 32. https://doi.org/10.3390/logistics8010032