
Relationship between Thyroid CT Density, Volume, and Future TSH Elevation: A 5-Year Follow-Up Study
 ,
,  ,
,
Abstract
:1. Introduction
2. Materials and Methods
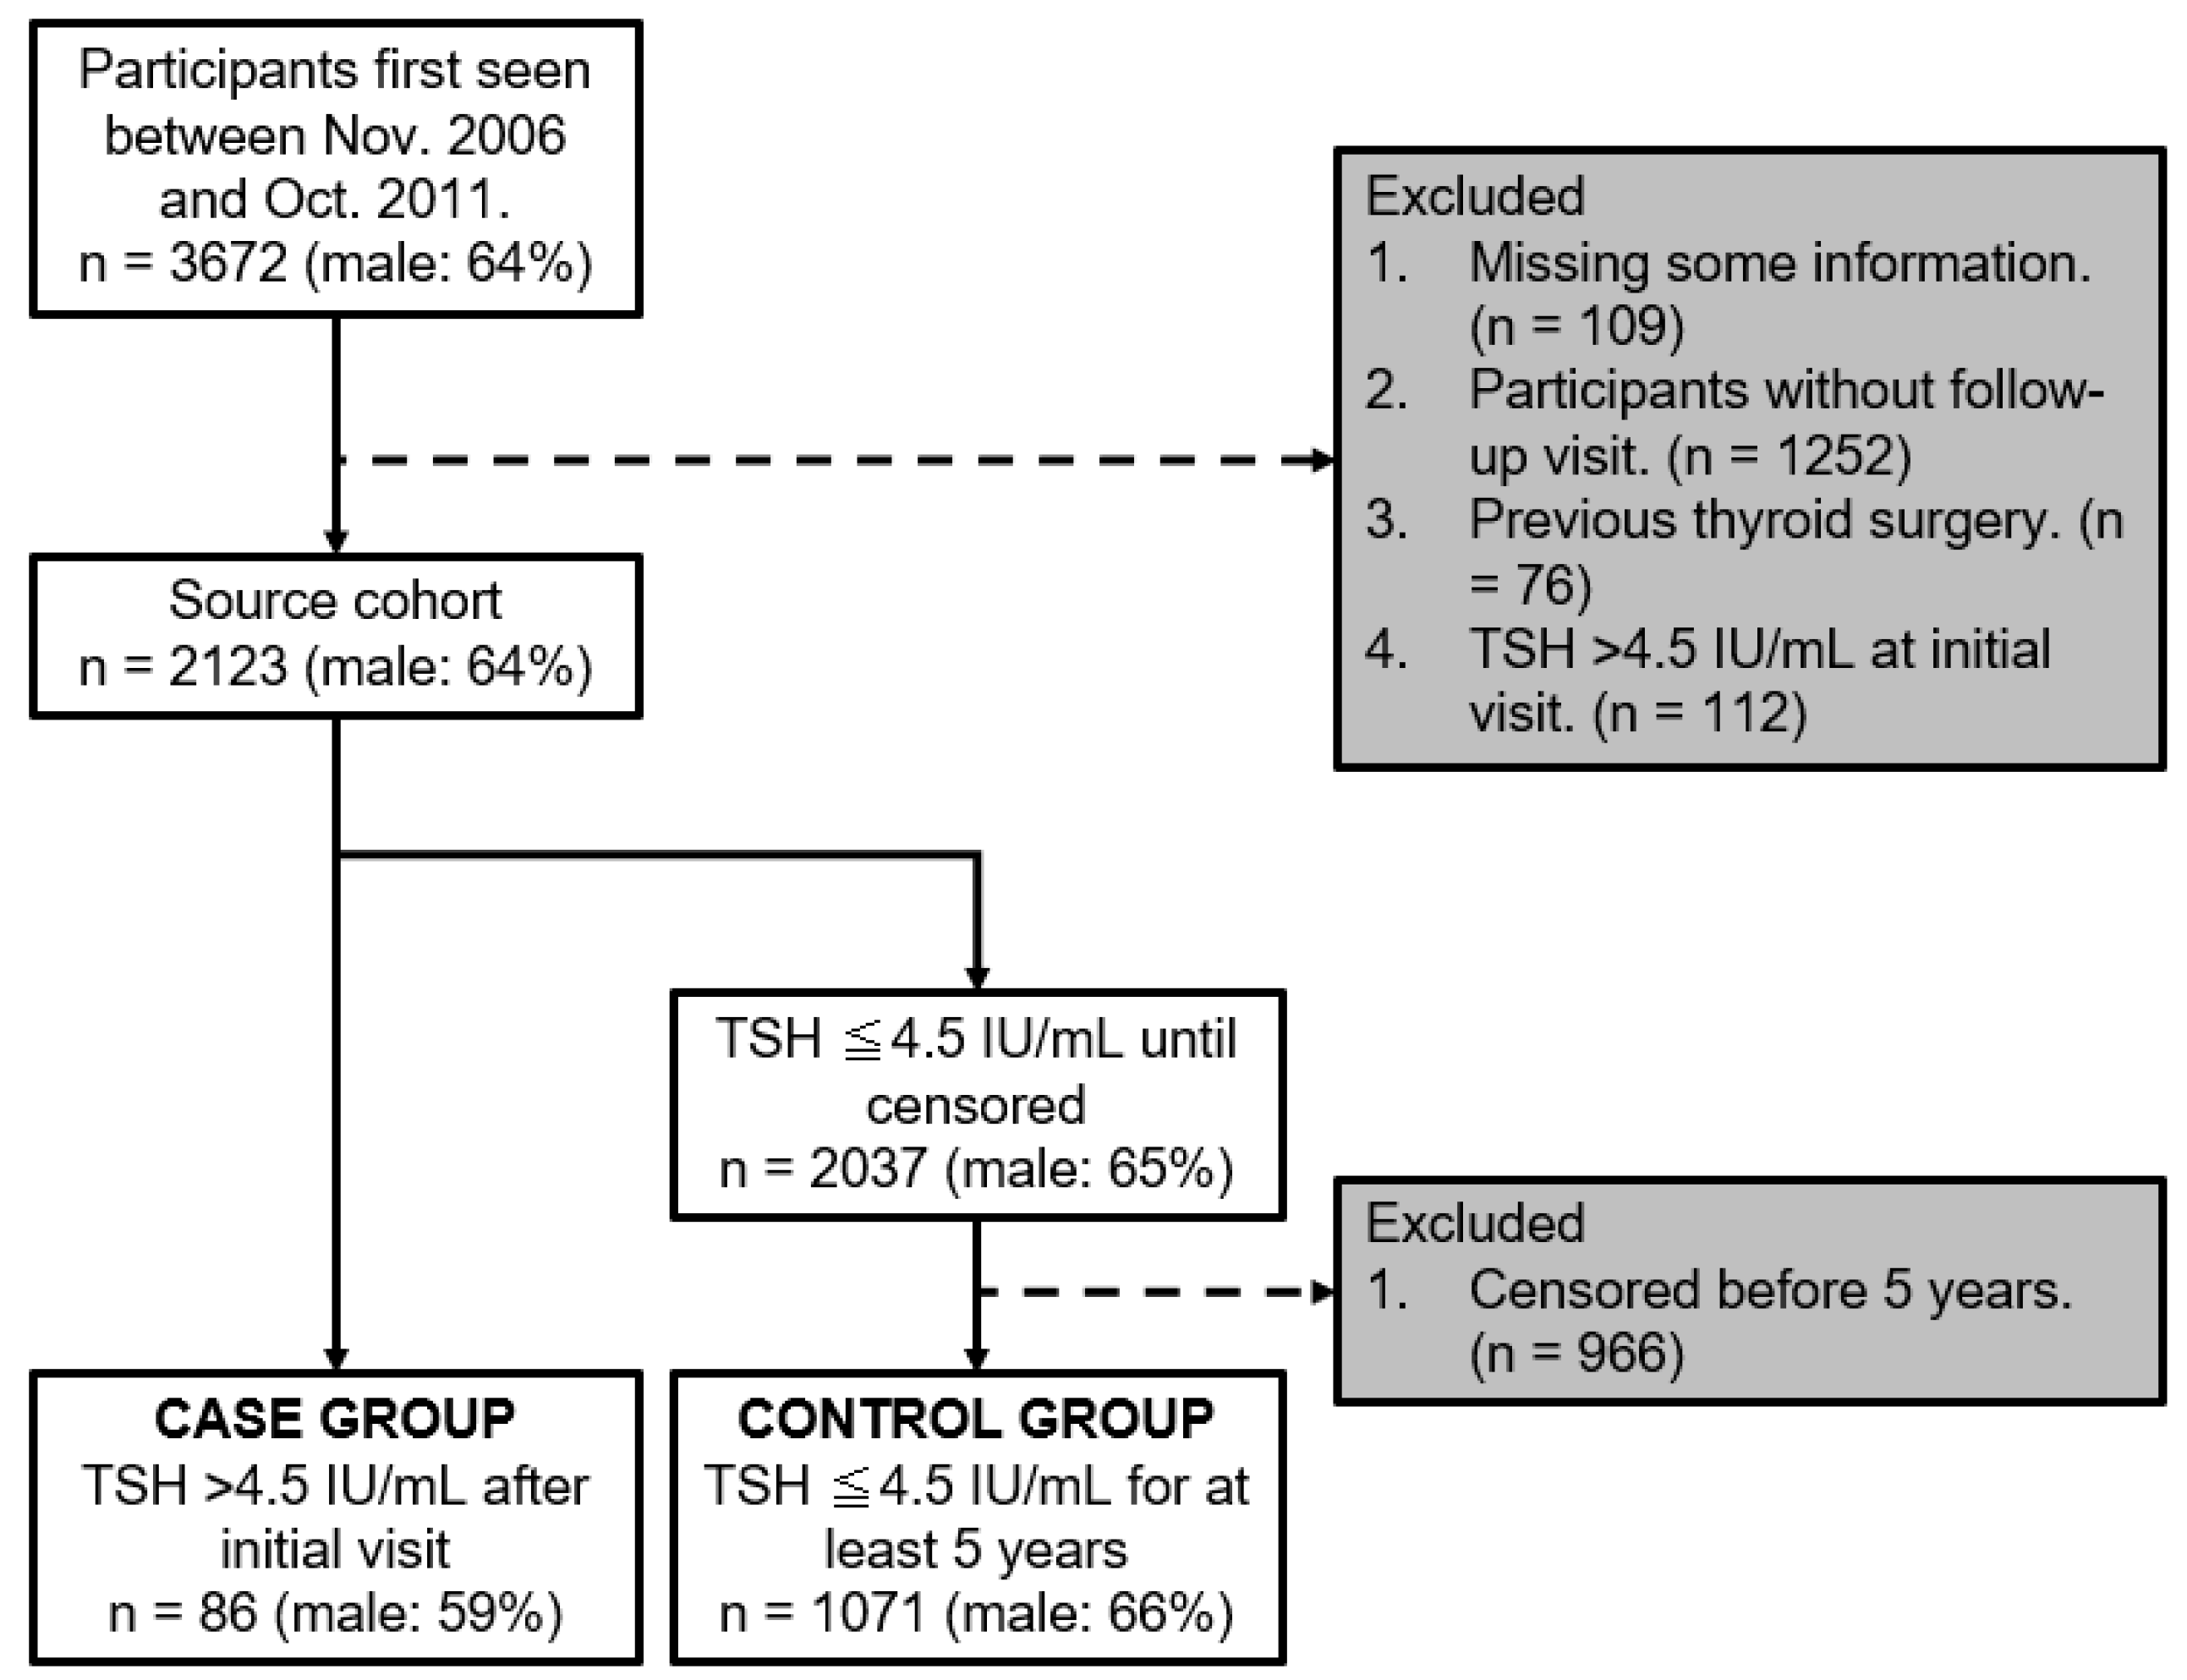
2.1. Dataset and Study Design
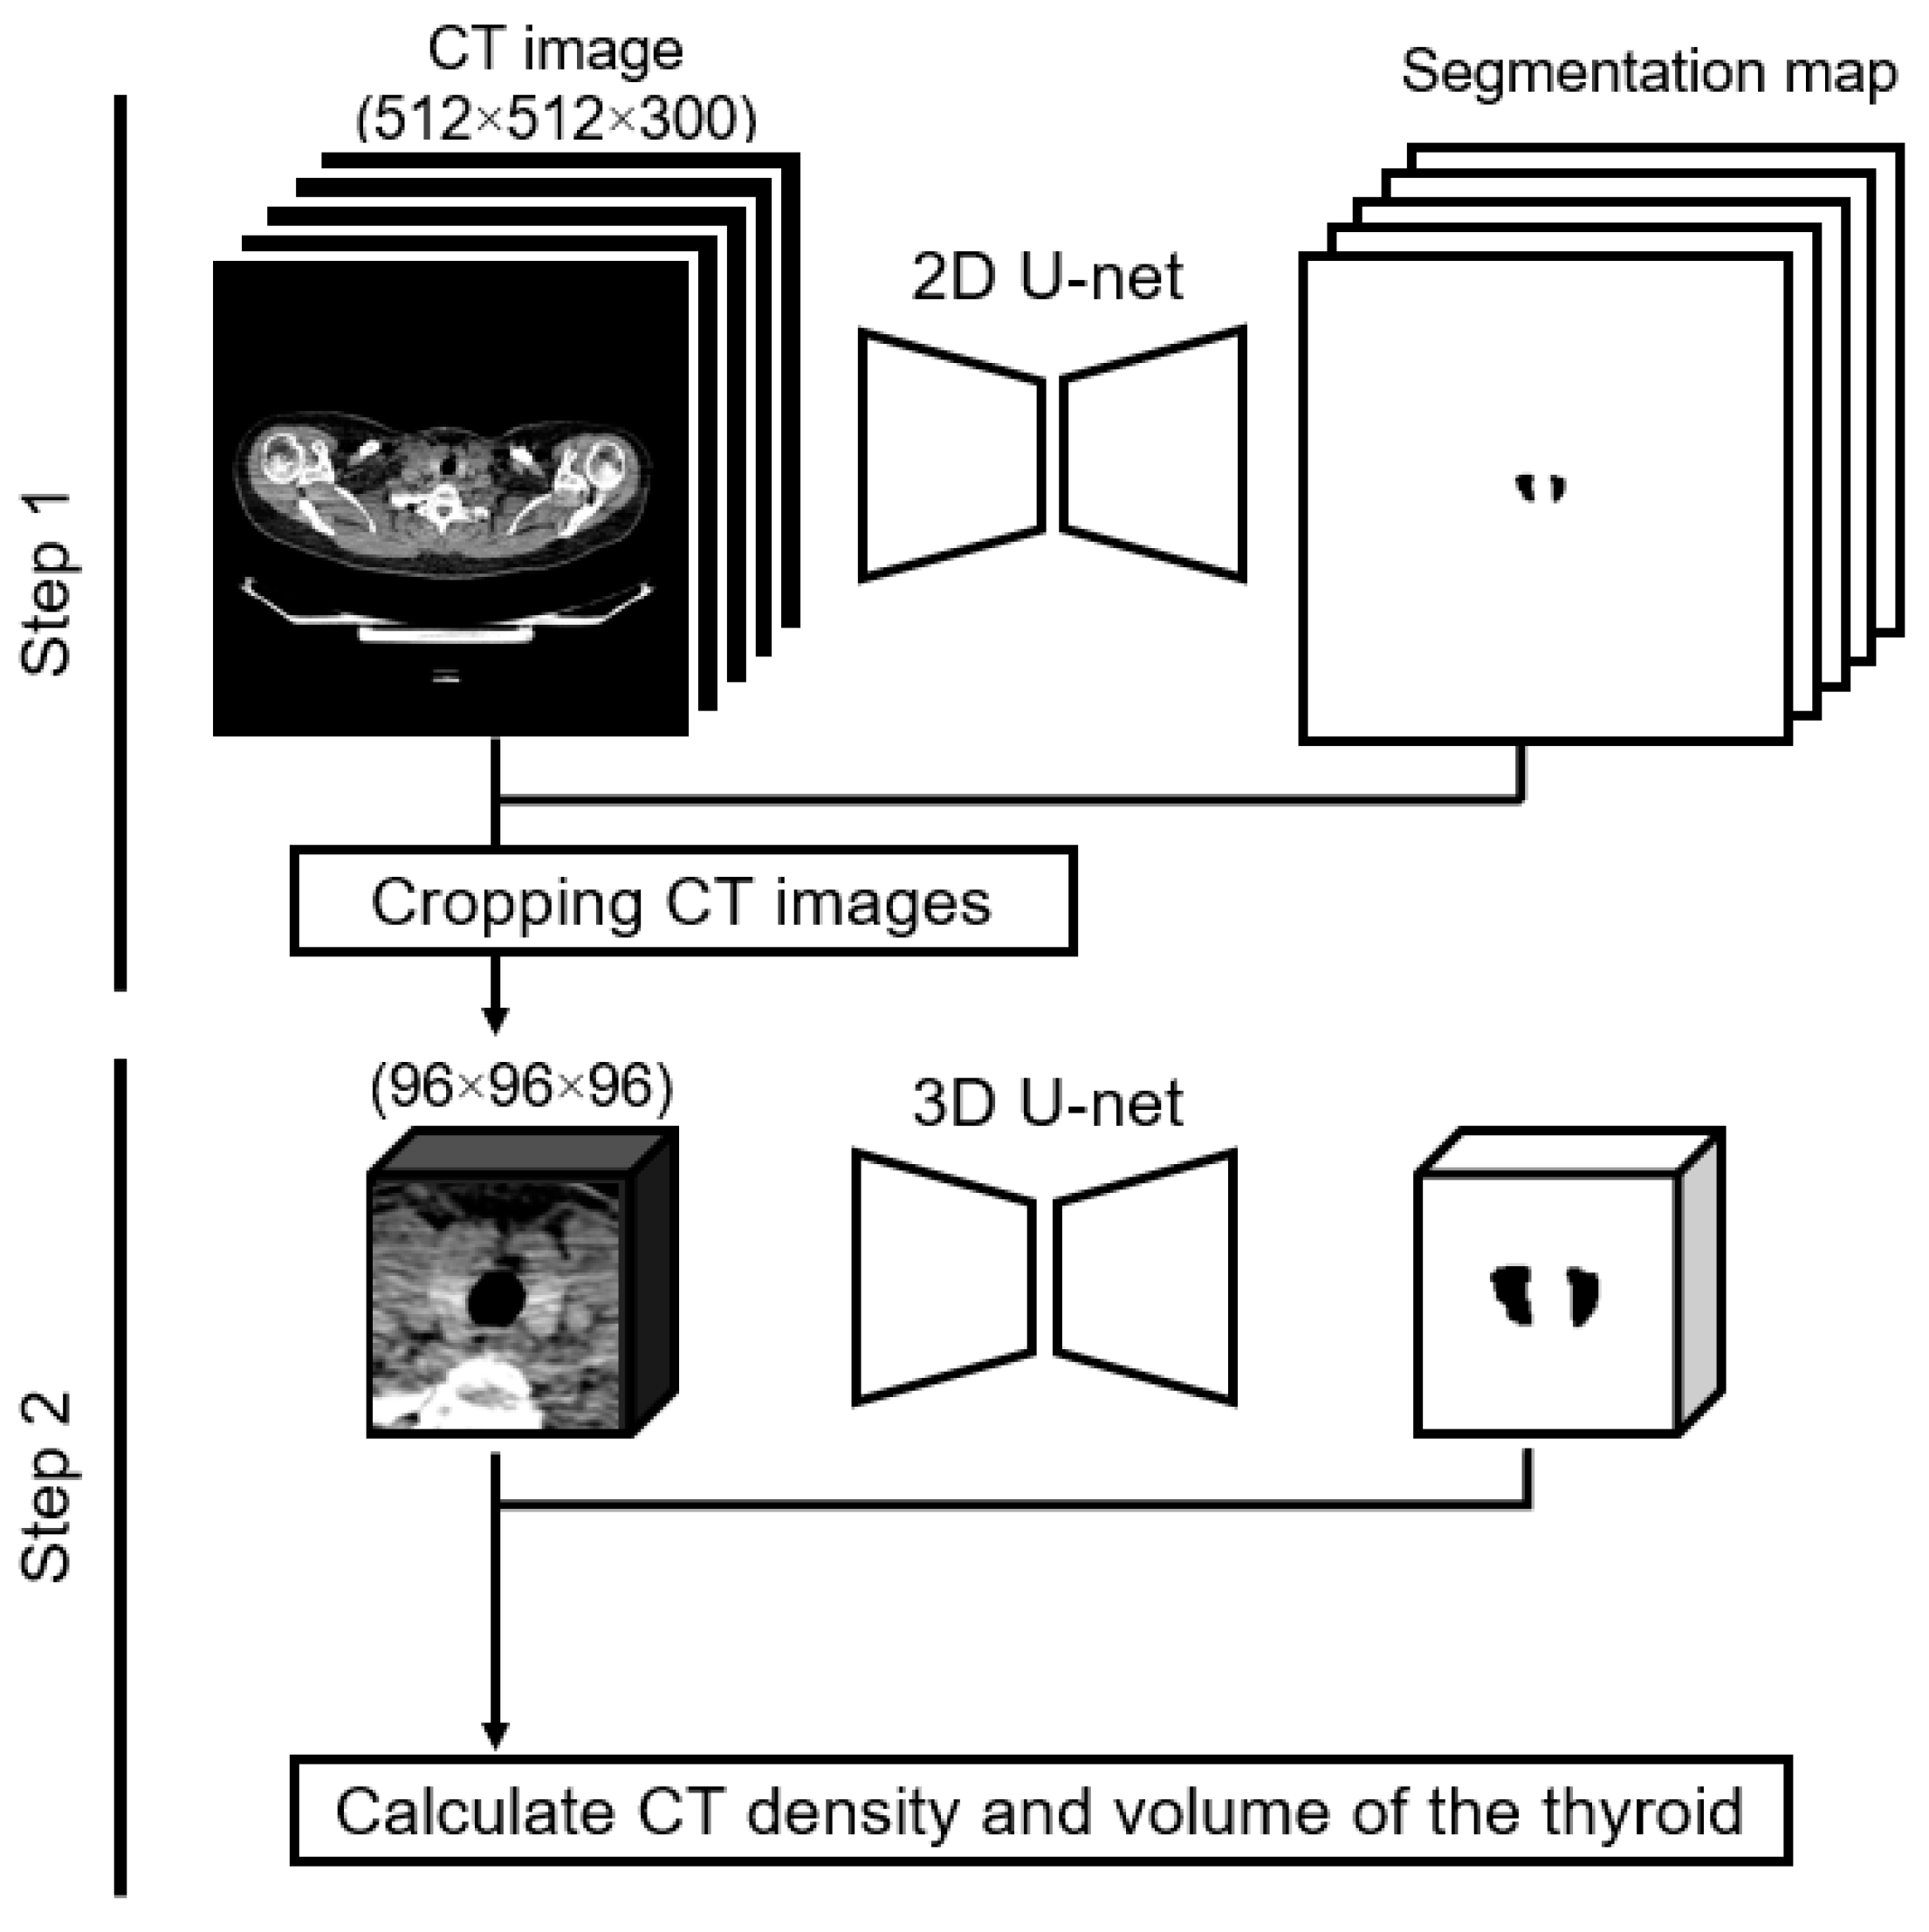
2.2. Image Acquisition and Measurements
2.3. Statistical Analysis
3. Results
4. Discussion
5. Conclusions
Author Contributions
Funding
Institutional Review Board Statement
Informed Consent Statement
Data Availability Statement
Acknowledgments
Conflicts of Interest
References
- Chaker, L.; Bianco, A.C.; Jonklaas, J.; Peeters, R.P. Hypothyroidism. Lancet 2017, 390, 1550–1562. [Google Scholar] [CrossRef]
- Parle, J.V.; Franklyn, J.A.; Cross, K.W.; Jones, S.C.; Sheppard, M.C. Prevalence and Follow-up of Abnormal Thyrotrophin (TSH) Concentrations in the Elderly in the United Kingdom. Clin. Endocrinol. 1991, 34, 77–83. [Google Scholar] [CrossRef]
- Canaris, G.J.; Manowitz, N.R.; Mayor, G.; Ridgway, E.C. The Colorado Thyroid Disease Prevalence Study. Arch. Intern. Med. 2000, 160, 526–534. [Google Scholar] [CrossRef] [PubMed]
- Vanderpump, M.P.J.; Tunbridge, W.M.G. Epidemiology and Prevention of Clinical and Subclinical Hypothyroidism. Thyroid 2002, 12, 839–847. [Google Scholar] [CrossRef]
- Chiovato, L.; Magri, F.; Carlé, A. Hypothyroidism in Context: Where We’ve Been and Where We’re Going. Adv. Ther. 2019, 36, 47–58. [Google Scholar] [CrossRef] [PubMed]
- Li, Z.-T.; Zhai, R.; Liu, H.-M.; Wang, M.; Pan, D.-M. Iodine Concentration and Content Measured by Dual-Source Computed Tomography Are Correlated to Thyroid Hormone Levels in Euthyroid Patients: A Cross-Sectional Study in China. BMC Med. Imaging 2020, 20, 10. [Google Scholar] [CrossRef] [PubMed]
- Kaneko, T.; Matsumoto, M.; Fukui, K.; Hori, T.; Katayama, K. Clinical Evaluation of Thyroid CT Values in Various Thyroid Conditions. J. Comput. Tomogr. 1979, 3, 1–4. [Google Scholar] [CrossRef] [PubMed]
- Kamijo, K. Clinical Studies on Thyroid CT Number in Chronic Thyroiditis. Endocr. J. 1994, 41, 19–23. [Google Scholar] [CrossRef] [PubMed]
- Bin Saeedan, M.; Aljohani, I.M.; Khushaim, A.O.; Bukhari, S.Q.; Elnaas, S.T. Thyroid Computed Tomography Imaging: Pictorial Review of Variable Pathologies. Insights Imaging 2016, 7, 601–617. [Google Scholar] [CrossRef]
- Ishibashi, N.; Maebayashi, T.; Aizawa, T.; Sakaguchi, M.; Okada, M.; Matsushita, J. Computed Tomography Density Change in the Thyroid Gland Before and After Radiation Therapy. Anticancer Res. 2018, 38, 417–421. [Google Scholar] [CrossRef]
- Romaldini, J.H.; Biancalana, M.M.; Figueiredo, D.I.; Farah, C.S.; Mathias, P.C. Effect of L-Thyroxine Administration on Antithyroid Antibody Levels, Lipid Profile, and Thyroid Volume in Patients with Hashimoto’s Thyroiditis. Thyroid 1996, 6, 183–188. [Google Scholar]
- Rho, M.H.; Kim, D.W. Computed Tomography Features of Incidentally Detected Diffuse Thyroid Disease. Int. J. Endocrinol. 2014, 2014, 921934. [Google Scholar] [CrossRef] [PubMed]
- Maldjian, P.D.; Chen, T. Is Visual Assessment of Thyroid Attenuation on Unenhanced CT of the Chest Useful for Detecting Hypothyroidism? Clin. Radiol. 2016, 71, 1199.e9–e1199.e14. [Google Scholar] [CrossRef] [PubMed]
- Sun, X.; Shan, Z.; Teng, W. Effects of Increased Iodine Intake on Thyroid Disorders. Endocrinol. Metab. 2014, 29, 240–247. [Google Scholar] [CrossRef] [PubMed]
- Kim, S.; Kwon, Y.S.; Kim, J.Y.; Hong, K.H.; Park, Y.K. Association between Iodine Nutrition Status and Thyroid Disease-Related Hormone in Korean Adults: Korean National Health and Nutrition Examination Survey VI (2013–2015). Nutrients 2019, 11, 2757. [Google Scholar] [CrossRef]
- Van den Bruel, A.; Delanote, J.; Braeckman, A.; De Vroe, C.; Pyfferoen, L.; Ghekiere, J.; Duytschaever, M.; Tavernier, R. “White Thyroid” on Unenhanced Computed Tomography in Amiodarone-Induced Thyrotoxicosis Type 2. Thyroid 2018, 28, 769–772. [Google Scholar] [CrossRef]
- Felix, L.; Jacon, P.; Lugosi, M.; Cristante, J.; Roux, J.; Chabre, O. Rise and Fall of Thyroid Radiologic Density during the Time Course of Amiodarone-Induced Thyrotoxicosis. Eur. Thyroid J. 2022, 11, e210047. [Google Scholar] [CrossRef]
- Çiçek, Ö.; Abdulkadir, A.; Lienkamp, S.S.; Brox, T.; Ronneberger, O. 3D U-Net: Learning Dense Volumetric Segmentation from Sparse Annotation. In Proceedings of the Medical Image Computing and Computer-Assisted Intervention—MICCAI 2016, Athens, Greece, 17–21 October 2016; Springer International Publishing: Berlin/Heidelberg, Germany, 2016; pp. 424–432. [Google Scholar]
- Cheng, P.M.; Montagnon, E.; Yamashita, R.; Pan, I.; Cadrin-Chênevert, A.; Perdigón Romero, F.; Chartrand, G.; Kadoury, S.; Tang, A. Deep Learning: An Update for Radiologists. Radiographics 2021, 41, 1427–1445. [Google Scholar] [CrossRef] [PubMed]
- Ronneberger, O.; Fischer, P.; Brox, T. U-Net: Convolutional Networks for Biomedical Image Segmentation. In Medical Image Computing and Computer-Assisted Intervention—MICCAI 2015; Lecture Notes in Computer Science; Springer International Publishing: Cham, Switzerland, 2015; pp. 234–241. ISBN 9783319245737. [Google Scholar]
- Dice, L.R. Measures of the Amount of Ecologic Association between Species. Ecology 1945, 26, 297–302. [Google Scholar] [CrossRef]
- Waller, J.; O’Connor, A.; Rafaat, E.; Amireh, A.; Dempsey, J.; Martin, C.; Umair, M. Applications and Challenges of Artificial Intelligence in Diagnostic and Interventional Radiology. Pol. J. Radiol. 2022, 87, e113–e117. [Google Scholar] [CrossRef]
- Fu, Y.; Lei, Y.; Wang, T.; Curran, W.J.; Liu, T.; Yang, X. A Review of Deep Learning Based Methods for Medical Image Multi-Organ Segmentation. Phys. Med. 2021, 85, 107–122. [Google Scholar] [CrossRef]
- Kim, Y.J.; Lee, S.H.; Lim, K.Y.; Kim, K.G. Development and Validation of Segmentation Method for Lung Cancer Volumetry on Chest CT. J. Digit. Imaging 2018, 31, 505–512. [Google Scholar] [CrossRef] [PubMed]
- Liu, F. Improving Quantitative Magnetic Resonance Imaging Using Deep Learning. Semin. Musculoskelet. Radiol. 2020, 24, 451–459. [Google Scholar] [CrossRef]
- Kikuchi, T.; Hanaoka, S.; Nakao, T.; Nomura, Y.; Yoshikawa, T.; Alam, A.; Mori, H.; Hayashi, N. Significance of FDG-PET Standardized Uptake Values in Predicting Thyroid Disease. Eur. Thyroid. J. 2023, 12, e220165. [Google Scholar] [CrossRef] [PubMed]
- Khachnaoui, H.; Guetari, R.; Khlifa, N. A Review on Deep Learning in Thyroid Ultrasound Computer-Assisted Diagnosis Systems. In Proceedings of the 2018 IEEE International Conference on Image Processing, Applications and Systems (IPAS), Sophia Antipolis, France, 12–14 December 2018; IEEE: Piscataway, NJ, USA, 2018; pp. 291–297. [Google Scholar]
- Peng, S.; Liu, Y.; Lv, W.; Liu, L.; Zhou, Q.; Yang, H.; Ren, J.; Liu, G.; Wang, X.; Zhang, X.; et al. Deep Learning-Based Artificial Intelligence Model to Assist Thyroid Nodule Diagnosis and Management: A Multicentre Diagnostic Study. Lancet Digit. Health 2021, 3, e250–e259. [Google Scholar] [CrossRef]
- Zhang, X.; Lee, V.C.; Rong, J.; Lee, J.C.; Liu, F. Deep Convolutional Neural Networks in Thyroid Disease Detection: A Multi-Classification Comparison by Ultrasonography and Computed Tomography. Comput. Methods Programs Biomed. 2022, 220, 106823. [Google Scholar] [CrossRef] [PubMed]
- Carlé, A.; Pedersen, I.B.; Knudsen, N.; Perrild, H.; Ovesen, L.; Jørgensen, T.; Laurberg, P. Thyroid Volume in Hypothyroidism due to Autoimmune Disease Follows a Unimodal Distribution: Evidence against Primary Thyroid Atrophy and Autoimmune Thyroiditis Being Distinct Diseases. J. Clin. Endocrinol. Metab. 2009, 94, 833–839. [Google Scholar] [CrossRef]
- Shinohara, N.; Takahashi, M.; Kamishima, T.; Ikushima, H.; Otsuka, N.; Ishizu, A.; Shimizu, C.; Kanayama, H.; Nonomura, K. The Incidence and Mechanism of Sunitinib-Induced Thyroid Atrophy in Patients with Metastatic Renal Cell Carcinoma. Br. J. Cancer 2011, 104, 241–247. [Google Scholar] [CrossRef] [PubMed]
- Itonaga, T.; Saito, K.; Ikeda, N.; Mikami, R. Morphological Changes of the Thyroid Gland as a New Radiographic Marker for Lung Cancer Treatment Efficacy of Immune Checkpoint Inhibitors. Acta Radiol. 2021, 62, 42–50. [Google Scholar] [CrossRef]
- Mammen, J.S. Interpreting Elevated TSH in Older Adults. Curr. Opin. Endocr. Metab. Res. 2019, 5, 68–73. [Google Scholar] [CrossRef]
- Walsh, J.P. Thyroid Function across the Lifespan: Do Age-Related Changes Matter? Endocrinol. Metab. 2022, 37, 208–219. [Google Scholar] [CrossRef] [PubMed]
- Tunbridge, W.M.; Evered, D.C.; Hall, R.; Appleton, D.; Brewis, M.; Clark, F.; Evans, J.G.; Young, E.; Bird, T.; Smith, P.A. The Spectrum of Thyroid Disease in a Community: The Whickham Survey. Clin. Endocrinol. 1977, 7, 481–493. [Google Scholar] [CrossRef] [PubMed]
- Mahne, A.; El-Haddad, G.; Alavi, A.; Houseni, M.; Moonis, G.; Mong, A.; Hernandez-Pampaloni, M.; Torigian, D.A. Assessment of Age-Related Morphological and Functional Changes of Selected Structures of the Head and Neck by Computed Tomography, Magnetic Resonance Imaging, and Positron Emission Tomography. Semin. Nucl. Med. 2007, 37, 88–102. [Google Scholar] [CrossRef] [PubMed]
- Amouzegar, A.; Ghaemmaghami, Z.; Beigy, M.; Gharibzadeh, S.; Mehran, L.; Tohidi, M.; Azizi, F. Natural Course of Euthyroidism and Clues for Early Diagnosis of Thyroid Dysfunction: Tehran Thyroid Study. Thyroid 2017, 27, 616–625. [Google Scholar] [CrossRef]
- Guo, W.; Tan, L.; Dong, S.; Jin, Y.; Zhu, M.; Wei, H.; Chen, Y.; Fan, L.; Du, C.; Zhang, W. New Reference Values for Thyroid Volume and a Comprehensive Assessment for Influencing Factors in Chinese Adults with Iodine Sufficiency. Eur. Thyroid J. 2021, 10, 447–454. [Google Scholar] [CrossRef]


| Case Group (n = 86) | Control Group (n = 1071) | p-Value | |
|---|---|---|---|
| Follow-up time (Years) (Median [IQR]) | 2.1 [1.9–3.4] | 5.5 [5.4–5.7] | N/A |
| Sex (No.) | 0.22 | ||
| Male | 51 | 712 | |
| Female | 35 | 359 | |
| Age (Years) (Median [IQR]) | 61 [54–69] | 56 [48–64] | <0.01 |
| TSH (IU/mL) (Median [IQR]) | 2.80 [2.23–3.63] | 1.30 [0.87–1.84] | <0.01 |
| T4 (ng/dL) (Median [IQR]) | 1.08 [0.92–1.23] | 1.12 [1.12–1.26] | <0.01 |
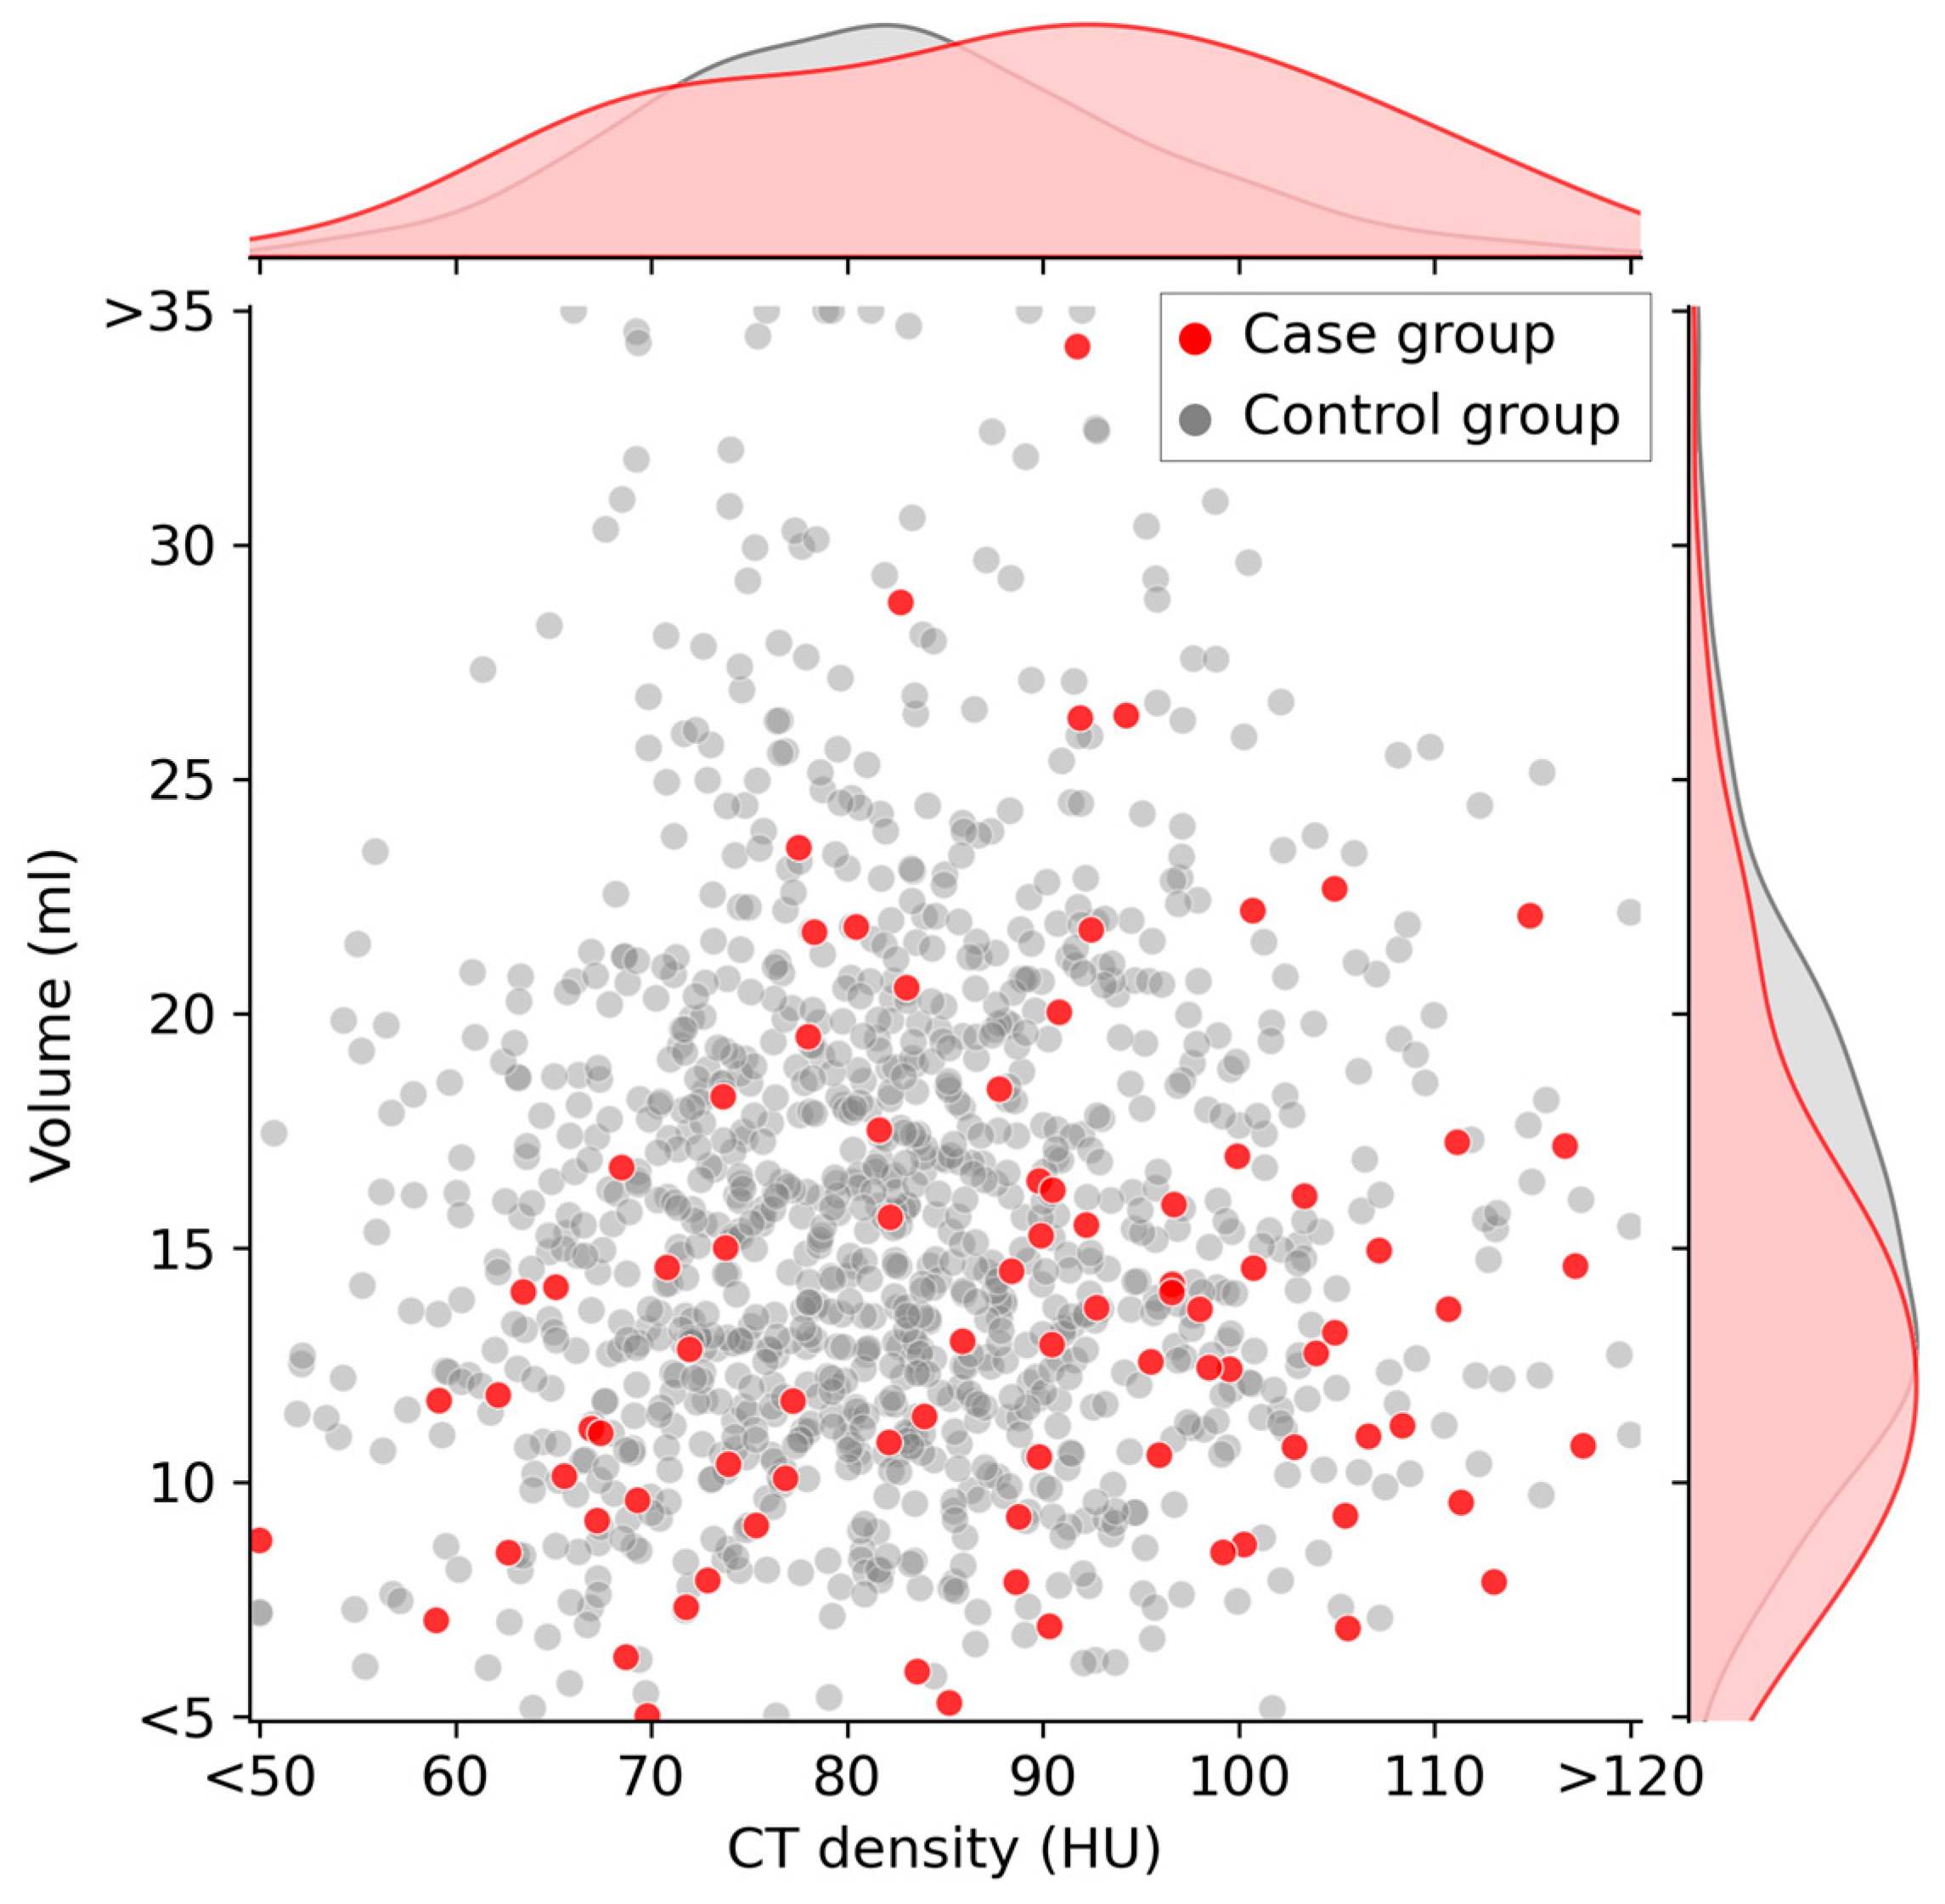
| CT density (HU) (Median [IQR]) | 89.8 [74.3–99.8] | 81.7 [73.5–90.0] | <0.01 |
| Volume (mL) (Median [IQR]) | 13.0 [10.1–16.4] | 15.3 [11.9–19.2] | <0.01 |
| Non-Adjusted Odds Ratio (95%CI) | p-Value | Multivariable-Adjusted Odds Ratio * (95% CI) | p-Value | |
|---|---|---|---|---|
| CT density (+10 HU) | 1.40 (1.16–1.67) | <0.01 | 1.44 (1.17–1.77) | <0.01 |
| Volume (−3 mL) | 1.26 (1.10–1.45) | <0.01 | 1.33 (1.11–1.59) | <0.01 |
| Baseline | End of Follow-Up * | p-Value | Changes | |
|---|---|---|---|---|
| TSH | ||||
| Case group | 2.80 [2.23–3.63] | 5.21 [4.89–5.76] | ** | 2.53 [1.80–3.25] |
| Control group | 1.30 [0.87–1.84] | 1.32 [0.92–1.85] | ** | 0.02 [−0.27–0.35] |
| T4 | ||||
| Case group | 1.12 [1.00–1.26] | 1.09 [0.99–1.21] | <0.01 | −0.03 [−0.17–0.11] |
| Control group | 1.08 [0.92–1.23] | 1.05 [0.87–1.17] | 0.04 | −0.04 [−0.23–0.11] |
| CT density | ||||
| Case group | 89.8 [74.3–99.8] | 77.5 [66.0–90.7] | <0.01 | −8.4 [−17.1–−1.1] |
| Control group | 81.7 [73.5–90.0] | 78.3 [71.0–86.5] | <0.01 | −2.9 [−8.5–1.8] |
| Volume | ||||
| Case group | 13.0 [10.1–16.4] | 13.1 [9.9–16.3] | 0.23 | −0.1 [−1.9–1.2] |
| Control group | 15.3 [11.9–19.2] | 15.1 [12.0–18.9] | 0.29 | −0.1 [−1.4–1.2] |
| Coefficient | Standard Error | 95%CI | p-Value | |
|---|---|---|---|---|
| Constant | 0.124 | 0.034 | 0.058–0.190 | <0.01 |
| Changes in CT (HU) | −0.022 | 0.003 | −0.029–−0.015 | <0.01 |
Disclaimer/Publisher’s Note: The statements, opinions and data contained in all publications are solely those of the individual author(s) and contributor(s) and not of MDPI and/or the editor(s). MDPI and/or the editor(s) disclaim responsibility for any injury to people or property resulting from any ideas, methods, instructions or products referred to in the content. |
© 2023 by the authors. Licensee MDPI, Basel, Switzerland. This article is an open access article distributed under the terms and conditions of the Creative Commons Attribution (CC BY) license (https://creativecommons.org/licenses/by/4.0/).
Share and Cite
Kikuchi, T.; Hanaoka, S.; Nakao, T.; Nomura, Y.; Yoshikawa, T.; Alam, M.A.; Mori, H.; Hayashi, N. Relationship between Thyroid CT Density, Volume, and Future TSH Elevation: A 5-Year Follow-Up Study. Life 2023, 13, 2303. https://doi.org/10.3390/life13122303
Kikuchi T, Hanaoka S, Nakao T, Nomura Y, Yoshikawa T, Alam MA, Mori H, Hayashi N. Relationship between Thyroid CT Density, Volume, and Future TSH Elevation: A 5-Year Follow-Up Study. Life. 2023; 13(12):2303. https://doi.org/10.3390/life13122303
Chicago/Turabian StyleKikuchi, Tomohiro, Shouhei Hanaoka, Takahiro Nakao, Yukihiro Nomura, Takeharu Yoshikawa, Md Ashraful Alam, Harushi Mori, and Naoto Hayashi. 2023. "Relationship between Thyroid CT Density, Volume, and Future TSH Elevation: A 5-Year Follow-Up Study" Life 13, no. 12: 2303. https://doi.org/10.3390/life13122303