Focus Prosody Varies by Phrase-Initial Tones in Seoul Korean: Production, Perception, and Automatic Classification

1
Department of English Language and Literature, Cheongju University, Cheongju 28503, Korea
2
Linguistic Data Consortium, University of Pennsylvania, Philadelphia, PA 19104, USA
*
Authors to whom correspondence should be addressed.
Languages 2020, 5(4), 64; https://doi.org/10.3390/languages5040064
Submission received: 22 September 2020
/
Revised: 6 November 2020
/
Accepted: 11 November 2020
/
Published: 18 November 2020
Abstract
:Production and perception experiments were conducted to examine whether focus prosody varies by phrase-initial tones in Seoul Korean. We also trained an automatic classifier to locate prosodic focus within a sentence. Overall, focus prosody in Seoul Korean was weak and confusing in production, and poorly identified in perception. However, Seoul Korean’s focus prosody differed between phrase-initial low and high tones. The low tone group induced a smaller pitch increase by focus than the high tone group. The low tone group was also subject to a greater degree of confusion, although both tone groups showed some degree of confusion spanning the entire phrase as a focus effect. The identification rate was, therefore, approximately half in the low tone group (23.5%) compared to the high tone group (40%). In machine classification, the high tone group was also more accurately identified (high: 86% vs. low: 68%) when trained separately, and the machine’s general performance when the two tone groups were trained together was much superior to the human’s (machine: 65% vs. human: 32%). Although the focus prosody in Seoul Korean was weak and confusing, the identification rate of focus was higher under certain circumstances, which avers that focus prosody can vary within a single language.
1. Introduction
Focus highlights a particular element in a sentence (Bolinger 1972; Xu and Xu 2005). It is normally modulated by prosodic prominence to emphasize its importance in communication. However, prosodic prominence marking focus varies according to each language’s prosodic system. For example, in English, prominence is marked by a post-lexical pitch accent on the head (i.e., a stressed syllable) of a word (Beckman and Pierrehumbert 1986; Cohan 2000; Jun 2011; Ladd 1996). Additionally, prosodic focus in American English is well identified by a machine classifier with a high accuracy (92%) (Cho et al. 2019). In Mandarin Chinese, it is also cued by the head of a word, but is distinctively characterized by the tone shape of individual lexical tones (Lee et al. 2016; Liu 2009; Yuan 2004). However, in Seoul Korean (SK), focus is expressed through prosodic phrasing in which a new phrase boundary is inserted before the focused word and prominence occurs throughout the entire focused word (Jun 2011; Lee 2012). Based on Jun’s (Jun 2005, 2014) prosodic typology, English and Mandarin Chinese belong to head-prominence languages. However, SK is labeled as an edge-prominence language because prominence is realized by marking the edge of a prosodic constituent. In order to understand the details of the current study, we first briefly overview SK’s prosodic system. We then provide a detailed description of how prosodic focus is manifested in SK. Finally, we present our research goals.
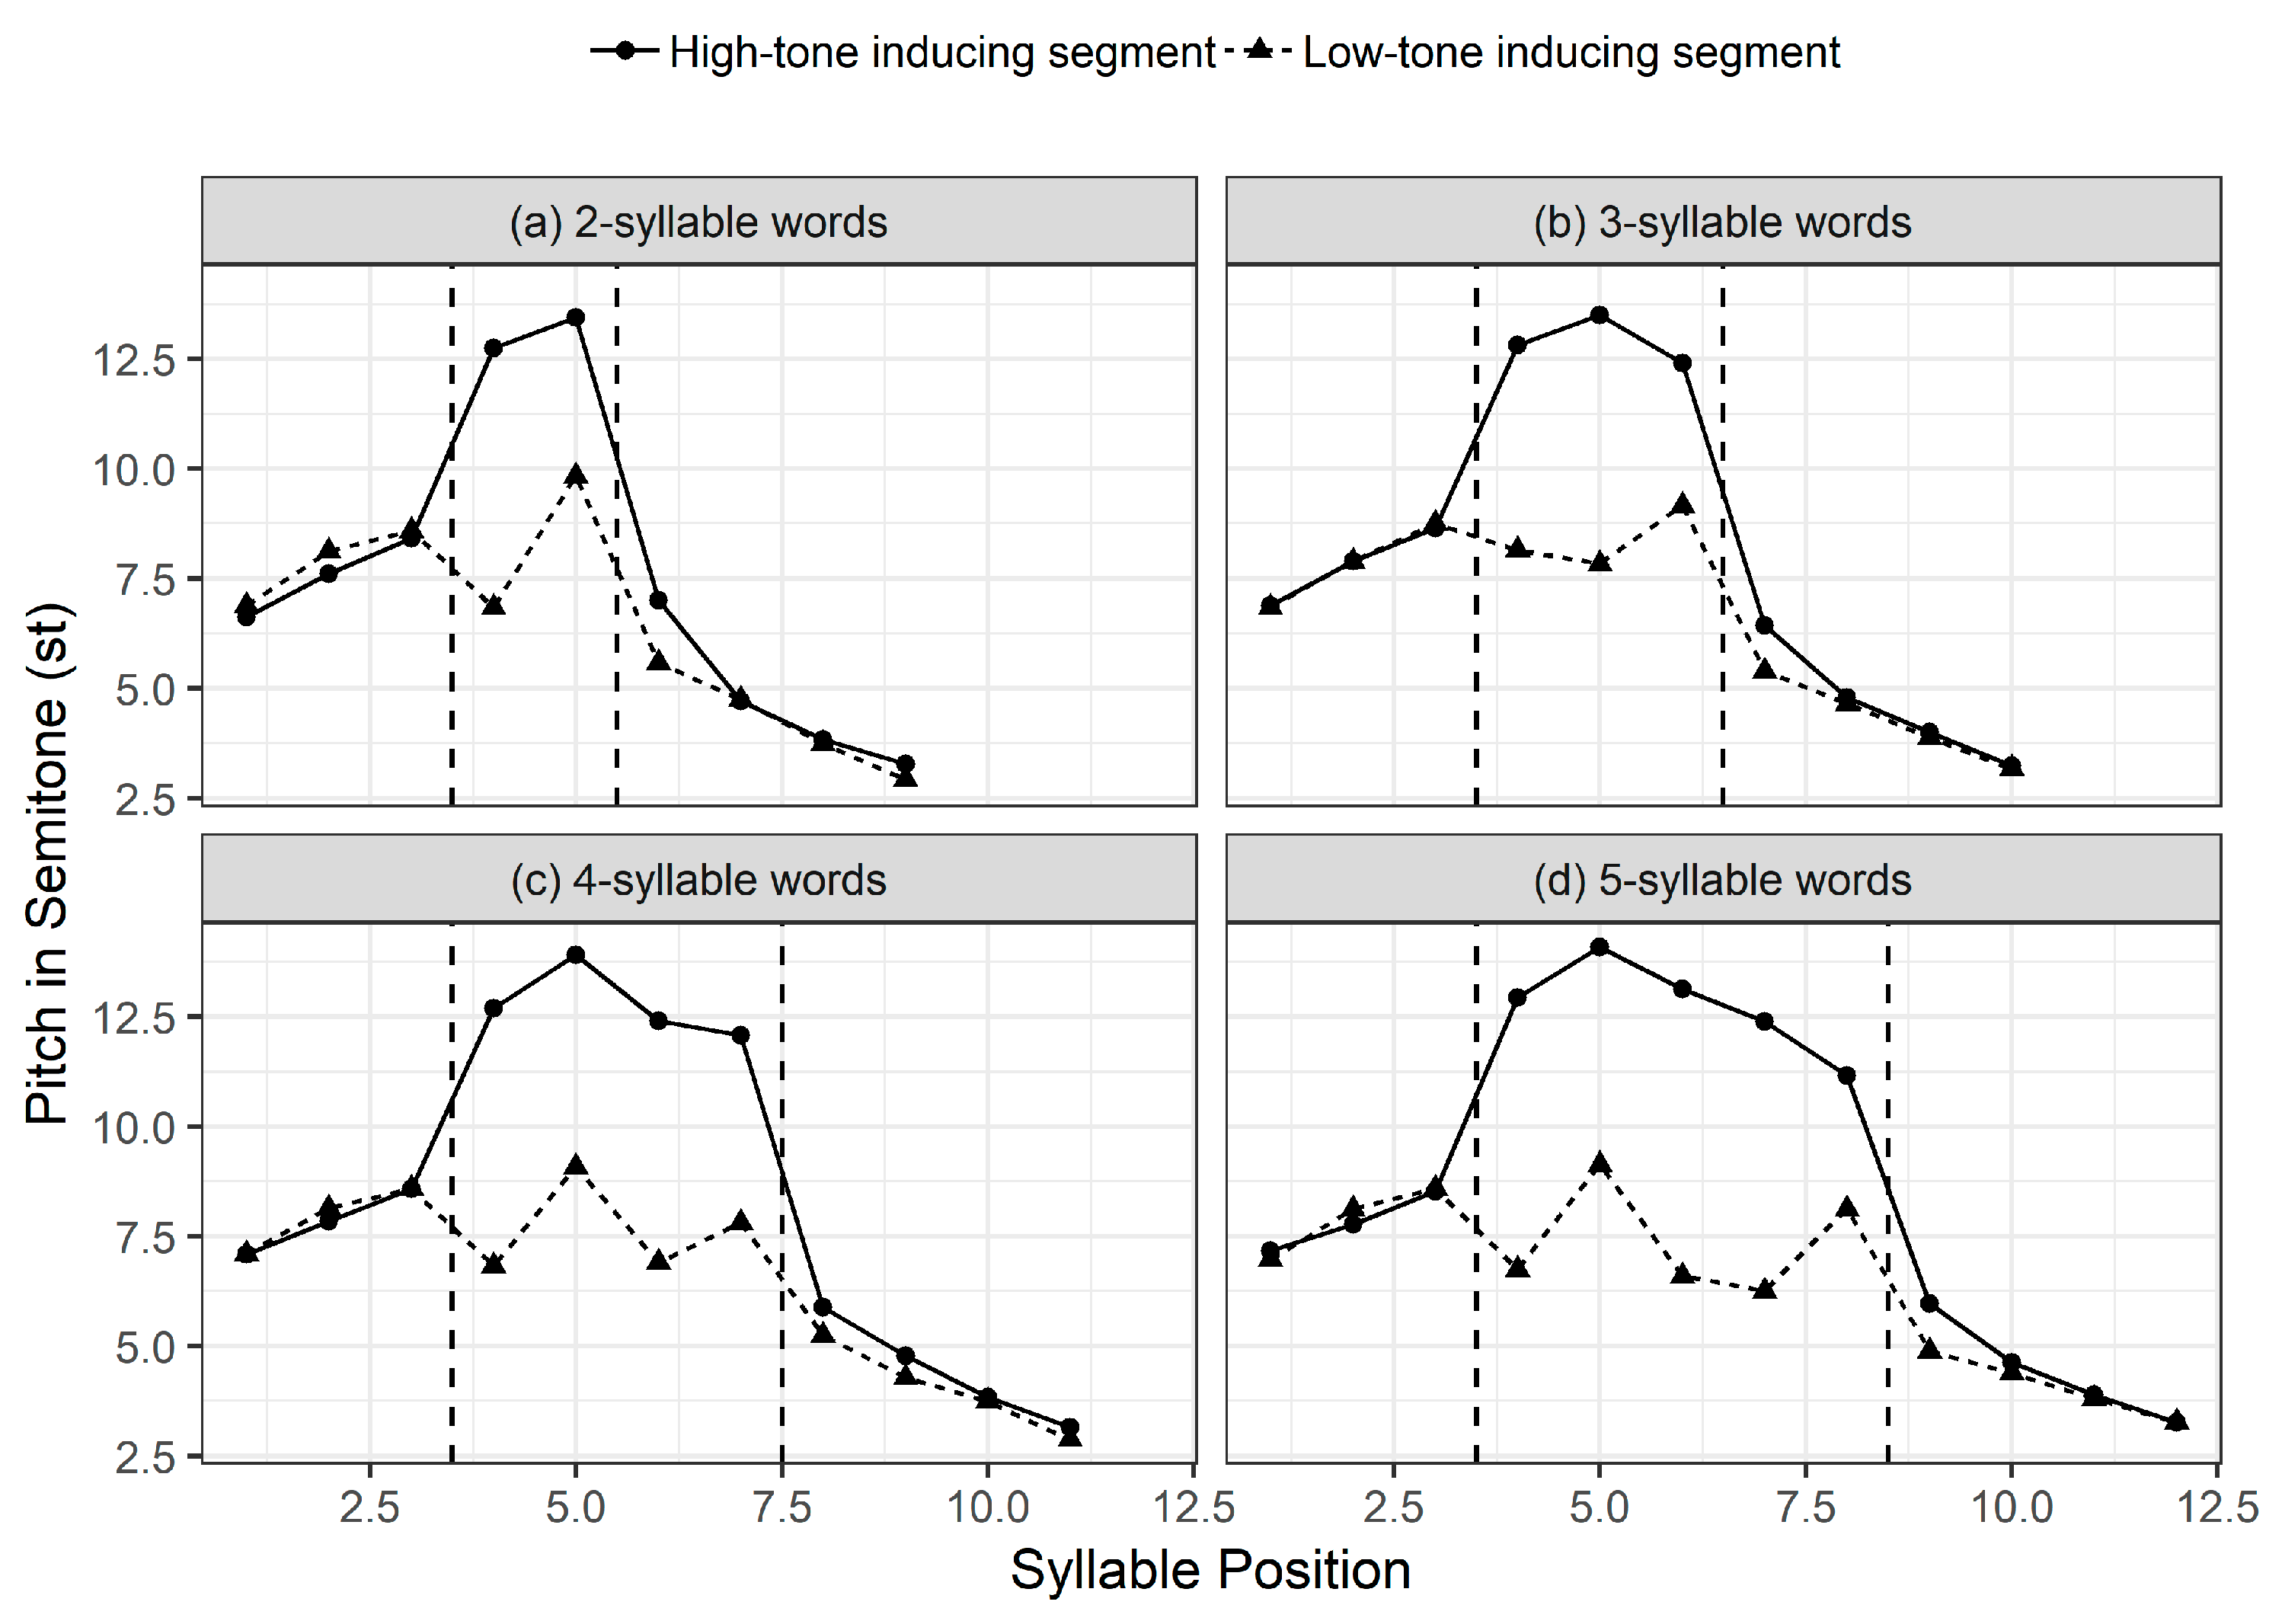
SK has neither lexical stress nor lexical pitch accents (Ueyama and Jun 1998; Song 2005). Instead, in default prosodic phrasing, each content word usually forms a small prosodic unit called an Accentual Phrase (AP) (Jun 1998) that is tonally marked at the post-lexical level. The typical melody of an AP is either LH-LH or HH-LH, depending on an AP-initial onset segment. The AP-initial tone is high when the initial onset has the feature [+aspirated/tense], while it is low when the initial onset has the feature [−aspirated/tense]. Intermediate H-L tones (either one or both) are omitted from APs that contain less than four syllables, resulting in several tonal patterns: L-H, L-LH, LH-H, H-H, H-LH, HH-H. Regarding the AP melody of SK, recent studies (Cho and Lee 2016; Cho 2017) showed that AP’s pitch target is much higher when it begins with a high-tone inducing segment and the high pitch is retained toward the final syllable of an AP. The tonal pattern of an AP with a high-inducing initial consonant even shows a high plateau, particularly when the number of syllables within an AP is two or three, as demonstrated in Figure 1. This seems to be why the AP with a high-inducing initial segment does not have a clear HH-LH pattern in Figure 1, unlike the basic melody of TH-LH in SK. Please see Cho and Lee (2016) for further discussion of the results.
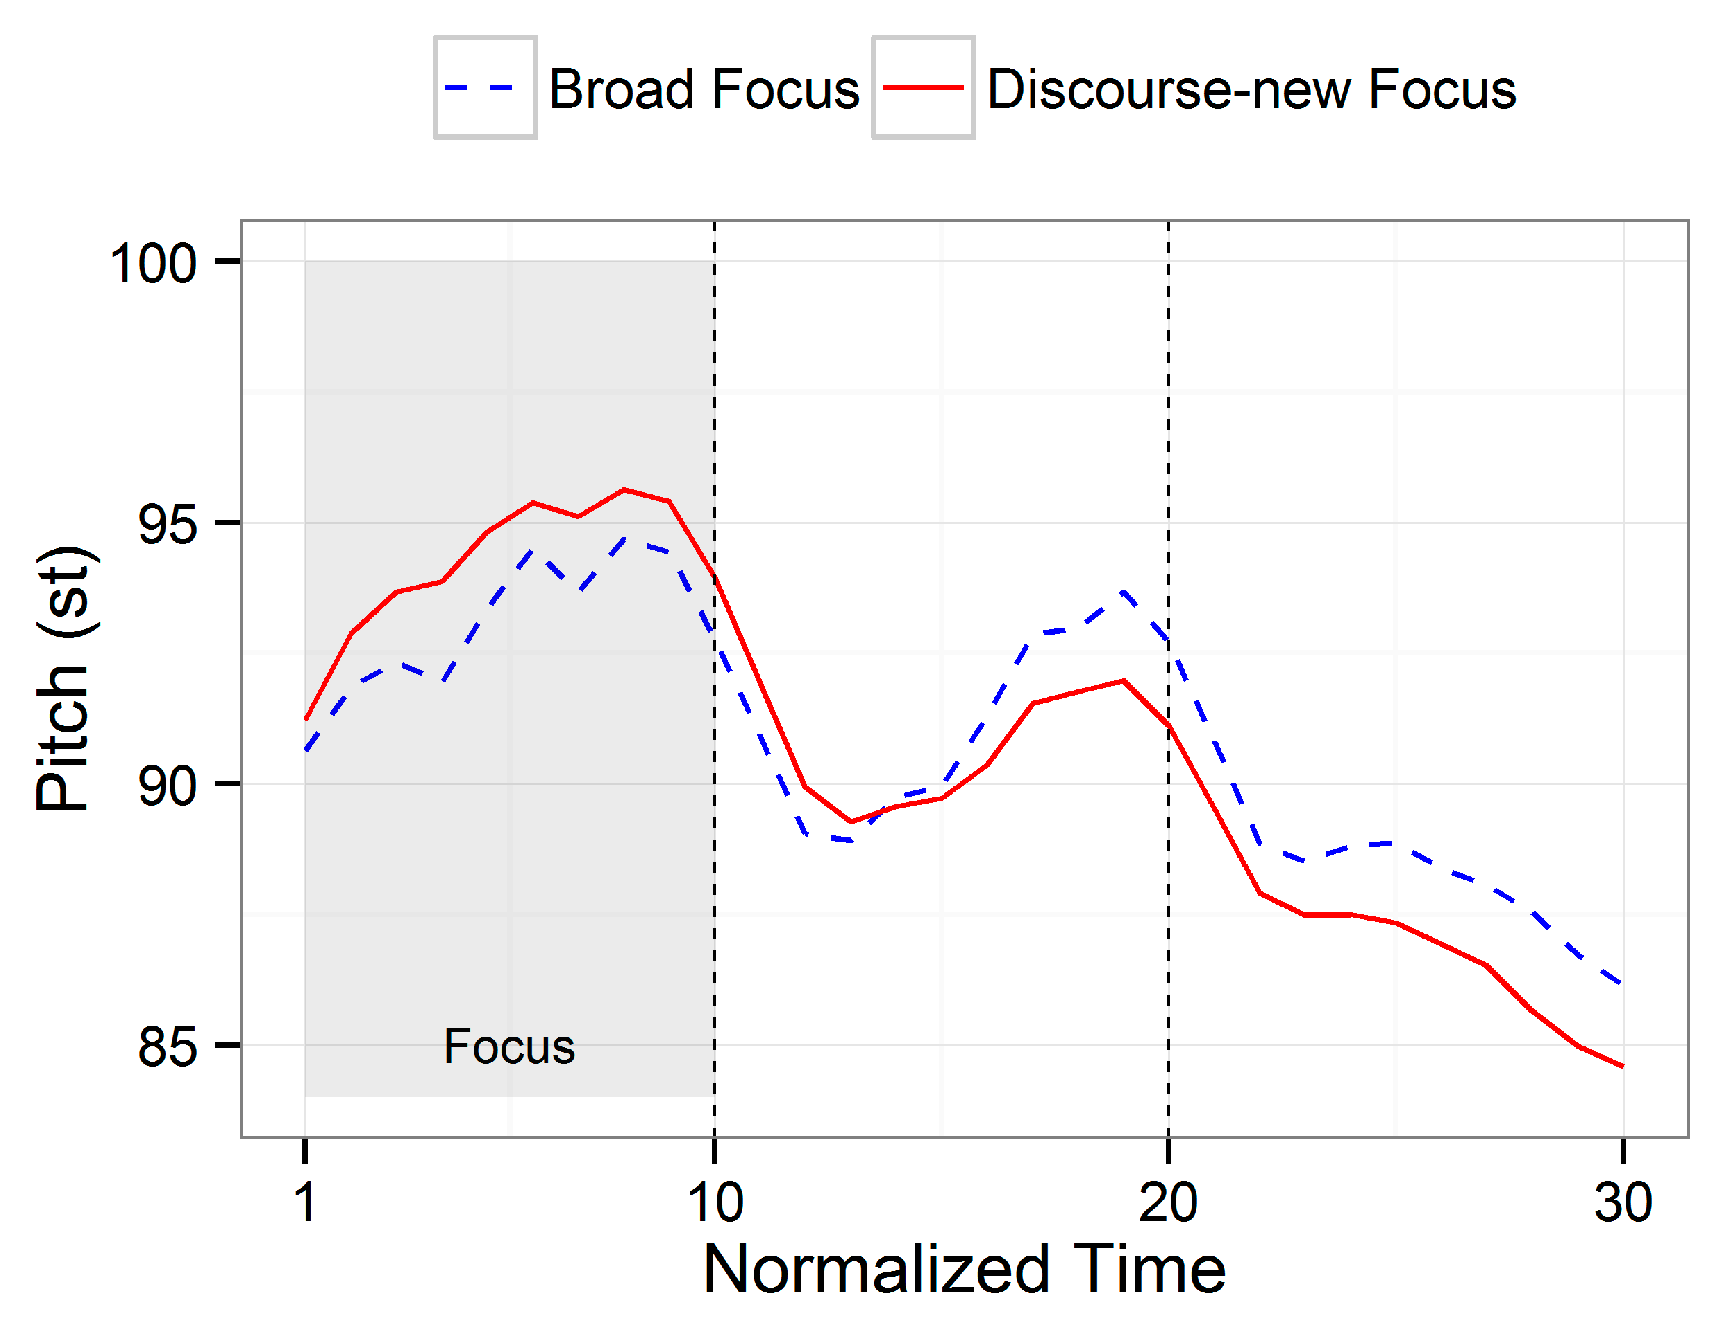
Figure 2 depicts SK’s focus realizations when a focused word starts with a low-tone inducing segment. Focus conditions were produced in an experimental setting in which six native speakers of SK read stimuli in isolation for broad focus and produced the same stimuli in a Q&A dialogue for discourse-new focus. Each stimulus was repeated six times in each condition by each of the six speakers. The differences in prosodic realizations between the two focus conditions reveal three noteworthy features. First, discourse-new focus produces a higher pitch as compared to broad focus, and the pitch increase clearly spans the entire focused word. Second, the pitch increase induced by focus is fairly small—just 1.18 extra pitch in semitones (st). The value of 1.18 st is similar to the interval between the C and C# pitches of an equal-tempered musical scale. Based on empirical findings, a difference of 1.5 st is needed in order to recognize a change in prominence of perception (Rietveld and Gussenhoven 1985). This suggests that when a focused element begins with a low tone, prosodic modulation by focus in SK is weak and is thus not perceptually salient for listeners. Lastly, focus does not change the AP tonal pattern; that is, the same pitch contours are observed whether a focused element is present or not.
Prosodic focus in SK has received considerable attention in the literature (Jun and Lee 1998; Jeon and Nolan 2017; Lee and Xu 2010; Oh and Byrd 2019), yet our understanding of its exact nature is still incomplete. More importantly, no research has been conducted examining how prosodic marking of focus interacts with the tonal contrast derived from different laryngeal features of SK’s AP-initial onset segment. Stimuli designed in previous studies lacked aspirated/tense segments in order to avoid pitch perturbation (Jo et al. 2006; Jun and Kim 2007; Jun and Lee 1998; Lee and Xu 2010; Lee 2009, 2012). If these previous studies had included aspirated/tense segments, potential differences caused by tonal contrast may have been observed in marking prosodic focus. We hypothesize that there may be differences in marking prosodic focus depending on an AP-initial tone. The reason for this hypothesis will be discussed in detail in the next paragraph.
The AP-initial tonal contrast (low vs. high) is an excellent case for testing whether prosodic marking of focus varies in different pitch-scaling conditions. Liberman and Pierrehumbert, 1984, suggested that pitch appears to show downstepping patterns over the course of a sentence toward a speaker’s baseline (B). This suggests that the scaling of F0 values should be evaluated as “baseline units above the baseline”, where “baseline” represents the bottom of the speaker’s range at a given level of vocal effort. The scaled intonational value (Int) is represented by the following equation:
or in the other direction
Int = (F0 − B)/B
F0 = Int × B + B
Based on Equation (2), if B is 100 Hz and Int is 1, we have 200 Hz (F0 = 1 × 100 + 100). If focus scaling is applied to the Int value, then a 30% increase in an Int value of 1 will turn out to be 230 Hz (F0 = 1.30 × 100 + 100), which is 15% higher in pitch (230/200). If the focus scaling is down to 10%, we may only have 210 Hz (F0 = 1.1 × 100 + 100), which is merely a 5% increase in pitch (210/200). Because focus scaling has a multiplicative effect on the Int value, higher pitches will have a greater impact than lower pitches, in terms of F0 ratios. This leads us to hypothesize that higher pitches more effectively mark prosodic focus as compared to lower pitches, in both production and perception. Thus, prosodic marking of focus for a syllable with [+aspirated/tense] segments will be more effective in production and also more identifiable in perception than a syllable with [−aspirated/tense] segments.
Although previous research on focus prosody in SK has been based primarily on regular sentences, the current study examines the focus prosody of telephone numbers. We believe that phone number strings provide an appropriate experimental setting for assessing the interplay between the AP initial tonal contrast and prosodic focus, because the individual digits of a phone number string do not behave like separate monosyllabic words, even though each digit is morphologically one word. That is, in a phone number string, ten digits tend to be produced in three phrases, (NNN)-(NNN)-(NNNN), grouping three or four monomorphemic words together. Since the subgrouping of digits in a phone number string form a tight prosodic unit and each digit does not behave like one word, focusing a phrase-internal digit does not generate a separate AP. Thus, as observed in Figure 1, when a L-toned digit is focused in the initial position of a digit string in non-sentence-final positions, the AP begins with a low tone and typically ends with a high tone, since prosodic realization of focus would differ by an AP-initial tone (low or high). This means that when a focused element begins with a low tone in sentence-medial positions, the initial focused digit will not be higher in pitch than the subsequent digit(s) because it bears a low tone. In this case, the initial low tone would not be high enough to be perceptually recognized, compared to the subsequent digit(s). We expect that this will make the focused L-toned digit confusing in perception within an AP, that is, native listeners will have difficulty in identifying which digit is focused. When an initial H-toned digit is in focus, the AP will begin with a high tone and the following will also show a high tone because the tonal melody is HH-LH when an initial segment has the feature [+aspirated/tense]. This indicates that the focused H-toned digit will be as high in pitch as the subsequent digit(s) within an AP, still rendering the focused H-toned digit confusing, but to a lesser extent compared to the focused L-toned digit. Therefore, although both focused L-toned and H-toned digits produce a confusing prosodic marking of focus, we hypothesize that the focused L-toned digit will be even more confusing, and listeners will have difficulty identifying it.
Before formulating the hypotheses, it should be noted that previous studies revealed noticeably distinct trends in focus prosody across languages. Focus prosody was clearly marked in production and accurately recognized in perception (over 90%) in English (Lee 2015) and Mandarin Chinese (Lee et al. 2016), but neither clearly marked in production nor accurately recognized in perception (below 50%) in Tokyo Japanese (Lee et al. 2018) and South Kyungsang Korean (Lee et al. 2019). The results of this study are expected to indicate an important typological difference between languages with and without clear prominence of focus prosody which certainly merits broader study.
Based on all of the considerations discussed above, we propose three hypotheses predicting how SK focus prosody is manifested. First, prosodic marking of focus is weak overall in production, given the small increase in pitch induced by prosodic focus as shown in Figure 2, but a focused H-toned digit will show a (relatively) greater impact than its L-toned focused counterpart, in terms of F0 ratios (Liberman and Pierrehumbert 1984). Second, the prosodic marking of focus in the AP-initial position is confusing overall in perception because of AP’s tonal melodies, but a focused L-toned digit will be associated with a greater degree of confusion than a focused H-toned digit. Third, a machine classifier will have difficulties in correctly identifying prosodic focus in SK due to weak and confusing prosodic cues, but a focused H-toned digit will be better identified than a focused L-toned digit. To test these hypotheses, we conducted production and perception experiments with 10-digit phone number strings and trained a machine learning classifier with prosodic cues that were obtained from the production experiment.
2. Production
2.1. Method
2.1.1. Stimuli
Using a Python script, 100 10-digit phone number strings were created in which each digit (i.e., 0–9) occurred equally in each position, and each pair of adjoining digits (e.g., 01, 87) occurred equally across each pair of sequences. The target strings were presented to participants in two conditions. In one condition, for broad focus, the target strings in a carrier sentence were shown in isolation. In the other condition, for corrective focus, the same strings were embedded in a Q&A form, as shown in below. In the Q&A dialogue, person A asked if a phone number was correct, and person B answered the question with the intended target string by correcting one inaccurate digit. The answer with corrective focus was used for analysis.
| A: | mina-ɰi | bʌnho-ga | 887-412-4699-ja. | matɕi? |
| Mina-POSS | number-NOM | 887-412-4699-DEC | right | |
| ‘Mina’s number is 887-412-4699. Right?’ | ||||
| B: | anija, mina-ɰi | bʌnho-nɯn | 787-412-4699-ja. | |
| no | Mina-POSS | number-TOP | 787-412-4699-DEC | |
| ‘No, Mina’s number is 787-412-4699.’ | ||||
Table 1 displays SK numerical digits from 0 to 9 and the onset consonant type of each digit. The digits are classified into two groups—high and low—depending on their AP-initial tonal contrast. The high tone group includes the following digits: 3 [sham], 4 [sha], 7 [tɕhil], and 8 [phal], whose onset consonants are associated with aspiration/tenseness, as well as 1 [il], which is reported to be produced with a lexically specified H tone (Cho 2018; Jun and Cha 2011, 2015). The other digits (0, 2, 5, 6, 9) belong to the low tone group. Since tonal contrast appears AP-initially in SK, we examined AP-initial digits only for analysis. The bolded AP-initial digits are target digits tested in this study (i.e., NNN), which is further explained in detail below.
2.1.2. Subjects
Five SK native speakers (two males and three females) ranging in age from 23 to 32 years (mean age: 29.4 years, SD: 3.8) participated in the production experiment. The participants were recruited at a university in the US, and they reported that they had been in the US for less than a year at the time of recording. The participants signed a consent form and received 10 dollars as compensation for their participation. None of the participants reported any speech or hearing disorder. All subjects gave their informed consent for inclusion before they participated in the study. The study was conducted in accordance with the Declaration of Helsinki, and the protocol #818905 was approved by the University of Pennsylvania IRB #8.
2.1.3. Recording Procedure
Recordings were made in a sound-proof booth at the same university in the US using a Plantronics headset microphone, and were saved directly onto a laptop as 16-bit wave files at a sampling rate of 44.1 kHz. Target stimuli were presented to speakers through PowerPoint slides.
Speakers were seated in front of a laptop monitor, wearing the headset microphone. Before recording each of the broad- and corrective-focus conditions, speakers practiced three sample trials to introduce them to the recording procedure and to enable them to be aware of the discourse context, in which a certain digit was wrong and it needed to be corrected in the production. As shown in Figure 3, in the broad-focus condition, speakers read target stimuli in a carrier sentence, and in the corrective-focus condition, they first listened to pre-recorded prompt questions (i.e., person A in the above Q&A dialogue) through headphones and then produced target strings as answers. Broad-focus readings were recorded first, followed by corrective-focus readings. Recording times were approximately 15 and 25 min for broad focus and corrective focus, respectively, and there was a short intermission between the focus conditions.
2.1.4. A Sketch of Pitch Contours
We first describe sample pitch contours that enable us to capture the prosodic differences between the broad focus and the corrective focus of each tone group. In this study, each digit in each phone number string was labeled, and pitch contours sampled at ten equidistant points of the labeled digit were obtained, using ProsodyPro (Xu 2013). When a creak—often occurring at the vowel onset—was found in labeling each digit, we actually included the portion showing the creak and used the portion in the acoustic analysis. When a coda consonant was followed by an onset consonant with a single closure (for example, kku in /juk.ku/ ‘six nine’), the closure was divided into two halves, each one included as a closure of each consonant. Furthermore, when pitch halving or doubling errors were detected during the inspection of pitch contours, they were manually corrected using a TD-PSOLA (Time Domain Pitch Synchronous Overlap-Add) technique in Praat. Pitch contours in Hertz were then converted to semitones (st) using the following equation (Lee et al. 2016; Xu and Wang 2009): st = 12log2Hz. This is because pitch in semitones increases linearly, contrary to the hertz scale that increases non-linearly (Nolan 2003).
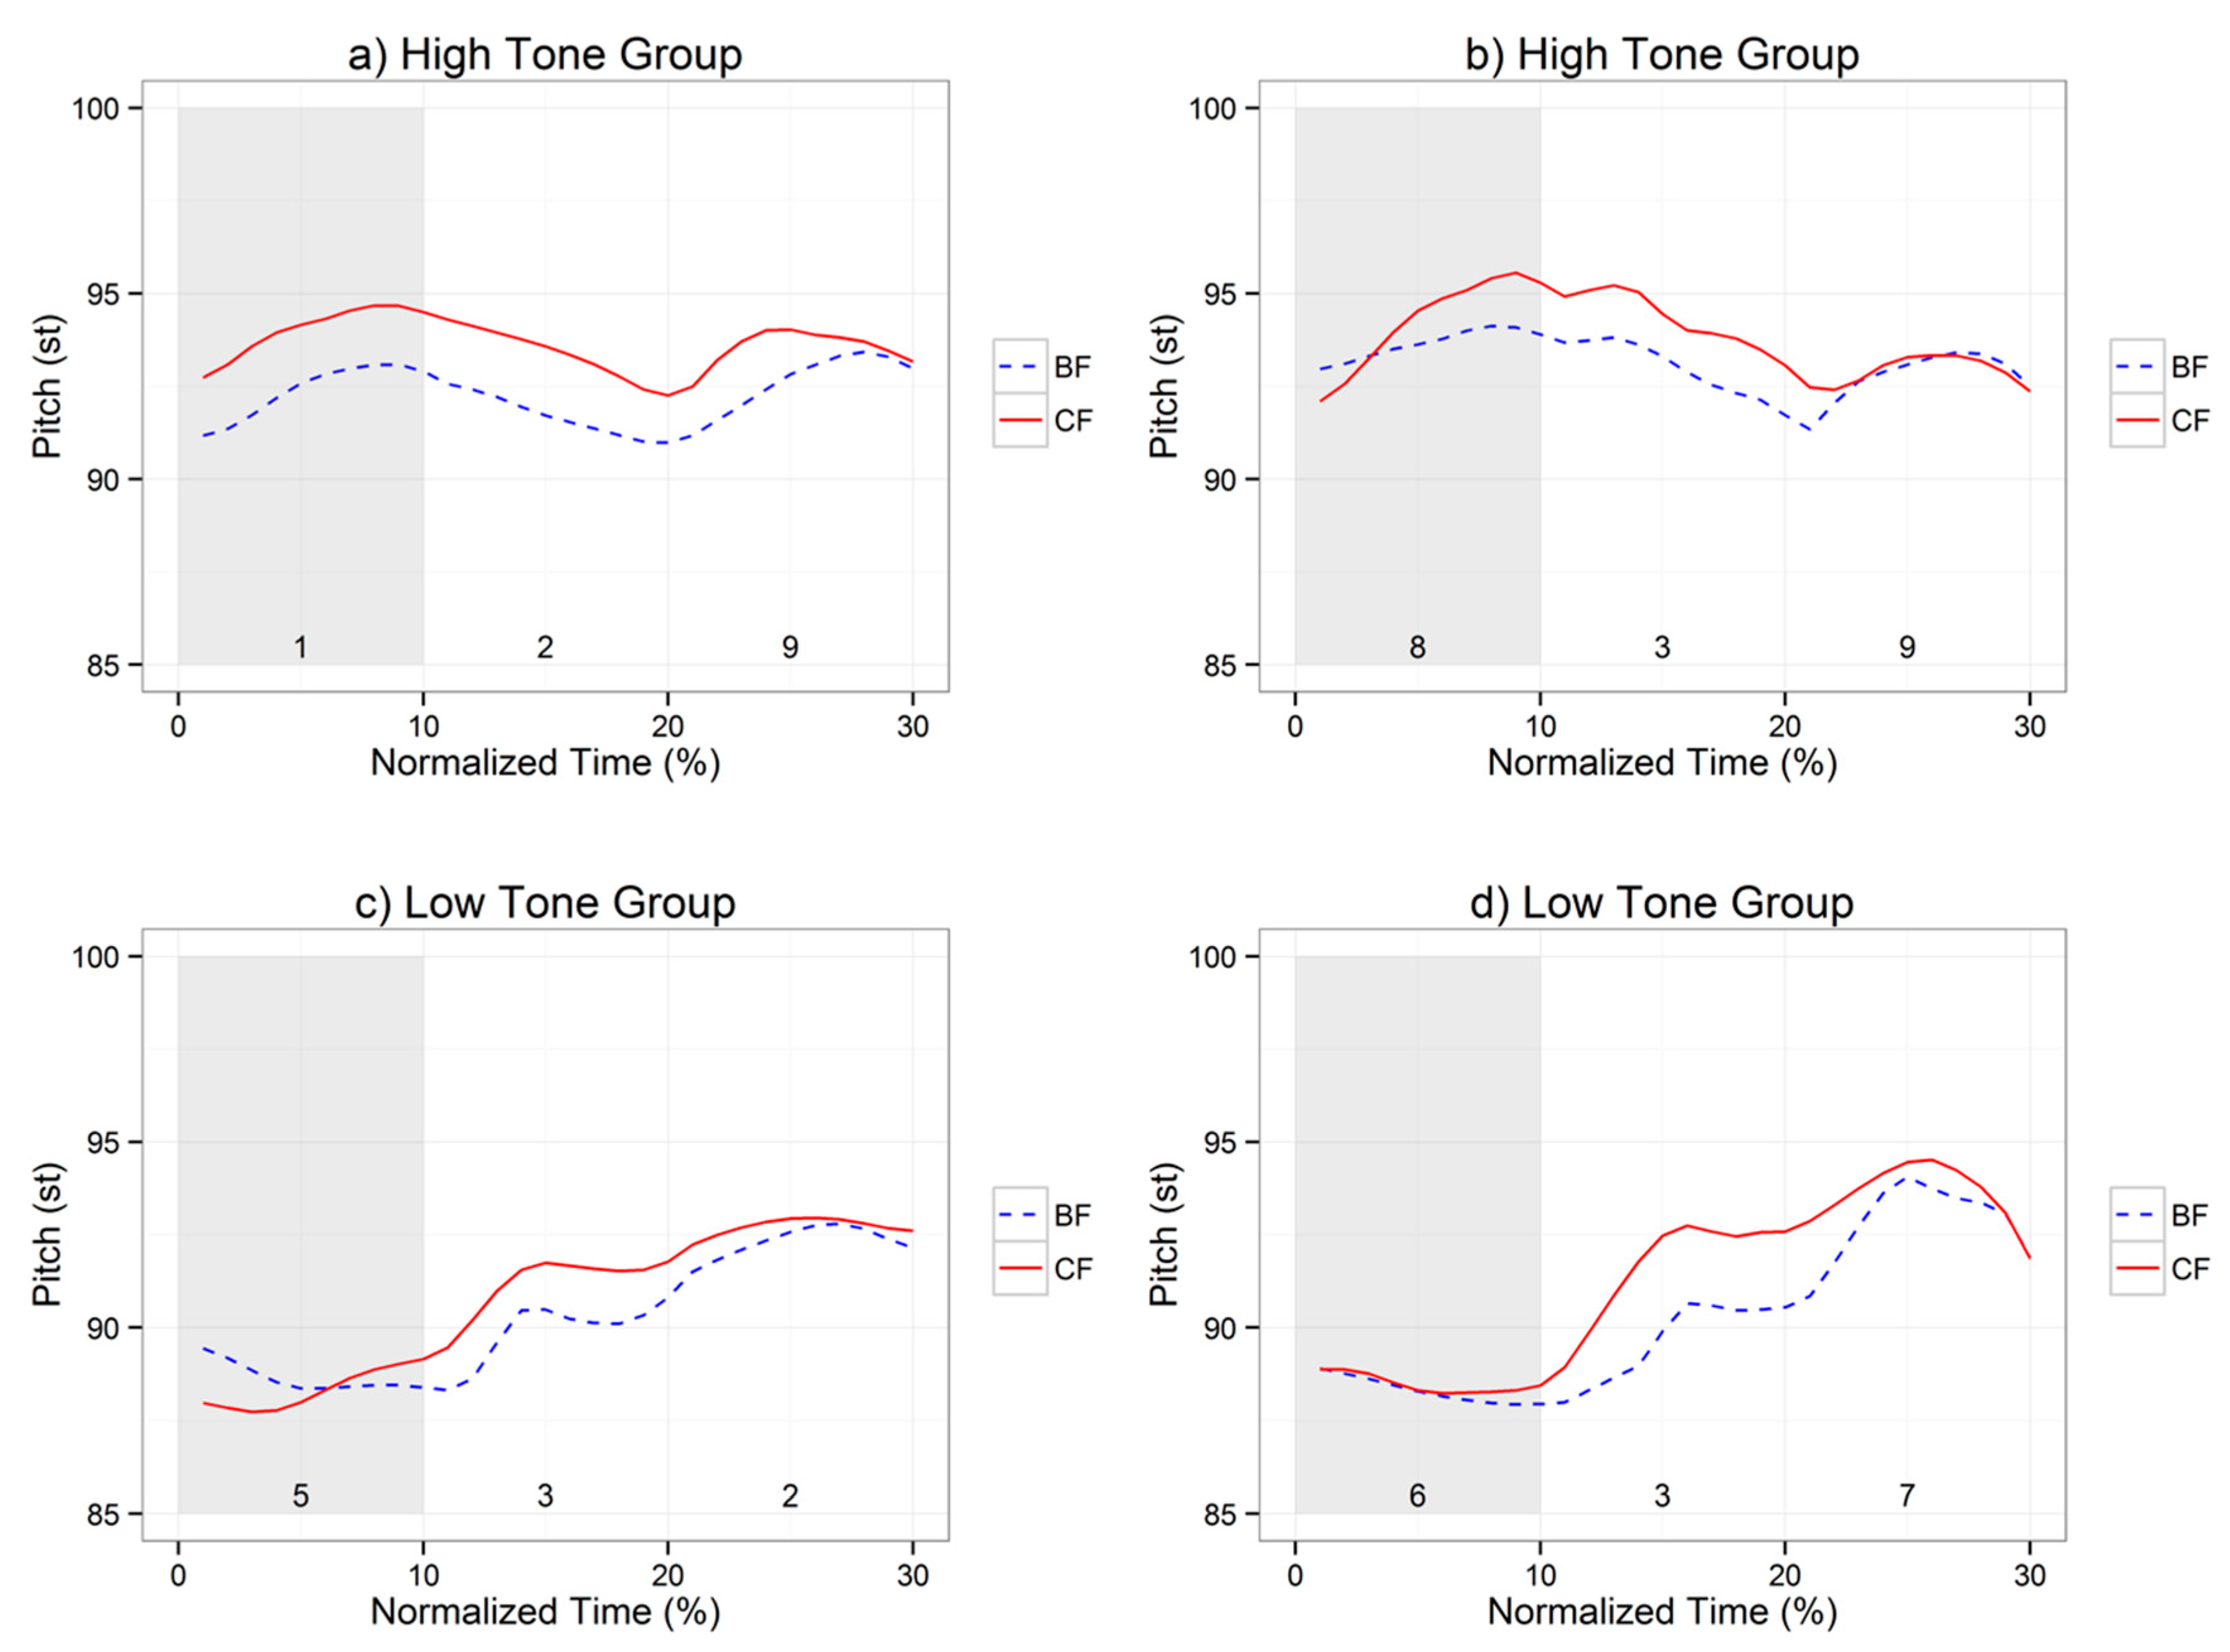
Figure 4 displays the time-normalized pitch contours of broad focus and corrective focus. Since only one digit is produced with corrective focus, only the phrase containing the corrected digit is shown here, while the other phrases are omitted for simplicity’s sake. In Figure 4, the numerical digits in each panel refer to the digits used for the first phrase, and the shaded area represents a focus position. The digits ‘1’ and ‘8’ in the top panels belong to the high tone group, and the digits ‘5’ and ‘6’ in the bottom panels belong to the low tone group. Two noticeable features can be seen in Figure 4. First, prosodic marking of focus differs strikingly by tonal contrast. It seems that only the digits in the high tone group are realized with a clearly increased pitch range in the focus position, relative to those in the low tone group, suggesting that prosodic marking of focus is more salient in the high tone group than in the low tone group. Second, it appears that focus does not modulate one single digit for both tone groups. All plots in Figure 4 show that the pitch level of positions 2 and/or 3 are also increased, although only position 1 was in focus. This indicates that both tone groups produced a confusing prosodic marking of focus.
2.2. Analyses
To evaluate how prosodic marking of focus varies by tone group, we directly compared the low and high tone groups in AP-initial focused positions (i.e., NNN) in two focus conditions (broad and corrective). We first examined 1000 digit strings by spectrogram reading and listening to determine whether speakers actually phrased at the hyphens in phone number strings. That is, our examination was focused on identifying whether each digit group demarcated by hyphens was produced as a separate phrase—here an AP. Unlike the 3-digit groups that were always produced as one phrase in both broad- and corrective-focus conditions, the 4-digit group was often produced as one phrase (i.e., NNNN), but was sometimes divided into two phrases (i.e., NN-NN). This inconsistency was due to the declarative morpheme (-ja or -ija) attached to the 4-digit group at the end. The choice of the morpheme depends on the presence of the coda consonant before it. When the coda consonant is present, -ija is attached; otherwise, -ja is used as a morpheme. To achieve consistency, 4-digit groups were excluded from further analysis, and only the AP-initial focused position in 3-digit groups was analyzed. Furthermore, in contrast to the assertion that a new ip boundary is inserted before a focused element (Jun and Cha 2015), we did not consider the ip boundary cue because the existence of the ip has not yet been generally accepted among researchers (e.g., Jeon and Nolan 2017).
In this production experiment, a total of 1000 digit strings (5 speakers × 2 focus conditions × 10 digits × 10 string positions) were obtained. However, because only 3-digit AP groups were included, the total number of target digit strings was reduced to 200 (5 speakers × 2 focus conditions × 10 digits × 2 string positions). Classifying the 200 digits by tone group yielded 100 target digits in the low tone group and 100 target digits in the high tone group. This division is based on the fact that, as previously mentioned, there are five digits (0, 2, 5, 6, 9) in the low tone group and five (1, 3, 4, 7, 8) in the high tone group.2
For acoustic measurements, measures of duration in milliseconds (ms), mean intensity in decibels (dB), and maximum pitch (st) were aggregated in order to observe whether each acoustic cue plays an important role in marking prosodic focus in SK. Among several pitch-related cues, maximum pitch was selected because the overall behavior for both tone groups showed an increase in pitch range to signal prominence for focus. Therefore, we found that maximum pitch best captures the difference in pitch range between broad focus and corrective focus. The measures of duration, mean intensity, and maximum pitch were taken from all the target digits and averaged in each focus condition and each tone group. For the sake of simplicity, we will henceforth refer to duration, mean intensity, and maximum pitch as duration, intensity, and pitch, respectively.
In the present study, we used three different analyses to determine how corrective focus was realized differently from broad focus in both tone groups. The first analysis (Section 2.3.1) focused on AP-initial positions to determine whether corrective focus produced more prominent acoustic cues than broad focus. Next, based on observations from Figure 4, the second analysis (Section 2.3.2) addressed whether prosodic modulation by focus spanned the entire phrase as a focus effect in both tone groups. To do so, focus position was divided into two positions: On-focus and post-focus. Since position 1 was focused in each AP of a digit string, it was labeled as “on-focus,” and the other positions were labeled as “post-focus.” Based on this method, the aggregate measures of duration (ms), intensity (dB), and pitch (st) in each of the two focus positions were calculated by subtracting broad focus from corrective focus. Finally, in the third analysis (Section 2.3.3), the pitch contours of each position (i.e., NNN) were compared at the AP level to identify whether an AP-initial position in the low tone group was tonally more constrained in marking prosodic focus as compared to the high tone group.
A series of linear mixed-effects model analyses were conducted to statistically test the above three analyses, using the lmerTest package (Kuznetsova et al. 2017) in R (R Core Team 2020). Fixed effects were focus (broad, corrective) and tone group (low, high) for the first analysis, focus position (on-focus, post-focus) for the second analysis, and AP position (initial, medial, final) for the third analysis. In all three analyses, random effects included speaker (5 speakers), position (1, 4), and digits (0–9), and dependent variables were the three acoustics cues. The Anova function of the lmerTest package was used to obtain the significance level of the fixed effects. Furthermore, a series of multiple comparisons with Bonferroni correction were conducted using the multcomp package (Hothorn et al. 2008) in R.
2.3. Results
2.3.1. On-Focus Effects
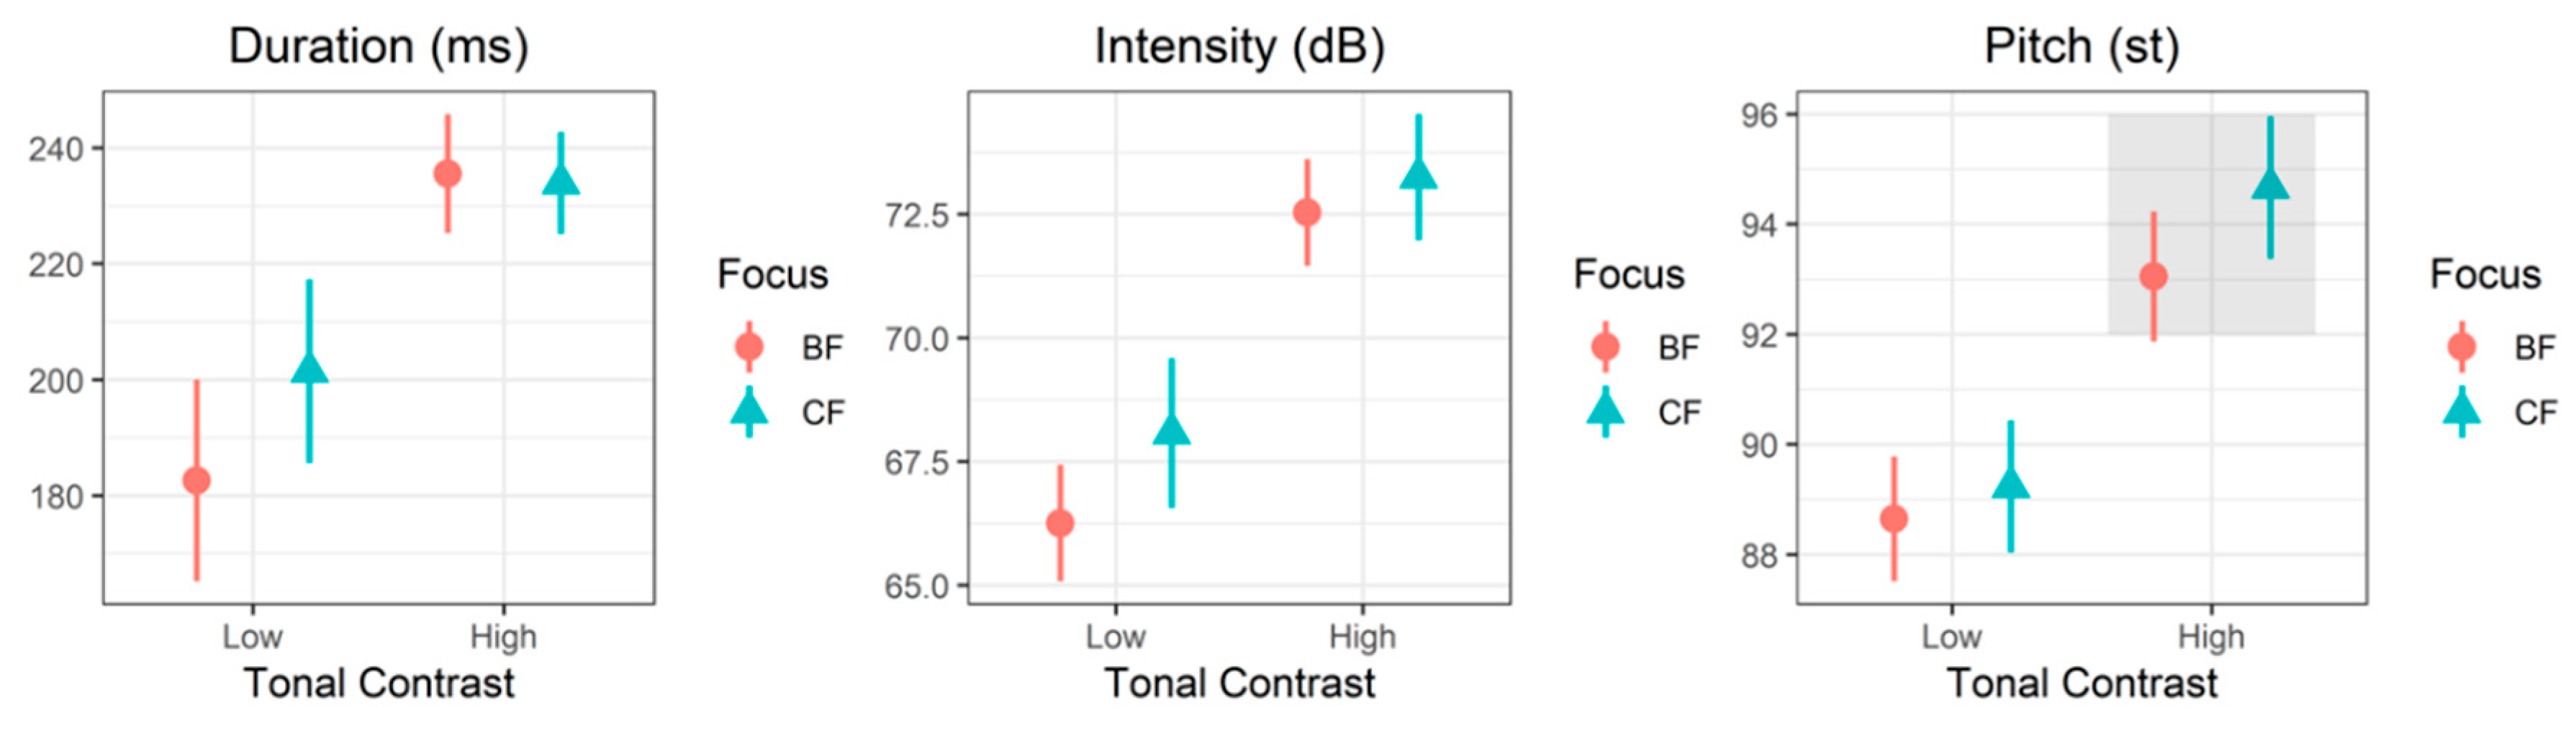
Figure 5 shows the mean values of duration (ms), intensity (dB), and pitch (st) in two focus conditions, separated by tone group. Target digits under corrective focus were produced with increased duration, intensity, and pitch as compared to target digits under broad focus in both tone groups, except duration in the high tone group. However, different tone groups showed different trends in marking prosodic focus. Duration and intensity played important roles in the low tone group; however, in the high tone group, intensity and pitch were crucial in the production of corrective focus. Furthermore, among all acoustic variables, pitch in the high tone group was most salient in distinguishing corrective focus from broad focus.
Based on Figure 5, we posit that two-way interaction effects between tone group and focus exist for all three acoustic cues, and therefore it is necessary to initiate examination of these interaction effects. Results of the linear mixed-effects model show that the interaction effect between tone group and focus was highly significant for all acoustic parameters (duration: X2 = 12.88, df = 3, p < 0.01; intensity: X2 = 19.55, df = 1, p < 0.001; pitch: X2 = 64.22, df = 3, p < 0.001). The results confirm that the two tone groups differ from each other in marking prosodic focus, which prompted us to evaluate the focus effect of the acoustic variables in each tone group.
In the low tone group, the main effect of focus was significant for all acoustic cues (duration: X2 = 9.33, df = 1, p < 0.01; intensity: X2 = 7.65, df = 1, p = 0.01; pitch: X2 = 7.51, df = 1, p = 0.01). In the high tone group, the main effect of focus showed a clear significance tendency for pitch (X2 = 91.72, df = 1, p < 0.001), but focus had no significant effect on duration (X2 = 0.83, df = 1, p = 0.77) and intensity (X2 = 1.36, df = 1, p = 0.24). The results show clear differences in the trends of marking prosodic focus in both tone groups. The two groups differ in that duration, intensity, and pitch played an important role in marking focus in the low tone group, whereas only pitch was an important cue in the high tone group.
Among the three acoustic variables, pitch and duration deserve further attention, since the focus effect by pitch and duration differed markedly in the two tone groups. In the low tone group, the estimated pitch value was 88.65 st for broad focus and 89.24 st for corrective focus, which is an increase of just 0.59 st extra pitch. However, in the high tone group, the estimated pitch value was 93.05 st for broad focus and 94.66 st for corrective focus, for a difference of 1.61 st between the two focus conditions. The difference indicates that the pitch increase induced by focus was roughly three times greater in the high tone group than in the low tone group (i.e., 1.61 st vs. 0.59 st). The opposite pattern appears in duration between the two tone groups. Duration served as a more prominent cue for focus in the low tone group, but lacked the same significance in the high tone group.
2.3.2. Focus Effects within APs
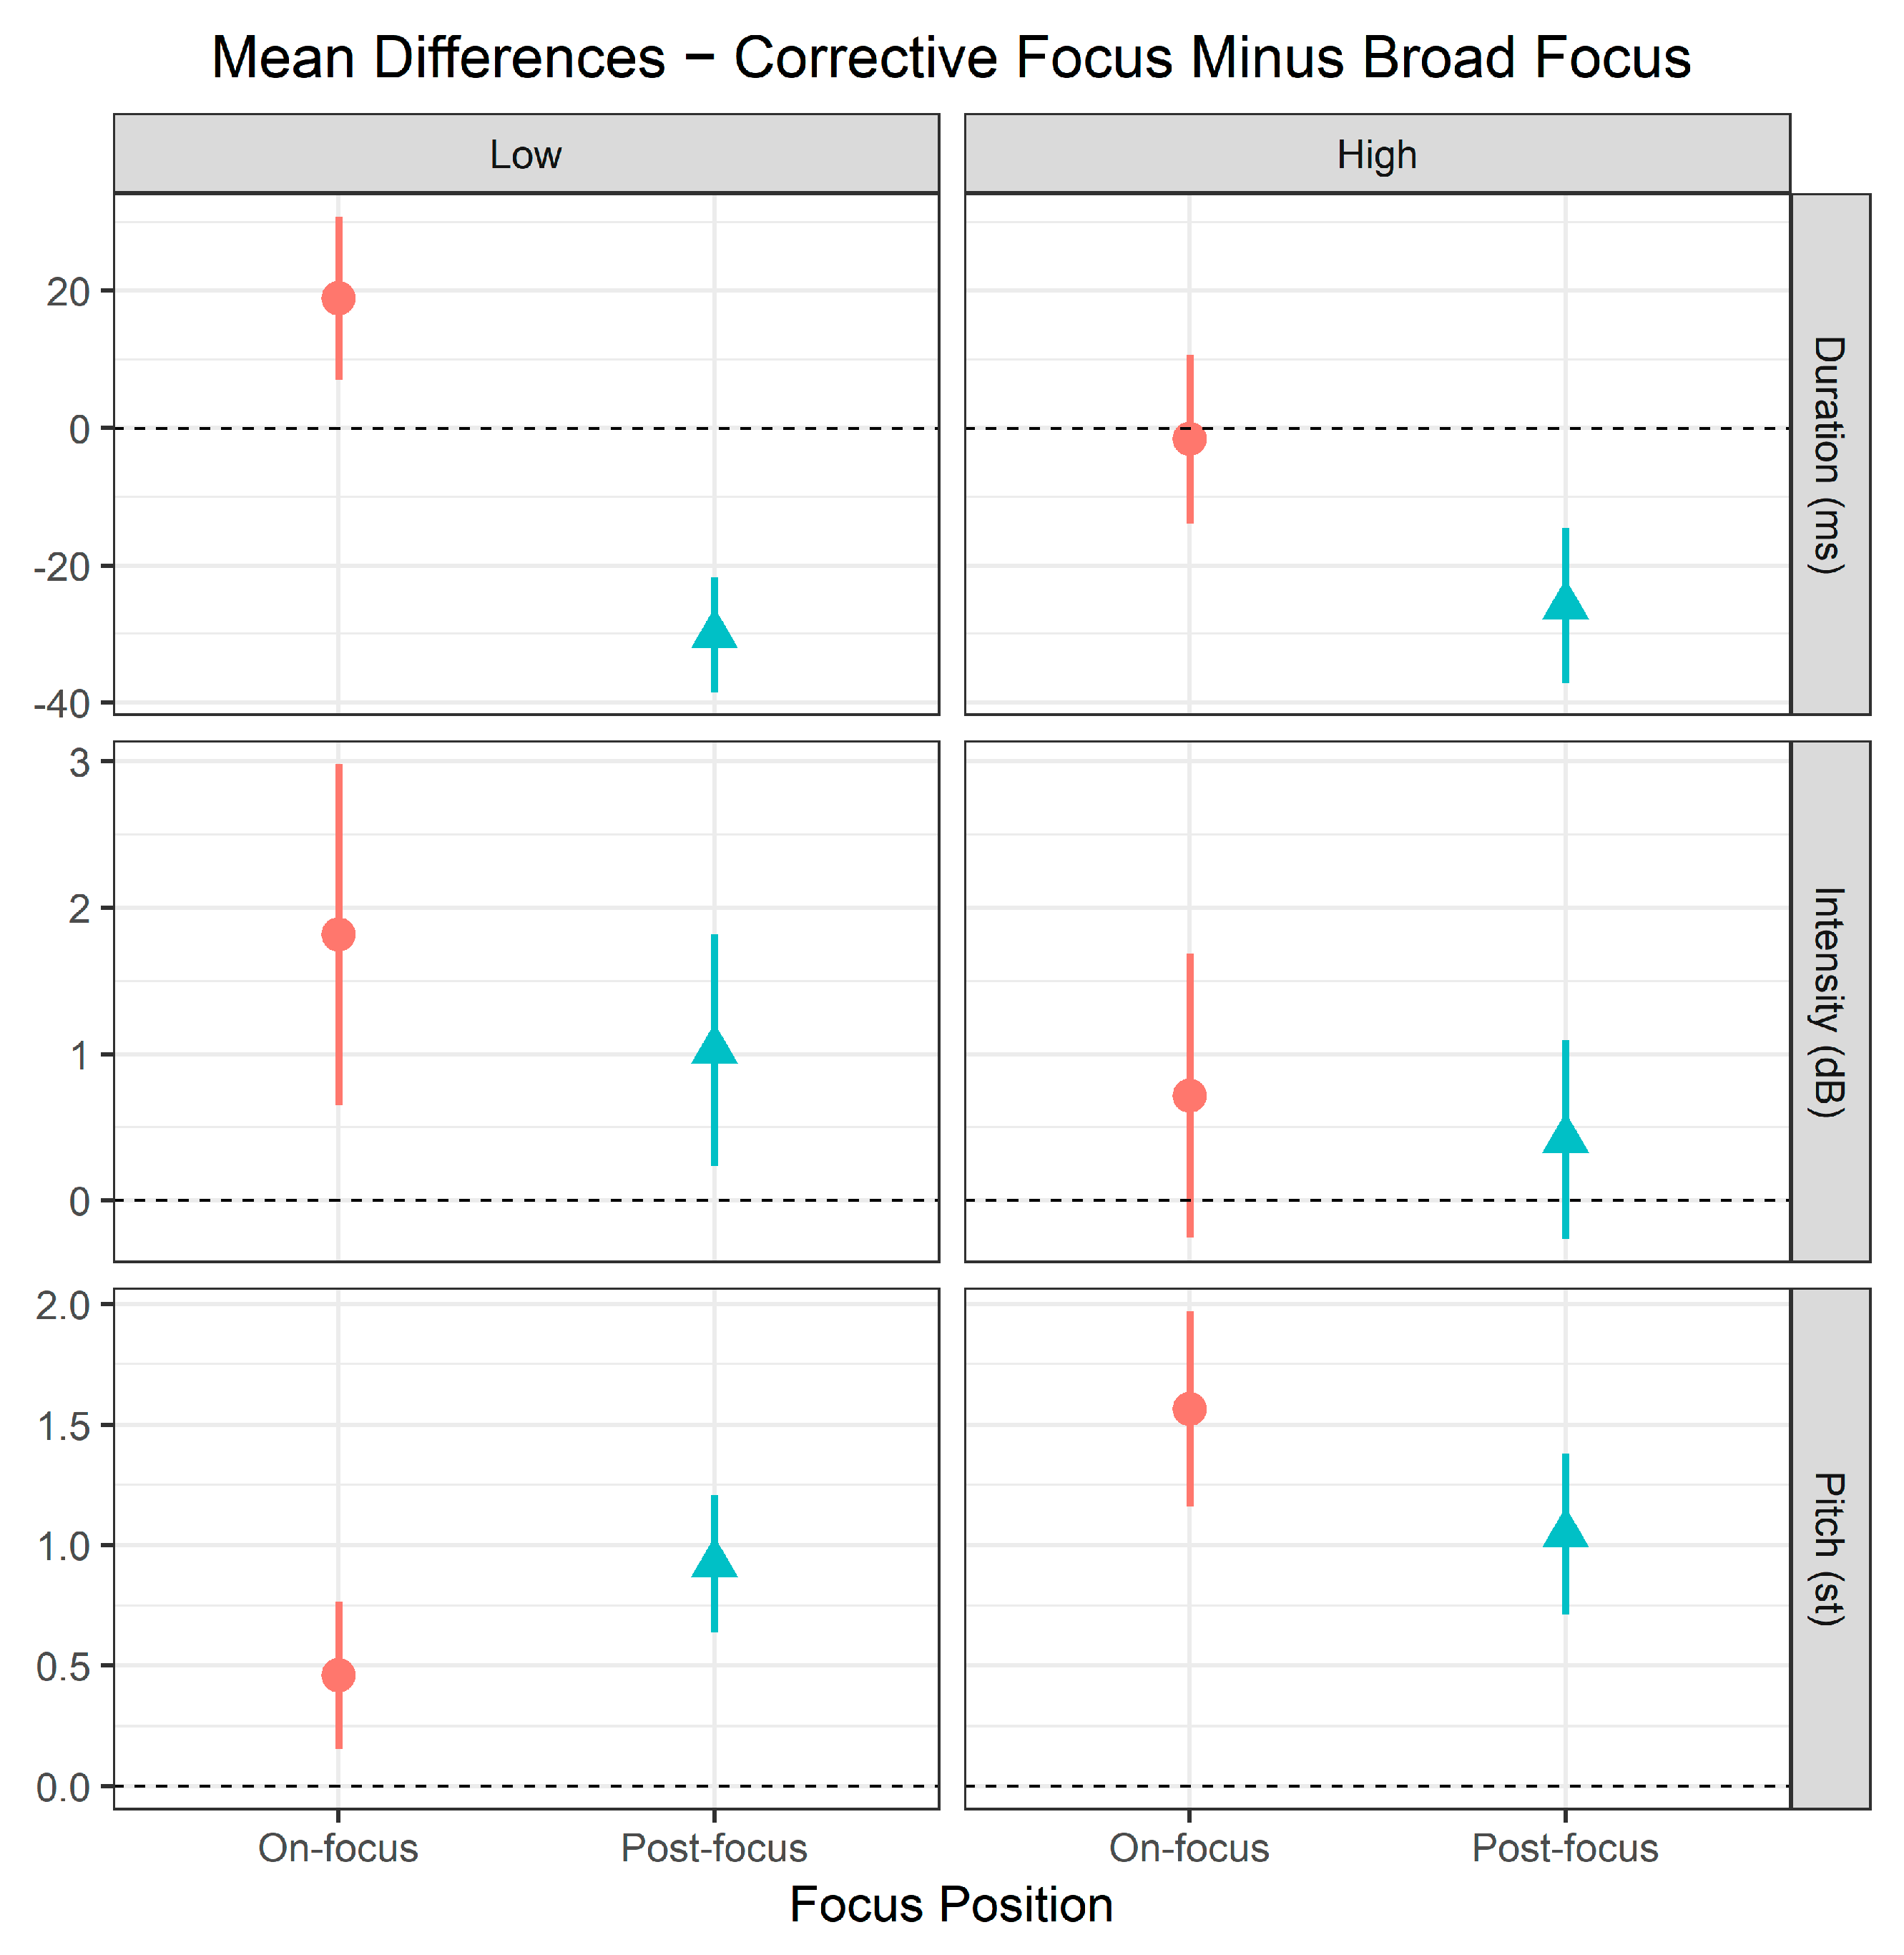
Figure 6 displays the mean differences in duration (ms), intensity (dB), and pitch (st) of the focus positions between corrective focus and broad focus. Overall, both the low and high tone groups show no clear indication of focus effects in the on-focus positions, when compared to the post-focus positions. In the low tone group, only the duration cues for on-focus positions were greater than 0 (i.e., corrective > broad) and the post-focus positions. Although the intensity and pitch cues for on-focus positions were greater than 0, the post-focus positions also showed greater intensity and pitch values than 0, and notably even the post-focus positions produced greater pitch values than the on-focus positions. This suggests that prosodic marking of focus by intensity and pitch was certainly confusing in the low tone group within APs. The high tone group also showed a similar level of confusion. The on-focus position of the high tone group did not have duration values greater than 0 and the post-focus positions. The intensity and pitch cues for on-focus positions were greater than 0 and the post-focus positions, but the post-focus positions also produced positive intensity and pitch values. This indicates that, similar to the low tone group, the high tone group produced a confusing prosodic marking of focus. Nevertheless, two crucial differences were apparent between the two tone groups: In the Low tone group, the on-focus and post-focus positions exhibited salient differences in duration, whereas the High tone group exhibited a higher level of pitch cues for on-focus positions, which is far greater than 0.
The results of the linear mixed-effects model analysis indicate that—for the low tone group—the main effect of focus position was significant for duration (X2 = 38.45, df = 1, p < 0.001) and pitch (X2 = 5.31, df = 1, p = 0.05), but not for intensity (X2 = 1.40, df = 1, p = 0.24). The high tone group showed a significant effect of focus position on duration (X2 = 9.89, df = 1, p < 0.01) and pitch (X2 = 8.97, df = 1, p < 0.01), but not on intensity (X2 = 0.28, df = 1, p = 0.60). Note that the direction of significance for pitch is not the same between the two tone groups; the post-focus positions produced a greater mean difference in pitch than the on-focus position for the low tone group. The statistical outcomes of both tone groups indicate that the on-focus positions were not clearly distinguished from the post-focus positions in both tone groups within APs. In the low tone group, pitch and intensity were the cues that produced a confusing prosodic marking of focus within APs. In the high tone group, intensity was such a cue.
2.3.3. SK’s AP Tonal Constraints on Focus Prosody
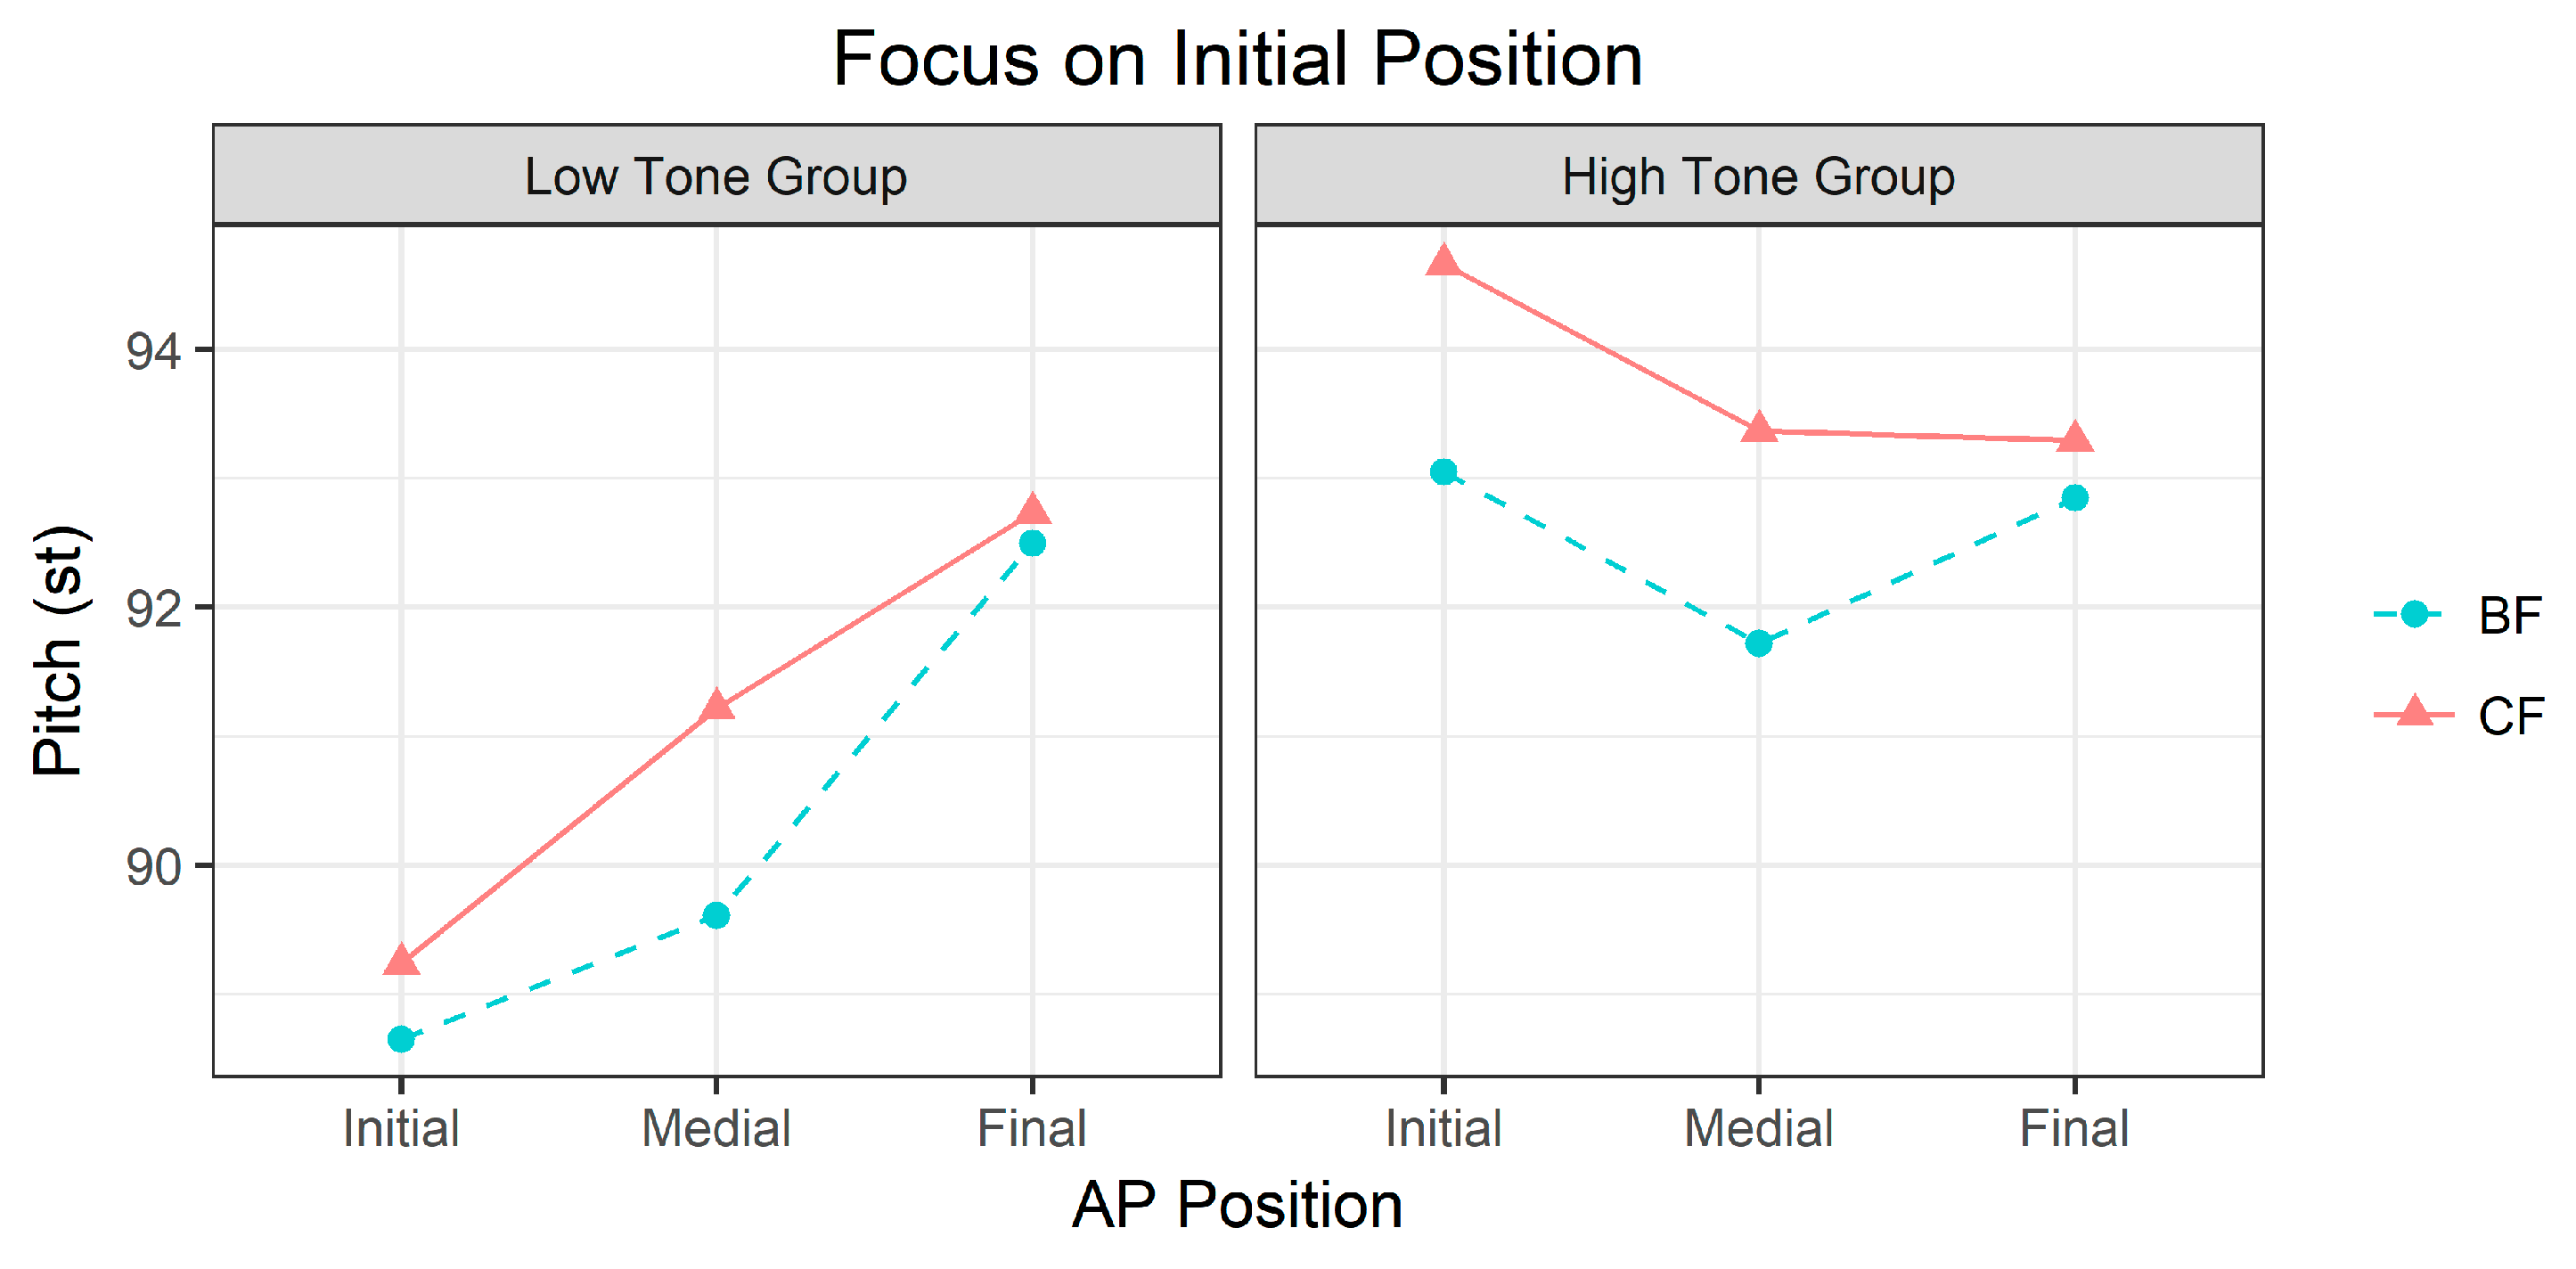
As can be seen in Figure 7, three positions (initial, medial, final) within an AP are shown on the x-axis and the aggregated mean of pitch (st) in the two focus positions (broad vs. corrective) is shown on the y-axis. Figure 7 shows that prosodic marking of focus in SK is affected by AP tonal patterns. The high tone group in the AP-initial position produced a higher pitch contour in the corrective-focus condition than in the broad-focus condition. Although higher pitch spanned the entire AP as a focus effect in the high tone group, the pitch level in the AP-initial position (94.7 st) was higher than that of the AP-medial (93.3 st) and AP-final positions (93.4 st). In the low tone group, the prosodic marking of focus in the initial position was marginal and the increase in pitch was also stretched to the entire AP position as a focus effect, albeit minimally. What is noteworthy in the low tone group is that the pitch level in the AP-initial position (89.1 st) was significantly lower than that of the AP-medial (91.2 st) and AP-final positions (92.7 st). Note that focus (broad vs. corrective) was not included as a focus effect in the model because our goal was to determine whether pitch values were affected by AP tonal patterns in the same digit string.
AP position had a significant effect on pitch in the low tone group (X2 = 139.22, df = 2, p < 0.001). The results of the multiple comparison analysis are detailed in Table 2, which only includes the comparisons between AP-initial and AP-medial positions and between AP-initial and AP-final positions. As shown in Table 2, the AP-initial focused position showed a significantly lower pitch value than the AP-medial and AP-final positions (2.12 st and 3.64 st lower than the AP-medial and AP-final positions, respectively) because the AP has a tonal pattern of LHH. This means that prosodic focus cannot deviate from the tonal pattern and it is realized, conforming to a language’s existing prosodic system. In the high tone group, the effect of AP position was also significant for pitch (X2 = 25.65, df = 2, p < 0.001). As shown in Table 2, the AP-initial focused position produced a significantly higher pitch than the subsequent positions within APs (1.28 st and 1.36 st higher than the AP-medial and AP-final positions, respectively). This salient focus prosody by pitch clearly distinguishes the high tone group from the low tone group.
3. Human Perception
3.1. Data Collection
We randomly selected 100 phone number strings produced with corrective focus from the production data of the five speakers (20 strings per speaker). The selected strings were designed to include 10 numerical digits ranging between 0–9 at every string position, and each digit was equally focused in every string position (i.e., 10 focused digits × 10 string positions). This design enabled an equal number of corrected digits to be included for the low and high tone groups. Since only the initial positions of 3-digit groups (i.e., NNN) were included, 20 corrected digits in AP-initial positions were employed as target stimuli.
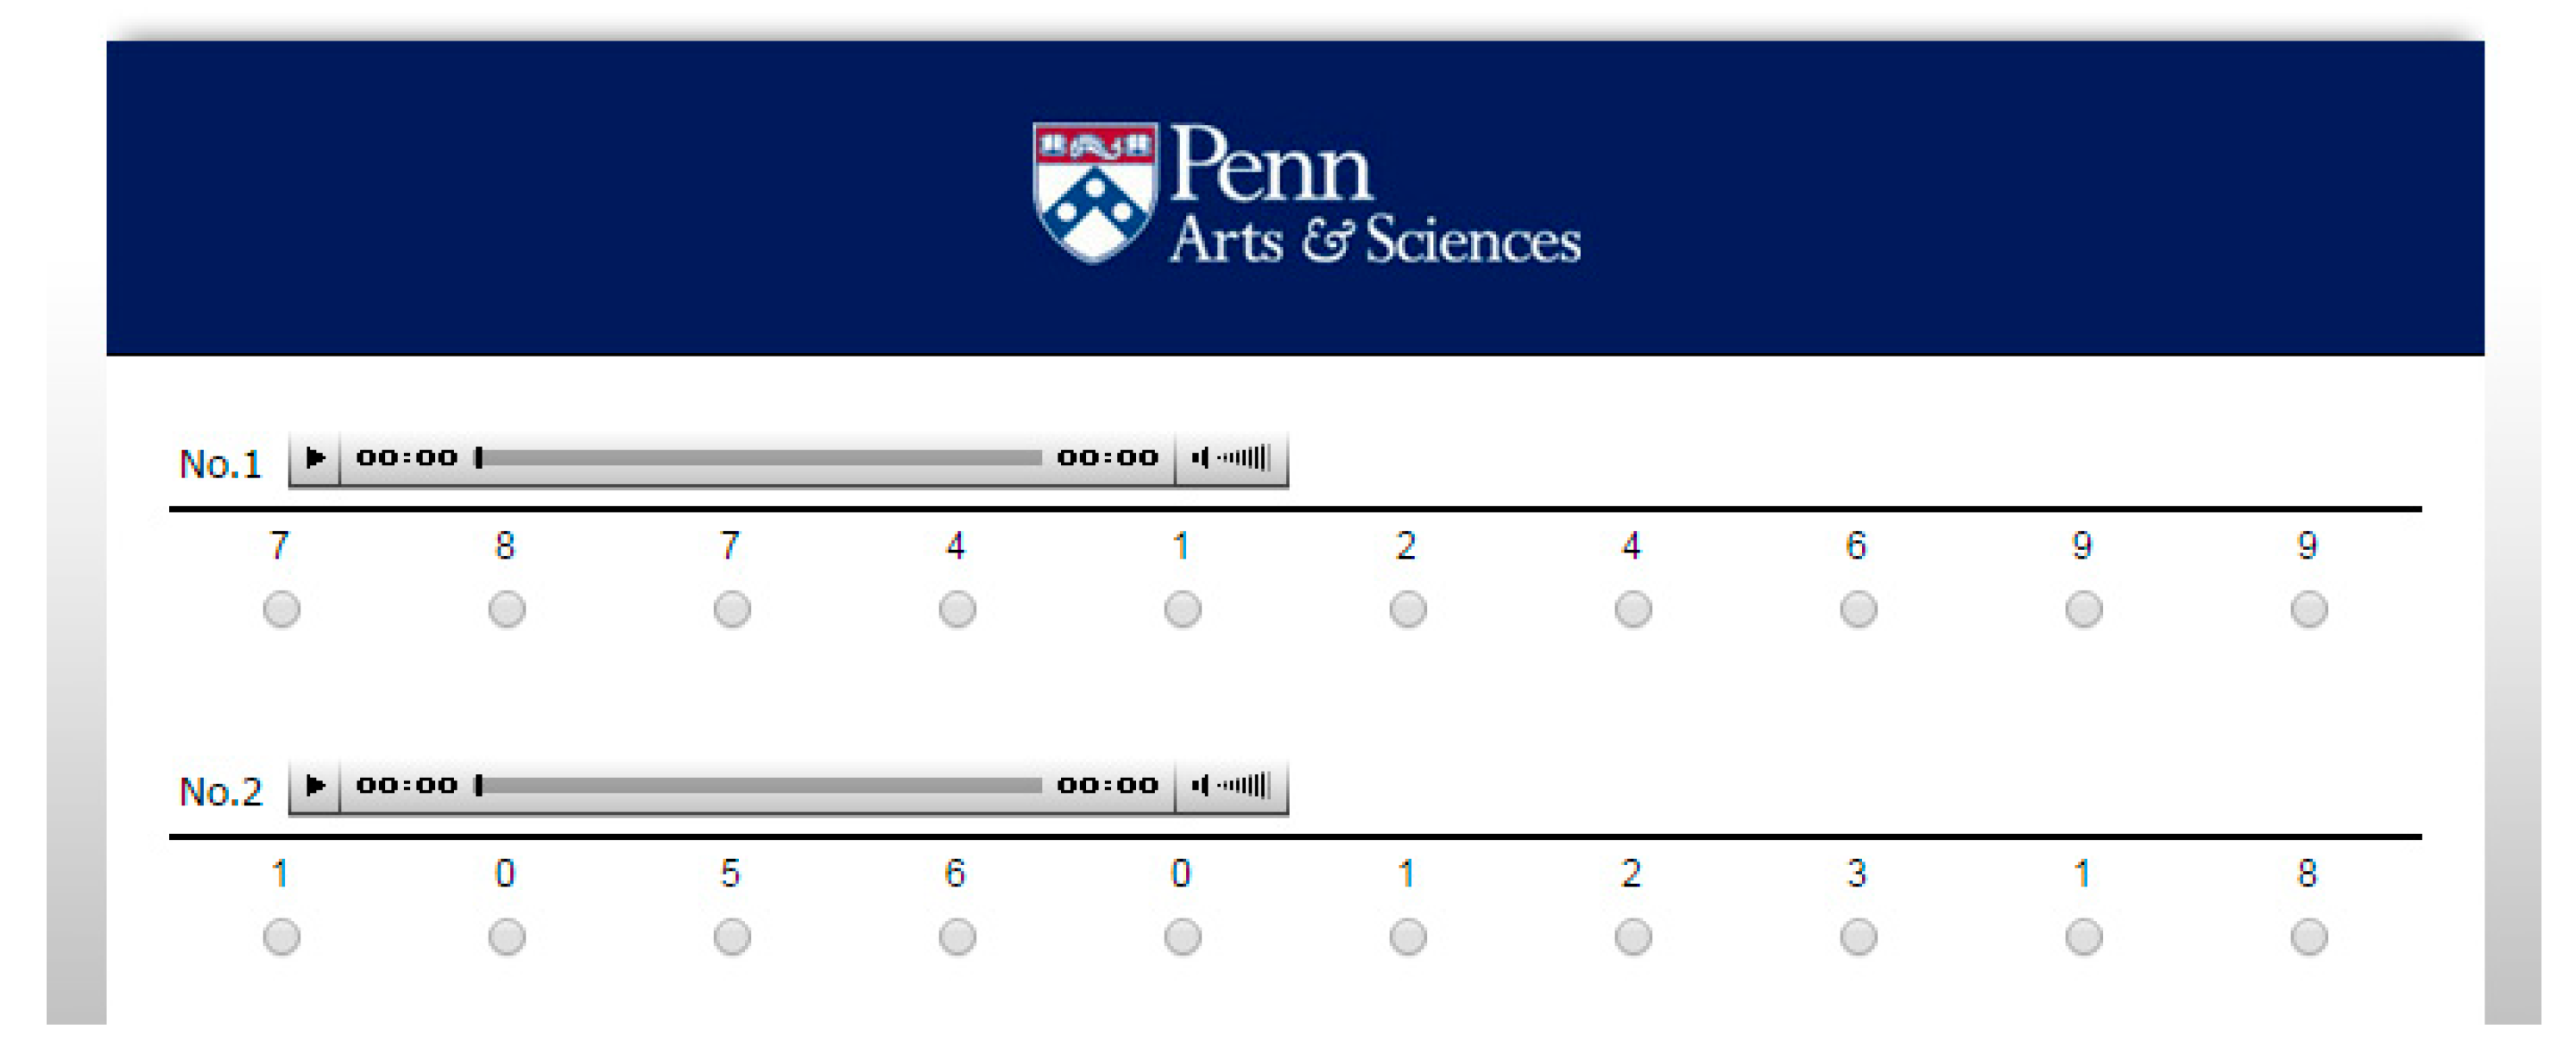
We set up the experiment using a web-browser (Qualtrics) in order to recruit listeners online with ease of access. Figure 8 shows a screenshot of a part of the survey in Qualtrics. For each question during the test, participants heard one phone number string with one corrected digit, which was produced by one of the five speakers in the production experiment, by pressing a play button. It should be noted that in this experiment, neither fillers with broad focus nor any discourse context was provided. Listeners heard only the answer part produced with corrective focus with no context. This process enabled listeners to rely solely on prosodic cues in recognizing the corrected digits. After listening, participants were asked to select which digit seemed to be corrected among the 10 digits in the phone number string they heard. The digits in the phone number string were shown as a task with ten-choices in the order they appeared in the phone number so that the participants could make a selection. In total, 52 native SK speakers participated in the perception experiment (40 females, 12 males; mean age: 24.2, SD: 3.8).
3.2. Analyses
Our basic strategy was to analyze the perception data in a confusion matrix—a table that summarizes the performance of a classification accuracy—to gauge the accuracy of each tone group’s identification of each focus position. For statistical analysis, we conducted a binary logistic regression model using the lmerTest package (Kuznetsova et al. 2017) in R (R Core Team 2020). Within the model, tone group was included as a fixed effect, listeners and individual digits as random effects, and identification—coded as 0 (incorrect) or 1 (correct)—as a dependent variable. The Anova function of the lmerTest package was used to determine the significance level of the fixed effect.
3.3. Results
Table 3 shows a confusion matrix for the identification of corrected digits in each tone group by the positions within phone number strings. The overall identification rate was 40.0% for the high tone group, but only 23.5% for the low tone group. These results indicate that tone group and prosodic focus interact asymmetrically in SK: The identification rate of focus positions in the high tone group was roughly twice higher than that of the low tone group. The results of the logistic regression model confirmed that the high tone group had a significantly better identification rate than the low tone group (χ2 = 5.07, df = 1, p < 0.05).
Table 3 shows that incorrect answers in the first digit phrase usually appeared within each phrase for both tone groups. For example, in the low tone group, when position 1 was focused, listeners selected position 2 at a rate of 20.4% and position 3 at a rate of 31.5%. The high tone group also exhibited a similar confusion rate, but to a lesser extent. When position 1 was focused, listeners chose positions 2 and 3 at a rate of 19.2% and 12.3%, respectively. However, the location of incorrect answers in the second digit phrase varied by tone group. When position 4 was focused in the Low tone group, listeners selected position 5 at a rate of 8.1% and position 6 at a rate of 18.5%. When position 4 was focused in the high tone group, the confusion did not spread significantly to the following positions within the same group (4.6% and 8.5%, respectively). Given that listeners chose position 3 at a rate of 10.4%, the last High tone in the previous digit phrase seemed to confuse the listeners. The identification results shown in Table 3 suggest that the confusion of prosodic modulation hindered the identification of corrected digits in both tone groups.
4. Automatic Classification
Automatic detection of prosodic focus is particularly important in that it can promote human-machine interaction. The results of the production and the perception experiments suggest that the phonetic cues of prosodic focus in SK are weak and confusing. These results raised a question of how a machine would perform in identifying prosodic focus in phone number strings in SK. Given that automatic detection of focus resulted in a promising result in American English (Cho et al. 2019), which had strong and salient prosodic focus, it was questionable if a machine would be able to detect prosodic focus well in a language like SK, where phonetic cues are not strong and native speakers also perform poorly.
4.1. Features and Model Training
We used the production data of the corrective condition for three classification tasks. One task was to identify the position of a focused digit using all training data, and another was to identify the position of a focused digit using digit strings with H-toned focused digits as training data, and the other with digit strings containing L-toned focused digits only (n = 250 digit strings for each tone group). We trained Support Vector Machine classifiers in all tasks. We used duration, mean intensity, and maximum pitch of each digit position from a digit string that we obtained from the production experiment as features for training. Because there were 10 digits in each digit string, the number of features for each target was 30 (=3 features × 10 digit positions). We standardized all features within each digit string using a z-score scale for better model performance. For example, we grouped all intensity values from one digit string and z-scored the values. This standardization preserved the relative differences between digit positions, yet minimized the problem of having different scales in pitch (st), intensity (dB), and duration (ms), which could hinder effective learning.
Since there were relatively many features (n = 30) compared to the number of tokens, we experimented with feature selection techniques. To avoid collinearity affecting the model performance, we tested correlations among features and dropped the ones that showed a high correlation, varying the cutoff correlation coefficient (r) from 0.5, 0.6, 0.7, 0.8, 0.9 to 1 (no feature dropping). We reported the best performance for each classification task after feature selection and hyperparameter tuning in the section below. In all models, we performed leave-one-group-out cross-validation, where one group was defined as all tokens produced by one speaker. All training and testing were done with the scikit-learn package (Pedregosa et al. 2011) in Python.
4.2. Model Performance
Table 4 shows the confusion matrix of the corrective focus of the AP-initial positions in our models. For all three tasks, the models trained with features selected at r < 0.5 (n = 16) performed best. The best performance model (C = 2.5, gamma = 0.0625) that was trained with all tone groups showed 65% of accuracy for AP-initial positions, which is much higher than that of human perception (about 32%). The accuracy was 64.8% for all positions (macro average precision = 0.66, recall = 0.65, F1-score = 0.65, AUC = 0.94). The model’s performance was very impressive, given that we included only three prosodic features and trained each CV fold with a relatively small number of tokens (400 digit strings). The accuracy increased when the tone groups were trained separately. The model trained with H-toned focused (C = 3, gamma = 0.065) digits correctly predicted focus positions 86% of the time for the AP-initial positions. The accuracy was 84% for all positions (macro average precision = 0.85, recall = 0.84, F1-score = 0.84, AUC = 0.98). However, the accuracy for the model trained with L-toned focused digits (C = 3, gamma = 0.0625) was 68% (16% lower) for the AP-initial positions, which was lower than the H-toned model. The overall accuracy for all positions in the L-toned model was 71.2% (macro average precision = 0.71, recall = 0.71, F1-score = 0.71, AUC = 0.96). Consistent with human perception, the H-toned model had a higher accuracy than the L-toned model.
5. Discussion and Conclusions
In this study, we examined the focus prosody of SK using telephone numbers by conducting production and human perception experiments and building machine learning classifiers to test our three working hypotheses: (a) SK’s prosodic marking of focus is weak, (b) prosodic marking of focus is confusing because its focus effect is spread over the entire phrase, (c) a machine classifier has difficulty correctly identifying prosodic focus in SK due to weak and confusing prosodic cues, but a focused H-toned digit is better identified than a focused L-toned digit. The methods employed were effective and provided interesting, novel findings regarding the focus prosody of SK. The production and human perception results were congruent overall, and the working hypotheses were both verified by the two experiments. However, we found a striking difference between human and machine in the detection of prosodic focus; the machine’s performance exceeded the human’s, partly rejecting our third hypothesis. What follows is a brief summary of the results and an in-depth discussion of key findings.
The results of the production data demonstrated that the low and high tone groups exhibited similarities and differences in marking prosodic focus. In the focus positions for the low tone group, duration, intensity, and pitch played important roles, but pitch was an important cue in the high tone group. However, the two tone groups produced a confusing prosodic marking of focus because prominence mainly by intensity and pitch spanned the entire phrase as a focus effect. Furthermore, while the low tone group was subject to a greater degree of confusion, both tone groups were affected by SK’s basic tonal melodies within an AP.
One of the key findings of this work was that prosodic marking of focus varied in different pitch-scaling conditions. As discussed earlier in the Introduction, higher pitches can have a greater impact than lower pitches in terms of F0 ratios, based on the formula F0 = Int × B + B. In the current study, the high tone group induced higher pitches in marking prosodic focus, whereas the low tone group induced relatively lower pitches. The higher pitches showed an increase of 1.61 st in marking prosodic focus, whereas the lower pitches showed an increase of only 0.59 st. We posit that the greater increase in pitch is one of the main factors that enable listeners to better identify focus in the high tone group. Furthermore, the claim by (Rietveld and Gussenhoven 1985) that a difference of less than 1.5 st is not sufficient to recognize a change in prominence in human perception was confirmed in this study. Accordingly, our work affirmed that higher pitches mark prosodic focus more successfully than lower pitches.
Another key finding was that the focus prosody of SK was found to be weak and confusing for both tone groups in production, leading to a poor identification rate in human perception. Reasons for this weak and confusing prosodic marking of focus are discussed below. As discussed earlier, Jun (Jun 2005) distinguished two types of language: Head-prominence and edge-prominence languages. In English, which is a head-prominence language, prominence of a word is marked by a post-lexical pitch accent on the head (that is, a stressed syllable) of the word. A focused word is thus realized by expressing the stressed syllable with longer duration, greater intensity, and higher pitch. In contrast, SK, an edge-prominence language, does not have such a head (no lexical stress, lexical tone, or lexical pitch accent) within a word; no specific syllable carries prominence for prosodic marking of focus. This prosodic characteristic results in a weak prosodic marking of focus, which leads to the question as to why prosodic marking of focus was confusing. Prominence of a word in SK is marked by initiating a new prosodic unit before the focused word, and the entire AP becomes prominent by raising the H-toned syllables in its tonal pattern. In this study, we found a strong constraint to group the 10 phone numbers into three or four prosodic units. Although a single digit in the phrase-initial position was narrowly focused, the digit did not itself form one separate AP; instead, the whole prosodic unit containing the focused digit became prominent as a focus effect. The prominence spanning the entire AP features a confusing prosodic marking of focus.
Based on the human perception data, an obvious question to ask is why the high tone group was perceived better than the low tone group in the perception of corrective focus. Three answers are possible. First, as stated above, the high tone group produced much higher pitch than the low tone group, which effectively marked prosodic focus. Second, in the low tone group, the acoustic cues of prominence were contradictory between duration and pitch; that is, the focused L-toned digit was longer in duration, but lower in pitch than the subsequent “unfocused” digits, and these conflicting acoustic cues of prominence were confusing to the listeners. In contrast, the focused H-toned digit was longer in duration and higher in pitch than the subsequent digit, which enhanced the prominence of the focused digit. Third, unlike Mandarin Chinese (Lee et al. 2016) and English (Beckman and Pierrehumbert 1986), where a low tone syllable can be salient by lowering its pitch target, the pitch target of the L-toned digit in SK was not lowered in marking prosodic focus.
Considering that prosodic marking of focus was ineffective in SK, our next question is to ask whether the current results can be generalized to a broader range of languages. According to the prosodic typology presented in (Jun 2005; Jun 2014), SK is an edge-prominence language—that is, it does not have any head on the word or phrase, and prominence is realized only by the edge of a word or phrase. Therefore, focus prosody of telephone numbers was indeed confusing. We expect any language belonging to an edge-prominence language to behave like SK. In contrast, a head-prominence language, where prominence is marked by the head of a word or phrase, produces a clear prosodic marking of focus (see Lee (2015) for more information). In addition, in head/edge-prominence languages (e.g., Tokyo Japanese, South Kyungsang Korean), prominence is marked by both the head and edge of a word or phrase. Recent studies of Tokyo Japanese (Lee et al. 2018) and South Kyungsang Korean (Lee et al. 2019) demonstrated that the manner in which prosodic focus is encoded in this language group is confusing because this language group also marks prominence at the edge of a word or phrase. Similar future studies of more diverse language groups will provide more clarity to understanding focus prosody in particular and prosodic typology in general.
What’s striking about the results is that the identification rate of our model was remarkably high relative to that of human perception. As stated above, the on-focus positions of the two tone groups were not more salient than the post-focus positions, leading to native listeners’ poor identification in perception. The high identification rate of the machine performance therefore remains particularly surprising because corrective focus was neither clearly marked in production nor accurately recognized by human perception. This makes an interesting contrast to American English, where native speakers’ perception was about 97%, whereas the machine performance was 92% (Cho et al. 2019). Our initial speculation was that Korean listeners who are already familiar with Korean intonational patterns for focus prosody were indeed distracted by the two tone groups’ confusing prosodic marking of focus. For example, as stated above, the focused L-tone digit was longer in duration, but lower in pitch than the following digit in our production, and these conflicting acoustic prominence cues may have confused listeners. In contrast, our model, which is naïve to the intonational system of Korean, seemed to find the most optimal cues of corrective focus by analyzing prosodic features without being misled as much as native listeners. It then identified the most plausible position within a 10-digit string to contain such focus cues, resulting in a higher identification rate than human perception. Since the discrepancy in the recognition of prosodic focus between human and machine was observed in only a single study, more languages should be analyzed to determine the universality of this case.
Although the method employed in this study effectively tested our goals, it is not clear whether our findings obtained from digit strings can be generalized to regular SK sentences. We expect prosodic marking of focus would be more effective for regular sentences as compared to telephone numbers. Since each regular word tends to form an AP by itself, whereas digits in a phone number string tend to group together to form an AP, a focused word in regular sentences are free from tonal constraints at the AP level. For example, as shown in Figure 2, the focused word minsu-ga begins with a low-tone inducing segment. Because the entire focused word instead of a single syllable becomes prominent at the AP level, its prosodic marking of focus will not be confusing, contrary to the AP-initial focused digit in a digit string. Therefore, prosodic marking of focus in regular sentences will behave differently and will be more effective than prosodic marking of focus in telephone numbers. On the other hand, if the focus is placed to fall on the initial syllable in kim.tɕʌŋ.guk-ɯl (to correct the family name of a person, for example), the focused word in regular sentences will also be bound by tonal constraints at the AP level, and prosodic marking of focus would not be effective for this case compared to telephone numbers.3 Additional research is, therefore, necessary to compare telephone numbers to regular sentences, taking into account two cases—first, where focus is placed on the entire word like minsu-ga and, second, on the initial syllable as in kim.tɕʌŋ.guk-ɯl. Furthermore, more speakers must be recruited for future research in order to ensure more robust data and validate the results of the present experiment. Finally, we should create a classifier to detect prosodic focus in other languages to compare the perception performance between human and machine and improve human-machine interactions.
In summary, the results of this study revealed both similarities and differences between the two tone groups in marking prosodic focus. The similarities included: (i) The low and high tone groups exhibited a degree of confusion within a phrase as a focus effect, and (ii) the two tone groups were constrained by AP tonal melodies. The differences included the importance of duration, intensity, and pitch in the low tone group, in contrast to the importance of pitch only in the high tone group. Moreover, the focus prosody of the two tone groups was not accurately recognized in human perception, but the identification rate was approximately twice as high for the high tone group than it was for the low tone group. In machine perception, misidentifications were also observed more often in the low tone group than in the high tone group. When comparing human and machine performance, the machine’s performance was found to be significantly superior to the human’s, contrary to our expectation. In this study, although the focus prosody of telephone numbers was weak and confusing, we observed a high identification rate of prosodic focus under certain circumstances. This study generated empirical evidence that prosodic marking of focus can vary according to the specific prosodic system of a language.
Author Contributions
Conceptualization Y.-c.L. and S.C.; methodology, Y.-c.L. and S.C.; validation, Y.-c.L. and S.C.; formal analysis, Y.-c.L. and S.C.; investigation, Y.-c.L.; resources, Y.-c.L.; writing—original draft preparation, Y.-c.L.; writing—review and editing, Y.-c.L. and S.C.; visualization, Y.-c.L. All authors have read and agreed to the published version of the manuscript.
Funding
This research received no external funding.
Acknowledgments
We gratefully acknowledge Mark Liberman and Sun-Ah Jun for their expert advice on this study’s earlier version. We also thank the three anonymous reviewers for their valuable comments that helped improve this manuscript’s quality.
Conflicts of Interest
The authors declare no conflict of interest.
References
- Beckman, Mary E., and Janet B. Pierrehumbert. 1986. Intonational structure in Japanese and English. Phonology Yearbook 3: 255–309. [Google Scholar] [CrossRef]
- Bolinger, Dwight. 1972. Accent is predictable (if you’re a mind-reader). Language 48: 633–44. [Google Scholar] [CrossRef]
- Cho, Sunghye, and Yong-cheol Lee. 2016. The effect of the consonant-induced pitch on Seoul Korean intonation. Linguistic Research 33: 299–317. [Google Scholar]
- Cho, Sunghye, Mark Liberman, and Yong-cheol Lee. 2019. Automatic detection of prosodic focus in American English. Proceedings of Interspeech 2019: 3470–74. [Google Scholar]
- Cho, Sunghye. 2017. Development of Pitch Contrast and Seoul Korean Intonation. Ph.D. dissertation, University of Pennsylvania, Philadelphia, PA, USA. [Google Scholar]
- Cho, Sunghye. 2018. The production and perception of High-toned [il] by young speakers of Seoul Korean. Linguistic Research 35: 533–65. [Google Scholar]
- Cohan, J. Ballantyne. 2000. The Realization and Function of Focus in Spoken English. Ph.D. dissertation, The University of Texas at Austin, Austin, TX, USA. [Google Scholar]
- Hair, Joseph, Rolph Anderson, Barry Babin, and William Black. 2010. Multivariate Data Analysis: A Global Perspective. Boston: Pearson. [Google Scholar]
- Hothorn, Torsten, Frank Bretz, and Peter Westfall. 2008. Simultaneous inference in general parametric models. Biometrical Journal 50: 346–63. [Google Scholar] [CrossRef] [PubMed] [Green Version]
- Jeon, Hae-sung, and Francis Nolan. 2017. Prosodic marking of narrow focus in Seoul Korean. Laboratory Phonology 8: 1–30. [Google Scholar] [CrossRef] [Green Version]
- Jo, Jung-Min, Seok-Keun Kang, and Taejin Yoon. 2006. A rendezvous of focus and topic in Korean: Morpho-syntactic, semantic, and acoustic evidence. The Linguistics Association of Korean Journal 14: 167–96. [Google Scholar]
- Jun, Sun-Ah, and Hee-Sun Kim. 2007. VP focus and narrow focus in Korean. Paper presented at the 16th The International Congress of Phonetic Sciences, Saarbrücken, Germany, August 6–10; pp. 1277–80. [Google Scholar]
- Jun, Sun-Ah, and Hyuck-Joon Lee. 1998. Phonetic and phonological markers of contrastive focus in Korean. Paper presented at the 5th International Conference on Spoken Language Processing, Sydney, Australia, November 30–December 4; pp. 1295–98. [Google Scholar]
- Jun, Sun-Ah, and Jihyeon Cha. 2011. High-toned [il] in Seoul Korean Intonation. Paper presented at the 17th The International Congress of Phonetic Sciences, Hong Kong, China, August 17–21; pp. 990–93. [Google Scholar]
- Jun, Sun-Ah, and Jihyeon Cha. 2015. High-toned [il] in Korean: Phonetics, intonational phonology, and sound change. Journal of Phonetics 51: 93–108. [Google Scholar] [CrossRef] [Green Version]
- Jun, Sun-Ah. 1998. The Accentual Phrase in the Korean prosodic hierarchy. Phonology 15: 189–226. [Google Scholar] [CrossRef] [Green Version]
- Jun, Sun-Ah. 2005. Korean intonational phonology and prosodic transcription. In Prosodic Typology: The Phonology of Intonation and Phrasing. Edited by Sun-Ah Jun. New York: Oxford University Press, pp. 201–29. [Google Scholar]
- Jun, Sun-Ah. 2011. Prosodic markings of complex NP focus, syntax, and the pre-/post-focus string. Paper presented at the 28th West Coast Conference on Formal Linguistics (WCCFL 28), Los Angeles, CA, USA, February 12–14; pp. 214–30. [Google Scholar]
- Jun, Sun-Ah. 2014. Prosodic typology: By prominence type, word prosody, and macro-rhythm. In Prosodic Typology II: The Phonology of Intonation and Phrasing. Edited by Sun-Ah Jun. Oxford: Oxford University Press, pp. 520–40. [Google Scholar]
- Kuznetsova, Alexandra, Per B. Brockhof, and Rune H. B. Christensen. 2017. lmerTest Package: Tests in Linear Mixed Effects Models. Journal of Statistical Software 82: 1–26. [Google Scholar] [CrossRef] [Green Version]
- Ladd, D. Robert. 1996. Intonational Phonology. Cambridge: Cambridge University Press. [Google Scholar]
- Lee, Yong-cheol, and Yi Xu. 2010. Phonetic realization of contrastive focus in Korean. Paper presented at Proceedings of Speech Prosody 2010, Chicago, IL, USA, May 10–14; p. 100033. [Google Scholar]
- Lee, Yong-cheol, Dongyoung Kim, and Sunghye Cho. 2019. The effect of prosodic focus varies by phrasal tones: The case of South Kyungsang Korean. Linguistics Vanguard 5: 20190010. [Google Scholar] [CrossRef]
- Lee, Yong-cheol, Satoshi Nambu, and Sunghye Cho. 2018. Focus prosody of telephone numbers in Tokyo Japanese. Journal of the Acoustical Society of America 143: EL340–46. [Google Scholar] [CrossRef] [PubMed]
- Lee, Yong-cheol, Ting Wang, and Mark Liberman. 2016. Production and perception of tone 3 focus in Mandarin Chinese. Frontiers in Psychology 7: 1058. [Google Scholar] [CrossRef] [PubMed] [Green Version]
- Lee, Yong-cheol. 2009. The Phonetic Realization of Contrastive Focus and its Neighbors in Korean and English: A Cross-Language Study. Master’s thesis, Hannam University, Daejeon, Korea. [Google Scholar]
- Lee, Yong-cheol. 2012. Prosodic correlation between the focusing adverb ozik ‘only’ and focus/givenness in Korean. Journal of Speech Sciences 2: 85–111. [Google Scholar]
- Lee, Yong-cheol. 2015. Prosodic Focus within and across Languages. Ph.D. dissertation, University of Pennsylvania, Philadelphia, PA, USA. [Google Scholar]
- Liberman, Mark, and Janet Pierrehumbert. 1984. Intonational invariance under changes in pitch range and length. In Language Sound Structure. Edited by Mark Aronoff and Richard Oehrle. Cambridge: MIT Press, pp. 157–233. [Google Scholar]
- Liu, Fang. 2009. Intonation Sytems of Mandarin and English: A Functional Approach. Ph.D. dissertation, University of Chicago, Chicago, IL, USA. [Google Scholar]
- Nolan, Francis. 2003. Intonational equivalence: An experimental evaluation of pitch scales. Paper presented at 15th International Congress of Phonetic Sciences, Barcelona, Spain, August 3–9; pp. 771–74. [Google Scholar]
- Oh, Miran, and Dani Byrd. 2019. Syllable-internal corrective focus in Korean. Journal of Phonetics 77: 100933. [Google Scholar] [CrossRef] [PubMed]
- Pedregosa, Fabian, Gael Varoquaux, Alexandre Gramfort, Vincent Michel, Bertrand Thirion, Olivier Grisel, Mathieu Blondel, Peter Prettenhofer, Ron Weiss, Vincent Dubourg, and et al. 2011. Scikit-learn: Machine learning in Python. Journal of Machine Learning Research 12: 2825–30. [Google Scholar]
- R Core Team. 2020. R: A Language and Environment for Statistical Computing. Version 4.0.2. Available online: http://www.r-project.org (accessed on 1 July 2020).
- Rietveld, Toni, and Carlos Gussenhoven. 1985. On the relation between pitch excursion size and prominence. Journal of Phonetics 13: 299–308. [Google Scholar] [CrossRef]
- Song, Jae Jung. 2005. The Korean Language: Structure, Use and Context. Abingdon: Routledge. [Google Scholar]
- Ueyama, Motoko, and Sun-Ah Jun. 1998. Focus realization in Japanese English and Korean English intonation. Japanese and Korean Linguistics 7: 629–45. [Google Scholar]
- Xu, Yi, and Ching X. Xu. 2005. Phonetic realization of focus in English declarative intonation. Journal of Phonetics 33: 159–97. [Google Scholar] [CrossRef]
- Xu, Yi, and Maolin Wang. 2009. Organizing syllables into groups—Evidence from F0 and duration patterns in Mandarin. Journal of Phonetics 37: 502–20. [Google Scholar] [CrossRef] [PubMed] [Green Version]
- Xu, Yi. 2013. ProsodyPro—A Tool for large-scale systematic prosody analysis. Paper presented at Tools and Resources for the Analysis of Speech Prosody, Aix-en-Provence, France, August 30; pp. 7–10. [Google Scholar]
- Yuan, Jiahong. 2004. Intonation in Mandarin Chinese: Acoustics, Perception, and Computational Modeling. Ph.D. dissertation, Cornell University, Ithaca, NY, USA. [Google Scholar]
| 1 | In this study, we used the International Phonetic Alphabet (IPA) symbols for Korean examples. |
| 2 | A sample size of 200 may not be sufficient to statistically determine the differences in focus prosody between the two tone groups: Low and high tone. Nevertheless, since digit and position were treated as random samples, we had 50 tokens for each focus type (broad and corrective) in each tone group. According to Hair et al. (2010), the general rule is to have a minimum of five observations per variable (5:1), and an acceptable sample size would have ten observations per variable (10:1). Since we had 50 tokens for each focus type, it should be noted that the ratio in our study was just above the rule of thumb. |
| 3 | We would like to thank the reviewer for bringing this issue to our attention. |
Figure 1.
Mean pitch values of all speakers by the length of the target words. The x-axis shows syllable positions in the target sentences, and the y-axis shows the mean pitch values. The first three syllables are for /i.tɕe.nɯn/ ‘now-topic’, and the last four syllables are for /mal.ha.se.jo/ ‘say’ in the carrier sentence /i.dʑe.nɯn ____ mal.ha.se.jo/ ‘Now say _____.’, and the syllables in the middle (inside the dashed lines) are the target words.1 Modified from Cho and Lee (2016).

Figure 2.
Time-normalized pitch contours sampled at ten equidistant points. The shaded area indicates the phrase containing the focus element minsu. The sentence is minsu-ga mandu-ɾɯl mʌk-nɯnda ‘Minsu is eating dumplings.’ Raw data taken from Lee and Xu (2010).
Figure 2.
Time-normalized pitch contours sampled at ten equidistant points. The shaded area indicates the phrase containing the focus element minsu. The sentence is minsu-ga mandu-ɾɯl mʌk-nɯnda ‘Minsu is eating dumplings.’ Raw data taken from Lee and Xu (2010).

Figure 3.
Screenshots of the production experiment. The left panel corresponds to a broad-focus condition in which the target sentence means ‘Mina’s number is 787-412-4699′ in English. The right panel corresponds to a corrective-focus condition in which the upper sentence means ‘Mina’s number is 887-412-4699. Right?’, and the lower sentence means ‘No, Mina’s number is 787-412-4699.’.

Figure 4.
Sample pitch contours for the low and high tone groups in the two focus conditions. In panels (a,b), the digits highlighted in gray belong to the high tone groups, and in panels (c,d), the digits in the first area refer to the low tone groups. BF and CF are abbreviations for broad focus and corrective focus, respectively.

Figure 5.
Duration, intensity, and pitch of each tone group in two focus conditions (BF: Broad focus, CF: Corrective focus; Low: Low tone group, High: High tone group). Points refer to mean values, and error bars indicate the 95% confidence interval.
Figure 5.
Duration, intensity, and pitch of each tone group in two focus conditions (BF: Broad focus, CF: Corrective focus; Low: Low tone group, High: High tone group). Points refer to mean values, and error bars indicate the 95% confidence interval.

Figure 6.
Mean differences in duration (ms), intensity (dB), and pitch (st) of the two focus positions between corrective focus and broad focus. The horizontal dotted line at 0 on the y-axis indicates that the difference between corrective and broad focus conditions equals zero, and values above 0 indicate that the value of the corrective-focus condition exceeds that of the broad-focus counterpart.

Figure 7.
AP (Accentual Phrase) tonal patterns with three digits in two focus conditions (broad vs. corrective), separated by tone group. BF is shown here for reference only.
Figure 7.
AP (Accentual Phrase) tonal patterns with three digits in two focus conditions (broad vs. corrective), separated by tone group. BF is shown here for reference only.

Figure 8.
Screenshot of a part of the survey in Qualtrics.


Table 1.
The onset consonant type of each digit and the tone group depending on the tonal contrast that each digit shows.
Table 1.
The onset consonant type of each digit and the tone group depending on the tonal contrast that each digit shows.
| Digit (IPA) | Onset Consonant Type | Post-Lexical Tone Group |
|---|---|---|
| 0 (/koŋ/) | lenis | Low |
| 1 (/il/) | vowel-initial | High |
| 2 (/i/) | vowel-initial | Low |
| 3 (/sam/) | aspirated | High |
| 4 (/sa/) | aspirated | High |
| 5 (/o/) | vowel-initial | Low |
| 6 (/juk/) | glide | Low |
| 7 (/tɕhil/) | aspirated | High |
| 8 (/phal/) | aspirated | High |
| 9 (/ku/) | lenis | Low |
Table 2.
Results of the multiple comparison analysis for AP position in the low tone group (Estimate: Coefficient estimates, SE: Standard error).
Table 2.
Results of the multiple comparison analysis for AP position in the low tone group (Estimate: Coefficient estimates, SE: Standard error).
| Estimate | SE | z-Value | p-Value | ||
|---|---|---|---|---|---|
| Low tone | AP-initial vs. AP-medial | −2.12 | 0.24 | −8.94 | <0.001 |
| AP-initial vs. AP-final | −3.64 | 0.24 | −15.37 | <0.001 | |
| High tone | AP-initial vs. AP-medial | 1.28 | 0.29 | 4.46 | <0.001 |
| AP-initial vs. AP-final | 1.36 | 0.29 | 4.73 | <0.001 |
Table 3.
Confusion matrix of corrective focus perception (percentage values) by position in the digit strings. Numbers highlighted in gray indicate correct identification rates. (Top panel: Low tone group, bottom panel: High tone group).
Table 3.
Confusion matrix of corrective focus perception (percentage values) by position in the digit strings. Numbers highlighted in gray indicate correct identification rates. (Top panel: Low tone group, bottom panel: High tone group).
| Perceived | ||||||||||||
|---|---|---|---|---|---|---|---|---|---|---|---|---|
| 1st | 2nd | 3rd | 4th | 5th | 6th | 7th | 8th | 9th | 10th | |||
| Target | Low | 1st | 21.2 | 20.4 | 31.5 | 3.8 | 1.2 | 3.8 | 6.9 | 1.2 | 6.2 | 3.8 |
| 4th | 6.9 | 11.5 | 13.8 | 25.8 | 8.1 | 18.5 | 8.5 | 1.5 | 4.2 | 1.2 | ||
| High | 1st | 35.4 | 19.2 | 12.3 | 12.3 | 7.3 | 4.6 | 5.4 | 2.3 | 1.2 | 0.0 | |
| 4th | 5.4 | 2.7 | 10.4 | 44.6 | 4.6 | 8.5 | 12.7 | 0.8 | 10.0 | 0.4 | ||
Table 4.
Confusion matrix of corrective focus identification performed by the models. In this table, we only show the accuracies of the AP-initial positions for the sake of simplicity. Numbers highlighted in gray indicate correct identification rates. The top panel shows the results of the model trained with digit strings containing a L-toned focused digit, and the bottom represents the performance of the model trained with a H-toned focused digit. We calculated the prediction rates from the sum of all CVs.
| Predicted | ||||||||||||
|---|---|---|---|---|---|---|---|---|---|---|---|---|
| 1st | 2nd | 3rd | 4th | 5th | 6th | 7th | 8th | 9th | 10th | |||
| Target | Low | 1st | 52 | 0 | 8 | 8 | 8 | 0 | 16 | 0 | 0 | 8 |
| 4th | 0 | 0 | 0 | 84 | 0 | 4 | 8 | 0 | 0 | 4 | ||
| High | 1st | 80 | 8 | 0 | 4 | 0 | 4 | 0 | 0 | 0 | 4 | |
| 4th | 4 | 4 | 0 | 92 | 0 | 0 | 0 | 0 | 0 | 0 | ||
Publisher’s Note: MDPI stays neutral with regard to jurisdictional claims in published maps and institutional affiliations. |
© 2020 by the authors. Licensee MDPI, Basel, Switzerland. This article is an open access article distributed under the terms and conditions of the Creative Commons Attribution (CC BY) license (http://creativecommons.org/licenses/by/4.0/).
Share and Cite
MDPI and ACS Style
Lee, Y.-c.; Cho, S. Focus Prosody Varies by Phrase-Initial Tones in Seoul Korean: Production, Perception, and Automatic Classification. Languages 2020, 5, 64. https://doi.org/10.3390/languages5040064
AMA Style
Lee Y-c, Cho S. Focus Prosody Varies by Phrase-Initial Tones in Seoul Korean: Production, Perception, and Automatic Classification. Languages. 2020; 5(4):64. https://doi.org/10.3390/languages5040064
Chicago/Turabian StyleLee, Yong-cheol, and Sunghye Cho. 2020. "Focus Prosody Varies by Phrase-Initial Tones in Seoul Korean: Production, Perception, and Automatic Classification" Languages 5, no. 4: 64. https://doi.org/10.3390/languages5040064