
Preferences and Willingness to Pay for Preservation: The Case of a Proposed Hydropower Project in Southern Iceland

Faculty of Life and Environmental Sciences, University of Iceland, 102 Reykjavik, Iceland
*
Author to whom correspondence should be addressed.
Land 2024, 13(2), 159; https://doi.org/10.3390/land13020159
Submission received: 16 December 2023
/
Revised: 27 January 2024
/
Accepted: 28 January 2024
/
Published: 30 January 2024
Abstract
:When decision makers use a financial approach to review the costs and benefits of new renewable energy projects, the economic value of changes in social welfare resulting from impacts on natural resources is not included in the analysis. Iceland’s policy objective for carbon neutrality by 2040 will require constructing new power plants. This study aimed to estimate the economic preservation value for the Hólmsá and Tungufljót river basins in southern Iceland using the contingent valuation method. A web-based survey of Icelandic residents was conducted between 13 November 2022 and 19 December 2022 using a stratified random sample of 2909 adults. The response rate was 46.6%, with 35.1% of respondents indicating a willingness to pay (WTP) to protect the area from hydropower development. After excluding protest voters and accounting for those with and without WTP, the estimated mean WTP equaled ISK 5515. When scaled to the adult population of Icelandic residents, that equates to a total environmental and social cost of between ISK 1.52 and 1.70 billion. Compared to the estimated levelized cost of energy for the Hólmsárvirkjun at Atley hydropower project, this aggregation equates to an estimated 5.6% markup in total project costs, excluding transmission lines. Accounting for these economic costs in decision making allows for a more holistic understanding of new energy project costs and net present benefits.
1. Introduction
The development of renewable energy (RE) projects has the potential to negatively impact the social and environmental values of a region [1], including values held by individuals who may never visit an area [2]. However, these environmental and social impacts lack a market-defined monetary value [3] and, therefore, often no efforts are made to account for these impacts [4] when assessing the economic feasibility of a new RE project. Accounting for, and incorporating, these additional impacts in an extended cost–benefit analysis (CBA) corrects this imbalance and allows for a more holistic estimate of the net present value (NPV) associated with RE development [5].
While many countries require new RE proposals to undergo an environmental impact assessment (EIA) [6,7,8], those typically focus on sociocultural and environmental impacts and do not address impacts on well-being at the individual level. Additionally, what are often referred to as non-use values [9,10,11] are not captured within an EIA. What is missing in these analyses is an understanding of the extent of potential welfare change due to the development of new RE projects.
Iceland is committed to achieving net-zero carbon emissions by 2040 [12], but recent limitations in producing enough energy to meet demand [13] suggest that new power plants may need to be developed in the future to meet that goal [14]. However, Icelandic residents have historically voiced their preferences toward specific hydropower developments within their country, with actions ranging from peaceful demonstrations to the use of dynamite to eliminate an existing dam [15]. Of concern have been the loss of land for agriculture [15,16], the loss of unique geological wonders [17], and impacts on the environment, wilderness quality, and landscape aesthetics [18,19,20]. Equally at risk is Iceland’s nature-based tourism industry [21,22,23], which is now its number one export sector [24].
Those protests highlight the values Iceland’s residents associate with landscapes in their natural conditions unimpacted by new hydropower projects in select regions of Iceland. In part, they condemn the projects’ adverse effects on wildlife, vegetation, hydrologic connectivity, wilderness quality, and landscape aesthetics [18,25]. The issues fueling these opposition movements in Iceland are tied directly to the nature of the environment in which the new REs are proposed. Iceland hosts some of the most geologically unique landscapes in the world, as well as what some refer to as the last remaining vast wilderness in Europe [26,27,28]. Additionally, Iceland is home to unique flora and fauna [19].
When decision makers in Iceland are faced with determining the feasibility of an RE project, the omission of an economic value for its environmental and social impacts can distort the project’s benefits and costs [5]. Incorporating these economic values, as repeatedly called for by the OECD [29,30,31], in an extended CBA has the potential to reduce those distortions and bring a more holistic understanding of a project’s actual costs and benefits [5].
This study aimed to explore Icelandic residents’ preferences toward the proposed Hólmsárvirkjun at Atley hydropower project (HAHP), thereby providing decision makers with valuable information regarding the estimated economic values associated with the project’s social and environmental impacts. The permitting for the HAHP is currently on hold, in part, until the area’s conservation value is further understood [32], and this study aimed to provide insights into that economic value. The research question presented was: what is the estimated mean WTP for the protection of the HAHP project? Additionally, as is customary in CVM studies [33], this study assessed the level to which respondents’ behavior, attitude, and sociodemographic variables affect their WTP to forgo development. Specifically, how do their place of residence, engagement in outdoor recreation, previous visits to the study area, or intended future visits affect their WTP?
Additionally, this study furthers the use of the contingent valuation method (CVM) [33] to estimate the economic value associated with hydropower development and explore individuals’ attitudes and behaviors when evaluating tradeoffs between an RE project and its perceived impacts in Iceland. Only two other CVM studies regarding hydropower projects have been conducted in Iceland [34,35], one of which was conducted after construction began [35].
This article is organized into six sections. Section 1 highlights the broad importance of accounting for the economic value associated with hydropower development’s environmental and social impacts in decision making regarding land use. Section 2 outlines the background of energy development in Iceland and details the selection process employed to identify a study site. Section 3 describes the methods used and outlines survey development and administration. Section 4 contains the results of this study. Section 5 discusses the results in the context of previous studies and their importance for policy. Lastly, Section 6 provides concluding remarks and suggestions for future research.
2. Renewable Energy in Iceland
2.1. Iceland’s Strategic Approach to Energy Development
Iceland is one of only two countries with a comprehensive planning approach to RE development focused on the sustainable development of its identified RE resources [19,36]. This is being carried out through a governmental project called Master Plan for Nature Protection and Energy Utilization (MP), which is managed by the Ministry of the Environment, Energy, and Climate [37]. The MP is focused on evaluating the benefits and tradeoffs between energy developments and the respective environmental and social values [38]. A key focus is the “… prioritization of power plant options with regard to the needs of society in terms of economic activity, conservation of natural quality, strengthening of rural areas and the interests of all those who utilize these same qualities with sustainable development as a guide” [32] (p. 12). To a degree, the MP shares some common traits with a Strategic Environmental Assessment, with its policy and planning level approach and intended goal of ensuring sustainable energy development in Iceland [39], though at a broader level and at the earliest stage of the process.
Since 1999, all new energy project proposals that are 10 megawatts (MW) or larger are subject to the MP process, in which they are analyzed by four working groups comprising experts in their fields and ranked based on their level of estimated impacts [39]. Each project is then placed in either the utilization, protection, or on-hold category by a steering committee based on the rankings across the four groups [37]. Those recommendations are then sent to the Icelandic Minister of the Environment, Energy, and Climate, who is responsible for proposing a resolution to Parliament [19]. The adoption of the Master Plan Act in Parliament makes the passing of the bill legally binding. This has been performed twice, in 2013 and 2022.
2.2. Study Site
This study focused on the proposed 65 MW HAHP, which is in the on-hold category in the MP, meaning that more information is required before being appropriately categorized to either protection or utilization [32]. Selection of a case study for this research focused on ten of the thirty-eight RE projects in the on-hold category within the MP that contained enough information [32] to be analyzed in a selection matrix based on the magnitude of their potential impacts (Table A1). The HAHP was selected from that matrix because it received the highest scores in two of the three categories and the second-highest score in the third category. Additionally, the HAHP’s position in the selection matrix reflects the statement made by the Icelandic Ministry of Environment and Natural Resources that “[t]he catchment area is one of the few slightly disturbed or undisturbed large, continuous rivers basins in Iceland, in addition to having very high valuable geological formation and hydrology” [32] (p. 173).
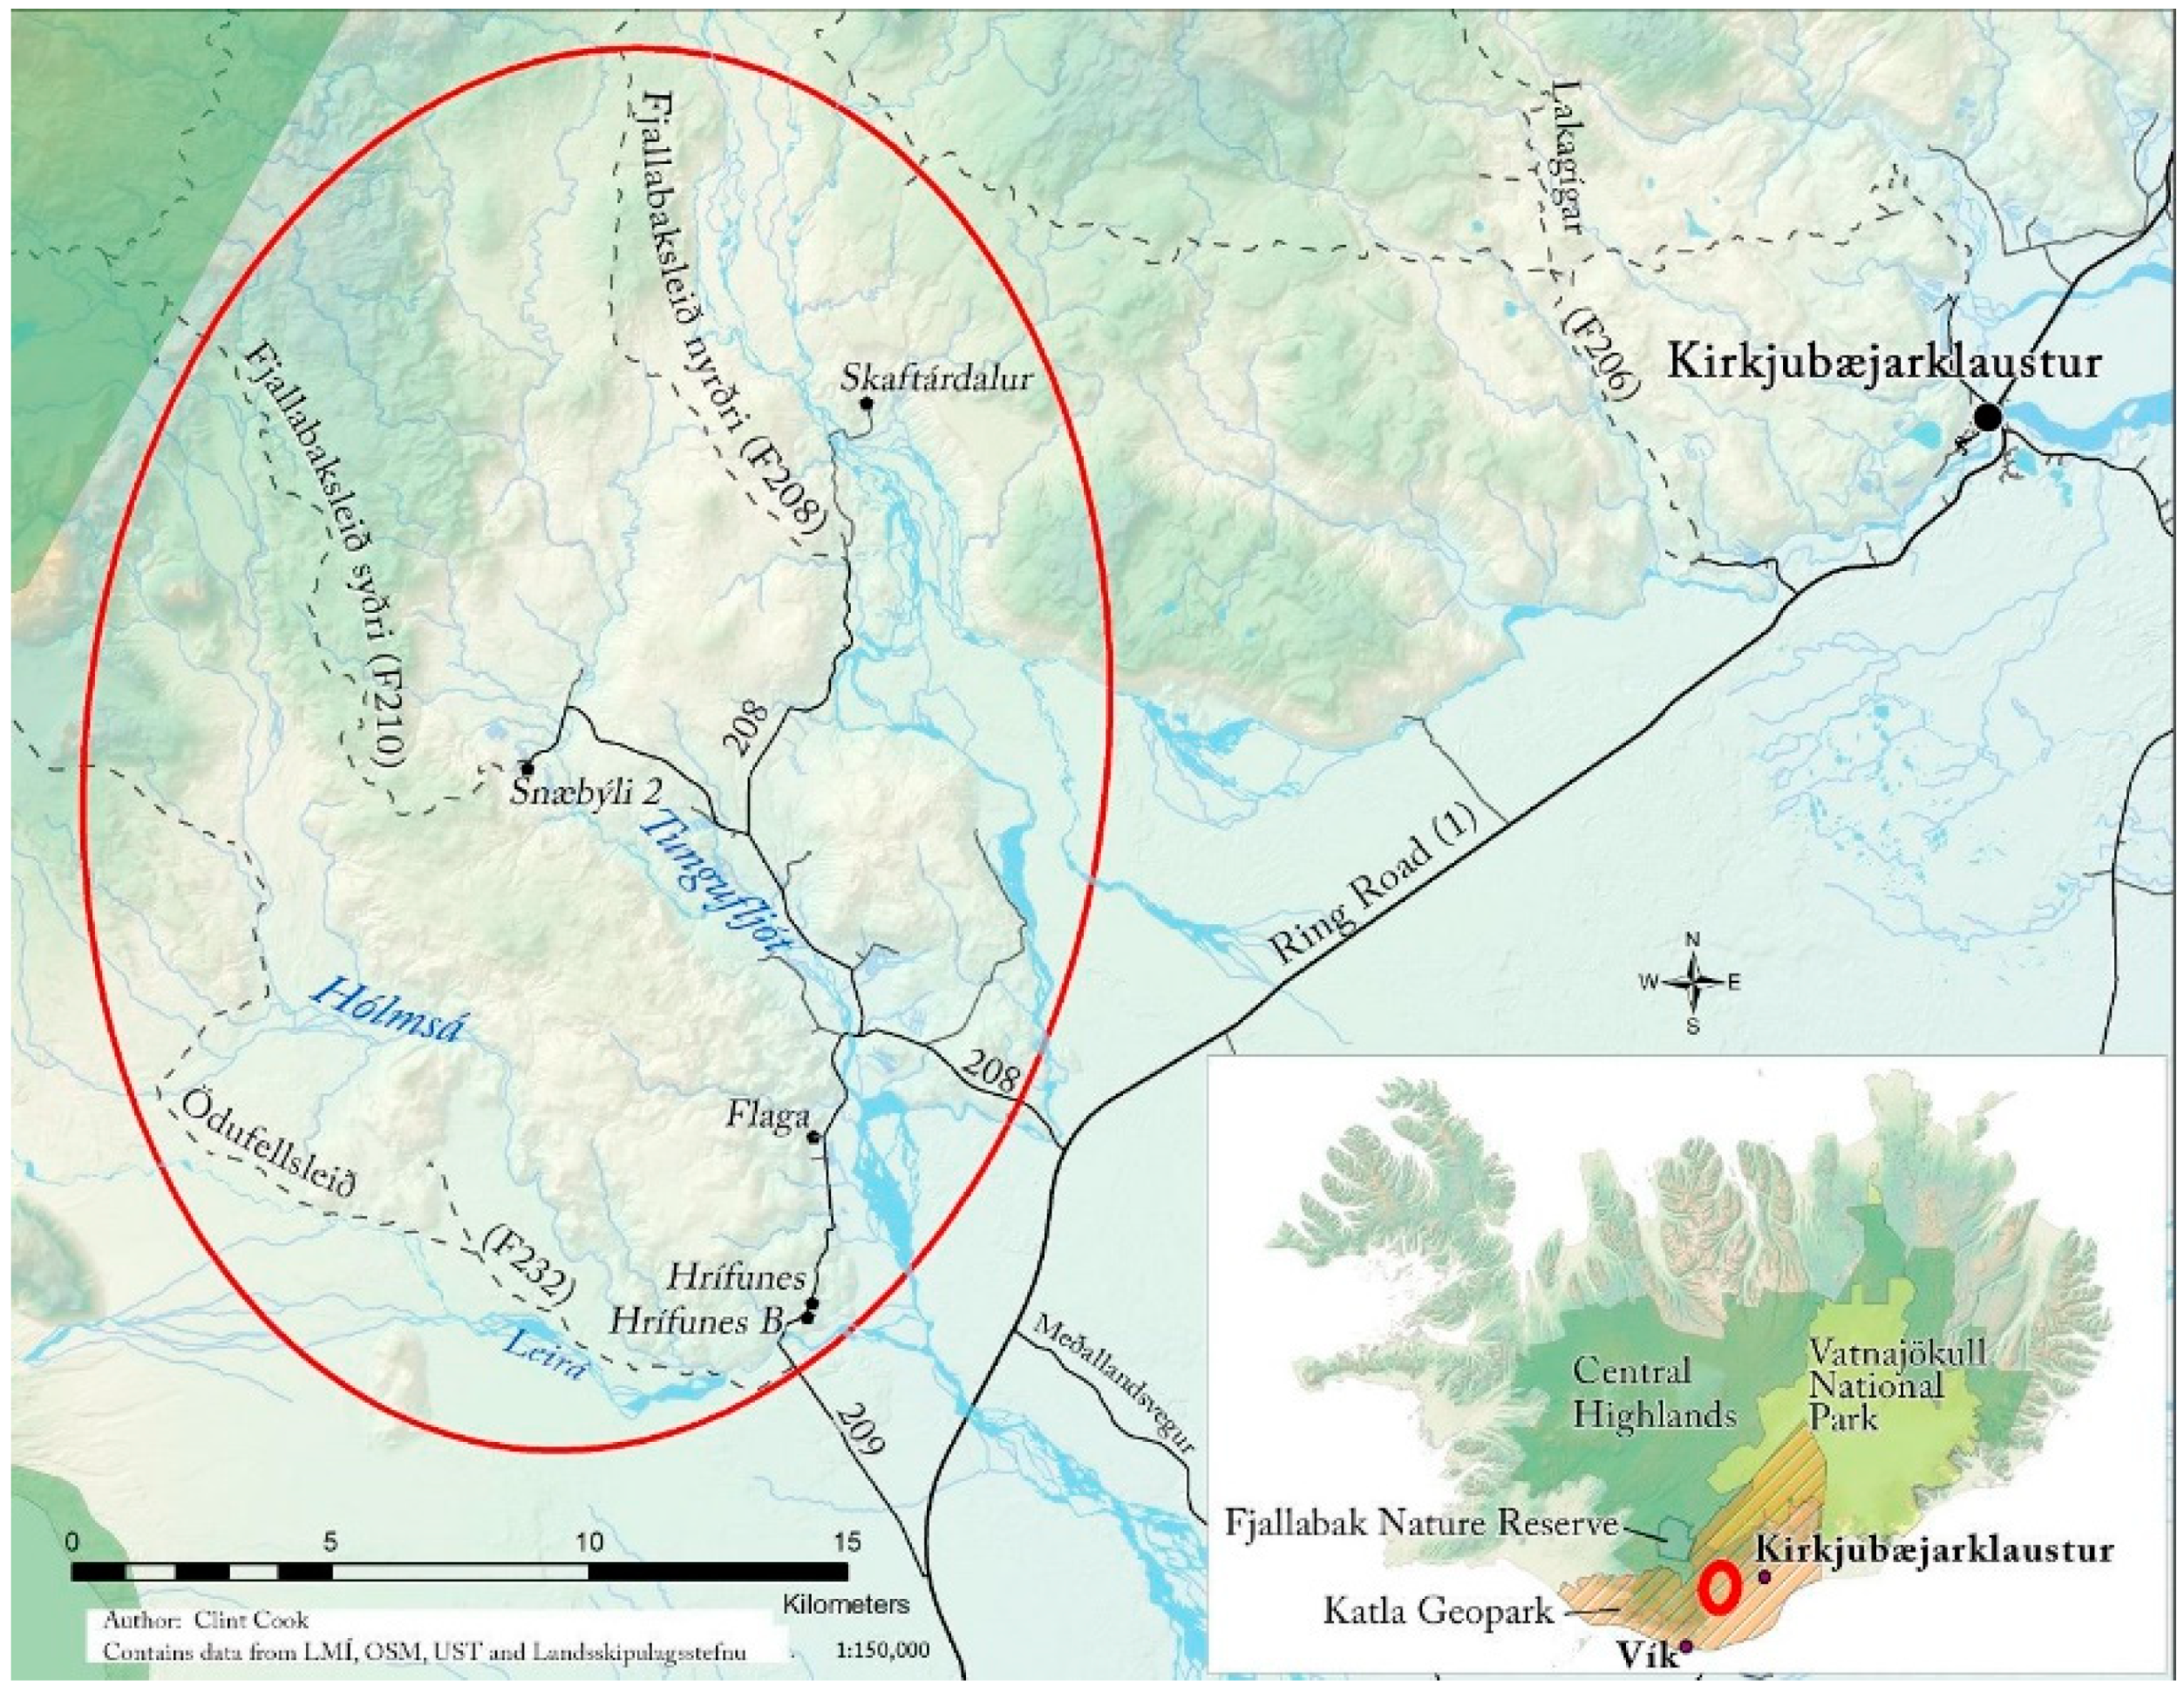
The HAHP project is located in a remote area of the Skaftárhreppur municipality in southern Iceland (Figure 1). The municipality is one of the largest in Iceland [40]. However, with only 641 inhabitants, it also has one of the lowest population densities in Iceland [41]. The municipality is home to a vast array of geologically unique landscapes, to the point that it was designated as part of the Katla Geopark by UNESCO, whose mission is to “…protect the natural environment, promote local sustainable development, introduce local culture and place a strong emphasis on nature tourism” [42,43].
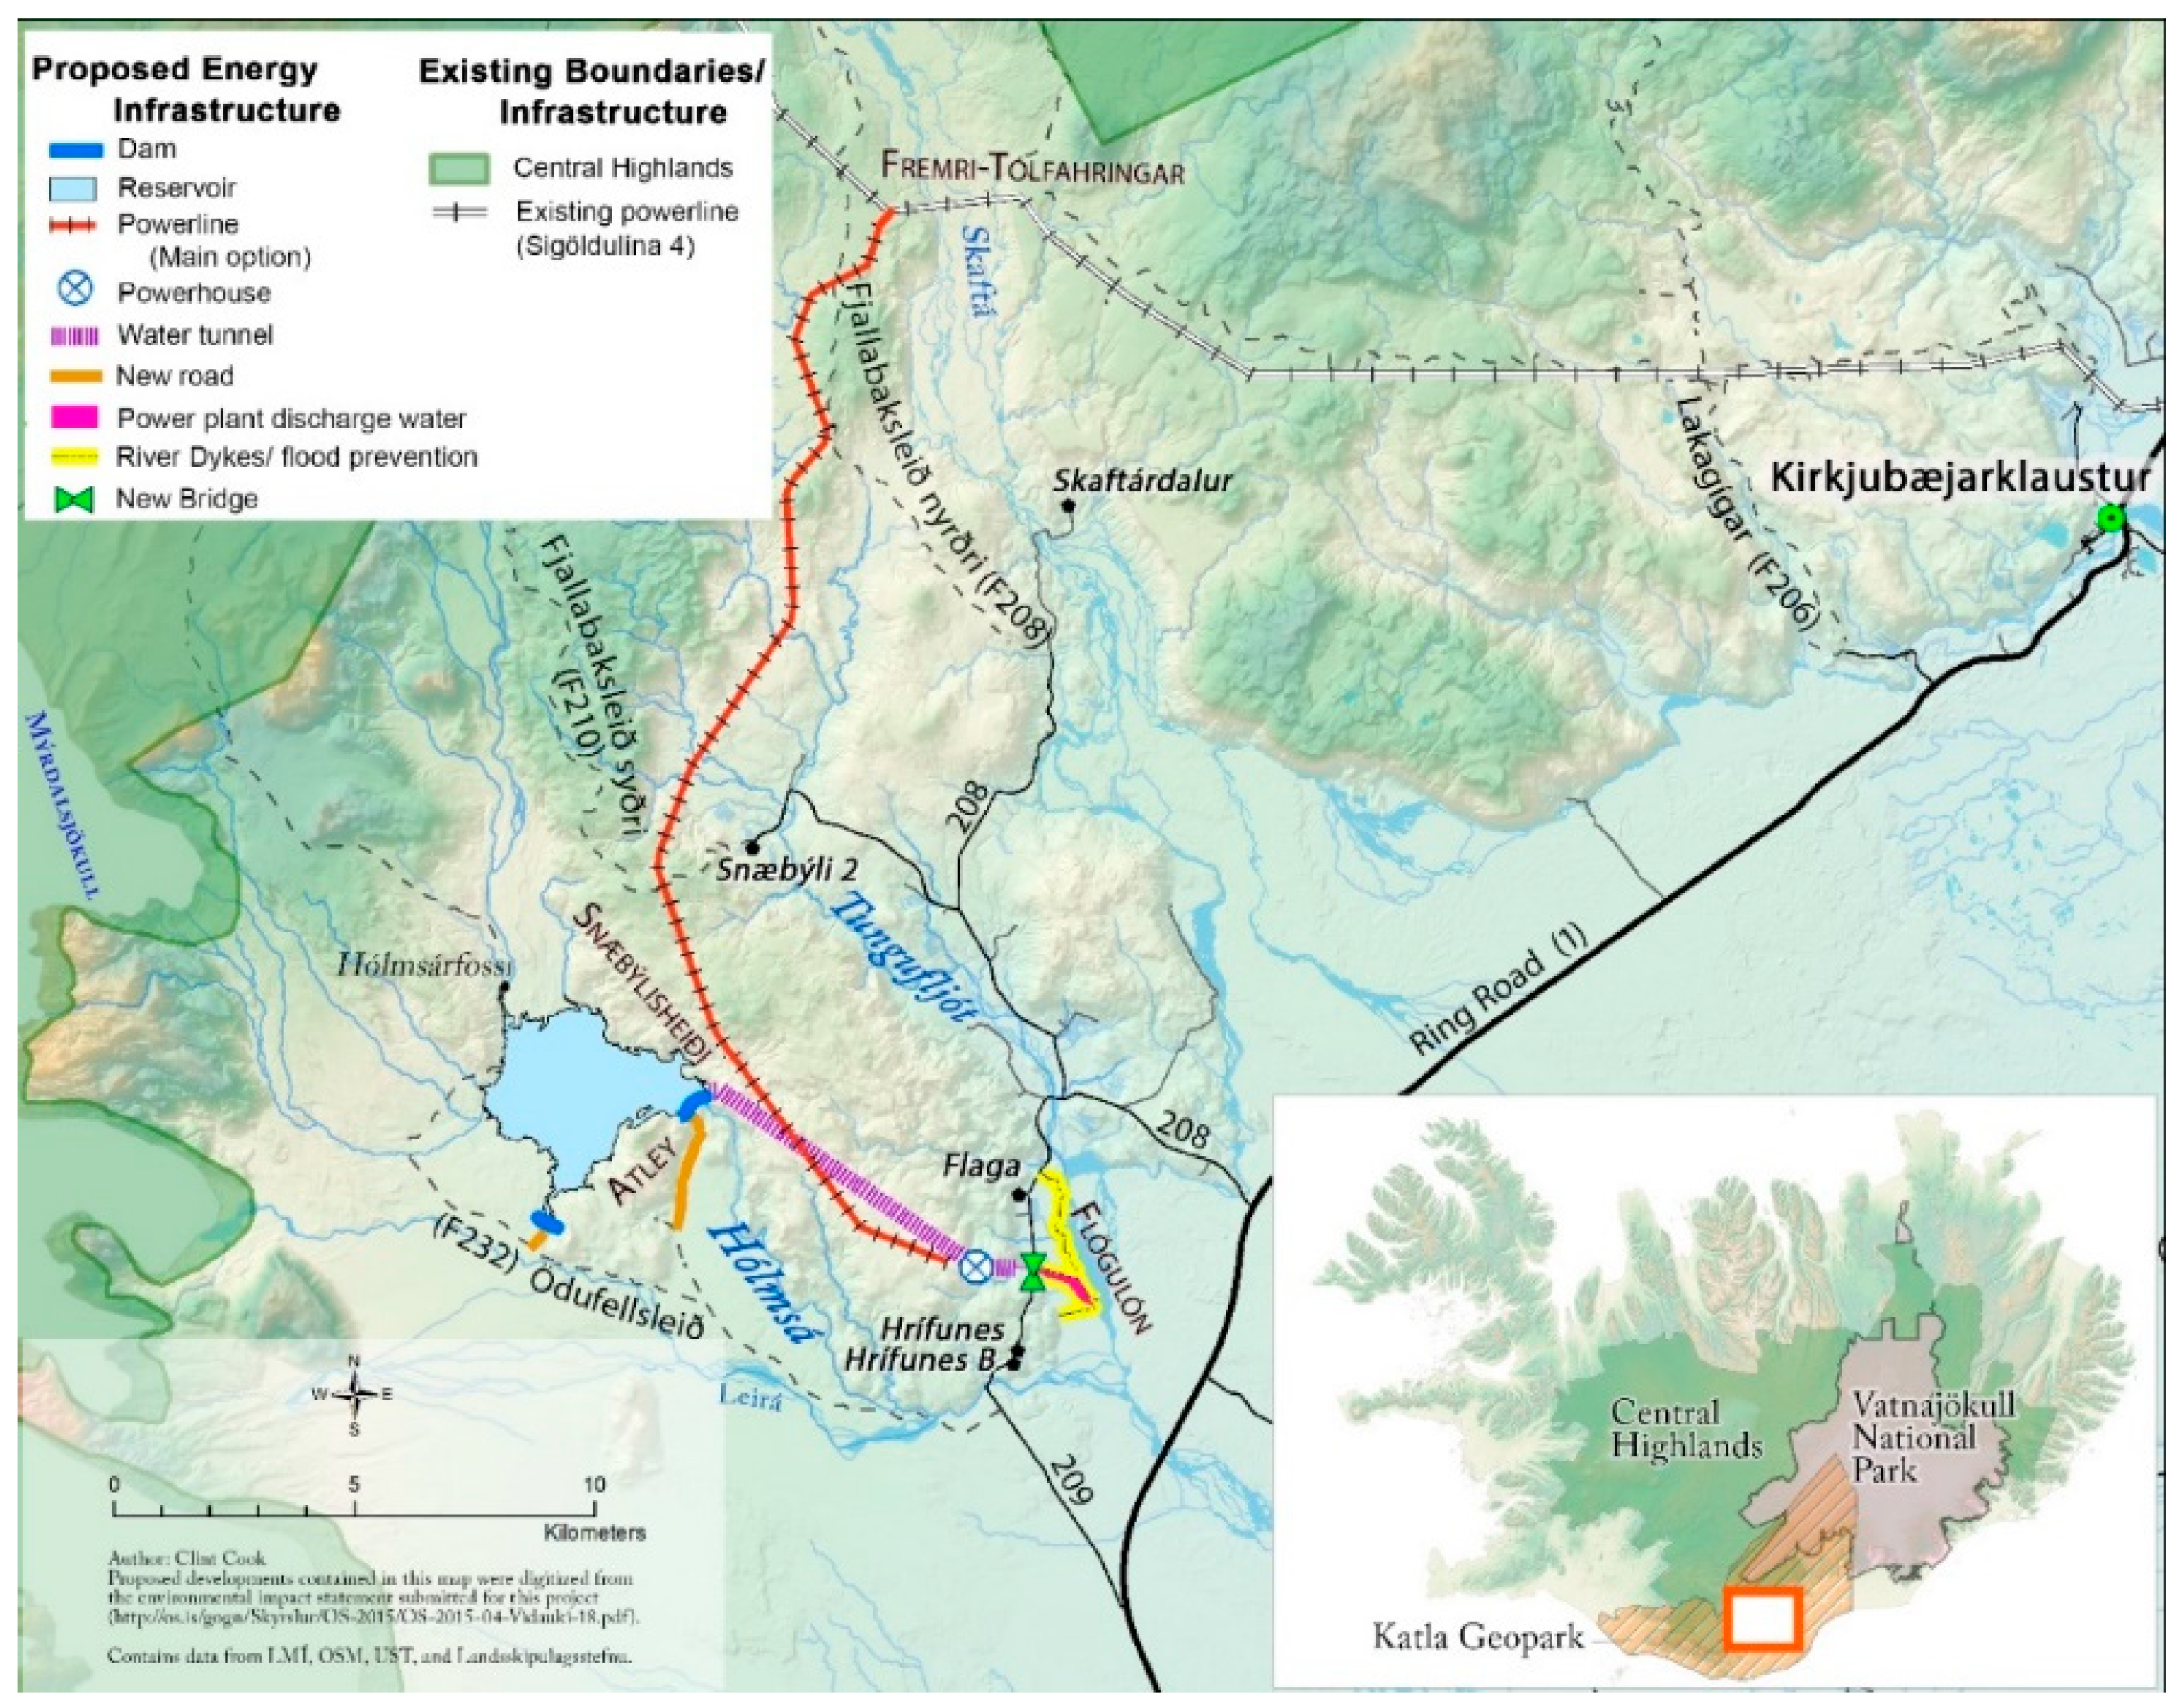
The HAHP would require the creation of a 9.3 square kilometer reservoir (Figure A1) through the construction of two dams (the largest of which is 38 m tall, with a spillover height of 172 m, and 470 m long) and excavation of approximately 13 km of underground supply water tunnels and effluent canals [44]. Installation of an overhead transmission line, and potential for a 5 m wide access road for the length of that line [45], would connect the powerhouse to the main transmission grid, thereby crossing over two remote roads (F208 and F210) that lead to the Central Highlands and popular tourist destinations, such as Eldgjá and Landmannalaugar (Figure A1). Additionally, flood prevention dikes would be constructed along the west side of the Tungufljót River to protect lowlands near the outflow discharge canal [44].
Impacts of the HAHP include potential loss or disruption of the diverse ecosystem, including rare and threatened species of flora [46,47], loss of the native birch forest [46,47,48], elimination of sheep grazing lands [46], and unknown changes to the region’s ecological integrity due to potentially increased groundwater levels from the reservoir development [46]. Furthermore, the HAHP infrastructure would impact the pristine landscape of the region [49], thereby negatively affecting nature-based tourism and recreation in the area [50,51].
3. Methods and Materials
3.1. Contingent Valuation Method
This study used the CVM to capture the preferences of adult Icelandic residents toward protecting the Hólmsá and Tungufljót river basins from energy development and to estimate a change in the economic and social values for the area if the HAHP were to be constructed. The CVM was selected based on the values underlying historic protests toward energy development in Iceland (both use and non-use values) and the hypothesis that non-use values would be a large component of the reported values based on the low population density in the neighborhood and low visitation to the area [52]. Additionally, the CVM was chosen because only one dichotomous choice (preservation or not) was presented to participants, unlike in more complicated discrete choice experiments, where respondents are presented with multiple policy options and their corresponding prices [53]. The withholding of a decision on permitting the HAHP, based on the interest in understanding the area’s conservation values, indicates the potential importance of non-use values for the region, reinforcing the need for a stated preference method to measure those values [54].
3.2. Survey Design and Implementation
3.2.1. Population Identification and Sample Selection
For this study, the affected population of the proposed HAHP was identified as all adult residents of Iceland aged 18 and over, given the national interest in decision making regarding the welfare of public lands [15,16,55] and the legal right to vote in referendums. Furthermore, communities near proposed energy developments may have a broad spectrum of attitudes and preferences toward said developments [15,16,56]; therefore, this study also aimed to collect a broad sample of those living in Skaftárhreppur and the municipalities proximal to the proposed HAHP.
The Social Science Research Institute (SSRI) at the University of Iceland was contracted to conduct a web-based survey using their panel database to collect a representative sample. Given that the sampling frame was established as all Icelandic residents aged 18 and older, the SSRI’s panel database, selected from Iceland’s National Registry and weighted according to the socio-demographics of the national population [57], was an appropriate means. In August 2022, their database comprised 8831 registered residents of Iceland, recruited by SSRI to eliminate self-selection [57].
The sample for this study included 2909 database participants aged 18 and over, representing 1.0% of the adult population of Icelandic residents. The sample was stratified by age, gender, and place of residence to closely represent the Icelandic national population. Additionally, the municipality affected by the project, Skaftárhreppur, as well as those near the project site, Mýrdalshreppur and Hornafjörður, were oversampled. In total, 117 individuals living in those municipalities were included in the sample.
3.2.2. Survey Design
A key element in a CVM study is a well-designed survey that follows best practice guidelines [33,54,58,59,60,61,62]. The survey for this study was provided in English and Icelandic, which allowed respondents to select their preference. The survey contained four sections, following modern design recommendations [61].
The first section introduced the survey to respondents, outlined the purpose of the research, provided notification of who financed this study, and relayed an assurance that responses would remain confidential. Respondents were also notified of the voluntary nature of their participation in the survey, their ability to skip individual questions or stop answering at any time, and who to contact with any follow-up questions [61].
The second section contained a series of attitudinal and behavioral questions, along with questions regarding prior knowledge or experience with the goods in question, which, for this survey, were the environmental and social values associated with the Hólmsá and Tungufljót river basins. Because the interest in this study was the preservation value of an area potentially impacted by a hydropower plant, it was decided to include behavioral questions about the respondents’ level of engagement in outdoor recreation. Attitudinal questions were designed to understand the respondents’ disposition toward the development of all RE types in Iceland, their inclination to support conservation organizations, and their positions on environmental protection in general.
As is customary, the third section of the survey contained a detailed scenario that identified the proposed infrastructure developments for the HAHP, a description of the potential environmental and social impacts in the region, and the potential benefits of the power plant, which follows best practices [53,54,60]. Additionally, this section contained the hypothetical market created to elicit the respondents’ maximum WTP amount [60]. Lastly, this section ended with two debriefing questions to discern the level to which the respondent understood the scenario as presented and provided their maximum WTP based on their understanding of the proposed development and its likely environmental and social impacts [60].
The payment vehicle selected for this survey was a one-time, voluntary payment. The literature states that a payment vehicle must be “…realistic, believable, and neutral” [53] (p. 73), and given the context of the scenario, where a portion of the affected area is privately owned, only a voluntary payment meets those criteria [63]. Understanding that voluntary payments, or donations, are not enforceable, efforts were made to frame the information in a consequential context within the valuation text of the scenario [54], so respondents would have “…at least a weak incentive to tell the truth” [53] (p. 73). Response options were listed randomly, so no option was consistently the first option in the list, helping to reduce the potential for primacy bias [64].
The elicitation format for this study was the payment card, which provides several advantages over the other methods, such as open-ended questions, bidding games, or dichotomous choice [62]. Payment cards eliminate starting point bias [54] and reduce the number of outliers, which are common critiques of the other methods [62]. Additionally, bidding games or dichotomous choice can introduce bias in the form of yeah-saying [62]. One concern with payment cards is the appropriate range of values presented to respondents [62], which, for this study, was analyzed in the pilot study and is discussed in Section 3.2.4 below.
The fourth section contained demographic and household economic information. This survey focused on standard questions including gender, place of residence, age, individual income before taxes, number of children at home, occupation, and level of education.
3.2.3. Survey Mode
A web-based survey was selected for this study due to nearly 100% Internet access among Iceland’s citizens and the prevalence of web-based surveys for CVM studies in Iceland [4,65,66,67,68]. Collecting a representative sample of Iceland’s adult residents using a face-to-face method was also prohibitive in terms of both cost and time compared to web-based delivery. Additionally, because web-based surveys are self-administered, incidents of yeah-saying are reduced compared to in-person interviews due to the lack of interviewer effects [64].
The web survey offered several advantages, particularly for those who wanted to reflect on the information presented before advancing through the survey or those who had limited time available at any one moment to complete the survey. Additionally, the Qualtrics XM software used to develop the survey allowed for the inclusion of logic branching, with respondents receiving only relevant questions based on their previous responses. The use of visual aids was also an advantage of this mode. This survey’s introductory paragraph included a sentence that suggested using a computer screen rather than a phone or tablet due to the visual aids included.
3.2.4. Pilot Testing
Pilot testing the survey instrument is important for gauging the target audience’s understanding of the questions and gaining insight into potential nonresponse issues [60,64]. The SSRI administered the pilot test with 140 of their panel members. The survey was sent out on 27 October 2022 and ran for five days. One email reminder to complete the survey was sent after the first three days had passed.
The efficacy of the payment vehicle was analyzed in the pilot test [53]. An examination of the responses from the pilot survey indicated that the range of values selected in the payment card was appropriate for capturing the majority of respondents’ reported WTP values. Based on those observations, no changes to the payment card were deemed necessary.
3.2.5. Survey Administration
The final data collection for this study was conducted over five weeks from 13 November 2022 to 19 December 2022. The SSRI sent five reminder emails to those who still needed to complete the survey throughout that period. The survey experienced a participation rate of 46.6% with responses from 1357 individuals, which is consistent with CVM survey participation rates from previous studies in Iceland that used a web-based mode [4,65,66] as well as online surveys in general [69].
3.3. Database Management
Of the 1357 respondents, 1278 provided information that allowed for further analysis. Cases in which the respondents quit answering questions early in the survey were removed from the dataset. In addition, cases were examined to identify strategic responses, such as repeated use of the ‘prefer not to answer’ response for all questions or selecting the central option for all questions. In total, 79 cases were dropped from the dataset for these conditions (Table 1).
In the recommendations for best practices in CVM survey design, it is stated that respondents should have a nonresponse option for the valuation question [59,60]. For this study, there was a ‘prefer not to answer’ response option. During the pilot test, no deliberate use of this response was observed; however, throughout the main survey, the response option was selected in 361 cases, which were removed from the dataset (Table 1).
Responses that did not provide information directly related to their preferences toward protecting the Hólmsá and Tungufljót river basins were coded as protest votes. A crucial step when analyzing CVM data is the discernment between respondents with no WTP values, such as those who have no interest in the preservation of the Hólmsá and Tungufljót rivers, and those who object to the survey, including, in particular, the merits of the elicitation method [70], or those whose behavior distorts their true preferences in the survey [53]. In total, 57 cases were identified as protest votes, representing 4.5% of the responses (Table 1).
Lastly, it is vital in a CVM survey that the respondents know what they are valuing and when the payment is necessary [53]. This survey used two debriefing questions to determine the degree to which respondents recalled information they had just read in the scenario [60]. Failure to answer at least one of the questions correctly was considered a cause for dropping the case from the dataset. After accounting for all other selection criteria, nine cases were identified as failing to answer at least one question correctly (Table 1).
3.4. Coding and Statistical Model
3.4.1. WTP Value Coding
When using a payment card format, the true WTP is found in the interval between the respondent’s selected value and the next higher value [58,71,72] for a specific set of payments offered on the payment card (n), ordered sequentially (p1, p2, …, pn) such that pn > pn−1. Then, the probability of someone choosing pn is reflected by the probability that their WTP lies between pn and pn+1 [58].
where:
Pr = probability;
pn = payment card value iteration.
For this study, a respondent’s reported WTP value was recalculated as the midpoint between their selected value and the next greater value on the payment card (Table 2). Respondents were presented with sixteen values based on an interval of ISK 2000, with the largest option being ISK 30,000. Response options were available for those not wanting to, or unable to, provide a response, as well as a write-in option for those wishing to donate more than the highest value provided. Based on the distribution of values, the cutoff point for an outlier was set at WTP values greater than ISK 50,000. Thirteen cases were identified as outliers in this study and removed from the regression analysis.
In keeping with common practice for analyzing reported WTP values from the payment card elicitation method, a parametric test was used to estimate mean WTP values using the Tobit regression model [71,73,74]. The Tobit model employs a log-likelihood function to account for the intervals and censored data [71,73]. The Tobit model is represented by:
where [75]:
WTP = xi β + εi
xi is the predictor variable(s);
β is the respective coefficient;
εi represents the error term.
The error term is “… assumed to be normal with zero mean and constant variance…” [76] (p. 318). Instances of reported WTP values are then represented by the following formulas [74]:
where:
Li = the maximum likelihood of a WTP outcome;
μ = mean WTP;
εi = a random error component;
t1 = stated WTP on the payment card;
t2 = next highest WTP amount on the payment card;
Pr = probability.
Equation (3) represents those cases with a reported value of zero for their WTP. It illustrates the supposition that their true WTP lies between their stated value and the next greatest option listed in the payment card, which was ISK 2000. Equation (4) follows the cases where the WTP values lie within the intervals provided on the payment card. Finally, Equation (5) represents those cases that exceed the upper limit provided.
Each of the predictor variables used in the Tobit regression and their coding schemes are found in Table A2. Variables are separated by type; the regression focused on six socio-demographic variables, five attitudinal and behavioral variables, and two variables focused on the study area.
3.4.2. Statistical Model
Aggregated WTP values were treated as a range of values rather than a point estimate [58]. Because of this, reporting of the total estimated value associated with the social and environmental impacts is based on the 95% confidence interval for the WTP variable rather than a single value. Confidence intervals for the aggregated WTP were calculated using the 292,897 adult Icelandic residents, aged 18 and over at the time of the survey [77], using the following formula:
where:
µ = mean WTP;
z = confidence coefficient level;
SD = standard deviation;
n = sample size.
3.5. Timeline for Data Analysis and Organization
All statistical analyses were performed from December 2022 to February 2023 using IBM SPSS Statistics (version 29.0). As appropriate for CVM studies in Iceland [4,66,74], the cutoff level for statistical significance was set at 90%.
Data analysis was conducted in three stages:
- A general descriptive analysis of attitudes and behaviors.
- A Tobit regression analysis to understand the influence of the predictor variables on reported WTP values. Variables examined in the descriptive analysis were further explored in the regression to clarify the research questions driving this study.
- Calculation of the mean WTP and its descriptive statistics, such as confidence intervals and standard deviation. Mean WTP values were calculated and used to derive the aggregate WTP associated with the HAHP, which would represent the environmental and social cost value in a CBA.
4. Results
4.1. Representation of Population across Stratified Variables
The general descriptive analysis included all cases that provided enough data to analyze behaviors. In total, 1278 cases were included. Examination of the proportion of respondents within each category, including age, gender, residence, and education, indicates that the trimmed dataset closely resembled those observed in the survey results (Table A3). A preliminary examination of data by SSRI revealed statistically significant differences between the national adult Icelandic population and respondents in all four categories: gender, age, place of residence, and education. The most significant difference was observed within education, where individuals with a university-level education were overrepresented by 18%. Those aged 18–25 were underrepresented by 10%, along with those aged 26–35. Individuals aged 56–65 were overrepresented by 7%, along with those between 66 and 75. Lastly, females were underrepresented by 6% in the descriptive analysis, and residents living in the capital area were also underrepresented (5%).
Examination of respondents’ place of residence indicates a representative sample across all six regions of Iceland (Table A4). The Capital area and Southwest were underrepresented (4.2% and 2.7%, respectively), while the East, North, West, and Westfjords regions indicated only slight overrepresentation (0.5% to 1.4%). The South recorded the second-highest number of responses across the country, which also relates to its overrepresentation of 4.5%. Respondents living in the Hornafjörður, Mýrdalshreppur, and Skaftárhreppur municipalities (roughly 35% of respondents from the South) were further classified. Fifty-nine people reported living in one of those three municipalities, with forty-three individuals (73%) from Hornafjörður.
4.2. Responses to Attitudinal Questions
4.2.1. Attitudes and Preferences toward RE and Environmental Protection
The survey contained three questions to provide an understanding of the respondents’ attitudes toward ensuring Iceland can develop its domestic RE resources, environmental protection, and donating time or money to environmental conservation organizations. A substantial majority of respondents (64%) felt it is very important that Iceland retains the ability to develop its domestic renewable energy resources in the future, while approximately 1% felt the issue is not important at all (Table 3). Similarly, 54% felt environmental protection is very important, while 1% thought it is not important at all. Lastly, attitudes toward personally donating money or time to environmental conservation organizations showed a wider distribution of reported attitudes, as 15% reported the action was very important, while 30% remained neutral. Approximately 25% indicated they felt donating personal resources was either not important at all or not that important.
Gender (X2 (4, N = 1278) = 24.342, p ≤ 0.001), age (X2 (24, N = 1278) = 44.689, p = 0.006), and education (X2 (8, N = 1278) = 19.241, p = 0.014) indicated significant differences regarding attitudes toward ensuring Iceland can continue to develop its domestic RE in the future (Table A5). Most males felt it was a very important issue (69%), while 57% of females held the same belief. The attitudes reported by females were slightly skewed toward finding the topic of energy security rather important compared to males, with 4% more females reporting neutral attitudes and 9% more females than males stating they find it rather important.
Respondents between 56 and 75 years old were most likely to say domestic RE development is important in the future (69%). Those aged 46 to 55 reported the highest number of neutral beliefs across the age ranges (10%). Lastly, all levels of education indicated that a majority of the individuals felt the issue was very important; those with a university-level education reported the highest number (69%), followed by upper-secondary (60%) and, lastly, those with compulsory education or less (56%).
Regarding beliefs on the importance of environmental protection, gender (X2 (4, N = 1278) = 22.554, p ≤ 0.001), place of residence (X2 (20, N = 1278) = 30.768, p = 0.058), and level of education (X2 (8, N = 1278) = 64.790, p ≤ 0.001) indicated significant differences (Table A6). Females were more likely to report that environmental protection was very important (61%) than males (49%). Individuals living in the East were less likely to believe it was important (5%) than those in the other five regions of Iceland. Residents of the Capital area were the most likely to believe that environmental protection is important (57%). Lastly, individuals with a university-level education resoundingly viewed environmental protection as a very important issue (62%), with very few reporting that it is not (0.3%).
Attitudes toward donating personal resources to environmental conservation organizations showed a wide distribution across the response options (Table A7). Gender (X2 (2, N = 1278) = 34.712, p ≤ 0.001), age (X2 (12, N = 1278) = 39.065, p ≤ 0.001), and level of education (X2 (4, N = 1278) = 10.789, p = 0.029) were all significant. Males were most likely to report a neutral stance on the issue (31%), while the majority of females (53%) found it important, either rather important (34%) or very important (18%). Individuals between the ages of 18 and 25 believed donating was rather important (46%), while only 6% percent in that range felt it was not important at all.
Within education, those with compulsory education or less indicated the largest percentage of people who believed donating personal resources to environmental conservation organizations is very important (18%). In comparison, those with an upper-secondary level of education were most likely to report a neutral belief on the issue (32%). Individuals with a university education reported the smallest percentage of people who believe donating personal resources toward environmental conservation was not important at all (10%), with the greatest percentage holding that it is a rather important issue (33%).
4.2.2. Attitudes toward Renewable Energy Development in Iceland
Of the RE options presented, the greatest support was demonstrated for geothermal (63%) and hydropower (51%), with tidal energy coming in third (40%) (Table 4). Support for onshore and offshore wind energy was nearly identical, with 34–36% reportedly somewhat positive and about 20% very positive attitudes. Nuclear and fossil fuel received very negative attitudes (31% and 59%, respectively).
4.2.3. Attitudes toward Hydropower Developments in Iceland
Gender revealed significant differences (Table A8) (X2 (4, N = 1278) = 57.984, p ≤ 0.001). Males (60%) were more likely than females (39%) to report very positive attitudes toward hydropower development. Females indicated a higher percentage of neutral attitudes (14%) than males (8%) and higher incidents of somewhat positive attitudes (36%) than males (26%).
Significant differences were also identified between age groups (X2 (12, N = 1278) = 24.119, p = 0.020). The percentage of people holding very positive attitudes increased linearly with age, with 44% of 18 to 25 year olds having that position and up to 58% among those over 66 years old. Younger adults indicated a departure from very positive attitudes toward hydropower, with nearly one quarter (24%) of those aged 18 to 25 reporting a neutral stance on further development.
The region of the country where people lived also illustrates significant differences (X2 (20, N = 1278) = 44.080, p = 0.001). Ten percent of those living in the capital area held negative attitudes toward hydropower development, the highest of any region. The West, Westfjords, and Southwest had the highest percentage of people with very positive attitudes (70% and 63%, respectively). A majority of those living in the South (60%) also held very positive views on future hydropower development.
Significant differences were also found when looking at responses from those living in the three municipalities nearest the study area: Mýrdalshreppur, Skaftárhreppur, and Hornafjörður (X2 (4, N = 1141) = 8.187, p = 0.085). More people reported very positive attitudes toward hydropower (59%) in those three municipalities than in the rest of the country (53%). However, unlike the nation, where nearly one third of the residents (30%) reported somewhat positive views, roughly half of that percentage (16%) is represented in these three municipalities. The municipalities in question reported slightly higher percentages for very negative (4% difference) and somewhat negative views (3% difference) toward hydropower development than the rest of the nation.
4.2.4. Familiarity with the Study Area and Activities Engaged in While Visiting
Twenty-nine percent of respondents had never visited the study area before completing this survey, while twenty-eight percent reported visiting the area once or twice (Table A9). Over 40% of the respondents had visited the area more than three times in their lifetime, and nearly 12% had visited more than ten times.
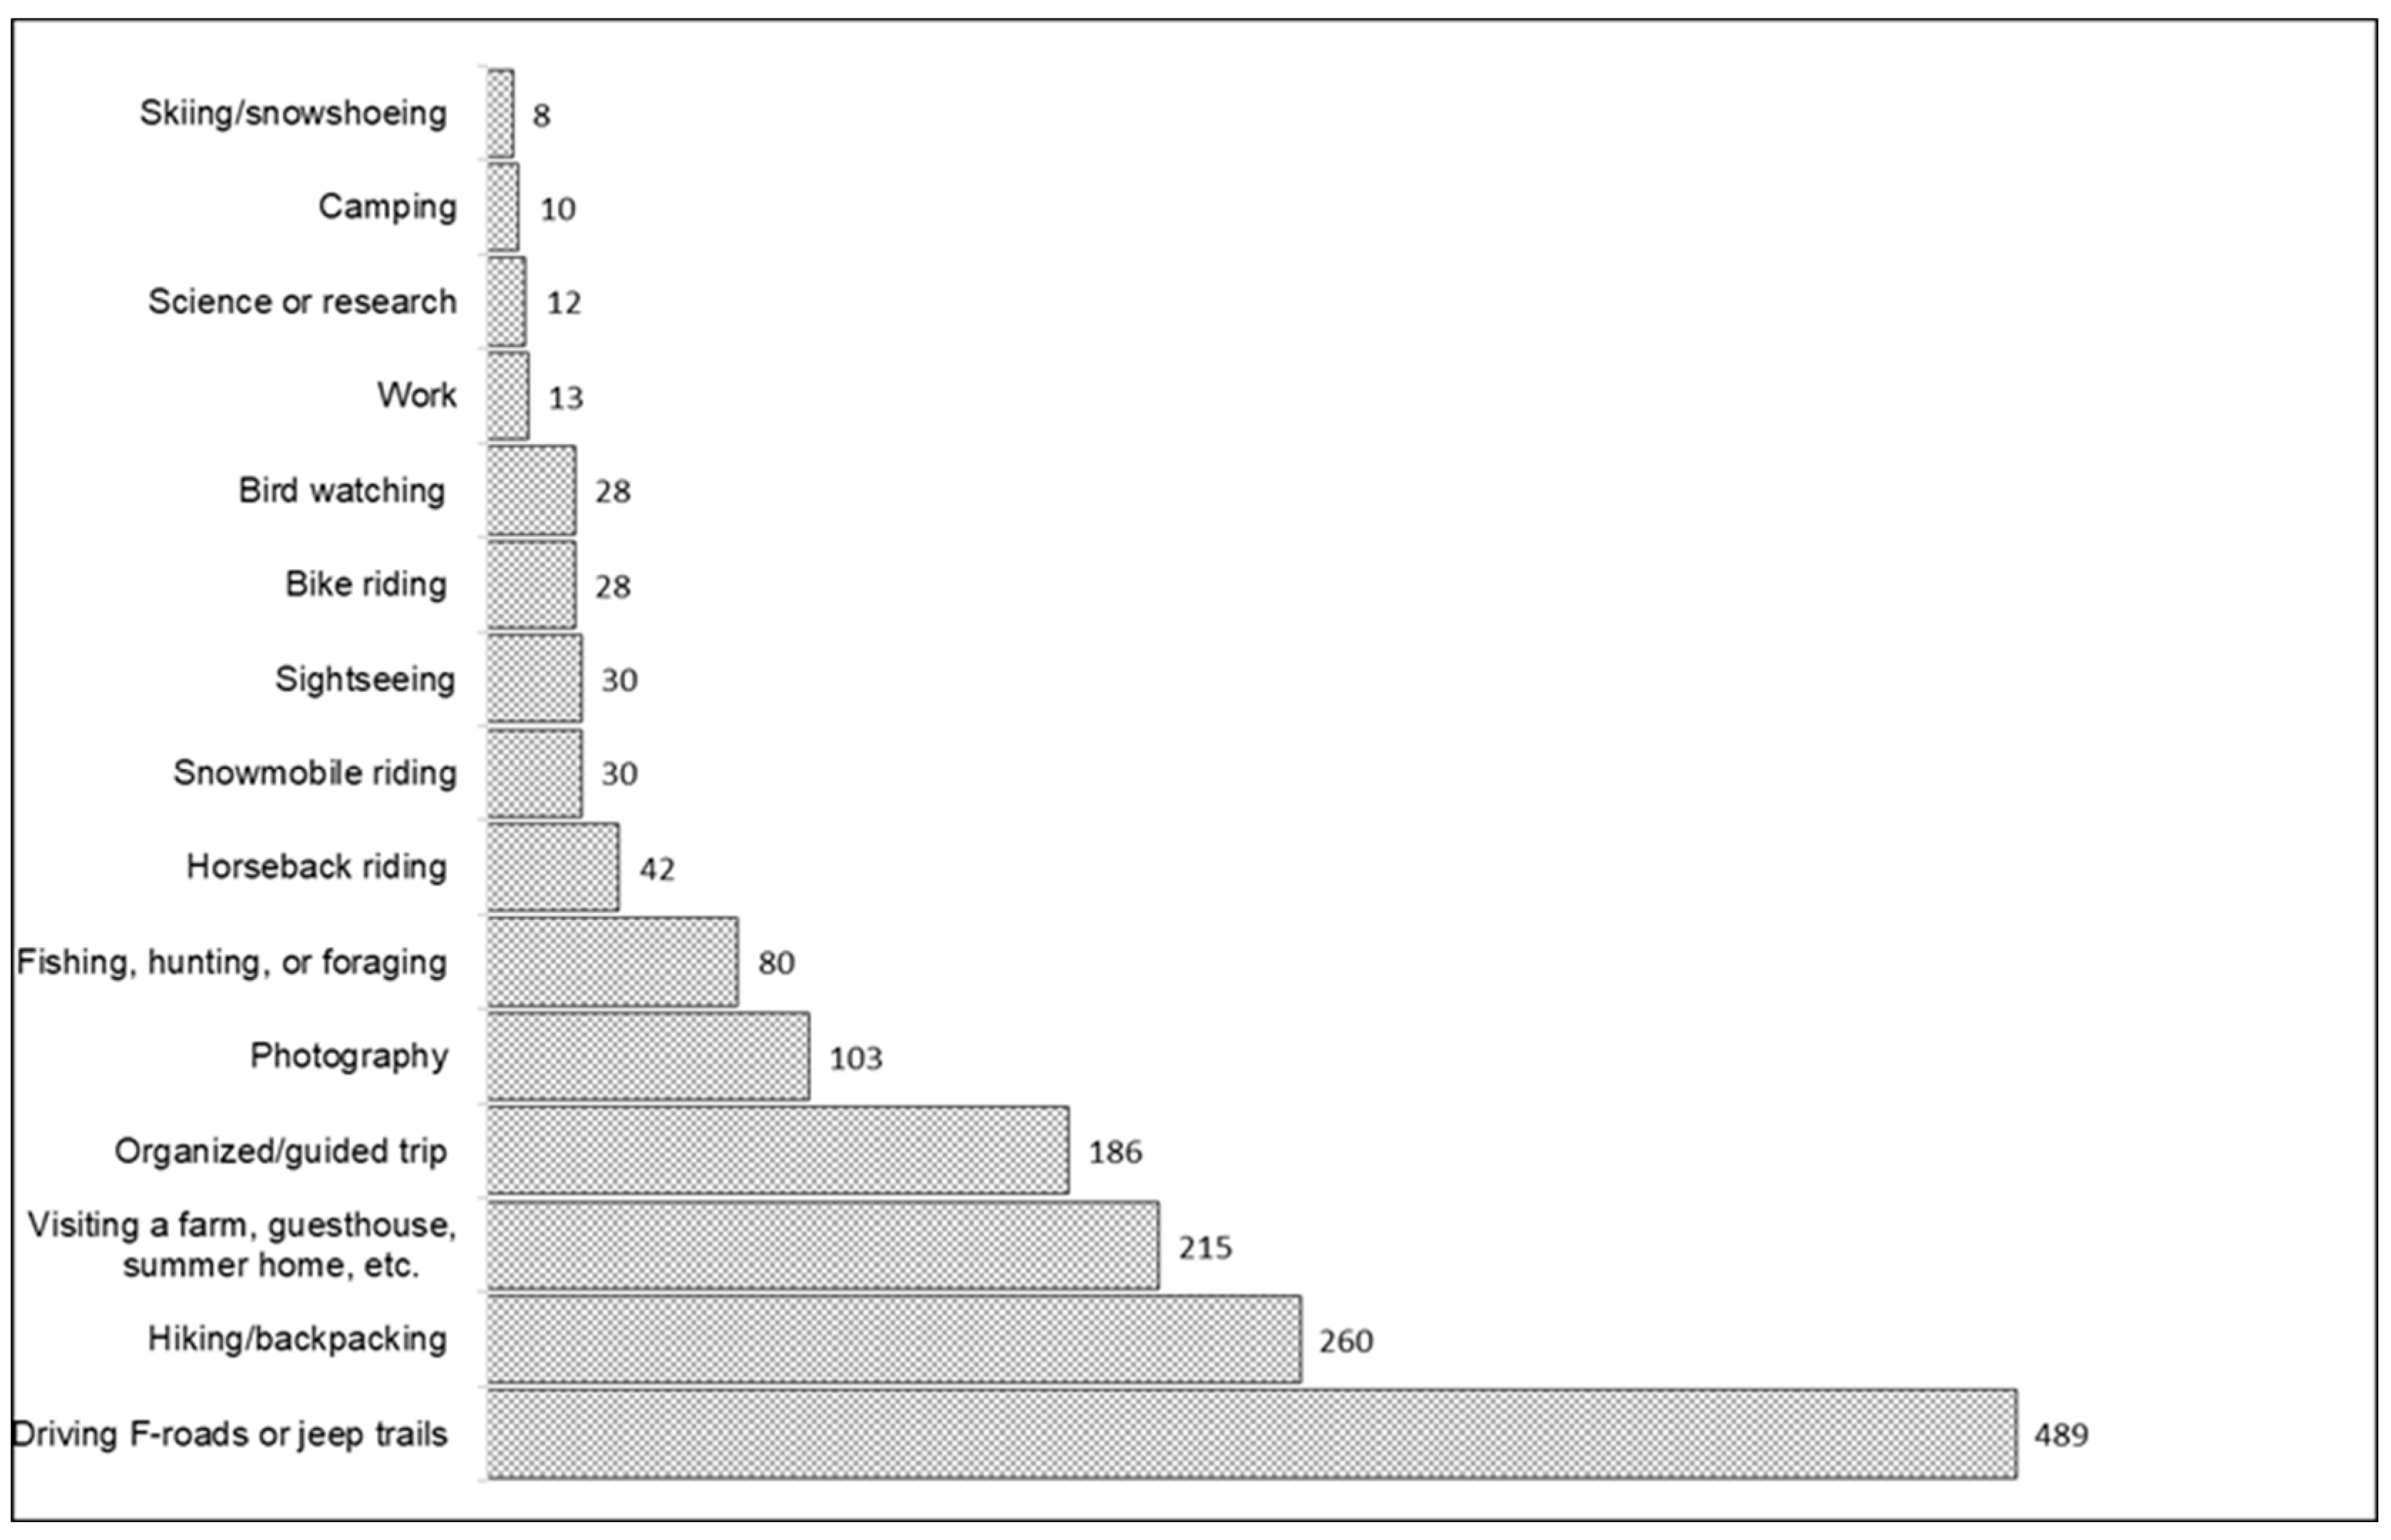
Age (X2 (6, N = 1278) = 54.686, p ≤ 0.001), gender (X2 (1, N = 1278) = 8.402, p = 0.004), and place of residence (X2 (5, N = 1278) = 30.184, p ≤ 0.001) indicated significant predictors of the number of visits to the study area (Table A10). The reported number of visits to the study area increased linearly with age, as 84% of individuals over the age of 76 reported visiting the area at least once. More males visited the site than females, and the highest visitation rates came from those individuals living in the South (83%). Individuals from the Capital area (72%) and the Southwest (71%) recorded the second- and third-highest visitation rates. The most prominent reason (38%) for visiting the area was driving the F-roads or jeep tracks (Figure A3). Hiking or backpacking were the second-highest reasons, followed by visiting a farm, guesthouse, or summerhouse.
When asked whether they intended to visit the study area in the future, 45% responded they did not know, 43% said yes, and the remaining 10% claimed they would not (Table A11). The age of an individual (X2 (12, N = 1278) = 63.555, p ≤ 0.001), and where they live (X2 (10, N = 1278) = 29.789, p ≤ 0.001), indicated significant differences. Individuals aged 56 to 65 represent the largest percentage of people interested in future visits to the study area, while those 76 and older are least likely to visit. Individuals from the South reported the greatest intent to visit the study area in the future (56%), followed by those in the Capital area (44%). Respondents from the Southwest reported the least interest in visiting (17%), followed by those in the West and Westfjords (16%).
4.3. Data Analysis and Regression
The final data analysis used the cases determined to be valid, as gauged using the selection criteria outlined earlier. Instances where individuals failed to report a WTP value, failed to complete the survey, failed to answer at least one of the scenario debriefing questions correctly, were identified as a protest vote, or were identified as outliers were removed from the analysis. In total, the final analysis included 621 cases.
4.3.1. Willingness to Pay
Each of the socio-demographic variables indicated significant differences between the two WTP categories (Table A12). Within gender, males were far more likely to report no WTP (74%) than females, whereas most females reported a positive WTP (52%). Regarding the level of education, 73% of individuals with compulsory or upper-secondary education reported no WTP, while 58% of those with a university-level education reported the same. Individuals earning more than ISK 901k per month before taxes reported 10% higher incidents of reporting no WTP than those earning less. For the place of residence, the Capital area and East showed the greatest deviation from the other regions with the most instances of positive WTP (41% and 44%, respectively), while the other regions averaged 26%. Finally, the 18 to 25 year old category had the highest percentage of positive WTP (61%), as compared to the other age brackets, which averaged 33%.
4.3.2. Tobit Regression Analysis
The coefficients from the Tobit regression model are found in Table A13. Five variables were statistically significant: gender, environmental protection, donation of money or time, hydropower development, and intent to visit the study area. Only one of the socio-demographic variables was significant; females had a WTP of ISK 6601 more than males (p < 0.01). Three attitudinal questions indicated significant results; individuals that believe environmental protection is important had a WTP of ISK 8088 more than those that do not (p < 0.05), and people that felt it is important to donate time or money to environmental conservation organizations had a WTP of ISK 14,365 more than those who do not hold that attitude (p < 0.01). Conversely, individuals with a positive attitude toward future hydropower developments in Iceland had a WTP of ISK 9696 less than those with neutral or negative attitudes (p < 0.01). Only one of the site-specific questions was significant; individuals who reported interest in visiting the study area in the future had a WTP of ISK 8110 more to preserve the site than those who do not (p < 0.01). Previous visits to the study area did not indicate a significant difference in the responses.
4.4. Estimated Mean WTP and Total Value for Social and Environmental Impacts
The estimated mean WTP to protect the Hólmsá and Tungufljót river basins from the HAHP, for all cases, was ISK 5515, with a standard deviation of ISK 4009 (Table 5). When scaled up to the adult resident population of Iceland aged 18 and older, the total WTP was between ISK 1.52 billion and ISK 1.7 billion.
Significant differences exist when examining only those reporting a positive WTP. The median WTP is nearly twice as large as the median observed for all cases. Similarly, the mean WTP more than doubled, increasing from ISK 5515 to ISK 13,862. The standard deviation is larger for those reporting a positive WTP, resulting in a wider confidence interval, ranging from ISK 12,516 to ISK 15,209.
5. Discussion
5.1. The Economic Value of the Hólmsá and Tungufljót River Basins
This study set out to elicit preferences and estimate willingness to pay for the preservation of the Hólmsá and Tungufljót river basins and to provide insight into the underlying factors. The total cost for the HAHP, excluding the transmission lines, is estimated at ISK 29.1 billion over the economic lifetime of the power plant, based on a levelized cost of energy (LCOE) assessment [78]. Based on those calculations, the environmental and social costs of ISK 1.52 to 1.7 billion represent a five to six percent mark-up on the project costs over its calculated 30-year economic lifetime [78].
Although not directly comparable to previous CVM studies in Iceland on the preservation of areas likely to be developed via energy projects, mainly due to methodological variations in the choice of elicitation formats and payment vehicles used, a rough comparison is provided here to demonstrate where this study aligns in terms of the percentage of those expressing a WTP, the mean WTP value, and the aggregated WTP. For example, Cook et al. [4] found that a higher percentage of Icelandic residents reported a WTP for the protection of Eldvörp (56%) and Hverahlíð (47%) against geothermal energy developments (50 MW and 90 MW, respectively) than this study found for the HAHP (35%). Also, the mean WTP for Eldvörp (ISK 8333) and Hverahlíð (ISK 7122) was higher than the mean WTP to protect the Hólmsá and Tungufljót river basins (ISK 5515). Additionally, the estimated total WTP for the two geothermal energy projects was slightly higher than that found in this study; Eldvörp was ISK 2.1 billion, and Hverahlíð was ISK 1.77 billion, while HAHP was estimated in the range of ISK 1.52 to 1.7 billion. One potential factor in these reported differences could be the proximity, and perhaps familiarity, of Eldvörp and Hverahlíð to the greater Capital area, given they are both located within 50 km of Iceland’s only major population center. When examining WTP responses for the two geothermal areas, more individuals expressed a WTP (51.5%) [4] than they did for HAHP (31.1%) when they also indicated an interest in visiting the areas in the future.
The results of this study suggest that more residents of Iceland express a WTP to preserve the Hólmsá and Tungufljót river basins from the HAHP (35%) than those who reported a WTP to protect against the environmental impacts of the 200 MW wind energy project at Búrfellslundur (28%) [66]. However, the mean WTP to protect Búrfellslundur (ISK 12,549) was over twice as much as the mean estimated for the HAHP, resulting in an estimated change in total economic value for Búrfellslundur of ISK 3.17 billion. In comparison, the HAHP was estimated to be between ISK 1.52 and 1.7 billion. This may be attributable to the fact that the proposed Búrfellslundur wind farm would be located along the main tourist route, leading to places like Landmannalaugar, and the windmills would be highly visible [79]. In contrast, the HAHP is located along a far-less-traveled route.
5.2. Factors Influencing WTP
This study explored whether WTP amounts varied based on an individual’s previous visit to the study area or intended future visit, place of residence, engagement in outdoor recreation, and socio-demographics. The results indicate that familiarization with the study area was not a significant indicator of whether individuals preferred to pay to protect it, which is counter to previous CVM studies regarding energy development in Iceland [66]. This lack of significance could be partly attributed to the nature of the activities people reported as the primary reason for their visits to the study area. The majority of responses indicated their time in the area was spent driving the F-roads, most likely driving through the study area on their way into or from the Central Highlands. Due to the scale of the study area, and the limited number of questions available in the survey, it was not possible to gather the information necessary to understand travel patterns within the study area fully, nor was it possible to discern the amount of time people spent there. Both identifiers would allow for further analysis of whether the attitudes of those driving the F-roads and jeep trails are similar to those visiting the area for photography, hiking, camping, etc.
The intent to visit the study area in the future was a significant indicator of whether someone would prefer to protect the region. Similar findings were observed for the Eldvörp and Hverahlíð [4]. These findings provide insight into the presence of an option value for preserving the Hólmsá and Tungufljót river basins, given the notion that they are stating a WTP based on their interest in visiting the site in the future. This is an important finding because it supports the claim made in the MP that this area holds a potentially high value for tourism and outdoor recreation in the future [32].
Given the remote nature of the study area, it was interesting to see that a majority of people from each region of Iceland had visited the study area at least once in their lifetime. Other CVM studies examining the impacts of hydropower development found an inverse relationship between the distance of residence from the affected region and reported levels of WTP [80]. However, this study did not find that relationship. No significant relationships were identified between WTP and the distance between where the individuals lived in Iceland and the study area. According to Carson et al. [81], the lack of this relationship indicates the prevalence of non-use values and reaffirms the choice to use the CVM in this study.
Engagement in outdoor recreation was not a significant predictor of WTP in this study; this could be a factor in how the question was presented in the survey. The term ‘outdoor recreation’ was not defined, which may have led to misinterpretation. Still, other studies indicate that engagement in outdoor recreation alone does not singularly affect one’s attitude toward an existing hydropower plant [82]. Instead, values associated with outdoor recreation have been found to correlate to the mode of recreation [83]. Because only a general question was asked regarding respondents’ engagement in outdoor recreation, and no further delineation was possible, understanding whether outdoor recreation is a factor in attitudes toward the HAHP is beyond the scope of this study.
Lastly, of the socio-demographic variables in the regression model, only gender was a significant predictor of WTP to preserve the Hólmsá and Tungufljót river basins, with females twice as likely to report a WTP than males. Gender has been a consistent indicator of WTP across CVM studies regarding RE development in Iceland; Einarsdóttir et al. [66] and Cook et al. [4] found that a majority of the respondents with a WTP for the preservation of the respective study areas were female. Similar findings have been seen internationally, particularly when risks associated with developments are evaluated [84].
Also of interest are the 29% of individuals who are in favor of hydropower development but reported a WTP to preserve this area from the HAHP. Further information on these respondents’ motivations for stating a non-zero WTP to preserve this area was not collected in this study, so classification of their motivations is not possible. However, the top three most-selected reasons for expressing a WTP were the scale of the environmental impacts (60%), an interest in preserving the river basins from development (26%), and objection to the visual impacts of the power plant and its accompanying overhead transmission line (11%).
5.3. Contextualizing Results among Previous National and International CVM Studies
Attempts to compare the results of this study to others are difficult because of the elicitation method and payment vehicle used [81]. Previous CVM studies involving hydropower have not combined a one-time, voluntary payment as a payment vehicle and a payment card as the elicitation method. For example, Jones et al. [85] used an annual tax increase as an elicitation method and a single-bound dichotomous choice payment vehicle to evaluate the economic benefits of the Glen Canyon Dam, rendering it incomparable with this study. Other studies have reported the payment vehicles used but failed to specify the elicitation method employed [80,86]. Hongyun et al. [87] used donations as the elicitation method but used single and double-bounded dichotomous choice methods as the payment vehicle in their study, rendering it incomparable.
Lehtoranta and Louhi [88] examined preferences toward water quality improvements in Saarijärvi, Norway. Their study found a mean WTP between EUR 29.7 and EUR 75.5 annually and a positive change in the total economic value of EUR 4.8 to 16.1 million over ten years [88]. Their study used the payment card as a payment vehicle and voluntary contributions as the elicitation method; however, the payment duration was annual rather than a one-time payment. Their study is also incomparable because although hydropower was addressed in the survey, the attributes presented to their survey respondents only pertained to water quality improvements, not the valuation of environmental and social costs that this study analyzed.
Navrud et al. [49] studied preferences for overhead transmission lines in Norway, where the mean WTP ranged between NOK 732 and 1988 annually, resulting in an aggregated WTP of NOK 7 million per year. However, their study used the payment card as the payment vehicle and an additional cost on their electricity bill as the elicitation method, rendering the study somewhat incomparable. Of interest regarding their study is the lack of statistical significance for the distance between where a person lived and the potential impacts.
The choice to use voluntary payments rather than mandatory payments, such as taxes, in this study was perhaps well-founded given the large number of people (59%) that felt a conservation organization, not the state (12%), was the most appropriate recipient of funds to protect the study area most effectively. Previous CVM studies in Iceland that used mandatory taxes as elicitation methods experienced higher rates of protest voters than this study of HAHP (18%). Cook et al. [4] reported that 65% of reported zero WTP cases were protest voters against paying a higher tax to protect Eldvörp and Hverahlíð from geothermal development. However, in their report, the authors identified that the political turmoil following the then-ongoing Panama Papers scandal may have affected the public’s trust in the government and may have resulted in the high protest rates observed [4]. Similarly, when examining preferences toward the environmental impacts associated with the proposed wind farm at Búrfell using a tax to elicit payment, Einarsdóttir et al. [66] reported that 24% of those with a WTP were protest voters.
5.4. Implications for Policy
The HAHP was placed on hold, in part, due to a lack of an understanding of its conservation value [32]. The findings of this study provide a means to represent that value in a monetary metric, allowing for direct comparison to the other project costs and benefits included in an extended CBA. The economic value of the project’s environmental and social costs was not available to the MP previously, and the hope is that these findings will help inform their discussion of the economic optimality of the HAHP.
The findings of this study highlight the potentially significant economic values associated with an energy project’s social and environmental impacts. This underscores the importance of using an extended CBA in decision making for energy project evaluations, as called for by the OECD [31] and working group four in the MP [32]. However, for that to happen, a procedure must be implemented [5] and adopted. Despite resistance from developers, as seen in the case of the HAHP [44] (p. 23), the inclusion of extended CBAs is essential for making informed decisions about energy project developments and understanding their economic optimality.
From an international perspective, the results of this study highlight the importance of incorporating the economic value of social and environmental impacts associated with new hydropower RE developments to evaluate their sustainability and understand how changes in social welfare are distributed across the population of interest. This is of particular note when RE developments are proposed in remote regions, which is increasingly common [89]. As addressed by TEEB, the omittance of these values is not in line with the concept of sustainable development of natural resources, while their incorporation can lead to “… more equitable, effective and efficient conservation practices” [90] (p. 12). As nations evaluate energy options to meet demand or reach their greenhouse gas emission reduction goals, it is imperative that the costs of proposed hydropower projects include the environmental and social values of all stakeholders to ensure optimal decision making regarding welfare gains and losses.
5.5. Limitations
This study followed best common practices for developing a CV survey; however, due to the inherent limitations of survey methodology [64], there is potential for bias and misrepresentation in the responses. This section lists some common criticisms [91,92] of CV studies and describes the efforts taken to minimize their impacts on the data collected.
One of the most commonly cited criticisms of the CVM is hypothetical bias [54], or the potential for respondents to overstate their maximum WTP because the survey is founded on a hypothetical scenario. This study acknowledged the potential for hypothetical bias and designed the survey to minimize its occurrence [81]. Specifically, the survey was based on a highly plausible scenario [93], given that the energy option is, in fact, under evaluation by the MP to determine whether it moves into the utilization or protection category. Additionally, great effort was taken to communicate an unbiased accounting of the potential impacts of the HAHP using results from scientific research on the project’s potential environmental and social impacts.
Strategic behavior in reporting a WTP value has also been a criticism associated with hypothetical bias, particularly for voluntary payments. Carson et al. [81] point out that the use of voluntary payments, such as the donation used in this study, may lead to an overestimation of WTP due to free-riding behavior. The potential for strategic behavior was understood during the survey design, and all attempts were made to categorize the valuation question in a consequential referendum format to minimize those instances. Writing the valuation question in such a manner was meant to incentivize respondents to respond truthfully [53].
The potential for anchoring and range bias was assessed during the pilot test by analyzing the percentages of respondents reporting values beyond the upper value listed on the payment card. Based on those results, it was found that the range of values offered was sufficiently large enough to capture the majority of responses [94].
Lastly, this study’s results are a function of the population sampled, which may not represent all stakeholders. This study was based on Icelandic residents’ preferences and attitudes toward preserving the Hólmsá and Tungufljót river basins. However, as discussed, this region is also likely to hold a high value for tourism [32]. Estimation of the change in the TEV for the Hólmsá and Tungufljót river basins then requires input from all affected stakeholders, of which international tourism values for this area were not accounted for in this study.
6. Conclusions
This study was designed to elicit preferences and estimate Icelandic residents’ willingness to pay to protect the Hólmsá and Tungufljót river basins from the HAHP. The Social Science Research Institute of the University of Iceland administered a web-based contingent valuation survey, drawing on their panel database. The survey was sent to 2909 Icelandic residents aged 18 and over and 1357 responses were returned, resulting in a 46.6% participation rate. Gender, intention to visit the area in the future, concern toward environmental protection, willingness to donate money or time to conservation efforts, and favorability of hydropower energy were all significant influences on an individual’s WTP. In total, 35% of respondents indicated a positive WTP to protect the Hólmsá and Tungufljót river basins from hydropower development, while 65% stated no WTP. The estimated mean WTP is ISK 5515 when including those with no WTP. When scaled to Iceland’s national population, the total estimate for the environmental and social costs associated with the proposed HAHP is between ISK 1.52 and 1.70 billion. The use of an extended CBA to account for the monetary value of these social and environmental impacts would indicate a 5% to 6% increase in the project costs over the economic lifetime of the hydropower plant. This study thus highlighted the potential significance of the environmental and social costs of developing hydropower projects in remote, sparsely populated locations in Iceland, underscoring the importance of their incorporation in the decision-making process. Their exclusion from economic welfare calculations in Iceland engenders the risk of sub-optimal decision making.
Further research should focus on incorporating international tourists’ values for the region. In that way, an even more holistic understanding of the project’s costs and benefits can be evaluated to understand its NPV. Additionally, future studies could also evaluate the HAHP in the context of other proposed energy projects in Iceland or evaluate which transmission line option is preferred. Such research could employ non-market valuation techniques, such as discrete choice experiments, to enable affected individuals to choose their preferred design and locational arrangements for the HAHP project. This may provide further information about the impacts of energy generation and distributional infrastructure on this region.
Author Contributions
Conceptualization, C.C., D.C. and A.D.S.; methodology, C.C., D.C. and A.D.S.; software, C.C. and D.C.; validation, C.C. and D.C.; formal analysis, C.C. and D.C.; investigation, C.C.; resources, C.C.; data curation, C.C.; writing—original draft preparation, C.C.; writing—review and editing, C.C., D.C. and A.D.S.; visualization, C.C.; supervision, D.C. and A.D.S.; project administration, D.C. and A.D.S.; funding acquisition, A.D.S. All authors have read and agreed to the published version of the manuscript.
Funding
This research received no external funding.
Institutional Review Board Statement
Not applicable.
Data Availability Statement
The raw data supporting the conclusions of this article will be made available by the authors on request.
Acknowledgments
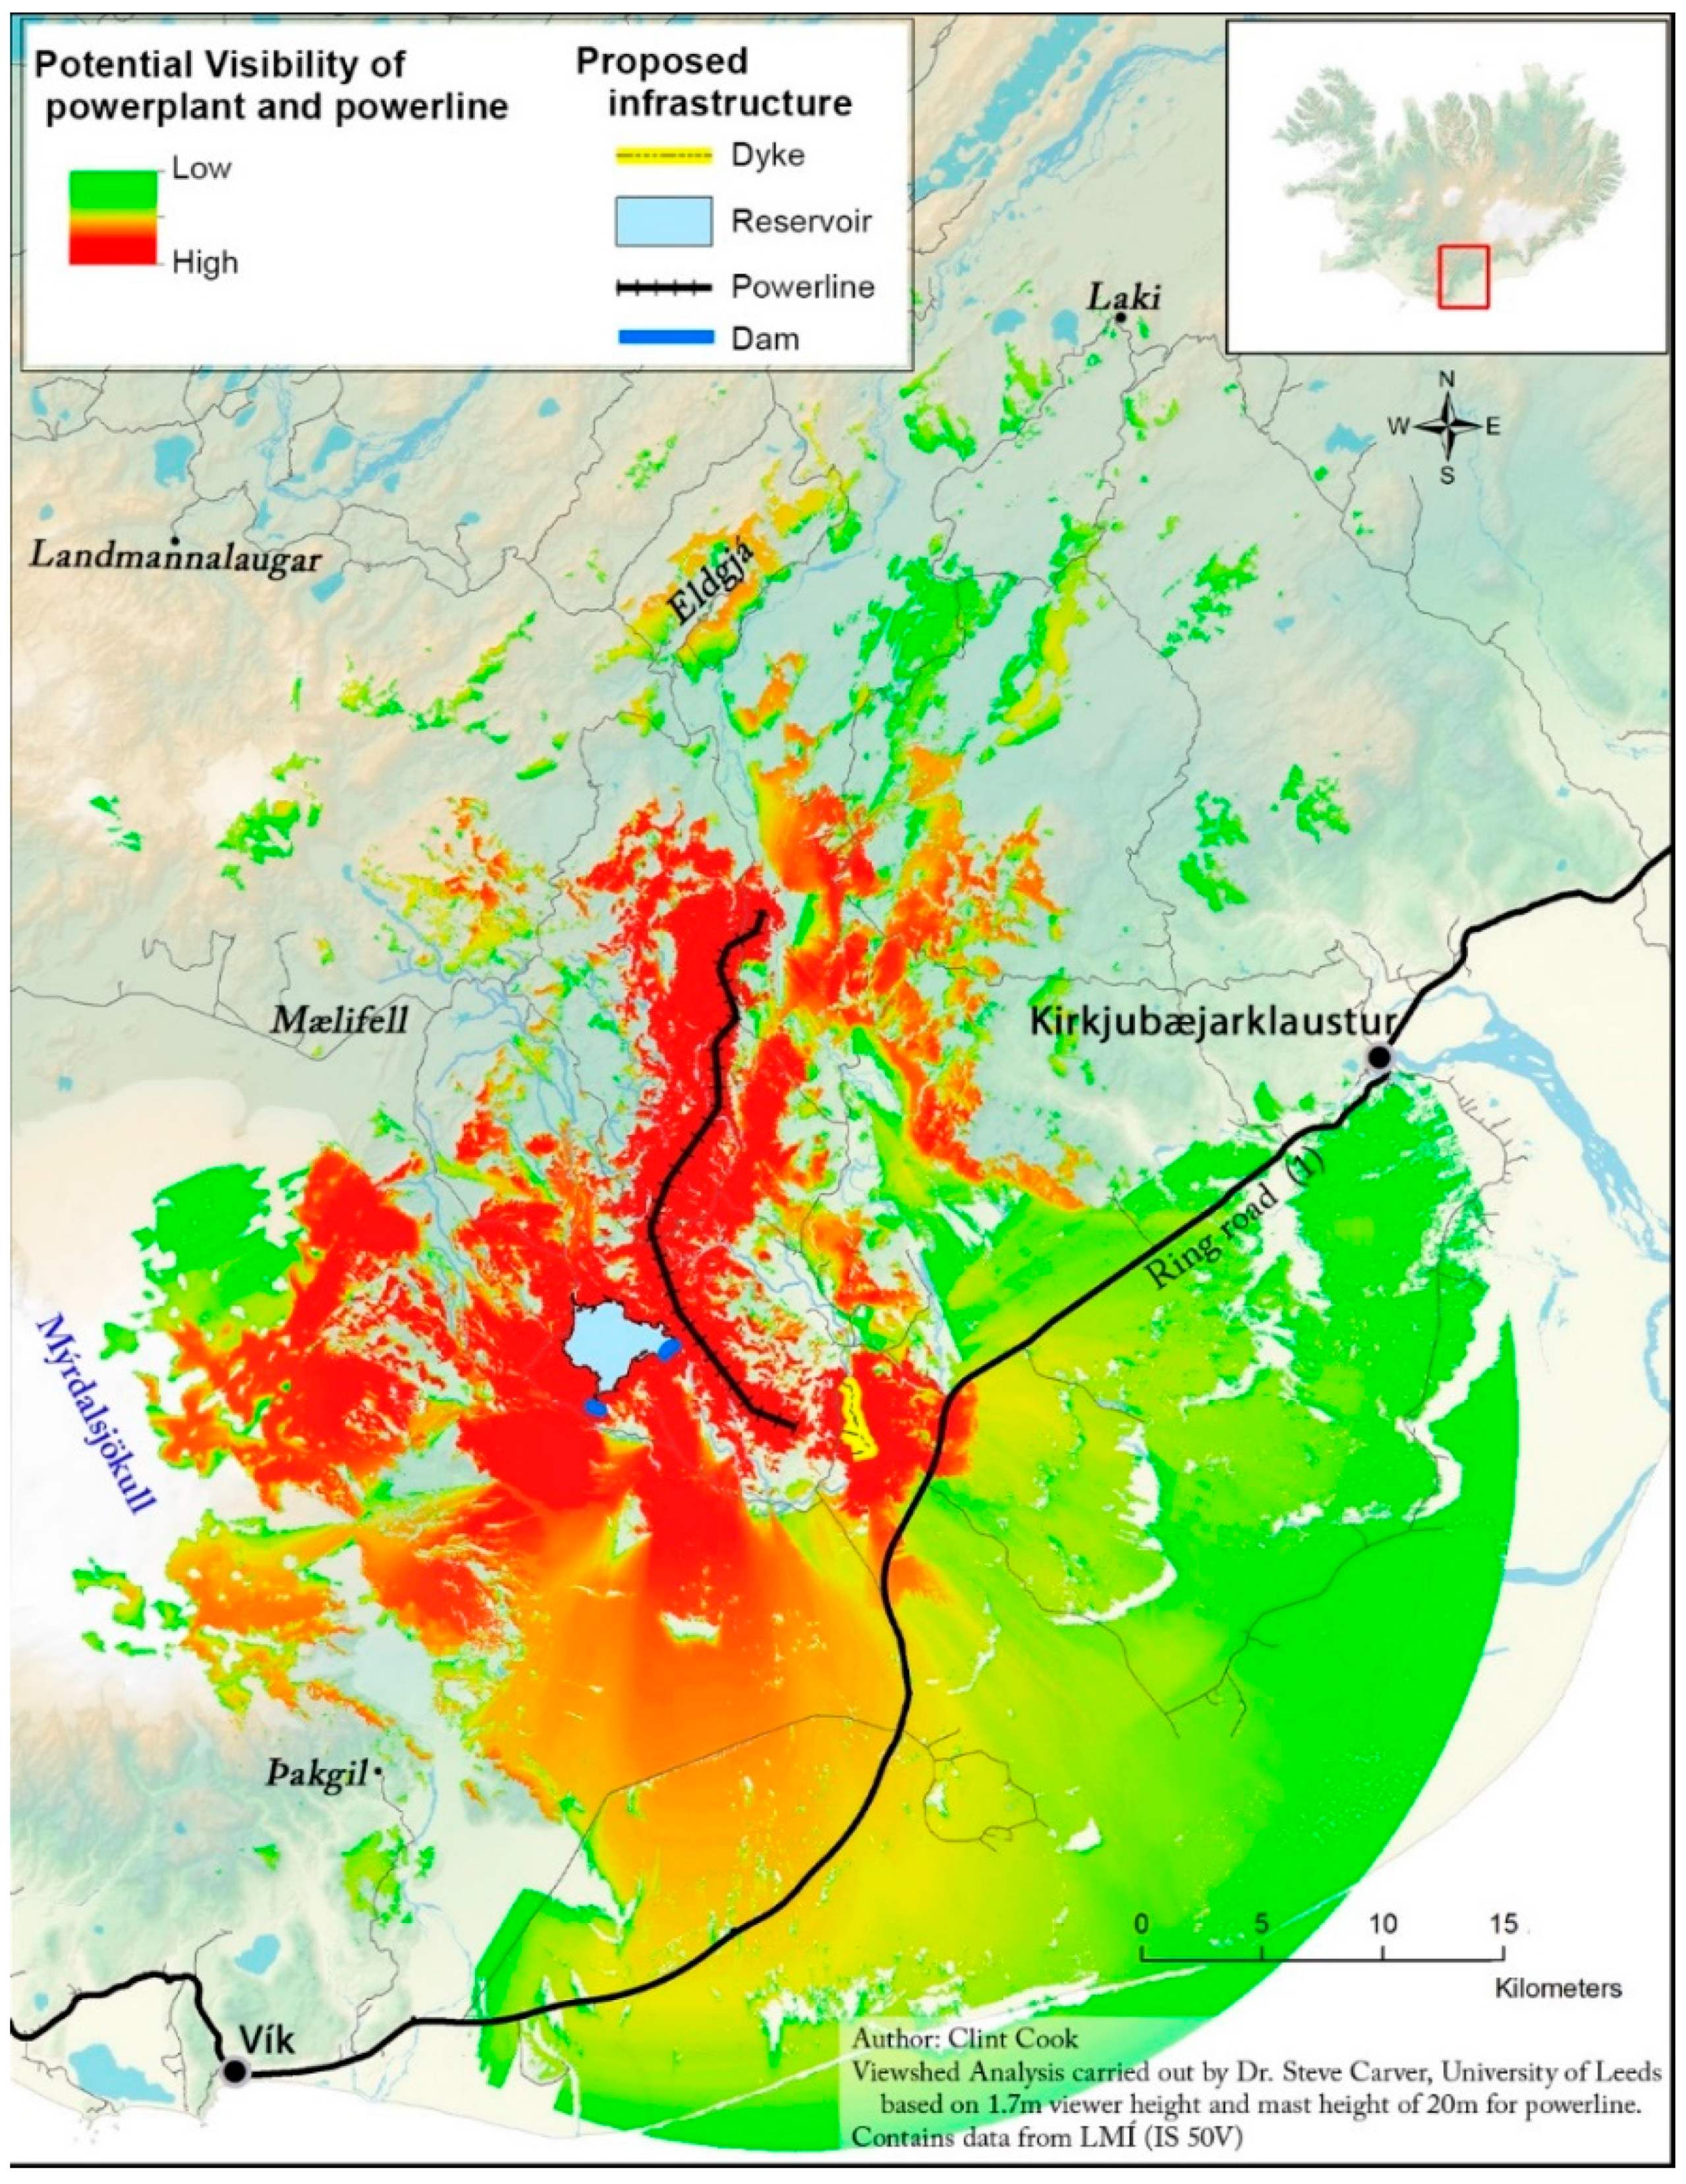
Steve Carver, a senior lecturer at Leeds University, UK donated his time to produce the ‘potential visibility’ raster used to demonstrate the potential visibility of HAHP’s infrastructure across the landscape.
Conflicts of Interest
The authors declare no conflicts of interest.
Appendix A

Table A1.
Matrix to select an energy project from ten projects in the on-hold category.
| Energy Option | Rankings and Scores | Environmental Assessment (EA) Count (Weight Applied) *** | ||||
|---|---|---|---|---|---|---|
| Working Group 1 (AHP) * | Working Group 2 ** | EA Weighted Summation | Significant Negative Effects (3) | Moderate Negative Effects (2) | Insignificant Negative Effects (1) | |
| R3121A Hólmsárvirkjun at Atley | 13.4 | 6.16 | 40 | 7 (21) | 8 (16) | 3 |
| R3296A Fremrinámar | 13.3 | 3.29 | 35 | 8 (24) | 1 (2) | 9 |
| R3134A Búðartunguvirkjun | 11.8 | 3.25 | 34 | 3 (9) | 10 (20) | 5 |
| R3273A Innstidalur | 11.3 | 3.36 | 37 | 6 (18) | 7 (14) | 5 |
| R3265A Trölladyngja | 6.5 | 2.92 | 34 | 4 (12) | 8 (16) | 6 |
| R3141A Stóra-Laxá | 5.3 | 3.7 | 37 | 4 (12) | 11 (22) | 3 |
| R3139A Hagavatnsvirkjun | 4.9 | 2.49 | 33 | 4 (12) | 7 (14) | 7 |
| R4301B Búrfellslundur | 1.7 | 7.99 | 28 | 2 (6) | 6 (12) | 10 |
| R3154A Blöndudalsvirkjun | 1.7 | 3.12 | 29 | 2 (6) | 7 (14) | 9 |
| R3291A Hágönguvirkjun | 1.3 | 4.77 | 28 | 3 (9) | 4 (8) | 11 |
Figure A1.
Proposed energy infrastructure for HAHP and site location.

Figure A2.
Potential visibility of HAHP infrastructure using infrastructure heights reported in EIA supporting documents [44,45].

Table A2.
Predictor variables and coding scheme used in the regression model.
| Independent Variable | Coding Scheme |
|---|---|
| Socio-demographics | |
| Gender | Dummy variable; 0 = male, 1 = female |
| Education | Dummy variable; 0 = education at upper-secondary school or less, 1 = university-level education |
| Income | Dummy variable; 0 = less than ISK 901k monthly before taxes and deductions, 1 = ISK 901k or more per month before taxes and deductions |
| Residence | Nominal variable; reference South, 1 = Southwest, 2 = East, 3 = North, 4 = Capital area, 5 = West and Westfjords |
| Live 20 years | Dummy variable for those living locally in Skaftárhreppur, Mýrdalshreppur, or Hornafjörður for more than 20 years; 0 = less than 20 years, 1 = 20 years or more |
| Age | Scale variable (min = 18, max = 90, mean = 53.1, S.D. = 15.81, N = 621) |
| Attitudinal/Behavioral | |
| Outdoor recreation | Dummy variable; 0 = never engage in outdoor recreation in Iceland, 1 = engage in outdoor recreation at least once per year or more |
| Energy security | Dummy variable for ‘how important is it to you to ensure Iceland can develop its domestic RE resources in the future?’; 0 = not important or neutral, 1 = important |
| Environmental protection | Dummy variable for ‘how important is environmental protection to you?’; 0 = not important or neutral, 1 = important |
| Donate money or time | Dummy variable for ‘how important is it to you to donate money or time to environmental conservation organizations?’; 0 = not important or neutral, 1 = important |
| Hydropower | Dummy variable for attitude toward new hydropower developments in Iceland; 0 = neutral or negative attitudes, 1 = positive attitude |
| Study-area-specific | |
| Past visits | Dummy variable for the number of visits to the study area over the course of their life; 0 = never visited, 1 = visited at least once or live there |
| Future visits | Dummy variable for those that intend on visiting the study area in the future; 0 = don’t plan to visit, 1 = plan to visit in the future |
Table A3.
Respondents in the descriptive analysis versus Icelandic national population.
| Variable | Survey Respondents (N = 1357) (%) | Adult Icelandic Residents 1 (N = 292,989) (%) | Cases in Descriptive Analysis (N = 1278) (%) | Difference: Residents vs. Descriptive Analysis (%) | |
|---|---|---|---|---|---|
| Gender *** | Male | 55.6 | 51.5 | 57.0 | 5.50 |
| Female | 44.4 | 48.5 | 43.0 | −5.50 | |
| Age *** | 18–25 | 6.3 | 15.1 | 5.6 | −9.50 |
| 26–35 | 10.8 | 21.0 | 10.6 | −10.40 | |
| 36–45 | 15.9 | 17.8 | 16.0 | −1.80 | |
| 46–55 | 20.2 | 15.7 | 20.3 | 4.60 | |
| 56–65 | 20.6 | 14.3 | 20.9 | 6.60 | |
| 66–75 | 17.3 | 10.1 | 17.4 | 7.30 | |
| 76+ | 8.9 | 6.1 | 9.1 | 3.00 | |
| Residence *** | Capital Area | 60.6 | 65.1 | 60.0 | −5.10 |
| Countryside | 39.4 | 34.9 | 40.0 | 5.10 | |
| Education *** | Compulsory or less | 11.2 | 28.3 | 10.5 | −17.80 |
| Upper- secondary | 36.7 | 37.2 | 36.7 | −0.50 | |
| University | 52.1 | 34.5 | 52.8 | 18.30 |
Note: 1 data provided by SSRI, 2022. *** p < 0.01.
Table A4.
Regions of Iceland represented in the descriptive analysis.
| Region of Residence | Respondents (%) | National Adult Population 1 (%) | % Difference: Respondents to National Population |
|---|---|---|---|
| Capital area | 60.0 | 64.2 | −4.2 |
| Southwest | 4.9 | 7.6 | −2.7 |
| East | 3.4 | 2.9 | 0.5 |
| North | 11.6 | 10.2 | 1.4 |
| West and Westfjords | 7.0 | 6.4 | 0.6 |
| South | 13.1 | 8.6 | 4.5 |
| Municipalities within the South region | Respondents N (% of Municipality) | Municipality Population 1 N | |
| Hornafjörður | 43 (2.2) | 1988 | |
| Mýrdalshreppur and Skaftárhreppur | 16 (1.3) | 1242 | |
Note: 1 [77].
Table A5.
Attitudes toward ensuring Iceland can develop domestic RE in the future.
| Not Important at All | Not That Important | Neither Important Nor Unimportant | Rather Important | Very Important | Total | ||
|---|---|---|---|---|---|---|---|
| Variable | (%) | (%) | (%) | (%) | (%) | (N) | |
| Gender *** | Males | 0.41 | 1.51 | 4.94 | 24.14 | 69.00 | 729 |
| Females | 0.73 | 0.55 | 8.38 | 32.97 | 57.38 | 549 | |
| Age *** | 18–25 | 0.00 | 0.00 | 5.56 | 31.94 | 62.50 | 72 |
| 26–35 | 1.47 | 0.74 | 5.15 | 27.94 | 64.71 | 136 | |
| 36–45 | 0.49 | 1.46 | 4.88 | 33.17 | 60.00 | 205 | |
| 46–55 | 0.00 | 0.39 | 10.04 | 29.73 | 59.85 | 259 | |
| 56–65 | 0.00 | 0.00 | 5.62 | 25.47 | 68.91 | 267 | |
| 66–75 | 1.35 | 1.79 | 7.17 | 21.08 | 68.61 | 223 | |
| 76+ | 0.86 | 4.31 | 3.45 | 31.03 | 60.34 | 116 | |
| Education ** | Compulsory or less | 1.49 | 1.49 | 5.97 | 35.07 | 55.97 | 134 |
| Upper secondary | 0.64 | 1.71 | 6.61 | 31.34 | 59.70 | 469 | |
| University | 0.30 | 0.59 | 6.37 | 24.15 | 68.59 | 675 |
** p < 0.05, *** p < 0.01.
Table A6.
Attitudes toward environmental protection.
| Variable | Not Important at All (%) | Not That Important (%) | Neither Important Nor Unimportant (%) | Rather Important (%) | Very Important (%) | Total (N) | |
|---|---|---|---|---|---|---|---|
| Gender *** | Males | 0.96 | 2.19 | 10.15 | 38.00 | 48.70 | 729 |
| Females | 0.55 | 1.09 | 6.01 | 31.15 | 61.20 | 549 | |
| Place of residence * | Capital area | 0.91 | 1.30 | 6.39 | 34.29 | 57.11 | 767 |
| Southwest | 0.00 | 0.00 | 11.11 | 49.21 | 39.68 | 63 | |
| East | 0.00 | 4.65 | 16.28 | 30.23 | 48.84 | 43 | |
| North | 0.68 | 3.38 | 11.49 | 37.16 | 47.30 | 148 | |
| South | 1.19 | 1.79 | 11.31 | 30.36 | 55.36 | 168 | |
| West/Westfjords | 0.00 | 2.25 | 8.99 | 39.33 | 49.44 | 89 | |
| Education *** | Compulsory or less | 2.99 | 3.73 | 7.46 | 42.54 | 43.28 | 134 |
| Upper secondary | 0.85 | 2.35 | 13.65 | 37.53 | 45.63 | 469 | |
| University | 0.30 | 0.89 | 4.89 | 31.85 | 62.07 | 675 |
* p < 0.10, *** p < 0.01.
Table A7.
Attitudes toward donating time or money to conservation organizations.
| Variable | Not Important at All (%) | Not That Important (%) | Neither Important Nor Unimportant (%) | Rather Important (%) | Very Important (%) | Total (N) | |
|---|---|---|---|---|---|---|---|
| Gender *** | Males | 16.60 | 13.99 | 31.00 | 26.20 | 12.21 | 729 |
| Females | 7.65 | 10.20 | 29.51 | 34.24 | 18.40 | 549 | |
| Age *** | 18–25 | 5.56 | 0.00 | 19.44 | 45.83 | 29.17 | 72 |
| 26–35 | 8.82 | 13.24 | 33.09 | 27.94 | 16.91 | 136 | |
| 36–45 | 14.15 | 8.78 | 30.73 | 32.20 | 14.15 | 205 | |
| 46–55 | 11.20 | 15.06 | 33.59 | 29.73 | 10.42 | 259 | |
| 56–65 | 16.10 | 13.48 | 31.46 | 26.22 | 12.73 | 267 | |
| 66–75 | 13.45 | 15.70 | 26.46 | 26.46 | 17.94 | 223 | |
| 76+ | 13.79 | 10.34 | 31.03 | 31.03 | 13.79 | 116 | |
| Education ** | Compulsory or less | 16.42 | 9.70 | 25.37 | 30.60 | 17.91 | 134 |
| Upper secondary | 16.20 | 12.58 | 31.98 | 25.16 | 14.07 | 469 | |
| University | 9.63 | 12.74 | 30.22 | 32.59 | 14.81 | 675 |
** p < 0.05, *** p < 0.01.
Table A8.
Attitudes toward hydropower developments in Iceland.
| Variable | Very Negative (%) | Somewhat Negative (%) | Neither Positive Nor Negative (%) | Somewhat Positive (%) | Very Positive (%) | Total N | |
|---|---|---|---|---|---|---|---|
| Gender *** | Males | 1.92 | 3.84 | 8.23 | 25.51 | 60.49 | 729 |
| Females | 2.91 | 7.47 | 14.03 | 36.25 | 39.34 | 549 | |
| Age * | 18–25 | 2.78 | 2.78 | 23.61 | 26.39 | 44.44 | 72 |
| 26–35 | 2.21 | 8.82 | 12.50 | 29.41 | 47.06 | 136 | |
| 36–45 | 2.44 | 7.32 | 13.17 | 31.71 | 45.37 | 205 | |
| 46–55 | 0.77 | 5.79 | 9.65 | 34.36 | 49.42 | 259 | |
| 56–65 | 2.62 | 4.49 | 7.87 | 30.71 | 54.31 | 267 | |
| 66–75 | 3.14 | 4.04 | 7.62 | 27.35 | 57.85 | 223 | |
| 76+ | 3.45 | 3.45 | 11.21 | 25.00 | 56.90 | 116 | |
| Place of Residence *** | Capital area | 2.87 | 7.04 | 11.47 | 32.72 | 45.89 | 767 |
| Southwest | 0.00 | 1.59 | 7.94 | 26.98 | 63.49 | 63 | |
| East | 2.33 | 4.65 | 16.28 | 23.26 | 53.49 | 43 | |
| North | 1.35 | 2.03 | 10.81 | 32.43 | 53.38 | 148 | |
| South | 2.38 | 4.76 | 10.71 | 22.02 | 60.12 | 168 | |
| West/Westfjords | 1.12 | 1.12 | 3.37 | 24.72 | 69.66 | 89 | |
| Living in surrounding municipality * | Yes | 5.88 | 7.84 | 11.76 | 15.69 | 58.82 | 51 |
| No | 2.02 | 4.95 | 10.28 | 30.46 | 52.99 | 1141 | |
| Education *** | Compulsory or less | 2.99 | 1.49 | 10.45 | 30.60 | 54.48 | 134 |
| Upper-secondary | 1.92 | 3.20 | 8.74 | 27.72 | 58.42 | 469 | |
| University | 2.52 | 7.70 | 12.15 | 31.70 | 45.93 | 675 |
* p < 0.10, *** p < 0.01.
Table A9.
Number of visits to the study area over the course of their lifetime.
| Reported Number of Trips | Responses (N) | Percentage (%) |
|---|---|---|
| Never | 374 | 29.3 |
| Once or twice | 359 | 28.1 |
| 3 or 4 times | 200 | 15.6 |
| 5 or 6 times | 112 | 8.8 |
| 7 or 8 times | 43 | 3.4 |
| 9 or 10 times | 36 | 2.8 |
| More than 10 times | 149 | 11.7 |
| I live and/or work in this area | 5 | 0.4 |
Table A10.
Reports of visitation to the study area based on age, gender, and residence.
| Variable | Have Not Visited N (%) | Have Visited at Least Once N (%) | Total (N) | |
|---|---|---|---|---|
| Age *** | 18–25 | 32 (44.44) | 40 (55.56) | 72 |
| 26–35 | 65 (47.79) | 71 (52.21) | 136 | |
| 36–45 | 70 (34.15) | 135 (65.85) | 205 | |
| 46–55 | 77 (29.73) | 182 (70.27) | 259 | |
| 56–65 | 67 (25.10) | 200 (74.91) | 267 | |
| 66–75 | 45 (20.18) | 178 (79.82) | 223 | |
| 76 and older | 18 (15.52) | 98 (84.48) | 116 | |
| Gender *** | Male | 190 (26.06) | 539 (73.94) | 729 |
| Female | 184 (33.52) | 365 (66.48) | 549 | |
| Place of residence *** | Capital area | 216 (28.16) | 551 (71.84) | 767 |
| Southwest | 18 (28.57) | 45 (71.43) | 63 | |
| East | 20 (46.51) | 23 (53.49) | 43 | |
| North | 59 (39.86) | 89 (60.14) | 148 | |
| South | 28 (16.67) | 140 (83.33) | 168 | |
| West and Westfjords | 33 (37.08) | 56 (62.92) | 89 |
*** p < 0.01.
Figure A3.
Reported instances of engagement in recreational activities while visiting the study area.
Figure A3.
Reported instances of engagement in recreational activities while visiting the study area.

Table A11.
Interest in visiting the study area in the future based on age and residence.
| Whether They Intend to Visit the Study Area in the Future | |||||
|---|---|---|---|---|---|
| Variable | Yes N (%) | No N (%) | Don’t Know N (%) | Total (N) | |
| Age *** | 18–25 | 25 (34.72) | 9 (12.50) | 38 (52.78) | 72 |
| 26–35 | 45 (33.09) | 26 (19.12) | 65 (47.79) | 136 | |
| 36–45 | 90 (43.90) | 17 (8.30) | 98 (47.80) | 205 | |
| 46–55 | 123 (47.49) | 19 (7.34) | 117 (45.17) | 259 | |
| 56–65 | 146 (54.68) | 15 (5.62) | 106 (39.70) | 267 | |
| 66–75 | 92 (41.26) | 19 (8.52) | 112 (50.22) | 223 | |
| 76 and older | 35 (30.17) | 28 (24.14) | 53 (45.69) | 116 | |
| Residence *** | Capital area | 341 (44.46) | 80 (10.43) | 346 (45.11) | 767 |
| Southwest | 21 (33.33) | 11 (17.46) | 31 (49.21) | 63 | |
| East | 17 (39.53) | 5 (11.63) | 21 (48.84) | 43 | |
| North | 54 (36.49) | 9 (6.08) | 85 (57.43) | 148 | |
| South | 94 (55.95) | 14 (8.33) | 60 (35.71) | 168 | |
| West and Westfjords | 29 (32.58) | 14 (15.73) | 46 (51.69) | 89 | |
*** p < 0.01.
Table A12.
Percentage of positive WTP and no WTP responses by predictor variable.
| Variable | Positive WTP (35.1%) (%) | No WTP (64.9%) (%) | Total (N) | |
|---|---|---|---|---|
| Socio-demographics | ||||
| Gender *** | Male | 25.6 | 74.4 | 398 |
| Female | 52.0 | 48.0 | 223 | |
| University | 41.7 | 58.3 | 333 | |
| education *** | Compulsory or upper-secondary | 27.4 | 72.6 | 288 |
| Over ISK 901k monthly | 28.6 | 71.4 | 213 | |
| income ** | Up to ISK 901k monthly | 38.5 | 61.5 | 408 |
| Capital area | 40.5 | 59.5 | 358 | |
| Residence ** | Southwest | 25.0 | 75.0 | 32 |
| East | 43.5 | 56.5 | 23 | |
| North | 24.1 | 75.9 | 79 | |
| South | 29.1 | 70.9 | 86 | |
| West and Westfjords | 25.6 | 74.4 | 43 | |
| 18-25 | 60.6 | 39.4 | 33 | |
| Age ** | 26–35 | 31.1 | 68.9 | 61 |
| 36–45 | 43.8 | 56.3 | 112 | |
| 46–55 | 31.8 | 68.2 | 129 | |
| 56–65 | 31.1 | 68.9 | 135 | |
| 66–75 | 30.3 | 69.7 | 99 | |
| 76+ | 32.7 | 67.3 | 52 | |
| Attitudinal/Behavioral | ||||
| Environmental protection *** | Important | 38.9 | 61.1 | 543 |
| Not important or neutral | 9.0 | 91.0 | 78 | |
| Donate time or money to conservation *** | Important | 62.2 | 37.8 | 249 |
| Not important or neutral | 16.9 | 83.1 | 372 | |
| Hydropower *** | Positive attitude | 28.8 | 71.2 | 524 |
| Neutral or negative attitude | 69.1 | 30.9 | 97 | |
| Study-area-specific | ||||
| Intended future visits *** | Plan to visit in the future | 44.4 | 55.6 | 277 |
| Don’t plan to visit in the future | 27.6 | 72.4 | 344 | |
| No previous visit ** | Plan to visit in the future | 31.1 | 68.9 | 341 |
| Don’t plan to visit in the future | 40.0 | 60.0 | 280 | |
** p < 0.05, *** p < 0.01.
Table A13.
Tobit regression model results.
| Predictor Variable | Coefficient (Standard Error) | p-Value |
|---|---|---|
| Socio-demographics | ||
| Gender *** | 6600.648 (1591.390) | <0.001 |
| Education | 1954.765 (1647.170) | 0.235 |
| Income | −1626.526 (1705.030) | 0.340 |
| Residence (in relation to South) | ||
| Capital area | 3800.802 (2673.178) | 0.155 |
| Southwest | 1745.808 (4376.058) | 0.690 |
| North | 259.849 (3456.156) | 0.940 |
| East | 6909.447 (4396.865) | 0.116 |
| West and Westfjords | 2974.401 (3972.134) | 0.454 |
| Live 20 years | 479.150 (4993.944) | 0.924 |
| Age | 69.745 (48.527) | 0.151 |
| Attitudinal/Behavioral | ||
| Outdoor recreation | −2202.658 (4813.864) | 0.647 |
| Energy security | −2954.684 (3202.200) | 0.356 |
| Environmental protection ** | 8087.520 (3323.174) | 0.015 |
| Donate money or time *** | 14,364.852 (1711.524) | <0.001 |
| Hydropower *** | −9695.758 (1922.136) | <0.001 |
| Study-area-specific | ||
| Past visits | −2044.677 (1877.300) | 0.276 |
| Future visits *** | 8110.026 (1628.403) | <0.001 |
| Constant ** | −17493.730 (7209.993) | 0.015 |
| Log/scale | 9.587 (0.054) | |
| N | 621 | |
| Log-likelihood (degrees of freedom.) | −2500.098 (D.f.: 19) | |
| Wald (degrees of freedom) | 194.263 (D.f.: 17) |
** p < 0.05, *** p < 0.01.
References
- Hastik, R.; Basso, S.; Geitner, C.; Haida, C.; Poljanec, A.; Portaccio, A.; Vrščaj, B.; Walzer, C. Renewable energies and ecosystem service impacts. Renew. Sustain. Energy Rev. 2015, 48, 608–623. [Google Scholar] [CrossRef]
- Harris, J.M.; Roach, B. Environmental and Natural Resource Economics: A Contemporary Approach; Taylor and Francis: Florence, Italy, 2018. [Google Scholar]
- Vysna, V.; Maes, J.; Petersen, J.-E.; La Notte, A.; Vallecillo, S.; Aizpurua, N.; Ivits, E.; Teller, A. Accounting for Ecosystems and Their Services in the European Union (INCA): Final Report from Phase II of the INCA Project Aiming to Develop a Pilot for an Integrated System of Ecosystem Accounts for the EU; Publications Office of the European Union: Luxembourg, 2021. [Google Scholar]
- Cook, D.; Davíðsdóttir, B.; Kristófersson, D.M. Willingness to pay for the preservation of geothermal areas in Iceland—The contingent valuation studies of Eldvörp and Hverahlíð. Renew. Energy 2018, 116, 97–108. [Google Scholar] [CrossRef]
- Cook, D.; Davíðsdóttir, B.; Kristófersson, D.M. Energy projects in Iceland—Advancing the case for the use of economic valuation techniques to evaluate environmental impacts. Energy Policy 2016, 94, 104–113. [Google Scholar] [CrossRef]
- Directive 2014/52/EU. Environmental Impact Assessment; European Commission, Ed.; European Commission: Brussels, Belgium, 2014. [Google Scholar]
- Act No. 2012(sc2012c-19). Environmental Assessment Act, Canada; Government of Canada: Ottawa, ON, Canada, 2012.
- Alþingi. Lög um mat á Umhverfisáhrifum nr. 63/1993 [Environmental Impact Assessment Act]; Alþingi: Reykjavík, Iceland, 1993. [Google Scholar]
- Krutilla, J.V. Conservation reconsidered. Am. Econ. Rev. 1967, 57, 777–786. [Google Scholar]
- Holmes, T.P. Self-Interest, Altruism, and Health-Risk Reduction: An Economic Analysis of Voting Behavior. Land Econ. 1990, 66, 140–149. [Google Scholar] [CrossRef]
- Popp, D. Altruism and the Demand for Environmental Quality. Land Econ. 2001, 77, 339–349. [Google Scholar] [CrossRef]
- Icelandic Ministry of the Environment and Natural Resources. Iceland’s 2020 Climate Action Plan; Ministry of the Environment, Energy and Climate: Reykjavík, Iceland, 2020.
- Sigurdardottir, R.; Burton, M. Iceland Cuts Power to Industry, Turns Away New Bitcoin Miners. 2021. Available online: https://www.bloomberg.com/news/articles/2021-12-07/iceland-reduces-power-to-heavy-users-denies-bitcoin-miners (accessed on 10 January 2022).
- Guðmundsson, G. Iceland: Transition to Clean Energy, Limitations of the Electric Transmission System, in School of Science and Engineering. Master’s Thesis, Reykjavik University, Reykjavik, Iceland, 2017. [Google Scholar]
- Olafsson, H. A True Environmental Parable: The Laxá-Mývatn Conflict in Iceland, 1965–1973 An Ecological and Anthropological Approach. Environ. Rev. 1981, 5, 2–38. [Google Scholar] [CrossRef]
- Ögmundardóttir, H. The Shepherds of Þjórsárver: Traditional Use and Hydropower Development in the Commons of the Icelandic Highland; Department of Cultural Anthropology and Ethnology, Uppsala University: Uppsala, Sweden, 2011; 320p. [Google Scholar]
- Environmental Agency. Gullfoss: Culture and History. Available online: https://ust.is/nattura/natturuverndarsvaedi/fridlyst-svaedi/sudurland/gullfoss/menning-og-saga/ (accessed on 20 January 2021).
- Bosshard, P. Karahnjukar—A Project on Thin Ice: An Analysis of the Karahnjukar Hydropower and Reydaral Aluminum Smelter Project in Iceland; International Rivers Network: Berkeley, CA, USA, 2003. [Google Scholar]
- Thórhallsdóttir, T.E. Environment and energy in Iceland: A comparative analysis of values and impacts. Environ. Impact Assess. Rev. 2007, 27, 522–544. [Google Scholar] [CrossRef]
- Ingólfsdóttir, A.H.; Gunnarsdóttir, G.Þ. Tourism as a tool for nature conservation? Conflicting interests between renewable energy projects and wilderness protection in Iceland. J. Outdoor Recreat. Tour. 2020, 29, 100276. [Google Scholar] [CrossRef]
- Tverijonaite, E.; Sæþórsdóttir, A.D.; Ólafsdóttir, R.; Hall, C.M. Renewable Energy in Wilderness Landscapes: Visitors’ Perspectives. Sustainability 2019, 11, 5812. [Google Scholar] [CrossRef]
- Sæþórsdóttir, A.D.; Hall, C.M. Contested Development Paths and Rural communities: Sustainable Energy or Sustainable Tourism in Iceland? Sustainability 2019, 11, 3642. [Google Scholar] [CrossRef]
- Burns, G.L.; Haraldsdóttir, L. Hydropower and tourism in Iceland: Visitor and operator perspectives on preferred use of natural areas. J. Outdoor Recreat. Tour. 2018, 25, 91–101. [Google Scholar] [CrossRef]
- OECD. OECD Tourism Trends and Policies 2020: Iceland. 2022. Available online: https://www.oecd-ilibrary.org/sites/2fde1a1d-en/index.html?itemId=/content/component/2fde1a1d-en (accessed on 15 May 2022).
- Benediktsson, K. “Scenophobia”, Geography and the Aesthetic Politics of Landscape. Geogr. Ann. Ser. B Hum. Geogr. 2007, 89, 203–217. [Google Scholar] [CrossRef]
- Ólafsdóttir, R.; Runnström, M.C. How wild is Iceland? Wilderness quality with respect to nature-based tourism. Tour. Geogr. 2011, 13, 280–298. [Google Scholar] [CrossRef]
- Karlsdóttir, U.B. Nature worth seeing! The tourist gaze as a factor in shaping views on nature in Iceland. Tour. Stud. 2013, 13, 139–155. [Google Scholar] [CrossRef]
- Thórhallsdóttir, E. Evaluating Nature and Wilderness in Iceland of the Central Highland. In Wilderness in the Circumpolar North: Searching for Compatibility in Ecological, Traditional, and Ecotourism Values; 2001 May 15–16; Anchorage, AK, Proceedings of the RMRS-P-26. Ogden, UT, USA Department of Agriculture, Forest Service, Rocky Mountain Research Station, 15–16 May 2001; Watson, A.E., Alessa, L., Sproull, J., Eds.; Forest Service, U.S. Department of Agriculture: Washington, DC, USA, 2002; pp. 96–104. [Google Scholar]
- OECD. Environmental Performance Reviews: Iceland; OECD: Paris, France, 1993. [Google Scholar]
- OECD. Environmental Performance Reviews: Iceland; OECD: Paris, France, 2001. [Google Scholar]
- OECD. Environmental Performance Reviews: Iceland; OECD: Paris, France, 2014. [Google Scholar]
- Icelandic Ministry of the Environment and Natural Resources. Lokaskýrsla Verkefnisstjórnar 3. Áfanga Verndar- Og Orkunýtingaráætlunar 2013–2017; Gíslason, S., Ed.; Ministry of the Environment, Energy and Climate: Reykjavík, Iceland, 2016.
- Carson, R.T. Contingent valuation: A user’s guide. Environ. Sci. Technol. 2000, 34, 1413–1418. [Google Scholar] [CrossRef]
- Arnórsson, Á.; Eiríksdóttir, K. Skýrsla nr. C21:01 Handbók Um Hagrænt Umhverfismat Mars 2021; Háskóli Íslands: Reykjavík, Iceland, 2021. [Google Scholar]
- Lienhoop, N.; MacMillan, D. Valuing wilderness in Iceland: Estimation of WTA and WTP using the market stall approach to contingent valuation. Land Use Policy 2007, 24, 289–295. [Google Scholar] [CrossRef]
- Steingrimsson, B.; Björnsson, S.; Adalsteinsson, H. Master Plan for Geothermal and Hydropower Development in Iceland. In Proceedings of the ARGeo C-2 Conference, Entebbe, Uganda, 24–25 November 2008. [Google Scholar]
- Master Plan. The Master Plan for Nature Protection and Energy Utilization. Rammaáætlun n.d. Available online: https://www.ramma.is//english (accessed on 21 March 2023).
- Gunnarsson, B.; Gunnarsson, M.-V. Iceland’s Central Highlands: Nature conservation, ecotourism, and energy resource utilization. In Wilderness in the Circumpolar North: Searching for Compatibility in Ecological, Traditional, and Ecotourism Values; 2001 May 15–16; Anchorage, AK, Proceedings of the RMRS-P-26. Ogden, UT, USA Department of Agriculture, Forest Service, Rocky Mountain Research Station, 15–16 May 2001; Watson, A.E., Alessa, L., Sproull, J., Eds.; Forest Service, U.S. Department of Agriculture: Washington, DC, USA, 2002; pp. 54–63. [Google Scholar]
- Thórhallsdóttir, T.E. Strategic planning at the national level: Evaluating and ranking energy projects by environmental impact. Environ. Impact Assess. Rev. 2007, 27, 545–568. [Google Scholar] [CrossRef]
- Klaustur. Facebooksíða Skaftárhreppur. Available online: https://www.klaustur.is/is (accessed on 8 May 2022).
- Pálsdóttir, P.; Ólafsdóttir, R. Jökulvötn in Skaftárhreppur; South East Iceland Nature Research Center: Höfn, Iceland, 2019. [Google Scholar]
- Ólafsdóttir, R.; Dowling, R.K. Geotourism and Geoparks—A Tool for Geoconservation and Rural Development in Vulnerable Environments: A Case Study from Iceland. Geoheritage 2013, 6, 71–87. [Google Scholar] [CrossRef]
- Katla Geopark. About Katla Geopark. Available online: https://www.katlageopark.com/about-katla/ (accessed on 8 May 2022).
- Landsvirkjun. Hólmsárvirkjun: Allt að 80 MW Vatnsaflsvirkjun í Skaftárhreppi: Mat á Umhverfisáhrifum: Tillaga að Matsáætlun; Skipulagsstofnun: Reykjavik, Iceland, 2011. [Google Scholar]
- Árnason, Ó.; Kjeld, A.; Ingólfsdóttir, B.D.; Thoroddsen, R.; Auhage, S.N.V. Tenging Hólmsár- og Búlandsvirkjana, Flutningslínur í Skaftártungu, 132/220 kV, Mat á Umhverfisáhrifum; EFLA: Reykjavik, Iceland, 2011. [Google Scholar]
- Ólafsson, E.; Guðmundsson, G.A.; Guðjónsson, G.; Skarphéðinsson, K.H. Hólmsárvirkjun—Atleyjarlón, Fuglar, Gróður og Smádýr; Rafhlaðan: Reykjavik, Iceland, 2012. [Google Scholar]
- Thoroddsen, R.; Guðjónsson, G. Hólmsárvirkjun—Atleyjarlón, Náttúrufarsyfirlit um Gróður og Vistgerðir; Natural History Institute of Iceland: Garðabær, Iceland, 2011; NÍ-11005. [Google Scholar]
- Snorrason, A.; Traustason, B.; Eggertsson, Ó. Hólmsárvirkjun—Atleyjarlón: Úttekt á Náttúrulegu Birkilendi Sem fer Undir Vatn Við myndun Atleyjarlóns; Forestry Department: Reykjavík, Iceland, 2011.
- Navrud, S.; Ready, R.C.; Magnussen, K.; Bergland, O. Valuing the social benefits of avoiding landscape degradation from overhead power transmission lines: Do underground cables pass the benefit–cost test? Landsc. Res. 2008, 33, 281–296. [Google Scholar] [CrossRef]
- Sæþórsdóttir, A.D. Virkjun Frumkraftanna: Ferðamennska eða Virkjun í Skaftárhreppi? Skemman: Reykjavik, Iceland, 2013. [Google Scholar]
- Stefánsson, Þ.; Sæþórsdóttir, A.D.; Hall, C. When tourists meet transmission lines: The effects of electric transmission lines on tourism in Iceland. Energy Res. Soc. Sci. 2017, 34, 82–92. [Google Scholar] [CrossRef]
- Sæþórsdóttir, A.D.; Ólafsson, R. Áhrif Raflínu Frá Hólmsárvirkjun að Sigöldulínu 4 á Ferðamennsku og Útivist; Institute of Land and Tourism: Reykjavik, Iceland, 2013. [Google Scholar]
- Alberini, A.; Kahn, J. Handbook on Contingent Valuation; Edward Elgar Publishing: Cheltenham, UK, 2006. [Google Scholar]
- Carson, R.T.; Hanemann, W.M. Chapter 17 Contingent Valuation. In Handbook of Environmental Economics; Mler, K.-G., Vincent, J.R., Eds.; Elsevier: Amsterdam, The Netherlands, 2005; pp. 821–936. [Google Scholar]
- Schils, N. Icelanders protest Karahnjukar Hydropower Project, 2000–2006. 2011. Available online: https://nvdatabase.swarthmore.edu/content/icelanders-protest-karahnjukar-hydropower-project-2000-2006 (accessed on 31 January 2000).
- Guðmundsdóttir, H.; Carton, W.; Busch, H.; Ramasar, V. Modernist dreams and green sagas: The neoliberal politics of Iceland’s renewable energy economy. Environ. Plan. E Nat. Space 2018, 1, 579–601. [Google Scholar] [CrossRef]
- Social Science Research Institute. Online Panel. Available online: https://ssri.is/services-questionnaire-surveys/online-panel (accessed on 24 January 2023).
- Haab, T.; McConnell, K.E. Valuing Environmental and Natural Resources; Edward Elgar Publishing: Cheltenham, UK, 2002. [Google Scholar]
- Arrow, K.; Solow, R.; Portney, P.R.; Leamer, E.E.; Radner, R.; Schuman, H. Report of the NOAA Panel on Contingent Valuation. Fed. Regist. 1993, 58, 4601–4614. [Google Scholar]
- Johnston, R.J.; Boyle, K.J.; Adamowicz, W.; Bennett, J.; Brouwer, R.; Cameron, T.A.; Hanemann, W.M.; Hanley, N.; Ryan, M.; Scarpa, R.; et al. Contemporary Guidance for Stated Preference Studies. J. Assoc. Environ. Resour. Econ. 2017, 4, 319–405. [Google Scholar] [CrossRef]
- Sajise, A.J.; Samson, J.N.; Quiao, L. Contingent Valuation of Nonmarket Benefits in Project Economic Analysis: A Guide to Good Practice; Asian Development Bank: Mandaluyong, Philippines, 2021. [Google Scholar]
- OECD. Cost-Benefit Analysis and the Environment: Further Developments and Policy Use; OECD Publishing: Paris, France, 2018. [Google Scholar]
- Black, J.; Milner-Gulland, E.J.; Sotherton, N.; Mourato, S. Valuing complex environmental goods: Landscape and biodiversity in the North Pennines. Environ. Conserv. 2010, 37, 136–146. [Google Scholar] [CrossRef]
- Groves, R.M. Survey Methodology; J. Wiley: Hoboken, NJ, USA, 2004. [Google Scholar]
- Malinauskaite, L.; Cook, D.; Davíðsdóttir, B.; Ögmundardóttir, H.; Roman, J. Willingness to pay for expansion of the whale sanctuary in Faxaflói Bay, Iceland: A contingent valuation study. Ocean. Coast. Manag. 2020, 183, 105026. [Google Scholar] [CrossRef]
- Einarsdóttir, S.R.; Cook, D.; Davíðsdóttir, B. The contingent valuation study of the wind farm Búrfellslundur—Willingness to pay for preservation. J. Clean. Prod. 2018, 209, 795–802. [Google Scholar] [CrossRef]
- Cook, D.; Eiríksdóttir, K.; Davíðsdóttir, B.; Kristófersson, D.M. The Contingent Valuation Study of Heiðmörk, Iceland—Willingness to pay for its preservation. J. Environ. Manag. 2018, 209, 126–138. [Google Scholar] [CrossRef] [PubMed]
- Statista. Share of Households with Internet Access in Iceland from 2010 to 2021. 2023. Available online: https://www.statista.com/statistics/377769/household-internet-access-in-iceland/ (accessed on 10 January 2023).
- Wu, M.-J.; Zhao, K.; Fils-Aime, F. Response rates of online surveys in published research: A meta-analysis. Comput. Hum. Behav. Rep. 2022, 7, 100206. [Google Scholar] [CrossRef]
- Strazzera, E.; Scarpa, R.; Calia, P.; Garrod, G.D.; Willis, K.G. Modelling zero values and protest responses in contingent valuation surveys. Appl. Econ. 2003, 35, 133–138. [Google Scholar] [CrossRef]
- Hynes, S.; O’Donoghue, C. Value transfer using spatial microsimulation modelling: Estimating the value of achieving good ecological status under the EU Water Framework Directive across catchments. Environ. Sci. Policy 2020, 110, 60–70. [Google Scholar] [CrossRef]
- Voltaire, L.; Jeanty, P.W.; Pirrone, C.; Mahieu, P.-A. A convergent validity test within the payment card format using simulation techniques. Appl. Econ. 2019, 51, 3770–3786. [Google Scholar] [CrossRef]
- Buckley, C.; Hynes, S.; Mechan, S. Supply of an ecosystem service—Farmers’ willingness to adopt riparian buffer zones in agricultural catchments. Environ. Sci. Policy 2012, 24, 101–109. [Google Scholar] [CrossRef]
- Cook, D.; Malinauskaite, L.; Davíðsdóttir, B.; Ögmundardóttir, H. A contingent valuation approach to estimating the recreational value of commercial whale watching—The case study of Faxaflói Bay, Iceland. Tour. Manag. Perspect. 2020, 36, 100754. [Google Scholar] [CrossRef]
- Hynes, S.; Hanley, N. The “Crex crex” lament: Estimating landowners willingness to pay for corncrake conservation on Irish farmland. Biol. Conserv. 2009, 142, 180–188. [Google Scholar] [CrossRef]
- Moffitt, R.; McDonald, J. The Uses of Tobit Analysis. Rev. Econ. Stat. 1980, 62, 318–321. [Google Scholar]
- Statistics Iceland. 2023. Available online: https://www.statice.is (accessed on 10 January 2023).
- Ólafsson, K.B. Levelized Cost of Energy (LCOE) og Virkjunarkostir til Umfjöllunar i 3. Áfanga Rammaáætlunar. 2016. Available online: https://vatnsidnadur.net/wp-content/uploads/2017/02/Virkjanakostir-LCOE-greining-fyrir-Samorku.pdf (accessed on 10 January 2023).
- Tverijonaite, E.; Sæþórsdóttir, A.D.; Ólafsdóttir, R.; Hall, C.M. How close is too close? Mapping the impact area of renewable energy infrastructure on tourism. Energy Res. Soc. Sci. 2022, 90, 102574. [Google Scholar] [CrossRef]
- Ponce, R.D.; Vásquez, F.; Stehr, A.; Debels, P.; Orihuela, C. Estimating the Economic Value of Landscape Losses Due to Flooding by Hydropower Plants in the Chilean Patagonia. Water Resour. Manag. 2011, 25, 2449–2466. [Google Scholar] [CrossRef]
- Carson, R.T.; Flores, N.E.; Meade, N.F. Contingent Valuation: Controversies and Evidence. Environ. Resour. Econ. 2001, 19, 173–210. [Google Scholar] [CrossRef]
- Aas, Ø.; Onstad, O. Strategic and temporal substitution among anglers and white-water kayakers: The case of an urban regulated river. J. Outdoor Recreat. Tour. 2013, 1, 1–8. [Google Scholar] [CrossRef]
- Jackson, E.L. Outdoor recreation participation and attitudes to the environment. Leis. Stud. 1986, 5, 1–23. [Google Scholar] [CrossRef]
- Boudet, H.S. Public perceptions of and responses to new energy technologies. Nat. Energy 2019, 4, 446–455. [Google Scholar] [CrossRef]
- Jones, B.A.; Berrens, R.P.; Jenkins-Smith, H.; Silva, C.; Ripberger, J.; Carlson, D.; Gupta, K.; Wehde, W. In search of an inclusive approach: Measuring non-market values for the effects of complex dam, hydroelectric and river system operations. Energy Econ. 2018, 69, 225–236. [Google Scholar] [CrossRef]
- Håkansson, C. Costs and benefits of improving wild salmon passage in a regulated river. J. Environ. Plan. Manag. 2009, 52, 345–363. [Google Scholar] [CrossRef]
- Hongyun, H.; Liange, Z.; Tong, Z. Estimating Ecological Value of Small Hydropower Using Contingent Valuation Method: An Application to Tongjiqiao Reservoir in Zhejiang Province, China. Chin. J. Popul. Resour. Environ. 2012, 10, 87–95. [Google Scholar] [CrossRef]
- Lehtoranta, V.; Louhi, P. Does conservation in Natura 2000 areas promote water quality improvement? Findings from a contingent valuation study on environmental benefits and residents’ preferences. Environ. Sci. Policy 2021, 124, 226–234. [Google Scholar] [CrossRef]
- IRENA; CPI. Renewable Energy Statistics 2023; International Renewable Energy Agency: Abu Dhabi, United Arab Emirates, 2023. [Google Scholar]
- TEEB. The Economics of Ecosystems and Biodiversity: Mainstreaming the Economics of Nature: A Synthesis of the Approach, Conclusions and Recommendations of TEEB. 2010. Available online: https://portals.iucn.org/library/node/9684 (accessed on 5 March 2023).
- Diamond, P.A.; Hausman, J.A. Contingent Valuation: Is Some Number better than No Number? J. Econ. Perspect. 1994, 8, 45–64. [Google Scholar] [CrossRef]
- Haab, T.; Interis, M.G.; Petrolia, D.R.; Whitehead, J.C. From Hopeless to Curious? Thoughts on Hausman’s “Dubious to Hopeless” Critique of Contingent Valuation. Appl. Econ. Perspect. Policy 2013, 35, 593–612. [Google Scholar] [CrossRef]
- Cummings, R.G.; Taylor, L.O. Does Realism Matter in Contingent Valuation Surveys? Land Econ. 1998, 74, 203–215. [Google Scholar] [CrossRef]
- Rowe, R.D.; Schulze, W.D.; Breffle, W.S. A Test for Payment Card Biases. J. Environ. Econ. Manag. 1996, 31, 178–185. [Google Scholar] [CrossRef]
Figure 1.
The location of the case study area in southern Iceland.

Table 1.
Level of analysis appropriate for incomplete cases and protest votes.
| Category | Number | Percentage in Final Dataset | Level of Analysis |
|---|---|---|---|
| Early withdrawal and strategic responses | 79 | Removed from analysis | |
| Failed to complete survey beyond attitude/behavior | 43 | 3.4 | Attitudinal and behavioral analysis only |
| Not stating WTP | 361 | 28.2 | Attitudinal and behavioral analysis only |
| Protest vote for no WTP | 174 | 13.6 | Attitudinal and behavioral analysis only |
| Protest vote for positive WTP | 57 | 4.5 | Attitudinal and behavioral analysis only |
| Failure to answer at least one debriefing question correctly | 9 | 0.7 | Attitudinal and behavioral analysis only |
Table 2.
Payment card values provided in the survey and recoded values for the model.
| Values in Survey (ISK) | Recoded Values (ISK) |
|---|---|
| 0 | 1000 |
| 2000 | 3000 |
| 4000 | 5000 |
| 6000 | 7000 |
| 8000 | 9000 |
| 10,000 | 11,000 |
| 12,000 | 13,000 |
| 14,000 | 15,000 |
| 16,000 | 17,000 |
| 18,000 | 19,000 |
| 20,000 | 21,000 |
| 22,000 | 23,000 |
| 24,000 | 25,000 |
| 26,000 | 27,000 |
| 28,000 | 29,000 |
| 30,000 | 31,000 |
| 50,000 | 40,000 ** |
Note: ** recoded from write-in responses as an upper valid response for WTP value.
Table 3.
Attitudes toward energy security, environmental protection, and donating resources to environmental conservation organizations.
Table 3.
Attitudes toward energy security, environmental protection, and donating resources to environmental conservation organizations.
| (N = 1278) | Not Important at All | Not That Important | Neither Important Nor Unimportant | Rather Important | Very Important |
|---|---|---|---|---|---|
| (%) | (%) | (%) | (%) | (%) | |
| Ensuring Iceland can develop renewable energy in the future | 0.5 | 1.1 | 6.4 | 27.9 | 64.0 |
| Importance of environmental protection | 0.8 | 1.7 | 8.4 | 35.1 | 54.1 |
| Donate money or time to environmental conservation organizations | 12.8 | 12.4 | 30.4 | 29.7 | 14.9 |
Table 4.
Attitudes toward RE development in Iceland.
| Very Negative | Somewhat Negative | Neither Positive Nor Negative | Somewhat Positive | Very Positive | |
|---|---|---|---|---|---|
| Energy Type | (%) | (%) | (%) | (%) | (%) |
| Geothermal | 1.17 | 1.25 | 7.36 | 27.15 | 63.07 |
| Hydropower | 2.35 | 5.40 | 10.72 | 30.13 | 51.41 |
| Tidal | 0.63 | 1.72 | 19.56 | 37.87 | 40.22 |
| Hydrogen | 1.96 | 3.76 | 29.34 | 31.38 | 33.57 |
| Biofuels | 3.13 | 6.49 | 32.24 | 33.88 | 24.26 |
| Offshore wind | 6.26 | 5.71 | 32.08 | 35.52 | 20.42 |
| Onshore wind | 6.57 | 7.51 | 32.08 | 33.88 | 19.95 |
| Fossil fuels | 31.46 | 21.13 | 29.11 | 11.97 | 6.34 |
| Nuclear | 59.39 | 15.10 | 16.28 | 4.77 | 4.46 |
Table 5.
Mean WTP for the preservation of the study area.
| Cases Included | Mean WTP (ISK) | Standard Deviation (ISK) | Median WTP (ISK) | 95% Confidence Interval | |
|---|---|---|---|---|---|
| Lower | Upper | ||||
| (ISK) | |||||
| All respondents (N = 621) | 5515.30 | 4008.94 | 5431.38 | 5199.38 | 5831.22 |
| Excluding non-WTP (N = 218) | 13,862.39 | 10,087.15 | 11,000.00 | 12,515.85 | 15,208.92 |
Disclaimer/Publisher’s Note: The statements, opinions and data contained in all publications are solely those of the individual author(s) and contributor(s) and not of MDPI and/or the editor(s). MDPI and/or the editor(s) disclaim responsibility for any injury to people or property resulting from any ideas, methods, instructions or products referred to in the content. |
© 2024 by the authors. Licensee MDPI, Basel, Switzerland. This article is an open access article distributed under the terms and conditions of the Creative Commons Attribution (CC BY) license (https://creativecommons.org/licenses/by/4.0/).
Share and Cite
MDPI and ACS Style
Cook, C.; Sæþórsdóttir, A.D.; Cook, D. Preferences and Willingness to Pay for Preservation: The Case of a Proposed Hydropower Project in Southern Iceland. Land 2024, 13, 159. https://doi.org/10.3390/land13020159
AMA Style
Cook C, Sæþórsdóttir AD, Cook D. Preferences and Willingness to Pay for Preservation: The Case of a Proposed Hydropower Project in Southern Iceland. Land. 2024; 13(2):159. https://doi.org/10.3390/land13020159
Chicago/Turabian StyleCook, Clint, Anna Dóra Sæþórsdóttir, and David Cook. 2024. "Preferences and Willingness to Pay for Preservation: The Case of a Proposed Hydropower Project in Southern Iceland" Land 13, no. 2: 159. https://doi.org/10.3390/land13020159
Note that from the first issue of 2016, this journal uses article numbers instead of page numbers. See further details here.