Regional Ecological Security Assessment Based on the Pressure–State–Response Framework: The Demonstration Zone of Yangtze River Delta as an Example


Abstract
:1. Introduction
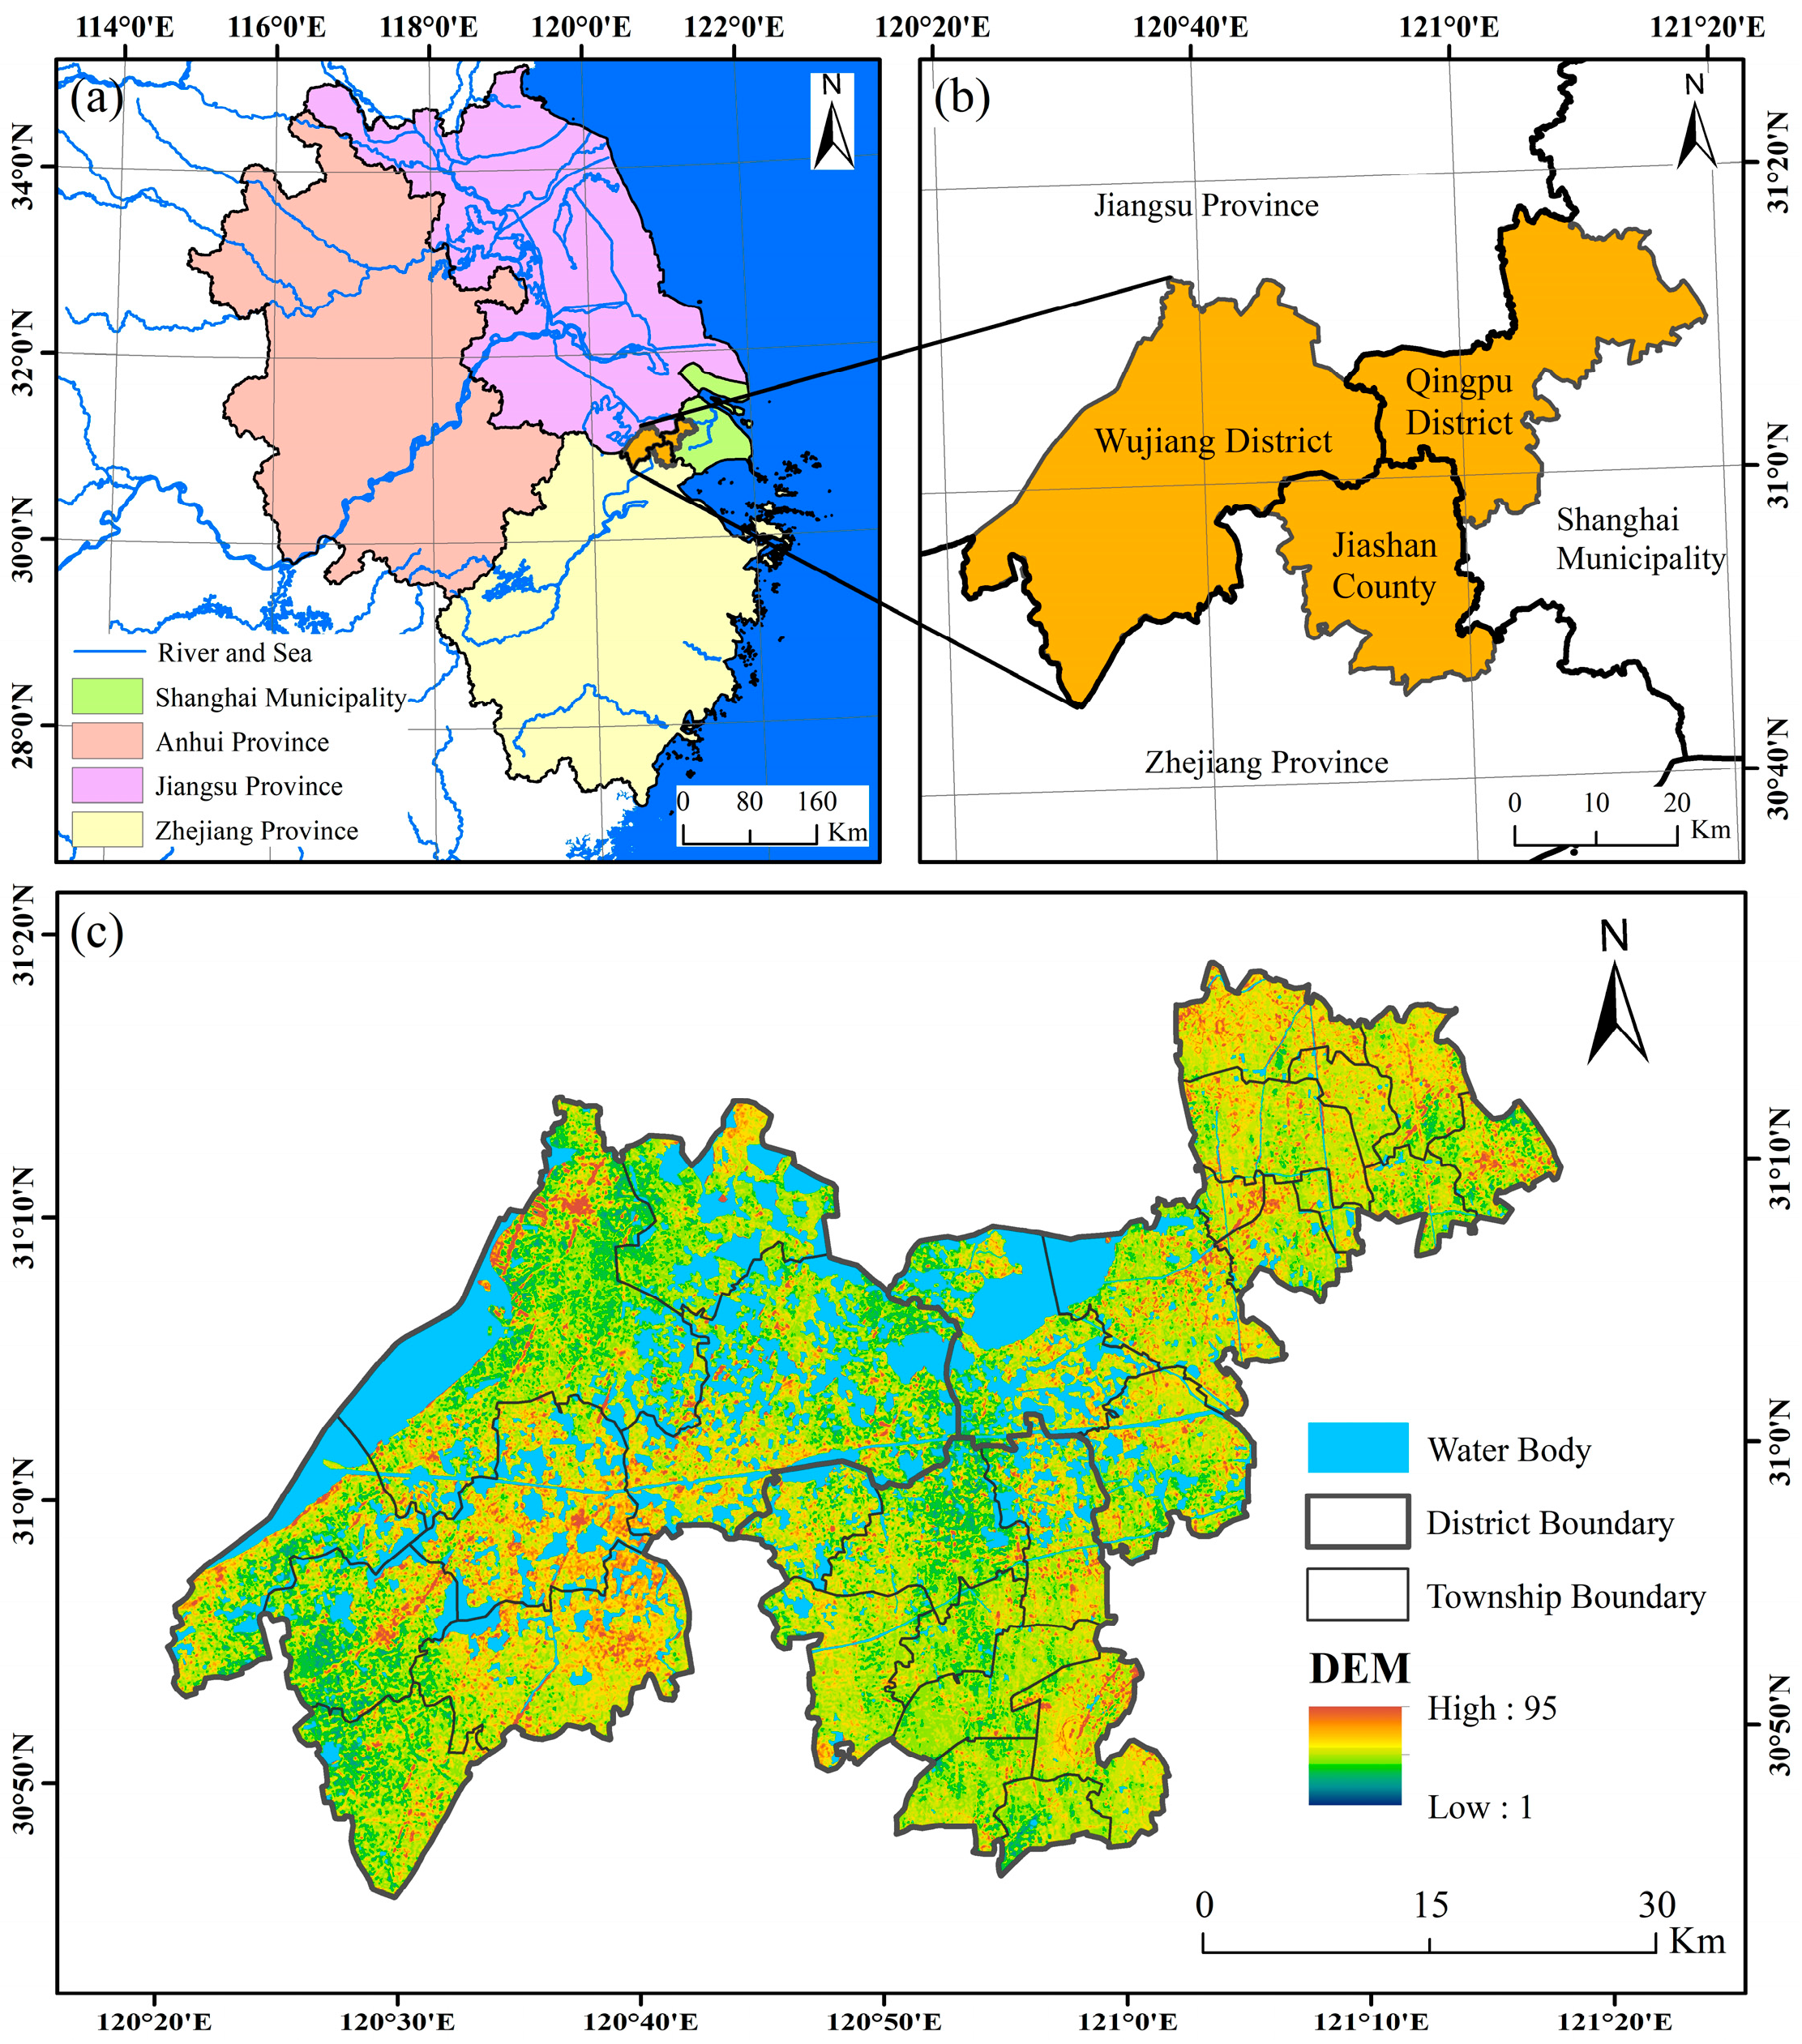
2. Study Area
3. Materials and Methods
3.1. Data Sources
3.2. Regional Ecological Security Assessment Model
- (1)
- Township Development Intensity [55]. It refers to the expansion of human activities in the township. The general economy of the DZGIED has been growing, but excessive development and construction will cause damage to the environment.where refers to the township development intensity of the DZGIED; is the build-up area of the grid; is the total area of the grid; is the population concentration coefficient; is the average brightness of nighttime light; is the minimum brightness; and is the maximum brightness.
- (2)
- (3)
- Soil Erosion [57,58]. Soil erosion destroys land resources and causes land degradation, loss of soil fertility, siltation, and other problems. It can have a negative ecological impact. The RUSLE model was used to calculate the soil erosion degree.where is the mean annual soil loss; is the rainfall erosivity; is the soil erodibility; is the topography; is the vegetation cover; is the factor of conservation practice.
- (4)
- (5)
- Topographic Difference [59]. Variations in slope are caused by topography. Significant differences in altitude affect other natural factors such as precipitation, temperature, and so on, affecting human socio-economic and social activities.where refers to the topographic difference index for the DZGIED; is the gradient variance; is the average gradient. It was calculated with DEM data.
- (6)
- Land Surface Temperature [60]. The Land Surface Temperature (LST) is fundamental in studying the surface thermal environment and the urban heat island effect. This paper solves the surface temperature in accordance with Statistical Mono-Window (SMW). Too high or too low land surface temperature will cause adverse effects on the ecology and destroy the ecological balance.where is the TOA brightness temperature in the TIR channel and is the surface emissivity for the same channel. , , and are algorithm coefficients. The LST indicator was calculated by using Google Earth Engine based on the study of Ermida et al. [60].
- (7)
- Landscape Fragmentation degree [61]. Landscape fragmentation is one of the most dominant aspects of the structure of ecosystems. A landscape with high fragmentation degree is vulnerable to interference by human activities and natural disasters, and its anti-interference ability is weak.where is the degree of landscape fragmentation, Number “6” represents that there are six types of land use, is the number of land patches, and is the total area of the grid.
- (8)
- Ecological Vitality. Ecological vitality is the completeness and health of the ecosystem, supporting the prosperity and development capacity of the ecosystem. The growth quality of vegetation is a sign of ecosystem vitality [62]. The maximum annual NDVI was used to express ecological vitality.where is the ecosystem vitality of the grid, is the largest NDVI.
- (9)
- Ecological Resilience [63]. Ecological resilience represents the ability of the ecosystem to keep and regulate itself while withstanding a series of external pressures and disturbances. It can mitigate the impact of external ecological pressure on regional ecological security to some extent.where is the grid system’s ecosystem resilience, is the resilient weight of the land use , is the area of the land use type , and is the grid system’s area. The ecosystem resilient weight of each land use type in the study was Forest 1; Grass Land 0.8; Cultivated Land 0.6; Artificial Surfaces 0.2; Water Body 1; Bareland 0.4.
3.3. Comprehensive RES Index
3.3.1. Data Standardization
3.3.2. Assignment of Index Weights
3.3.3. Comprehensive Index of Regional Ecological Security
3.4. Assessment Level
3.5. Spatial Autocorrelation Analysis
3.6. Slope Trend Analysis
4. Results and Analysis
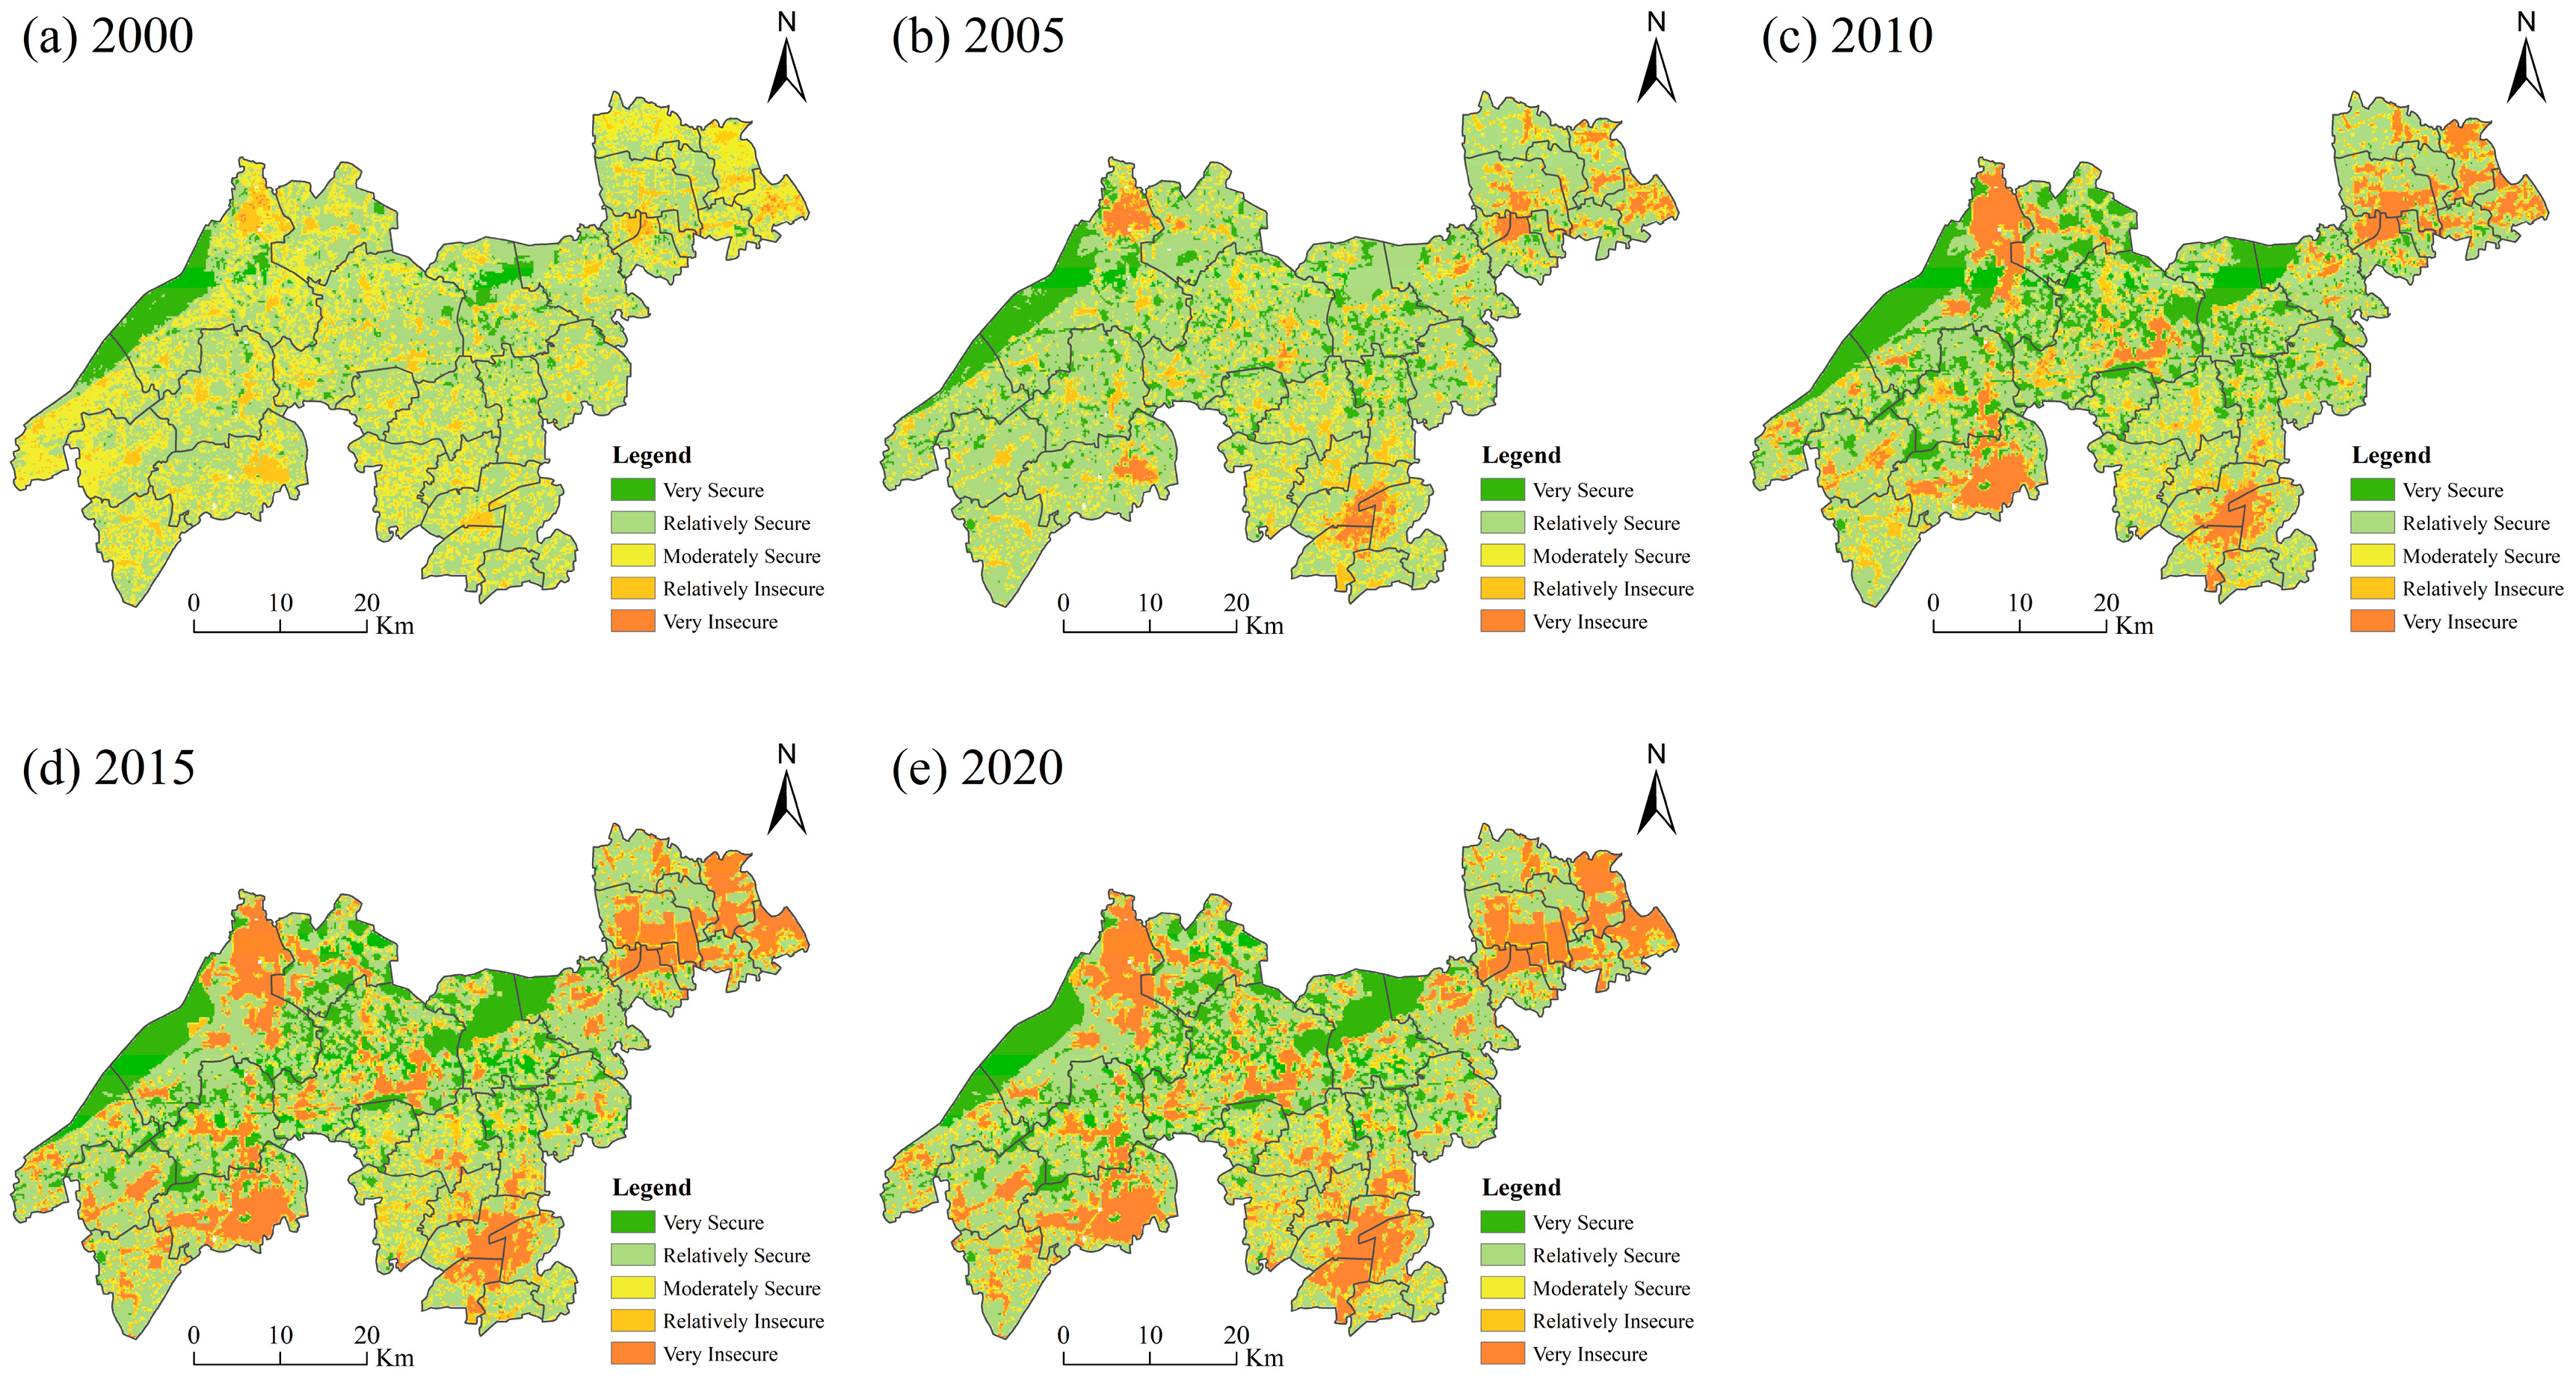
4.1. Regional Ecological Security for the DZGIED
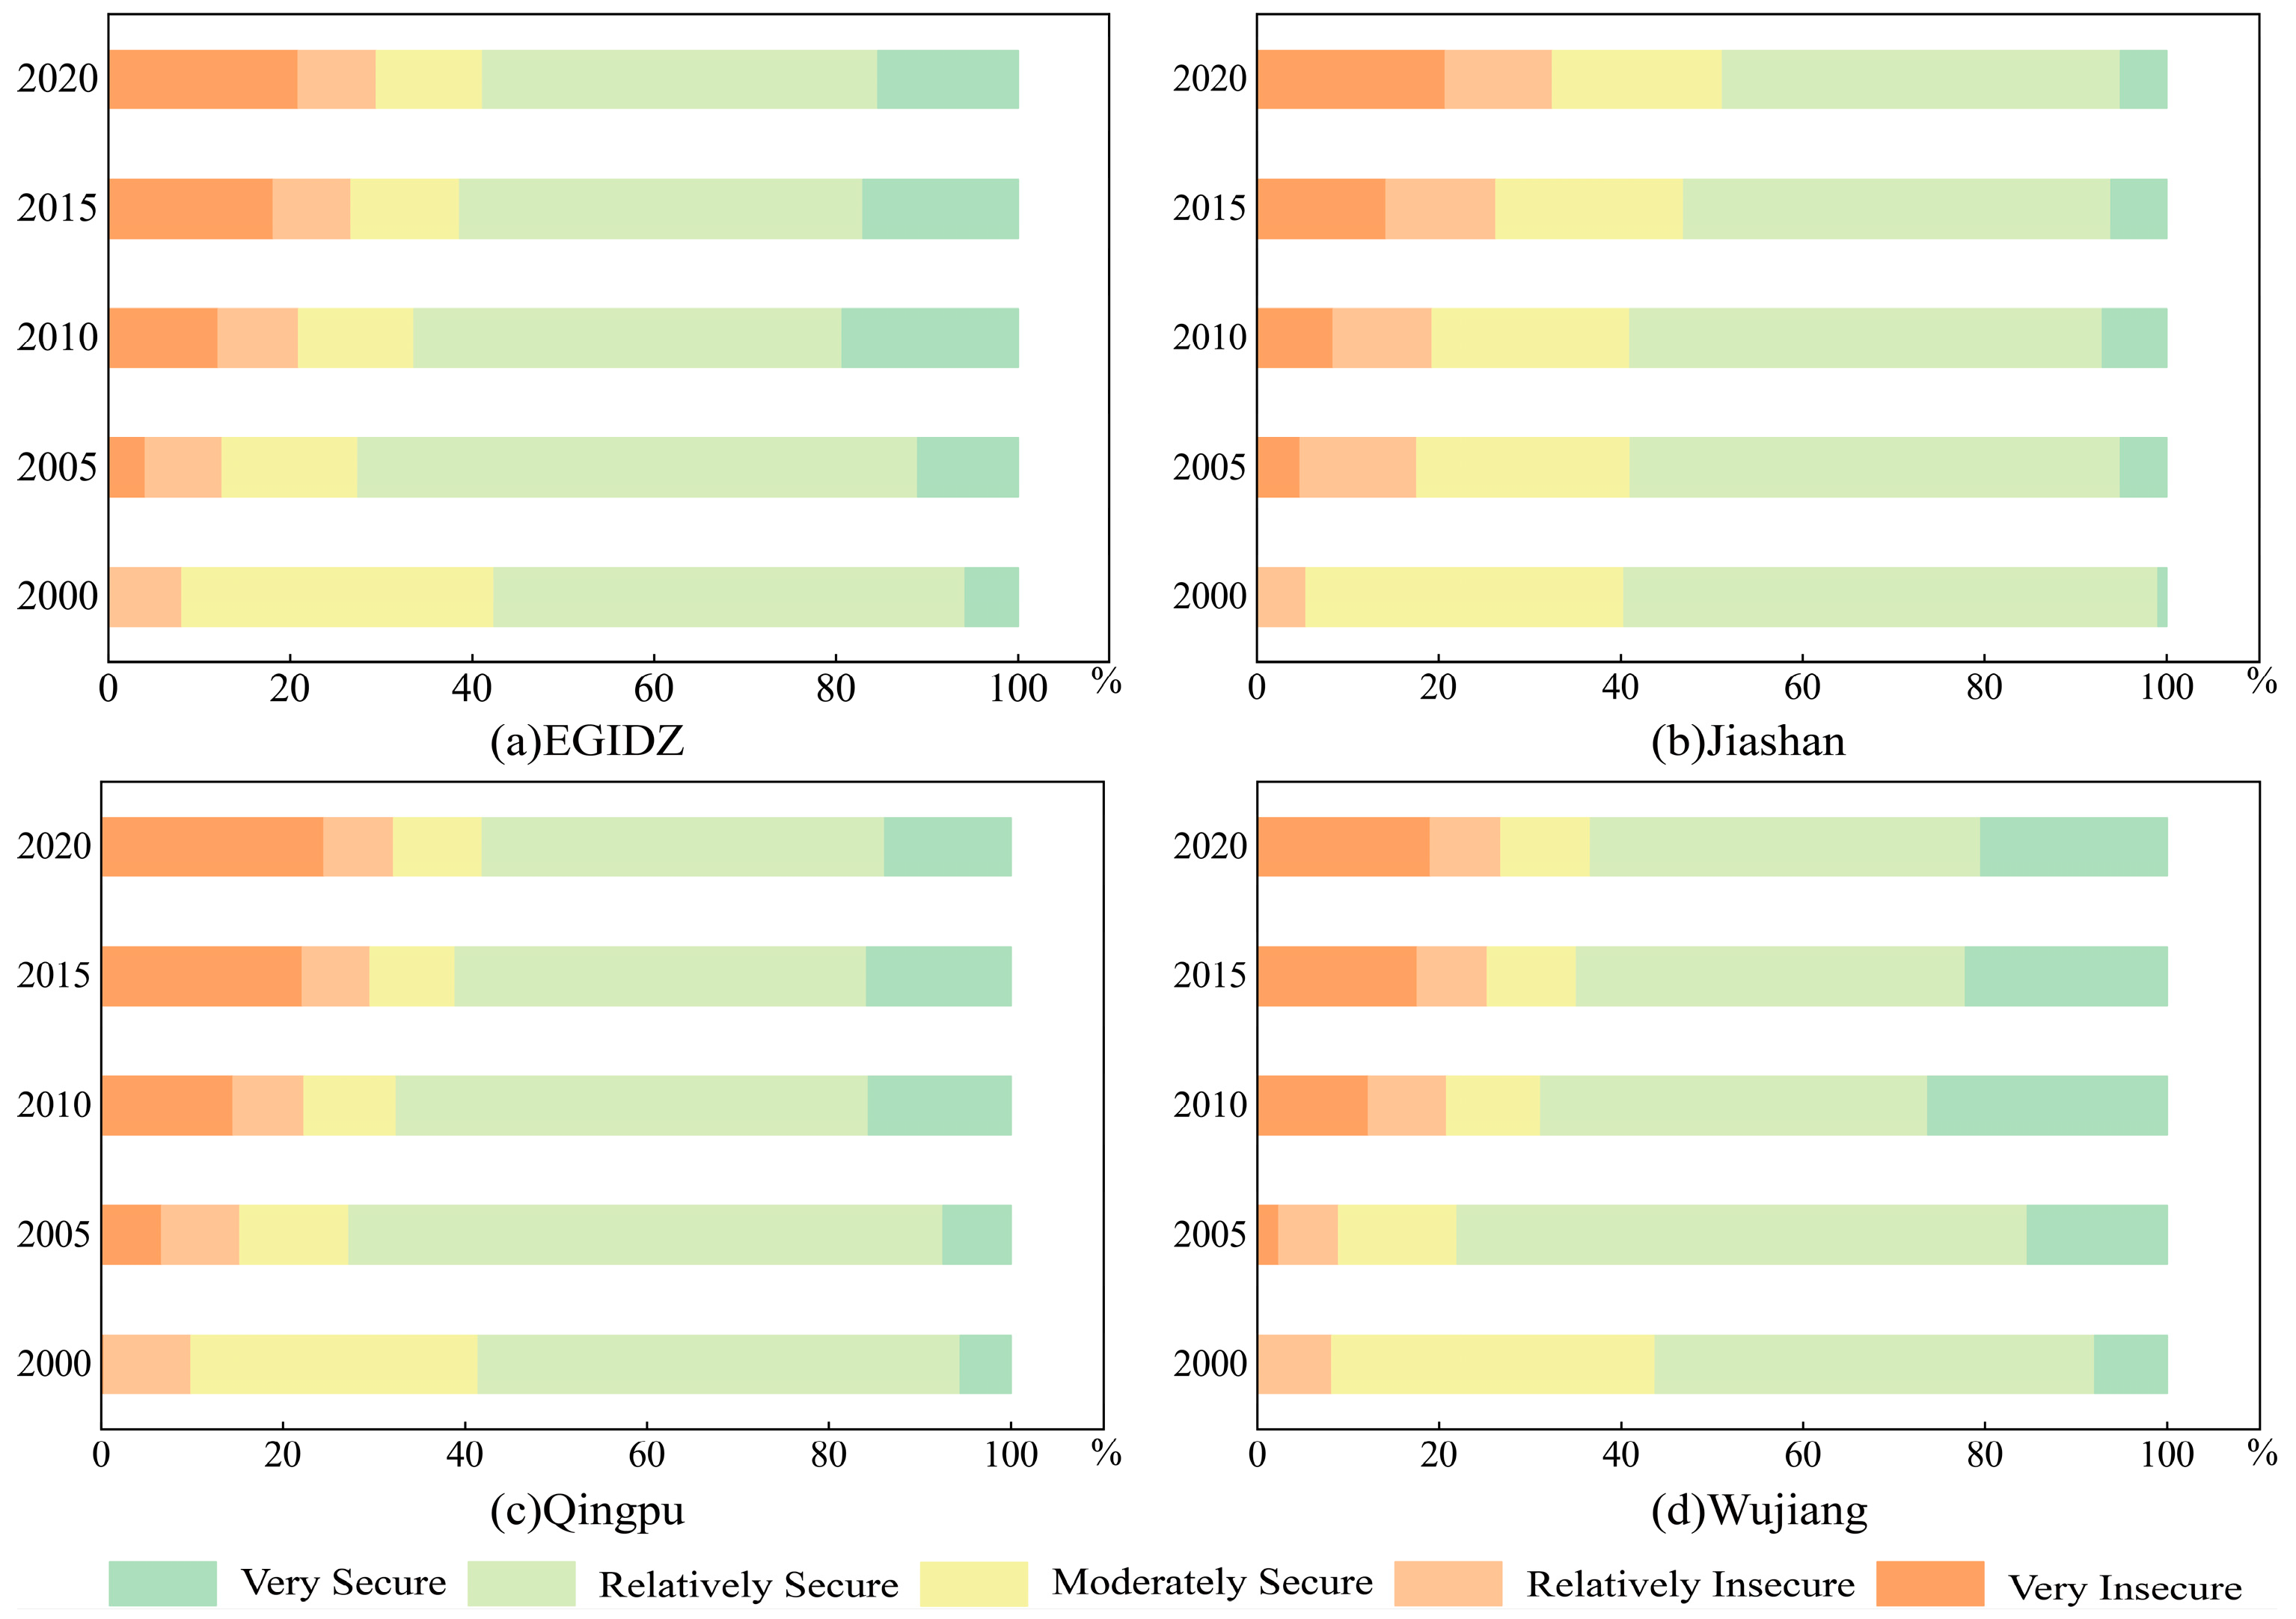
4.2. Analysis of RES at Township Scale
4.2.1. Spatiotemporal Change in RES in Each Township
4.2.2. Spatial Autocorrelation Analysis of 28 Township Streets
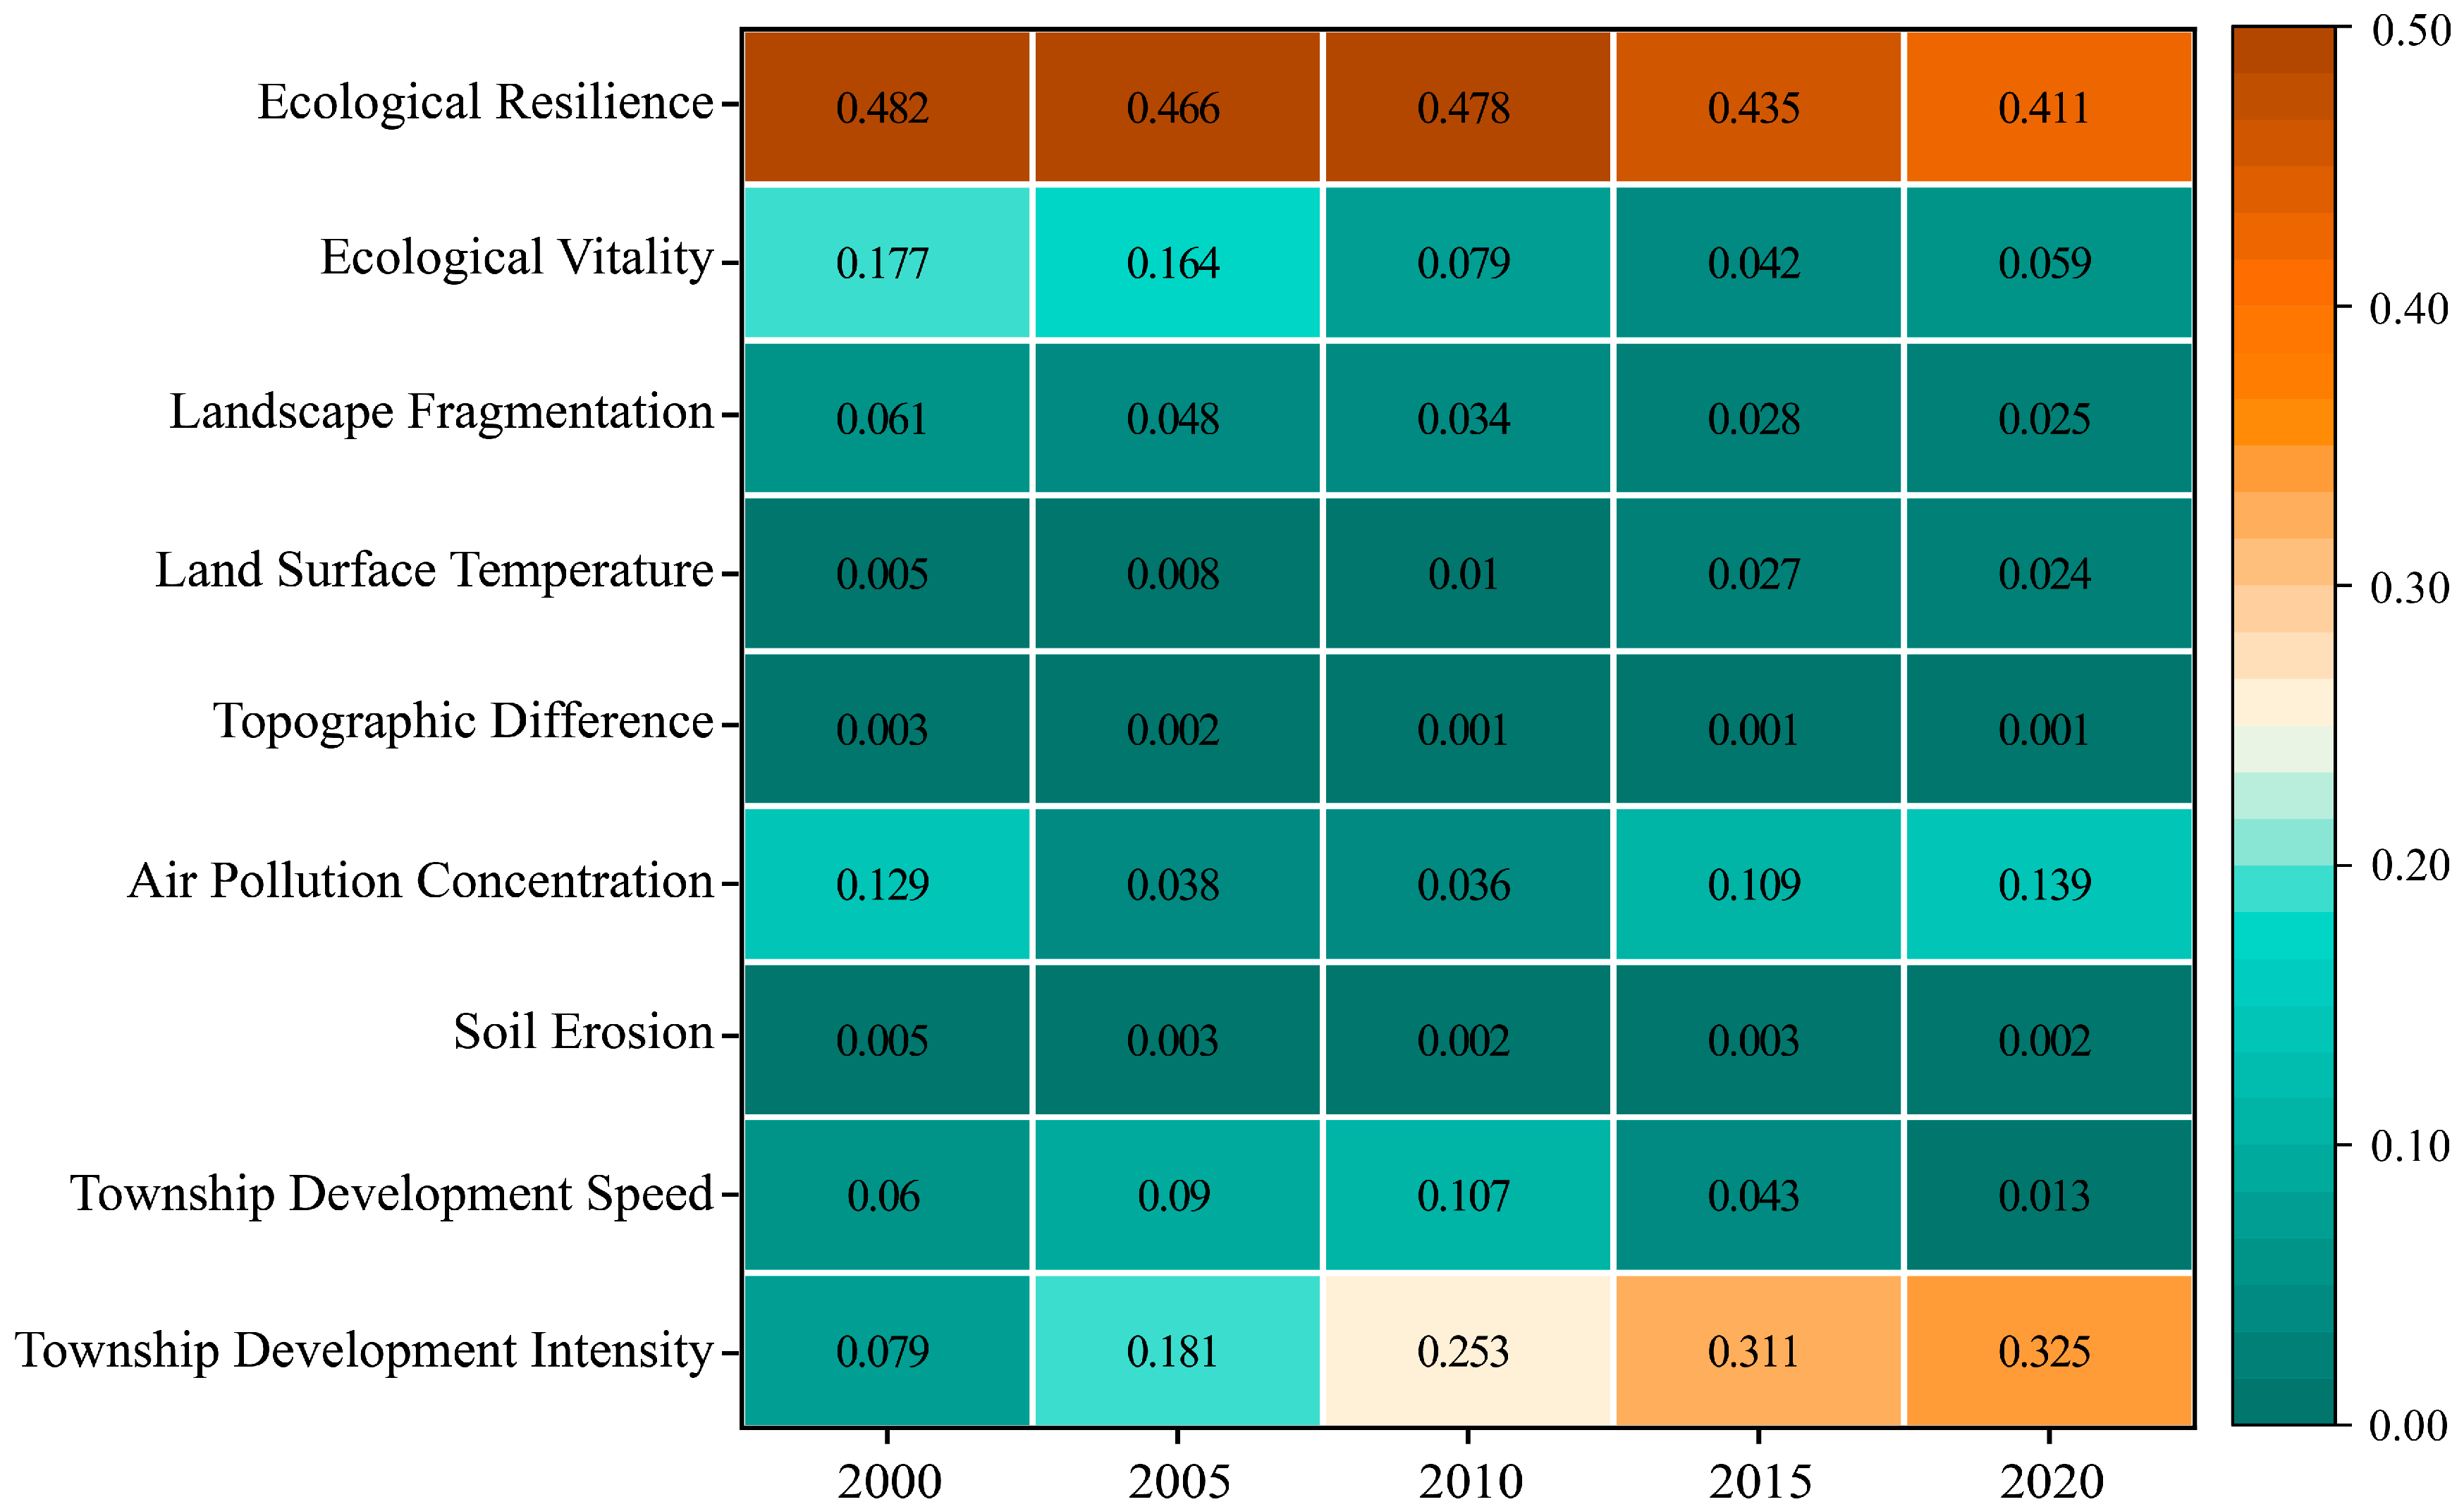
4.3. Influence of Different Subsystems on RES
4.4. Trend Analysis for RES
5. Discussion
5.1. Dynamic Change Law of Ecological Security
5.2. Recommendations for Future Enhancement of Ecological Security
6. Conclusions
- (1)
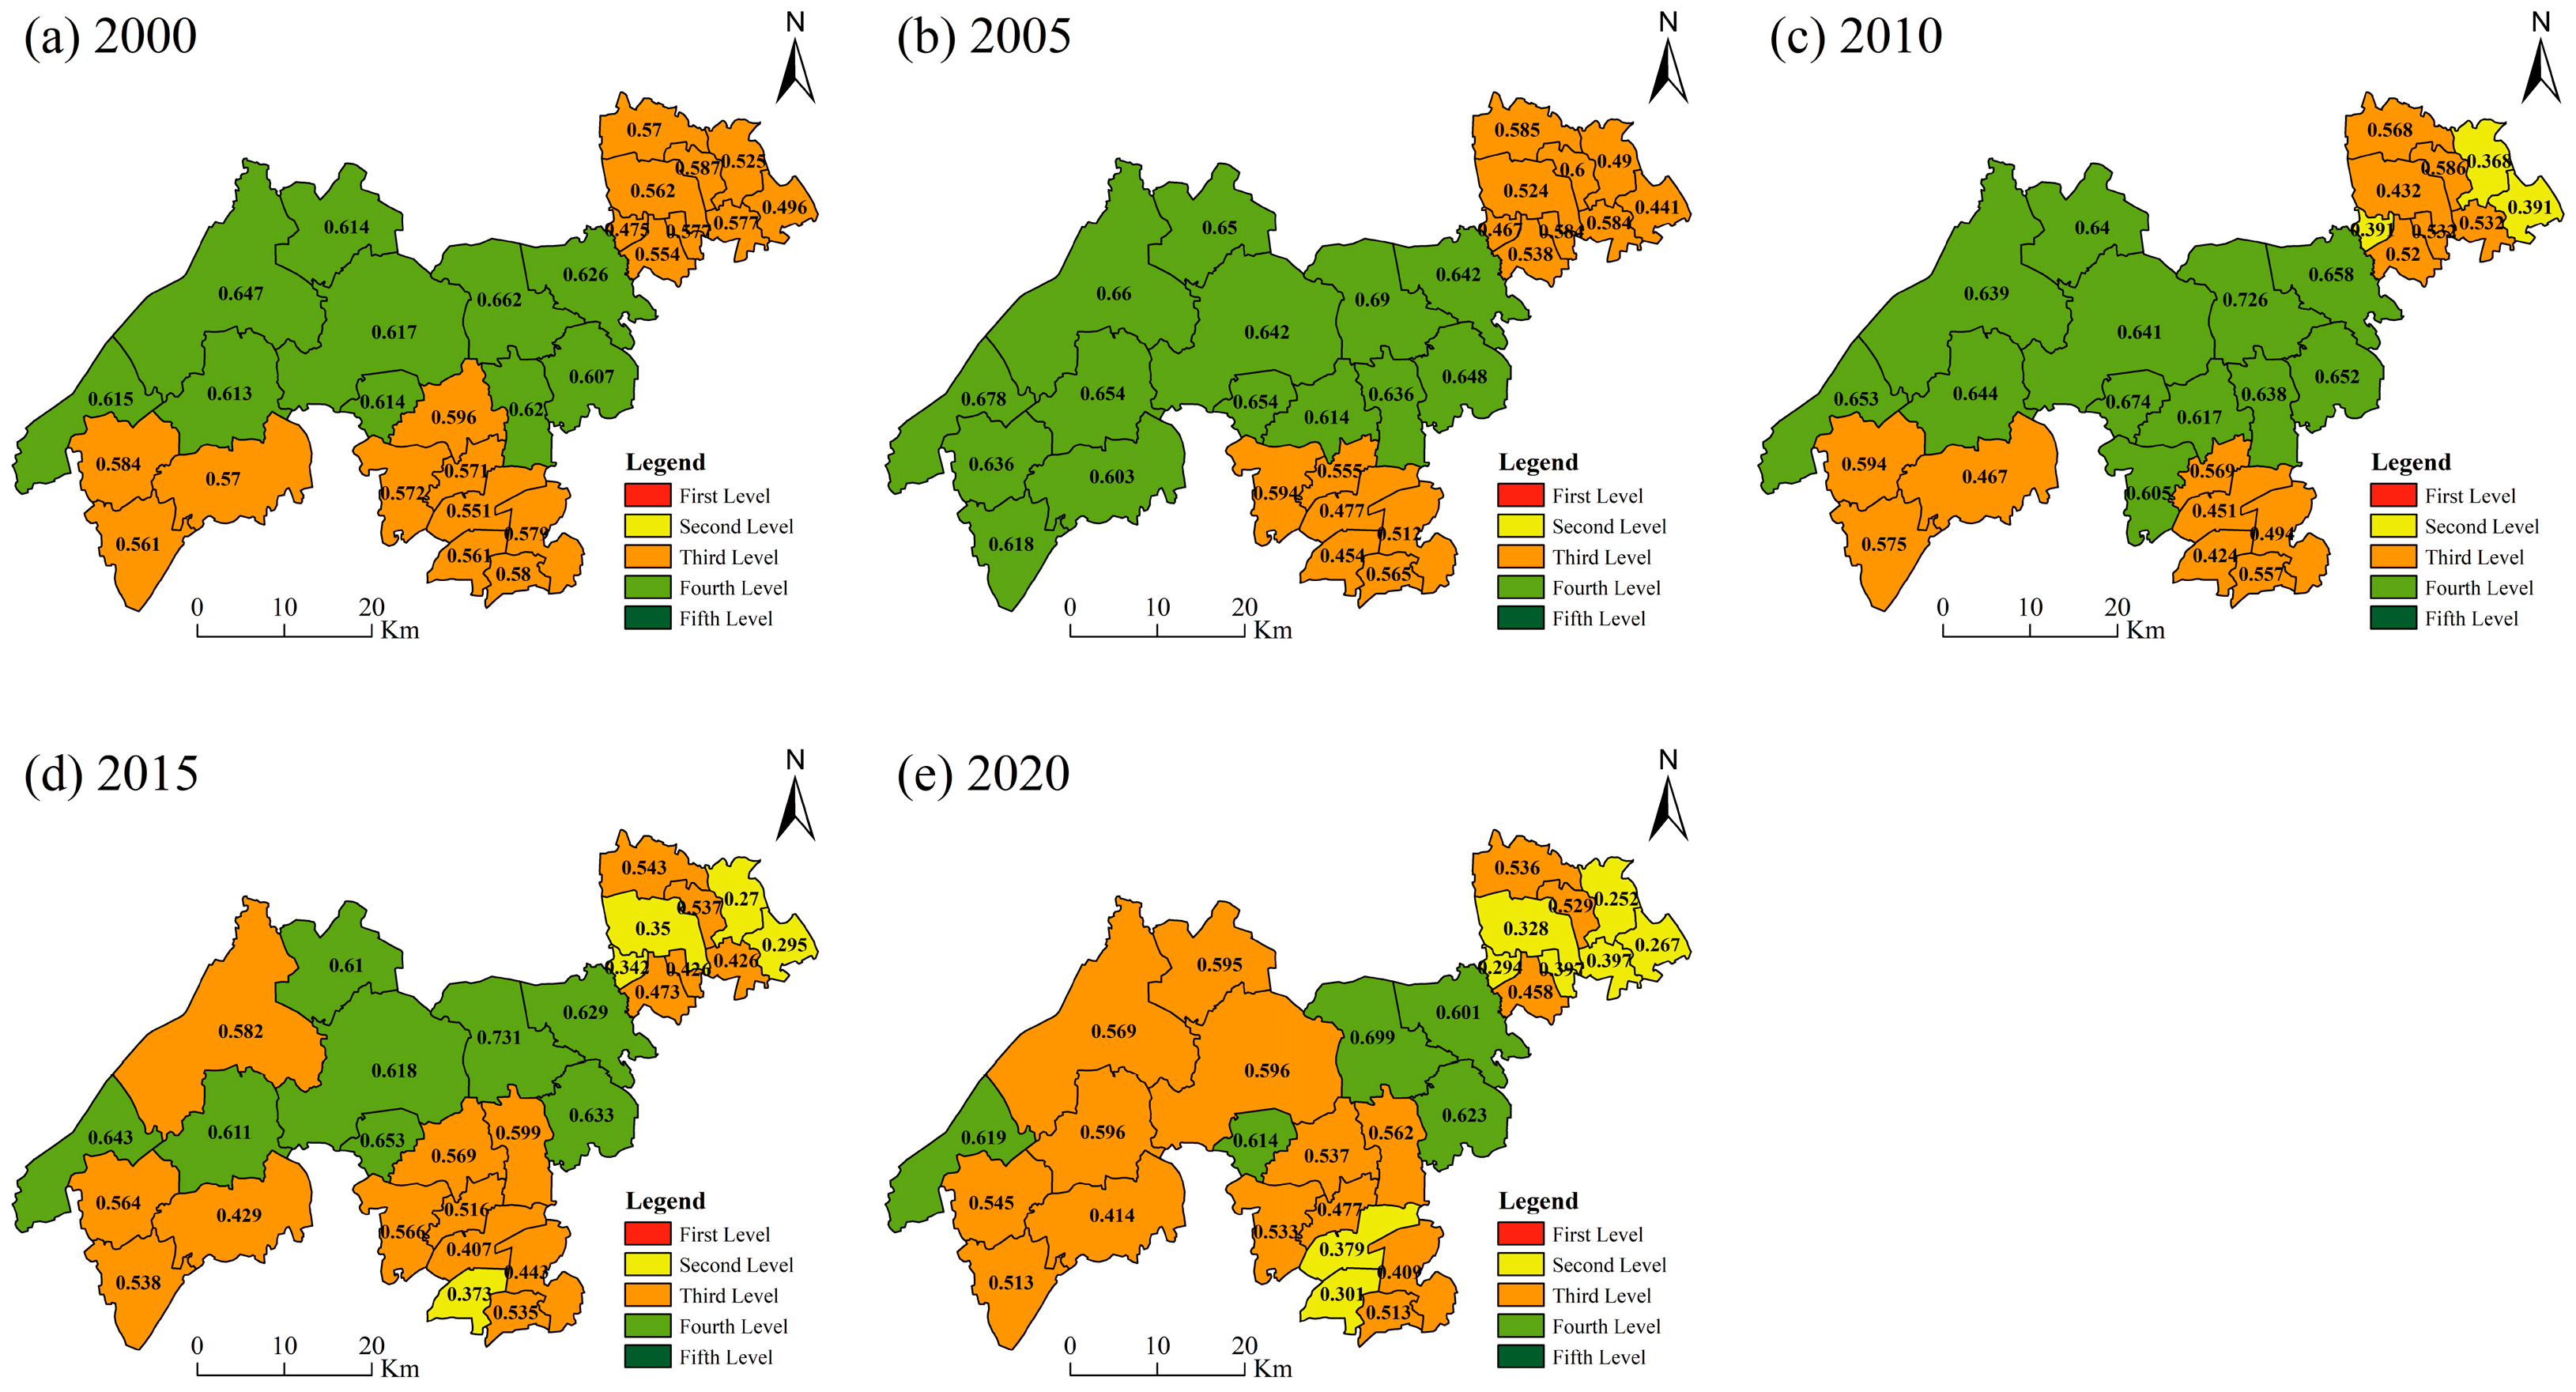
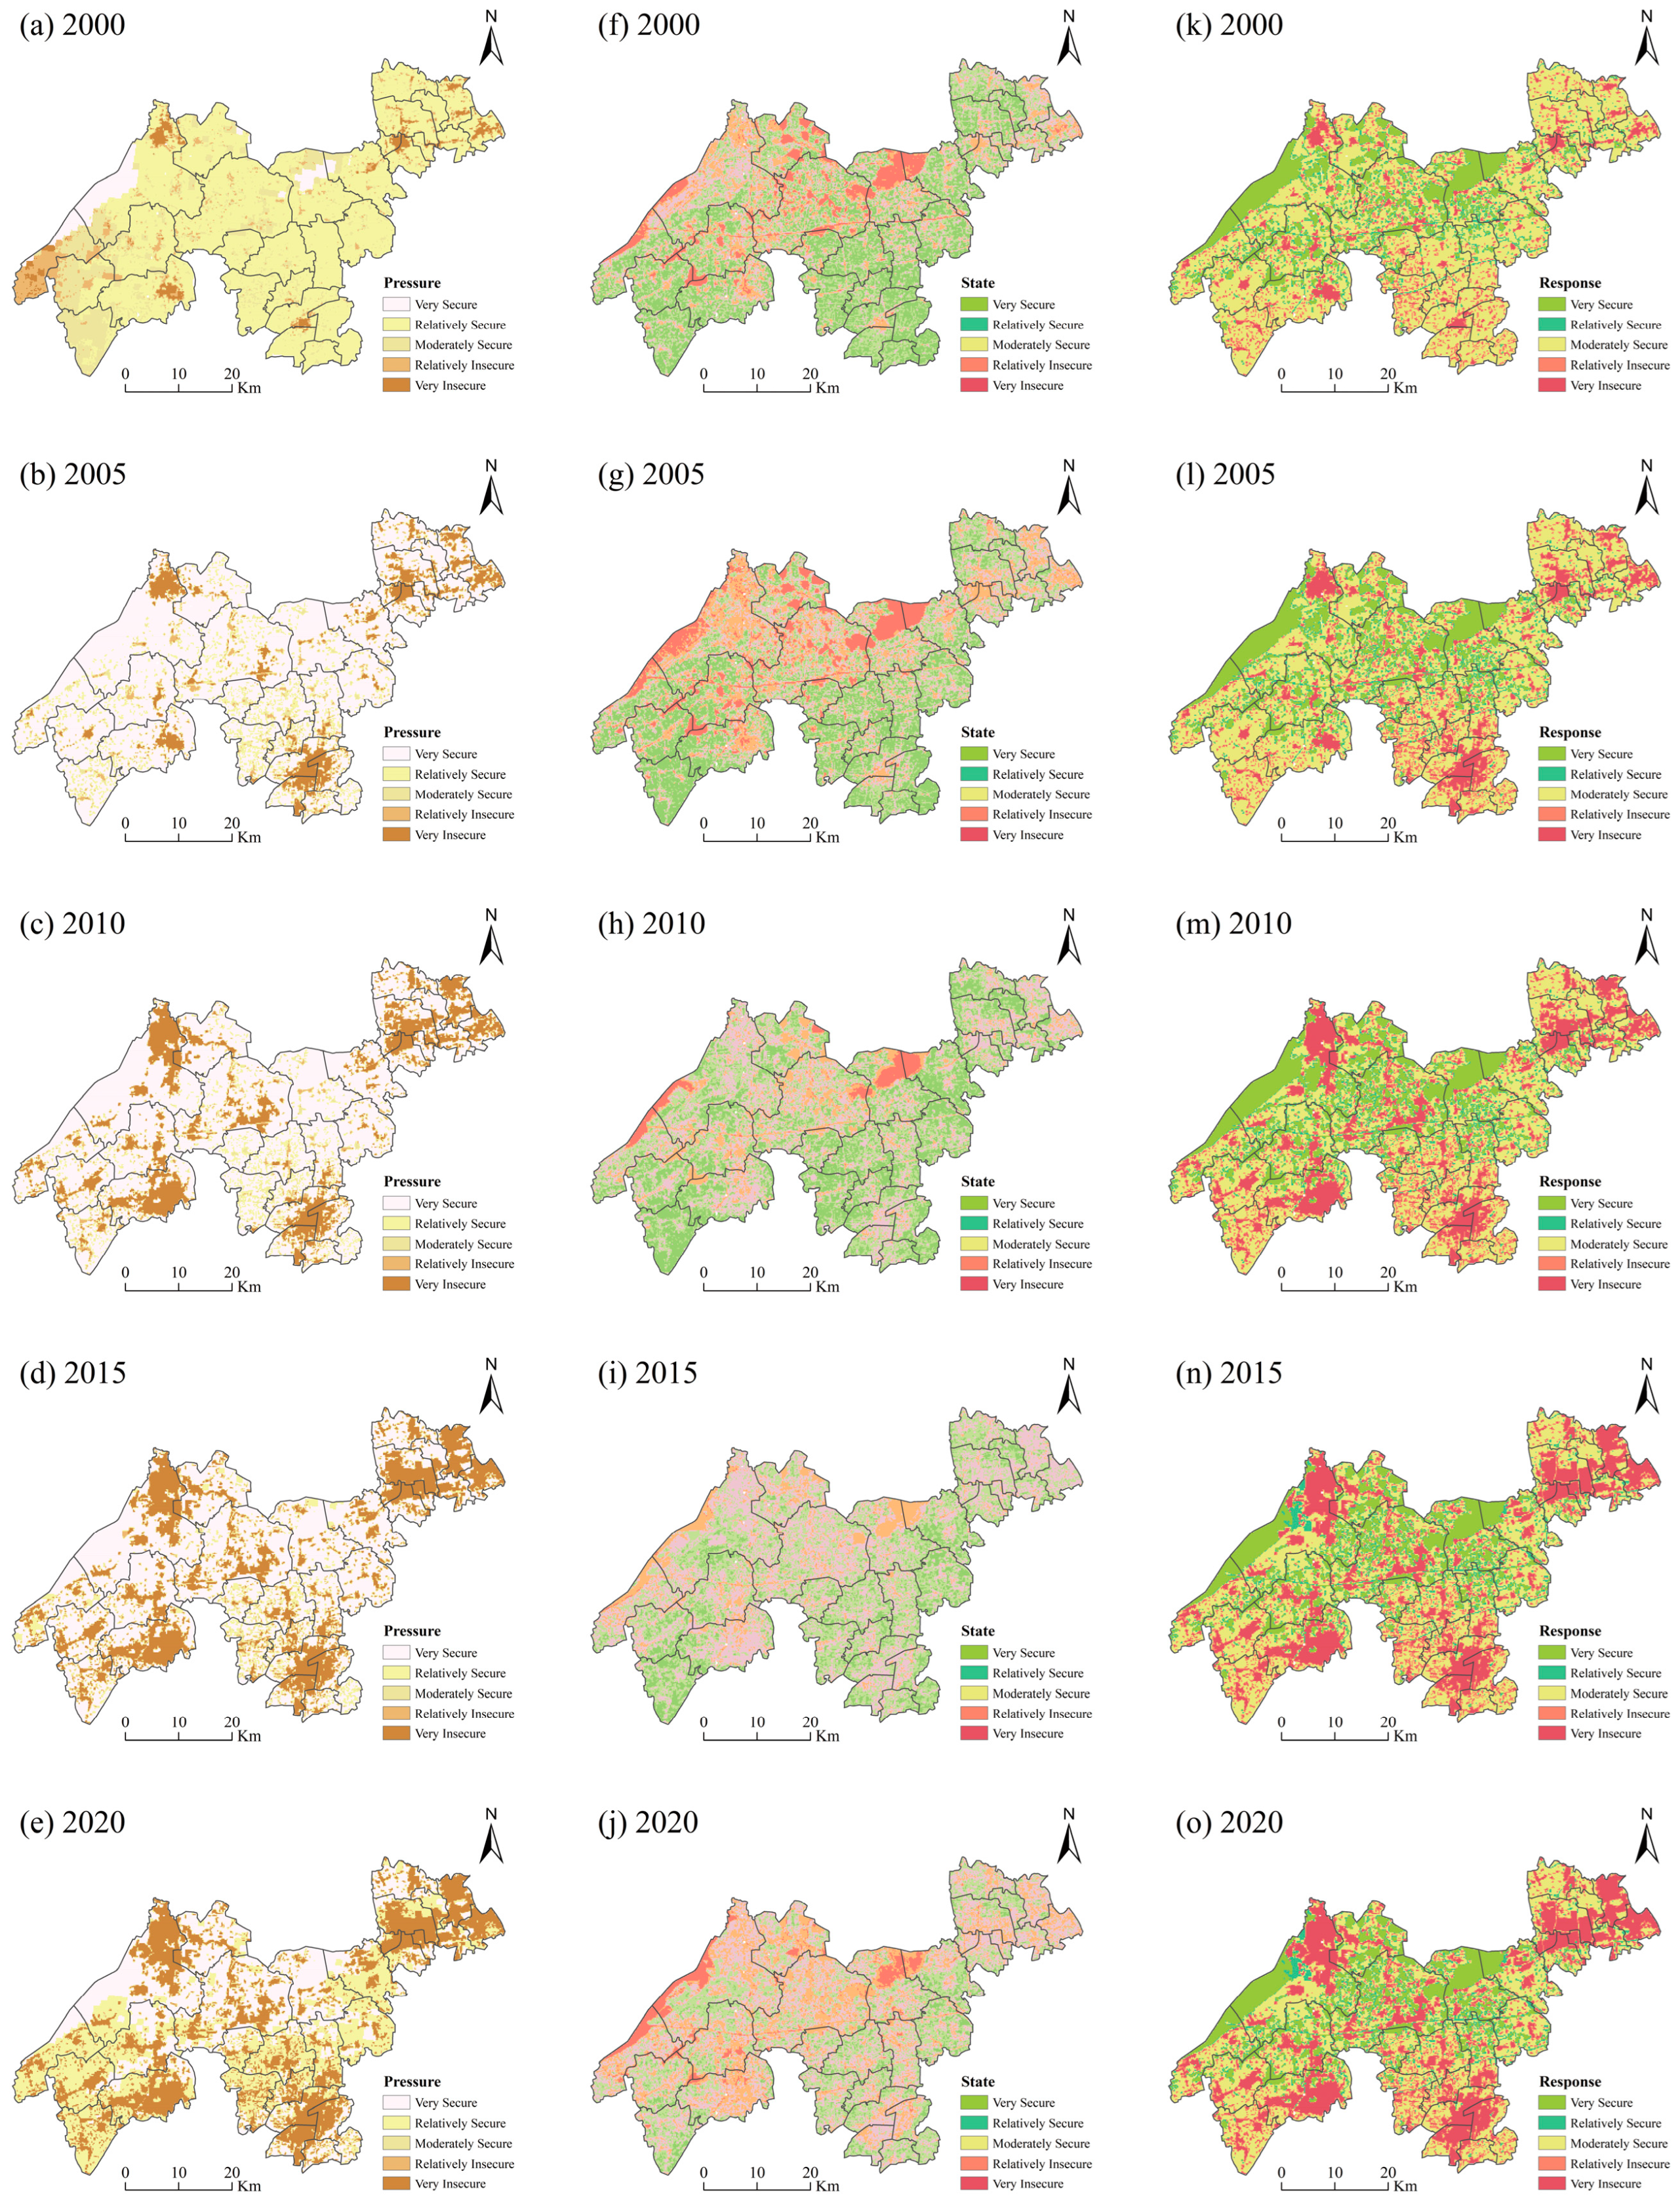
- From 2000 to 2020, the regional ecological security of the DZGIED first shows a trend of rising and then a slight decline overall. The RES decreased from 0.60 to 0.53. The ecological security level is kept above the critical security level. The areas with the highest RES levels are found in the regions that have the superior natural resources of Jiangnan. The lower RES level zones are mainly within the Wujiang electrooptical communication zone, the Jiashan Specialization Cluster, and the Qingpu Industrial Zone. They have a relatively high level of economic development, and the rapid expansion of industry and commerce may impact the ecological environment.
- (2)
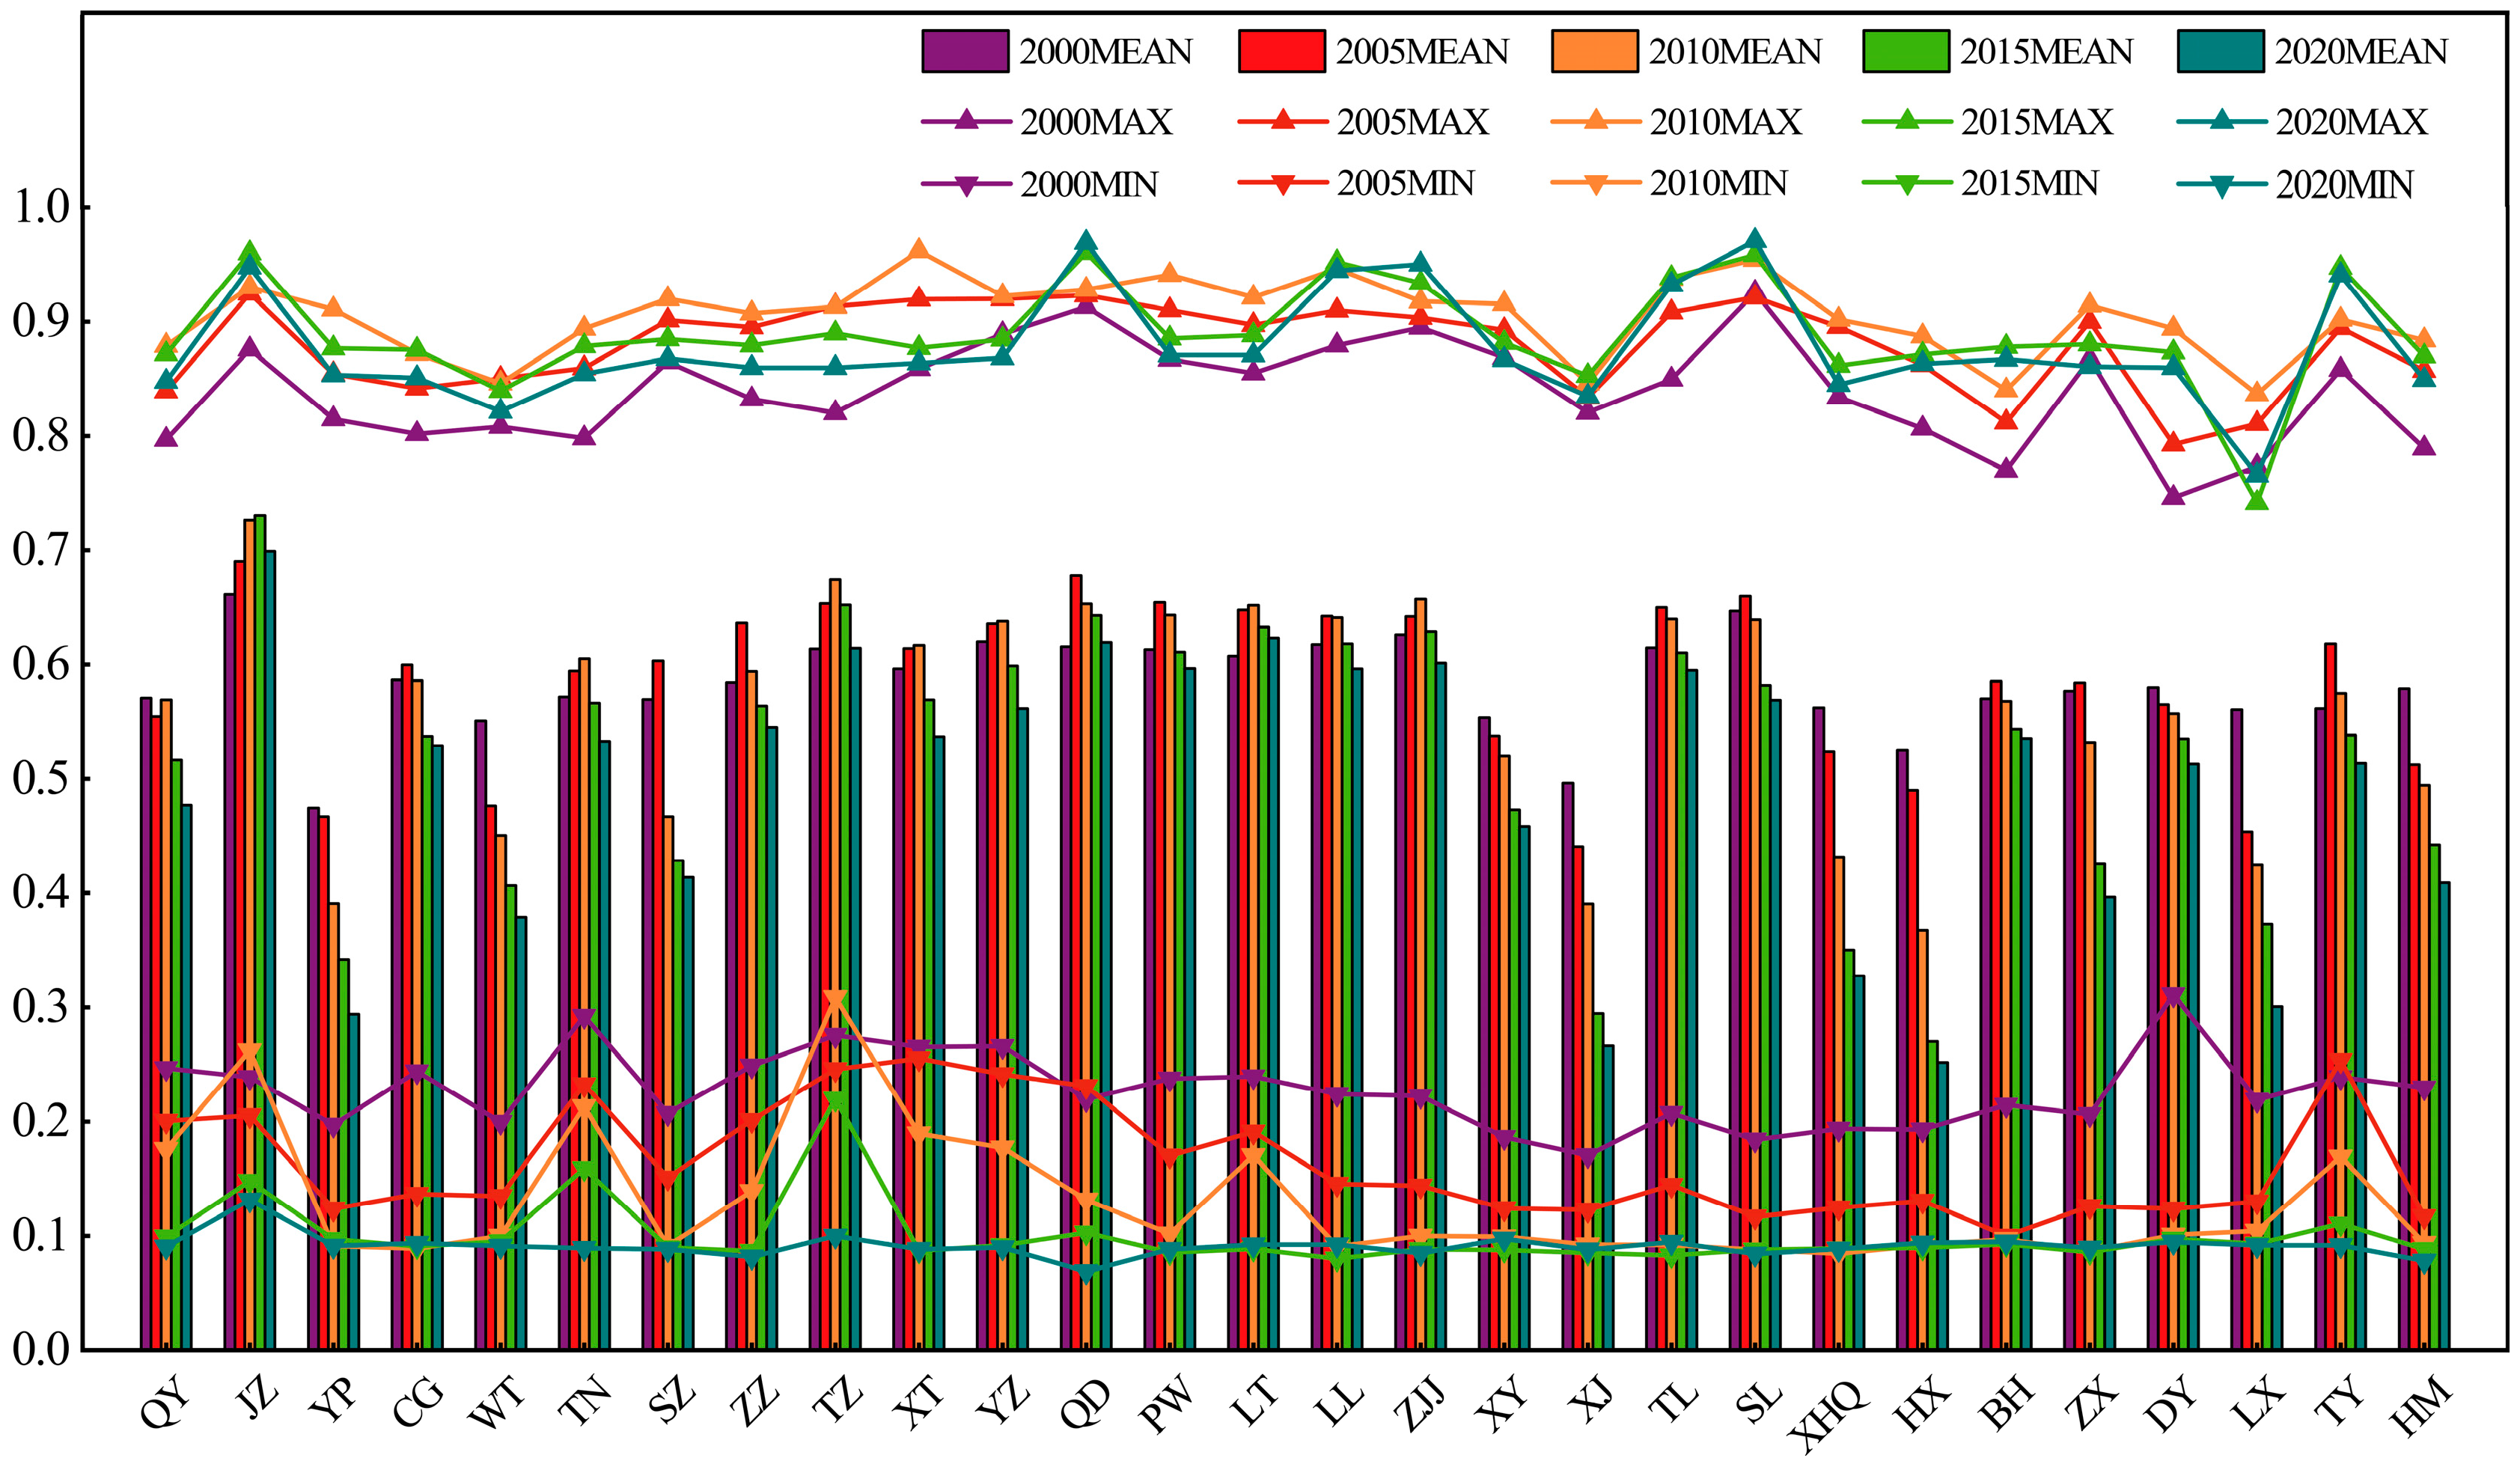
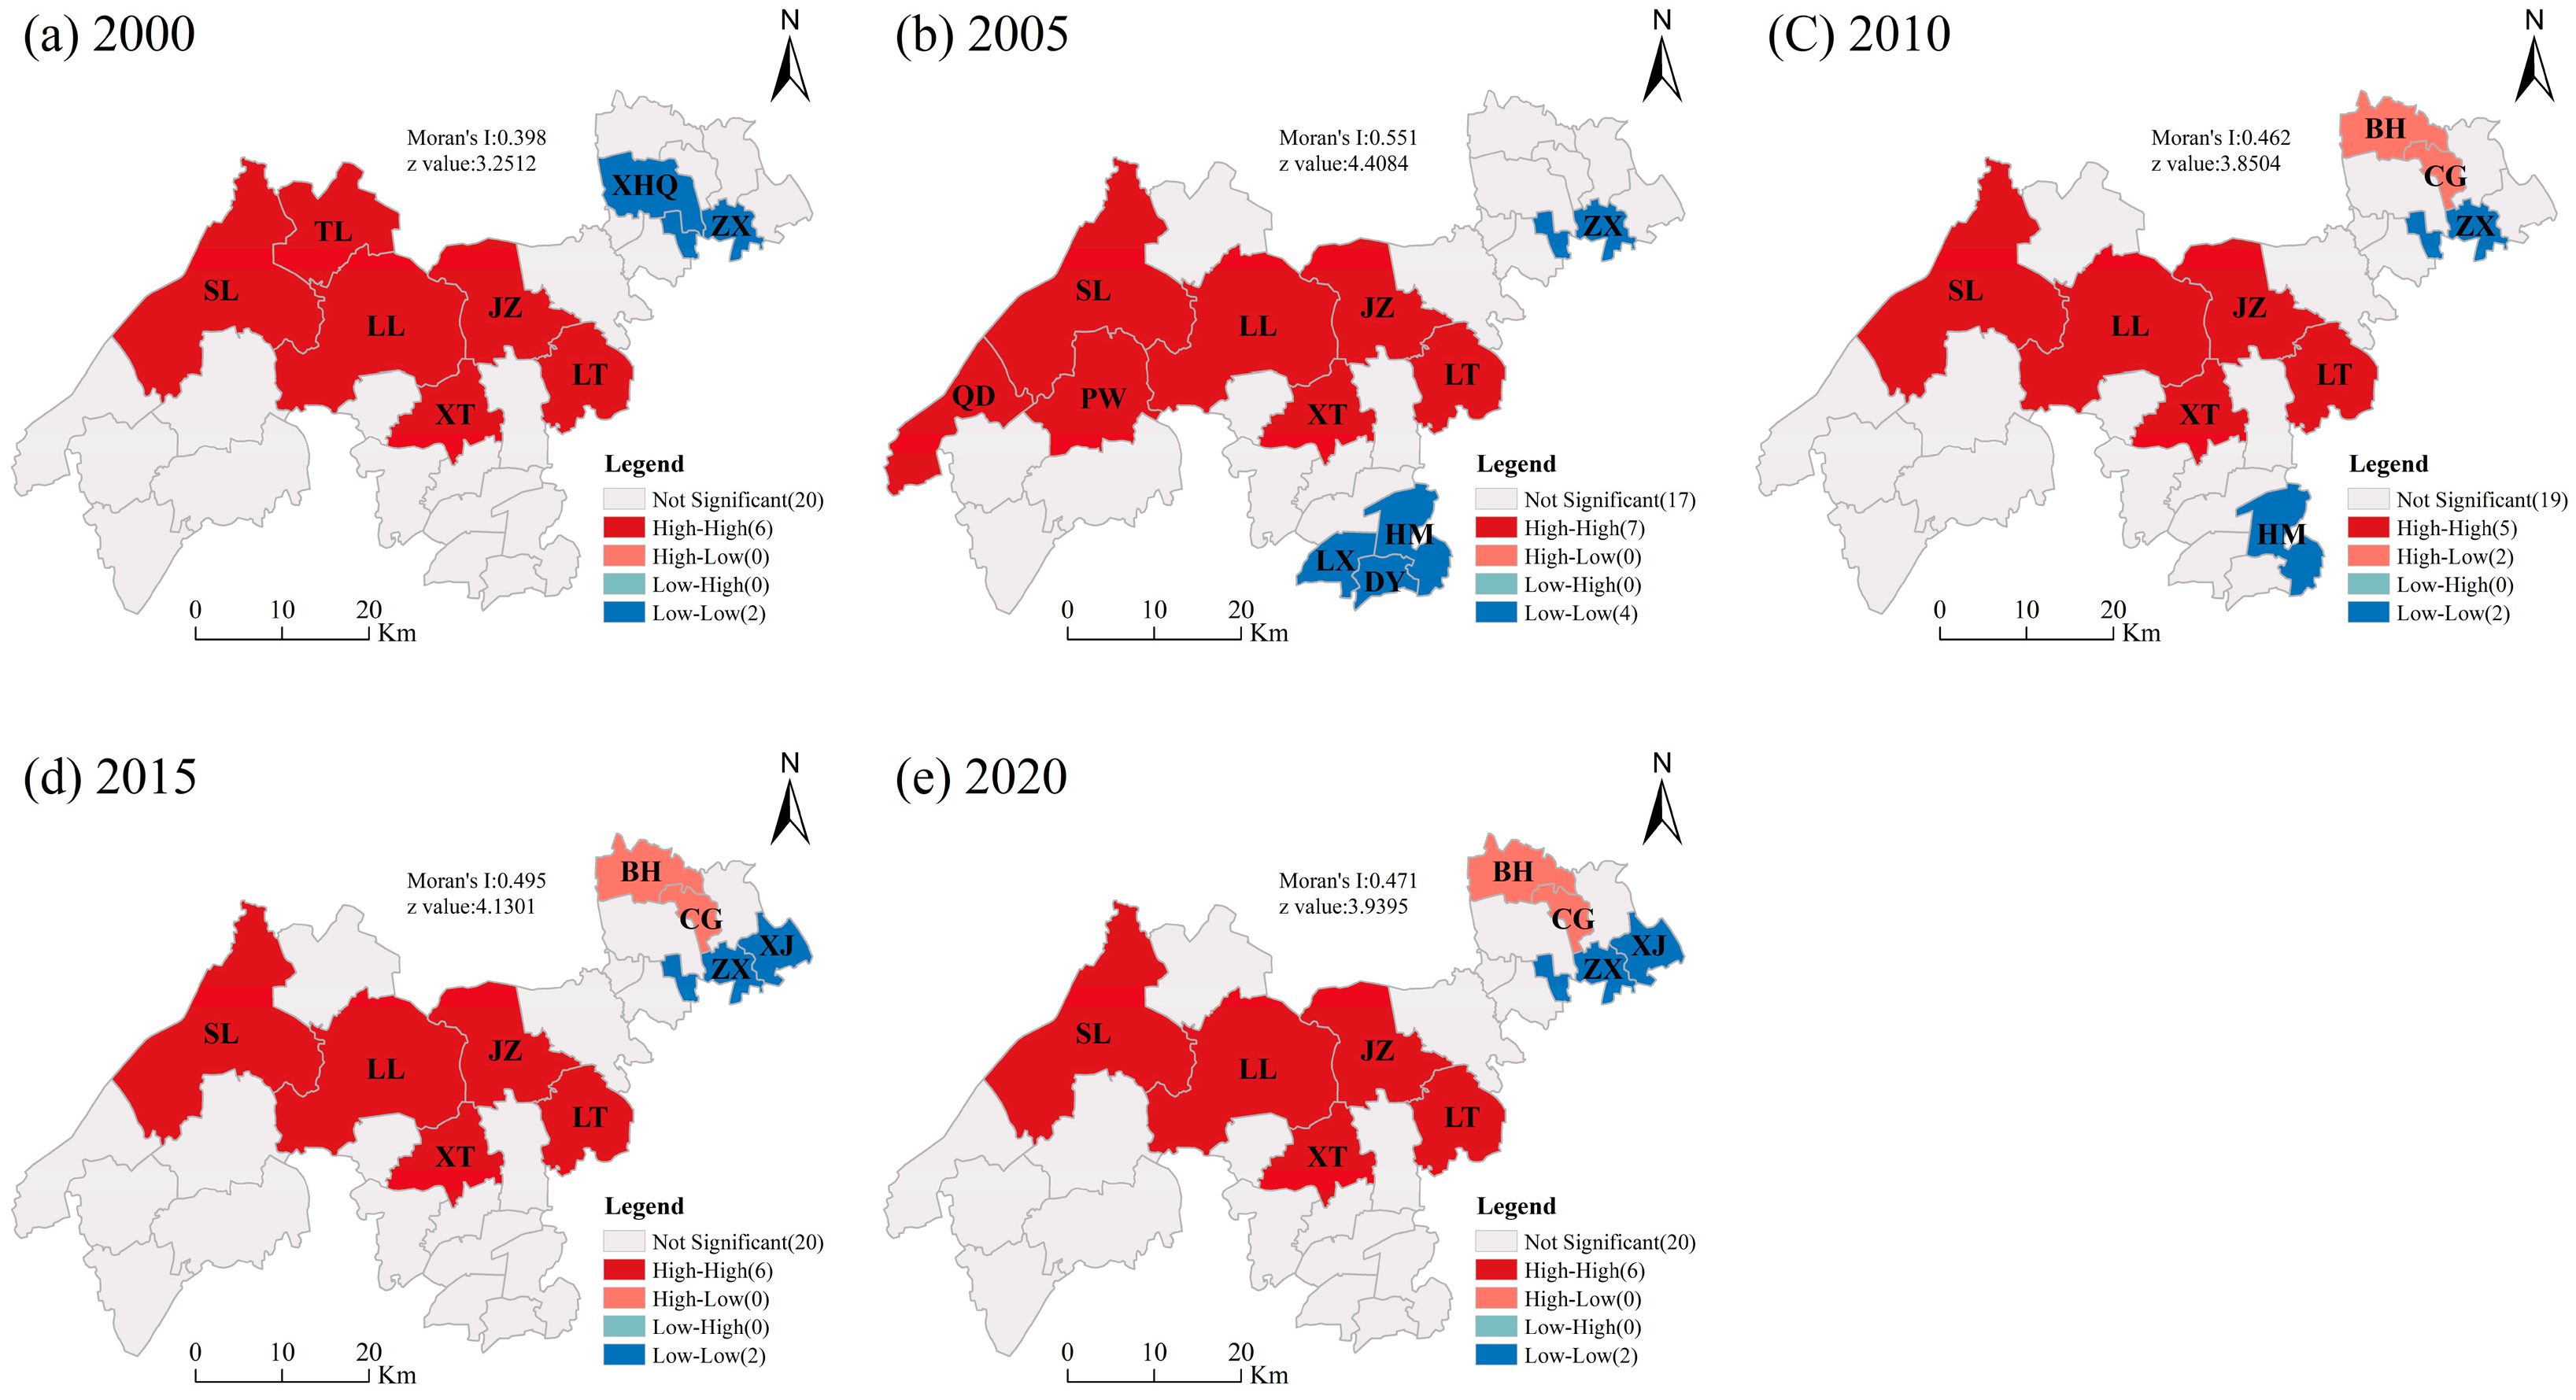
- The spatial differences in the ecological safety status among administrative districts are significant, and the RES of townships shows fluctuating changes. The spatial differences in the RES extremes are obvious. The streets are more urbanized, and the RES values are generally lower than those of townships. The ecological security situation of each township in the DZGIED presents a strong spatial autocorrelation. More than 80% of townships in the study area have positive spatial correlations. The cities with positive spatial correlations decreased in number slightly but remained essentially unchanged. The regional ecological security is more critical to the central area and the impact of environmental safety on the central area is more significant.
- (3)
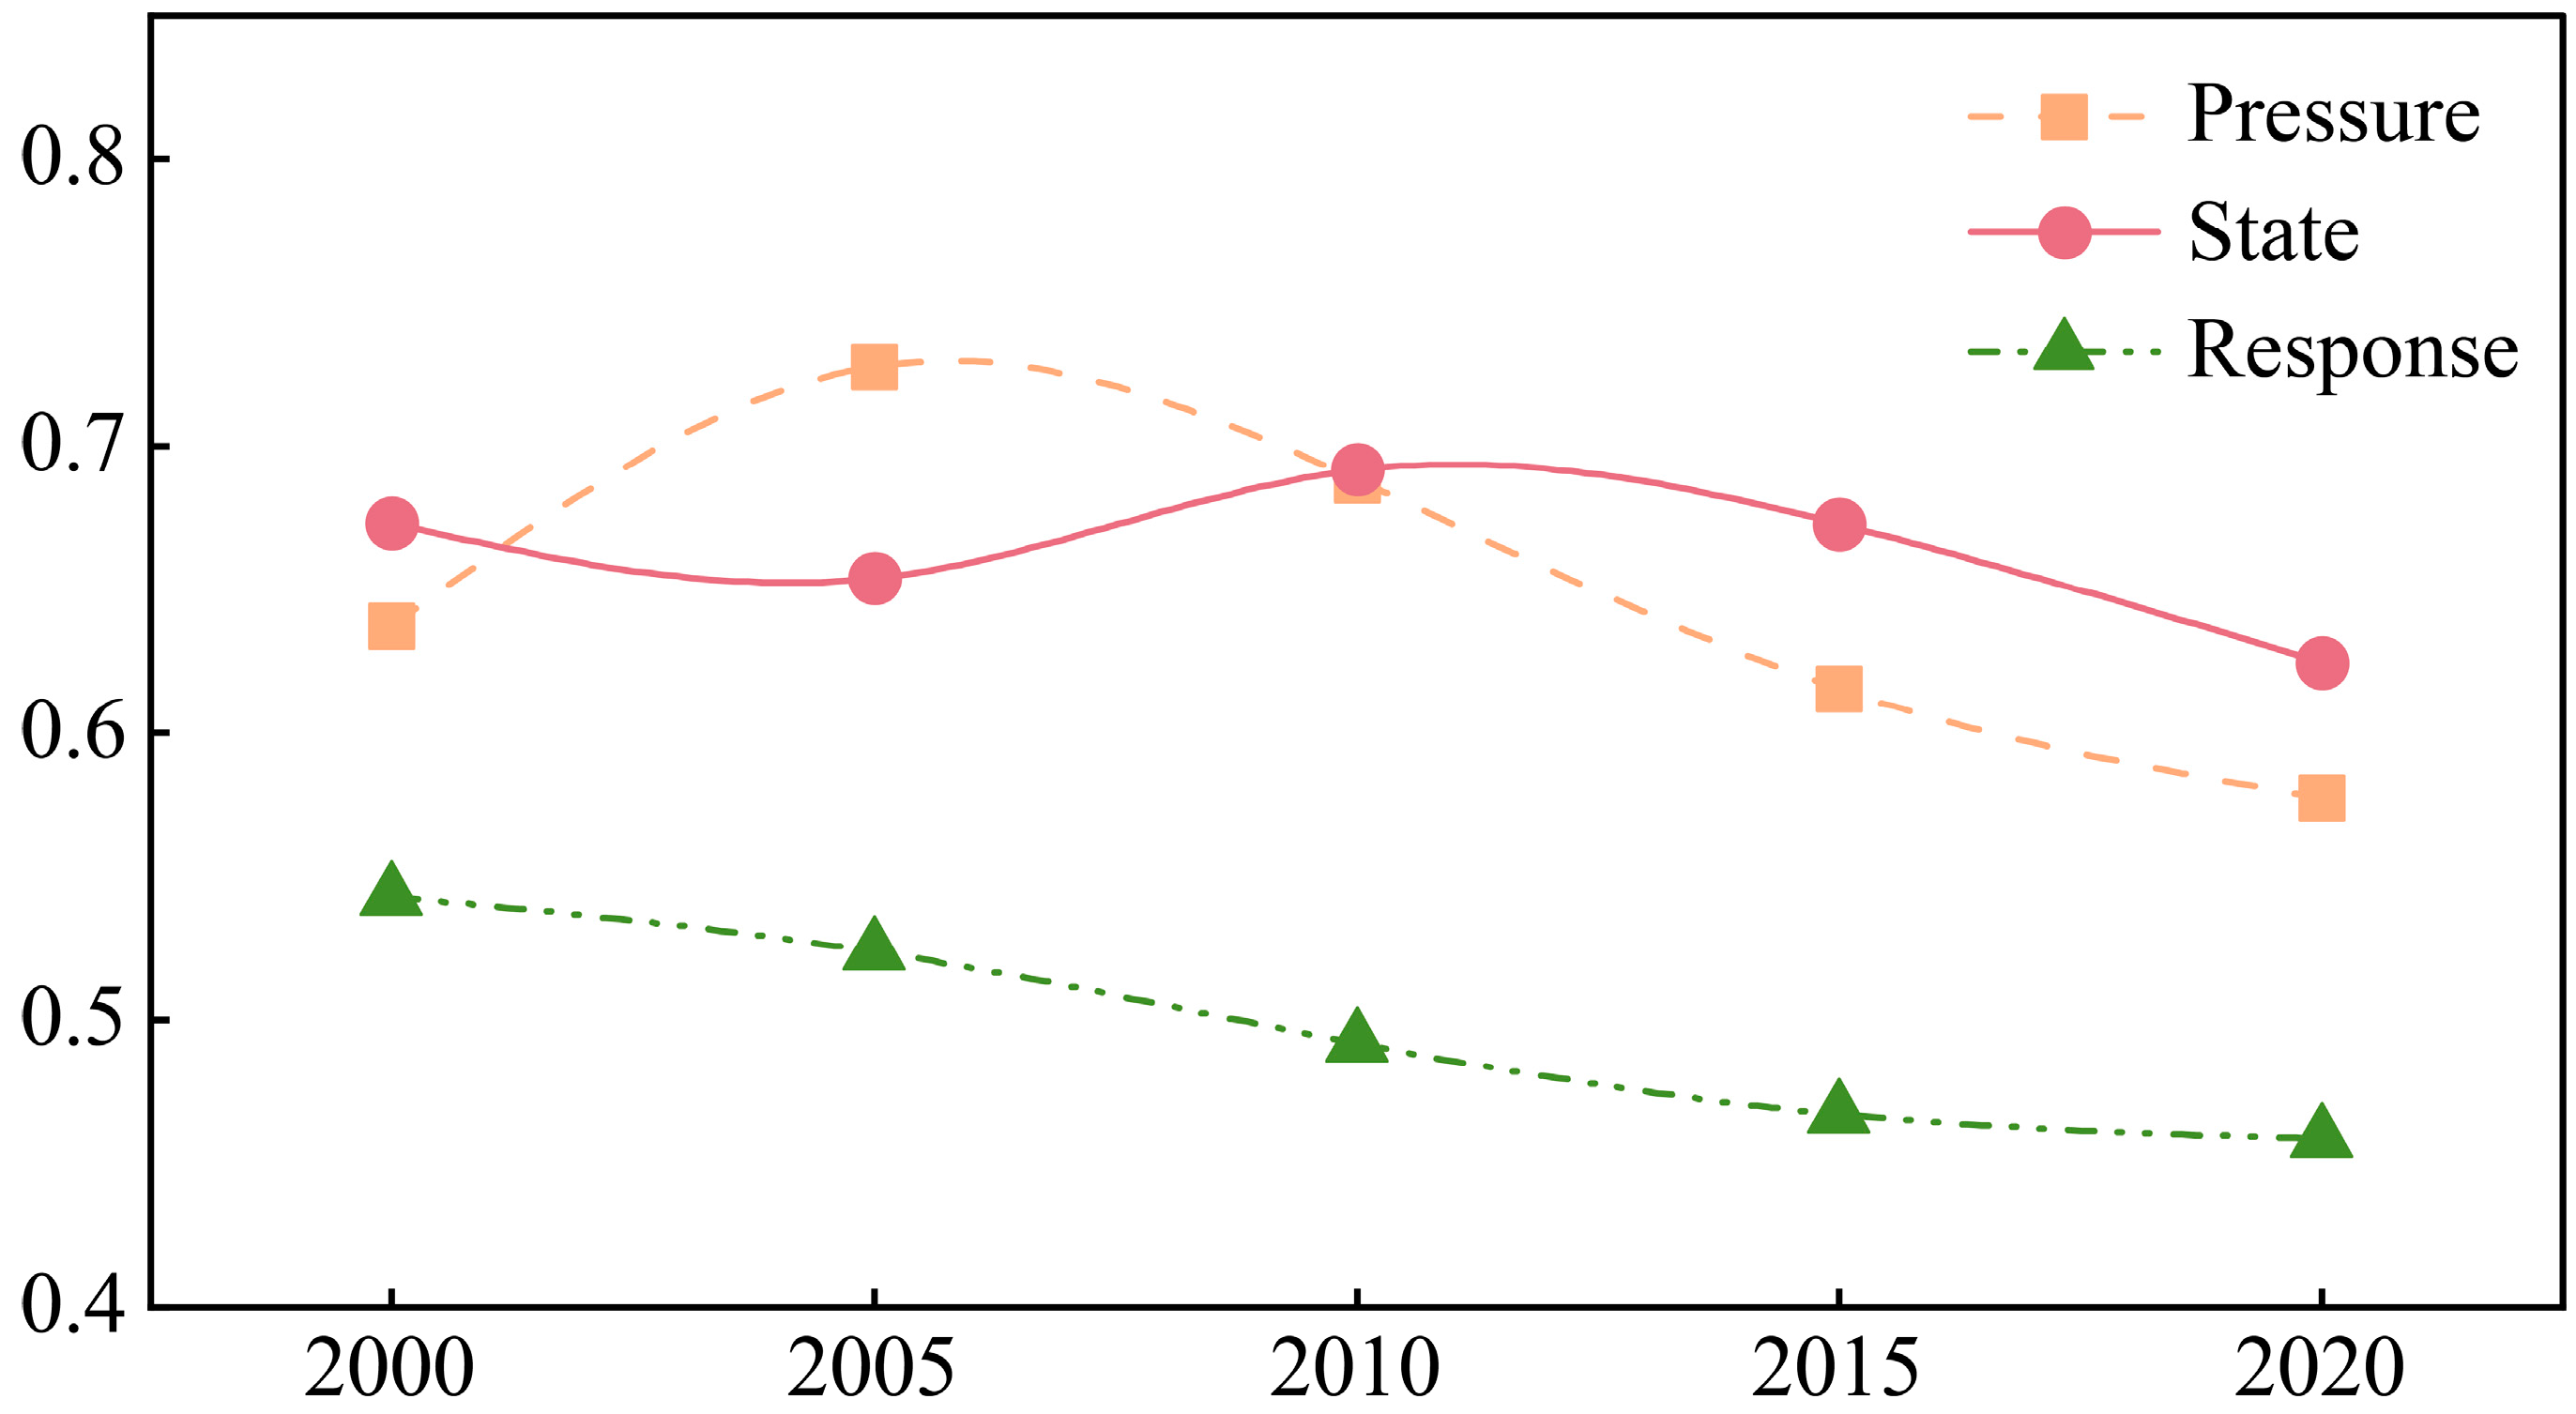
- Different subsystems of the regional ecosystem have other effects on ecological security. Among them, the ecological pressure subsystem is the most critical driver of the decline in environmental safety. The ecological state and response subsystems exacerbate the downward trend in ecological safety. Human disturbance is the crucial issue causing a deterioration in environmental security. Excessive land development is the direct driver of the ecological security decline in the demonstration zone. Ecological issues such as air pollution and urban heat islands also negatively impact the DZGIED’ s ecological security.
- (4)
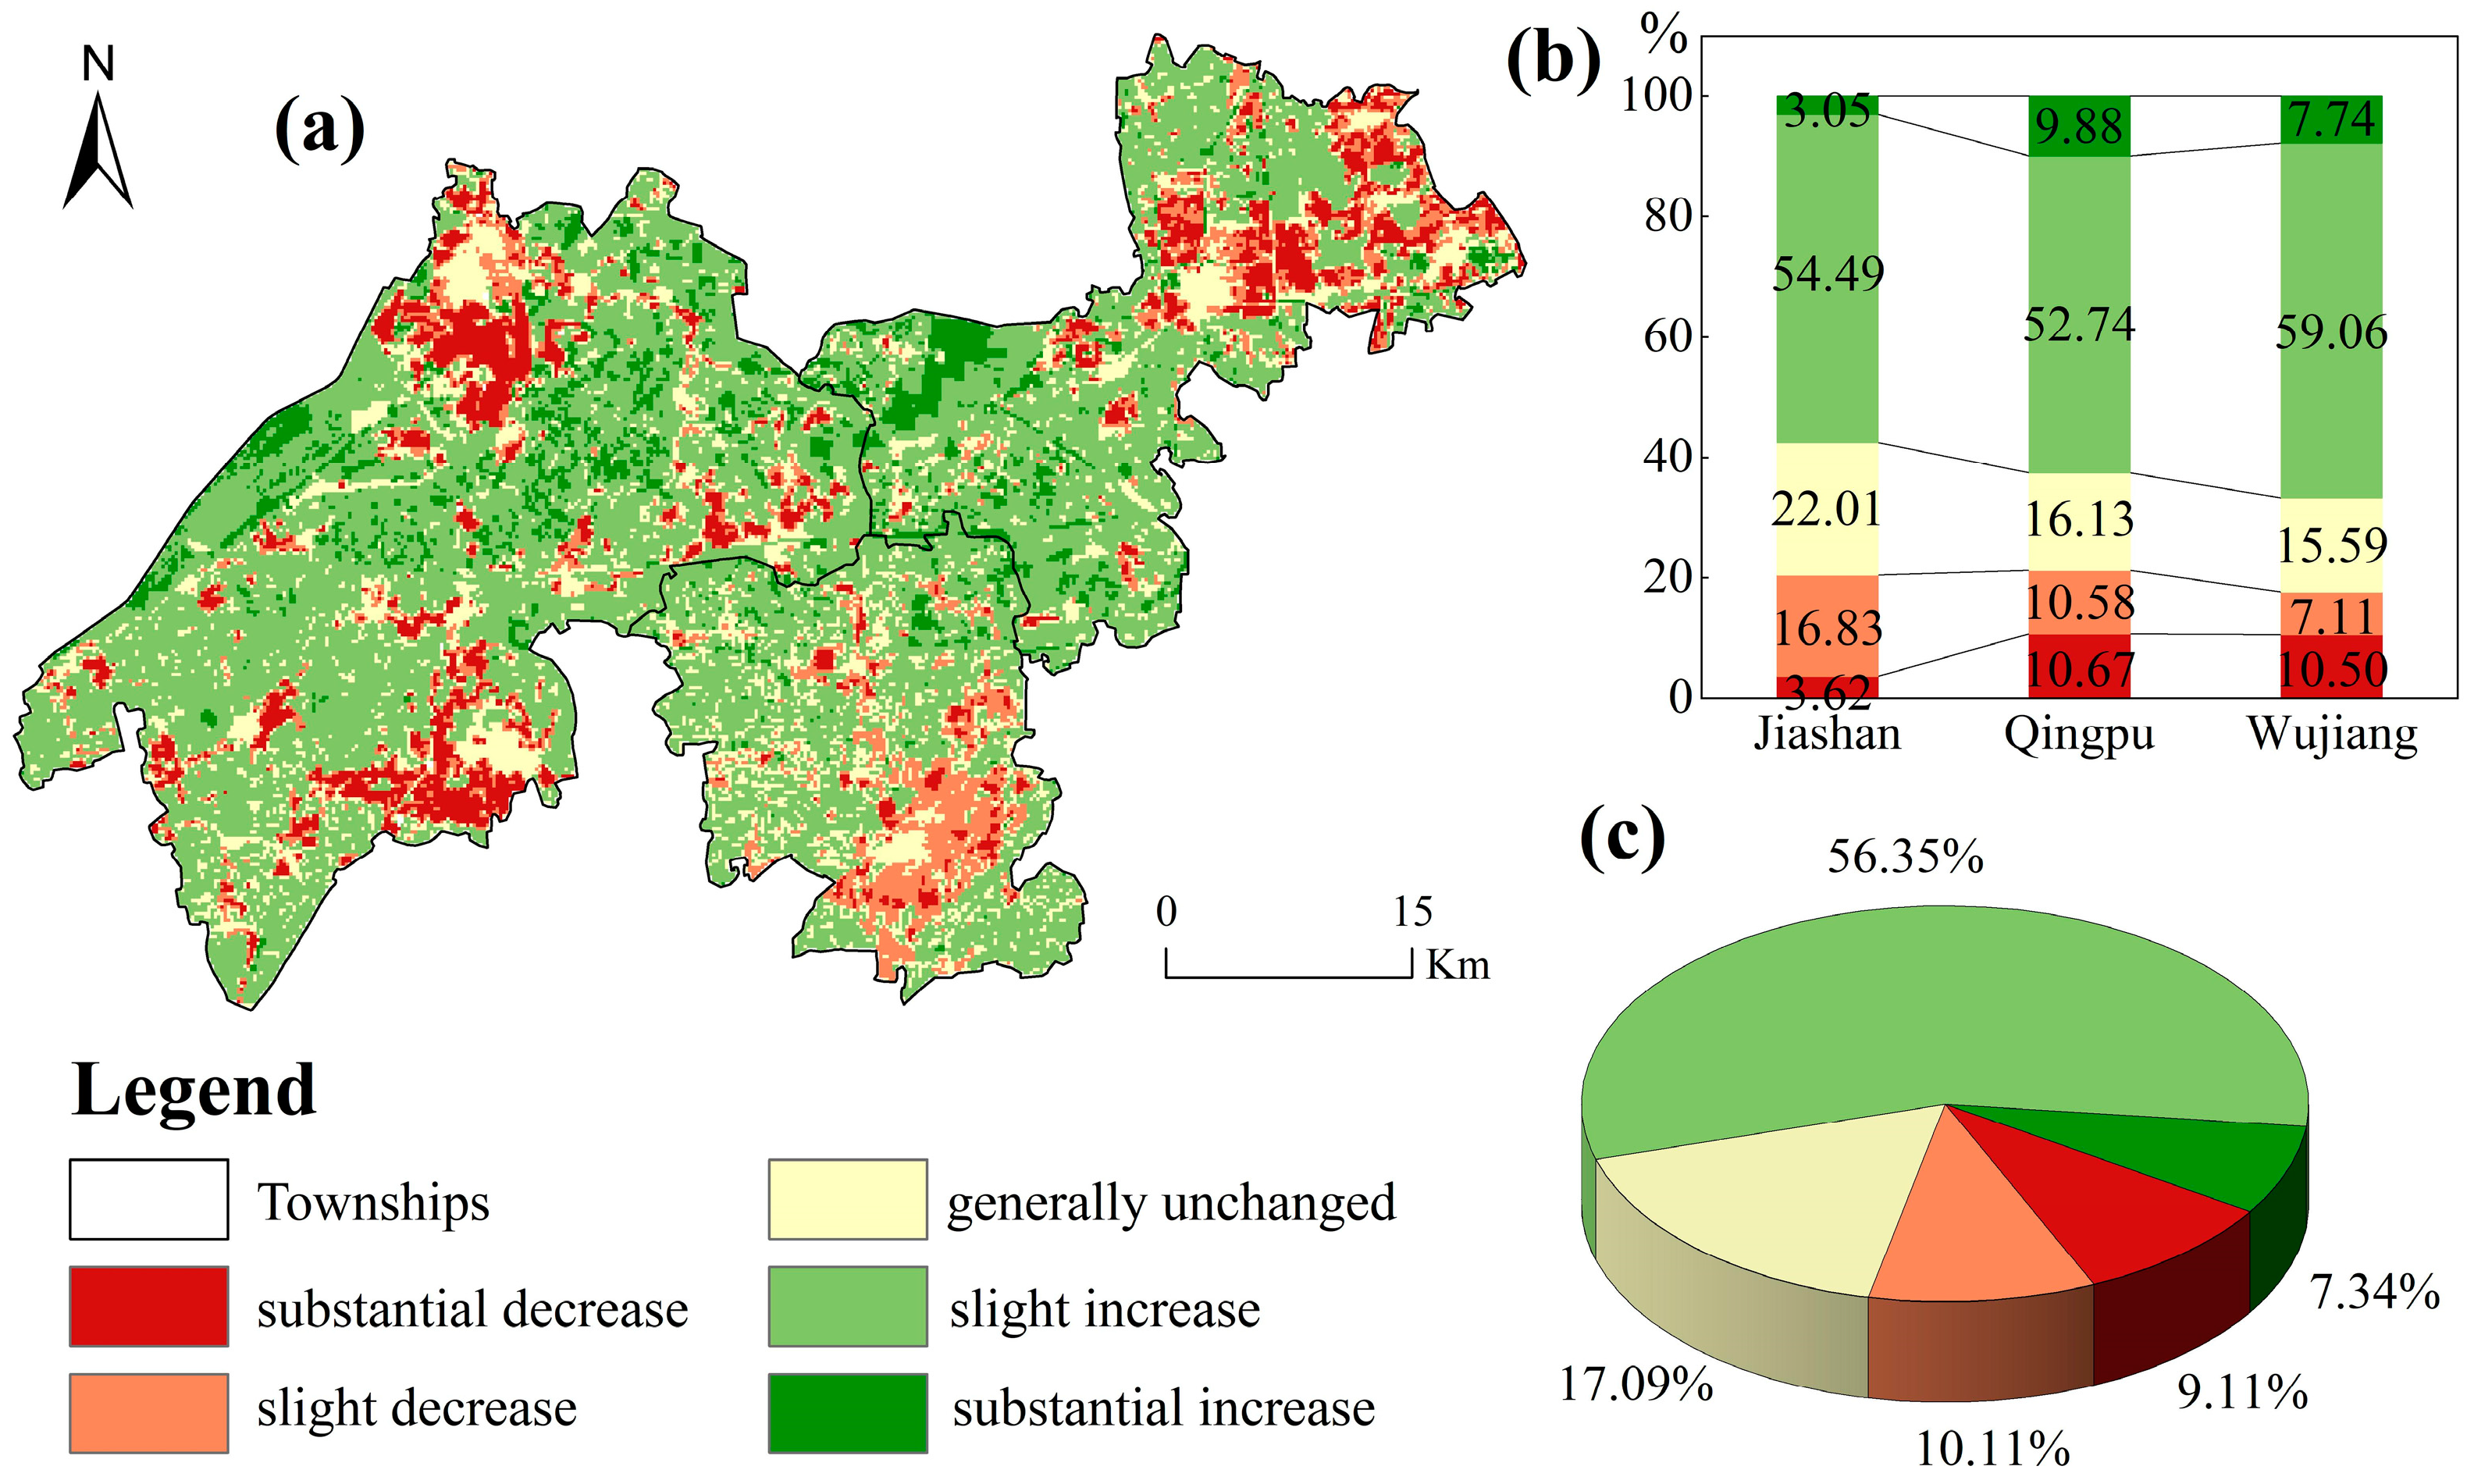
- The ecological security of the DZGIED generally shows an improving trend. Regions associated with significant increasing trends were identified around the DZGIED, specifically in the west, southwest, and southeast. Nonetheless, the increasing rate with which urbanization is occurring has still adversely affected specific regions.
Author Contributions
Funding
Data Availability Statement
Conflicts of Interest
References
- Ying, L.X.; Kong, L.Q.; Xiao, Y.; Ouyang, Z.Y. The research progress and prospect of ecological security and its assessing approaches. Acta Ecol. Sin. 2022, 42, 1679–1692. [Google Scholar] [CrossRef]
- Deng, H.D.; Ye, L.F.; Liu, L.X. Review of urban ecological security research. J. Environ. Eng. Technol. 2022, 12, 248–259. [Google Scholar] [CrossRef]
- Wang, L.; Pang, Y.S. A Review of Regional Ecological Security Evaluation. Appl. Mech. Mater. 2012, 178–181, 337–344. [Google Scholar] [CrossRef]
- Huang, J.; Yu, H.; Han, D.; Zhang, G.; Wei, Y.; Huang, J.; An, L.; Liu, X.; Ren, Y. Declines in global ecological security under climate change. Ecol. Indic. 2020, 117, 106651. [Google Scholar] [CrossRef]
- Tian, S.; Zhang, Y.; Xu, Y.; Wang, Q.; Yuan, X.; Ma, Q.; Chen, L.; Ma, H.; Xu, Y.; Yang, S.; et al. Urban ecological security assessment and path regulation for ecological protection—A case study of Shenzhen, China. Ecol. Indic. 2022, 145, 109717. [Google Scholar] [CrossRef]
- R Edward Grumbine. Assessing environmental security in China. Front. Ecol. Environ. 2014, 12, 403–411. [Google Scholar] [CrossRef] [PubMed]
- Alberti, M.; Marzluff, J.M. Ecological resilience in urban ecosystems: Linking urban patterns to human and ecological functions. Urban Ecosyst. 2004, 7, 241–265. [Google Scholar] [CrossRef]
- Zou, C.; Zhu, J.; Lou, K.; Yang, L. Coupling coordination and spatiotemporal heterogeneity between urbanization and ecological environment in Shaanxi Province, China. Ecol. Indic. 2022, 141, 109152. [Google Scholar] [CrossRef]
- Shi, Z.; Wang, Y.; Zhao, Q. Analysis of Spatiotemporal Changes of Ecological Environment Quality and Its Coupling Coordination with Urbanization in the Yangtze River Delta Urban Agglomeration, China. Int. J. Environ. Res. Public Health 2023, 20, 1627. [Google Scholar] [CrossRef]
- Li, W.; Yi, P.; Zhang, D.; Zhou, Y. Assessment of coordinated development between social economy and ecological environment: Case study of resource-based cities in Northeastern China. Sustain. Cities Soc. 2020, 59, 102208. [Google Scholar] [CrossRef]
- Chen, Q.; Zhu, M.; Zhang, C.; Zhou, Q. The driving effect of spatial-temporal difference of water resources carrying capacity in the Yellow River Basin. J. Clean. Prod. 2023, 388, 135709. [Google Scholar] [CrossRef]
- Jin, W.; Cui, Y.; Wu, S.; Cheng, D. Ecological risk resonance of urbanization and its effect on geohazard disaster: The case of Freetown, Sierra Leone. Urban Ecosyst. 2020, 23, 1141–1152. [Google Scholar] [CrossRef]
- Sun, X. Green city and regional environmental economic evaluation based on entropy method and GIS. Environ. Technol. Innov. 2021, 23, 101667. [Google Scholar] [CrossRef]
- Zhang, M.; Bao, Y.; Xu, J.; Han, A.; Liu, X.; Zhang, J.; Tong, Z. Ecological security evaluation and ecological regulation approach of East-Liao River basin based on ecological function area. Ecol. Indic. 2021, 132, 108255. [Google Scholar] [CrossRef]
- Fang, C.L.; Zhang, X.L. The progress of ecological reconstruction and economic sustainable development in arid region. Acta Ecol. Sin. 2001, 21, 1163–1170. [Google Scholar] [CrossRef]
- Pirages, D. Ecological Security: Micro-Threats to Human Well-Being. In People and Their Planet: Searching for Balance; Baudot, B.S., Moomaw, W.R., Eds.; Palgrave Macmillan: London, UK, 1999; pp. 284–298. ISBN 978-1-349-27184-9. [Google Scholar]
- People and their Planet: Searching for Balance; Baudot, B.S.; Moomaw, W.R. (Eds.) Palgrave Macmillan: London, UK, 1999; ISBN 978-1-349-27184-9. [Google Scholar]
- Zou, C.X.; Shen, W.S. Advances in ecological security. J. Ecol. Rural. Environ. 2003, 19, 56–59. [Google Scholar] [CrossRef]
- Villanueva, X.; Villarroel, J.D.; Antón, A. Environmental Awareness and Its Relationship with the Concept of the Living Being: A Longitudinal Study. Sustainability 2018, 10, 2358. [Google Scholar] [CrossRef]
- Liu, C.; Li, W.; Xu, J.; Zhou, H.; Li, C.; Wang, W. Global trends and characteristics of ecological security research in the early 21st century: A literature review and bibliometric analysis. Ecol. Indic. 2022, 137, 108734. [Google Scholar] [CrossRef]
- Calculli, C.; D’Uggento, A.M.; Labarile, A.; Ribecco, N. Evaluating people’s awareness about climate changes and environmental issues: A case study. J. Clean. Prod. 2021, 324, 129244. [Google Scholar] [CrossRef]
- Janoušková, S.; Hák, T.; Nečas, V.; Moldan, B. Sustainable Development—A Poorly Communicated Concept by Mass Media. Another Challenge for SDGs? Sustainability 2019, 11, 3181. [Google Scholar] [CrossRef]
- Nations, U. Transforming Our World: The 2030 Agenda for Sustainable Development. 2015. Available online: https://sustainabledevelopment.un.org/post2015/transformingourworld/publication (accessed on 21 March 2023).
- Ghosh, S.; Das Chatterjee, N.; Dinda, S. Urban ecological security assessment and forecasting using integrated DEMATEL-ANP and CA-Markov models: A case study on Kolkata Metropolitan Area, India. Sustain. Cities Soc. 2021, 68, 102773. [Google Scholar] [CrossRef]
- Lin, B.B.; Egerer, M.H. Global social and environmental change drives the management and delivery of ecosystem services from urban gardens: A case study from Central Coast, California. Glob. Environ. Chang. 2020, 60, 102006. [Google Scholar] [CrossRef]
- Li, N.; Zhang, Y.; Wang, T.; Li, J.; Yang, J.; Luo, M. Have anthropogenic factors mitigated or intensified soil erosion over the past three decades in South China? J. Environ. Manag. 2022, 302, 114093. [Google Scholar] [CrossRef] [PubMed]
- Dong, J.; Lyu, Y. Appraisal of urban land ecological security and analysis of influencing factors: A case study of Hefei city, China. Environ. Sci. Pollut. Res. Int. 2022, 29, 90803–90819. [Google Scholar] [CrossRef] [PubMed]
- Zhang, Y.; She, J.; Long, X.; Zhang, M. Spatio-temporal evolution and driving factors of eco-environmental quality based on RSEI in Chang-Zhu-Tan metropolitan circle, central China. Ecol. Indic. 2022, 144, 109436. [Google Scholar] [CrossRef]
- Yang, H.; Zhai, G.; Zhang, Y. Ecological vulnerability assessment and spatial pattern optimization of resource-based cities: A case study of Huaibei City, China. Hum. Ecol. Risk Assess. Int. J. 2021, 27, 606–625. [Google Scholar] [CrossRef]
- Sadeghi, S.H.; Vafakhah, M.; Moosavi, V.; Pourfallah Asadabadi, S.; Sadeghi, P.S.; Khaledi Darvishan, A.; Bagheri Fahraji, R.; Mosavinia, S.H.; Majidnia, A.; Gharemahmudli, S.; et al. Assessing the health and ecological security of a human induced watershed in central iran. Ecosyst. Health Sustain. 2022, 8, 2090447. [Google Scholar] [CrossRef]
- Tang, Y.; Zhao, X.; Jiao, J. Ecological security assessment of Chaohu Lake Basin of China in the context of River Chief System reform. Environ. Sci. Pollut. Res. Int. 2020, 27, 2773–2785. [Google Scholar] [CrossRef] [PubMed]
- Zhao, C.; Wang, C.; Yan, Y.; Shan, P.; Li, J.; Chen, J. Ecological Security Patterns Assessment of Liao River Basin. Sustainability 2018, 10, 2401. [Google Scholar] [CrossRef]
- Xi, H.; Chen, Y.; Zhao, X.; Sindikubwabo, C.; Cheng, W. Safety assessment of fragile environment in Badain Jaran Desert and its surrounding areas based on the DPSIR model. Ecol. Indic. 2023, 146, 109874. [Google Scholar] [CrossRef]
- Genton, M.G.; Sun, Y. Comments on: Data science, big data and statistics. Test 2019, 28, 338–341. [Google Scholar] [CrossRef]
- Zhang, B.H.; Zhai, H. Ecological Security Evaluation of Coal Resource-Exhausted Cities: A Case Study of Zaozhuang City in China. Appl. Mech. Mater. 2013, 392, 943–948. [Google Scholar] [CrossRef]
- Guo, M. Application of Remote Sensing Technology in Macro-Ecological Environment Monitoring. Remote Sens. 2020, 9, 26. [Google Scholar] [CrossRef]
- Niu, Z.; He, H.; Peng, S.; Ren, X.; Zhang, L.; Gu, F.; Zhu, G.; Peng, C.; Li, P.; Wang, J.; et al. A Process-Based Model Integrating Remote Sensing Data for Evaluating Ecosystem Services. J. Adv. Model. Earth Syst. 2021, 13, e2020MS002451. [Google Scholar] [CrossRef]
- White, H.J.; Gaul, W.; Sadykova, D.; León-Sánchez, L.; Caplat, P.; Emmerson, M.C.; Yearsley, J.M. Quantifying large-scale ecosystem stability with remote sensing data. Remote Sens. Ecol. Conserv. 2020, 6, 354–365. [Google Scholar] [CrossRef] [PubMed]
- Li, J.; Pei, Y.; Zhao, S.; Xiao, R.; Sang, X.; Zhang, C. A Review of Remote Sensing for Environmental Monitoring in China. Remote Sens. 2020, 12, 1130. [Google Scholar] [CrossRef]
- Wang, Y.; He, X.; Bai, Y.; Tan, Y.; Zhu, B.; Wang, D.; Ou, M.; Gong, F.; Zhu, Q.; Huang, H. Automatic detection of suspected sewage discharge from coastal outfalls based on Sentinel-2 imagery. Sci. Total Environ. 2022, 853, 158374. [Google Scholar] [CrossRef] [PubMed]
- Gao, J.; Zhang, X.; Jiang, Y.; Ou, X.; He, D.; Shi, J. Key issues on watershed ecological security assessment. Chin. Sci. Bull. 2007, 52, 251–261. [Google Scholar] [CrossRef]
- Hu, Y.; Gong, J.; Li, X.; Song, L.; Zhang, Z.; Zhang, S.; Zhang, W.; Dong, J.; Dong, X. Ecological security assessment and ecological management zoning based on ecosystem services in the West Liao River Basin. Ecol. Eng. 2023, 192, 106973. [Google Scholar] [CrossRef]
- Xie, H.; He, Y.; Choi, Y.; Chen, Q.; Cheng, H. Warning of negative effects of land-use changes on ecological security based on GIS. Sci. Total Environ. 2020, 704, 135427. [Google Scholar] [CrossRef]
- Sun, T.; Lin, W.; Chen, G.; Guo, P.; Zeng, Y. Wetland ecosystem health assessment through integrating remote sensing and inventory data with an assessment model for the Hangzhou Bay, China. Sci. Total Environ. 2016, 566–567, 627–640. [Google Scholar] [CrossRef]
- Sun, J.; Yuan, X.; Liu, G.; Tian, K. Emergy and eco-exergy evaluation of wetland restoration based on the construction of a wetland landscape in the northwest Yunnan Plateau, China. J. Environ. Manag. 2019, 252, 109499. [Google Scholar] [CrossRef] [PubMed]
- Zhu, W.; Miao, C.; Zheng, X.; Cao, G.; Wang, F. Study on ecological safety evaluation and warning of wetlands in Tumen River watershed based on 3S technology. Acta Ecol. Sin. 2014, 34, 1379–1390. [Google Scholar] [CrossRef]
- Chen, J.; Wang, S.; Zou, Y. Construction of an ecological security pattern based on ecosystem sensitivity and the importance of ecological services: A case study of the Guanzhong Plain urban agglomeration, China. Ecol. Indic. 2022, 136, 108688. [Google Scholar] [CrossRef]
- He, D.; Hou, K.; Wen, J.F.; Wu, S.Q.; Wu, Z.P. A coupled study of ecological security and land use change based on GIS and entropy method-a typical region in Northwest China, Lanzhou. Environ. Sci. Pollut. Res. 2021, 29, 6347–6359. [Google Scholar] [CrossRef]
- Peng, C.; Li, B.; Nan, B. An analysis framework for the ecological security of urban agglomeration: A case study of the Beijing-Tianjin-Hebei urban agglomeration. J. Clean. Prod. 2021, 315, 128111. [Google Scholar] [CrossRef]
- Xu, X.L.; Liu, J.Y.; Zhang, S.W.; Li, R.D.; Yan, C.Z.; Wu, S.X. China’s Multi-Period Land Use Land Cover Remote Sensing Monitoring Dataset (CNLUCC). Data Registration and Publishing System of the Resource and Environmental Science Data Center of the Chinese Academy of Sciences. 2018. Available online: https://www.scirp.org/reference/referencespapers?referenceid=2687440 (accessed on 12 January 2024).
- Wei, J.; Li, Z.; Cribb, M.; Huang, W.; Xue, W.; Sun, L.; Guo, J.; Peng, Y.; Li, J.; Lyapustin, A.; et al. Improved 1 km resolution PM2.5 estimates across China using enhanced space–time extremely randomized trees. Atmos. Chem. Phys. 2020, 20, 3273–3289. [Google Scholar] [CrossRef]
- Wei, J.; Li, Z.; Lyapustin, A.; Sun, L.; Peng, Y.; Xue, W.; Su, T.; Cribb, M. Reconstructing 1-km-resolution high-quality PM2.5 data records from 2000 to 2018 in China: Spatiotemporal variations and policy implications. Remote Sens. Environ. 2021, 252, 112136. [Google Scholar] [CrossRef]
- Zhang, R.; Wang, C.; Xiong, Y. Ecological security assessment of China based on the Pressure-State-Response framework. Ecol. Indic. 2023, 154, 110647. [Google Scholar] [CrossRef]
- Hu, X.; Xu, H. A new remote sensing index based on the pressure-state-response framework to assess regional ecological change. Environ. Sci. Pollut. Res. Int. 2019, 26, 5381–5393. [Google Scholar] [CrossRef]
- Sang, S.; Wu, T.; Wang, S.; Yang, Y.; Liu, Y.; Li, M.; Zhao, Y. Ecological Safety Assessment and Analysis of Regional Spatiotemporal Differences Based on Earth Observation Satellite Data in Support of SDGs: The Case of the Huaihe River Basin. Remote Sens. 2021, 13, 3942. [Google Scholar] [CrossRef]
- Liu, J.; Cao, X.; Zhao, L.; Dong, G.; Jia, K. Spatiotemporal Differentiation of Land Ecological Security and Its Influencing Factors: A Case Study in Jinan, Shandong Province, China. Front. Environ. Sci. 2022, 10, 8. [Google Scholar] [CrossRef]
- Dong, L.; Ge, C.; Zhang, H.; Liu, Z.; Yang, Q.; Jin, B.; Ritsema, C.J.; Geissen, V. an optimized method for extracting slope length in rusle from raster digital elevation. Catena 2022, 209, 105818. [Google Scholar] [CrossRef]
- Islam, M.R.; Jaafar, W.Z.W.; Hin, L.S.; Osman, N.; Karim, M.R. Development of an erosion model for Langat River Basin, Malaysia, adapting GIS and RS in RUSLE. Appl. Water Sci. 2020, 10, 1–11. [Google Scholar] [CrossRef]
- Liu, C.; Wu, X.; Wang, L. Analysis on land ecological security change and affect factors using RS and GWR in the Danjiangkou Reservoir area, China. Appl. Geogr. 2019, 105, 1–14. [Google Scholar] [CrossRef]
- Ermida, S.L.; Soares, P.; Mantas, V.; Göttsche, F.-M.; Trigo, I.F. Google Earth Engine Open-Source Code for Land Surface Temperature Estimation from the Landsat Series. Remote Sens. 2020, 12, 1471. [Google Scholar] [CrossRef]
- Wang, S.; Zhang, X.; Wu, T.; Yang, Y. The evolution of landscape ecological security in Beijing under the influence of different policies in recent decades. Sci. Total Environ. 2019, 646, 49–57. [Google Scholar] [CrossRef]
- Zuo, W.; Wang, Q.; Wang, W.J.; Liu, J.J.; Yang, Y.P. Study on Regional Ecological Security Assessment Index and Standard. Geogr. Territ. Res. 2002, 18, 67–71. [Google Scholar] [CrossRef]
- Li, Y.; Sun, X.; Zhu, X.; Cao, H. An early warning method of landscape ecological security in rapid urbanizing coastal areas and its application in Xiamen, China. Ecol. Model. 2010, 221, 2251–2260. [Google Scholar] [CrossRef]
- Cheng, W.; Xi, H.; Sindikubwabo, C.; Si, J.; Zhao, C.; Yu, T.; Li, A.; Wu, T. Ecosystem health assessment of desert nature reserve with entropy weight and fuzzy mathematics methods: A case study of Badain Jaran Desert. Ecol. Indic. 2020, 119, 106843. [Google Scholar] [CrossRef]
- Liu, H.Y.; Liu, Y.C.; Meng, L.H.; Jiao, K.Q.; Zhu, M.Y.; Chen, Y.K.; Zhang, P.F. Research progress of entropy weight method in water resources and water environment. J. Glaciol. Geocryol. 2022, 44, 299–306. [Google Scholar] [CrossRef]
- Wang, C.; Xu, M.; Olsson, G.; Liu, Y. Characterizing of water-energy-emission nexus of coal-fired power industry using entropy weighting method. Resour. Conserv. Recycl. 2020, 161, 104991. [Google Scholar] [CrossRef]
- Lai, S.; Sha, J.; Eladawy, A.; Li, X.; Wang, J.; Kurbanov, E.; Lin, Z.; Wu, L.; Han, R.; Su, Y.-C. Evaluation of ecological security and ecological maintenance based on pressure-state-response (PSR) model, case study: Fuzhou city, China. Hum. Ecol. Risk Assess. Int. J. 2022, 28, 734–761. [Google Scholar] [CrossRef]
- Gocic, M.; Trajkovic, S. Analysis of changes in meteorological variables using Mann-Kendall and Sen’s slope estimator statistical tests in Serbia. Glob. Planet. Change 2013, 100, 172–182. [Google Scholar] [CrossRef]
- Zhu, B.; Hashimoto, S.; Cushman, S.A. Navigating ecological security research over the last 30 years: A scoping review. Sustain. Sci. 2023, 18, 2485–2498. [Google Scholar] [CrossRef]
- Zhu, M.; Zhang, Z.; Zhu, B.; Kong, R.; Zhang, F.; Tian, J.; Jiang, T. Population and Economic Projections in the Yangtze River Basin Based on Shared Socioeconomic Pathways. Sustainability 2020, 12, 4202. [Google Scholar] [CrossRef]


| Target Layer | The Standard Layer | Index Layer | Attribute |
|---|---|---|---|
| Regional ecological security assessment model | Pressure | Township Development Intensity | negative |
| Township Development Speed | negative | ||
| Soil Erosion | negative | ||
| Air Pollution Concentration | negative | ||
| Topographic Difference | negative | ||
| State | Land Surface Temperature | negative | |
| Landscape Fragmentation | negative | ||
| Ecological Vitality | positive | ||
| Response | Ecological Resilience | positive |
| Evaluation Level | First Level | Second Level | Third Level | Fourth Level | Fifth Level |
|---|---|---|---|---|---|
| Description | Very insecure | Relatively insecure | Moderately secure | Relatively secure | Very secure |
| Highly alarmed | Moderately alarmed | Mildly alarmed | In good state | Comforted | |
| RES value | ≤0.20 | 0.20–0.40 | 0.40–0.60 | 0.60–0.80 | ≥0.80 |
| Years | Pressure | State | Response | Comprehensive Index | ||||
|---|---|---|---|---|---|---|---|---|
| RES | Level | RES | Level | RES | Level | RES | Level | |
| 2000 | 0.64 | Relatively Secure | 0.67 | Relatively Secure | 0.54 | Moderately Secure | 0.60 | Relatively Secure |
| 2005 | 0.73 | Relatively Secure | 0.65 | Relatively Secure | 0.52 | Moderately Secure | 0.62 | Relatively Secure |
| 2010 | 0.69 | Relatively Secure | 0.69 | Relatively Secure | 0.49 | Moderately Secure | 0.59 | Moderately Secure |
| 2015 | 0.62 | Relatively Secure | 0.67 | Relatively Secure | 0.47 | Moderately Secure | 0.56 | Moderately Secure |
| 2020 | 0.58 | Moderately Secure | 0.63 | Relatively Secure | 0.46 | Moderately Secure | 0.53 | Moderately Secure |
Disclaimer/Publisher’s Note: The statements, opinions and data contained in all publications are solely those of the individual author(s) and contributor(s) and not of MDPI and/or the editor(s). MDPI and/or the editor(s) disclaim responsibility for any injury to people or property resulting from any ideas, methods, instructions or products referred to in the content. |
© 2024 by the authors. Licensee MDPI, Basel, Switzerland. This article is an open access article distributed under the terms and conditions of the Creative Commons Attribution (CC BY) license (https://creativecommons.org/licenses/by/4.0/).
Share and Cite
Ren, E.; Lin, W.; Li, B.; Jiang, Y.; Zhang, Y.; Yu, Y. Regional Ecological Security Assessment Based on the Pressure–State–Response Framework: The Demonstration Zone of Yangtze River Delta as an Example. Land 2024, 13, 96. https://doi.org/10.3390/land13010096
Ren E, Lin W, Li B, Jiang Y, Zhang Y, Yu Y. Regional Ecological Security Assessment Based on the Pressure–State–Response Framework: The Demonstration Zone of Yangtze River Delta as an Example. Land. 2024; 13(1):96. https://doi.org/10.3390/land13010096
Chicago/Turabian StyleRen, Enhui, Wenpeng Lin, Bo Li, Yue Jiang, Yuxun Zhang, and Yan Yu. 2024. "Regional Ecological Security Assessment Based on the Pressure–State–Response Framework: The Demonstration Zone of Yangtze River Delta as an Example" Land 13, no. 1: 96. https://doi.org/10.3390/land13010096