

Global Drought-Wetness Conditions Monitoring Based on Multi-Source Remote Sensing Data
by
 , , , ,
Wei Wei
1,
Jiping Wang
1,*,
Libang Ma
1,
Xufeng Wang
2,
Binbin Xie
3,
Junju Zhou
1 and
Haoyan Zhang
1 1
College of Geography and Environmental Science, Northwest Normal University, Lanzhou 730070, China
2
Key Laboratory of Remote Sensing of Gansu Province, Heihe Remote Sensing Experimental Research Station, Northwest Institute of Eco-Environmental and Resources, Chinese Academy of Sciences, Lanzhou 730000, China
3
School of Urban Economics and Tourism Culture, Lanzhou City University, Lanzhou 730070, China
*
Author to whom correspondence should be addressed.
Land 2024, 13(1), 95; https://doi.org/10.3390/land13010095
Submission received: 18 December 2023
/
Revised: 9 January 2024
/
Accepted: 10 January 2024
/
Published: 15 January 2024
(This article belongs to the Topic Spatial Patterns of Disaster Risk Assessment via Remote Sensing)
Abstract
:Drought is a common hydrometeorological phenomenon and a pervasive global hazard. To monitor global drought-wetness conditions comprehensively and promptly, this research proposed a spatial distance drought index (SDDI) which was constructed by four drought variables based on multisource remote sensing (RS) data, including the normalized difference vegetation index (NDVI), land surface temperature (LST), soil moisture (SM), and precipitation (P), using the spatial distance model (SDM). The results showed that the consistent area of SDDI with the 1-month and 3-month standardized precipitation-evapotranspiration index (SPEI1 and SPEI3), and the self-calibrating Palmer drought severity index (scPSDI) accounted for 85.5%, 87.3%, and 85.1% of the global land surface area, respectively, indicating that the index can be used to monitor global drought-wetness conditions. Over the past two decades (2001–2020), a discernible spatial distribution pattern has emerged in global drought-wetness conditions. This pattern was characterized by the extreme drought mainly distributed deep within the continent, surrounded by expanding moderate drought, mild drought, and no drought areas. On the annual scale, the global drought-wetness conditions exhibited an upward trend, while on the seasonal and monthly scales, it fluctuated steadily within a certain cycle. Through this research, we found that the sensitive areas of drought-wetness conditions were mainly found on the east coast of Australia, the Indus Basin of the Indian Peninsula, the Victoria and Katanga Plateau areas of Africa, the Mississippi River Basin of North America, the eastern part of the Brazilian Plateau and the Pampas Plateau of South America.
1. Introduction
Drought is defined as the prolonged absence of rain high temperatures, or low rainfall in an area, leading to the air and soil being deprived of moisture. The occurrence of drought is mainly associated with episodic or periodic decreases in precipitation [1,2,3]. Drought is one of the most serious climatic disasters affecting human society and is characterized by its high frequency, long duration, and widespread impact [4,5]. The frequent occurrence and long-term persistence of drought not only cause huge losses to society and the economy, especially agricultural production but also result in a shortage of water resources, increased desertification, frequent dust storms and many other adverse ecological and environmental impacts [6,7,8]. According to a recent report released by the United Nations in 2020, drought has caused at least 124 billion US dollars in economic losses and affected more than 1.5 billion people from 1998 to 2017, and approximately 5 billion people will live in water-scarce areas by 2050 [9]. Therefore, drought studies are becoming increasingly essential globally for building a comprehensive monitoring system for natural hazards and ecological risks [10,11].
Currently, drought can be divided into four primary categories: meteorological, agricultural, hydrological, and socioeconomic drought [12]. Meteorological drought is a water deficit resulting from precipitation being less than evapotranspiration. The most visible manifestation of a meteorological drought is a decrease in precipitation [13]. Agricultural drought is a phenomenon in which soil moisture is reduced and vegetation growth is subjected to moisture stress. Soil moisture and vegetation growth conditions are the main characteristics of this drought type [14]. Hydrological drought is a water deficit caused by an imbalance between surface water or groundwater revenues and expenditures, with groundwater levels and runoff being the main associated characteristics [15]. Socioeconomic drought is a phenomenon in which a water deficit is caused by an imbalance between the supply and demand of water resources [16].
At present, drought monitoring mainly depends on meteorological observations and quantitative evaluations conducted with the help of drought indices. A suitable drought index not only allows for the efficient and accurate monitoring of drought conditions but also allows researchers to predict drought conditions and provides decision-makers with the means to develop drought prevention and management strategies [17,18,19,20]. Based on the means of observation methods, drought indices can be categorized into two types: traditional station-based drought monitoring indices (TS-BDIs) and remote sensing technology-based drought monitoring indices (RS-BDIs).
TS-BDIs are derived from ground station observations and can thus effectively characterize the drought-wetness characteristics around a given station. However, ground stations are limited in their ability to observe various spatial scales, and the monitoring accuracy is therefore heavily affected by the number, distribution density and mathematical functions of existing stations, making it difficult to accurately characterize detailed drought conditions from a spatial perspective. The most recognized TS-BDIs include the percentage of precipitation anomalies (PPA) [21], self-calibrating Palmer drought severity index (scPDSI) [22], standardized precipitation index (SPI) [23], and standardized precipitation evapotranspiration index (SPEI) [24]. The SPI calculation process is simple and has the advantage of considering multiple time scales to allow for better spatial and temporal monitoring. However, this index considers only a single precipitation element and ignores the effects of temperature and evapotranspiration on drought in the presence of global warming. Thus, it is somewhat one-sided. In contrast, the SPEI considers both temperature and evapotranspiration, making it a more desirable drought monitoring index with better application prospects in the context of global warming. Recently, RS-BDIs have compensated for the shortcomings of TS-BDIs; RS-BDIs can continuously monitor spatial and temporal drought characteristics due to their timeliness, objectivity, cost-efficiency, long-term continuous data, and wide coverage. RS-BDIs have thus become the most promising means for conducting drought monitoring research.
RS-BDIs include remote sensing single variable-based drought monitoring indices (RSSV-BDIs) and remote sensing multivariable-based composite drought indices (RSMV-BDIs). RSSV-BDIs primarily include the temperature condition index (TCI) [25], vegetation condition index (VCI) [26], precipitation condition index (PCI) [27] and soil moisture condition index (SMCI) [28]. The TCI was proposed according to land surface temperature (LST) information and is a crucial link in the water cycle and heat exchanges in the atmosphere, this index can be used to monitor the drought status in-depth through calculations performed based on the thermal infrared bands of images. The VCI was developed from the normalized difference vegetation index (NDVI) through RS image data and can directly indicate vegetation conditions. However, precipitation, terrain and soil conditions are not considered in the process of constructing the VCI or TCI [4,29,30]. Consequently, the PCI and SMCI were proposed, and these indices can directly reflect drought characteristics from key influencing factors. However, the global drought-wetness condition is a complex natural phenomenon, closely related to precipitation, vegetation, soil moisture, etc. Only one data type or one aspect of drought information can provide a comprehensive view due to the complex conditions and influencing factors associated with drought monitoring [12,13,14,15,16]. Therefore, an increasing number of scholars are becoming aware of the importance of developing RSMV-BDIs, such as the temperature vegetation drought index (TVDI), vegetation health index (VHI), scaled drought condition index (SDCI) and temperature vegetation precipitation drought index (TVPDI). These indices have been widely used to study both agricultural and meteorological droughts at different scales due to their simple principles, straightforward calculations, and highly accurate results [10,15,22].
However, the multivariate weights of the drought indices listed above are dependent on different methods, such as the use of multiple linear regression (MLR), the empirical assignment method (EAM), principal component analysis (PCA), spatial principal component analysis (SPCA), and the entropy weight method (EWM). Different methods have different emphases, limitations, and complexities [31,32,33,34]. For example, MLR lacks physical meaning in its interpretation [35], the EAM exhibits an artificial subjective characteristic, the PCA method may lead to information losses, SPCA may also lead to small information losses and the EWM is limited in its use of spatial datasets, especially RS datasets [35,36,37,38]. Therefore, a drought monitoring index with a scientific theory, simple calculation and universal applicability should be developed for use worldwide.
The global scale can help us better understand the global distribution pattern of drought, the links between different regions and their mutual impacts, and provide a reference for international cooperation and resource allocation [5,10,37]. Therefore, we have chosen the global scale to conduct an integrated drought study to provide scientific support for drought management and response on a global scale. In this study, the VCI, PCI, TCI and SMCI were selected as the four variables, and the spatial distance model (SDM) was used to build the spatial distance drought index (SDDI) [8,32,39]. After the SDDI was constructed, its applicability was verified, and the index was used to identify and monitor the temporal and spatial distribution characteristics of global drought-wetness. We considered an area with a very high drought degree compared to other areas was considered to be experiencing extreme drought (ED), while an area with a very high degree of drought at a certain time compared to the average value obtained during the research period in the corresponding area was considered to be experiencing abnormal drought (AD). Consequently, this study aimed to answer three questions: (1) What are the spatial distributions of and changes in drought wetness worldwide? (2) How can we accurately identify global drought-wetness conditions? (3) Where do extreme drought and abnormal drought occur worldwide?
2. Data and Processing
2.1. MODIS Data
In this paper, two data products including the normalized difference vegetation index (NDVI) and land surface temperature (LST) (Terra product) of the Moderate Resolution Imaging Spectroradiometer (MODIS) were obtained from the National Aeronautics and Space Administration (NASA) (http://modis.gsfc.nasa.gov) (accessed on 30 November 2021) and were used to calculate the spatial distance drought index (SDDI). To unify the spatial resolution, all MODIS data were resampled 0.5 Deg (55 km), Table 1 shows detailed information on MODIS data.
2.2. GLDAS Data
Global land data assimilation systems (GLDAS) data were obtained from the Goddard Space Flight Center (GSFC) of the National Aeronautics and Space Administration (NASA) (https://disc.gsfc.nasa.gov) (accessed on 30 November 2021). The goal of the GLDAS is to ingest satellite and ground-based observational data products, using advanced land surface modeling and data assimilation techniques, to generate optimal fields of land surface conditions and fluxes. Soil Moisture (SM) used SoilMoi0_10cm_inst production of GLDAS, the period is from January 2001 to December 2020, the spatial resolution is 0.25 Deg × 0.25 Deg, was resampled to 0.5 Deg (55 km) to build the SDDI and the time resolution is monthly scale.
2.3. GPM Data
Global precipitation measurement (GPM) data were obtained from NASA (https://daac.gsfc.nasa.gov) (accessed on 30 November 2021), which has higher spatial resolution than TRMM data and covers global precipitation observations, and the integrated multi-satellite inversion of GPM can significantly improve spatial and temporal resolution and coverage. Precipitation (P) used GPM_3IMERGM production of GPM, which was obtained from January 2001 to December 2020. The spatial resolution is 0.1 Deg × 0.1 Deg, was resampled to 0.5 Deg (55 km) to build the SDDI, and the time resolution is monthly scale.
2.4. Other Data
The Standardized Precipitation-Evapotranspiration Index (SPEI) data was obtained from the SPEI Global Drought Monitor (https://spei.csic.es/map) (accessed on 30 November 2021), which is an indicator of the deviation of drought in an area. It is calculated through standardized potential evapotranspiration and precipitation and is an indicator of the evolution of drought. self-calibrating Palmer Drought Severity Index (scPDSI) data were obtained from Word Meteorological Organization (http://climexp.knmi.nl) (accessed on 30 November 2021), which is calculated from time series of precipitation and temperature, and integrated fixed parameters related to the soil and surface characteristics. It can reflect different climate regimes more comparable. Land cover types of data was obtained from Earth System Science Data (https://essd.copernicus.org) (accessed on 30 November 2021), the GLASS-GLC dataset was built by the latest version of GLASS (The Global Land Surface Satellite)-CDRs (Climate Data Records) and generated on the Google Earth Engine (GEE) platform, to unify the spatial resolution, Land cover types of data were resampled to 0.5 Deg [39]. Crop yield data were obtained from Nature Scientific Data (https://www.nature.com/sdata) (accessed on 30 November 2021), which is a hybrid data product of agricultural census statistics (national yield statistics reported by FAO) and satellite remote sensing (crop indices derived from remote sensing inversions) including four primary crops: maize, rice, wheat and soybean [38]. SPEI and scPDSI are used to verify the accuracy of the SDDI, and Land cover types and Crop yield data were utilized to characterize the spatial and temporal relationships with SDDI. Table 2 provides detailed information on the datasets.
3. Method
3.1. Drought Indices Calculation
In this paper, the TCI, VCI, PCI, and SMCI were used to synthesize the SDDI, and the details of the calculation of TCI, VCI, PCI, and SMCI are shown in Table 3. The higher the value of the VCI, PCI, and SMCI, the wetter of the study area is. On the contrary, the higher the value of the TCI, the drier it is.
Land surface temperature, vegetation, precipitation and soil moisture are the four main influencing factors for drought-wetness on the land surface. Decreased precipitation is the most direct manifestation of meteorological drought, vegetation growth conditions and soil moisture are the most important characteristics of agricultural drought, and surface temperature affects surface evapotranspiration, which in turn affects soil moisture expenditure, so the land surface temperature is also a direct influence factor of agricultural drought. However, a single land surface drought-wetness factor does not provide integrated information on the drought-wetness conditions on the land surface. The Spatial Distance Model (SDM) is employed to integrate the information on these drought-wetness factors to construct the spatial distance drought index (SDDI), which integrates the information on drought-wetness conditions of the land surface [8,32,39]. The specific algorithm is as follows:
In the formula, VCIi, PCIi, TCIi and SMCIi represent each of the pixel values of VCI, PCI, TCI and SMCI respectively, VCImin, PCImin and SMCImin represent the minimum of all pixel values of VCI, PCI and SMCI respectively, VCIi − VCImin represents the Euclidean distance between VCIi and VCImin in the VCI pixel space. and the other three represent similar meanings. TCImax represents the maximum value of all TCI pixel values, and the Euclidean distance of TCI pixel space (TCImax − TCIi) is calculated because the higher the temperature, the drier it is. So, the smaller the Euclidean distance of each factor, the drier it is. The threshold of VCIi − VCImin is 0–1, and the other three variables are also 0–1, so the threshold of SDDI is 0–2, with 0 being the driest and 2 being the wettest. Therefore, in this study, we have classified the global drought-wetness conditions as follows [33,40] (Table 4):
3.2. Analytical Method
3.2.1. Consistency Test of SDDI
The reliability of the SDDI in characterizing global drought-wetness can be verified by the consistency test between SDDI and other drought indices. In this paper, the Pearson correlation coefficient was used to test the consistency [41]. The calculation formula is as follows:
In the formula, xi and are the i-th value and average value of the variable x, respectively; yi and are the i-th value and average value of the variable y, respectively. n is the total number of sample sequences. If the |Rxy| is close to 1, the correlation is stronger. If Rxy = ±1, the two groups of variables have a perfect positive (negative) correlation. If 0 < Rxy < 1, the two groups of variables are positively correlated, and if −1 < Rxy < 0, then the two groups of variables are negatively correlated.
The SPEI fulfils the requirements of a drought index since its multi-scalar character enables it to be used by different scientific disciplines to detect, monitor, and analyze drought. SPEI1 is primarily used to monitor meteorological drought and SPEI3 is primarily used to monitor agricultural drought. The scPDSI uses readily available temperature and precipitation data to estimate relative drought, and the scPDSI has been reasonably successful at quantifying long-term drought. Therefore, spatial correlations between monthly scales of SDDI and SPEI1, SPEI3 and scPDSI can indicate the monitor capability for drought-wetness of the global land surface. This paper uses ArcGIS 10.4 to count the areas where the correlation of SDDI with SPEI1, SPEI3 and scPDSI are greater than 0 as a percentage of the study total areas, to measure the consistency of SDDI with these three indices.
In the formula, CA is the consistency areas as a percentage of the study’s total areas. C is the consistency area of SDDI with SPEI1, SPEI3 and scPDSI (i.e., the areas where the correlation of SDDI with SPEI1, SPEI3 and scPDSI is greater than 0), and S is the study total areas. The larger value of CA indicates a higher degree of consistency.
3.2.2. Identification of Abnormal Drought-Wetness Areas and Sensitive Areas
The anomaly is the difference between a pixel value and the pixel average value of a period. The pixel average value of a period reflects the general state of the data [42], therefore the pixel-based anomaly can reflect the abnormal state of the pixel in a particular period. The specific algorithm is as follows:
In the formula, PA is the per-pixel anomaly value, P is the per-pixel value and is the pixel average value of a period. PA < 0 indicates the pixel is an abnormal drought condition in a particular period. PA = 0 indicates the pixel has stable drought-wetness conditions. conversely, PA > 0 indicates the pixel is an abnormal wetness condition in a particular period.
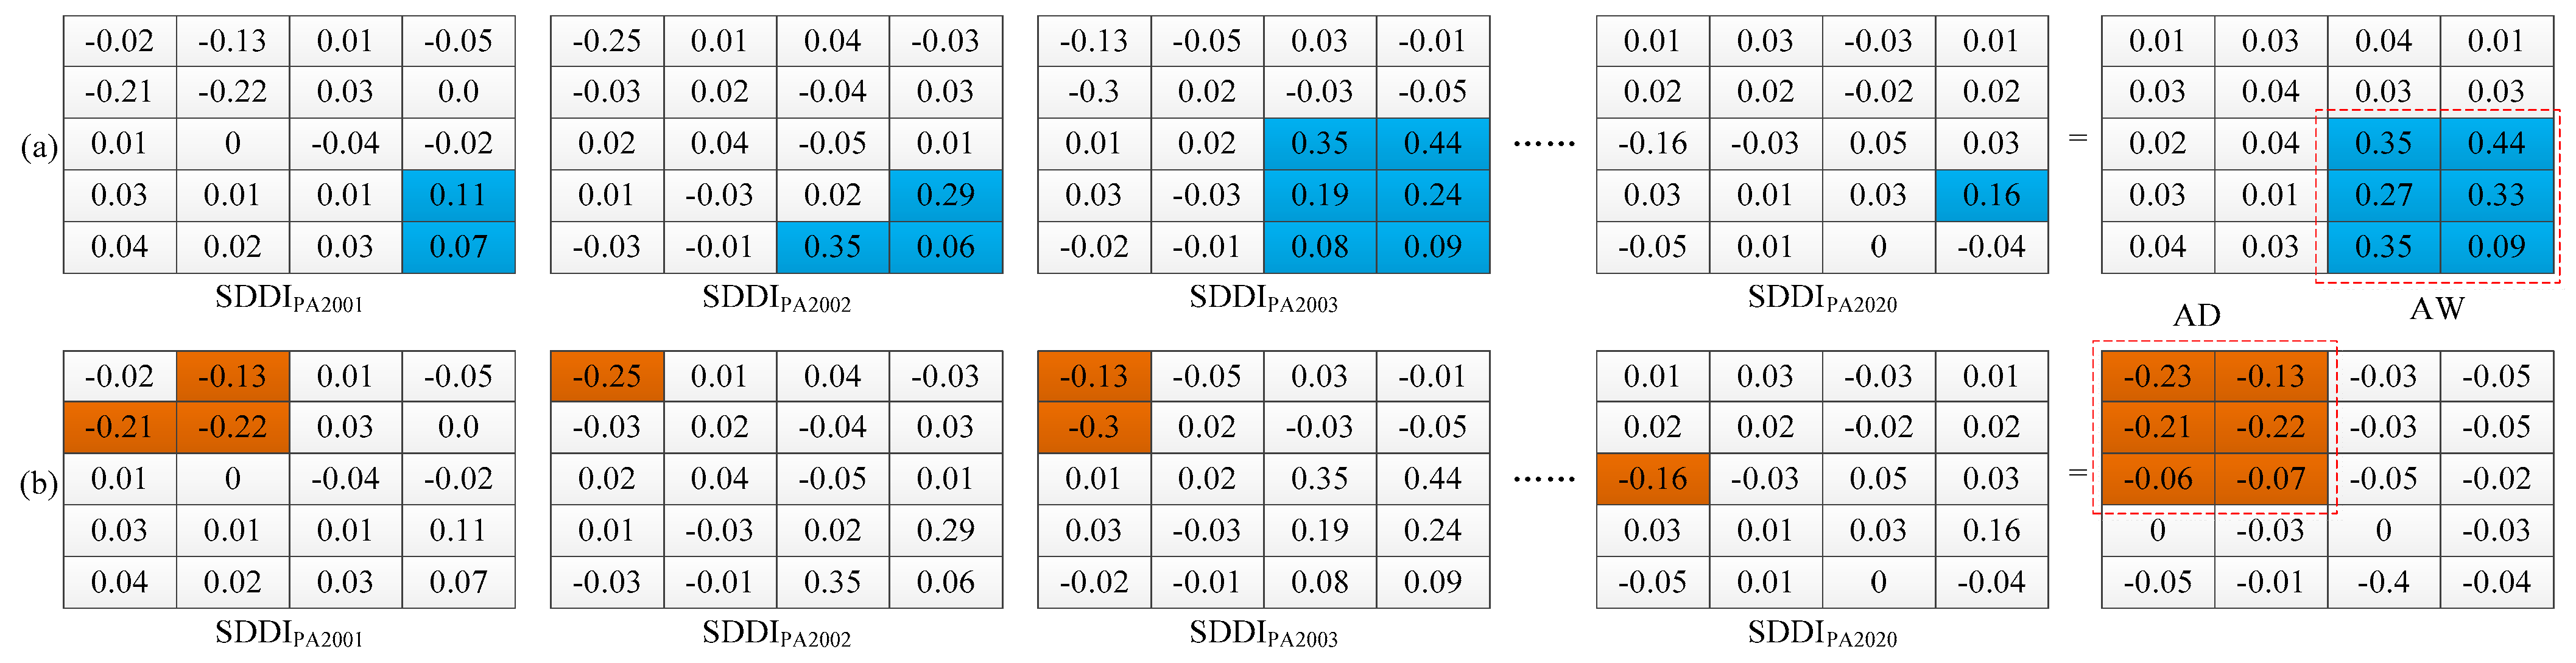
In this paper, the global areas of abnormal drought-wetness were identified by using the Cell Statistics tool of ArcGIS10.4, the maximum value of the 20-year global SDDI anomaly is greater than or equal to 0.06 is defined as areas of abnormal wetness and the minimum value is less than or equal −0.06 is defined as areas of abnormal drought, respectively [42,43] (Figure 1).
Both abnormal drought and abnormal wetness can occur in the intersection areas of AD and AW. Therefore, these intersection areas are sensitive areas to abnormal drought-wetness conditions. The specific algorithm is as follows:
In the formula, the SA are sensitive areas of abnormal drought-wetness. stands for the intersection of two variables. The intersection areas of AD and AW are defined as SA [43].
3.2.3. Trends Analysis of Drought-Wetness Conditions
The Theil-Sen Median (Sen) and Mann-Kendall (MK) trend test methods are widely used non-parametric trend tests of time series data [44]. This method does not require samples to follow a certain distribution and is affected by a small number of outliers [45]. It is often used to detect trends in precipitation and drought under the influence of climate change [33]. In this paper, the global drought-wetness trends based on pixel scale were analyzed using the Sen and MK trends test methods. Firstly, The Sen trend was calculated to indicate the trends of drought-wetness. Secondly, the MK method was used to indicate the significance of the trend, when the absolute value of MK is greater than 1.96, it means that it passes the 95% significance test. The specific algorithms are as follows: (1) the Sen slopes were reclassified and assigned different values; (2) Pass the significance test and those that did not were reclassified and assigned different values; (3) The two were multiplied together to obtain the characteristics of global drought-wetness variability.
In the formula, T, S and ST are drought-wetness trends, significance test (calculated by MK trends test) and significant drought-wetness trends, respectively.
3.2.4. Response Analysis of Crop Yields to Drought-Wetness Conditions Change
To explore the response of crop yields to drought-wetness conditions change, this paper designed a set of algorithms to reflect the response. It is shown as follows:
In the formula, the numbers from 1 to 6 represent a trend of wetness but less production, a trend of stable and less production, a trend of drought and less production, a trend of drought but greater production, a trend of stable and greater production and a trend of wetness and greater production, respectively.
4. Results
4.1. The Consistency Verification of the SDDI
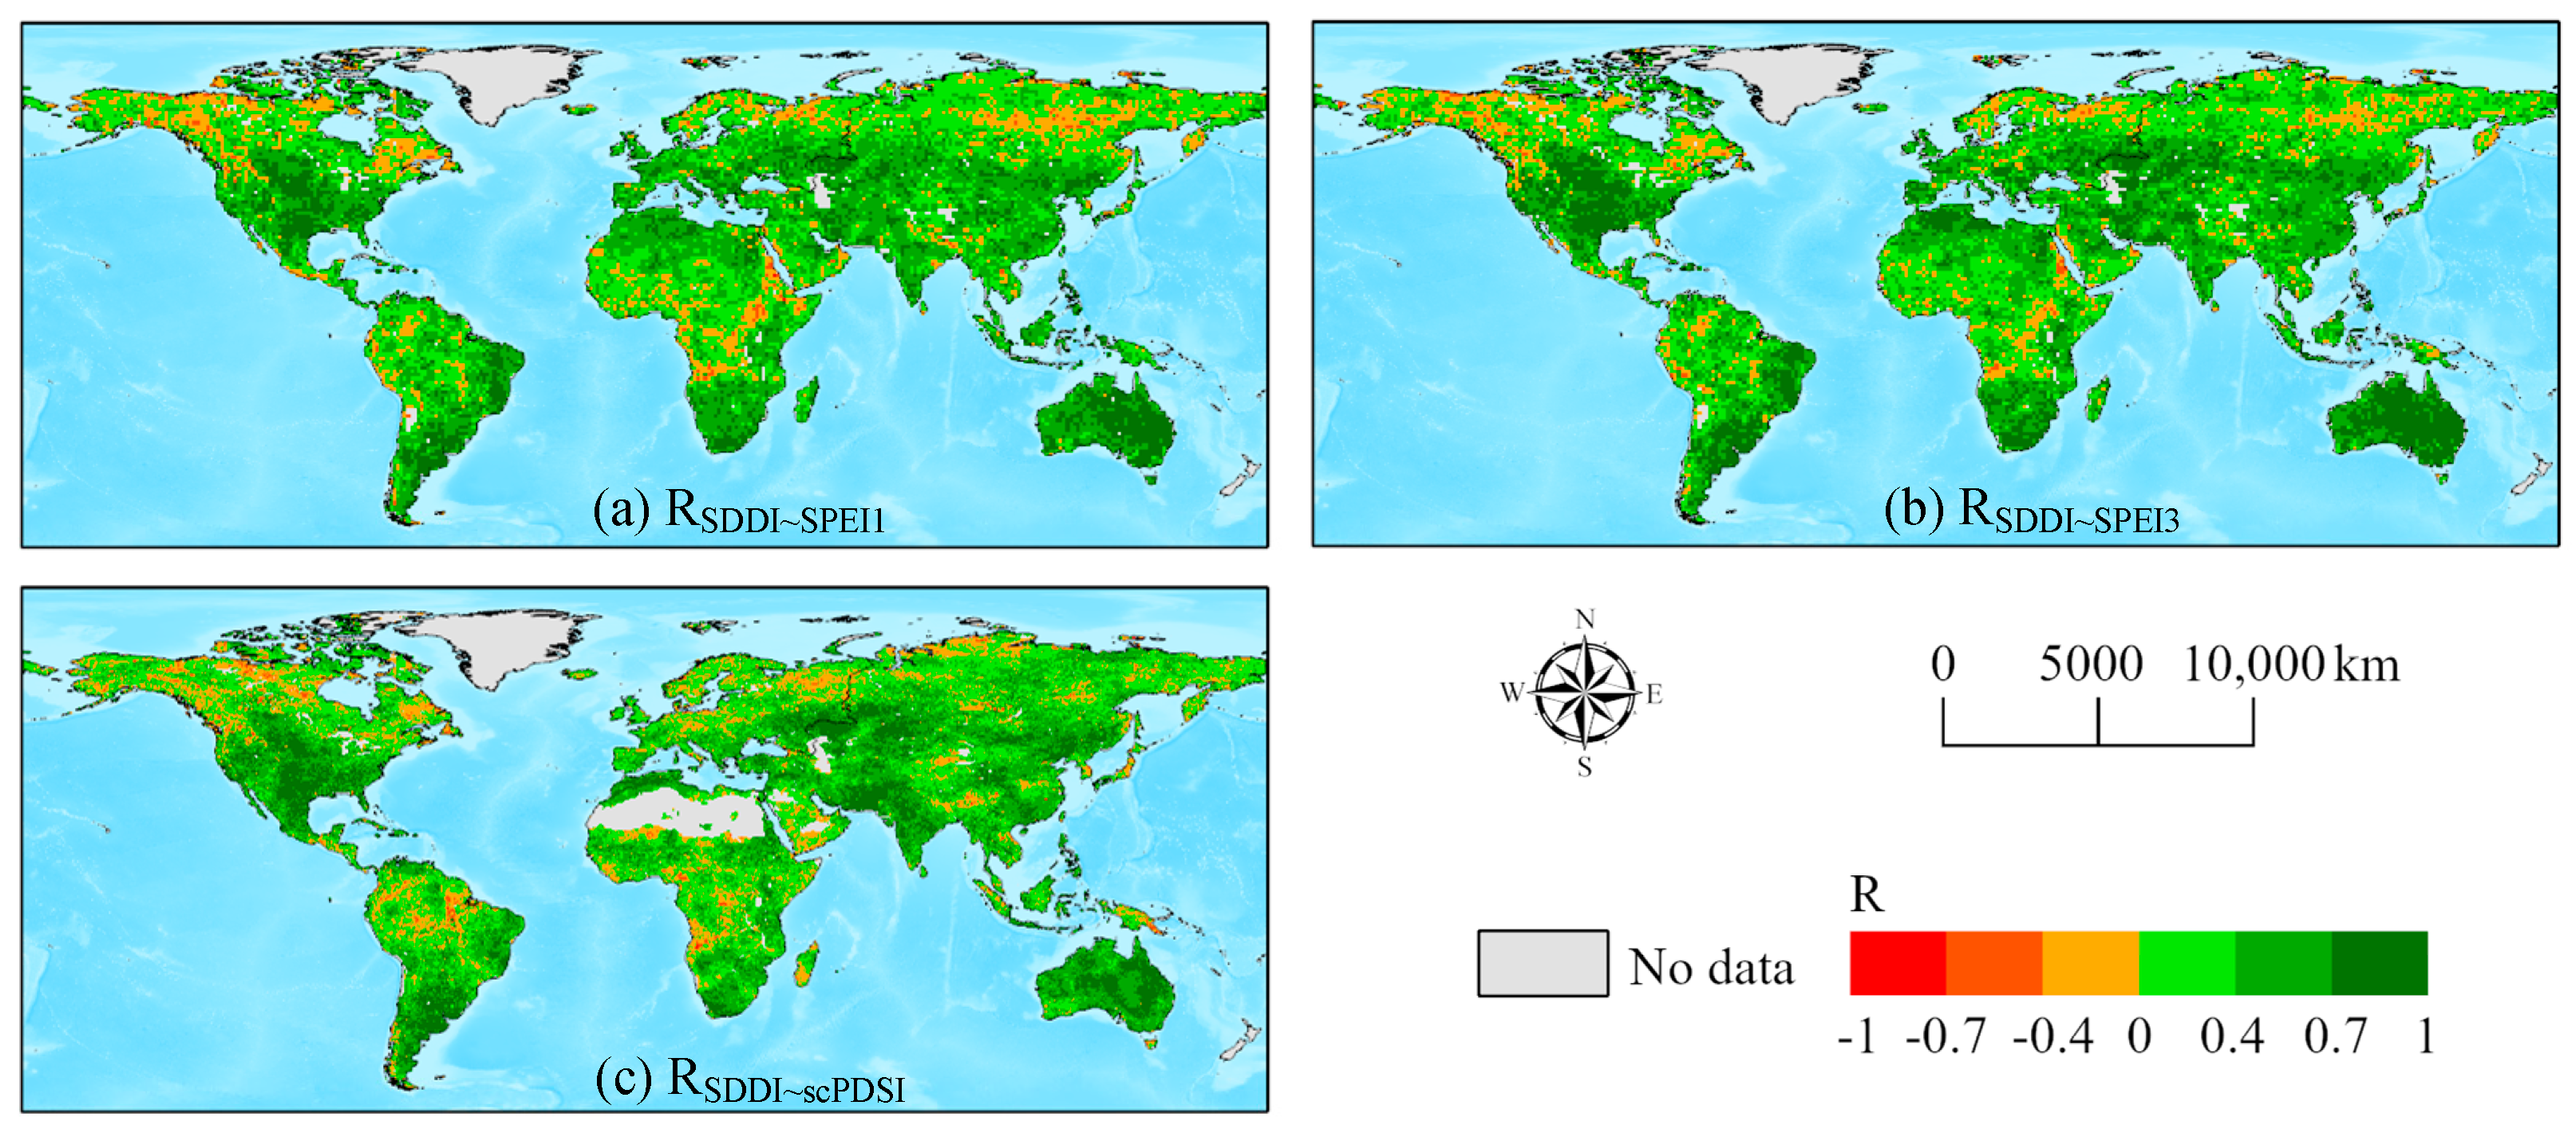
Consistency verification was required to ensure the accuracy and usability of the SDDI on a global scale, and the Pearson correlation coefficient was used to reflect the consistency test. Therefore, we selected the widely recognized drought indices SPEI and scPDSI from the period 2000 to 2010 to ensure consistency in verifying with SDDI. The Pearson correlation coefficients of the SDDI with the SPEI1, SPEI3 and scPDSI on the spatial scale were displayed in Figure 2. The result showed that the regions with a significant positive correlation (R > 0.7, p < 0.05) between SDDI with SPEI1, SPE3, and scPDSI are mainly located in the Central Great Plains of the United States, eastern South America, and Australia. While the correlation coefficient in northern North America, northern Europe and Siberia is negative, SDDI in these areas is negatively correlated with SPEI and scPDSI, because SDDI considers the factors of land surface temperature and soil moisture. Despite the lack of precipitation in these areas, the land surface temperature in these areas is usually low and soil moisture is relatively abundant [46,47]. In addition, the negative correlation coefficient of Congo Basin and Amazon Plain in Africa is due to the lush vegetation in these areas, and the drought-wetness conditions are significantly affected by vegetation, while SPEI and scPDSI do not consider vegetation factors, and the limitations of precipitation estimated by GPM-IMERG satellites, is the difficulty of estimating the precipitation of some types of clouds, such as the hot Amazonian clouds [48,49].
The correlation coefficient between SDDI and SPEI1, SPEI3 and scPDSI greater than 0, respectively, is defined as the region where the drought-wetness conditions meet the consistency. From the mathematical and statistical perspectives, the consistency area of the SDDI with the SPEI1, SPEI3 and scPDSI as a percentage of the global land surface total area was 85.5%, 87.3% and 85.1%, respectively. Therefore, the SDDI exhibited a high degree of spatial consistency with the SPEI and scPDSI on a global scale. To ensure the availability of the SDDI on the continental scale, we counted the consistency of the SDDI with the SPEI and scPDSI for each continent. The results of the consistency area of the SDDI with the SPEI1, SPEI3 and scPDSI across continents as a percentage of the global land surface total area are shown in Table 5. The average values of the three consistency area percentage rankings were as follows: Australia (99.3%) > South America (88.2%) > Africa (87.7%) > Asia (87.6%) > Europe (82.9%) > North America (78.4%). Therefore, the applicability of the SDDI is strongest in Australia, and the performance was close to that in the other four continents. In summary, the SDDI can be used to monitor global drought-wetness conditions from a spatial perspective and mathematical and statistical perspectives.
4.2. Global Drought-Wetness Conditions Monitoring
4.2.1. Global Drought-Wetness Conditions on the Annual Scale
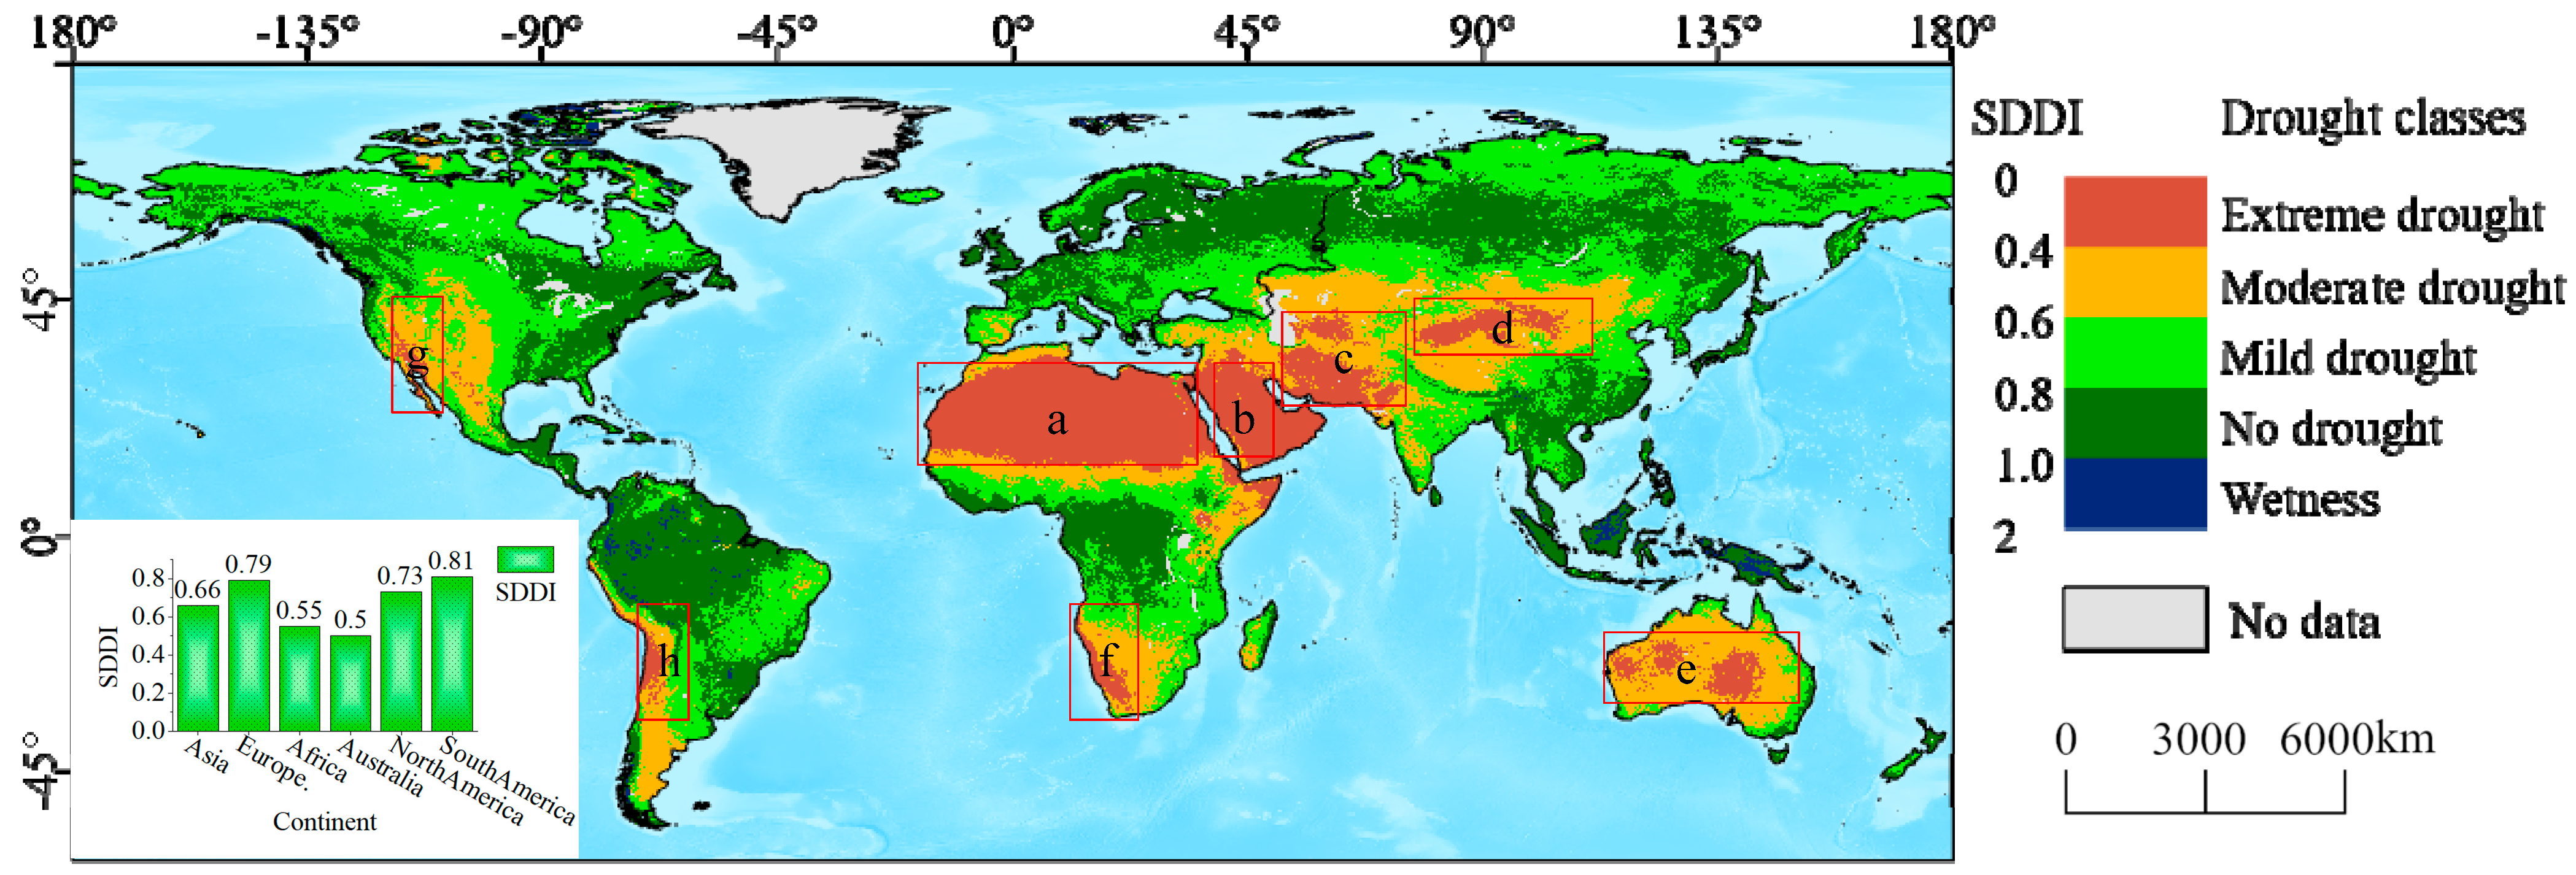
The global distribution of drought-wetness conditions was determined by computing the 20-year average value of each raster for the SDDI. From the mathematical and statistical perspective, the average value of the global land surface drought-wetness condition was 0.67, indicating that the overall global land surface drought-wetness condition was moderate drought. Furthermore, the 20-year average values of SDDI in each continent were also compared and the results are as follows: South America (0.81) > Europe (0.79) > North America (0.73) > Asia (0.66) > Africa (0.55) > Australia (0.5) (Figure 3). We found that South America experienced no drought according to the drought classification, while Australia experienced moderate drought in the past 20 years. In addition, the results of the drought classes for each continent as a percentage of the global land surface area are presented in Table 6. Except for Africa, which exhibited the largest area of extreme drought, accounting for 8.67% of the global land area, Asia accounted for the largest area characterized by the drought classes, accounting for 7.58%, 11.42%, 9.74%, and 0.44% of the global land area, respectively.
Spatially, there were significant regional differences and regularities for global drought-wetness conditions. The extreme drought areas were mainly distributed in the Sahara Desert area (a), the Arabian Peninsula area (b), the Iranian Plateau area (c), the Tibetan and Inner Mongolian Plateaus area (d), Australia (e), southern Africa (f), southwestern North America (g) and southwestern South America (h)) (Figure 3). These areas are mainly located on either side of the Tropic of Capricorn and the Tropic of Cancer and are mainly controlled by subtropical high pressure and prevailing dry and hot sinking currents. Some areas, such as a, b, c, d and e, are distributed inland and form a concentrated distribution area of drought. Other areas (f, g, h) are located on the west coast of the continent and are controlled by cold currents that act as a cooling and humidifying influence on the western coastal areas. Parts of the Indonesian archipelago and Amazonian plains near the equator are the wettest areas, as this area has the most abundant precipitation, the most luxuriant vegetation and thus higher soil moisture. In short, we found that the global drought-wetness conditions centred on extreme drought, with moderate drought, mild drought and no drought areas expanding outward in a circular pattern.
4.2.2. Global Drought-Wetness Conditions on the Seasonal and Monthly Scales
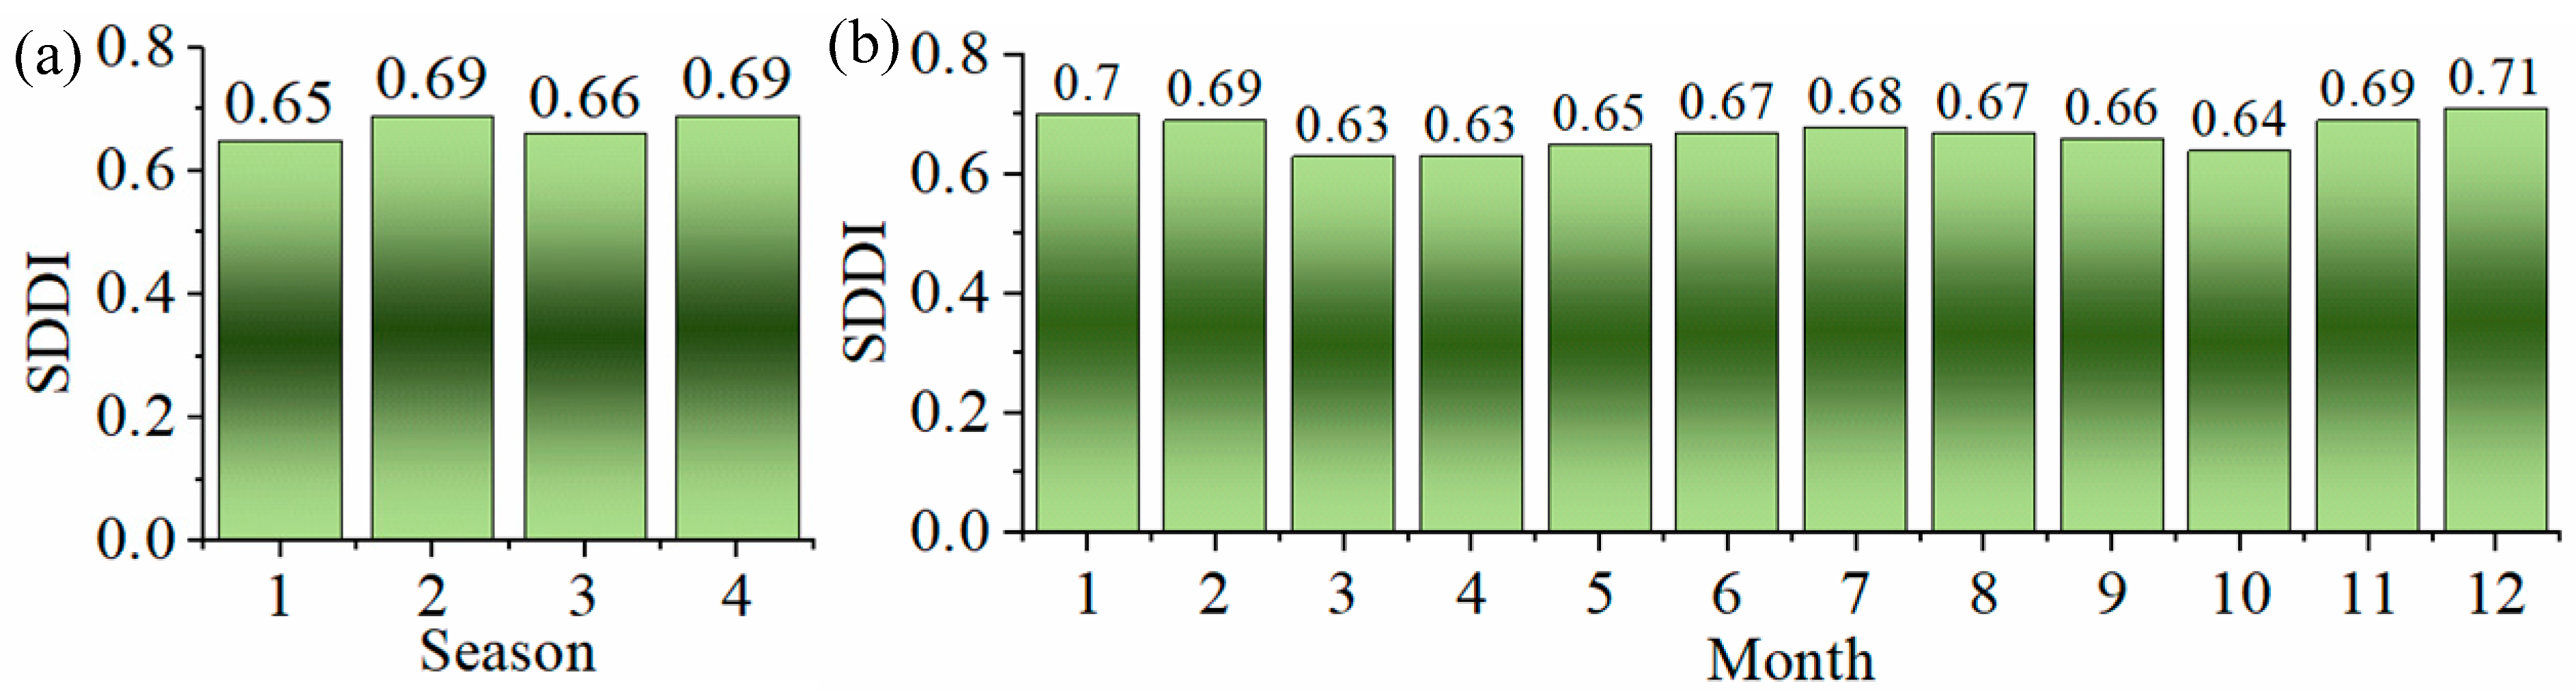
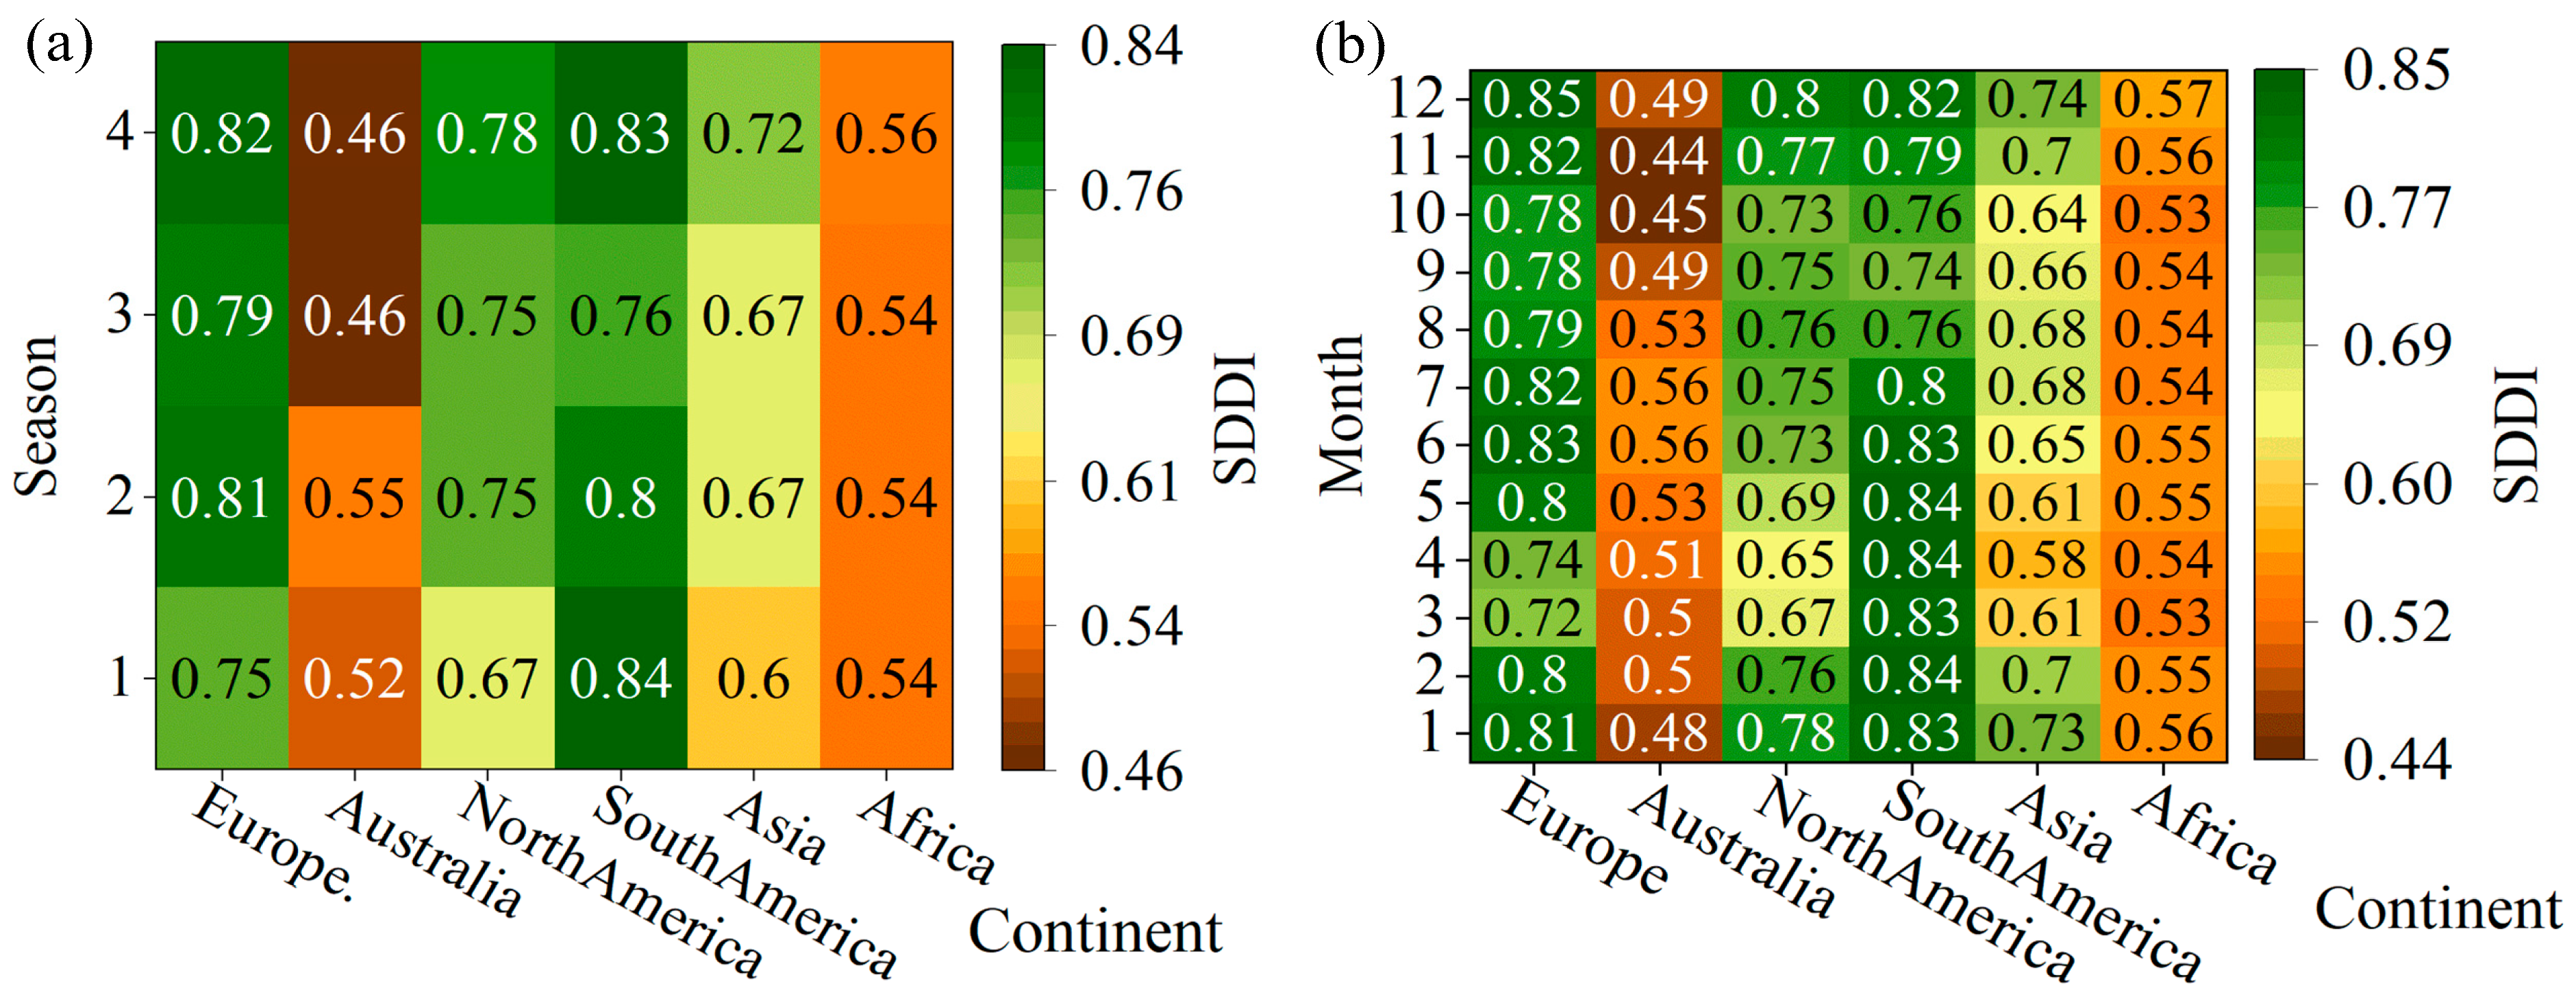
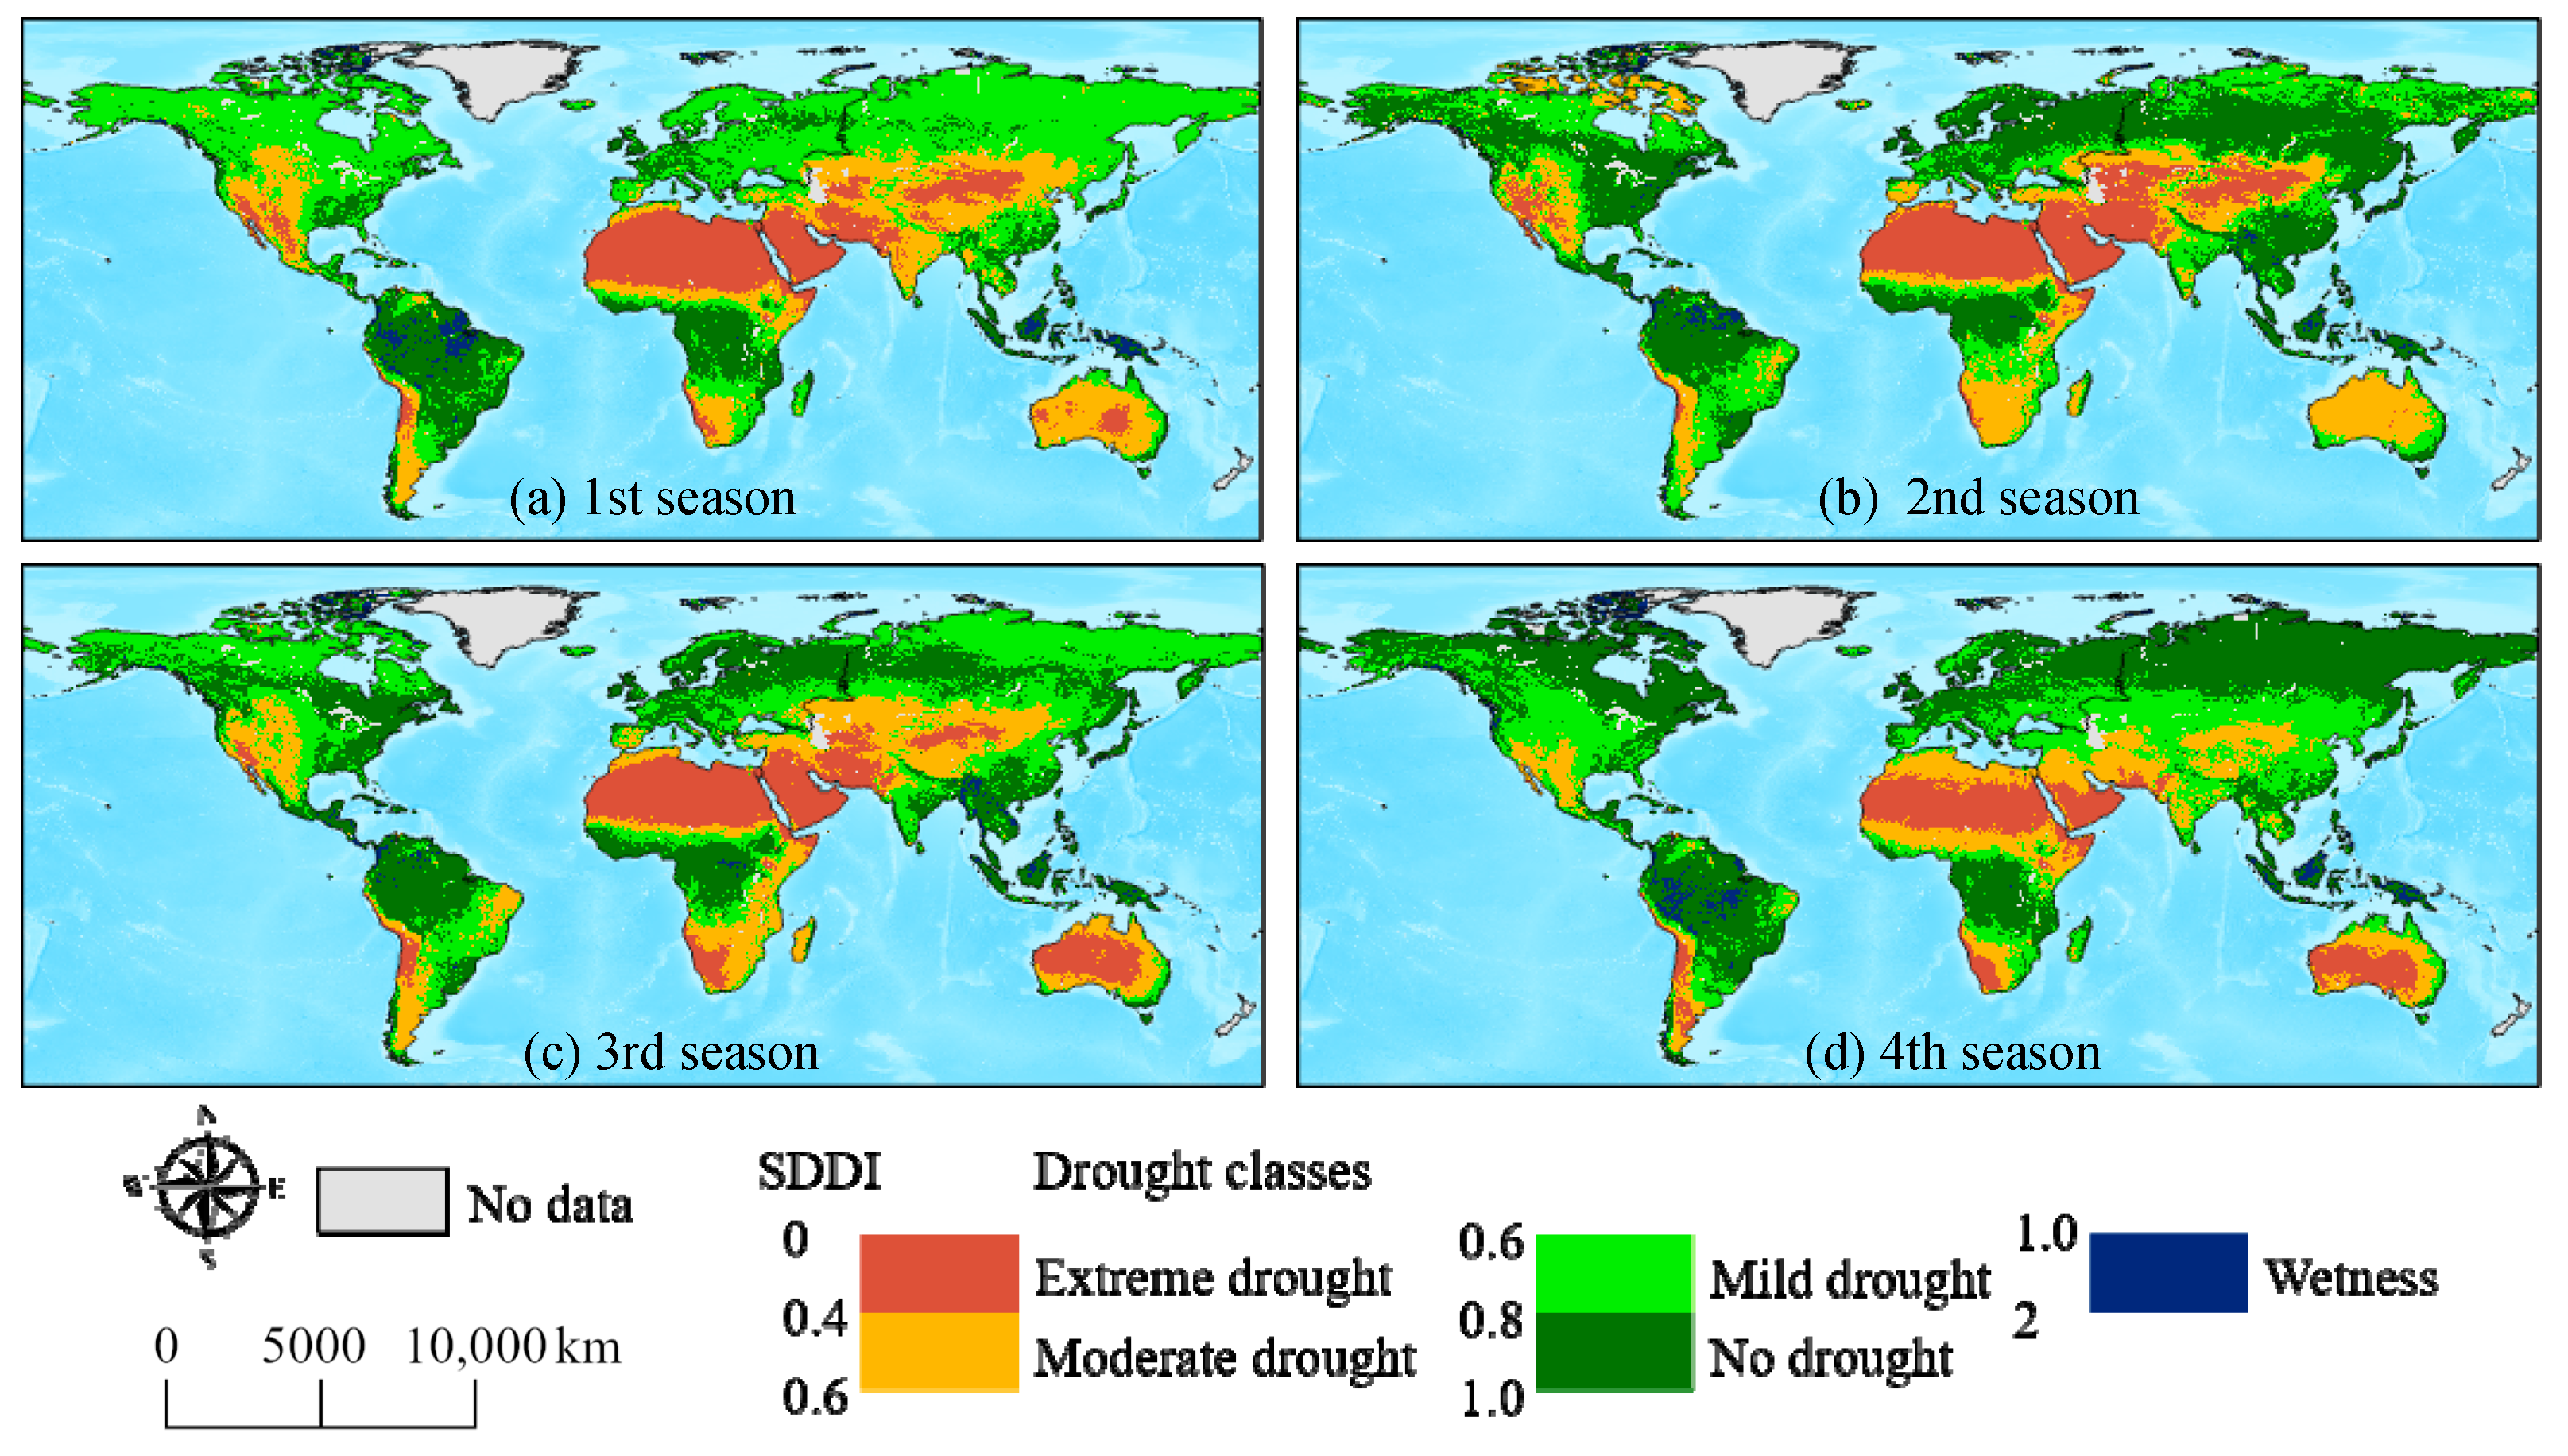
The global distribution of drought-wetness conditions exhibits variability on the seasonal scale. The wettest season was the 4th season and 2nd season (SDDI = 0.69), and the driest season was the 1st season (SDDI = 0.65) (Figure 4a). The drought-wetness conditions were compared across continents revealing that the 1st season (SDDI = 0.84) in South America was the wettest, and the 3rd season and 4th season (0.46) in Australia were the driest seasons (Figure 5a). Except for the Qinghai-Tibet Plateau and Inner Mongolia Plateau areas of central Asia in the 4th season, there was little change in the extreme and moderate drought areas across the seasons. Siberia in Asia and eastern and northern North America were the areas with the greatest fluctuations in global drought-wetness variability, displaying different spatial distribution patterns of drought-wetness in all seasons (Figure 6).
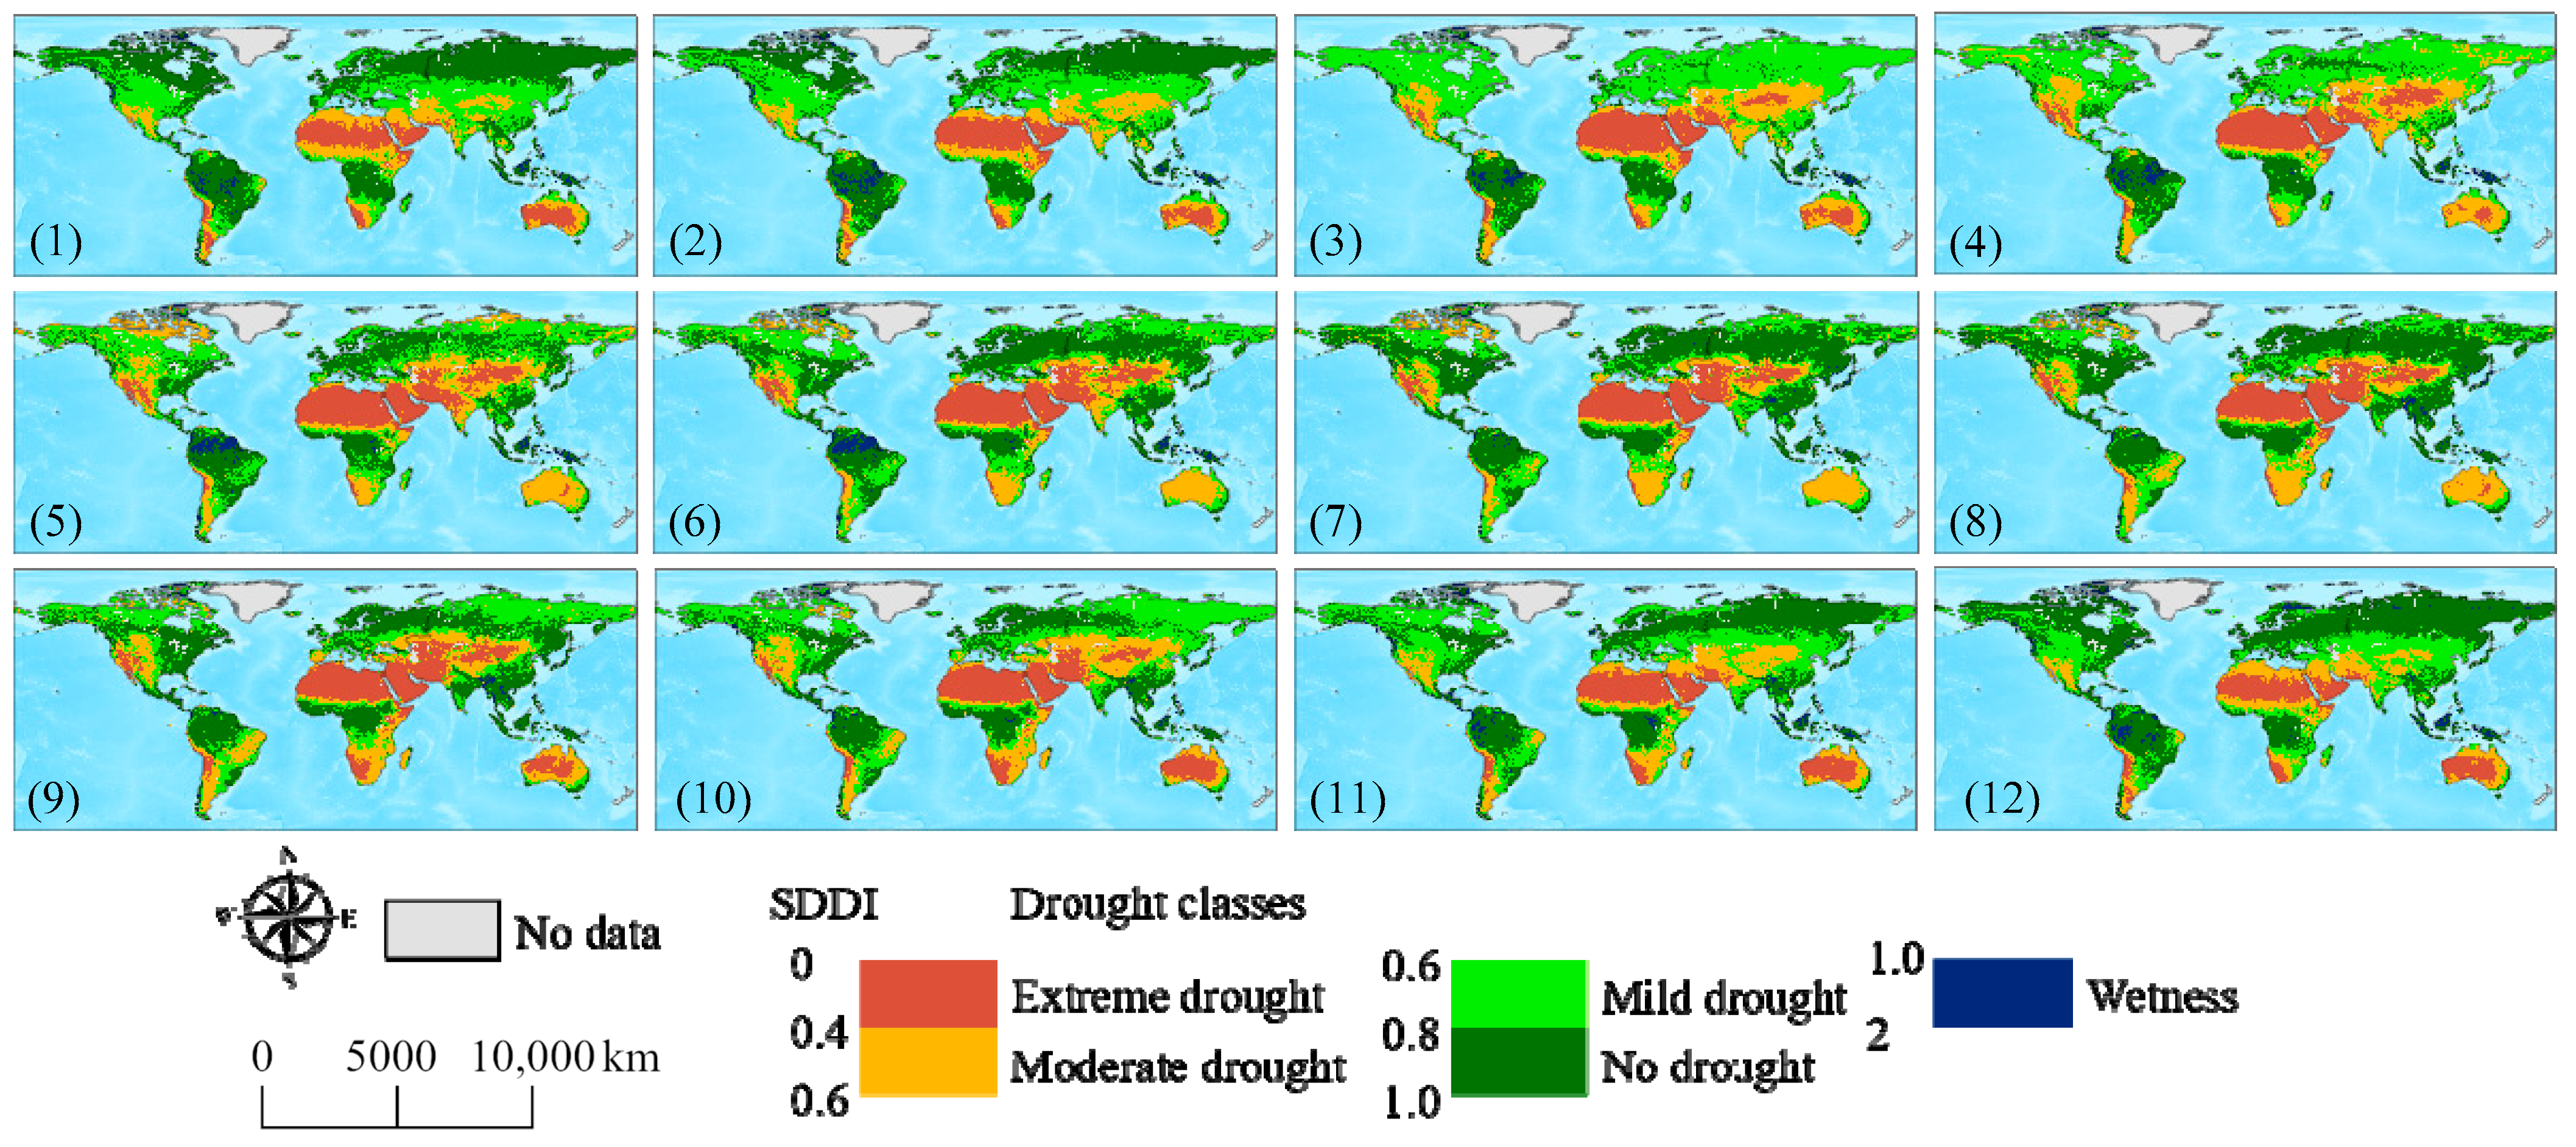
On the monthly scale, the SDDI varied exhibited significant variation across months in the following order: December (0.71) > January (0.7) > February (0.69) = November (0.69) > July (0.68) > August (0.67) = June (0.67) > September (0.66) > May (0.65) > October (0.64) > March (0.63) = April (0.63) (Figure 4b), indicating that the wettest month is December and the driest months are March and April. The drought-wetness conditions were compared across continents; December (SDDI = 0.85) is the wettest month in Europe, and November (0.44) is the driest month in Australia (Figure 5b). Spatially, from January to December, there was a certain regularity in the distribution of drought-wetness conditions across the global land surface (Figure 7); for example, the Tibetan and Inner Mongolian Plateau in Asia and the Siberian area in Asia exhibited a drier-wetter pattern, while the Amazonian plains of South America showed an increasingly wetter-drier-wetter pattern.
4.3. Temporal and Spatial Variation Regularity of Global Drought-Wetness Conditions
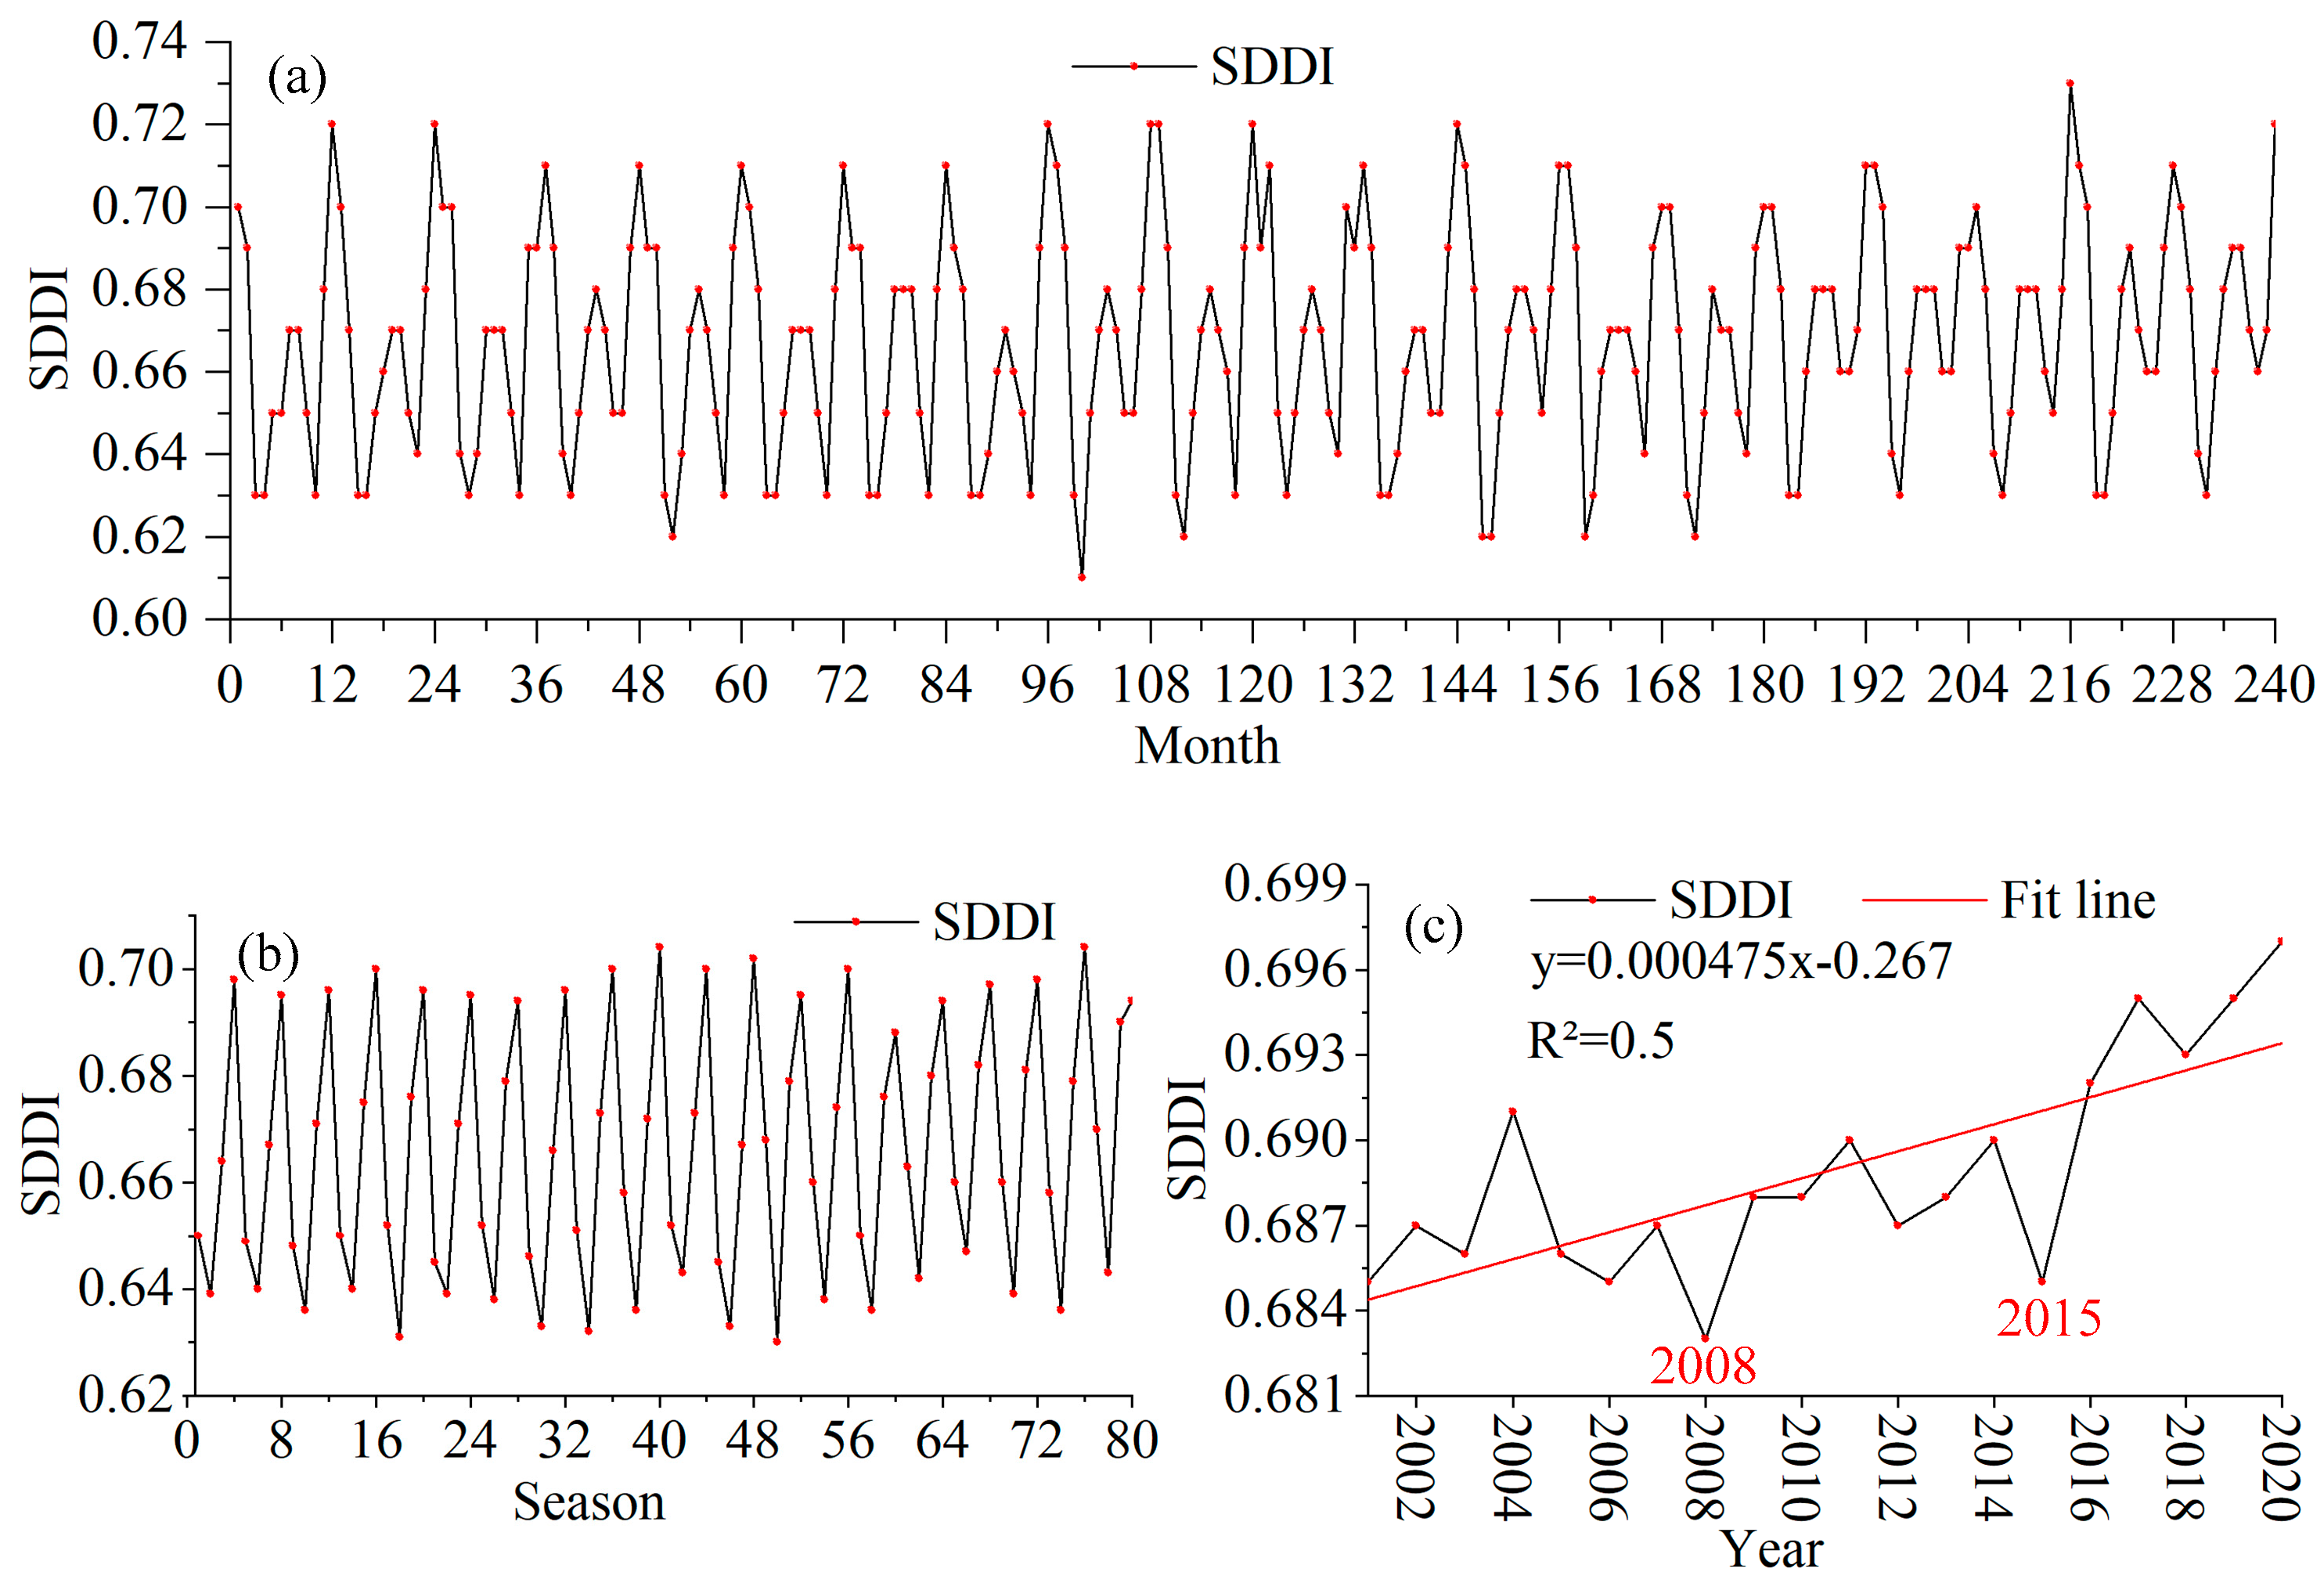
The temporal variation regularity of global drought-wetness conditions was analyzed on different time scales in this section. The SDDI exhibited stable volatility on both the seasonal scale with a cycle of four seasons and the monthly scale with a cycle of 12 months (Figure 8a,b). On an annual scale, global drought-wetness conditions exhibited a steady upward trend. The marked decline in SDDI in 2008 (0.685) and 2015 (0.683), within the context of the general trend toward global wetting, was attributed to the major global drought events that occurred in these two years (Figure 8c).
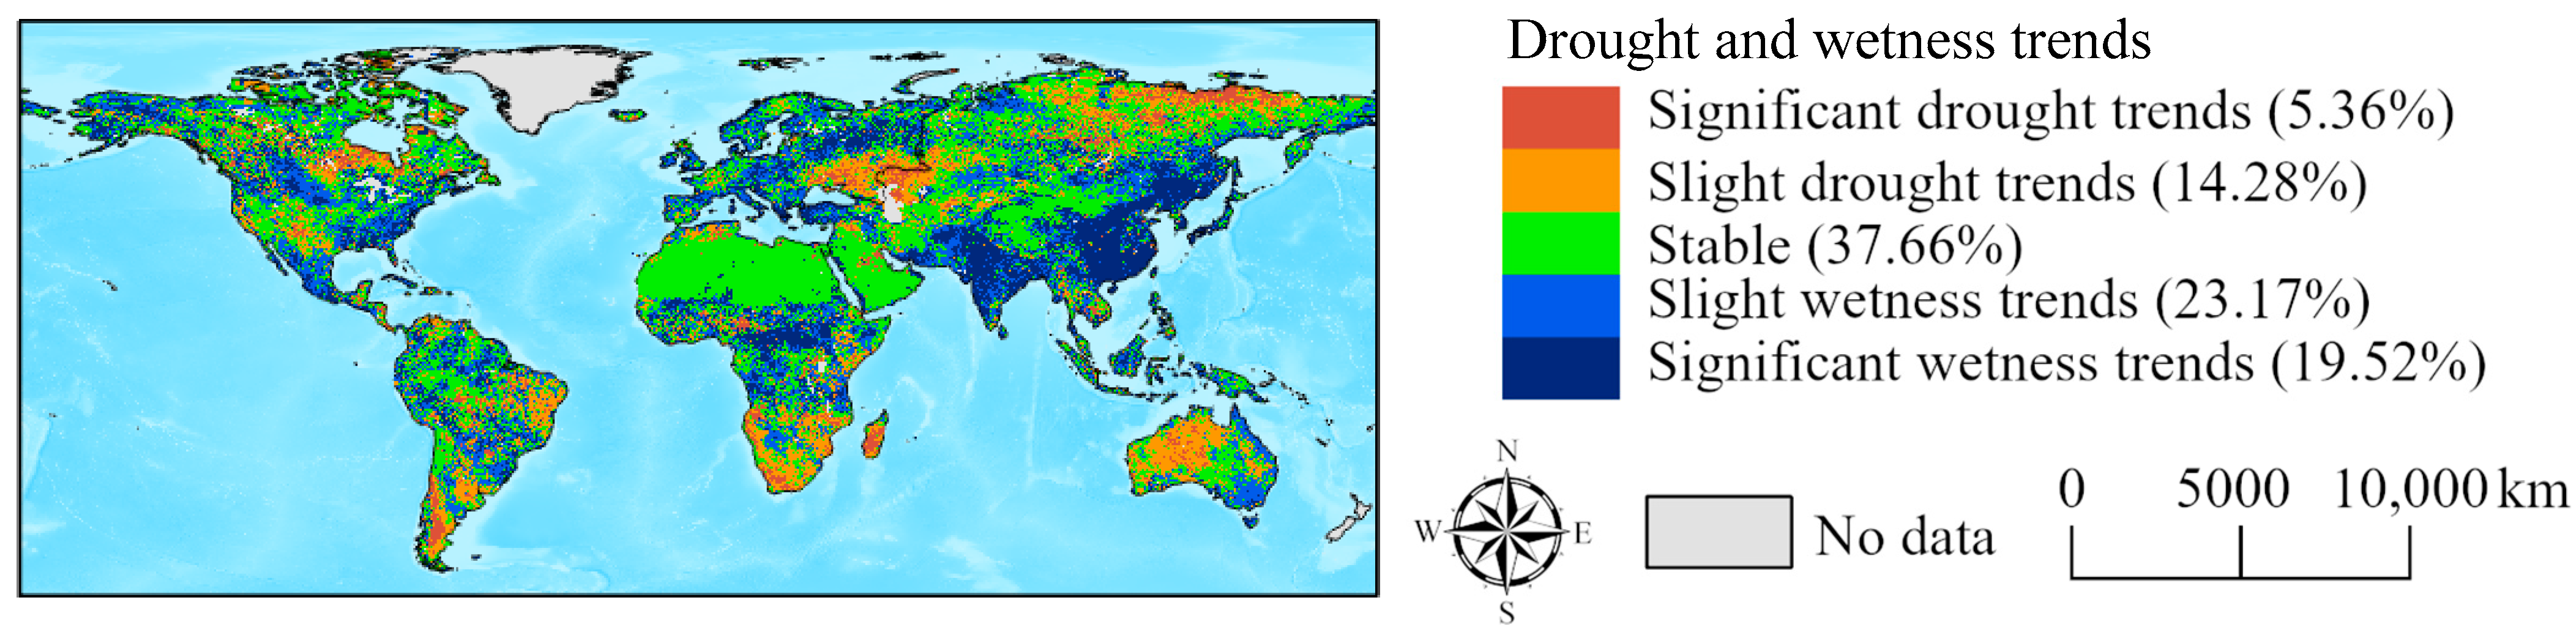
Figure 9 shows the spatial trend of global drought-wetness conditions from 2001 to 2020. Firstly, we found that 19.52% of the global land surface has experienced significant wetness trends (p < 0.05), mainly in southern and northeastern China, peninsular India, northern Europe, central Africa, and southern and central North America. These areas are the most populated in the world and are thus highly disturbed by humans. Second, only 5.13% of the global land surface has experienced significant drought trends (p < 0.05), mainly in the Ural area, Siberia, western Australia, southern Africa, northern North America, and southern South America. In addition, 37.66% of the global land surface maintained a stable state of drought-wetness conditions, mainly on the Tibetan Plateau, the Inner Mongolia Plateau, the Arabian Peninsula, and the Sahara Desert. These areas are mainly wilderness and desert areas, so the impact of climate change in a short period is very small.
4.4. Identifying Globally Abnormal Drought-Wetness Areas and Sensitive Areas
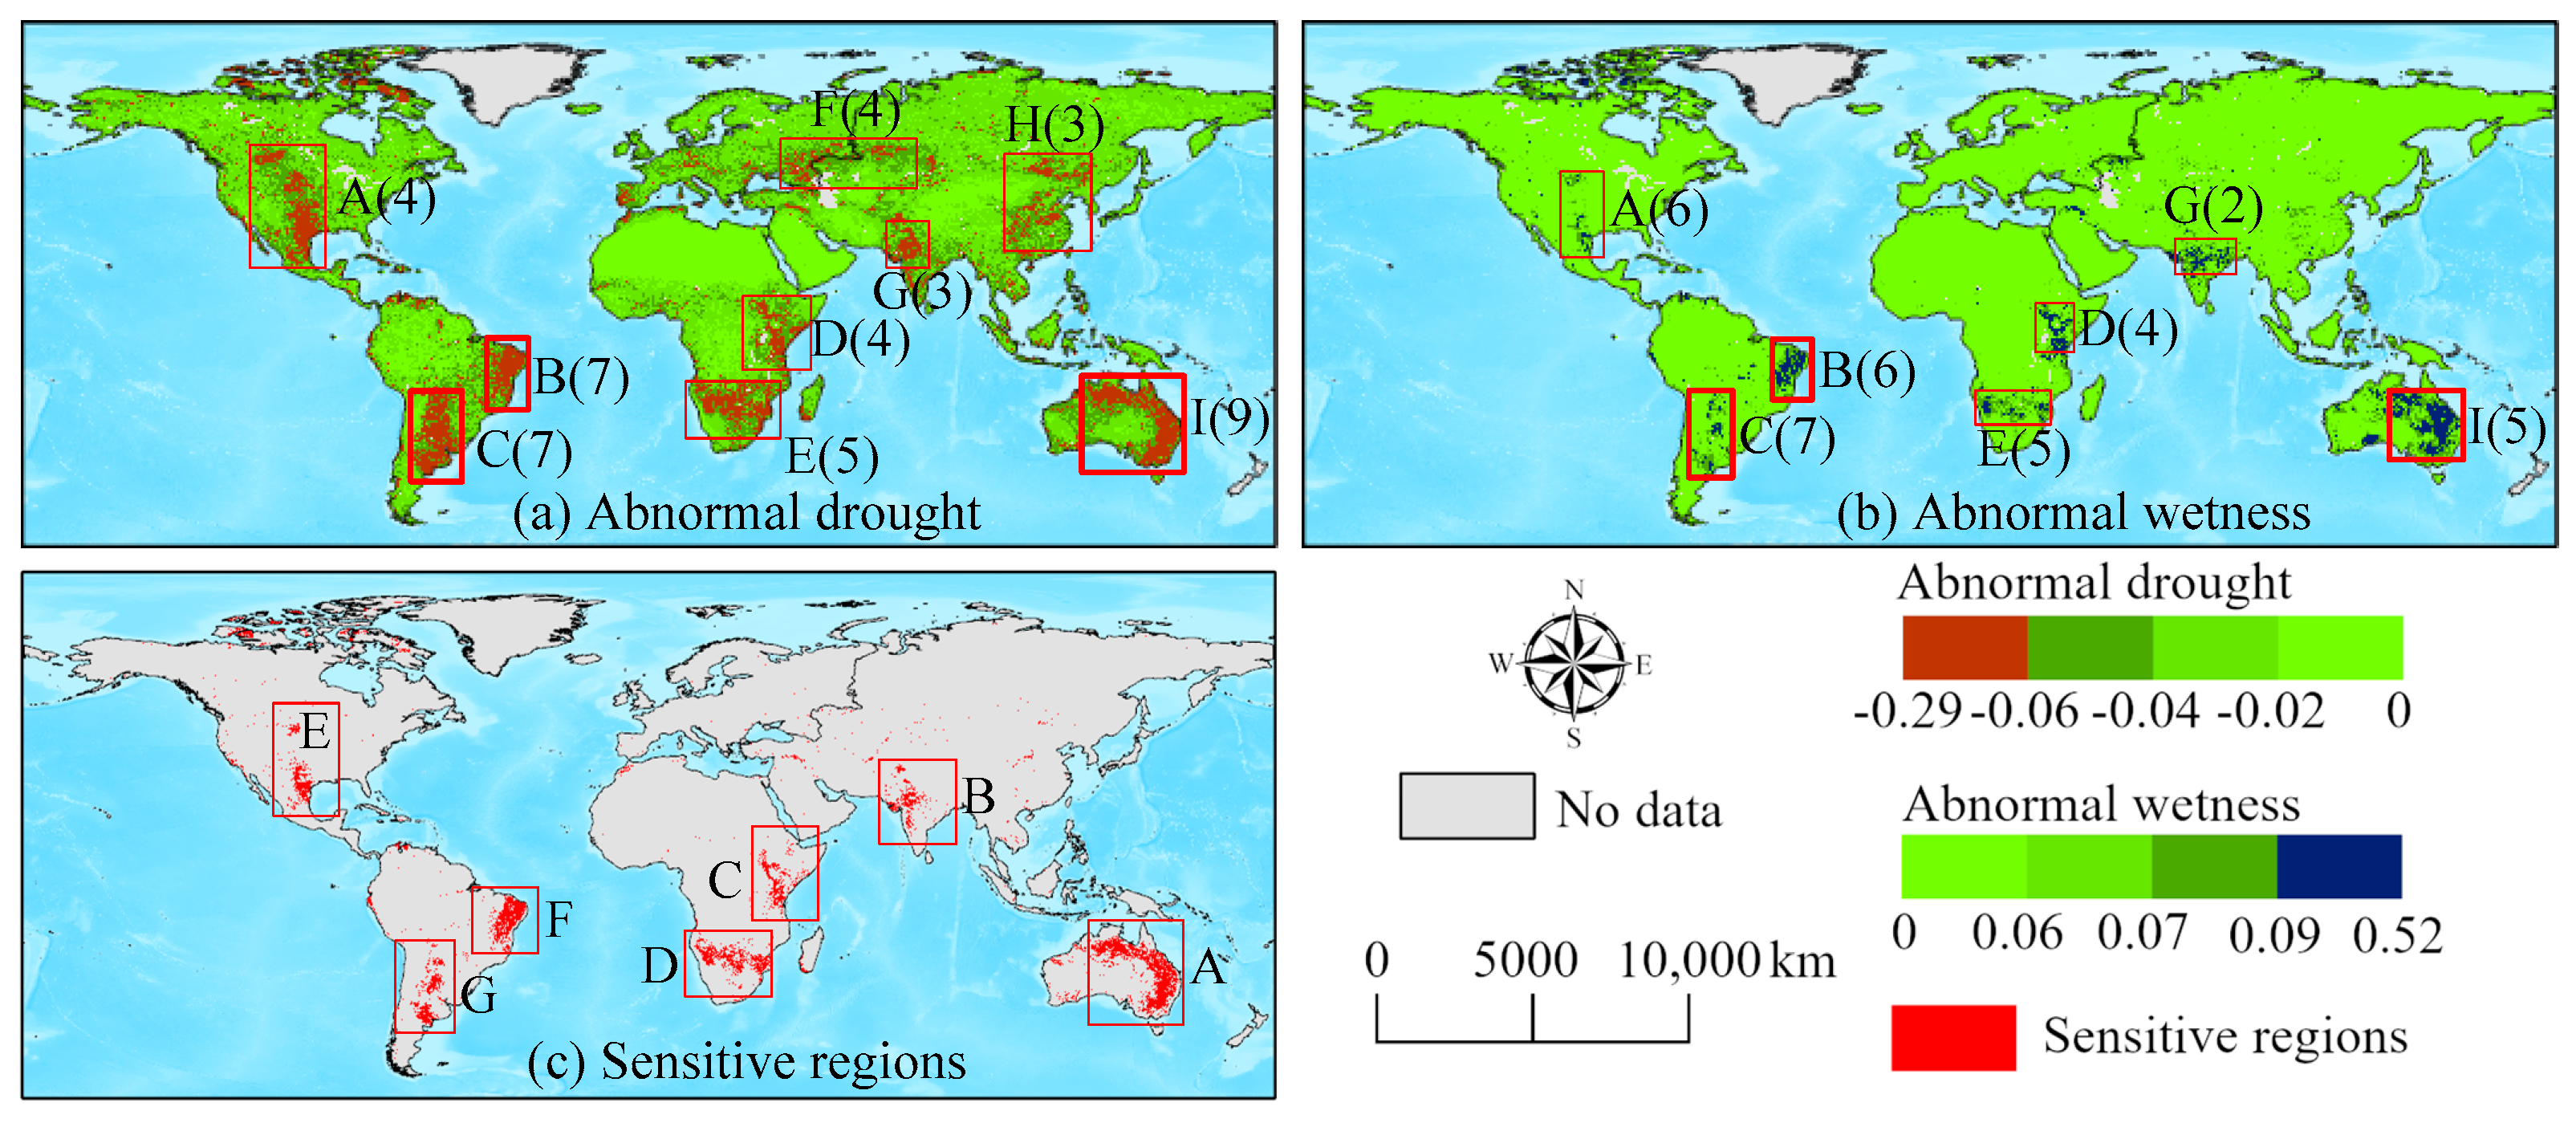
The globally abnormal drought-wetness areas are shown in Figure 10a,b. We found that areas that have frequently experienced abnormal drought conditions in the past 20 years also experience abnormal wetness conditions. Therefore, we define these areas as sensitive areas of abnormal drought-wetness. These areas were mainly found on the east coast of Australia (A), the Indus Basin of the Indian Peninsula (B), Victoria (C) and Katanga Plateau areas of Africa (D), the Mississippi River Basin of North America (E), the eastern part of the Brazilian Plateau, (F) and Pampas Plateau of South America (G) (Figure 10c).
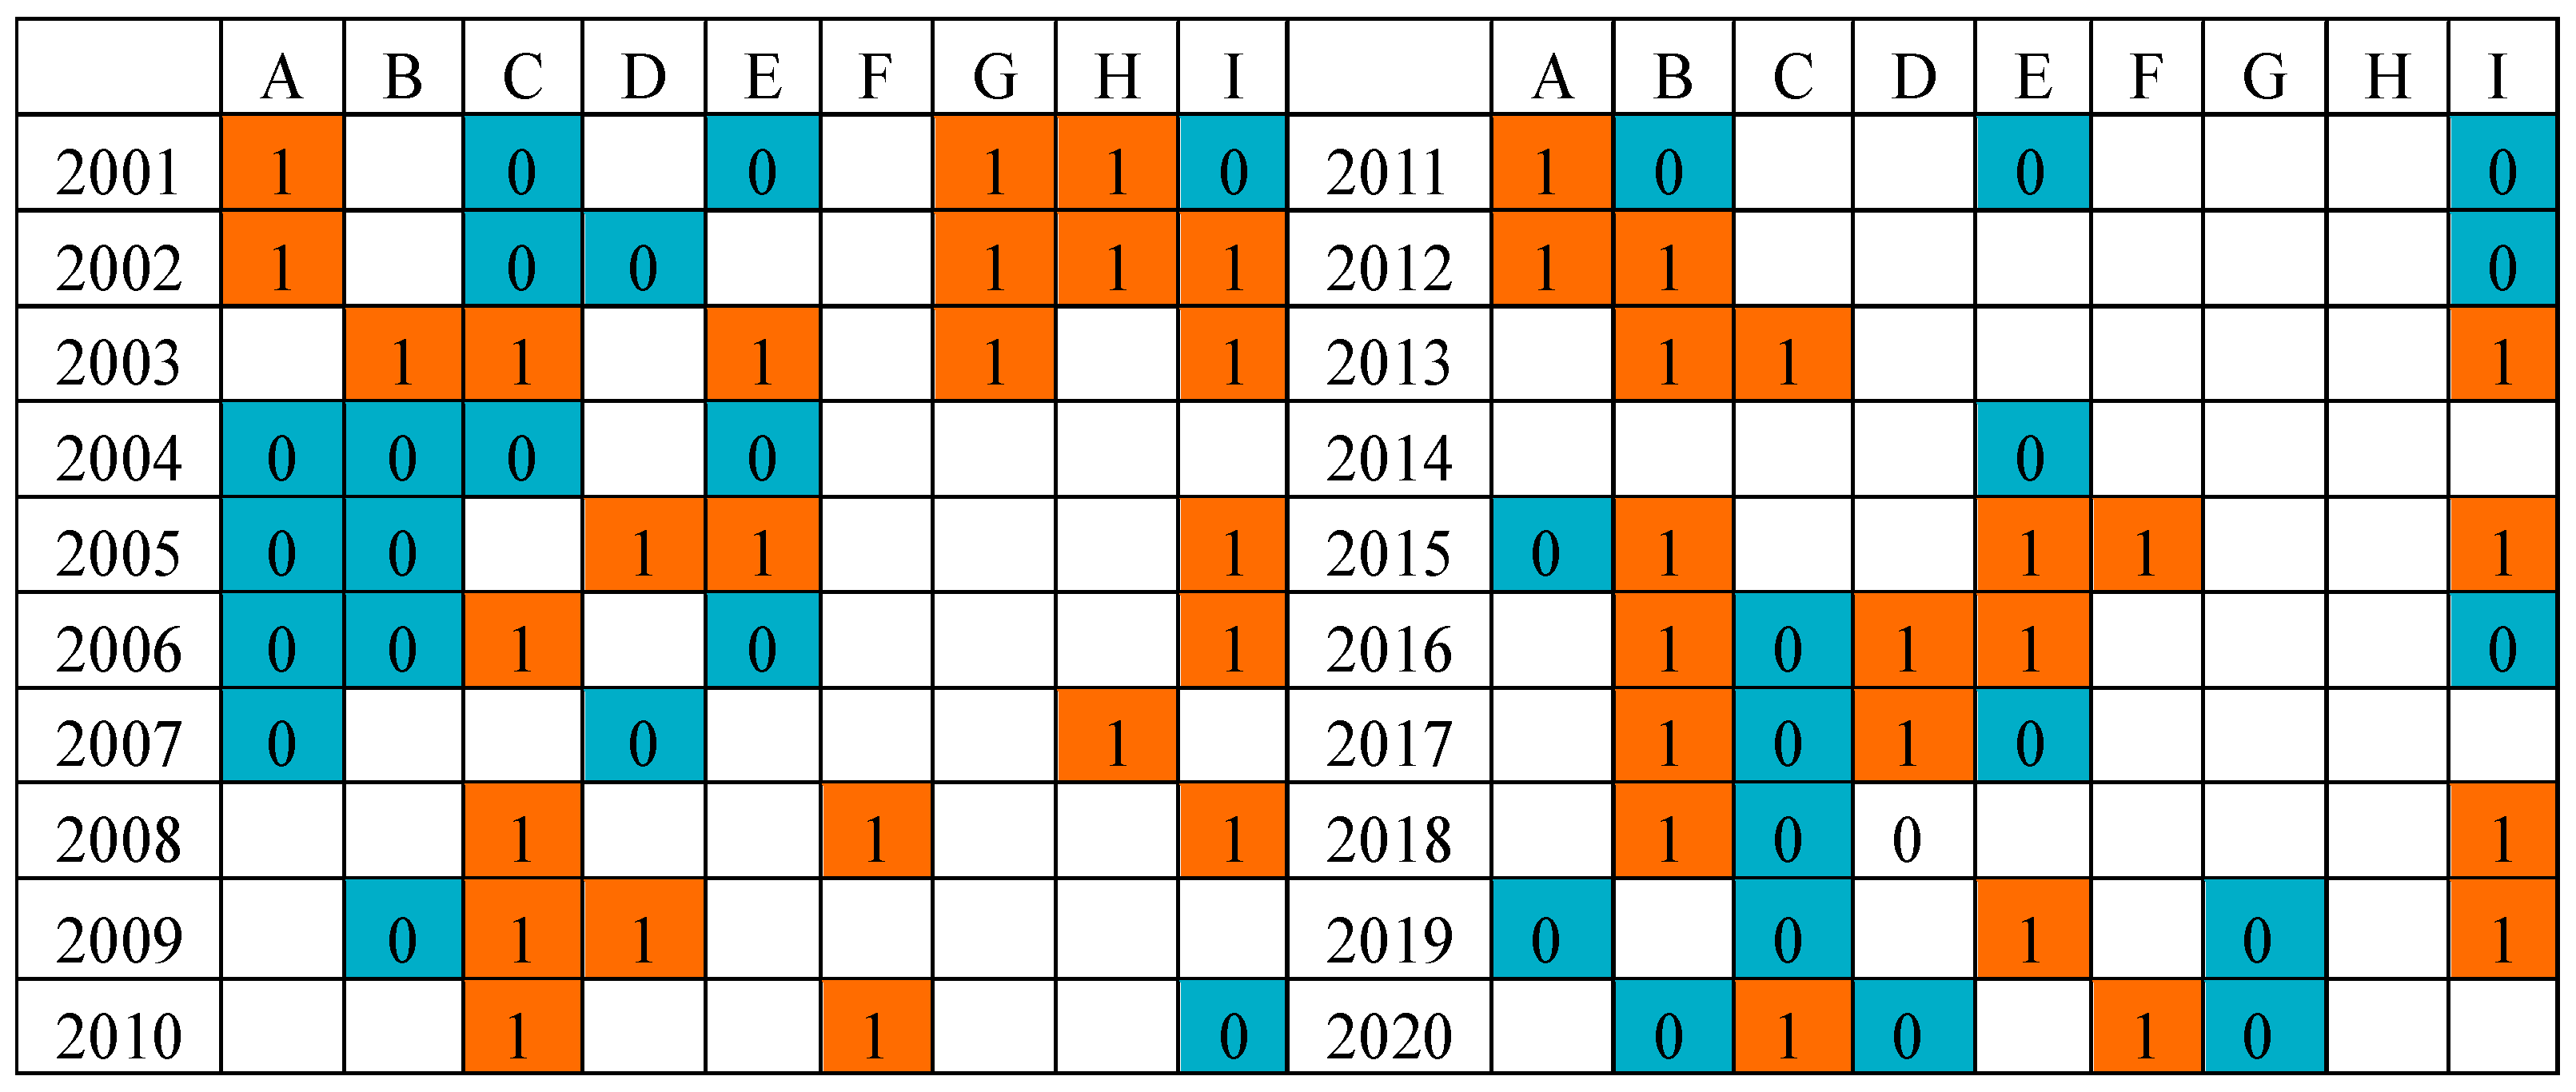
To investigate the frequency of global abnormal drought-wetness conditions, the numbers of abnormal drought-wetness events in the nine areas listed above over the 20 years were counted. The results showed that a total of 46 abnormal droughts (25.56% of the total number of drought events) and 35 abnormal wetness events (23.75% of the total number of wetness events) occurred over the 20 years of study (Figure 11).
5. Discussion
5.1. Relationship between Drought-Wetness Conditions and Land Cover Types
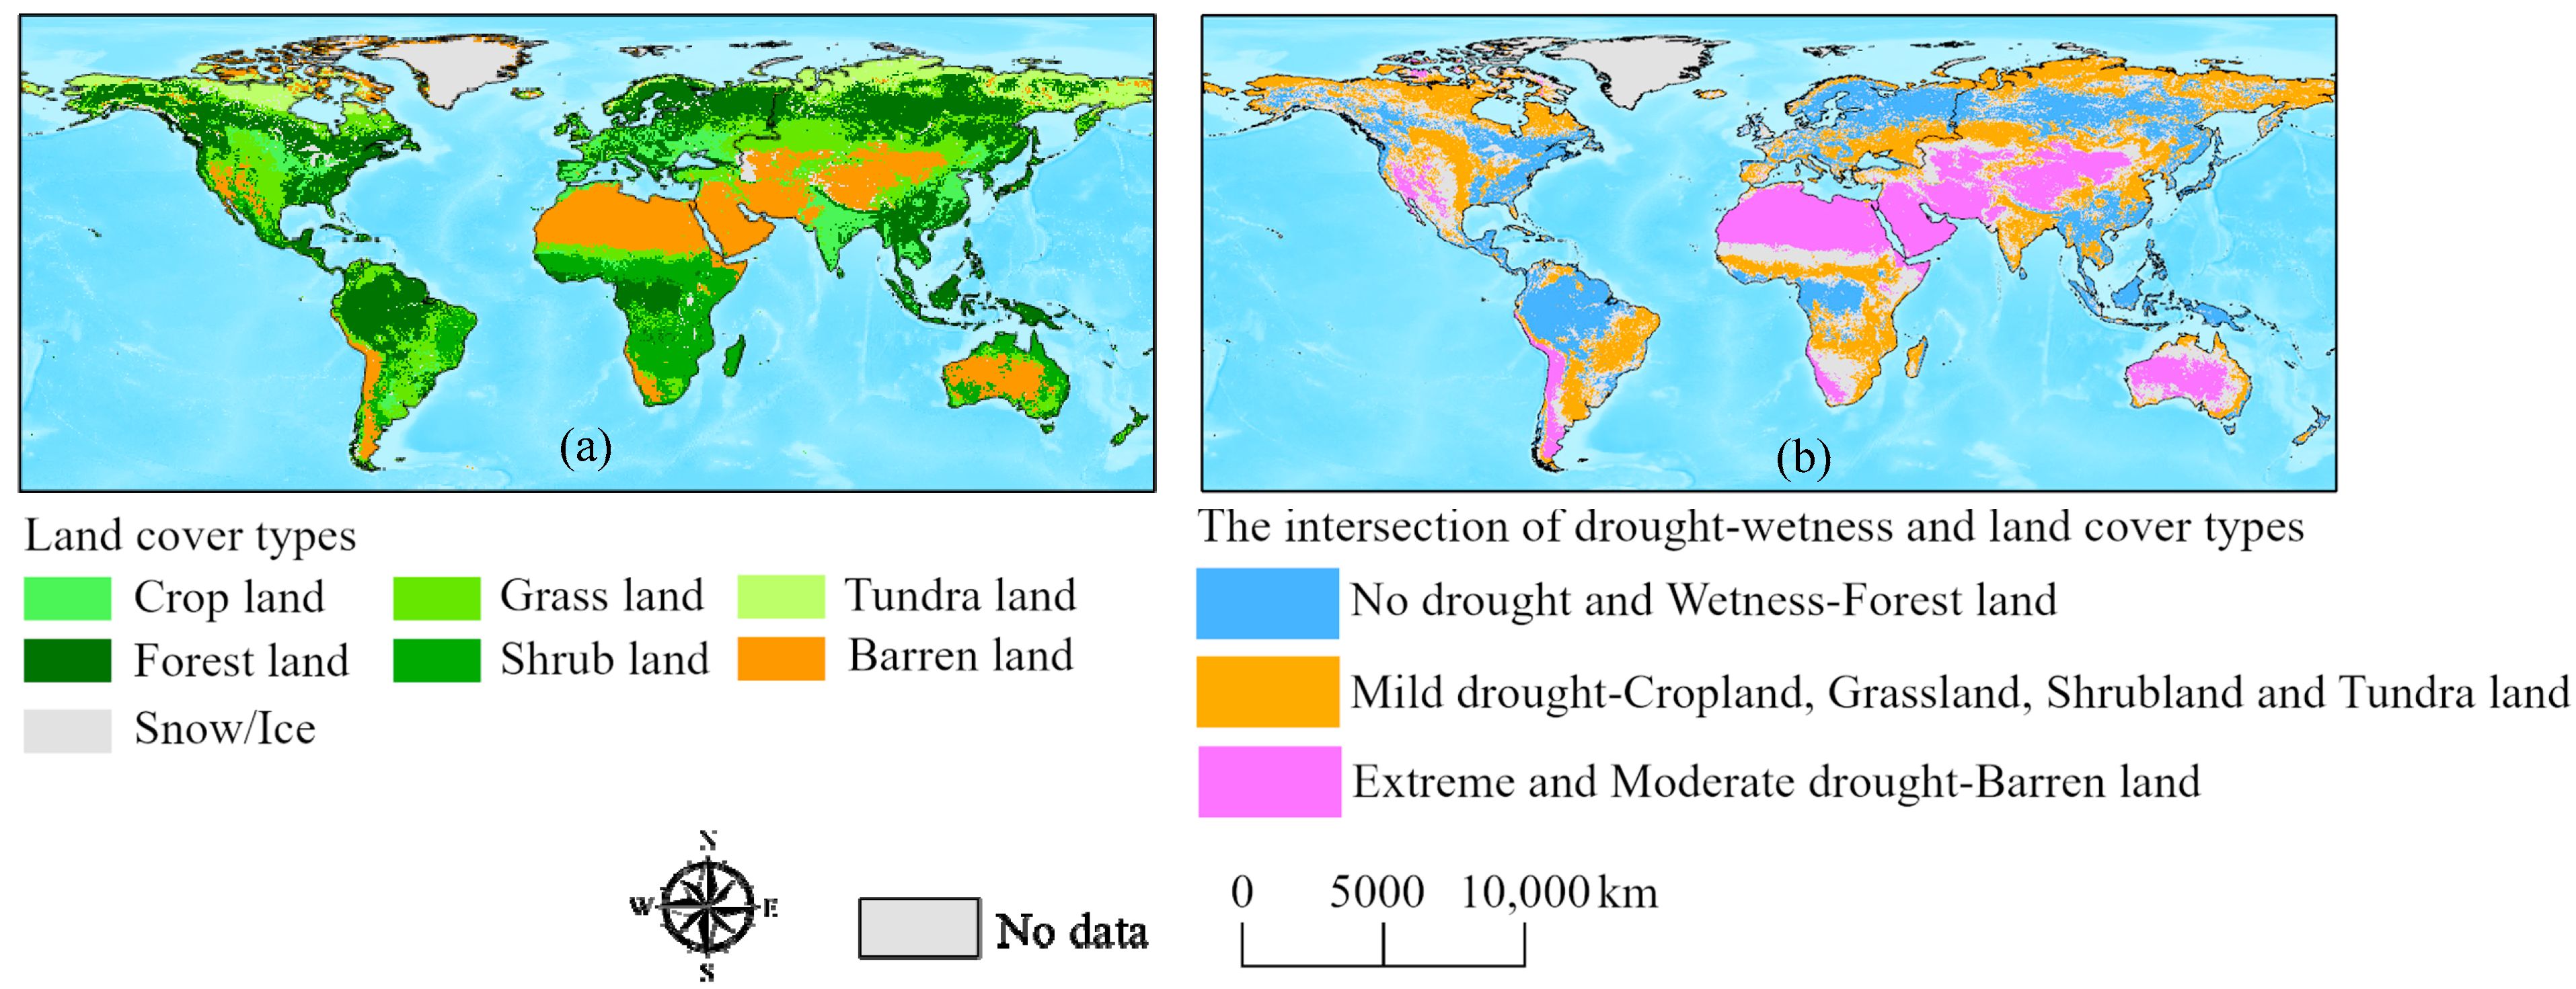
Global distribution of drought-wetness conditions is closely associated with land cover types (Figure 12a). Meanwhile, in our study, we found that the global drought-wetness conditions and land cover types had perfect spatial consistency (Figure 12b). The intersection of no drought and wetness with forest land accounted for 86.69% of the former and 67.91% of the latter because forest land usually receives abundant rainfall throughout the year, with high temperatures, rapid evapotranspiration, and vigorous vegetation growth. Therefore, drought conditions were rare in these areas. The intersection of mild drought with cropland, grassland, shrub land and tundra land accounted for 93.27% of the former and 59.52% of the latter. In addition, the intersection of extreme and moderate drought with barren land accounted for 58.33% of the former and 74.83% of the latter (Table 7). Thus, distinct land cover types significantly influence the global distribution of drought-wetness conditions, and similarly, changes in the latter variable feed back into the distribution of the former.
5.2. Response of Different Crop Yields to Global Drought-Wetness Change
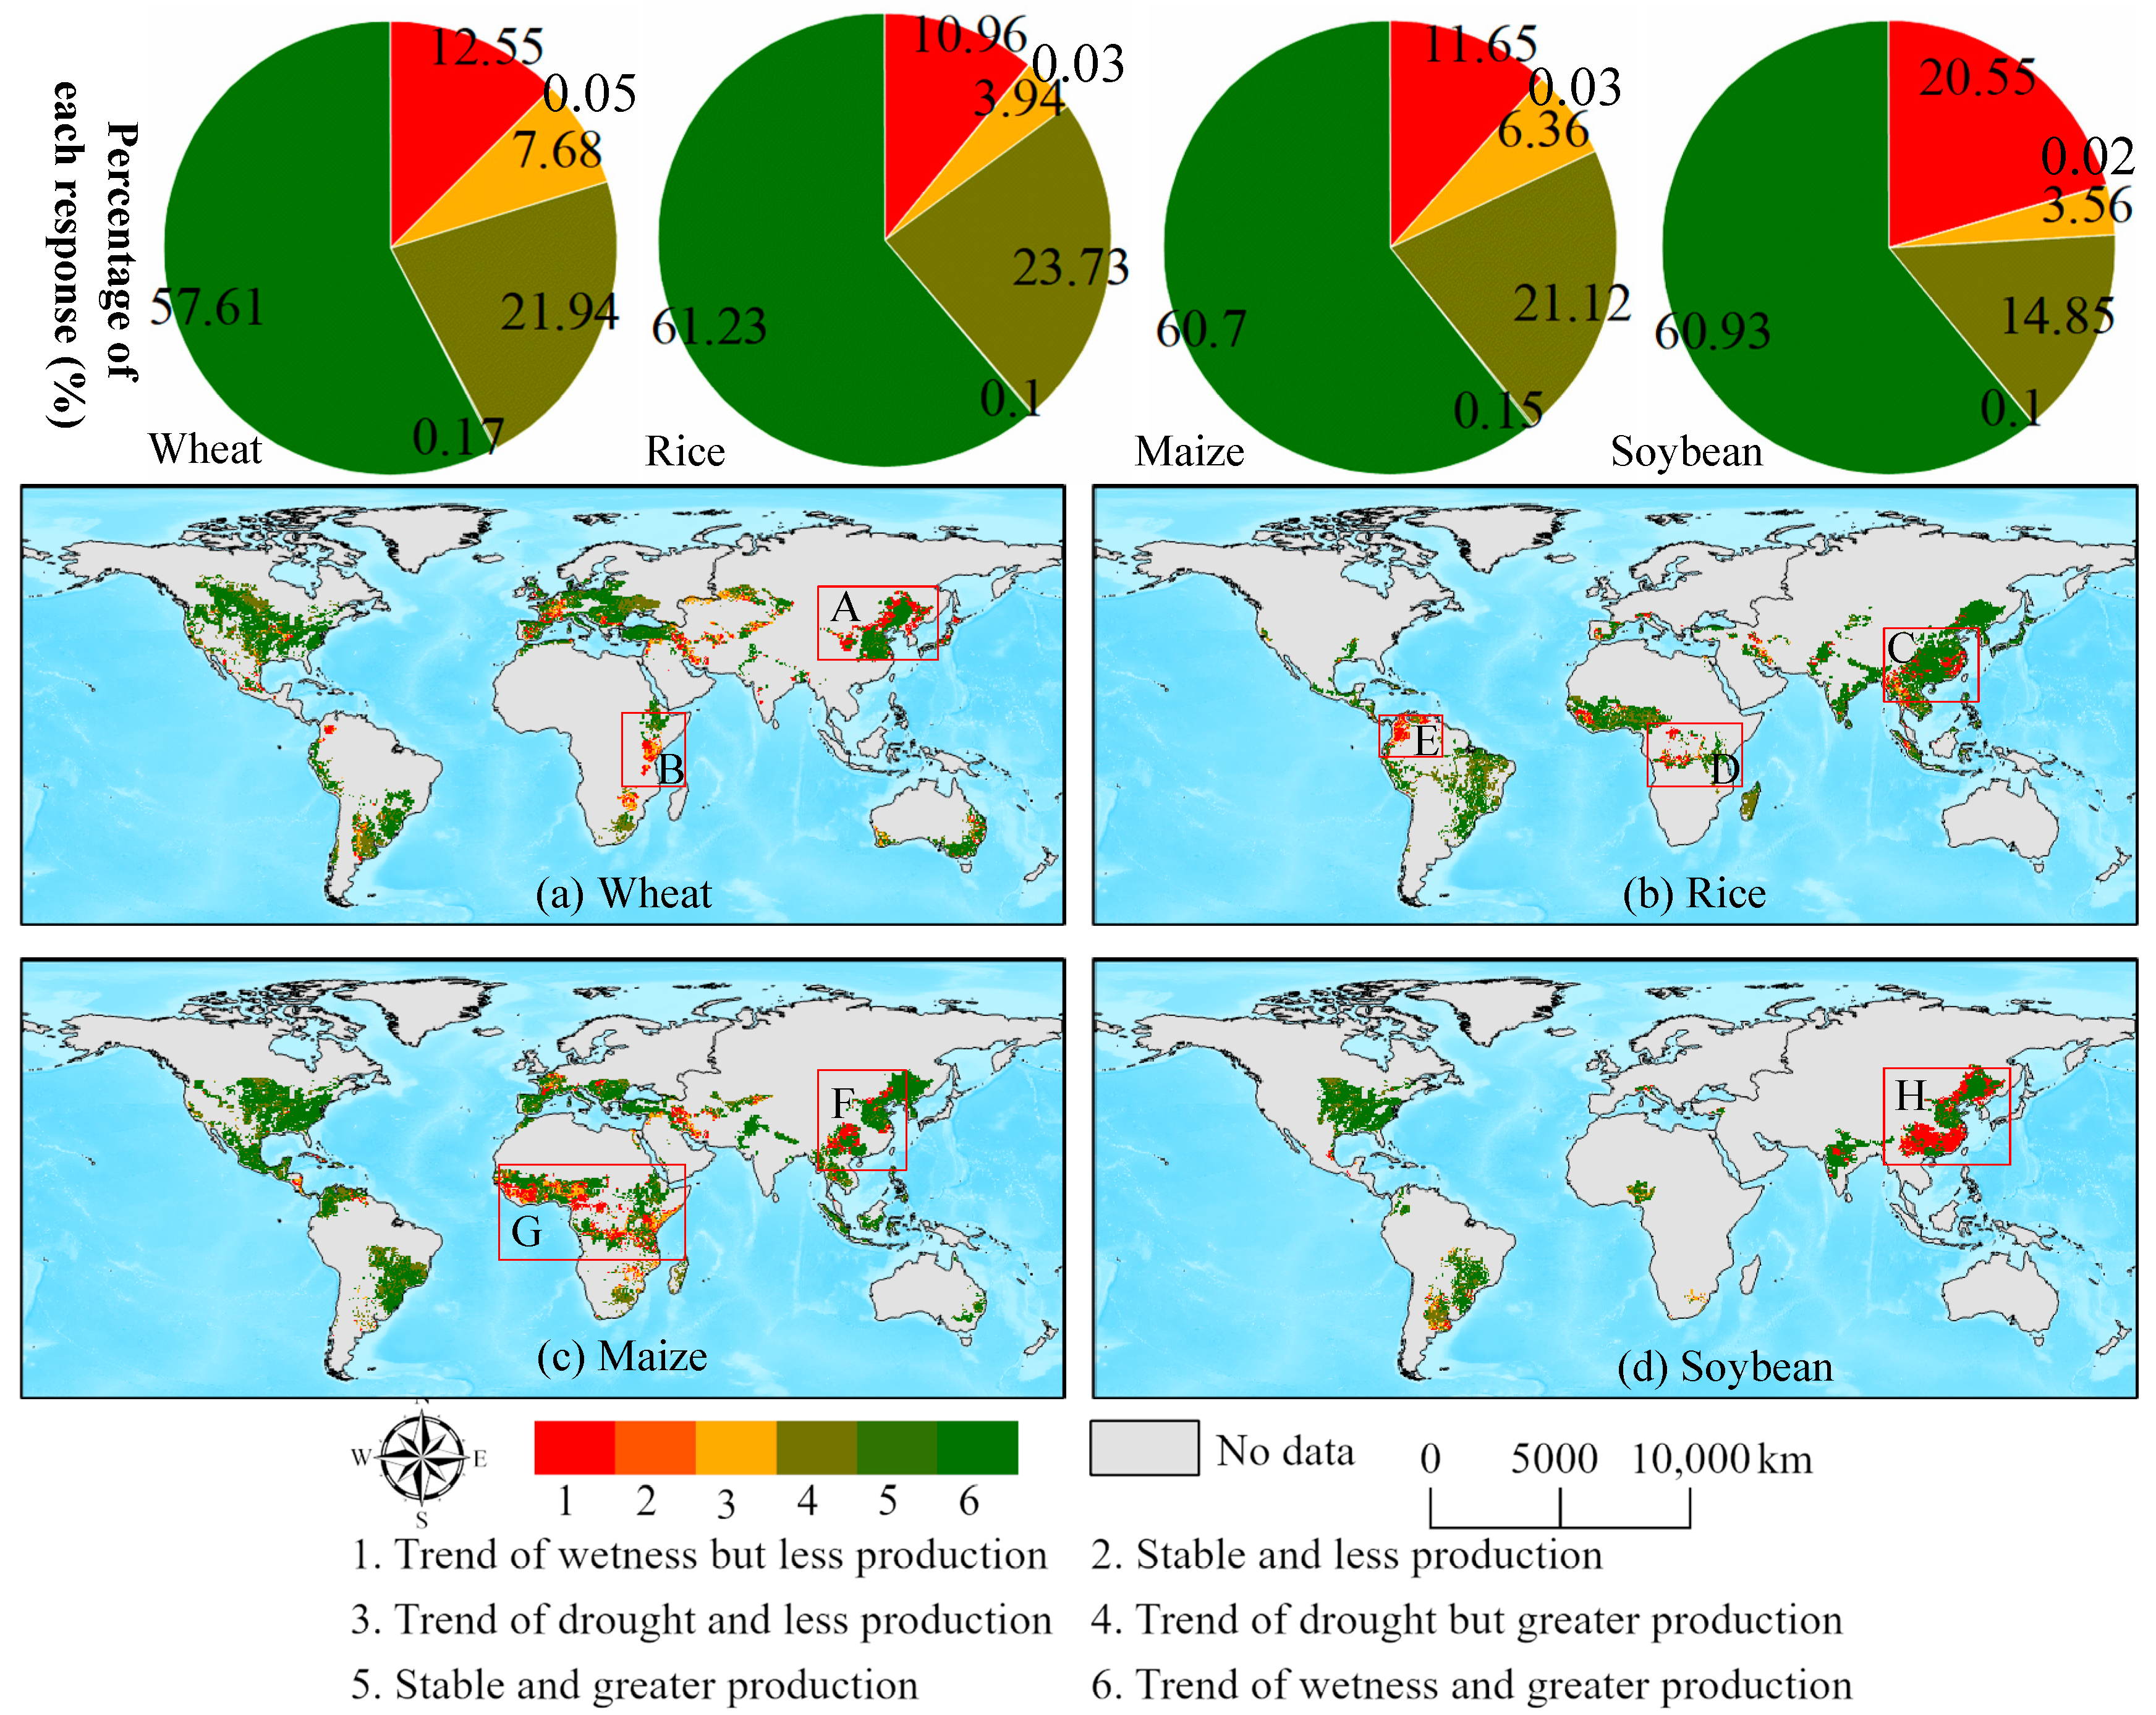
Drought can diminish the water availability and quality necessary for productive farms, ranches, and grazing lands. It can also contribute to insect infestations, increases in wildfires, and altered rates of carbon, nutrient, and water cycling, thereby impacting agricultural production and critical ecosystem services. Meanwhile, the occurrence of drought can inhibit crop growth and reduce crop yields [50,51]. In this study, we analyzed the responses of the yields of major crops (wheat, rice, maize, and soybean) to global drought-wetness changes. Figure 13 shows the results of this response. First, we found that regardless of the crop yield, it was observed that approximately 60% of the production areas exhibited a trend of wetness and greater production, and there were almost no production areas where drought-wetness changes did not occur. Second, approximately 20% of the wheat, rice and maize production areas demonstrated a trend of drought but greater production; for soybean production areas, this value was 14.85%. This indicates that these production areas responded to drought with possible human intervention to make the crop yield unaffected by drought. In addition, approximately 10% of the wheat, rice and maize production areas exhibited a trend of wetness but less production; for soybean production areas, this value was 20.55%. For example, wheat production in areas of northeastern China (A) and Ethiopia (B) (Figure 13a), rice production in areas of southern China (C), Congo (D), and northern South America (E) (Figure 13b), maize production in areas of southern China (F) and central Africa (G) (Figure 13c), and soybean production in areas of eastern and southern China (H) (Figure 13d) exhibited a trend of wetness but less production. This finding is inconsistent with the objective rule that a trend of wetness leads to increased yields. Therefore, these areas should adjust their industrial structures or improve their planted crop types.
5.3. Application of the Assessment Framework
This study employed the SDM to build a comprehensive remote sensing drought index, the SDDI, for monitoring global drought-wetness trends; this index can not only accurately and effectively identify extreme drought regions worldwide but can also stably monitor globally abnormal drought and sensitive regions. Thus, the SDDI can be effectively applied in large-scale drought monitoring studies. Effective drought monitoring often requires observations with both high spatial and temporal resolutions. On a small scale, if remote sensing image data with relatively high temporal and spatial resolutions can be used, small-scale drought events can be identified and monitored at an increasingly fine scale using this methodological process. Through more refined drought research, realistic agricultural needs and flooding research can be better served. Moreover, this set of monitoring methods can also be applied to different drought types; for example, extreme and abnormal agricultural and meteorological drought events can be monitored using this set of methods. Both agricultural and meteorological droughts are abrupt in nature. Therefore, studying long time-series abnormal droughts can help ascertain abnormal drought patterns and thus better serve agricultural and meteorological activities and research.
Drought has become a focal issue that directly affects industrial and agricultural production and the daily lives of residents and has received widespread attention from scholars [6,7,8]. The utilization of remote sensing and geographic information systems (GIS) technology for drought monitoring has achieved promising results, but some problems still exist [14]. A comprehensive foundational database needs to be established to allow basic data to be shared. Meteorological data and remote sensing monitoring data are kept in different departments, and poor data sharing among these various departments and the inability to obtain relevant information promptly are among the main reasons responsible for monitoring and analysis lags [9,22]. In addition, the development of remote sensing drought monitoring technology is relatively mature, but some problems still need to be studied in-depth; for example, in areas with complex topography, the influence of elevation on vegetation, ground temperature and other parameters is very great, and the influence of topographic factors should thus be considered more when monitoring drought in such areas [11,25].
6. Conclusions
Drought is a frequent disaster with widespread impacts on agricultural production, ecosystem protection, and the social economy. This study utilized RS data to assess drought conditions, focusing on the VCI, PCI, TCI, and SMCI variables to develop the SDDI using SDM. The main conclusions of this study are as follows:
- (1)
- The consistency areas of the SDDI with the SPEI1, SPEI3 and scPDSI as a percentage of the study area were 85.5%, 87.3%, and 85.1%, respectively, indicating that the SDDI can be used to monitor global drought-wetness conditions on a global scale;
- (2)
- A discernible spatial distribution pattern has emerged in global drought-wetness conditions in the past two decades. This pattern was characterized by the extreme drought mainly distributed deep within the continent, surrounded by expanding moderate drought, mild drought, and no drought areas;
- (3)
- On the annual scale, the SDDI was on an upward trend, while on the seasonal and monthly scale, it fluctuated steadily with a certain cycle, and the trend analysis revealed there was an overall trend of wetness worldwide;
- (4)
- The sensitive areas of drought-wetness were mainly found on the east coast of Australia, the Indus Basin of the Indian Peninsula, the Victoria and Katanga Plateau areas of Africa, the Mississippi River Basin of North America, the eastern part of the Brazilian Plateau and the Pampas Plateau of South America.
Author Contributions
Conceptualization, W.W. and J.W.; methodology, J.W.; software, X.W.; validation, J.W., L.M. and B.X.; formal analysis, W.W.; investigation, J.W.; resources, J.Z.; data curation, J.W.; writing—original draft preparation, J.W.; writing—review and editing, J.W.; visualization, H.Z.; supervision, W.W.; project administration, H.Z.; funding acquisition, W.W. All authors have read and agreed to the published version of the manuscript.
Funding
We gratefully acknowledge the support of the National Natural Science Foundation of China (grant numbers 42261023 and 41861040).
Data Availability Statement
Data sharing does not apply to this article.
Acknowledgments
We appreciate the MODIS, GLDAS, and GPM data support from NASA and the SPEI dataset from the Global SPEI database.
Conflicts of Interest
The authors declare no conflicts of interest.
References
- Lyons, D.S.; Dobrowski, S.Z.; Holden, Z.A.; Maneta, M.P.; Sala, A. Soil Moisture Variation Drives Canopy Water Content Dynamics across the Western U.S. Remote Sens. Environ. 2021, 253, 112233. [Google Scholar] [CrossRef]
- Liu, L.; Gudmundsson, L.; Hauser, M.; Qin, D.; Li, S.; Seneviratne, S.I. Soil Moisture Dominates Dryness Stress on Ecosystem Production Globally. Nat. Commun. 2020, 11, 4892. [Google Scholar] [CrossRef] [PubMed]
- West, H.; Quinn, N.; Horswell, M. Remote Sensing for Drought Monitoring & Impact Assessment: Progress, Past Challenges and Future Opportunities. Remote Sens. Environ. 2019, 232, 111291. [Google Scholar] [CrossRef]
- Zhang, L.; Jiao, W.; Zhang, H.; Huang, C.; Tong, Q. Studying Drought Phenomena in the Continental United States in 2011 and 2012 Using Various Drought Indices. Remote Sens Environ. 2017, 190, 96–106. [Google Scholar] [CrossRef]
- Ma, S.; Zhang, S.; Wang, N.; Huang, C.; Wang, X. Prolonged Duration and Increased Severity of Agricultural Droughts during 1978 to 2016 Detected by ESA CCI SM in the Humid Yunnan Province, Southwest China. Catena 2021, 198, 105036. [Google Scholar] [CrossRef]
- Wu, D.; Li, Z.; Zhu, Y.; Li, X.; Wu, Y.; Fang, S. A New Agricultural Drought Index for Monitoring the Water Stress of Winter Wheat. Agric. Water Manag. 2021, 244, 106599. [Google Scholar] [CrossRef]
- Henchiri, M.; Liu, Q.; Essifi, B.; Javed, T.; Zhang, S.; Bai, Y.; Zhang, J. Spatio-Temporal Patterns of Drought and Impact on Vegetation in North and West Africa Based on Multi-Satellite Data. Remote Sens. 2020, 12, 3869. [Google Scholar] [CrossRef]
- Amani, M.; Salehi, B.; Mahdavi, S.; Masjedi, A.; Dehnavi, S. Temperature-Vegetation-Soil Moisture Dryness Index (TVMDI). Remote Sens. Environ. 2017, 197, 1–14. [Google Scholar] [CrossRef]
- Brodribb, T.J.; Powers, J.; Cochard, H.; Choat, B. Hanging by a Thread? Forests and Drought. Science 2020, 368, 261–266. [Google Scholar] [CrossRef]
- Hao, C.; Zhang, J.; Yao, F. Combination of Multi-Sensor Remote Sensing Data for Drought Monitoring over Southwest China. Int. J. Appl. Earth Obs. Geoinf. 2015, 35, 270–283. [Google Scholar] [CrossRef]
- Yuan, X.; Ma, Z.; Pan, M.; Shi, C. Microwave Remote Sensing of Short-Term Droughts during Crop Growing Seasons. Geophys. Res. Lett. 2015, 42, 4394–4401. [Google Scholar] [CrossRef]
- Zargar, A.; Sadiq, R.; Naser, B.; Khan, F.I. A Review of Drought Indices. Environ. Rev. 2011, 19, 333–349. [Google Scholar] [CrossRef]
- Aghakouchak, A.; Farahmand, A.; Melton, F.S.; Teixeira, J.; Anderson, M.C.; Wardlow, B.D.; Hain, C.R. Reviews of Geophysics Remote Sensing of Drought: Progress, Challenges. Rev. Geophys. 2015, 53, 1–29. [Google Scholar] [CrossRef]
- Sun, F.; Mejia, A.; Zeng, P.; Che, Y. Projecting Meteorological, Hydrological and Agricultural Droughts for the Yangtze River Basin. Sci. Total Environ. 2019, 696, 134076. [Google Scholar] [CrossRef]
- Dutra, E.; Wetterhall, F.; Di Giuseppe, F.; Naumann, G.; Barbosa, P.; Vogt, J.; Pozzi, W.; Pappenberger, F. Global Meteorological Drought-Part 1: Probabilistic Monitoring. Hydrol. Earth Syst. Sci. 2014, 18, 2657–2667. [Google Scholar] [CrossRef]
- Wang, L.; Yu, H.; Yang, M.; Yang, R.; Gao, R.; Wang, Y. A Drought Index: The Standardized Precipitation Evapotranspiration Runo Ff Index. J. Hydrol. 2019, 571, 651–668. [Google Scholar] [CrossRef]
- Alizadeh, M.R.; Nikoo, M.R. A Fusion-Based Methodology for Meteorological Drought Estimation Using Remote Sensing Data. Remote Sens. Environ. 2018, 211, 229–247. [Google Scholar] [CrossRef]
- Park, S.; Im, J.; Park, S.; Rhee, J. Drought Monitoring Using High Resolution Soil Moisture through Multi-Sensor Satellite Data Fusion over the Korean Peninsula. Agric. Meteorol. 2017, 237–238, 257–269. [Google Scholar] [CrossRef]
- Guo, H.; Bao, A.; Liu, T.; Ndayisaba, F.; Jiang, L.; Zheng, G.; Chen, T.; De Maeyer, P. Determining Variable Weights for an Optimal Scaled Drought Condition Index (OSDCI): Evaluation in Central Asia. Remote Sens. Environ. 2019, 231, 111220. [Google Scholar] [CrossRef]
- Wang, S.; Mo, X.; Hu, S.; Liu, S.; Liu, Z. Assessment of Droughts and Wheat Yield Loss on the North China Plain with an Aggregate Drought Index (ADI) Approach. Ecol. Indic. 2018, 87, 107–116. [Google Scholar] [CrossRef]
- Wei, J.; Ma, Z. Comparison of Palmer Drought Severity Index, Percentage of Precipitation Anomaly and Surface Humid Index. Acta Geogr. 2003, 58, 117–124. [Google Scholar] [CrossRef]
- Wells, N.; Goddard, S.; Hayes, M.J. A Self-Calibrating Palmer Drought Severity Index. J. Clim. 2004, 17, 2335–2351. [Google Scholar] [CrossRef]
- McKee, T.B.; Doesken, N.J.; Kleist, J. The Relationship of Drought Frequency and Duration to Time Scales. In Proceedings of the Eighth Conference on Applied Climatology, Anaheim, CA, USA, 17–22 January 1993; pp. 17–22. [Google Scholar]
- Vicente-Serrano, S.M.; Beguería, S.; López-Moreno, J.I. A Multiscalar Drought Index Sensitive to Global Warming: The Standardized Precipitation Evapotranspiration Index. J. Clim. 2010, 23, 1696–1718. [Google Scholar] [CrossRef]
- Wang, P.-X.; Li, X.W.; Gong, J.Y.; Song, C. Vegetation Temperature Condition Index and Its Application for Drought Monitoring. Int. Geosci. Remote Sens. Symp. (IGARSS) 2001, 1, 141–143. [Google Scholar] [CrossRef]
- Kogan, F.N. Application of Vegetation Index and Brightness Temperature for Drought Detection. Adv. Space Res. 1995, 15, 91–100. [Google Scholar] [CrossRef]
- Du, L.; Tian, Q.; Yu, T.; Meng, Q.; Jancso, T.; Udvardy, P.; Huang, Y. A Comprehensive Drought Monitoring Method Integrating MODIS and TRMM Data. Int. J. Appl. Earth Obs. Geoinf. 2013, 23, 245–253. [Google Scholar] [CrossRef]
- Zhang, A.; Jia, G. Monitoring Meteorological Drought in Semiarid Regions Using Multi-Sensor Microwave Remote Sensing Data. Remote Sens. Environ. 2013, 134, 12–23. [Google Scholar] [CrossRef]
- Jiao, W.; Wang, L.; McCabe, M.F. Multi-Sensor Remote Sensing for Drought Characterization: Current Status, Opportunities and a Roadmap for the Future. Remote Sens. Environ. 2021, 256, 112313. [Google Scholar] [CrossRef]
- Tian, L.; Yuan, S.; Quiring, S.M. Evaluation of Six Indices for Monitoring Agricultural Drought in the South-Central United States. Agric. Meteorol. 2018, 249, 107–119. [Google Scholar] [CrossRef]
- Liu, X.; Zhu, X.; Zhang, Q.; Yang, T.; Pan, Y.; Sun, P. A Remote Sensing and Artificial Neural Network-Based Integrated Agricultural Drought Index: Index Development and Applications. Catena 2020, 186, 104394. [Google Scholar] [CrossRef]
- Wei, W.; Pang, S.; Wang, X.; Zhou, L.; Xie, B.; Zhou, J.; Li, C. Temperature Vegetation Precipitation Dryness Index (TVPDI)-Based Dryness-Wetness Monitoring in China. Remote Sens. Environ. 2020, 248, 111957. [Google Scholar] [CrossRef]
- Wei, W.; Zhang, J.; Zhou, J.; Zhou, L.; Xie, B.; Li, C. Monitoring Drought Dynamics in China Using Optimized Meteorological Drought Index (OMDI) Based on Remote Sensing Data Sets. J. Environ. Manag. 2021, 292, 112733. [Google Scholar] [CrossRef] [PubMed]
- Rhee, J.; Im, J.; Carbone, G.J. Monitoring Agricultural Drought for Arid and Humid Regions Using Multi-Sensor Remote Sensing Data. Remote Sens. Environ. 2010, 114, 2875–2887. [Google Scholar] [CrossRef]
- Hao, Z.; Singh, V.P. Drought Characterization from a Multivariate Perspective: A Review. J. Hydrol. 2015, 527, 668–678. [Google Scholar] [CrossRef]
- Liu, Q.; Zhang, S.; Zhang, H.; Bai, Y.; Zhang, J. Monitoring Drought Using Composite Drought Indices Based on Remote Sensing. Sci. Total Environ. 2020, 711, 134585. [Google Scholar] [CrossRef]
- Liu, H.; Gong, P.; Wang, J.; Clinton, N.; Bai, Y.; Liang, S. Annual Dynamics of Global Land Cover and Its Long-Term Changes from 1982 to 2015. Earth Syst. Sci. Data 2020, 12, 1217–1243. [Google Scholar] [CrossRef]
- Iizumi, T.; Sakai, T. The Global Dataset of Historical Yields for Major Crops 1981–2016. Sci. Data 2020, 7, 97. [Google Scholar] [CrossRef] [PubMed]
- Mitchell, S.W.; Remmel, T.K.; Csillag, F.; Wulder, M.A. Distance to Second Cluster as a Measure of Classification Confidence. Remote Sens. Environ. 2008, 112, 2615–2626. [Google Scholar] [CrossRef]
- Touma, D.; Ashfaq, M.; Nayak, M.A.; Kao, S.C.; Diffenbaugh, N.S. A Multi-Model and Multi-Index Evaluation of Drought Characteristics in the 21st Century. J. Hydrol. 2015, 526, 196–207. [Google Scholar] [CrossRef]
- Shen, Z.; Zhang, Q.; Singh, V.P.; Sun, P.; Song, C.; Yu, H. Agricultural Drought Monitoring across Inner Mongolia, China: Model Development, Spatiotemporal Patterns and Impacts. J. Hydrol. 2019, 571, 793–804. [Google Scholar] [CrossRef]
- Yang, S.E.; Wu, B.F. Calculation of Monthly Precipitation Anomaly Percentage Using Web-Serviced Remote Sensing Data. In Proceedings of the 2nd IEEE International Conference on Advanced Computer Control, ICACC 2010, Shenyang, China, 29–31 January 2010; Volume 5, pp. 621–625. [Google Scholar] [CrossRef]
- Milich, L.; Weiss, E. GAC NDVI Interannual Coefficient of Variation (CoV) Images: Ground Truth Sampling of the Sahel along North-South Transects. Int. J. Remote Sens. 2000, 21, 235–260. [Google Scholar] [CrossRef]
- Kisi, O.; Ay, M. Comparison of Mann–Kendall and Innovative Trend Method for Water Quality Parameters of the Kizilirmak River, Turkey. J. Hydrol. 2014, 513, 362–375. [Google Scholar] [CrossRef]
- Smadi, M.M.; Zghoul, A. A Sudden Change in Rainfall Characteristics in Amman, Jordan During the Mid 1950s. Am. J. Environ. Sci. 2006, 2, 84–91. [Google Scholar] [CrossRef]
- Berg, A.; Sheffield, J. Climate Change and Drought: The Soil Moisture Perspective. Curr. Clim. Chang. Rep. 2018, 4, 180–191. [Google Scholar] [CrossRef]
- Zhang, L.; Zhang, H.; Zhang, Q.; Li, Y.; Zhao, J. On the Potential Application of Land Surface Models for Drought Monitoring in China. Theor. Appl. Clim. 2017, 128, 649–665. [Google Scholar] [CrossRef]
- Ji, L.; Peters, A.J. Assessing Vegetation Response to Drought in the Northern Great Plains Using Vegetation and Drought Indices. Remote Sens. Environ. 2003, 87, 85–98. [Google Scholar] [CrossRef]
- dos Santos Silva, F.D.; da Costa, C.P.W.; dos Santos Franco, V.; Gomes, H.B.; da Silva, M.C.L.; dos Santos Vanderlei, M.H.G.; Costa, R.L.; da Rocha Júnior, R.L.; Cabral Júnior, J.B.; dos Reis, J.S.; et al. Intercomparison of Different Sources of Precipitation Data in the Brazilian Legal Amazon. Climate 2023, 11, 241. [Google Scholar] [CrossRef]
- Han, Z.; Huang, Q.; Huang, S.; Leng, G.; Bai, Q.; Liang, H.; Wang, L.; Zhao, J.; Fang, W. Spatial-Temporal Dynamics of Agricultural Drought in the Loess Plateau under a Changing Environment: Characteristics and Potential Influencing Factors. Agric. Water Manag. 2021, 244, 106540. [Google Scholar] [CrossRef]
- Zhou, X.; Wang, P.; Tansey, K.; Zhang, S.; Li, H.; Wang, L. Developing a Fused Vegetation Temperature Condition Index for Drought Monitoring at Field Scales Using Sentinel-2 and MODIS Imagery. Comput. Electron. Agric. 2020, 168, 105144. [Google Scholar] [CrossRef]
Figure 1.
Identification algorithm of abnormal wetness (AW) (a) and abnormal drought (AD) (b). all pixel values in AW greater than or equal to 0.06 and all pixel values in AD less than or equal to −0.06. Blue and brown pixels represent extreme wetness and extreme drought each year, respectively. And the (a,b) red boxes represent extreme wetness and extreme drought events in the past two decades (2001–2020), respectively.

Figure 2.
The Pearson correlation coefficient of the SDDI with the SPEI1 (a), SPEI3 (b) and scPDSI (c) at the spatial scale from 2000 to 2020. All the results passed the significance test (p < 0.05).
Figure 2.
The Pearson correlation coefficient of the SDDI with the SPEI1 (a), SPEI3 (b) and scPDSI (c) at the spatial scale from 2000 to 2020. All the results passed the significance test (p < 0.05).

Figure 3.
Global drought-wetness conditions. a–h are the areas of extreme drought.

Figure 4.
The average value of SDDI on the seasonal (a) and monthly scales (b).

Figure 5.
The average value of SDDI for each continent on the seasonal (a) and monthly scales (b).

Figure 6.
Spatial distribution of global drought-wetness conditions on the seasonal scale.

Figure 7.
Spatial distribution of global drought-wetness conditions on the monthly scale. Numbers 1–12 represent the January–December average of global drought–wetness conditions from 2001 to 2020, respectively.
Figure 7.
Spatial distribution of global drought-wetness conditions on the monthly scale. Numbers 1–12 represent the January–December average of global drought–wetness conditions from 2001 to 2020, respectively.

Figure 8.
The linear variation in the 20-year SDDI average value at monthly (a), seasonal (b), and annual scales (c).
Figure 8.
The linear variation in the 20-year SDDI average value at monthly (a), seasonal (b), and annual scales (c).

Figure 9.
The spatial trend of global drought-wetness conditions. The drought/wetness trend that passes the 95% significance test is significant, whereas the drought/wetness trend is slight.
Figure 9.
The spatial trend of global drought-wetness conditions. The drought/wetness trend that passes the 95% significance test is significant, whereas the drought/wetness trend is slight.

Figure 10.
The globally abnormal drought areas (a), abnormal wetness areas (b) and sensitive areas (c). The letters and numbers in (a,b) represent the number of abnormal drought and abnormal drought events from 2001 to 2020, respectively. The letters in (c) represent sensitive regions for global drought-wetness conditions.

Figure 11.
Abnormal drought-wetness events in different areas. The 1 in the brown box indicates an abnormal drought event, and the 0 in the bule box indicates an abnormal wetness event. A–I represent the nine areas with abnormal drought-wetness events across the world.
Figure 11.
Abnormal drought-wetness events in different areas. The 1 in the brown box indicates an abnormal drought event, and the 0 in the bule box indicates an abnormal wetness event. A–I represent the nine areas with abnormal drought-wetness events across the world.

Figure 12.
(a) Land cover types. (b) Intersections between drought-wetness conditions and land cover types. In the legend, “-” stands for the two sides of the intersection.
Figure 12.
(a) Land cover types. (b) Intersections between drought-wetness conditions and land cover types. In the legend, “-” stands for the two sides of the intersection.

Figure 13.
Responses of different crops yields to global drought-wetness change. A–H represents production areas with a trend of wetness but less production.
Figure 13.
Responses of different crops yields to global drought-wetness change. A–H represents production areas with a trend of wetness but less production.


Table 1.
MODIS/Terra data information.
| Production | Time | Spatial Resolution | Temporal Resolution | Description | Source |
|---|---|---|---|---|---|
| MOD13C2_NDVI | January 2001–December 2020 | 0.05 Deg (5 km) | Monthly | Building VCI | http://modis.gsfc.nasa.gov (accessed on 30 November 2021) |
| MOD11C3_LST | January 2001–December 2020 | 0.05 Deg (5 km) | Monthly | Building TCI |
Table 2.
Datasets information. All data accessed on 30 November 2021.
| Data Type | Production | Time | Spatial Resolution | Temporal Resolution | Source |
|---|---|---|---|---|---|
| SPEI | SPEI1, SPEI3 | January 2001–December 2020 | 0.5 Deg (55 km) | Monthly | https://spei.csic.es/map |
| scPDSI | scPDSI- 4.05 early | January 2001–December 2020 | 0.5 Deg (55 km) | Monthly | http://climexp.knmi.nl |
| Land cover types | GLASS-GLC | 2020 | 5 km | Yearly | https://essd.copernicus.org |
| Crop yields | - | 2001–2016 | 0.5 Deg (55 km) | Yearly | https://www.nature.com/sdata |
Table 3.
Calculation of TCI, VCI, PCI and SMCI.
| Single Drought Indices | Data Source | Formula |
|---|---|---|
| TCI | MOD11C3_LST | |
| VCI | MOD13C2_NDVI | |
| PCI | GPM_P | |
| SMCI | GLDAS_SM |
Table 4.
The classification of global drought-wetness conditions.
| SDDI | Drought-Wetness Class |
|---|---|
| 0–0.4 | Extreme drought |
| 0.4–0.6 | Moderate drought |
| 0.6–0.8 | Mild drought |
| 0.8–1 | No drought |
| 1–2 | Wetness |
Table 5.
The consistency area of SDDI with SPEI1, SPEI3 and scPDSI across continents as a percentage (%) of the global land surface total area.
Table 5.
The consistency area of SDDI with SPEI1, SPEI3 and scPDSI across continents as a percentage (%) of the global land surface total area.
| Consistency | Asia | Australia | Europe | North America | South America | Africa |
|---|---|---|---|---|---|---|
| SDDI~SPEI1 | 87.1 | 99.4 | 85.4 | 77.4 | 89.9 | 85.0 |
| SDDI~SPEI3 | 87.3 | 99.7 | 84.4 | 78.8 | 90.8 | 89.5 |
| SDDI~scPDSI | 88.5 | 98.8 | 78.8 | 78.9 | 84.0 | 88.5 |
| Average | 87.6 | 99.3 | 82.9 | 78.4 | 88.2 | 87.7 |
Table 6.
Area percentage (%) of different drought classes for each continent as the global land surface area.
Table 6.
Area percentage (%) of different drought classes for each continent as the global land surface area.
| Drought Classes | Asia | Australia | Europe | North America | South America | Africa | Total |
|---|---|---|---|---|---|---|---|
| Extreme drought | 4.74 | 1.05 | 0.00 | 0.25 | 0.39 | 8.67 | 15.10 |
| Moderate drought | 7.58 | 3.75 | 0.17 | 2.34 | 1.41 | 4.75 | 19.99 |
| Mild drought | 11.42 | 0.84 | 3.07 | 8.35 | 4.01 | 5.65 | 33.35 |
| No drought | 9.74 | 0.23 | 4.12 | 5.25 | 7.43 | 3.87 | 30.63 |
| Wetness | 0.44 | 0.00 | 0.03 | 0.13 | 0.34 | 0.00 | 0.93 |
| Total | 33.91 | 5.88 | 7.38 | 16.32 | 13.58 | 22.94 | 100.00 |
Table 7.
The intersection areas of drought-wetness and land cover types as a percentage of both.
| Intersection Areas | Intersection Areas as a Percentage of Drought-Wetness (%) | Intersection Areas as a Percentage of Land Cover Types (%) |
|---|---|---|
| No drought and Wetness—Forest land | 86.69 | 67.91 |
| Mild drought—Cropland, Grassland, Shrub land and Tundra land | 93.27 | 59.52 |
| Extreme and Moderate drought—Barren land | 58.33 | 74.83 |
Disclaimer/Publisher’s Note: The statements, opinions and data contained in all publications are solely those of the individual author(s) and contributor(s) and not of MDPI and/or the editor(s). MDPI and/or the editor(s) disclaim responsibility for any injury to people or property resulting from any ideas, methods, instructions or products referred to in the content. |
© 2024 by the authors. Licensee MDPI, Basel, Switzerland. This article is an open access article distributed under the terms and conditions of the Creative Commons Attribution (CC BY) license (https://creativecommons.org/licenses/by/4.0/).
Share and Cite
MDPI and ACS Style
Wei, W.; Wang, J.; Ma, L.; Wang, X.; Xie, B.; Zhou, J.; Zhang, H. Global Drought-Wetness Conditions Monitoring Based on Multi-Source Remote Sensing Data. Land 2024, 13, 95. https://doi.org/10.3390/land13010095
AMA Style
Wei W, Wang J, Ma L, Wang X, Xie B, Zhou J, Zhang H. Global Drought-Wetness Conditions Monitoring Based on Multi-Source Remote Sensing Data. Land. 2024; 13(1):95. https://doi.org/10.3390/land13010095
Chicago/Turabian StyleWei, Wei, Jiping Wang, Libang Ma, Xufeng Wang, Binbin Xie, Junju Zhou, and Haoyan Zhang. 2024. "Global Drought-Wetness Conditions Monitoring Based on Multi-Source Remote Sensing Data" Land 13, no. 1: 95. https://doi.org/10.3390/land13010095
Note that from the first issue of 2016, this journal uses article numbers instead of page numbers. See further details here.