1. Introduction
Rapid urban population agglomeration has led to the continuous low-quality spread of urban construction land to the suburbs and the continuous erosion of green resources outside the built-up area of Shanghai [
1]. This results in the destruction of the original relatively stable and intact green resources, thus reducing the regional ecosystem’s service function and seriously affecting the health and well-being of urban and rural residents [
2]. Therefore, this study focused on the regional green space outside the urban built-up area, which is defined in the Standard for classification of urban green space (CJJ/T 85-2017) of the People’s Republic of China [
3] as non-constructed land located outside the built-up area, and is divided into four main types: woodland, grassland, wetland, and all three combined. Regional green space is a collection of important ecological resources that support the operation of regional ecosystem services and directly or indirectly affect human well-being, including climate regulation, the production and protection of regional facilities, seedling production, recreation and leisure spaces, and the provision of habitats for species [
4]. Currently, the regional green space outside the built-up area suffers from the impact of urban expansion, especially the loss of regional green space in economically developed areas [
5]. Shanghai, as the most economically developed area in China, has experienced dramatic changes in the surrounding area of regional green space after rapid urban expansion due to the dual role of economic development and the rise of the concept of ecological civilization [
6].
The concept of regional green space appears less frequently in theory and practice outside of China, but land with the characteristics of regional green space is more represented in the relevant green concepts of various countries, such as the greenway network in North America [
7], the pan-European ecological network planning [
8], the UK’s idyllic city [
9], the UK Green Belt Act (Green Belt Act) [
10], etc. These concepts are more reflective of regionally integrated conservation features [
11]. In different countries and at different research scales, the form of regional green space also varies greatly, and the scope of research includes both micro, single green space resources, such as the United States Central Park [
12], Hong Kong country parks [
13], the United Kingdom Green Belt [
14], etc., and macro-scale combinations of a variety of regional green space resources across several administrative jurisdictions, such as the greenway network in North America, the sapphire necklace in Europe, etc. [
15]. These pathways link regional green spaces such as nature reserves and national parks to maintain the regional ecological balance and conserve wildlife habitats [
16]. These concepts do not distinguish between inside and outside of cities, and they include all green resources, emphasizing the natural functions of regional green spaces such as species protection, habitat maintenance, and ecological environmental protection [
17]. The concept of regional green space in China was put forward late and is now still in the early stage; in addition, the concept of regional green space varied greatly across different disciplines before the promulgation of the concept of regional green space in the Standard for classification of urban green space (CJJ/T 85-2017). Scholars [
18] have discussed the classification of regional green space and the significance of generating it, which has greatly promoted the development of regional green spaces. After the concept of regional green space was clarified, Scoot discussed a control strategy for regional green spaces in the discipline of landscape architecture from the perspective of a park city [
19]. Zhou analyzed the connotation and characteristics of regional green space from the categorization adjustment of “other green space” to “regional green space” [
20]. Through this analysis, it was found that most of the existing regional green space studies start from the perspectives of classification, connotation, and control strategies, and there are few studies involving dynamically changing regional green space data and the identification of spatial pattern characteristics. Although there have been studies on urban green spaces or green space patterns [
21] (although only within the built-up area or the entire region), there are no studies on the dynamically changing regional green space outside the built-up area and its spatial characteristics [
22]. The lack of accurate identification techniques and the lack of spatial characteristics of regional green space data are not conducive to the development of regional ecological environments and regional integration [
1,
23,
24].
Thus, this study took the regional green space outside the built-up area of Shanghai as the research object based on three points: (1) Shanghai’s rapid social and economic development in the past three decades attaches great importance to the construction of an ecological civilization, and takes the lead in the preparation of the relevant ecological planning within the country, making outstanding contributions to the protection and development of ecological resources outside the scope of the built-up area of the city. In addition, the development of regional green space outside the urban built-up area is protected and developed accordingly, which has value as a reference for other cities [
25]. (2) Shanghai is ranked as the leading city in the whole country in terms of its gross social and economic development value, and its early social and economic development cannot be separated from its urban expansion, which has led to dramatic changes in the ecological resources of the green space outside the built-up area of the city. These dramatic changes in the characteristics of and laws regarding this regional green space are of greater reference value for the regional environment of Shanghai as well as for other developing cities. (3) The sustainable development of Shanghai under the new situation will inevitably put forward higher requirements for the development and management of regional ecological resources. At the regional level, Shanghai is a core city in promoting the integrated development of the Yangtze River Delta and, at the international level, Shanghai is developing into a global city of excellence [
26]. Based on development needs at the regional and international levels, the identification of Shanghai’s regional spatial green resources and their characteristics not only can provide important practical support for the reconstruction of Shanghai’s regional ecological environmental protection and optimization, but also plays an important role in the construction of Shanghai as a city of global excellence and the development of the Yangtze River Delta Integration Demonstration Area.
Accordingly, the scientific question of this paper is: how can we scientifically collect dynamic data on the regional green space in Shanghai, which is constantly changing with the expansion of the built-up area? Further, how can we scientifically identify the multi-stage evolution characteristics of the spatial pattern of Shanghai’s regional green space? To address these scientific problems, we used the Google Earth Engine (GEE) platform [
27], machine learning [
28], biophysical composition (biophysical composition index) [
29], CA binarization, and other technical methods to construct a technical method for the identification of regional green spaces. We extracted dynamic data information for the regional green space in Shanghai and adopted a Sankey diagram and spatial pattern index [
30] to discriminate the multi-stage evolution characteristics of regional green space pattern in Shanghai. Therefore, this paper reveals the spatial pattern evolution characteristics during the period of 2000–2020 from the three steps of “dynamic data extraction—characterization of spatial pattern evolution—discussion and summary of the problem”, which will provide a reference for the future construction of green space in Shanghai as well as other urban areas.
2. Materials and Methods
2.1. Overview of the Study Area
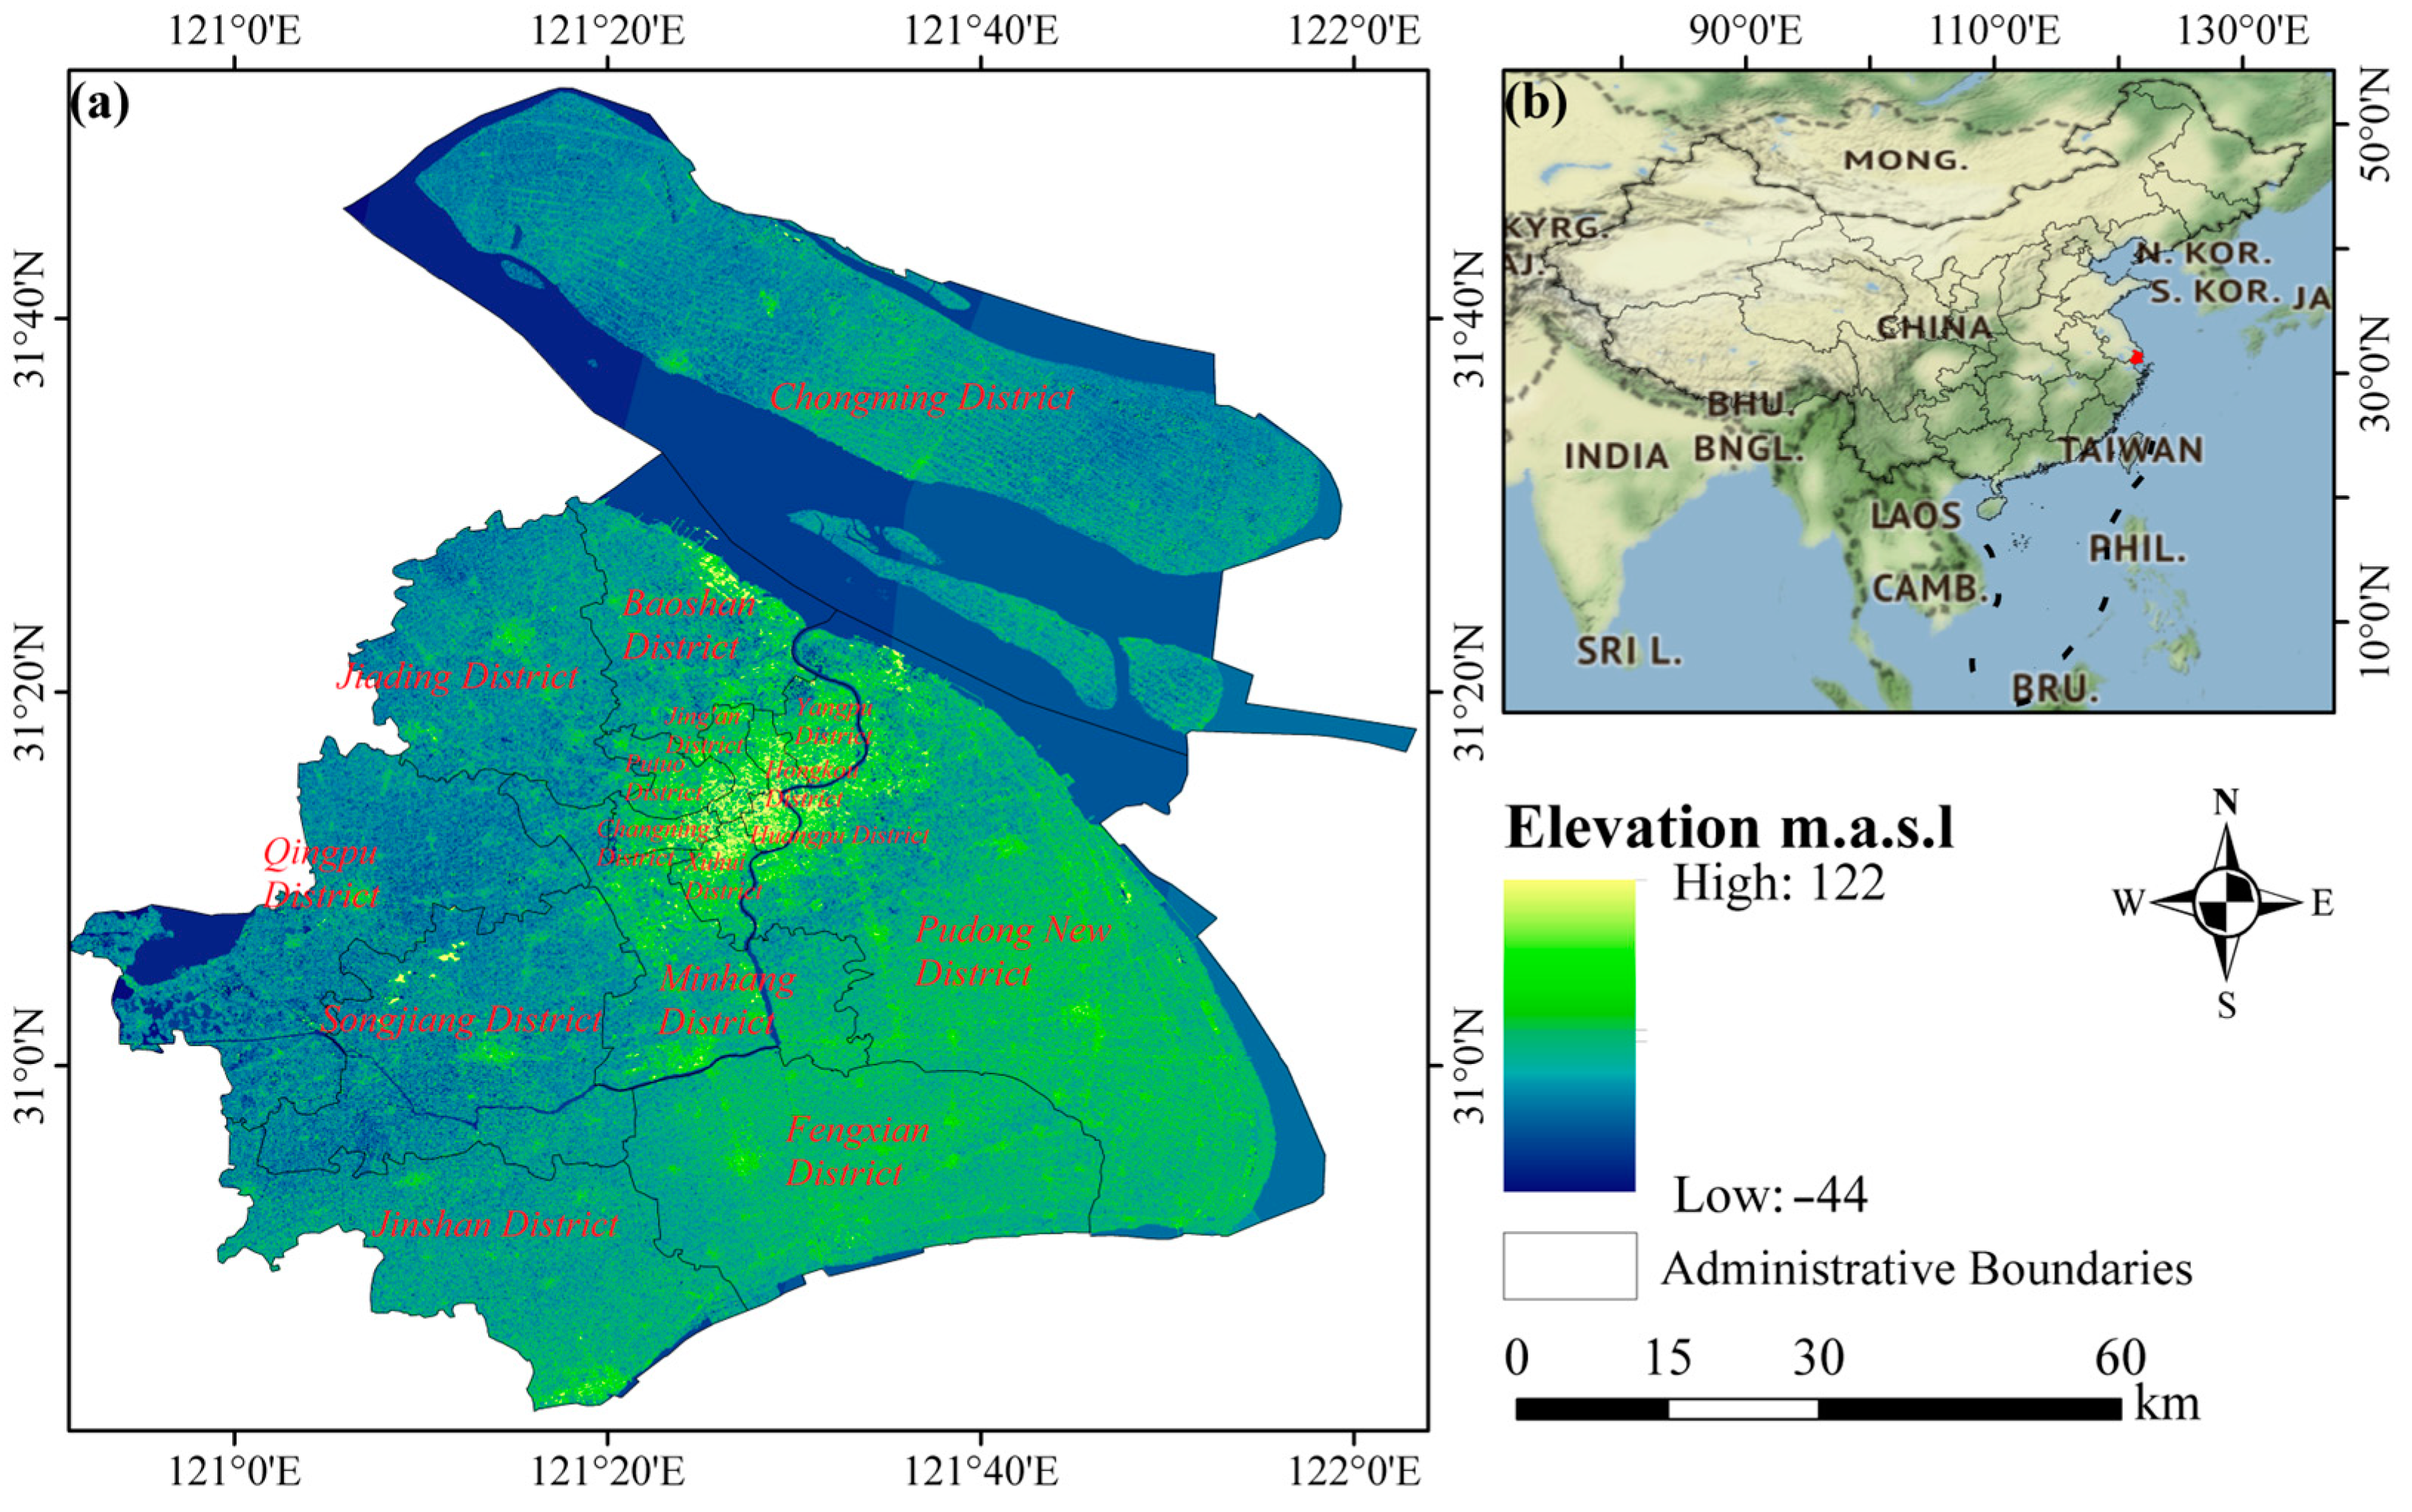
Shanghai is a province-level administrative region, municipality directly under the central government, national central city, mega city, and core city of the Shanghai metropolitan area of the People’s Republic of China (
Figure 1). It has been approved by the State Council as China’s international economic, financial, trade, shipping, and technological innovation center (1). As of 2019, the city has 16 districts under its jurisdiction, with a total area of 6340.5 km
2 and a built-up area of 1237.85 km
2. At the end of 2021, the permanent population of the city was 24.8943 million. In 2021, the gross domestic product of Shanghai was CNY 4321.485 billion, with a year-on-year increase of 8.1%.
The land area of the Shanghai coastal zone, except for a few exposed volcanic hills in the west and south, is covered by extremely thick Quaternary loose sediment, which thickens from southwest to northeast. The thickness of the Quaternary system on the north bank of Hangzhou Bay is about 100–220 m, the thickness on the eastern coastal plain is 280–300 m, and the thickness in the northern estuarine sand island area is 300–350 m. The coastal zone of Shanghai belongs to a subtropical monsoon climate, exhibiting monsoon and oceanic climate characteristics, with four distinct seasons, sufficient sunlight, and abundant rainfall. The climate in the coastal zone of Shanghai is mild and humid, with a shorter spring and autumn, and longer winter and summer. The annual rainfall is moderate, with around 60% of the year’s rainfall concentrated during the flood season from May to September. The annual average temperature is 15.8 °C, with an average of 3.6 °C in January and 27.8 °C in July.
2.2. Data Sources and Processing
Firstly, by comparing data sources from different reports in the literature, research data sources with a higher accuracy were selected to obtain socio-economic and administrative boundary data.
The administrative boundary data were from the Resource and Environmental Science and Data Center of the Chinese Academy of Sciences. The GDP 1 km × 1 km spatial grids for 2000, 2005, 2010, 2015, and 2020 were generated by Xu Xinliang et al. based on the national GDP statistical data of each county, taking into account the spatial interaction between land use types, nighttime light brightness, residential density data, and GDP closely related to human activities, and through spatial interpolation. The multi-factor weight distribution method was used to segregate the population data using administrative regions as the basic statistical unit on the spatial grid, thus achieving spatialization of the population. The night light data are a type of satellite remote sensing data mainly used for research work such as monitoring urbanization progress. These data are jointly produced by the Digital China Research Institute (Fujian) and the Key Laboratory of Spatial Data Mining and Information Sharing at Fuzhou University, with a resolution of 500 m. Through cross-sensor correction, DMSP-OLS and NPP-VIIRS can be continuously used.
2.3. Subsection
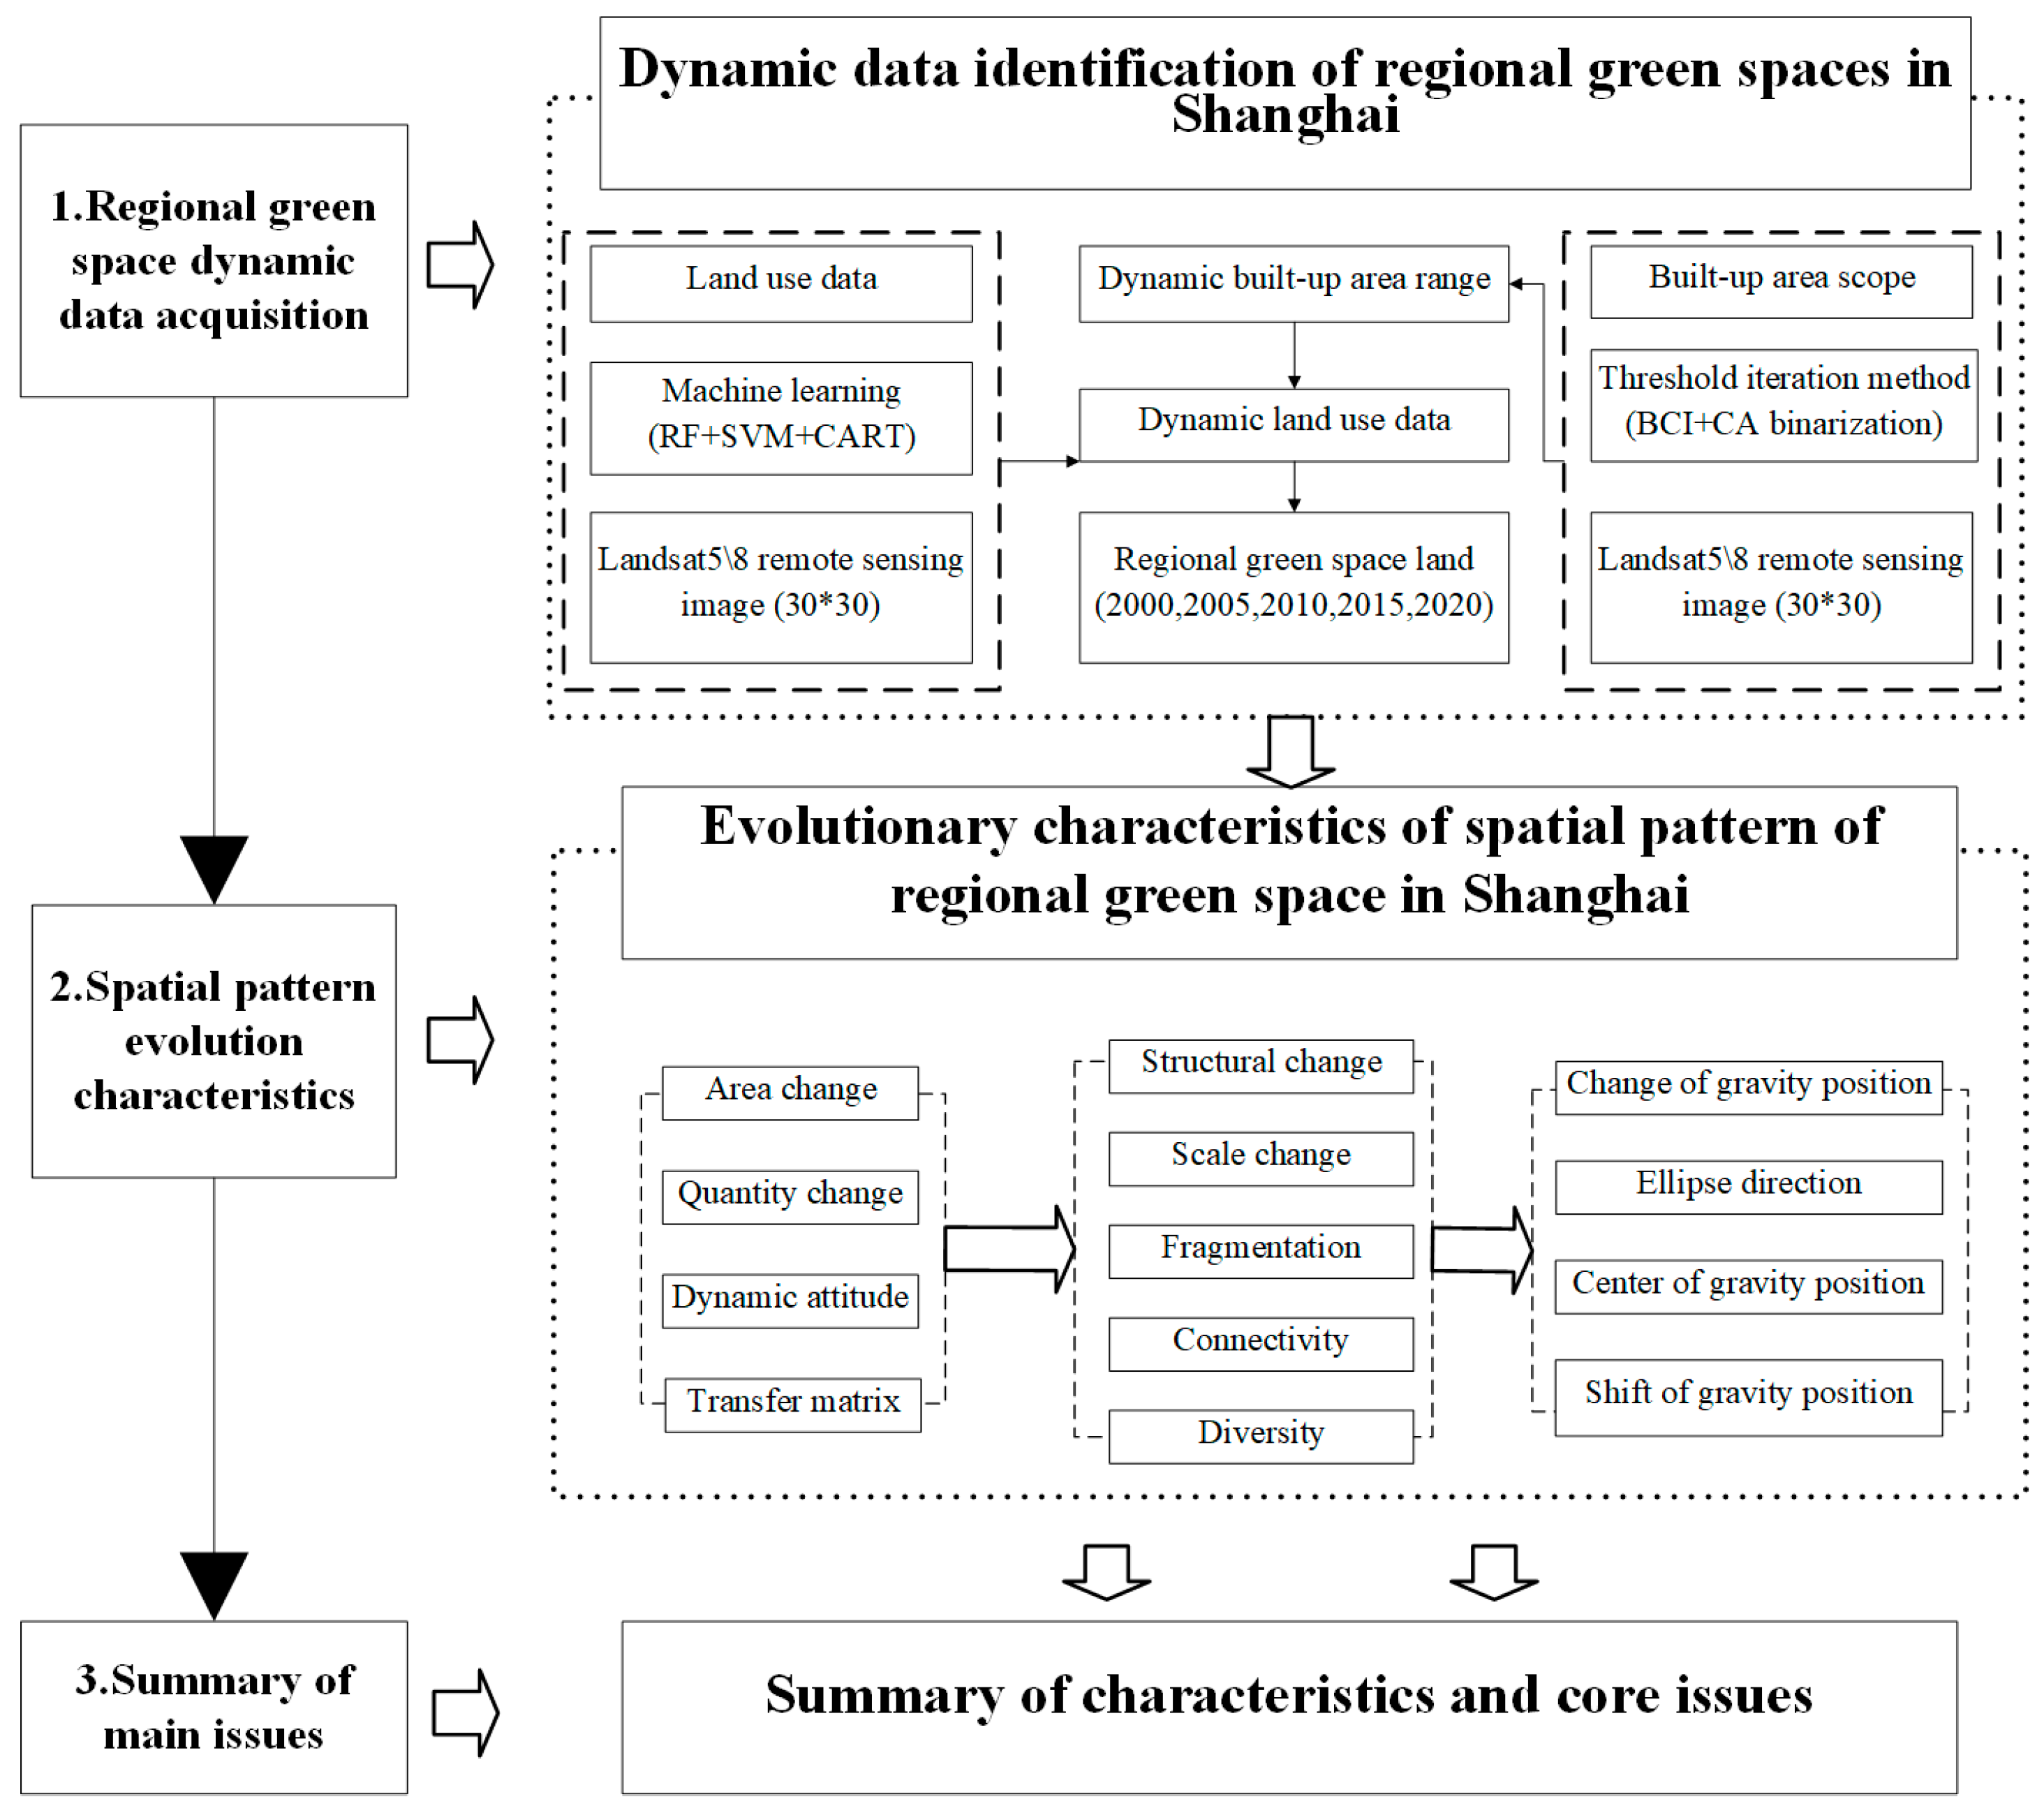
The regional green space is located outside the built-up area, and its land use will change dynamically with the expansion of the built-up area, resulting in changes in coverage. Finding a method to collect dynamic regional green space data is the goal of this research. This article defines the coverage of regional green space as non-construction land outside the built-up area, and defines the composition of regional green space as forest land, grassland, and wetland. With the help of the GEE platform [
31], a dynamic recognition technology system for regional green space was constructed through machine learning (random forest, support vector machine, decision tree, and object-oriented classification), biophysical components (BCI), and GIS methods to extract dynamic data information on the scope of built-up areas and regional green spaces at five time nodes in Shanghai (2000, 2005, 2010, 2015, and 2020). Based on the above data, this study analyzed the evolution characteristics and main problems of regional green space spatial pattern identification from three perspectives: area changes, spatial structure changes, and spatial center of gravity changes over time (
Figure 2).
2.3.1. Land Use Interpretation
In order to study the spatiotemporal changes in the regional green space in Shanghai, it is necessary to interpret the land cover and the performance of different remote sensing classification algorithms to map land cover based on the Google Earth Engine (GEE) cloud platform. High-spatial-resolution remote sensing images from Landsat and digital elevation data were used. Support vector machine (SVM), classification regression tree (CART), and random forest (RF) algorithms, as well as object-oriented methods were used in the supervised classification of Landsat 5/8 data for Shanghai [
32]. In addition, different remote sensing classification algorithms and feature variable combinations were used to compare and analyze the results obtained from the classification process, and the classification results with the highest classification accuracy and the best spatiotemporal continuous change were used as the research data. Remote sensing images were used to extract the urban built-up areas. Currently, the most popular choice for interpreting urban cover at long-term nodes is the Landsat series remote sensing images.
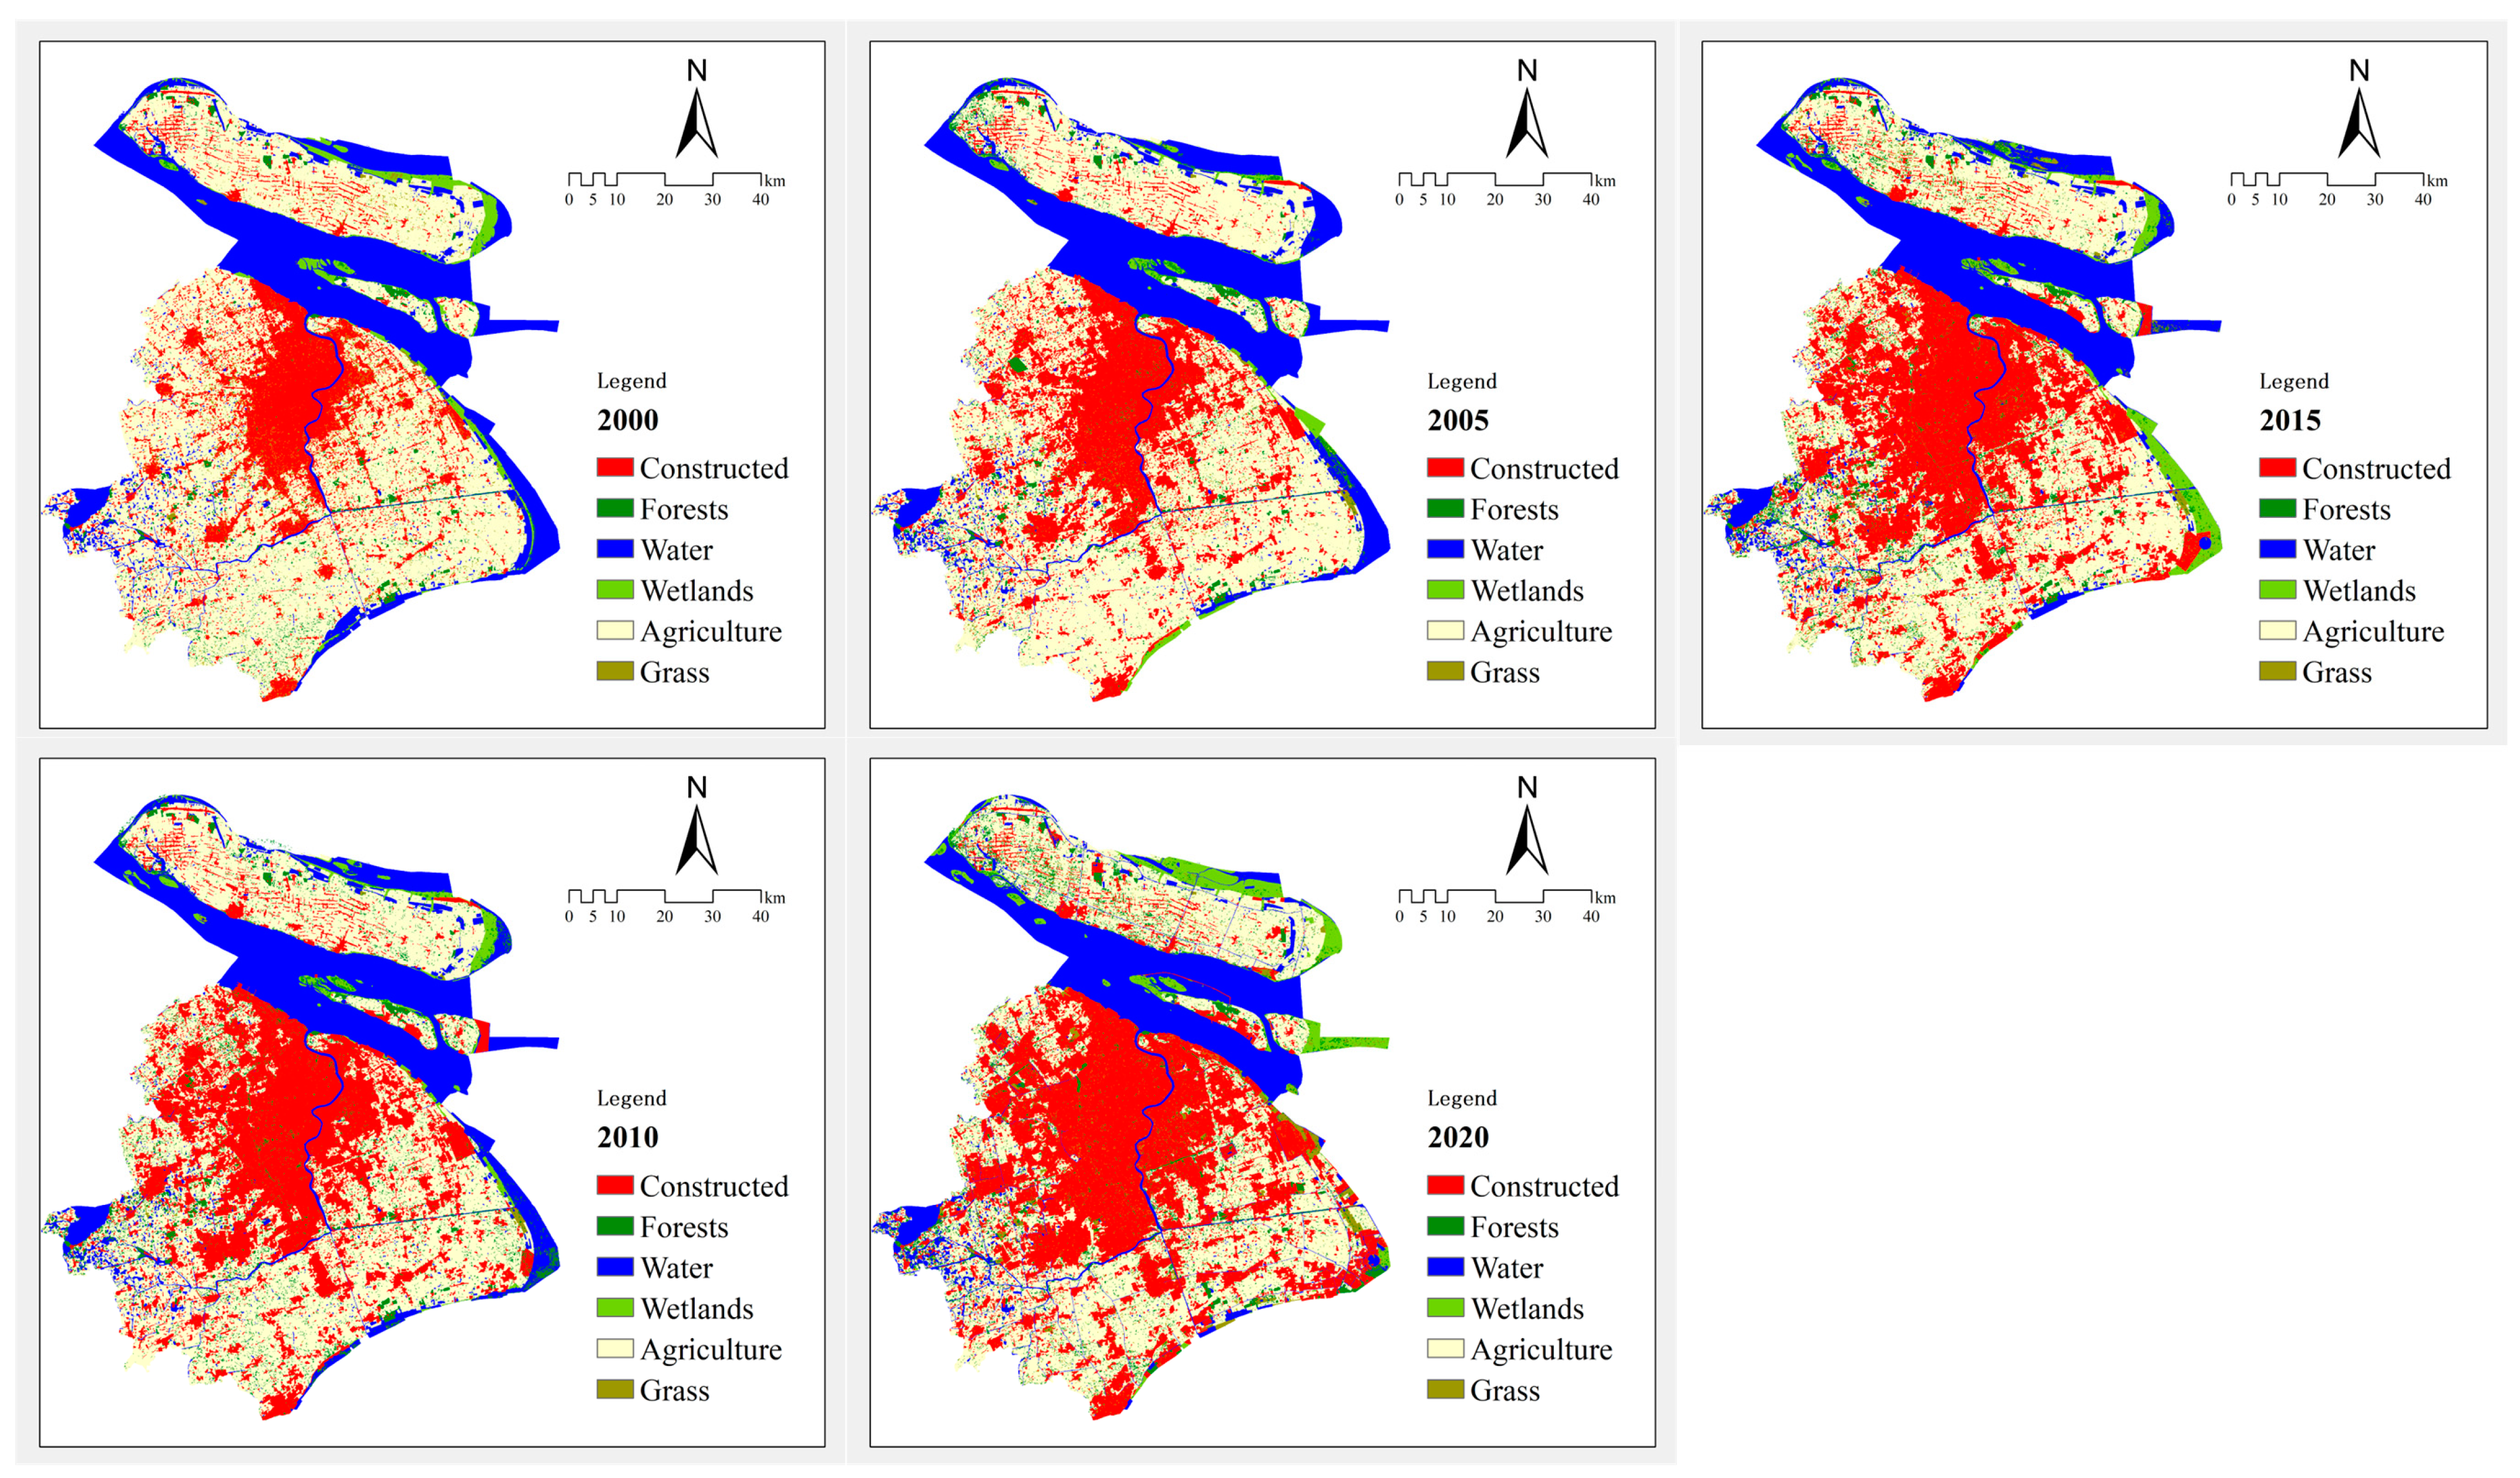
This study utilized the GEE cloud platform and its remote sensing classification algorithms and remote sensing data to classify the land cover situation in the Shanghai area. The research methods used include the collection and optimization of sample data, the construction of a feature space and machine learning classification algorithms, and the evaluation of the classification results. The specific classification methods and results are provided in the
supporting materials. The classification results are shown in
Figure 3.
2.3.2. Extraction of Urban Built-Up Areas
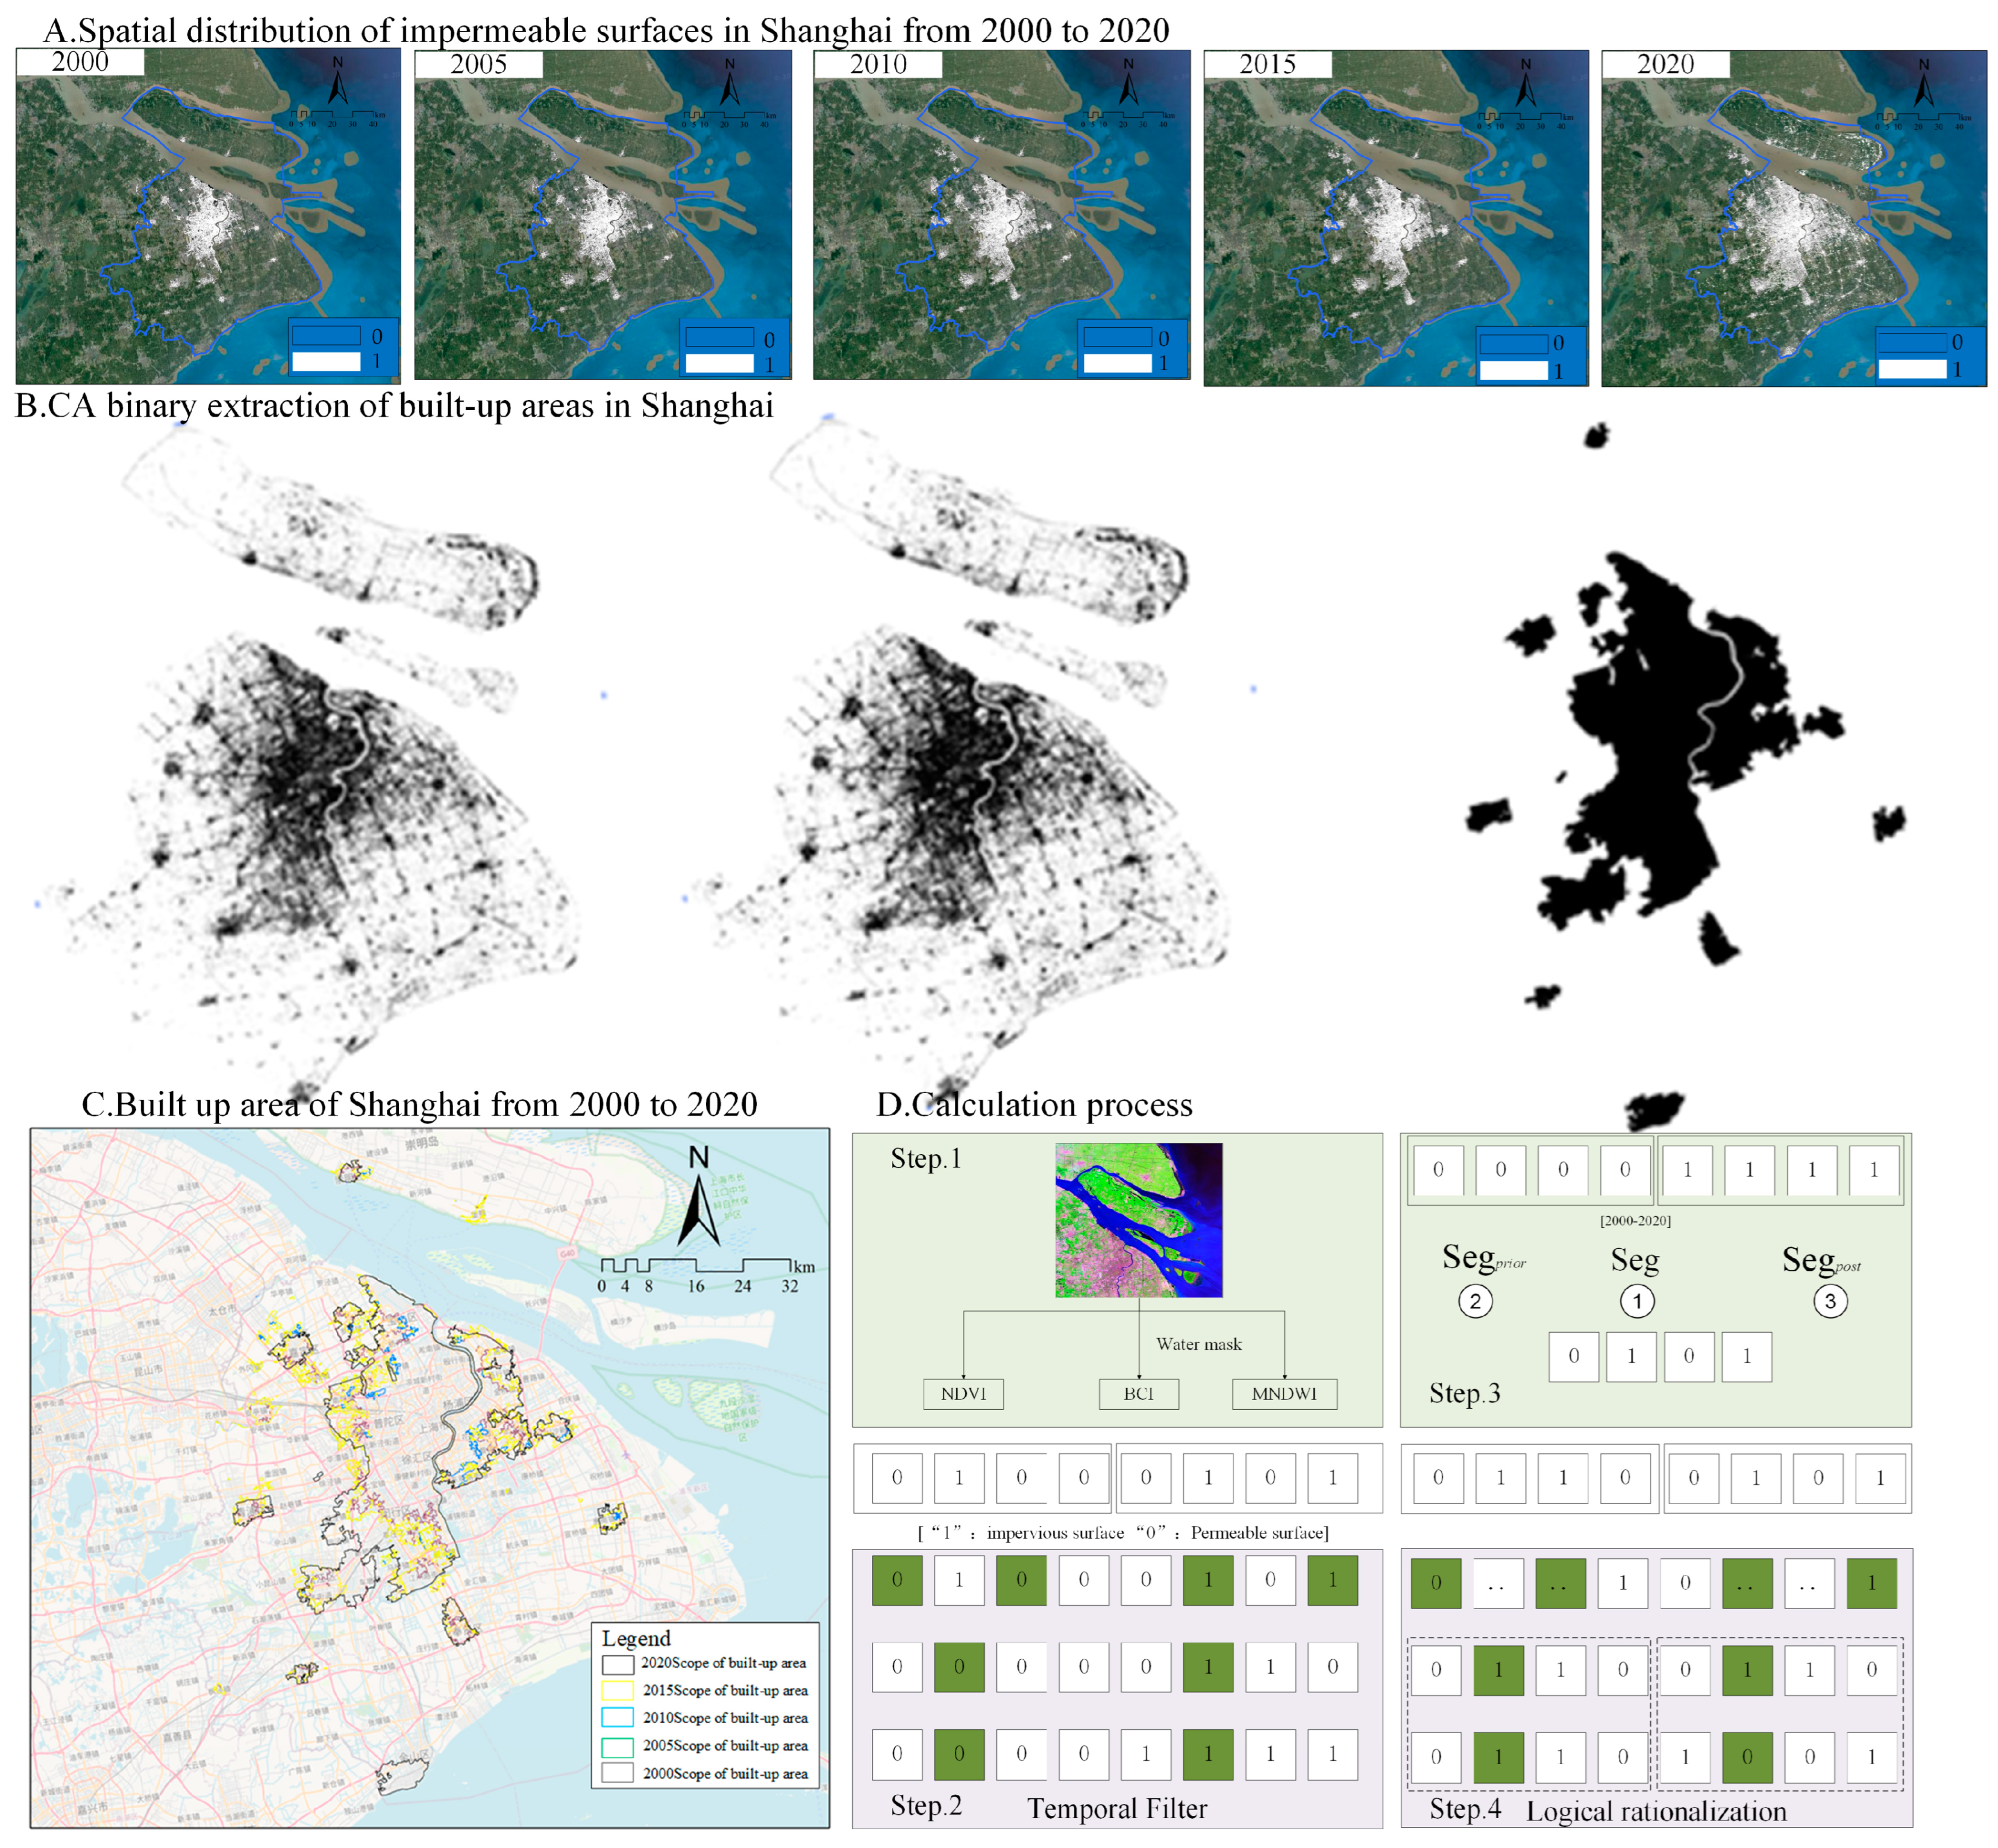
This study used a combination of the BCI and NDVI (normalized difference vegetation index) to obtain the initial impermeable spatial distribution (
Figure 4). Compared with commonly used indices such as the NDBI (normalized difference built-up index), NDVI, and NDSI (normalized difference snow index), the BCI can better distinguish between bare soil, vegetation, and impermeable surfaces, making it widely used for extracting impermeable surfaces. To obtain the urban impermeable surface (
Figure 4A), the CA binarization method (
Figure 4B) was used to extract the urban built-up area range (
Figure 4C) of Shanghai in 2000, 2005, 2010, 2015, and 2020. The specific research steps are provided in the supporting materials.
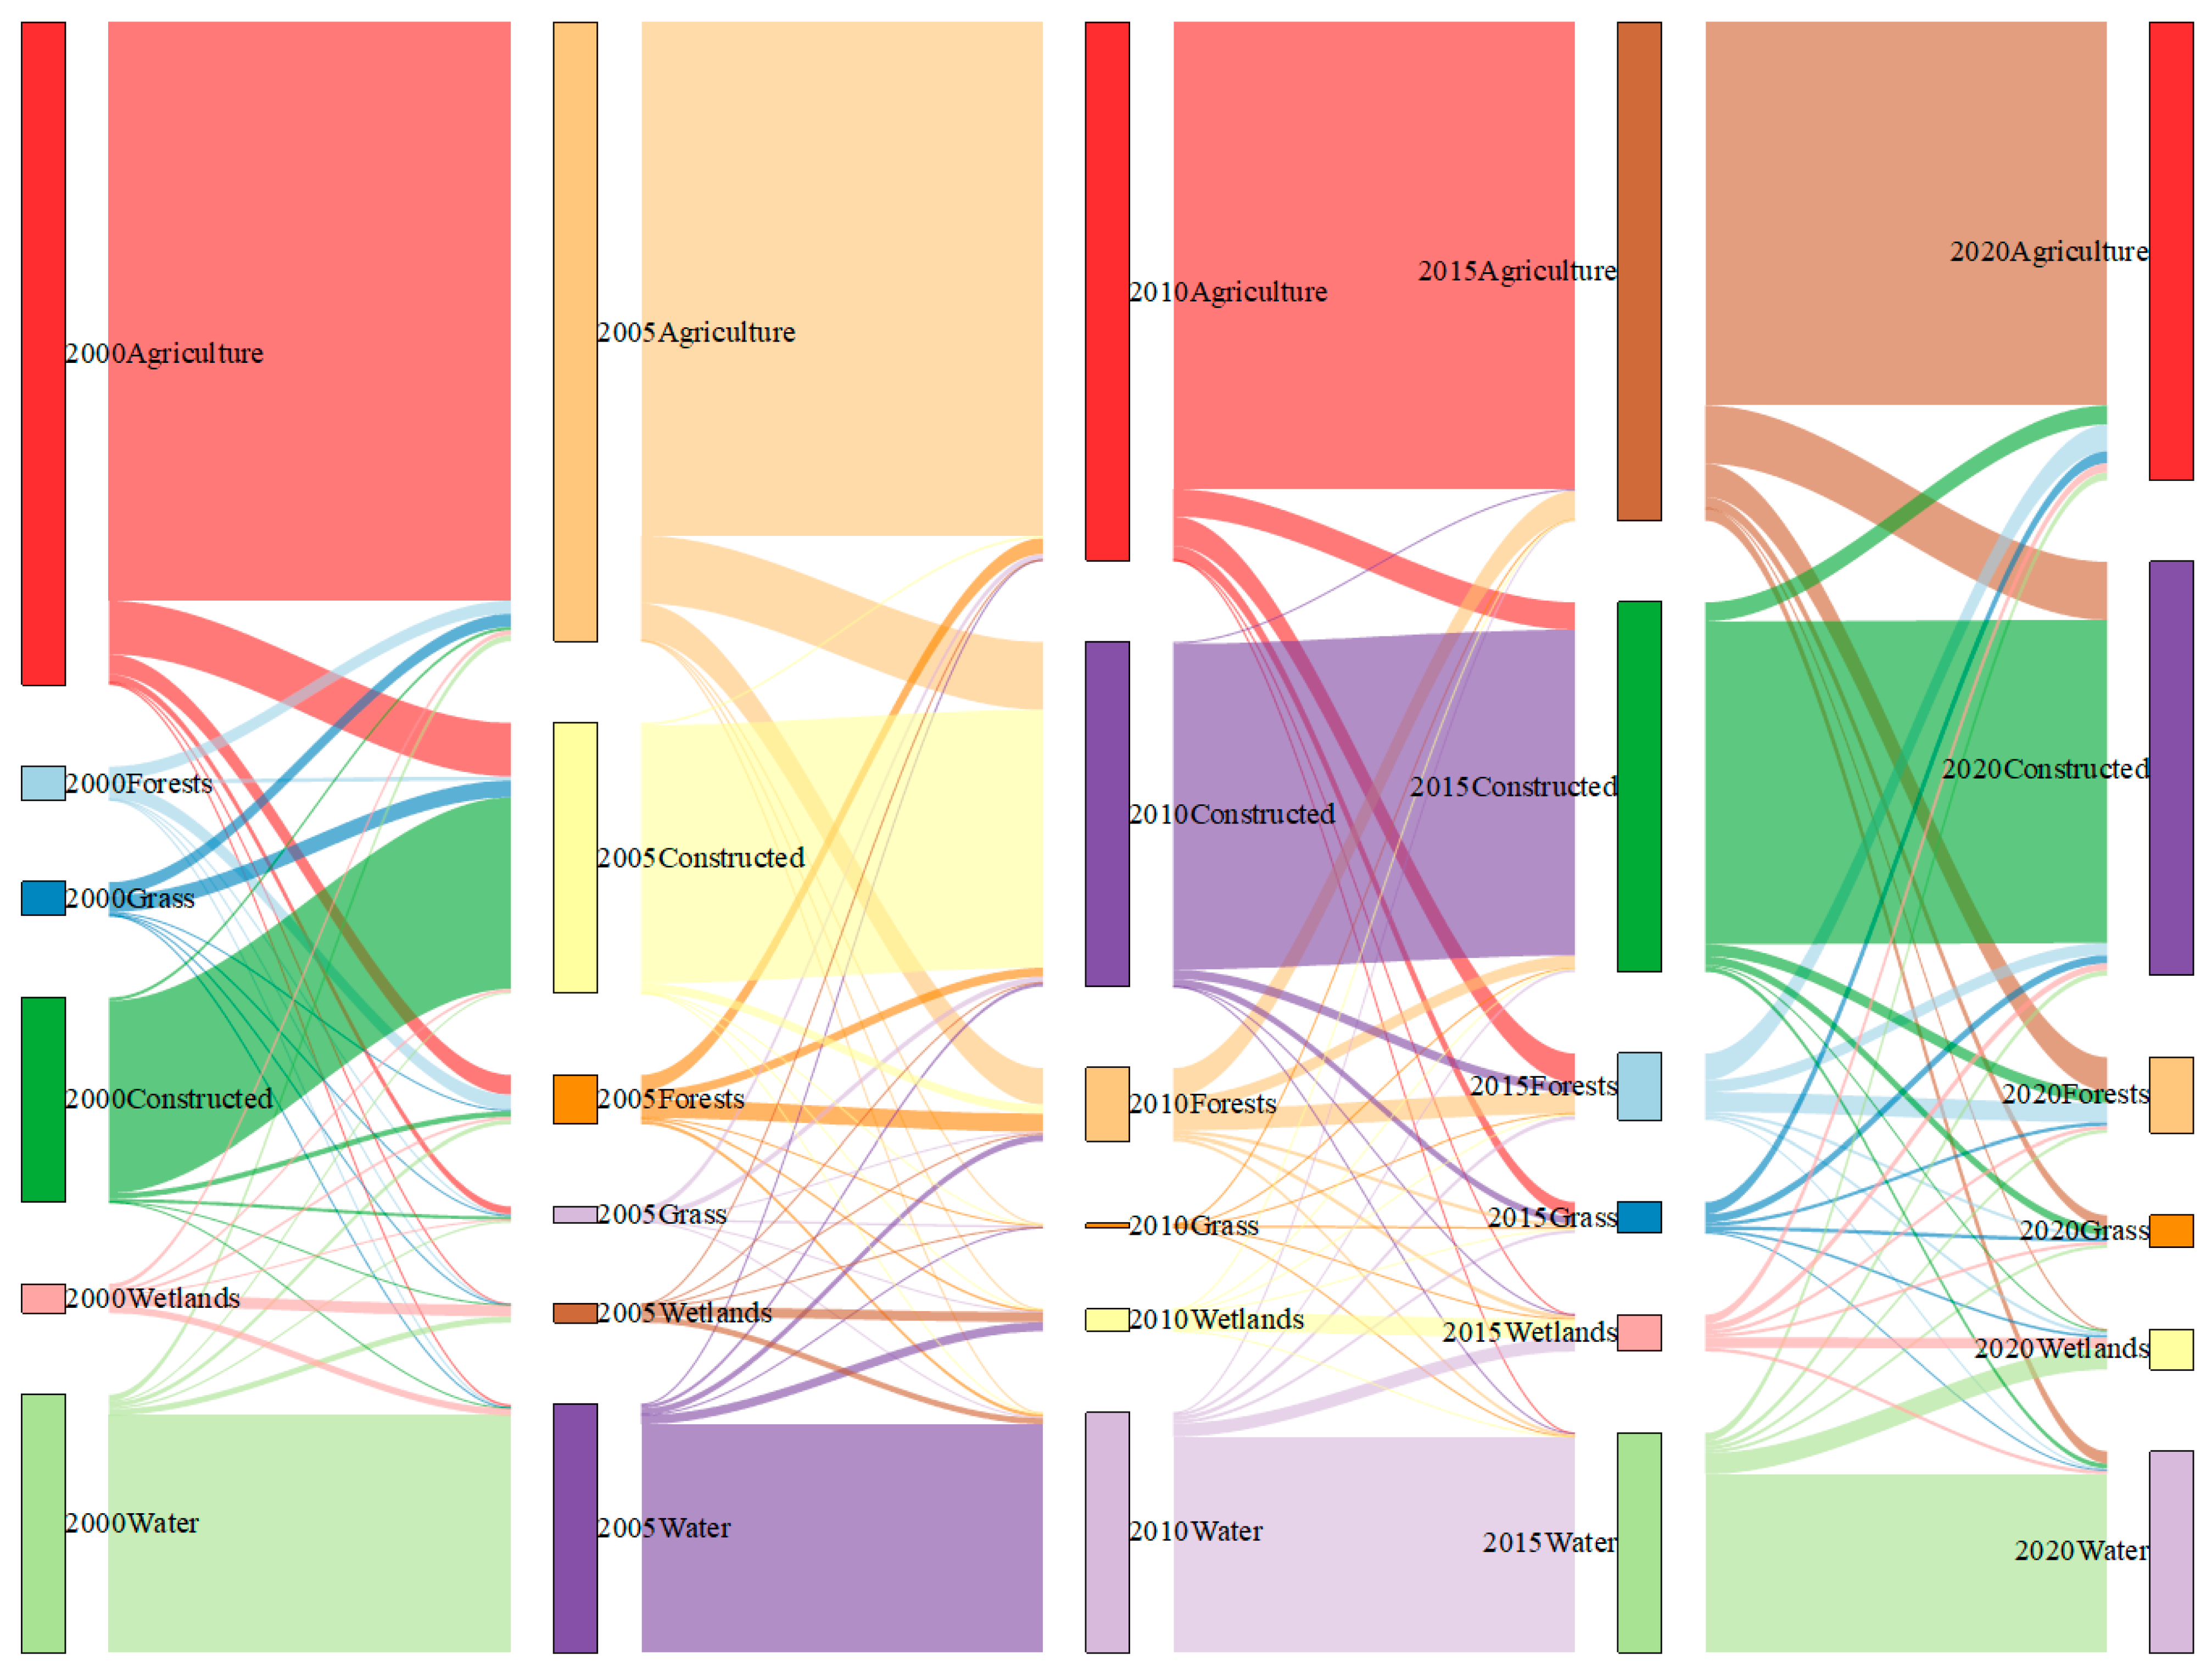
2.3.3. Measurement of Land Use Quantity and Spatial Change
Land use transfer matrix. The land use transfer matrix can reflect the direction and quantity of land use transfer during a certain period of time. We used the reclassification and calculation functions in ArcGIS10.6 to obtain the transfer area of land use functions in each time period [
33].
Here, S is the land area; N is the number of types of land use; and i and j are the land use types at the beginning and end of the research period.
- 2.
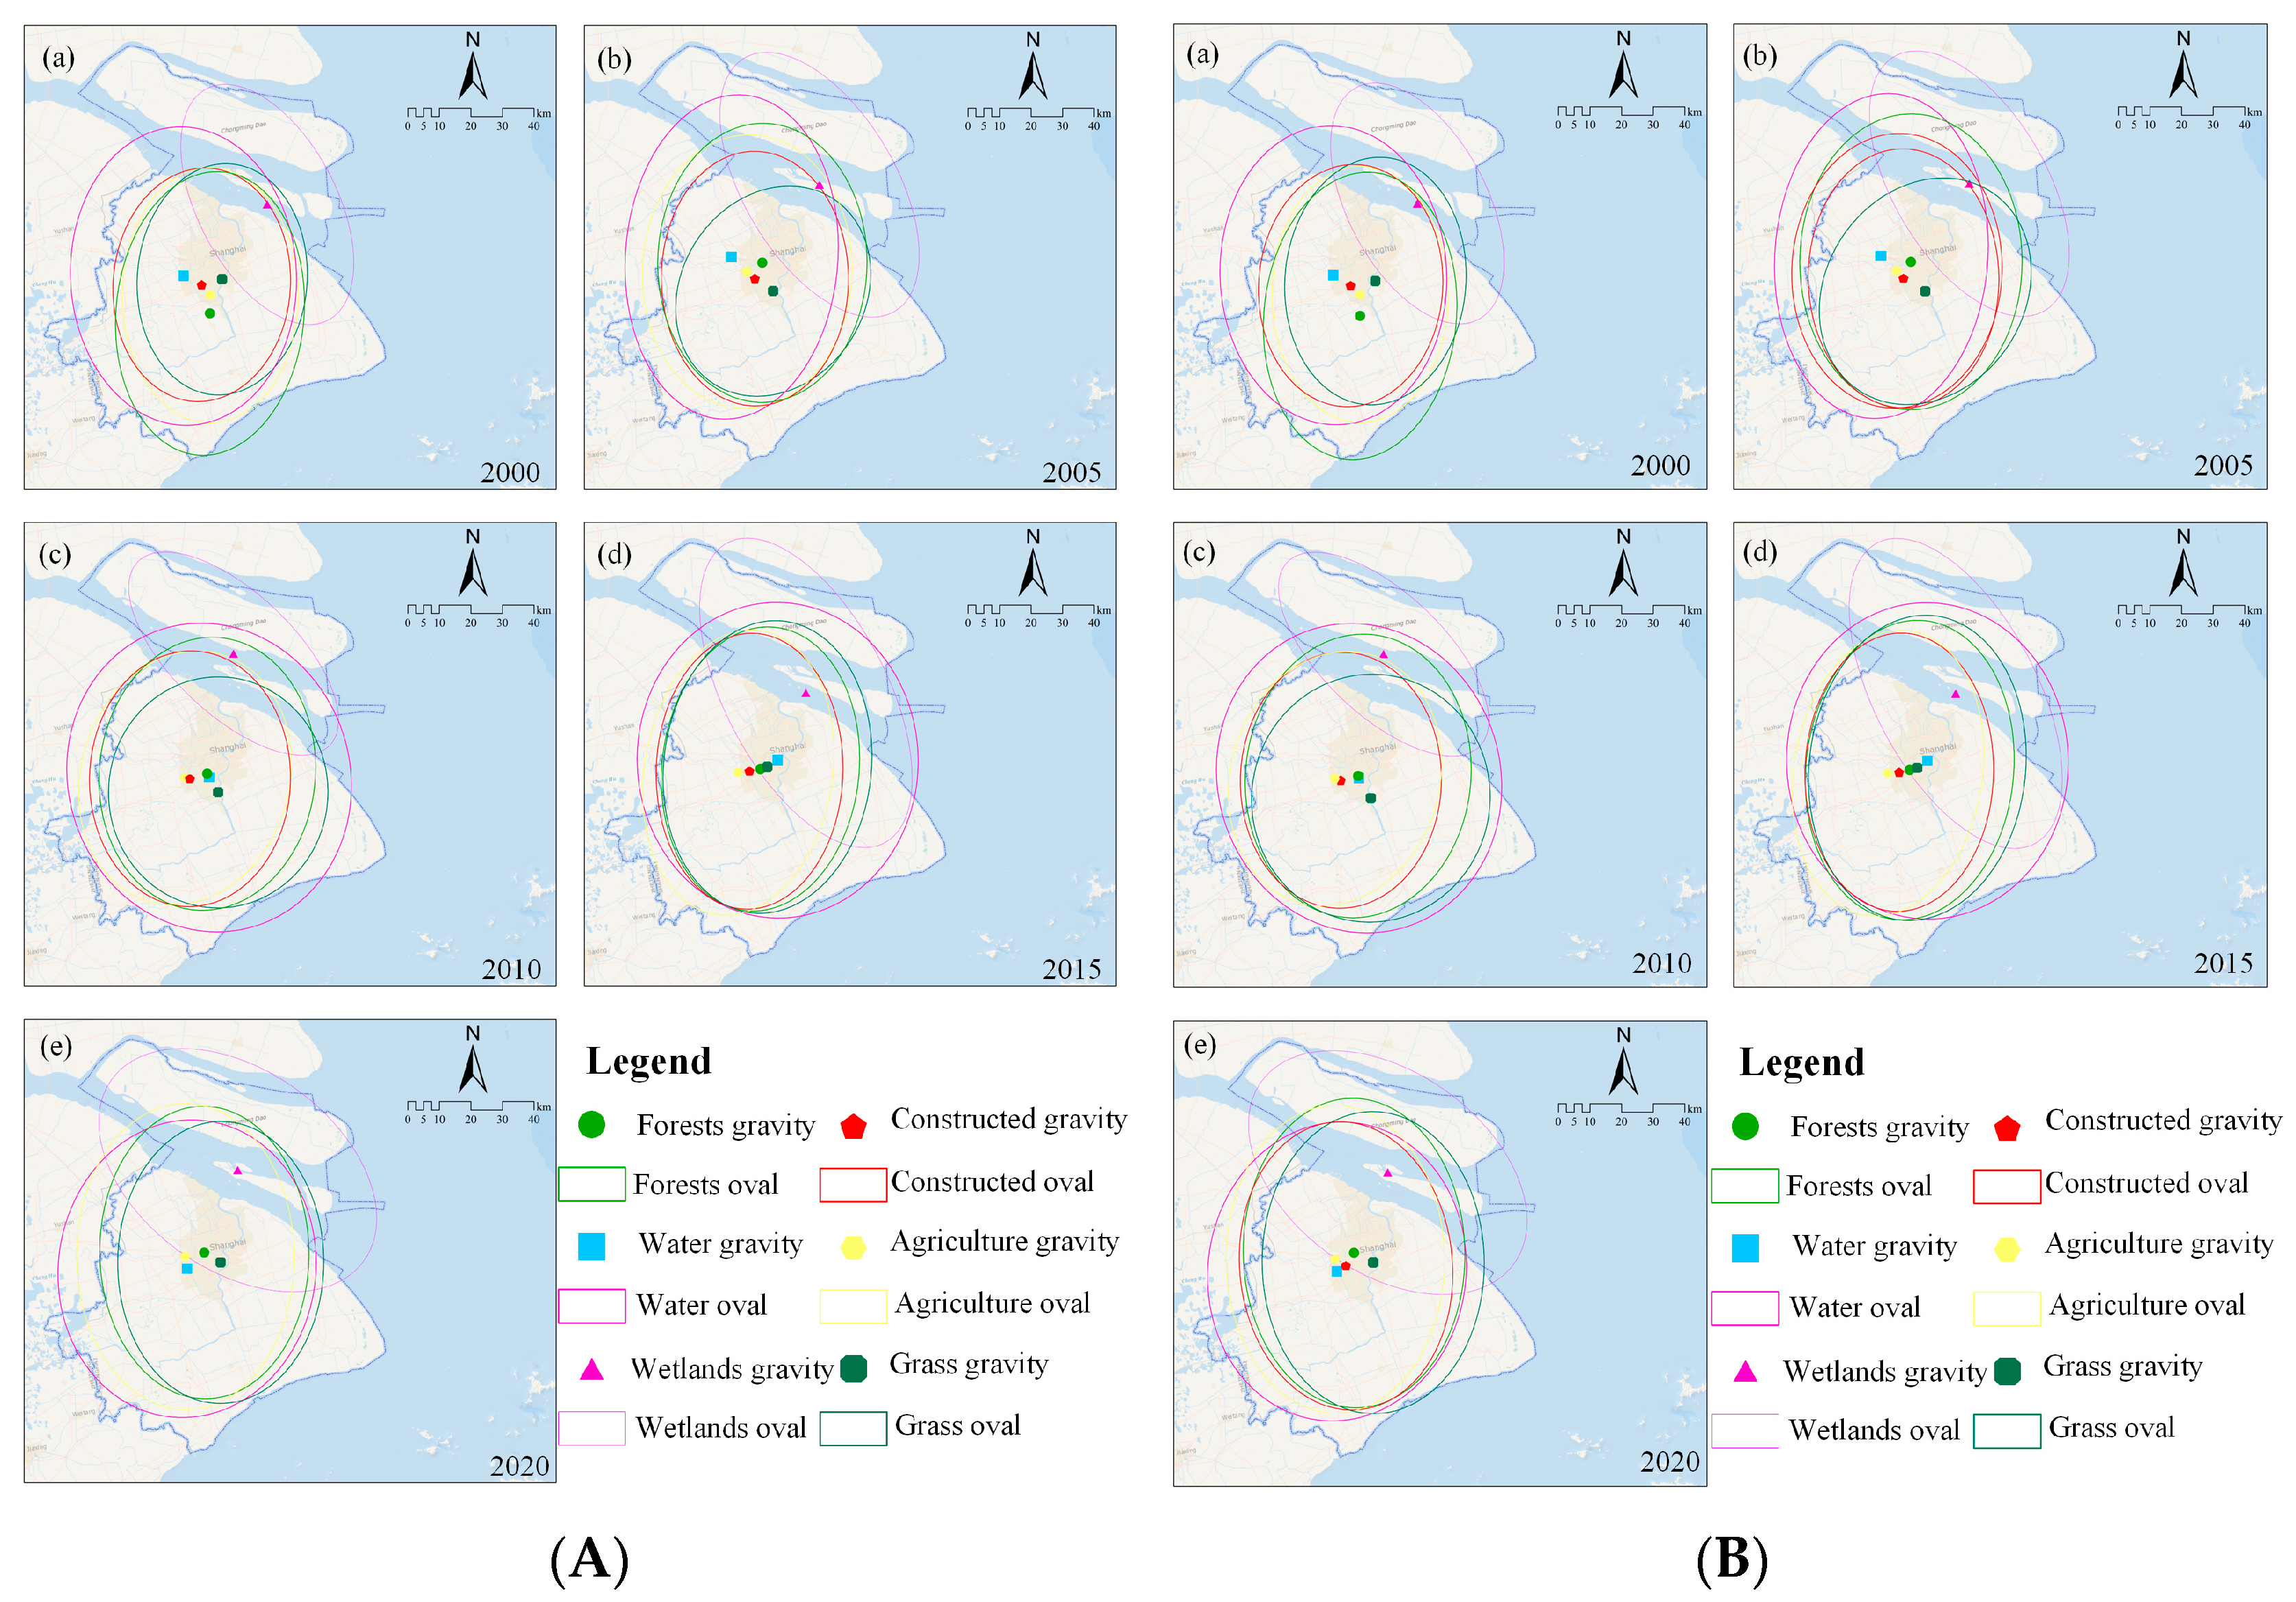
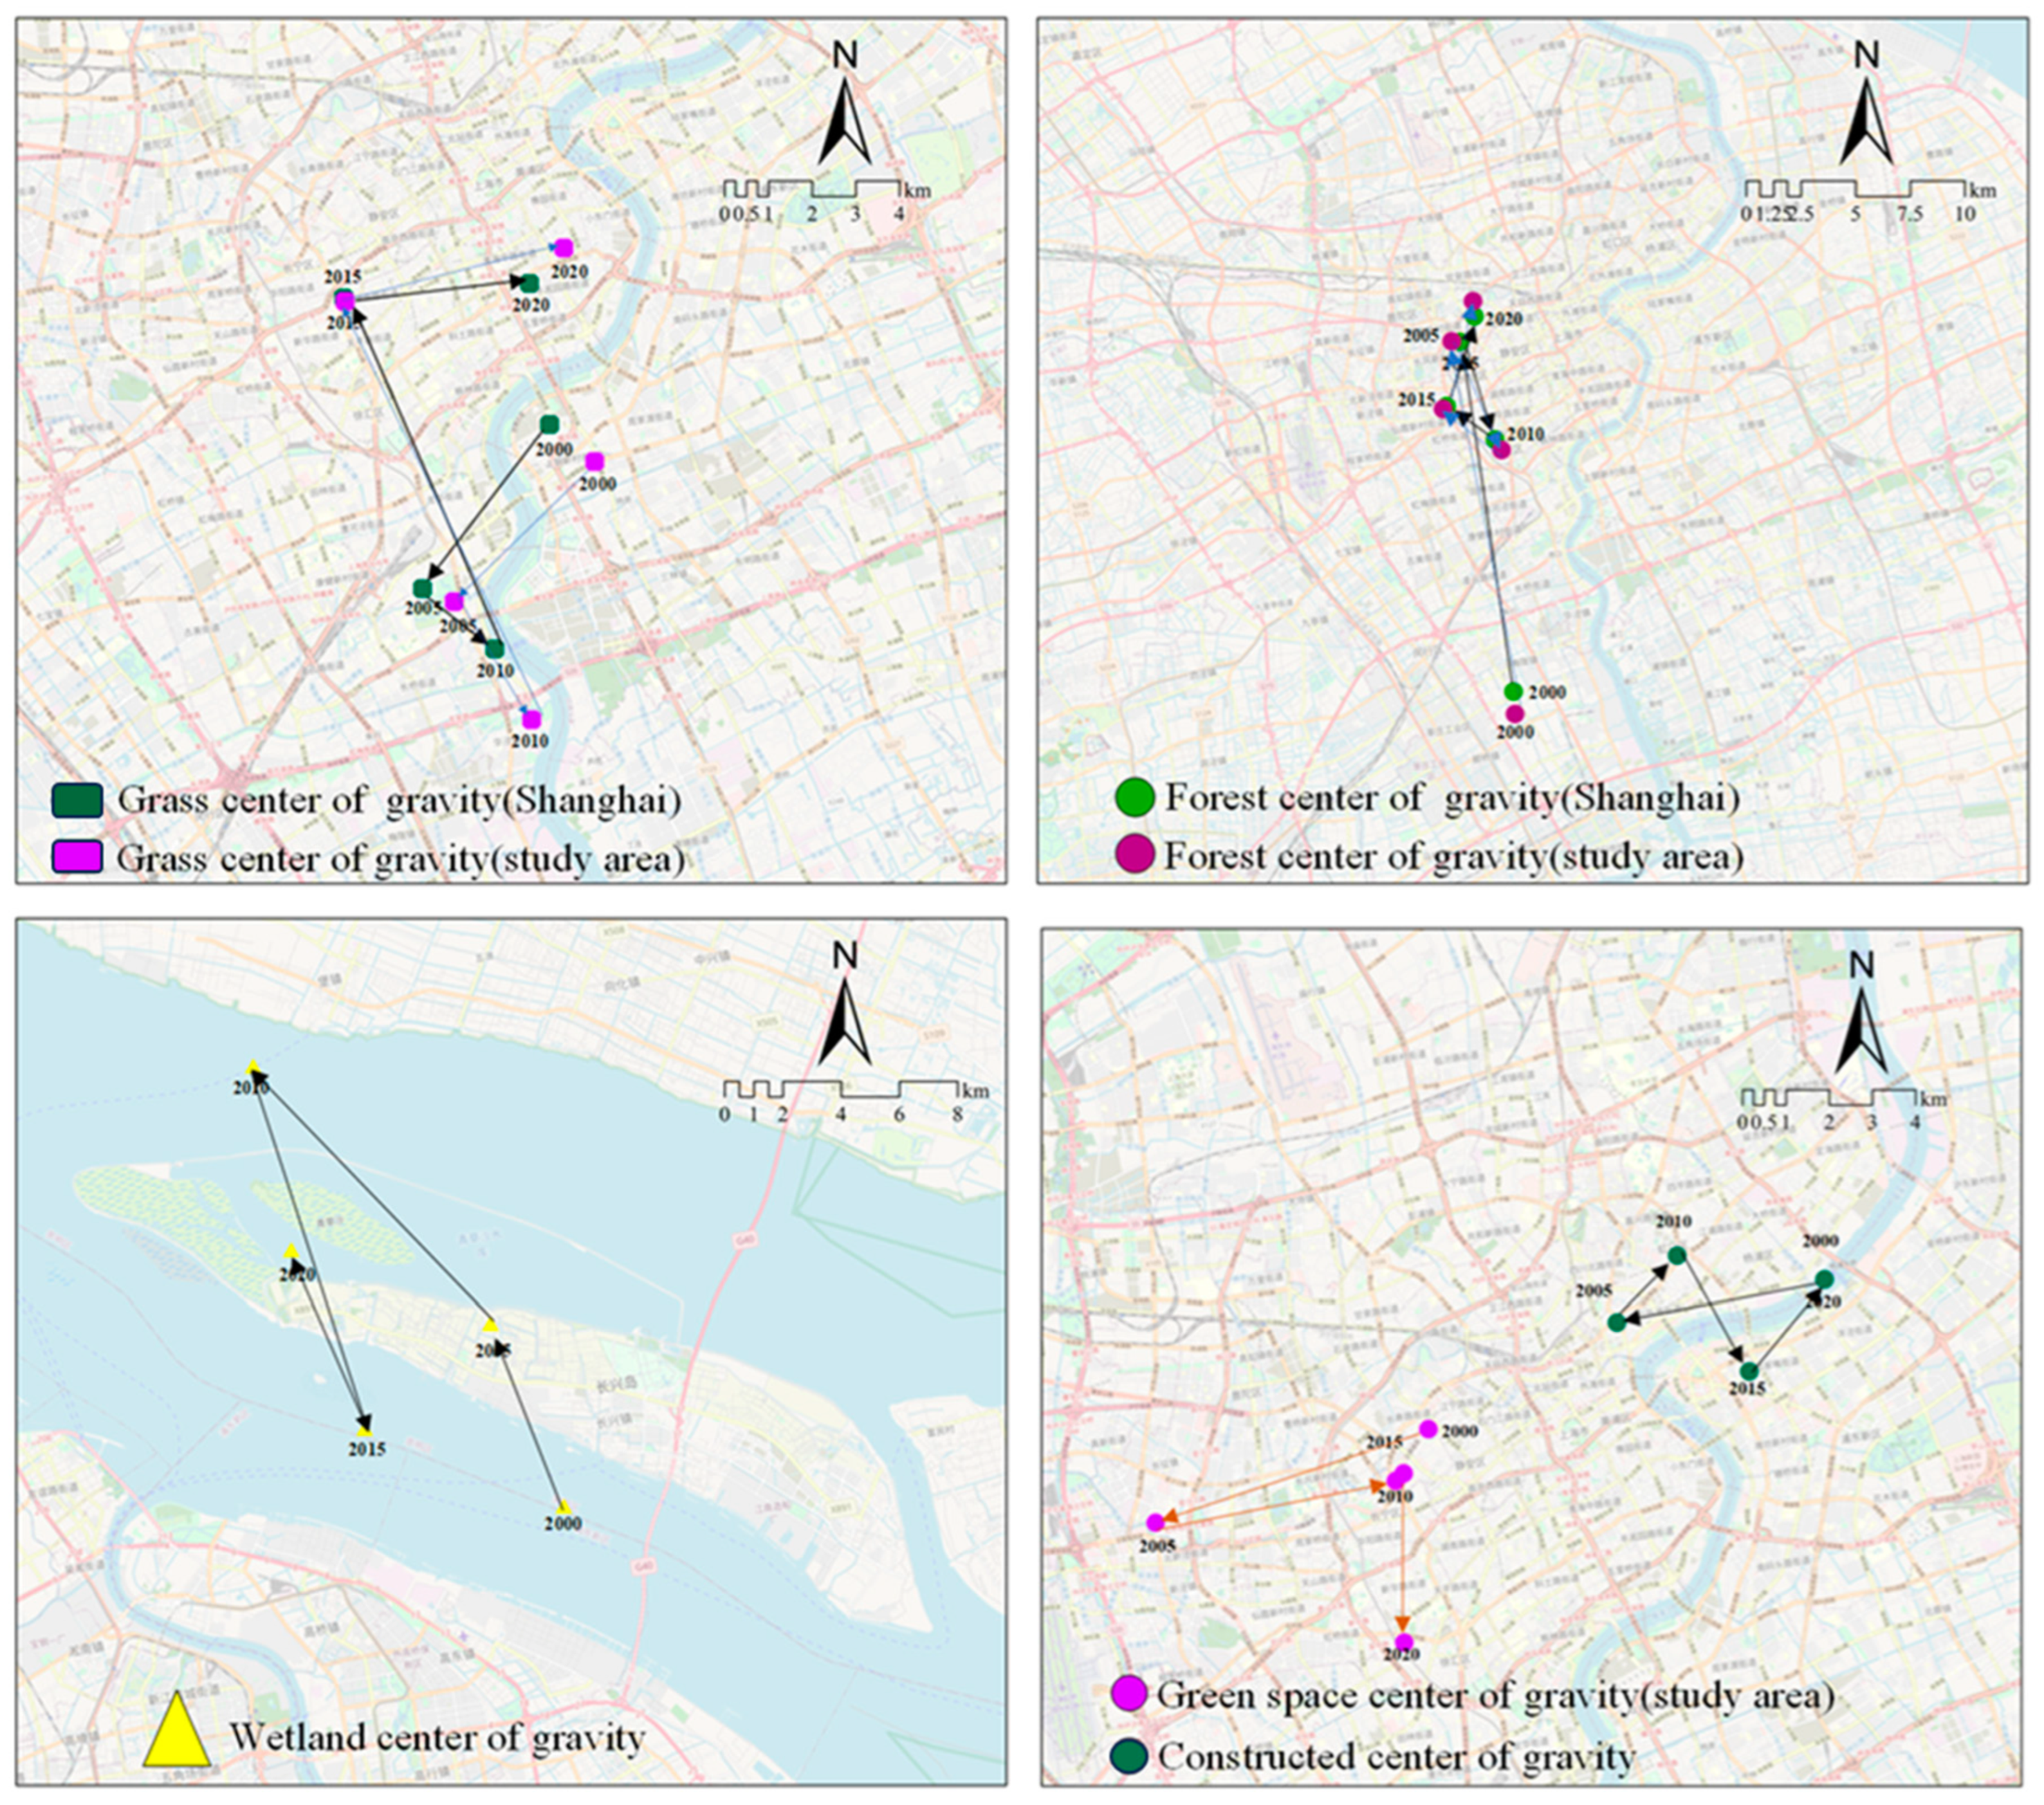
Shifts in land use functions. The transfer of the center of gravity of land use function can reflect the transfer of the center of gravity of various types of land in different years. Using the drawing function of ArcGIS 10.8 software, we obtain the standard deviation ellipses of various types of land use in different periods, and can generate the coordinates of the distribution of the center of gravity of various types of land use.
Here, X and Y represent the longitude and latitude coordinates of the distribution of the center of gravity of various types of land use; represents the area of the i-th land patch; represent the longitude and latitude, respectively, of the geometric center of gravity of the ith land patch; and N represents the total number of patches of various types of land use in that year.
2.3.4. Landscape Pattern Index Screening
Based on the characteristics of Shanghai’s urban development and environmental factors, a reasonable and effective use of the moving window method was to deeply analyze the spatial structure and internal differences in the fragmentation of green spaces outside the built-up areas in Shanghai. The moving windows method can clearly determine the dynamic changes in the spatial structure of regional green spaces, and can provide a more in-depth analysis of the changes in regional green land use and related land use, as well as the resulting urban pattern evolution [
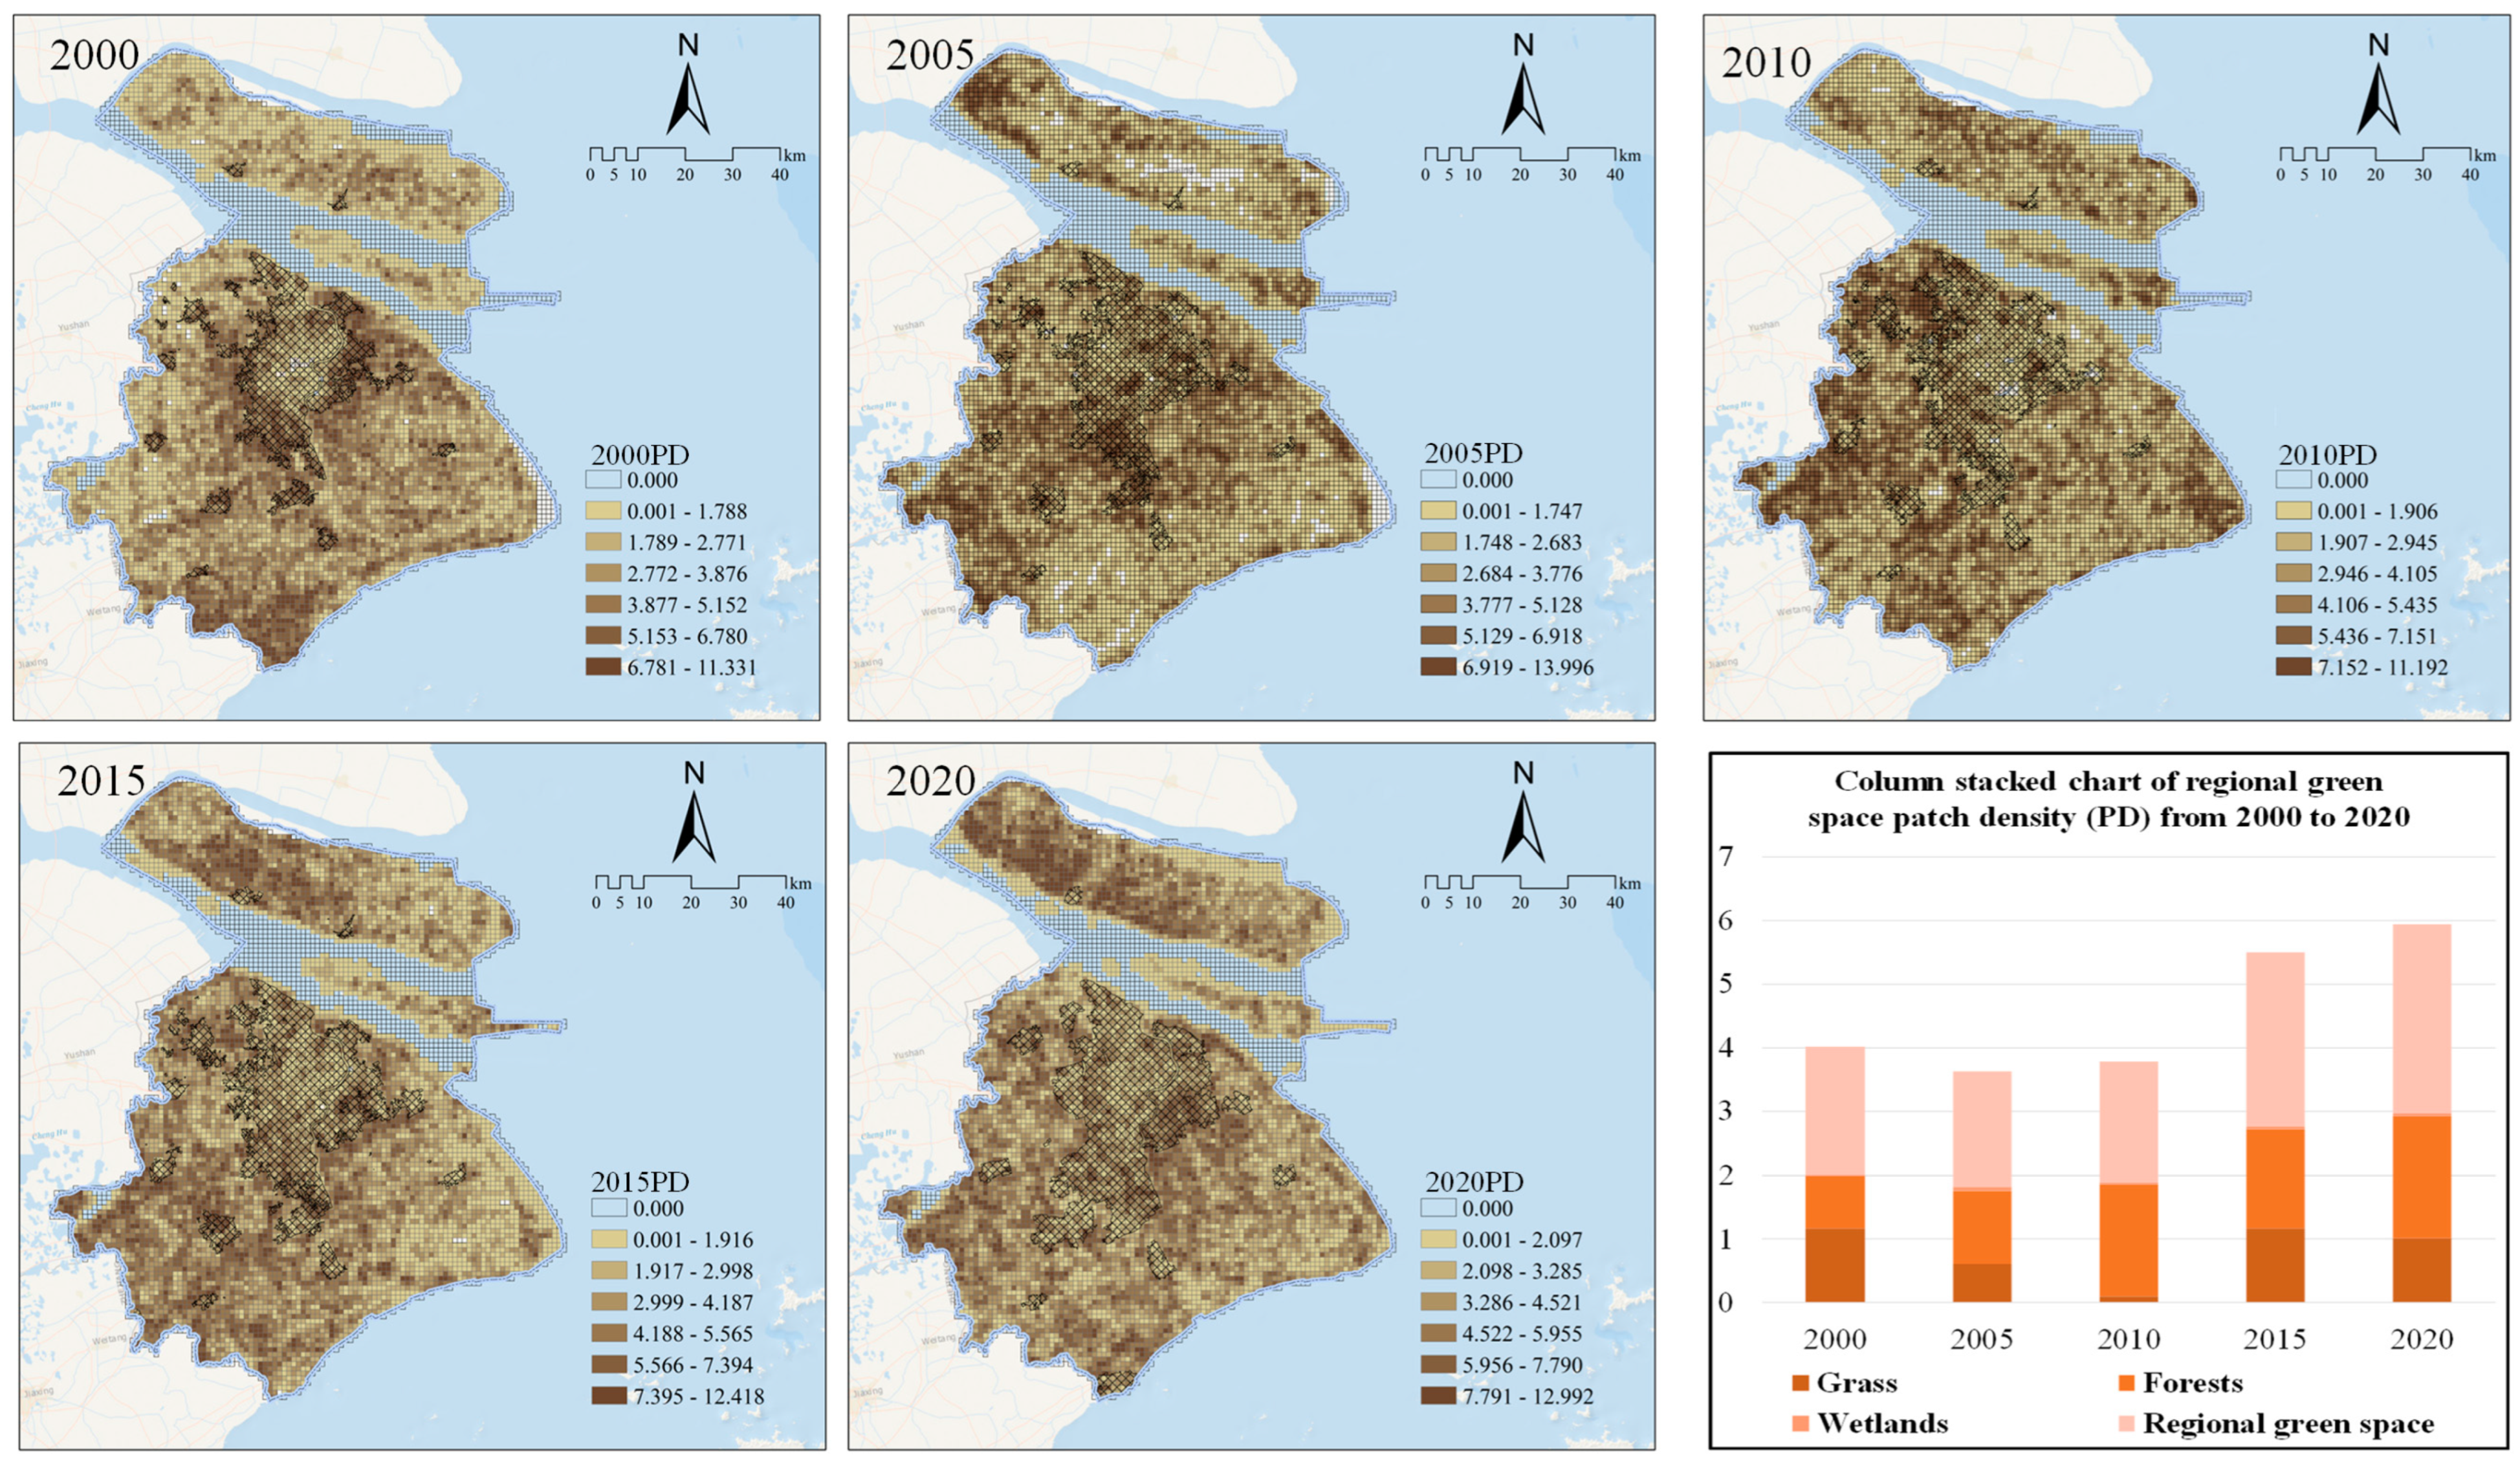
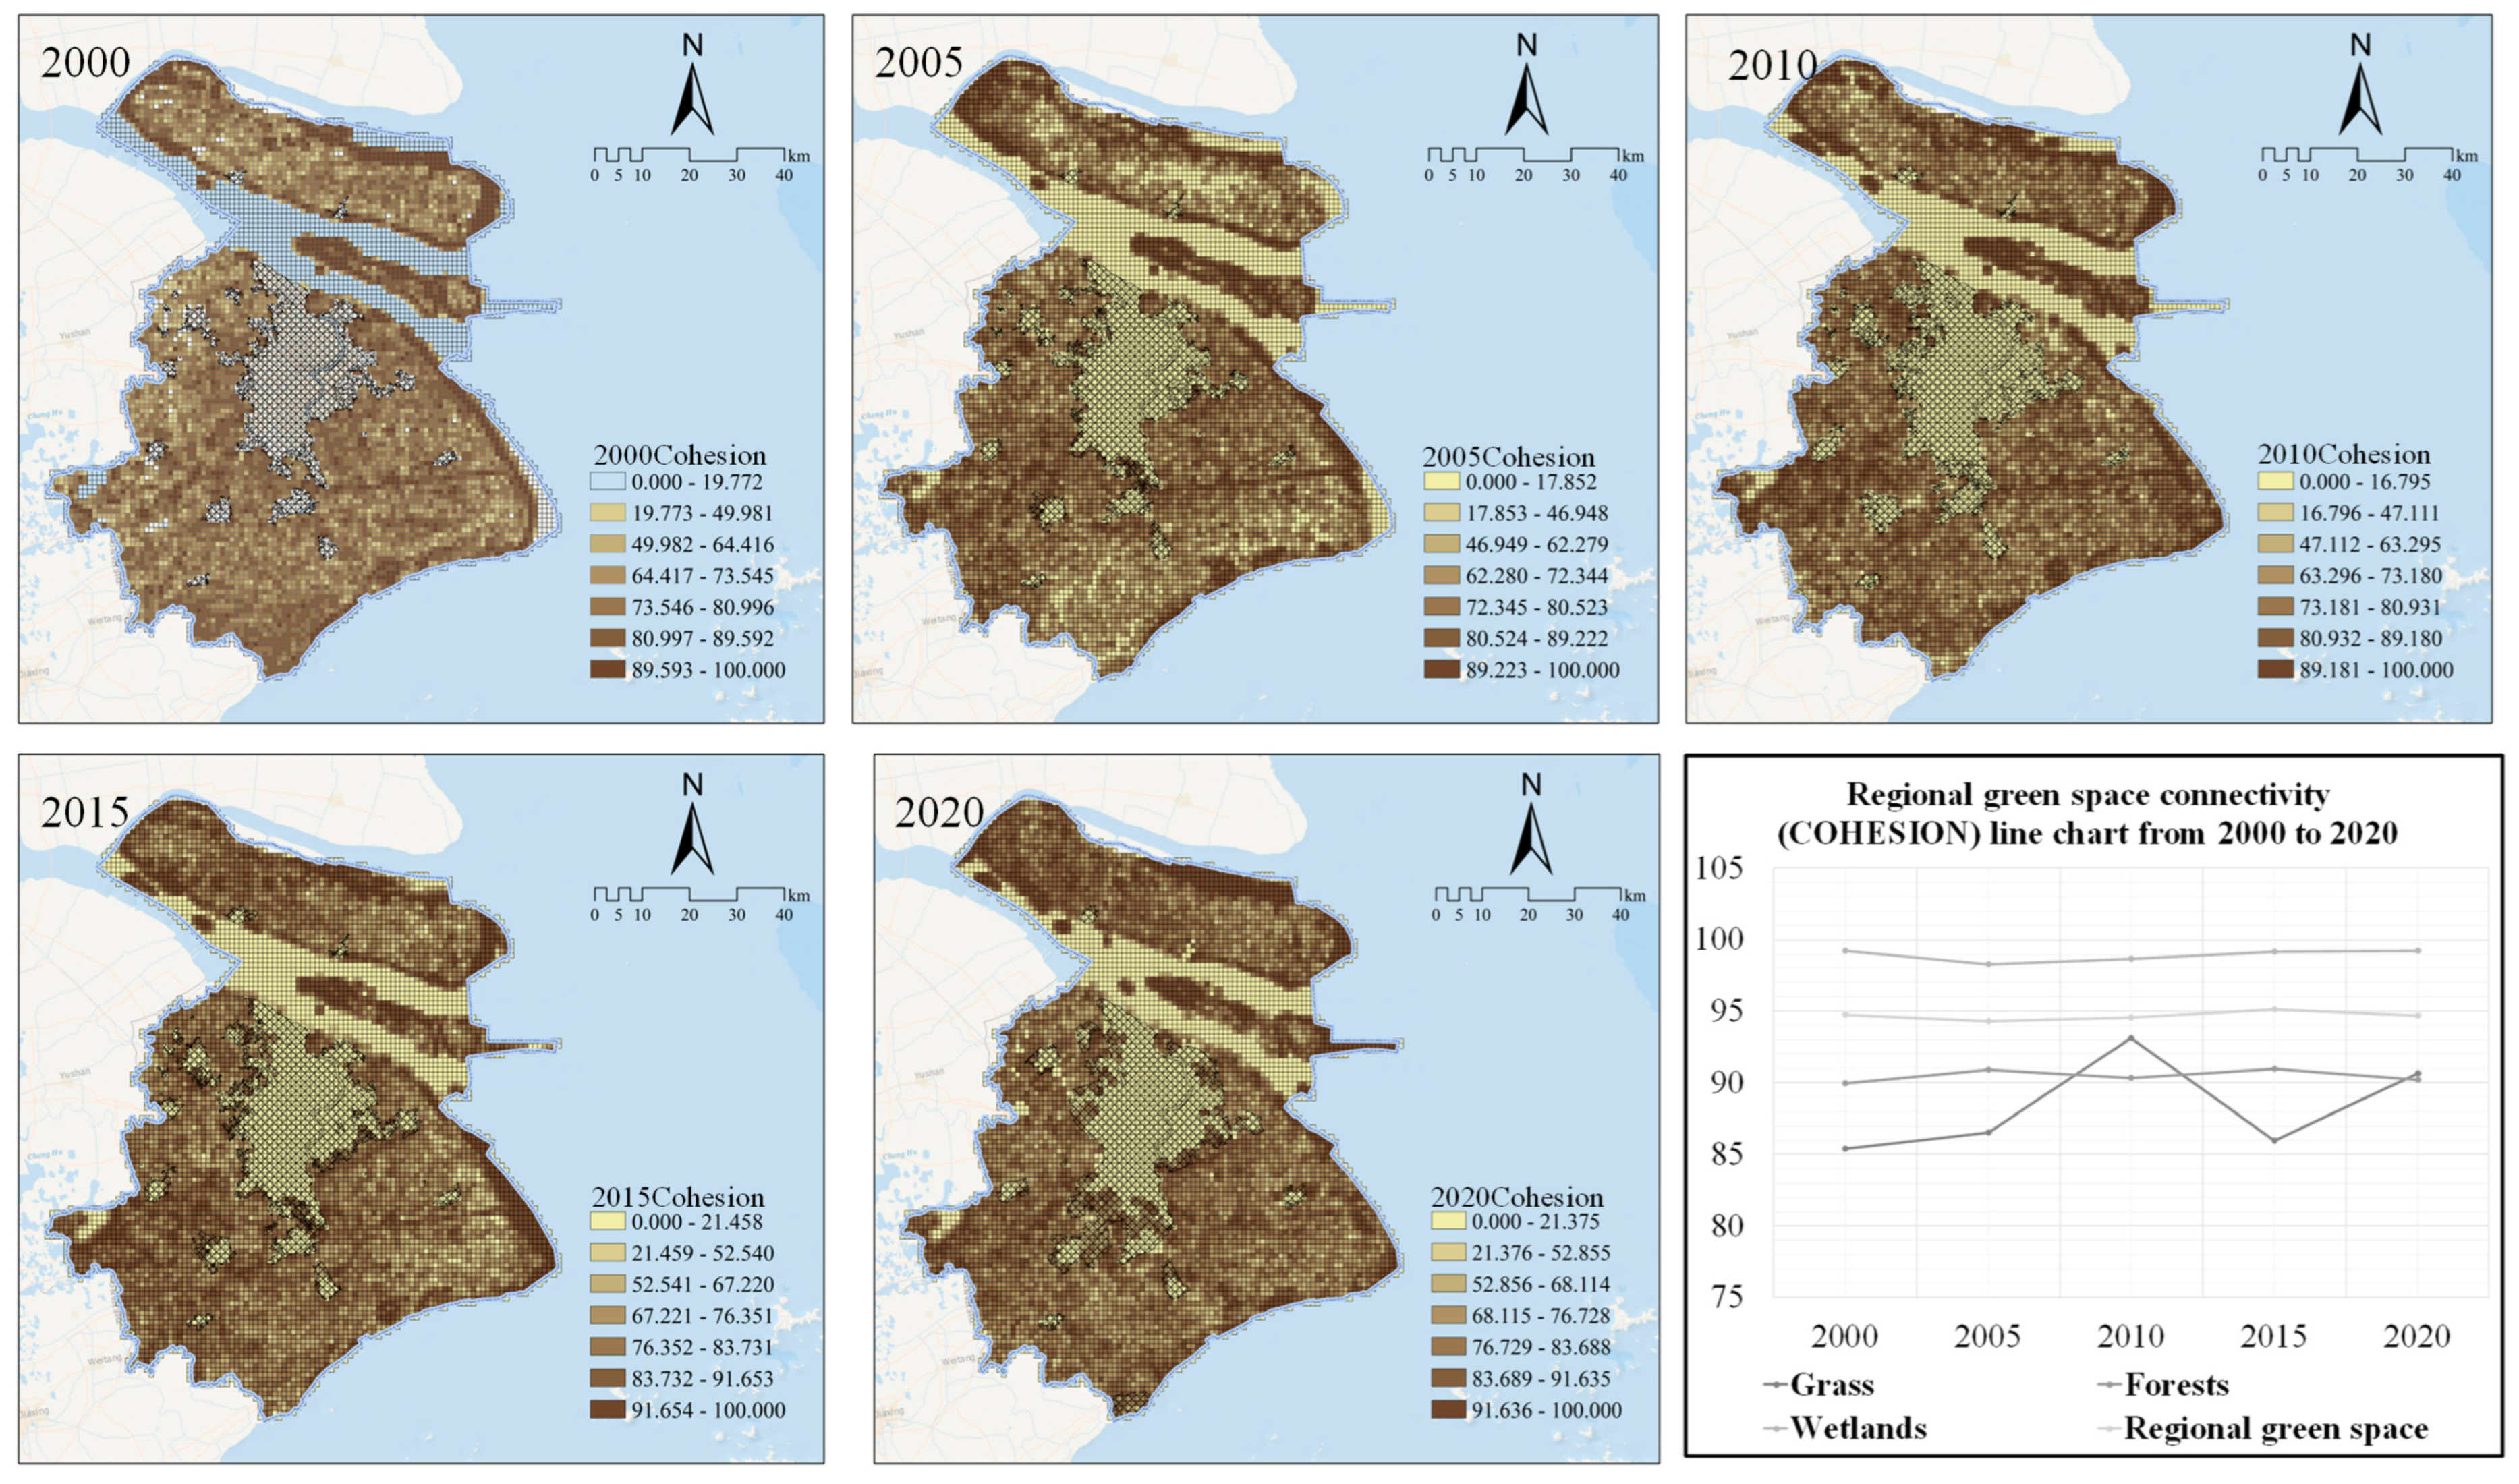
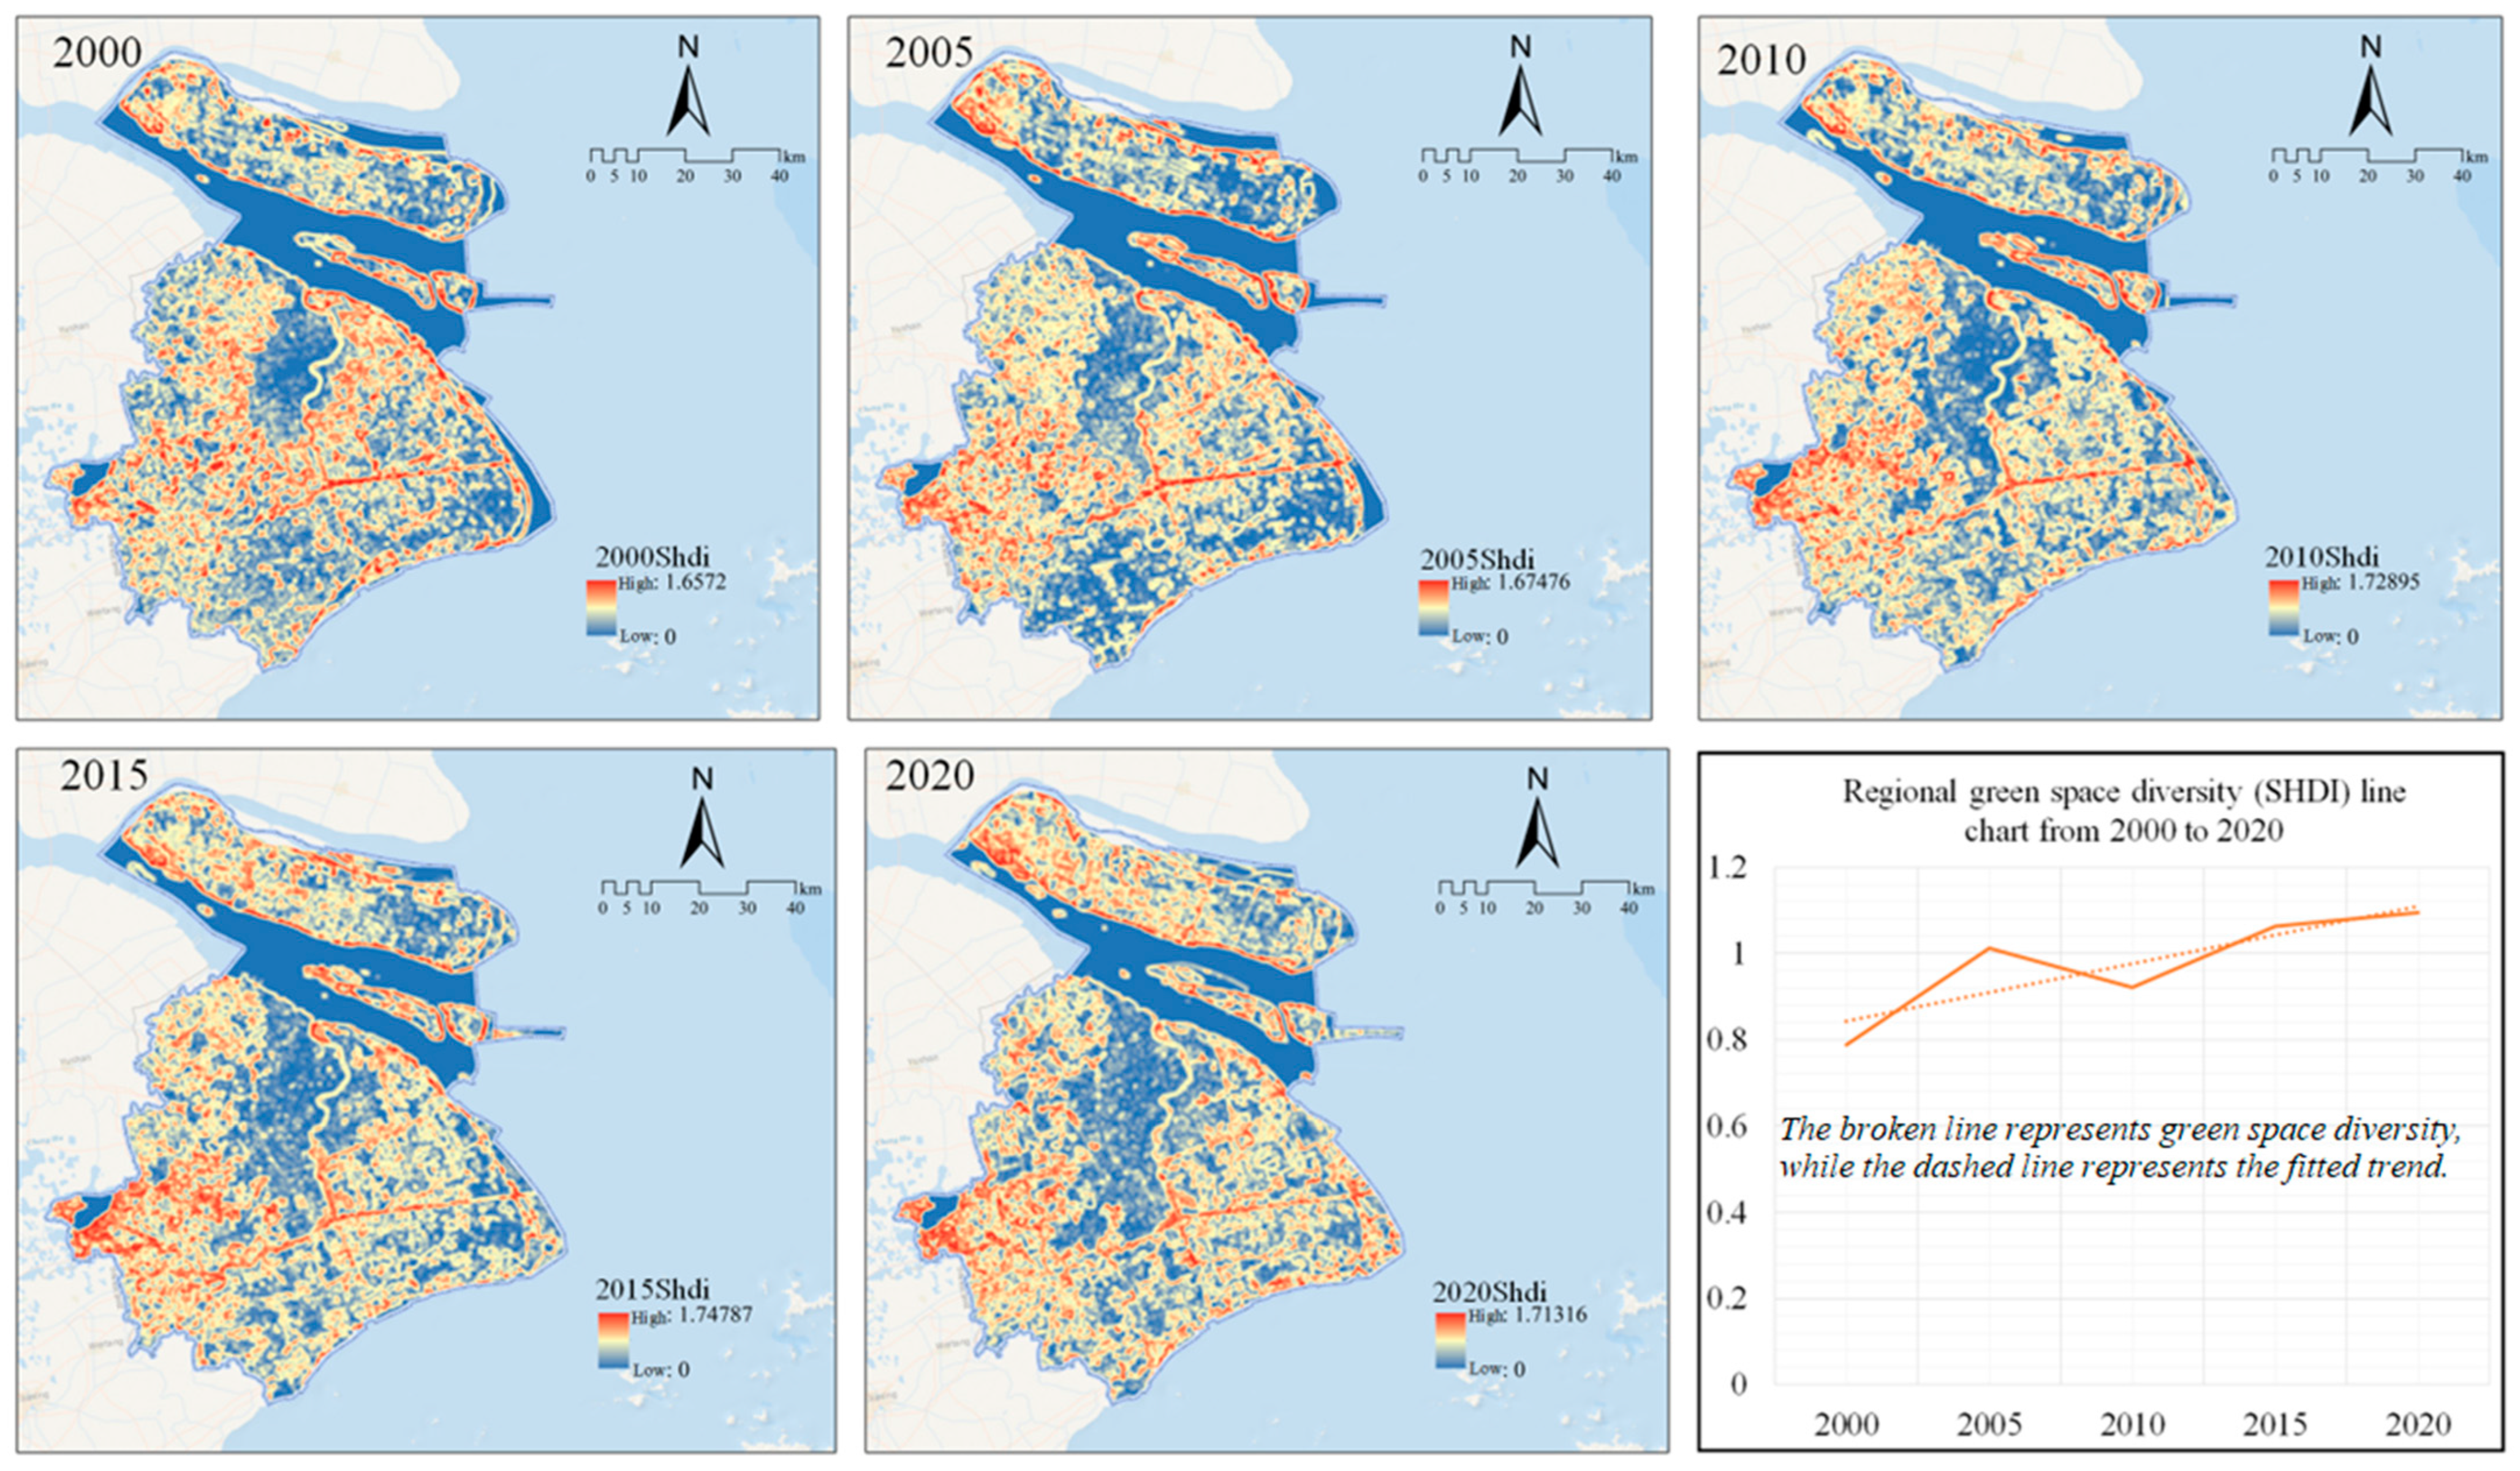
33]. The moving window method mainly outputs a new grid map corresponding to the selected landscape index by statistically analyzing the selected features within the window. The specific steps are as follows: (1) pixel verification was conducted on the current land use situation in Shanghai from 2000 to 2020, ensuring that the spatial position and size of pixels in each period were equal and, (2) after proofreading the grid layers from 2000 to 2020, the land use in Shanghai was analyzed using moving windows at the landscape level and type level, and the corresponding landscape indicator spatial grid maps were obtained. The landscape pattern calculation based on the moving window method was implemented using the Fragstats 4.2 platform. This study mainly analyzed the landscape pattern of and changes in green spaces outside the built-up areas in Shanghai. At the same time, in order to analyze the changes in landscape patterns in different regions, this study also calculated the landscape patterns on a 1 km × 1 km scale and used their spatial visualization to analyze the changes in landscape indices in the study area.
A single landscape pattern index cannot easily express the structure of the entire green space system’s landscape pattern, so multiple landscape pattern indices need to be used to jointly reflect the characteristics of the landscape pattern. To comprehensively express the characteristics of a landscape structure, scholars usually divide the landscape pattern index into three levels: the patch level, patch type level, and landscape level. Fargstats 4.2 is the most commonly used software for landscape pattern analysis and the calculation of landscape indices, with up to 277 indicators describing the three levels of landscape patterns in the software. The patch level index expresses the spatial structure characteristics of individual patches, and has little significance in explaining various types of patches, i.e., the entire landscape structure, at the urban scale. Many landscape pattern indices at the other two levels express a similar content and meaning, and many different indices have similarities in calculation and meaning, and their results also have a certain correlation. Therefore, it is necessary to choose the most suitable simple and persuasive landscape pattern index to illustrate the problem, in order to quantitatively describe the changes in landscape structural characteristics over different periods [
34].
The main principles for selecting landscape pattern indices in this study were as follows: (1) the calculation formula for landscape pattern indices is relatively simple and will not be affected by changes in the other indices; (2) the ecological or spatial significance of the index is clear, which is conducive to describing the characteristics of the spatial structure; and (3) the selected index can comprehensively reflect the heterogeneity or spatial structure characteristics of the landscape from various perspectives, which means that suitable landscape pattern indices can be selected from multiple perspectives to comprehensively and systematically describe the structure, characteristics, and dynamics of the landscape pattern. This study ultimately selected indicators that can describe the patch type and landscape, including the patch type area (CA), fragmentation index (PD), landscape shape index (LSI), connectivity index (cohesion), and Shannon diversity index (SHDI). The calculation formula for the landscape index is shown in
Table 1.
4. Discussion
The regional green space outside the built-up area of Shanghai, which is the most seriously disturbed area in the process of rapid urbanization [
35], is important in the study of its landscape spatial pattern characteristics. Previous studies on the spatial and temporal evolution of the green space landscape pattern in Shanghai were mostly based on the built-up area or the overall green space identified using remote sensing image data [
36]. The green space data cover the built-up area inside and outside of the city, and it is difficult to determine the unique characteristics of the changes in the spatial pattern of the green space landscape in the areas outside the built-up area. For example, Zhang Li-Quan et al. quantitatively revealed the spatial distribution characteristics of the landscape pattern in Shanghai. With the help of GIS spatial analysis technology, Zhang et al. [
37] studied the typical regional green corridor space in Shanghai, constructed an evaluation system, and provided a scientific and effective basis for the development of regional green corridors. The overall lack of spatial characterization of regional green landscapes outside the built-up area prevents regional ecological environment construction [
38]. Liu et al. made a relevant analysis of the overall green space pattern changes in Shanghai from 1990 to 2015 in terms of the degree of change and landscape indicators, mainly exploring the impact of urban expansion on arable land, and did not provide an in-depth discussion of the phase of regional green space [
39]. Based on the kilometer grid method, Da et al. analyzed the change patterns of the green space landscape in the central urban area of Shanghai from 2005 to 2015, and quantified the obvious “spatial characteristics” of different types of green space along the gradient of landscape patterns; however, the study was based on the forest soil and did not investigate the regional green space. The rapid urbanization of Shanghai since the turn of the century has led to the rapid development of the city. Since the 21st century, Shanghai has experienced a period of rapid urbanization, with the regional green space landscape spatial pattern change rate being significantly accelerated as a result. The regional environmental coverage of ecological resources has become much larger than the built-up area [
1]. The existing research is mostly focused on the scope of the built-up area, but the green space within the built-up area and the regional green space outside the built-up area are very different [
40,
41]. The collection of regional green space dynamic data and their spatial evolution characteristics need to be further strengthened to fill the gap in the relevant research. This study analyzed the spatial pattern of the regional green space landscape outside the built-up area of Shanghai using remote sensing data from 2000 to 2020, effectively making up for the lack of research on regional green spaces outside built-up areas, to help ensure the healthy and stable development of the regional environmental system.
The relationships between the area growth and landscape pattern indices (fragmentation, connectivity, diversity) at different stages did not necessarily show positive correlations, but there was a positive correlation between the area reduction and landscape pattern indices. For example, Zhang et al. [
42] found that the area of green space in Jinan City continued to increase during 1996–2004, but the diversity did not change much, while Deng Jinsong et al. [
43] showed that the total area of green space in Hangzhou City continued to decrease slowly during 1996–2004, and that the fragmentation was still high.
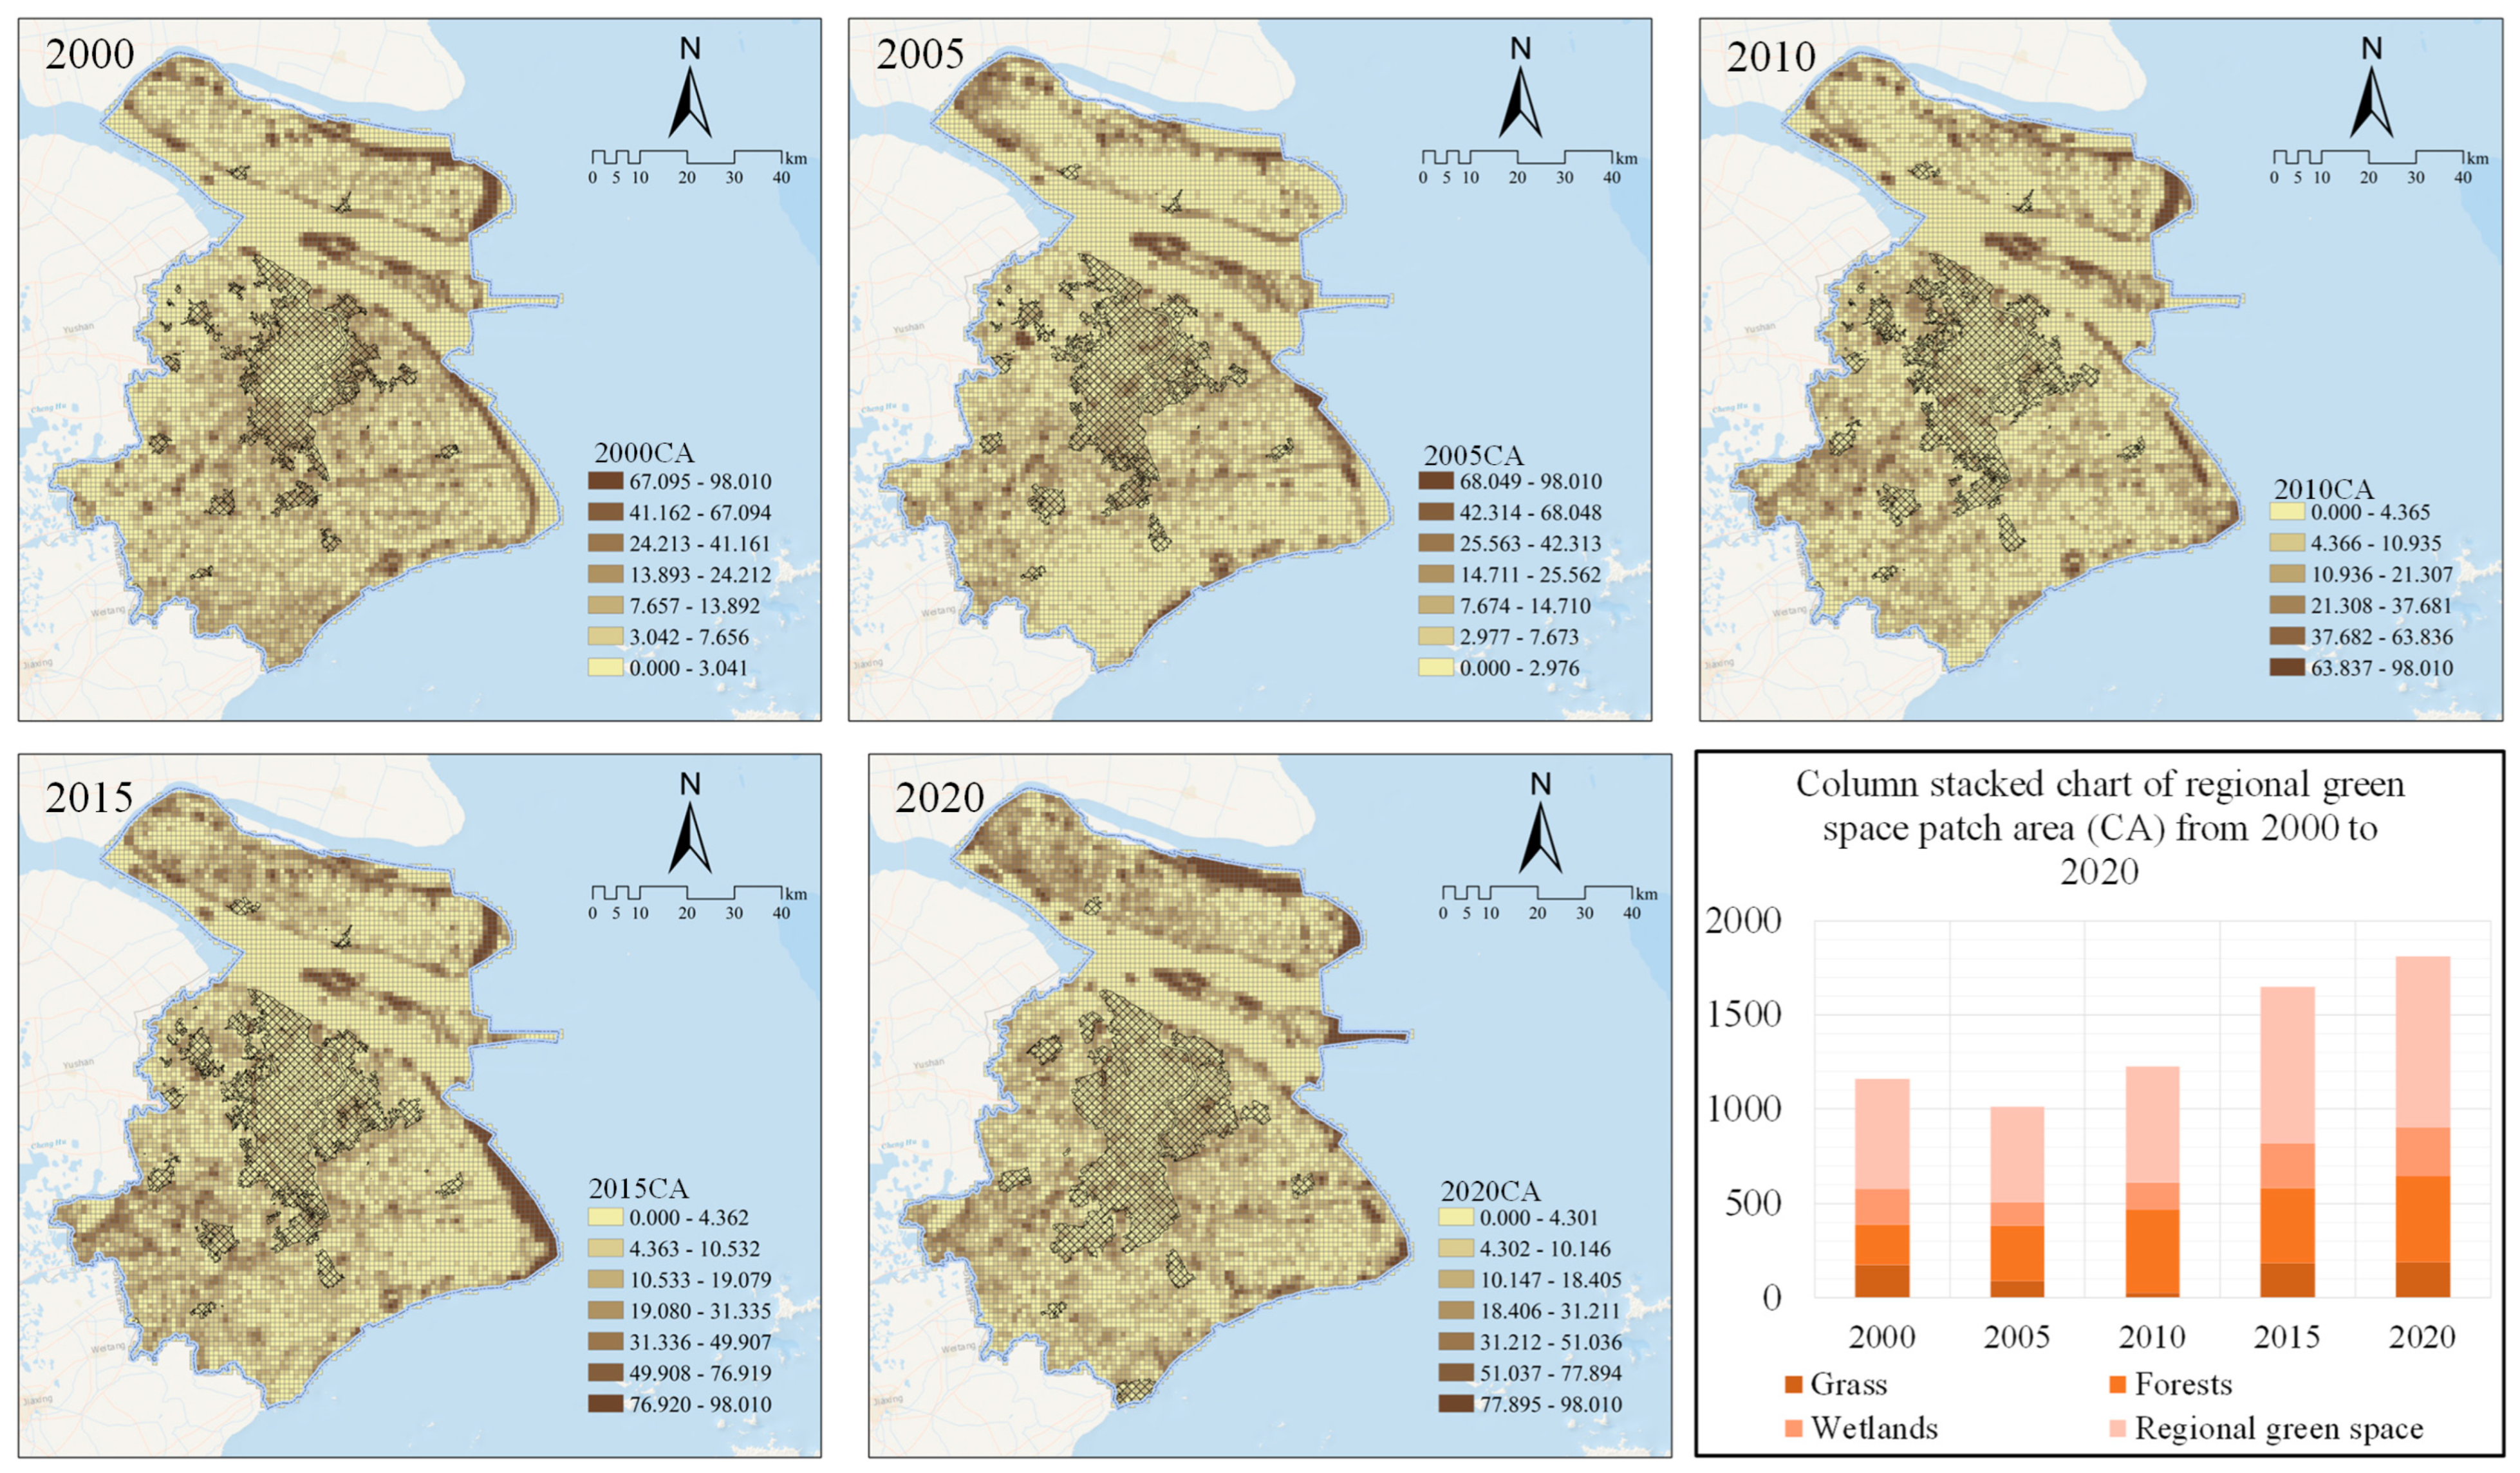
The results of this study show that, between 2000 and 2020, the total area of green space in the Shanghai Municipality showed a change characteristic of “decreasing first and then increasing”. For example, in the four phases of 2000–2005, 2005–2010, 2010–2015, and 2015–2020, the changes in the area of regional green space were a rapid decrease, slow increase, rapid increase, and then slow increase. The trend of the regional green space growth was closely related to the socio-economic development of Shanghai. Socio-economic development leads to urban expansion, and also promotes investments in landscaping and greening. In this stage, from 2001 to 2005, the regional green space area decreased by 74.1 km
2. However, the cognition of ecological and environmental protection tends to lag behind socio-economic development [
44], and there was a spatial and temporal divergence of green space and fragmentation of the urban area of Guangzhou in the last 35 years. Real estate investment and the number of factories have a negative effect on regional green space. The amount of regional green space occupied by urban expansion is much larger than the amount of new construction, and there is a “game” relationship between regional green spaces and socio-economic development, during which the fragmentation, connectivity, and diversity indices are negatively affected. In 2005–2010, socio-economic development increased to a certain degree, and began to focus on green development, resulting in the area of regional green space increasing by 106.7 km
2. To a certain extent, the government began to pay attention to green development, and the government began to increase the construction of regional green spaces outside built-up areas to curb urban sprawl. The regional green space area began to show good growth, which led to an increase in the connectivity and biodiversity in the landscape pattern index, but there was still severe fragmentation, and the phase of synchronous growth of the regional green space and the expansion of the city was realized. In 2010–2015, the regional green area increased by 210.1 km
2, and the regional green area in this phase was more fragmented than in the previous one. The regional green space growth in this stage was more obvious than in the previous stage, as the positive role of government policy continued to strengthen, which leaned toward ecological environmental protection and green development by increasing the investment in ecological environment construction and greatly promoting the construction of regional green spaces. From 2015 to 2020, urban expansion was basically stable, with none of the rapid expansion which was seen in the previous ten years, which led to a stage where the regional green space area increased by only 82.4 km
2, only half of the growth seen in the previous stage. This stage of urban development was the era where the regional green space slowly increased, and the regional green space and region entered the stage of high-quality development.
The rapid development of regional integration in Shanghai and the construction of regional facilities accelerated the fragmentation of natural ecological resources such as landscapes and forests in the region, resulting in a reduction in regional ecosystem stability and deterioration of connectivity. By accurately analyzing the regional green space data, we can scientifically discern the characteristics of the regional green space pattern evolution and identify the main problems. Under this new situation, the integrated development of Shanghai’s regional environment will inevitably put forward higher requirements for the development and management of the regional green space, and targeted research on the evolution of its spatial pattern can not only provide important theoretical support for Shanghai’s regional ecological environmental protection work and optimization of environmental reconstruction, but also has great significance for the city of Shanghai’s goals of global excellence and serving as the model for the integration of the Yangtze River Delta [
23]. From a governing perspective, these research results can provide a decision-making basis for regional planning, ecological spatial planning, regional integration management, etc., which can effectively support national land spatial planning [
22], enhance the stability of the regional ecology, and provide urban and rural residents with open spaces for recreation [
45]. From a market perspective, the results of this research can provide a direct reference for the planning, construction, and management of regional green spaces, and promote the comprehensive function of regional green spaces’ inherent ecological resources [
34]. From a social perspective, the results of this research can help to curb regional ecological environment fragmentation, promote the integration of gray infrastructure and the blue-green ecological resources in the region, enhance the image of the regional environment, and strengthen the quality of life for residents.
However, due to the limitation of space, there are some shortcomings in this study, which only focused on the evolutionary characteristics of green space patterns in Shanghai, a region with a higher level of socio-economic development, and did not study these characteristics in regions with a lower level of socio-economic development. A comparative study of the differences in the characteristics of regional green space evolution between Shanghai and underdeveloped cities, and further investigation into these characteristics, will play an important role in the decision-making regarding regional green space planning and the construction practices of cities.
5. Conclusions
Based on the moving window method, landscape pattern indices, transfer matrices, and other methods, this study comprehensively analyzed the evolution process and characteristics of regional green space patterns outside the built-up area of Shanghai between 2000 and 2020 from the perspectives of changes in regional green space, changes in spatial structure, and changes in the center of gravity of development. The specific conclusions are as follows:
- (1)
Constructing technical methods for acquiring scientific regional green space data.
Regional green space is located outside the built-up area, which not only has a large number of patches, large area, and wide coverage, but also involves different management departments such as water conservancy, transportation, agriculture, environmental protection, etc., and its scope and land use change dynamically with the expansion of the built-up area. A method to accurately analyze the dynamically changing regional green space data is needed in practice and research. In this study, through machine learning, biophysical components (BCI), CA binarization, and other technical methods, we constructed a regional green space identification technology system to identify regional green space dynamic data. This method was used to obtain a more comprehensive and relatively reasonable urban built-up area scope as well as regional green space data, and also provides a reference for the development of regional green space in Shanghai or other cities, as well as regional environment-related research.
- (2)
The evolution of Shanghai’s regional green area shows a fluctuating growth trend of “first decline and then rise”.
The cultivated land area in Shanghai showed a large area of reduction, and the water area continuously decreased, but the regional green space in terms of wetlands and grasslands showed a development trend of “first decline then rise”. In addition, the forested land area maintained continuous and steady growth. The changes in the land type of the regional green space in Shanghai were divided into several stages: the initial stage of regional green space was mainly formed naturally; the expansion of urban built-up areas eroded a large amount of arable land during this period, when the conversion of regional green space into other land types was not obvious. With economic and social development, reclamation and other construction projects, as well as various types of ecological security and ecological protection projects, caused the regional green space to change dramatically; with the socio-economic level of development at a higher level, the overall area of the regional green space and other types of land tended to stabilize. Therefore, the development of similar urban environments can learn from the Shanghai Municipality in terms of the construction of a large number of woodlands to promote the regional ecological environment, but also to avoid eroding the ecological environment after the destruction process has begun.
- (3)
The number of regional green spaces in Shanghai increased, but the spatial pattern at the overall level was fragmented and heterogeneous; at the local level, the woodlands, and wetlands in some areas showed continuous development, with the development trend of point-line synergy.
Large patches in the regional green space were mostly scenic recreational green spaces and ecological conservation green spaces, and the number of individual patches was large and relatively dispersed, such as the large patches of regional green space in the Sheshan area and Chongming Island area due to the concentration of original natural resources, which are relatively isolated and dispersed. The number of small patches was large, and they were aggregated; they were ecological conservation green spaces and regional facilities protection green spaces, and were distributed in water systems or around regional facilities in a strip-like aggregated distribution, with a strong spatial connectivity value. It can be seen that the coordination and integration between the regional green space was poor, presenting the spatial layout characteristics of a small number of extra-large patches that were dispersed, and a large number of small patches that were aggregated. Therefore, in the future planning and construction of regional green spaces in Shanghai or other cities, it is not only necessary to strengthen the protection of large regional green spaces, but also to consider the interconnectivity between them to avoid fragmentation.
- (4)
The spatial center of gravity of Shanghai’s regional green space has a high degree of consistency with the overall green space changes.
The difficulty of increasing the urban green space area leads to changes in the regional green space outside the built-up area of the city, which directly affects the change in the overall green space pattern of Shanghai. According to our analysis of the center of gravity transfer distance and orientation of the woodlands, grasslands, and wetlands in Shanghai’s regional green space, the center of gravity of the wetlands basically remained unchanged during the 20-year period, while that of the grasslands moved significantly to the northwest and that of the woodlands was transferred by a smaller distance and tended to be stabilized. Therefore, in the future, regional ecological environment protection and construction in Shanghai or other cities can not only focus on the green space resources within the urban built-up area, but also need to strengthen the regional green space resources outside of the built-up area.


