Measuring Agro-Biodiversity through Leverage Factors: Land Use, Farmer Practices and Public Policies


1
CREA—Research Centre for Policies and Bioeconomy, 00187 Rome, Italy
2
Department of Economics, Roma Tre University, 00145 Rome, Italy
*
Author to whom correspondence should be addressed.
Land 2023, 12(8), 1499; https://doi.org/10.3390/land12081499
Submission received: 15 June 2023
/
Revised: 17 July 2023
/
Accepted: 26 July 2023
/
Published: 28 July 2023
Abstract
:Understanding the socio-economic channels through which farmers affect agro-biodiversity (ABD) represents a relevant research area, especially in the light of the new sustainable development paradigm. Supporting ABD is one of the main goals of the EU Green Deal and the agricultural sector is being called on for a higher commitment. Nowadays, ABD interventions are linked not only to the genetic and natural resources of species, but also to farming practices, land management, living standards in rural areas and all the policy interventions supporting them. However, the existing literature is still mainly focused on the environmental and agronomic perspectives. This paper aims to assess the extent to which different socio-economic and policy factors affect the performance of farmers in supporting ABD at the territorial level. Starting from the FADN data and focusing on Italy, we built a new regional comprehensive indicator that accounts for three levers through which farmers mostly interact and can influence ABD: land use strategies, agriculture practices and management decisions, and Common Agricultural Policy (CAP) funds. Results reveal a heterogeneous spectrum of indicator scores at the regional level. Land use strategies have a significant relevance for the North-East regions and the Islands (Sicily and Sardinia), whereas agricultural practices emerge as the primary influential factors in the Centre and South. Policy funds dominate in the North-West, reflecting the greater expenditure capacity of the northern regions. These findings have important policy implications for the future of the CAP and the biodiversity EU strategy.
1. Introduction
The lemma “biodiversity” (BD) was coined in 1988 by the American entomologist E.O. Wilson, to describe the gene pool of all living beings on Earth [1]. In 1992, in Rio de Janeiro, the Convention on BD was subscribed at the international level and BD was defined as the variety and variability of all living organisms, including diversity within species, among species and among eco-systems [2]. The 1992 Convention on biological diversity defined BD as the “the variability among living organisms from all sources, including terrestrial, marine and other aquatic ecosystems and the ecological complexes of which they are part”1.
The acknowledgment of the importance of BD and its preservation at the global level has led to the necessity to deeply change the model of economic development aiming at the full implementation of a new sustainable model. Over the years, the EU policy as well has gone beyond the mitigation of agriculture effects on BD, often incentivizing conservation and constraints on production. In this context, the innovative idea behind the policy is that agricultural production and BD are not necessarily in conflict but can rather be interlinked, strengthening each other [3].
Moving from BD, agro-biodiversity (ABD) is defined as the result of the interactions among genetic resources, environment, and the agro-ecosystems, in which a key role is played by natural selection, environmental conditions, human practices, and by economic, social, technical, and policy factors [4]. While BD is usually aimed at conservation, and the main goal of preserving BD is to maintain or restore wildland ecosystems, in the case of ABD, interventions are mainly aimed at improving land management and living standards in agriculture and rural areas [5]. In this case, therefore, the environmental dimension of BD needs to be combined with other aspects such as social and economic reliability, proper practices, landscape conservation and public incentives within a win–win framework. This mixture makes the identification of the channels through which farmers can contribute to preserving and enhancing ABD a hard challenge. Even if there are several strategies proposed by the literature to measure the status of ABD and to assess to what extent actors are contributing to its conservation and preservation [6], most of them are limited to environmental characteristics and contextual factors, such as climate, weather, starting conditions of natural resources and so on, leaving to farm practices and policy factors a marginal role. In addition, these indicators do not account for the territorial dimension of ABD, and therefore do not disentangle territorial heterogeneities. The following question therefore remains: which are the socio-economic and political factors mainly affecting the performance of farmers dealing with ABD at the territorial level?
To investigate this question, we explored the cross-sectional Farm Account Data Network (FADN) 2020 database for Italian farms composed of 10,764 professional units, and built a new regional comprehensive indicator that accounts for three levers through which farmers mostly interact and can influence ABD: land use strategies, agricultural practices, and Common Agricultural Policy (CAP) funds. In other words, we do not merely consider the “quantity” of BD produced or protected in farms, but rather we consider land specialisation, farm practices and public (EU) policies as three relevant factors having direct effects on ABD and use them, properly combined in a synthetic indicator, as a proxy of ABD intended as a multidimensional measure of sustainable farming. All these dimensions have been stressed in the literature as factors having a large impact on BD and the ABD of farming systems, but they have never been considered together in a comprehensive single index, even if the literature stressed the need for BD indicators for farms [7].
To capture the territorial dimension, we refer our analysis and our indicator to the second level of the Nomenclature of Territorial Units for Statistics, NUTS2 (regions in Italy), given that the FADN database is representative of the universe only at the country and NUTS2 level by construction (in addition to farm type and economic dimension). For the rest of this paper, we will refer to the index as Three Leverages for ABD (T-LAB).
Our findings show a rather wide range of scores of the indicator at the regional level. More specifically, 11 regions are below the average national (Italian) score. Valle d’Aosta is the region performing the best, while Trento and Liguria perform less well. Looking at the three socio-economic dimensions of the index, land strategies are particularly relevant for the North-East regions and the Islands (Sicilia and Sardegna), while agricultural practices seem to be the most relevant channels in the Centre and in the South. The support of CAP funds prevails in the North-West, reflecting the higher expenditure capacity of the northern regions.
To confirm the validity of the index proposed, we replicate the analysis on a subsample composed of only those farms that are located within a Natura2000 area2. Even if this sample is not statistically representative at the regional level, it allows us to validate our strategy. If, as the literature argues, Natura2000 areas are established to protect BD and actors located in those areas work with nature rather than against it, by selecting only farmers in Natura2000 areas we should find higher values. Results confirm this: farmers in fragile and protected areas are more sensitive to the issue of ABD. Our findings confirm what the literature stressed in some previous papers. Focusing on Italy, Maiorano et al. [8] found that the Natura2000 network contributes to BD conservation, even if its role could be enhanced by a more general strategy [9]. In line with that, Princé et al. [10] provided evidence that common bird populations in France declined more slowly within Nature2000 areas than outside.
This paper contributes to the strand of the literature about BD and sustainable development in several ways. First, to our knowledge, this is one of the few contributions that investigate the mechanisms through which farmers can affect ABD and present an index to summarize them. In the paper we focus on Italy, but the index can be easily replicated for other EU countries to better inform the European debate and policy makers and to create a common set of data monitoring ABD in Europe. Second, our analysis represents one of the few studies investigating this issue at the disaggregated territorial (regional) level, rather than at the micro (farmers) or national level. Given the territorial heterogeneity across regions within a country, and ABD being highly dependent on production, territorial conditions and policies implemented at the regional level, it is particularly relevant to conduct the analysis at a sub-national level. Lastly, this paper contributes to the large political debate about the interventions to implement in support of ABD. Our results give some support to this concern, because within the same country, the mechanism through which ABD is supported differs and, therefore, more territorial-oriented and community-led policies appear potentially better to increase their efficiency.
The rest of the paper is organised as follow. Section 2 discusses the contextual and literature background and presents the empirical setting and the steps followed to construct the index. The results, together with a robustness analysis, are presented in Section 3. Section 4 presents a discussion of the results and some final remarks referring mainly to some policy advice.
2. Materials and Methods
2.1. Literature and Background
Most measures of BD come from the ecological and biological world. Studies on BD indicators agree on the complexity to measure it, even at the local level: on the one hand, indicators should be site-specific; on the other, they need to be replicable, robust, and economically sustainable [6]. A pragmatic approach to ABD has developed the concept of “functional ABD”, meaning to reconcile agricultural production with the conservation and sustainable use of BD and associated ecosystem services [11]. However, such an approach makes even more complicated the identification and measure of proper multidimensional indicators, while posing a challenging issue of the appropriate scale of assessment and policies. ABD is linked not only to the genetic and natural resources of species, but also the farming practices and policies supporting them. Farmers are directly involved in the production and management of BD, especially small-scale and family farms that organize their activities on the principle of product differentiation and multifunctional agriculture [12,13]. Institutions have acknowledged this specific function of farmers, rewarding it with specific incentives in the Common Agricultural Policy (CAP).
In this context, several attempts were made to create effective indices based on theoretical assumptions. As reported by Herzog et al. [7], the majority of biodiversity indicators for farming systems rely on habitat and species diversity indicators. In this group of studies, papers have adopted the information theory models [14] to propose a series of biological or ecological indicators that mathematically account for species diversity in each community [15]. Overall, based on species richness (the number of species present in a habitat) and species abundance (the number of individuals per species) they overall account for the probability that a single random individual belongs to a determined species. Among them, for instance, the Shannon–Wiener index is an information statistic index, which accounts for the share of individuals of a specific species in the total number of individuals in the sample, while the Simpson index weights the individual presence to common or dominant species to avoid having a few rare species with only a few representatives affecting the diversity. The indices are still commonly used, even if the literature recognized that it is difficult to identify a robust way to account for species in natural communities and conduct a robust sample splitting [15]. For instance, Belanger and Pilling [16] assess the biodiversity for food and agriculture by considering the diversity of animals, plants and micro-organisms at the genetic, species and ecosystem levels that sustain structures, functions and processes in and around production systems and provide food and non-food agricultural products.
A different strand of papers focuses on the business performance perspective and developed indices to compare management practices. These papers look at the impact of different products to support decision making in product design and organizational aspects [17]. For example, the Product Biodiversity Footprint method combines Life Cycle Assessment and Ecology and calculates the impact along the life cycle of products through a set of various indicators [18]. This literature has also stressed the relevance of the “biodiversity performance tool”3 in terms of BD for standards and certifications, and the “Root index” for specific forest landscape issues [19]. The general aim of both is to develop a biodiversity impact metric to support firms in measuring the impact on biodiversity of their provision chain, for a specific product in a specific geographic area.
A final group of papers has used different proxies in biodiversity valuation, especially at the territorial level, such as soil use and water resources [20]. For instance, De’ath and Fabricius [21] looked at water quality, while Alcocer et al. [22] used acoustics indices as a tool for rapidly assessing biodiversity. In this direction, recently, De Valck and Rolfe [23] have reviewed the proxies used to value coastal and marine biodiversity.
Regarding ABD, the literature struggles even more to find a common approach to measure and evaluate it [24]. Whilst on the one hand agricultural activity often benefits from BD, on the other some farmers’ decisions, such as the intensification of agriculture, can threaten biodiversity. The impacts of agricultural and food systems in biodiversity include, in fact, a wide group of elements. Each ABD index proposed by the literature has been designed to include a minimum set of indicators that capture ABD across different pillars. For instance, the Italian Istituto Superiore per la Protezione e Ricerca Ambientale (ISPRA) elaborated a system of indicators according to three different spatial scales: landscape, farm, and soil [25], while the index proposed by Swiss Agroscope refers, instead, to a set of 23 indicators for organic and low-impact agriculture subdivided into indicators for animal and vegetable BD, species diversity, habitat diversity, and indicators of farm management [26]. Trisorio et al. [27] worked on High Natural Value areas in Italy distinguishing among different levels of natural value and focusing on three criteria: share of semi-natural vegetation; presence of natural elements of landscape; and the presence of interesting species for BD conservation. Bailey [24] discussed the main characteristics of an effective index for evaluating the conservation of ABD across different dimensions. The author underlines the need to have a rapid and cost-efficient measure of BD and to also catch the connections with policy decisions and the private sector at the country level on best practices to foster diversity. More recently, the structure of the new ABD index proposed by Jones et al. [28] reflects the three key functions of ABD in food systems: consumption, production, and conservation. Each of them contributes to a specific part of sustainable food systems which are, respectively, healthy diets, sustainable agriculture and securing future use options. The research applies the index to evaluate the ABD performance of the food systems of ten Mediterranean countries.
The above discussion clearly shows that most of the indices used to capture ABD mainly focus on environmental conditions, agriculture species variety and land use. However, notwithstanding some relevant exceptions such as Jones et al. [28,29], papers proposing a more comprehensive indicator which accounts for categories related to actions and commitments are scant, leave a marginal role to these socio-economic aspects and, if addressed, mainly deal with them only at an aggregated territorial level (national). As a result, the kinds of actions farmers are pursuing to increase ABD across the agrifood sector and the extent to which CAP policy are supporting farmers in these actions are not clear. Farmers can, in fact, receive funds for implementing actions and strategies that have a specific enhancement effect on ABD.
In this context, the contribution of this paper is to propose a new approach to measure ABD considering socio-economic and political leverage factors, moving from farmers’ data, and using single regions as the unit of observation; that is, the territorial level at which the CAP rural development policies are programmed and managed.
2.2. Empirical Setting: Data and Methodology
The aim of this paper is to evaluate the socio-economic and the environmental mechanisms that foster the preservation of ABD at the territorial (regional) level. For this purpose, we follow a two-step procedure. First, by implementing a multidimensional sustainability approach, we constructed a three-dimensional index, which we called Three Leverages for ABD (T-LAB); second, we used it to evaluate the farmers’ involvement in ABD-friendly activities and to disentangle whether one mechanism, captured by a specific dimension of the index, is more relevant than others. Data for the analysis in this paper are drawn from the Italian FADN annual survey database (i.e., RICA). FADN is the EU official harmonized and standardized source of annual micro-economic data for European agricultural holdings. Data are representative at the regional-type of farming-year level and refer to a representative sample of commercial farms4. The Italian sample is made up of 10,764 professional farms. The observation field covers around 50% of farms5 (more than 8000 euros of revenues originate from on-farm activities), around 96% of standard production and 89% of the Utilised Agricultural Area (UAA).
The selection of the regional level depends on (i) data reliability (the NUTS2 level is the most territorial disaggregated level for which FADN is representative) and (ii) on the fact that the CAP Rural Development measures are programmed and implemented by the regional administrations through regional Rural Development Programs.
From the literature review, it emerged that a synthetic indicator accounting for the socio-economic drivers of ABD is missing. The ones currently available are based on sampling analysis, which can be hard to realize, especially on a large scale, and are often built on partial, case-specific measures and not suitable for a single indicator. A good synthetic indicator must be easy to measure and to calculate, and at the same time be statistically robust and keep all the information available. Similar indicators have been built and applied for different aspects of sustainability, such as water resources [30] and production sustainability [31].
The T-LAB index proposed in this paper measures the drivers that are involved in fostering ABD across three factors: (i) land use strategies, (ii) agriculture practices and (iii) CAP funds. All these three dimensions may contribute, in fact, to supporting ABD from three different channels, and it becomes relevant to have a synthetic measure of all the fostering leverages contributing to ABD according to the multidimensional concept of sustainability, going beyond the mere physical or conservative measure of BD.
Implementing more sustainable and resilient land use strategies is one of the main contributing factors to contrast the decline of ABD by addressing the reduction of soil degradation, landscape homogenization, habitats’ deterioration and fostering the maintenance of soil organic matter [32]. With regards to this, both the literature and the EU policy interventions have stressed the relevance of the protection of permanent pastures and the maintenance of the permanent pasture ratio [33].
The first part of our index captures, therefore, the diffusion of sustainable and resilient land use strategies, and it is computed as follows:
where a is the single farm, AREA P is the area devoted to pasture (including meadows) and g is the single crop area. To preserve ABD, it is however important to avoid too intensive pasturing, especially in small farms, because of its harmful impact on species richness of plants and soil characteristics. For this reason, if the ratio between the pastureland and the UAA is above 50% we follow the specification of Equation (1), while if the ratio is below 50%, we follow the specification (2).
At the same time, agriculture practices and management decisions are also crucial to minimize the effects of those actions directly linked to agriculture [34]. For example, practices associated with intensive farming systems can be harmful to ABD, as are heavy specialization and mechanization or under-rotation and overuse of fertilizers and pesticides. The second dimension of our index is dedicated therefore to capturing the relevance of agriculture practices realized within each farm. In particular, we collected data for the following practices:
- Agricultural land under organic farming. Organic production has, in fact, among the assumptions about the cultivation techniques used, targeted precisely the maintenance of ABD. As found by Kelement et al. [34], organic farmers have a more complex and philosophical approach to biodiversity;
- Forestry land, as a direct producer of BD;
- The absence of tillage, which is assumed to be a more friendly ABD practice;
- The use of fallowing, which allows for land regeneration;
- Low-intensity agriculture (high, medium or low). Highly specialized and intensive agriculture is, in fact, assumed not to be in line with the aim of preserving ABD, especially in the long run.
The dimension of the index is therefore calculated as follows:
For the first four elements, we used a dichotomic variable (0–1). For the intensity, we used a three-value scale: 1 if the intensity is low, 0 if is intermediate, −1 if it is high, according to the European Commission parameters6. The factor value ranks from −1 to 5, according to the number of practices and the rating of farm intensity.
Lastly, through the CAP, the EC has supported farmers over time to restore and conserve ABD in their farms and enhance local varieties of productions. The aim is to ensure that EU farmers can contribute not only to the EU’s ABD systems, but also to achieve more sustainable food systems for the EU.
To account for the political channel through which farmers should be more prone to support ABD, we built the third part of our indicator. We started by selecting from among the measures activated for the 2014–2020 CAP programming period those that can have a more direct effect on ABD and splitting them into:
- I Pillar funds;
- II Pillar funds targeting farmers’ actions and environmental commitments;
- II Pillar funds targeting farmers’ contextual conditions and therefore not linked to farmers’ choices and decisions.
The complete list of measures considered is provided in Table 1.
To each group of policies, the same weight has been given, and the indicator measured as follows:
In order to make comparisons possible, we standardized each factor of our index as follows:
where a is the single farm, V the computed value of each factor before the standardization, and MaxV and MinV are the maximum and the minimum value recorded for each factor among the FADN farms. Following the procedure proposed by Remans et al. [35], the overall T-LAB index score is compiled from the scores of each dimension, which together represent progress towards accounting for ABD. To each of the factors, then, we decided to assign the same weight, rather than changing the weighting for each pillar. A sensitivity analysis of outputs to individual pillar weightings is in our future research plan.
The final score is given by:
2.3. Application
As a second stage of our analysis, we applied the T-LAB indicator to the Italian FADN sample and aggregate data at the regional level to capture the territorial dimension. Overall, a positive value of T-LAB denotes a systematic contribution of farmers to regional ABD; the higher the value of the index, the higher the contribution. The value of each dimension indicates the channel through which the ABD is supported. The application of T-LAB has been provided by using 2020 FADN data for Italian farms. The sample is composed of 10,764 professional farms which are representative of the universe for the farm type, the economic dimension, and at the regional level. Note that we are aware that some potentially relevant data and information are not provided by FADN database. Therefore, our analysis can be also viewed as an indirect way to learn something about what could be the missing information (questions) that could be included in the FADN survey in the future.
The 2020 EU Farm to Fork Strategy has set the goal for the EU agri-food system to become a sustainability standard at the global level, among other things, through knowledge and information. For this reason, the strategy indicates the FADN as the new database for sustainability (FSDN) with the main goal to collect data for new and more accurate sustainability indicators (economic, social, and environmental). This process is already on its way, and it looks to be quite challenging since the original purpose of FADN was limited to the evaluation of farms’ economic performance. However, thanks to the fact that the Italian FADN has since long widened the scope and the fields of its dataset, this exercise also represents a test for the future goal of FADN as a database (FSDN) of sustainability [31].
3. Results
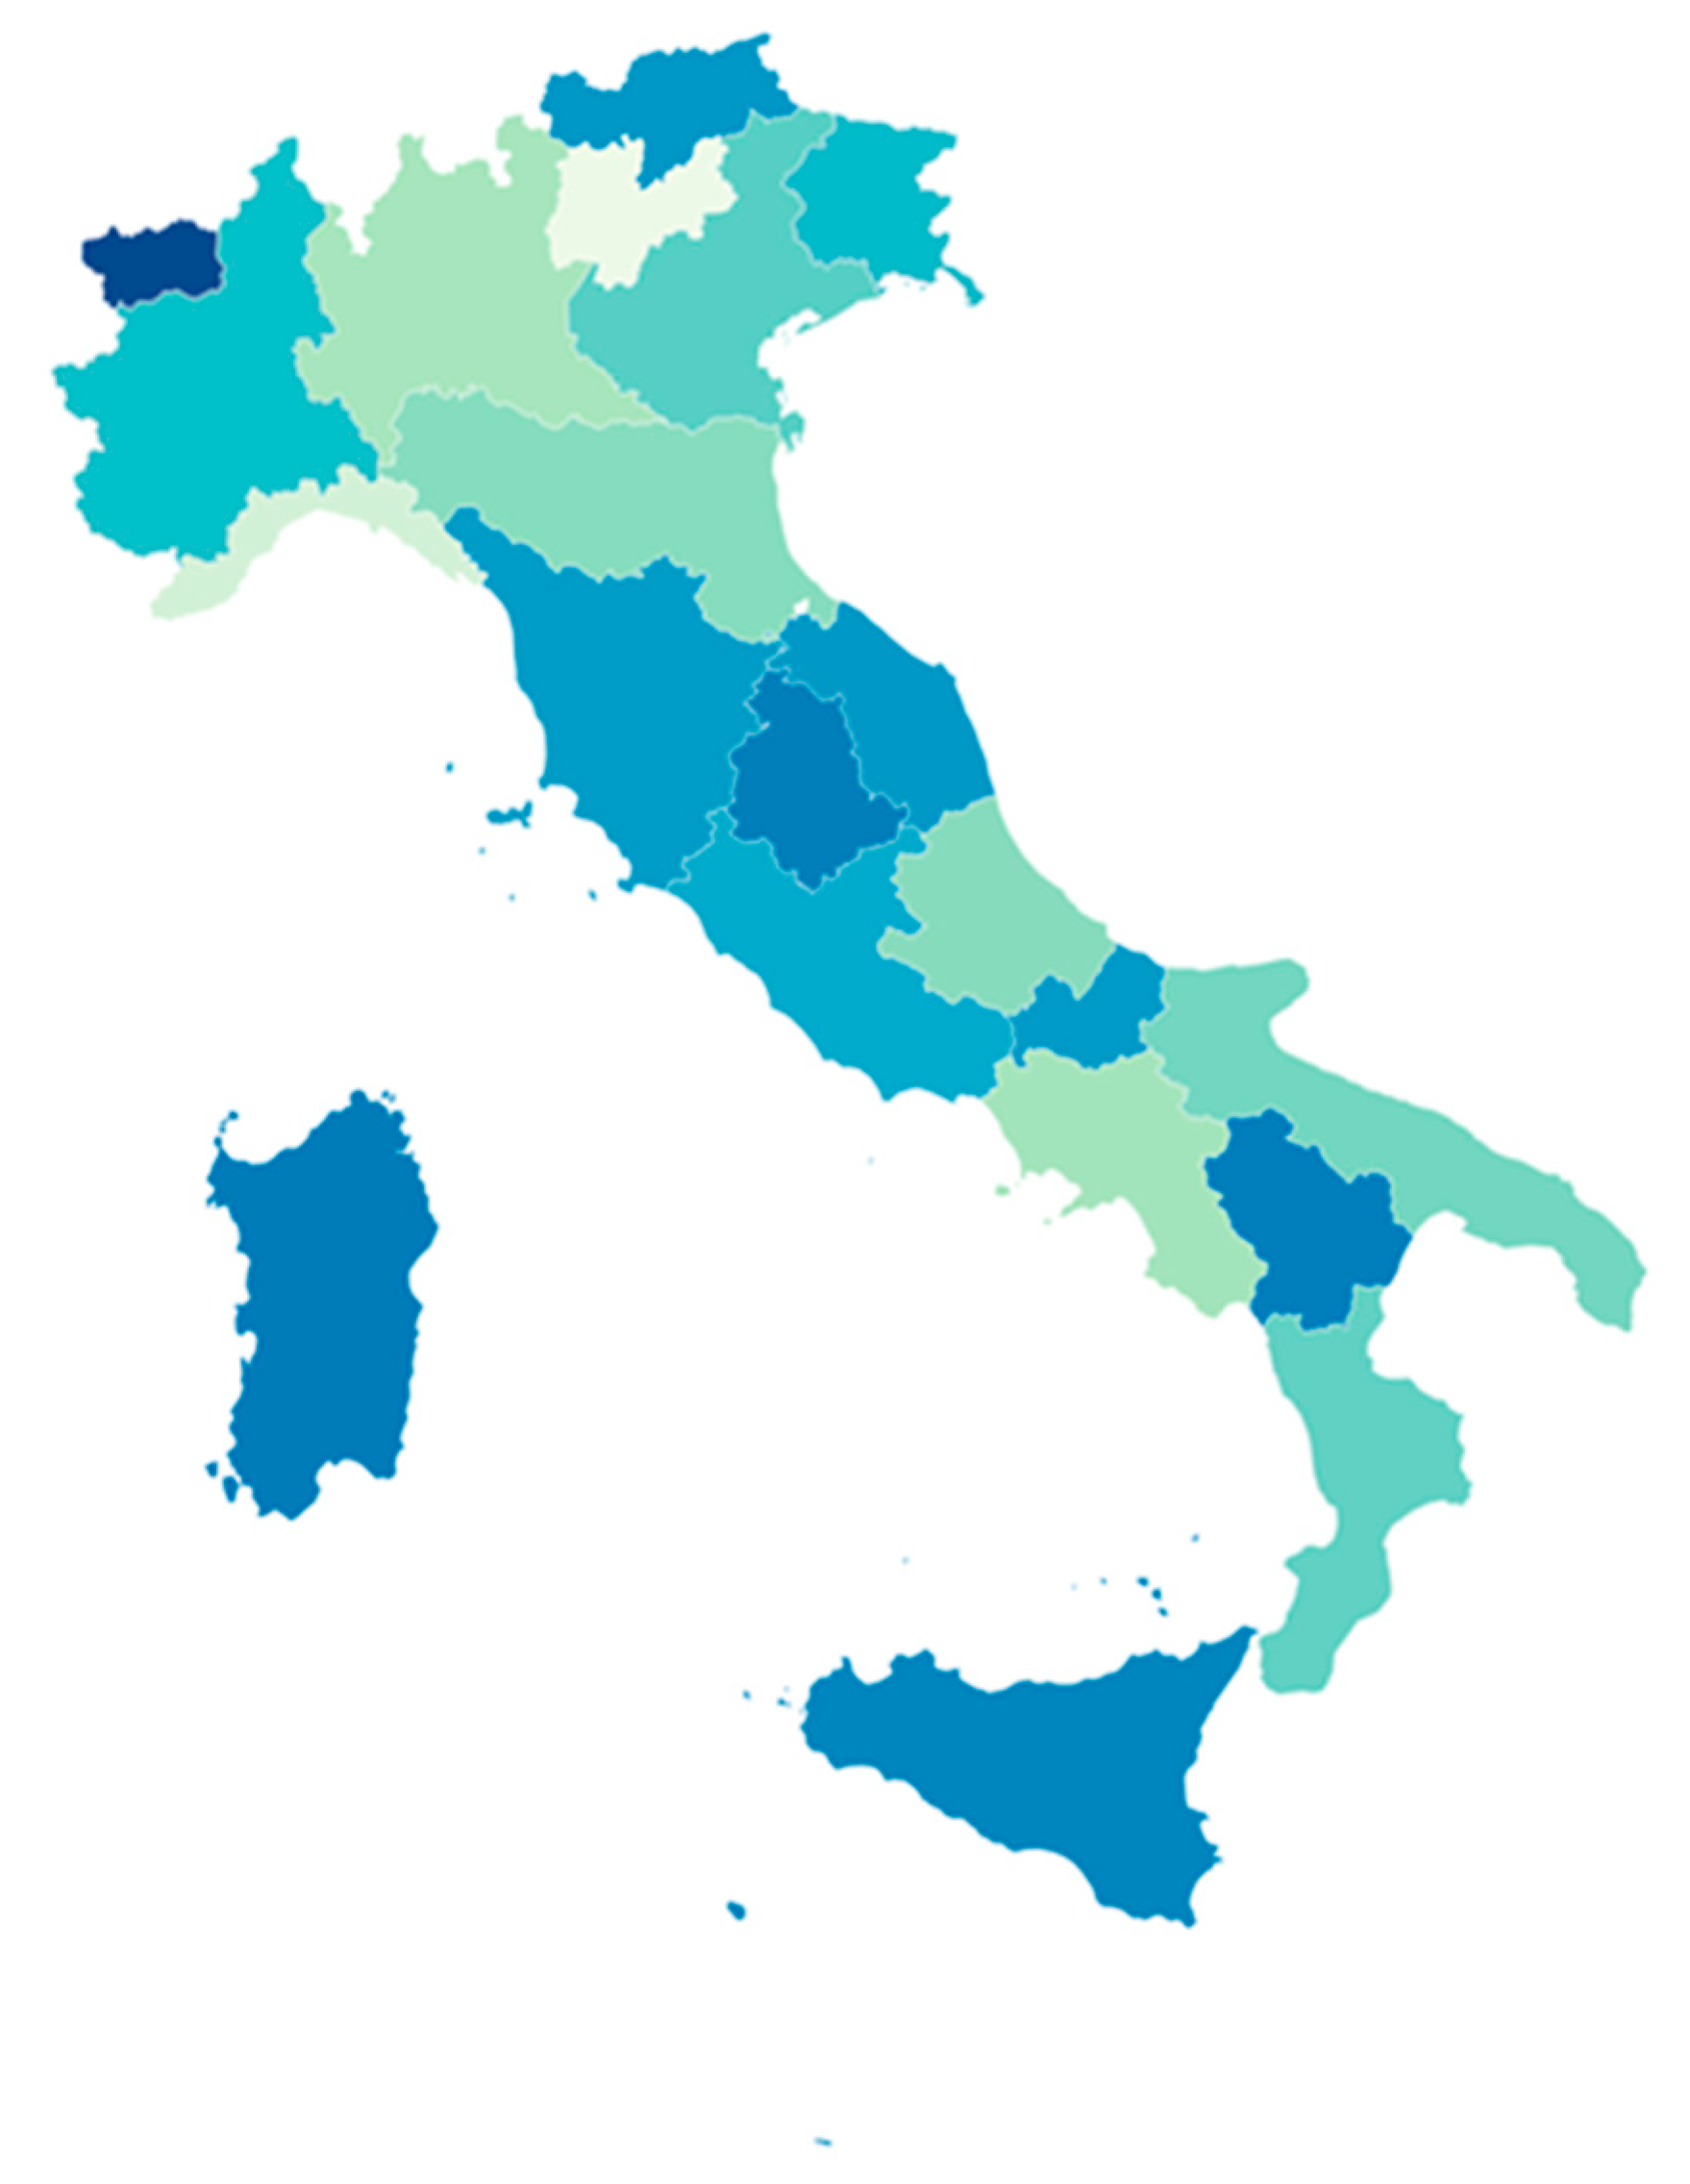
The geographical distribution of the territorial identity index (Equation (6)) is depicted by Figure 17.
Turning to the specific value of T-LAB, results reported in Table 2 show that 11 regions are below the average national score. Valle d’Aosta leads the ranking, while the provinces of Trento (region Trentino Alto Adige8) and Liguria are positioned at the bottom. For Trento, such a position is totally different from the other province of Trentino Alto Adige (Bolzano) and is probably due to the high intensity and specialisation of production, while for Liguria the presence of many greenhouses affects the ranking. Interesting is the case of Sicilia, fifth in the ranking, probably due to the high number of organic farms in the region.
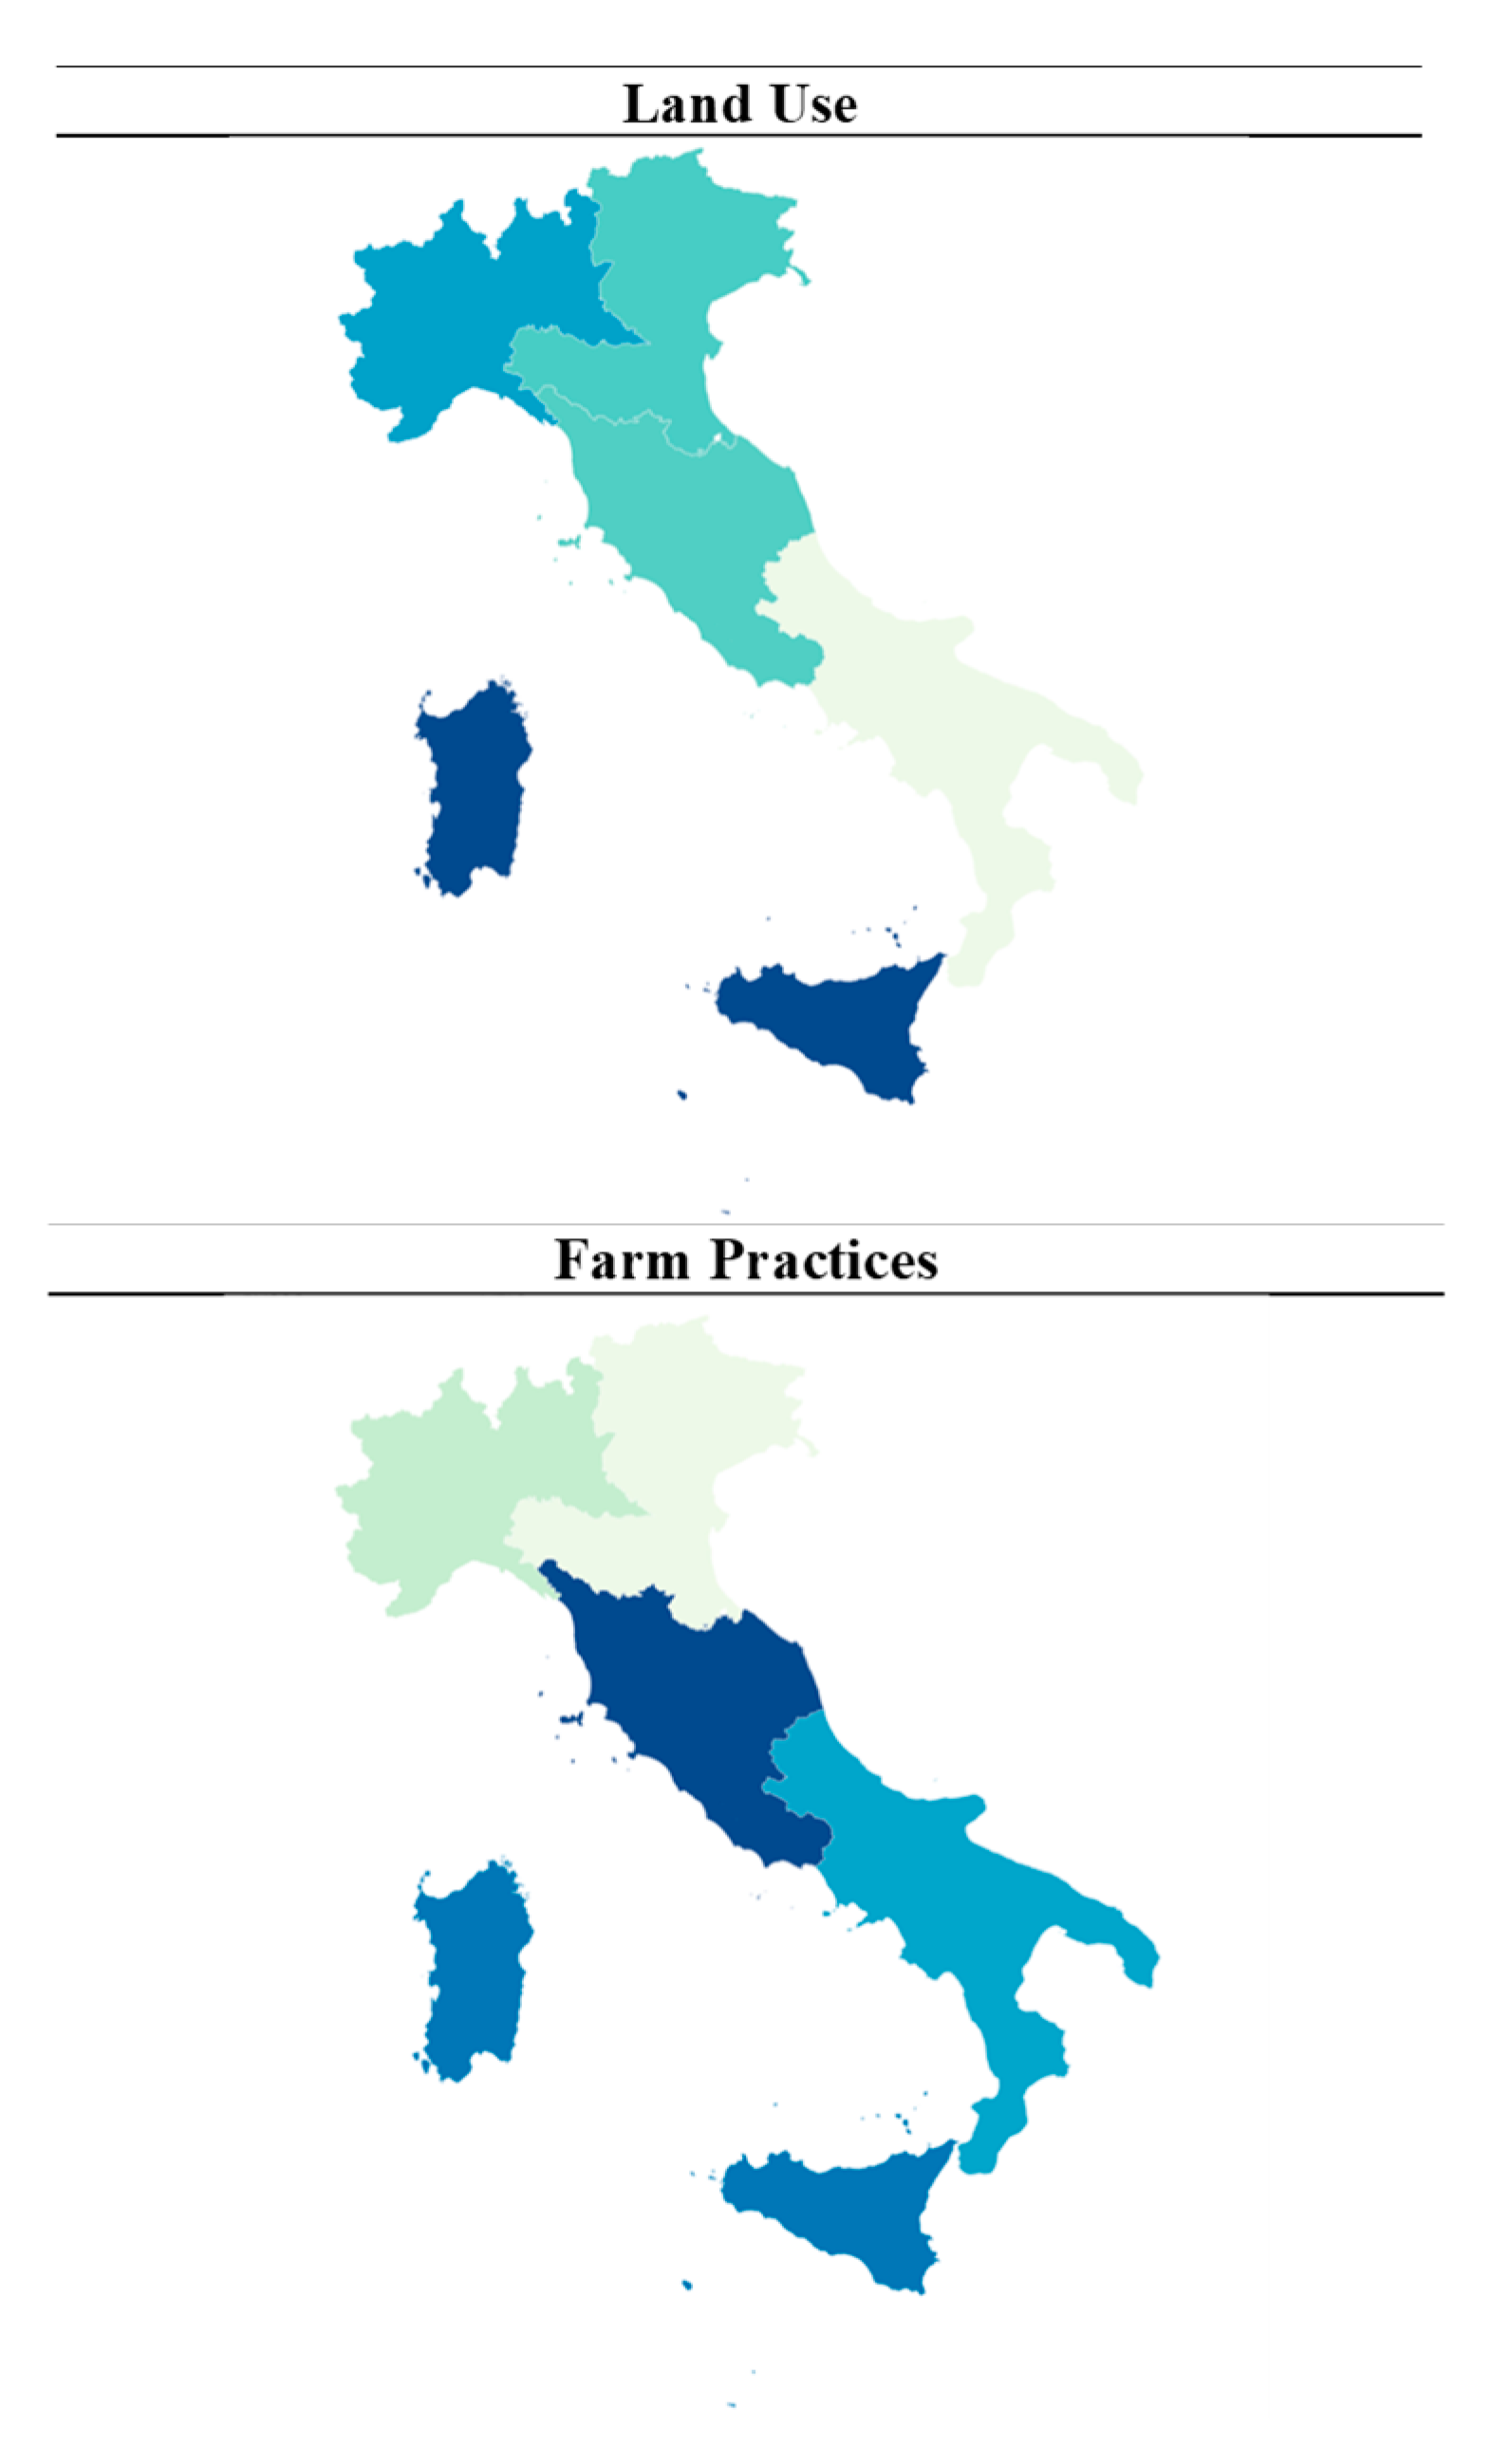
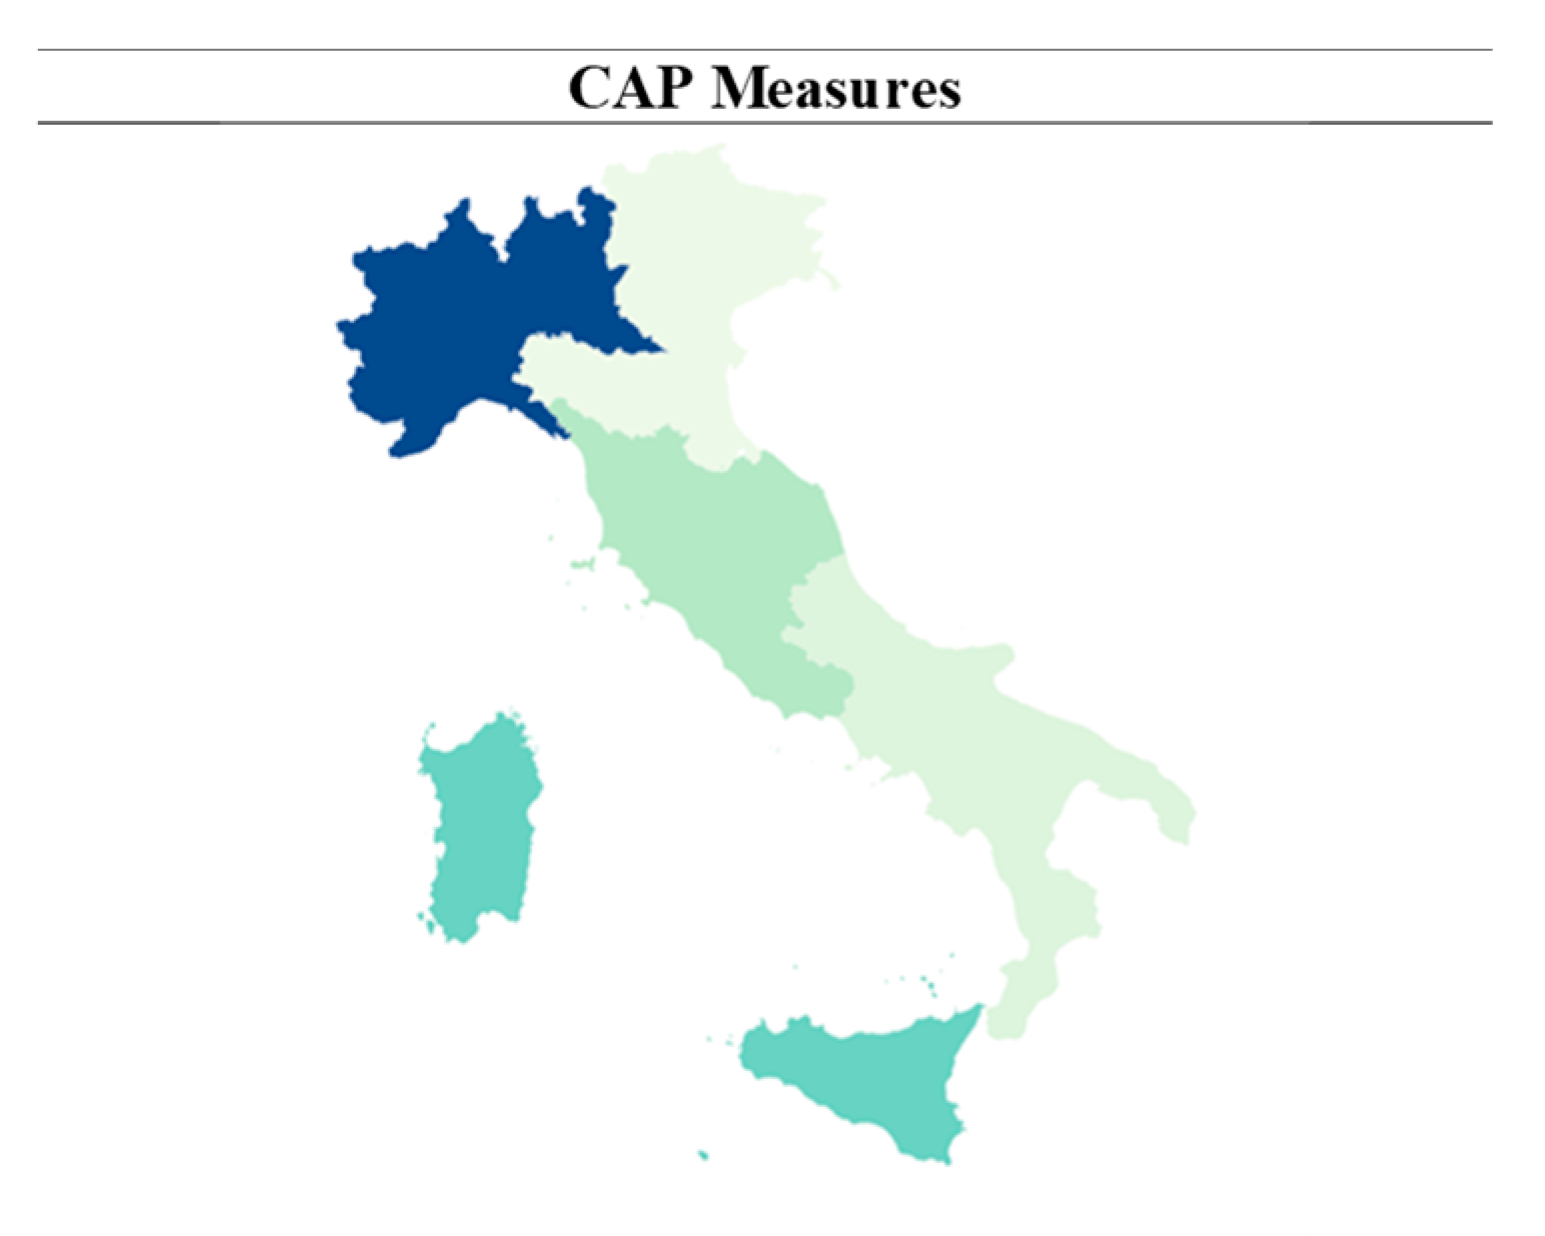
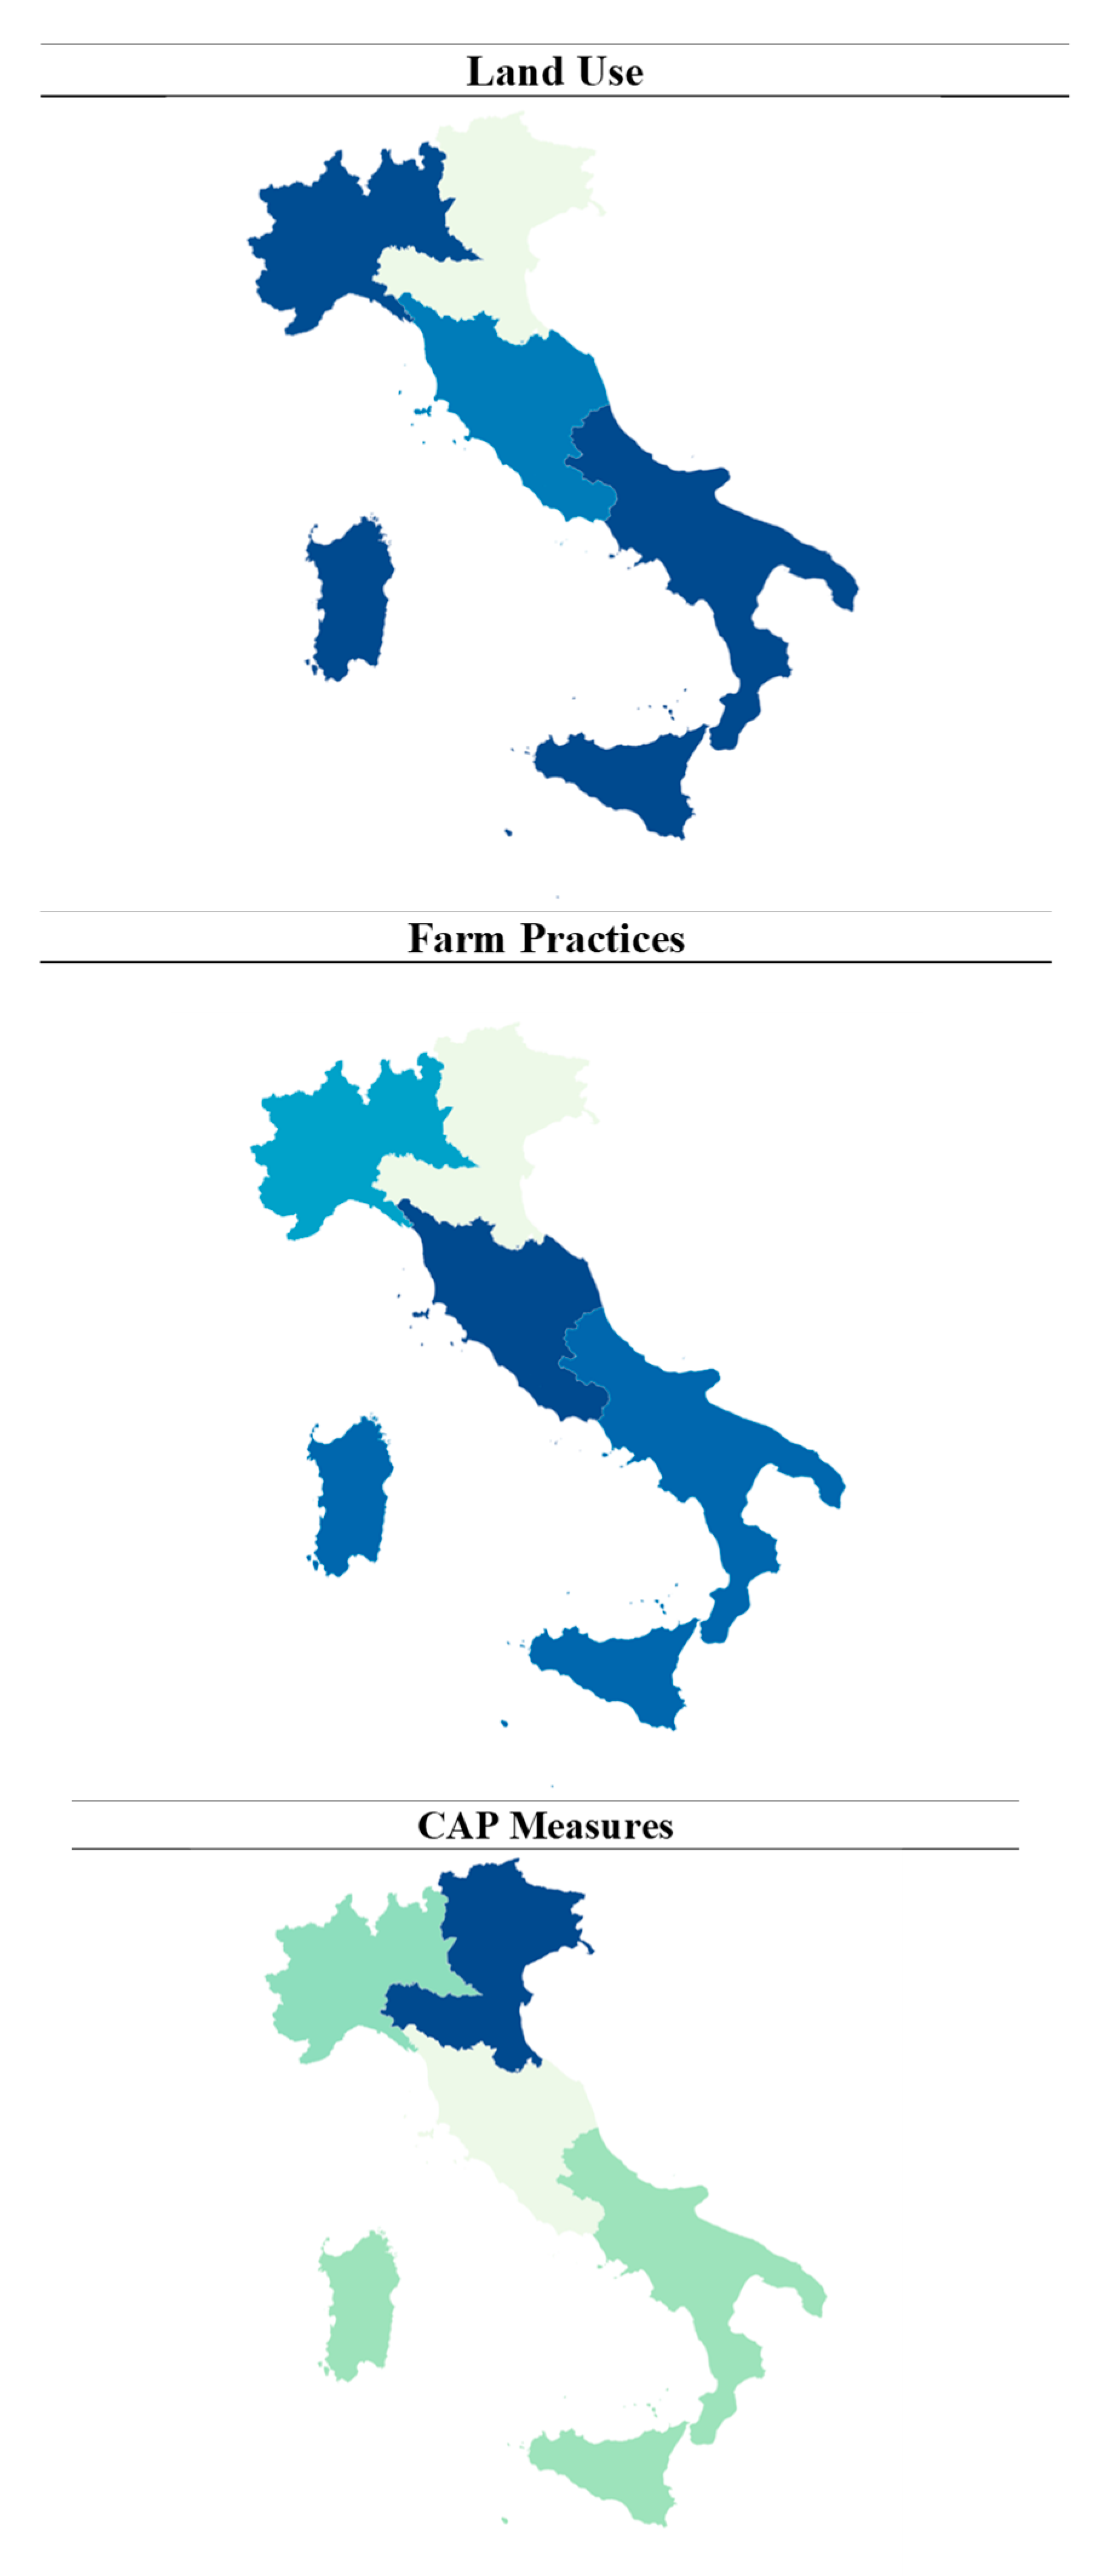
Small and medium farms are more biodiverse than large farms in the sample, and so are farms in mountainous areas, which is quite in line with expectations. Looking at the three components of the index (Figure 2), soil use is particularly relevant in the North-East and in the Islands, while agricultural practices seem to prevail in the Centre and in the South. Policies prevail in the North-West, while in the South they are much less relevant in the features of T-LAB, probably due to the higher expenditure capacity of the northern regions.
Heterogeneity: Natura2000 Sites
To confirm the validity of our empirical approach and the reliability of the index, we replicated the analysis by considering only farms located within Natura2000 site areas. Natura2000 is a network of core breeding and resting sites for rare and threatened species, and some rare natural habitat types which are protected [36]. It stretches across all 27 EU countries, both on land and at sea, with the aim of ensuring the long-term survival of Europe’s most valuable and threatened species and habitats, listed under both the Birds Directive and the Habitats Directive. In Italy, there are 21,720 km2 of Natura2000 marine area and 57,363 km2 of Natura2000 land area, covering around 19% of the total national land area9. The Natura2000 network is a core element of EU biodiversity and ABD conservation policy. In these protected areas, protection status must be maintained at least at current levels, while farming activity can, under certain conditions, still be pursued. To compensate the farmers for additional costs and income reductions, however, EU countries utilise specific measures of rural development programmes dedicated to Natura2000 payments. Being a farmer located within a Natura2000 site can therefore influence the ABD performance and the channels through which it is supported. In this section, we focus on the conditional role played by the Natura2000 strategy by computing the regional T-LAB indicator considering only those farms located in Natura2000 sites. The hypothesis is, in fact, that farms located within Natura2000 sites are more BD-oriented than other farms.
In Italian FADN, farms in Natura2000 sites number only 230 across 17 regions, which is a limit for the representativity of this analysis10. However, the comparison with the whole representative sample shows that the Natura2000 sample is quite consistent. Of the 230 total farms, 114 are in the mountains and 16 in flat plains; 51% are specialised in herbivores; only 4% can be considered “large” in economic dimensions, while in physical terms farms in Natura2000 sites are larger than the rest of the sample. In the full sample, large farms in economic terms are less biodiverse than small farms, contrary to what is featured in the Natura2000 sites. This is probably due to the different behaviour of the large farms in Natura2000 sites where the applied constraints modify the attitude of producers. This difference does not seem to apply to small farms. For the same reasons, on flat plains there is a lower concentration of biodiverse farms than in mountains and hills.
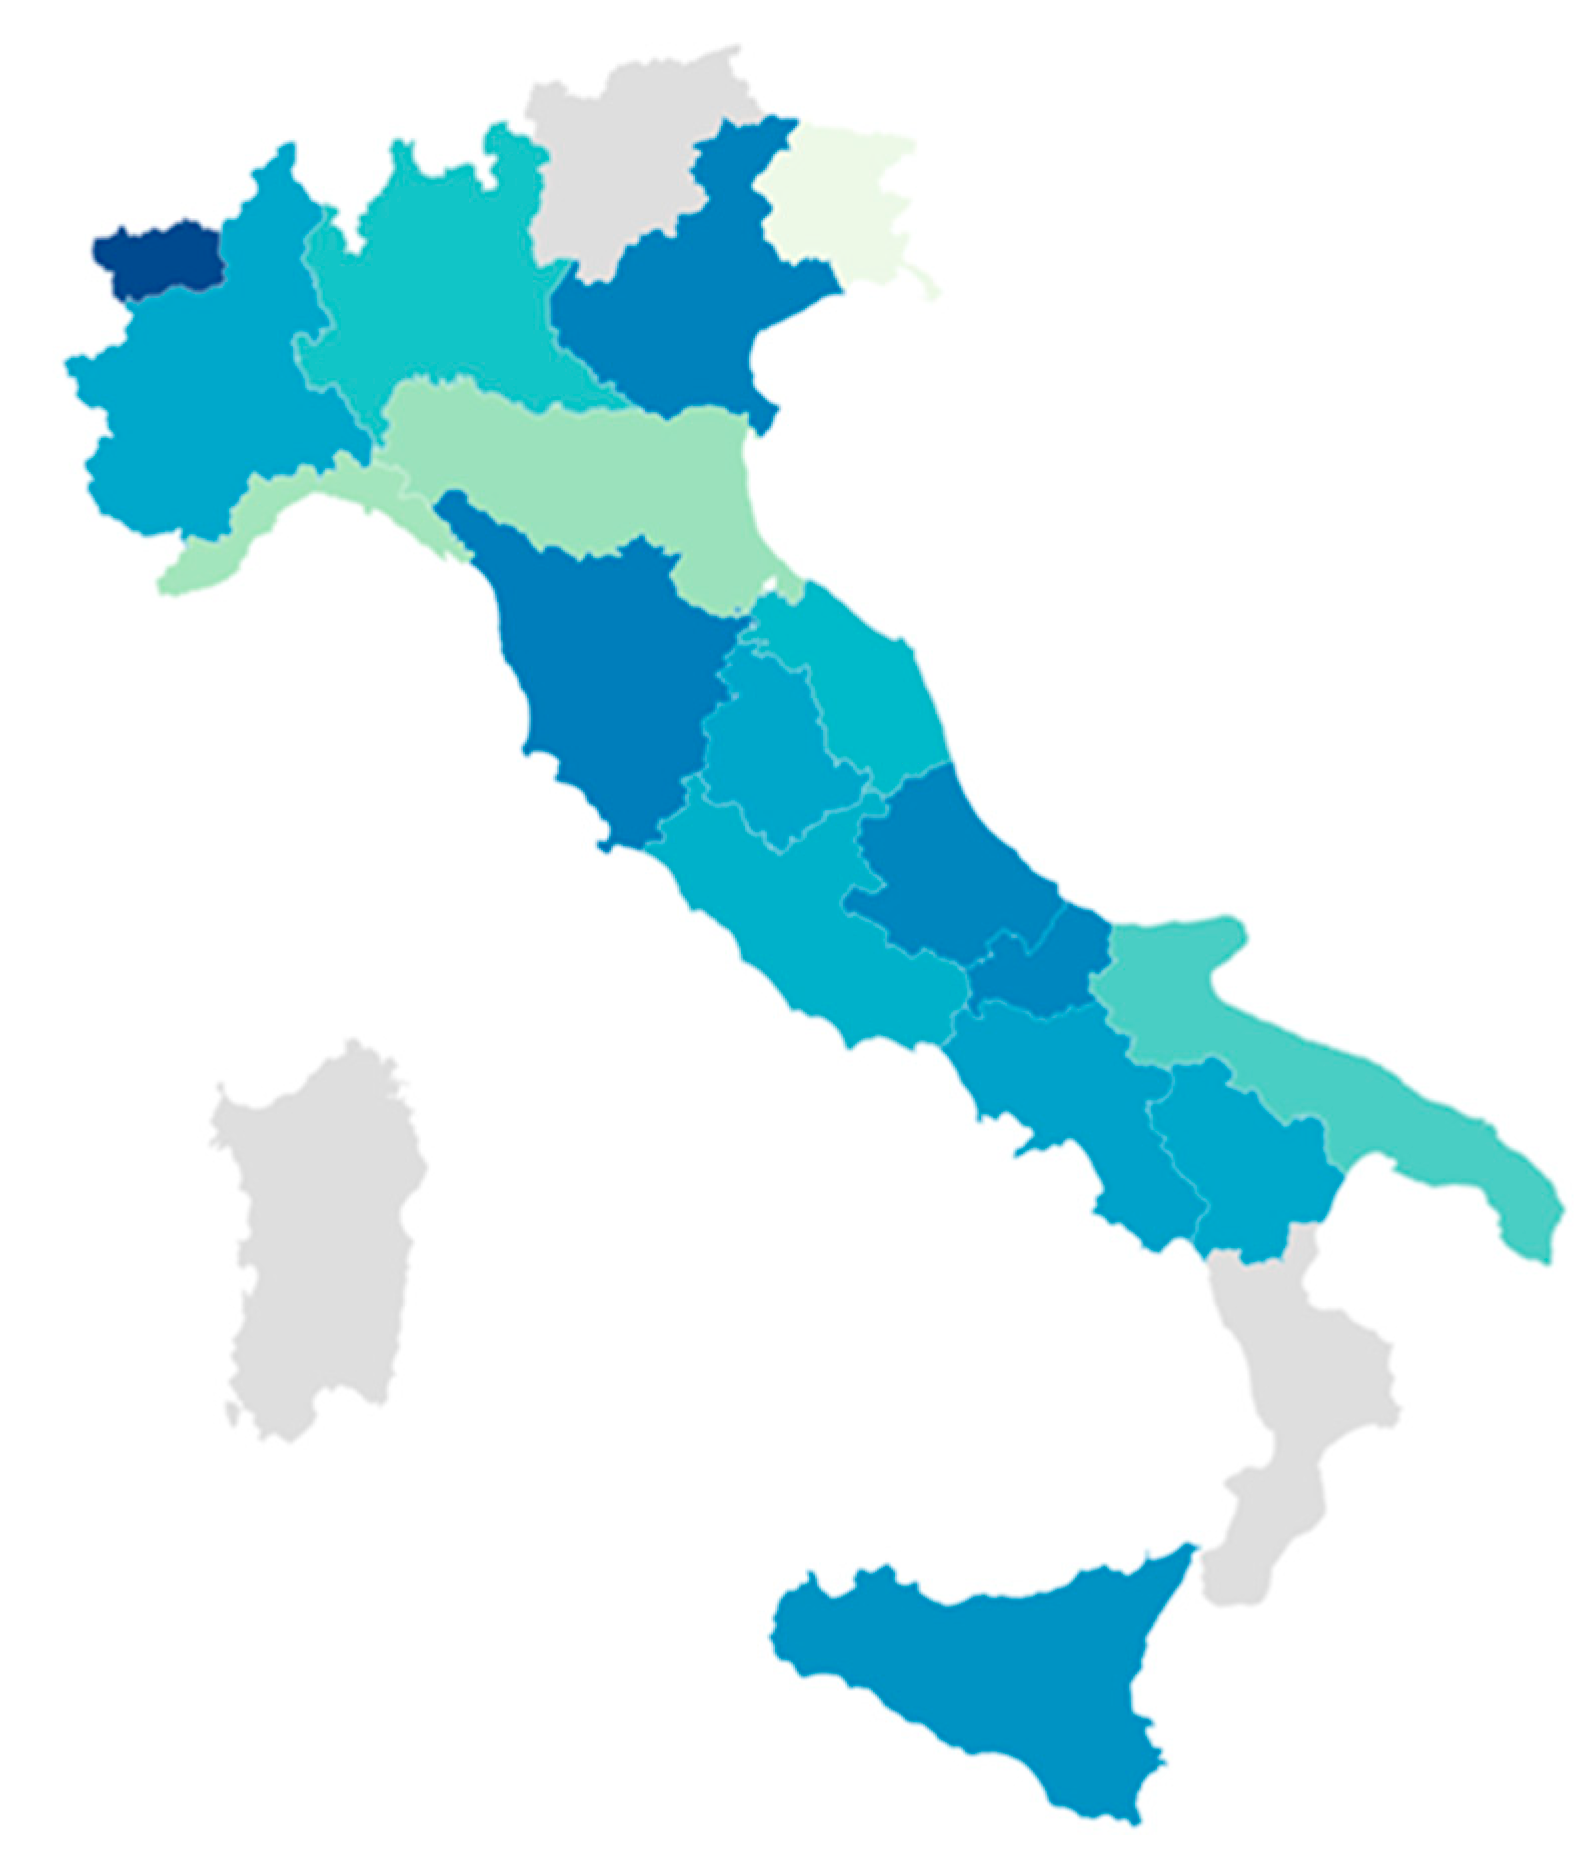
Results are presented in Figure 3 and Table 3. The highest score of the index is, even in this case, recorded by Valle d’Aosta (Table 3). Toscana ranks second, while Veneto is in third position. Despite its agriculture which is quite intensive and specialized, also for a high presence of arable crops, Veneto has a relatively large number of Natura2000 sites, so that many farms follow sustainable practices. Seven regions are below the national average, and Friuli Venezia Giulia is positioned at the bottom of the ranking, probably given that FADN farms in Natura2000 sites are highly intensive and specialised vine farms.
Interesting information is provided when considering separately the three factors of T-LAB (Figure 4). South Italy is more biodiverse than the rest of the country for factor 1 (land use), thanks to a general larger crop diversification. Looking at factor 2, it is again the South that is more biodiverse, especially thanks to the large presence of organic farms and a generally lower production intensity. Finally, about factor 3, the North prevails, as shown by the general index.
4. Discussion
The main objective of this work was to assess to what extent farmers are involved into ABD-friendly activities and are supported by ABD-related policies at the territorial level. Using a new multi-dimensional index that accounts also for socio-economic factors and applying it to the Italian FADN farms, we investigated this issue trying to investigate the role of the three main levers supporting ABD: soil use, farm practices and policies.
The majority of the indices proposed by the literature so far were, in fact, mainly technical and agronomic-oriented, leaving policy makers and practitioners without clear evidence of the role played by actors’ strategies and CAP policy support. The issue of building multidimensional and synthetic indicators represents a challenge for researchers who face economic, social, and environmental problems linked to sustainable development and policies requiring a multidisciplinary approach.
Our results show that the scores of the indicators differ across regions, with most of them under the national score. The best-performing region is Valle d’Aosta, whereas Trento and Liguria perform less well. The effect of land strategies is more evident in the case of the North-East regions and the Islands (Sicilia and Sardegna), while the choice of specific agricultural practices has the most relevant effect on ABD in the Centre and in the South. The role of CAP funds prevails in the North-West, where regional administrations are more efficient in planning and spending the EU resources.
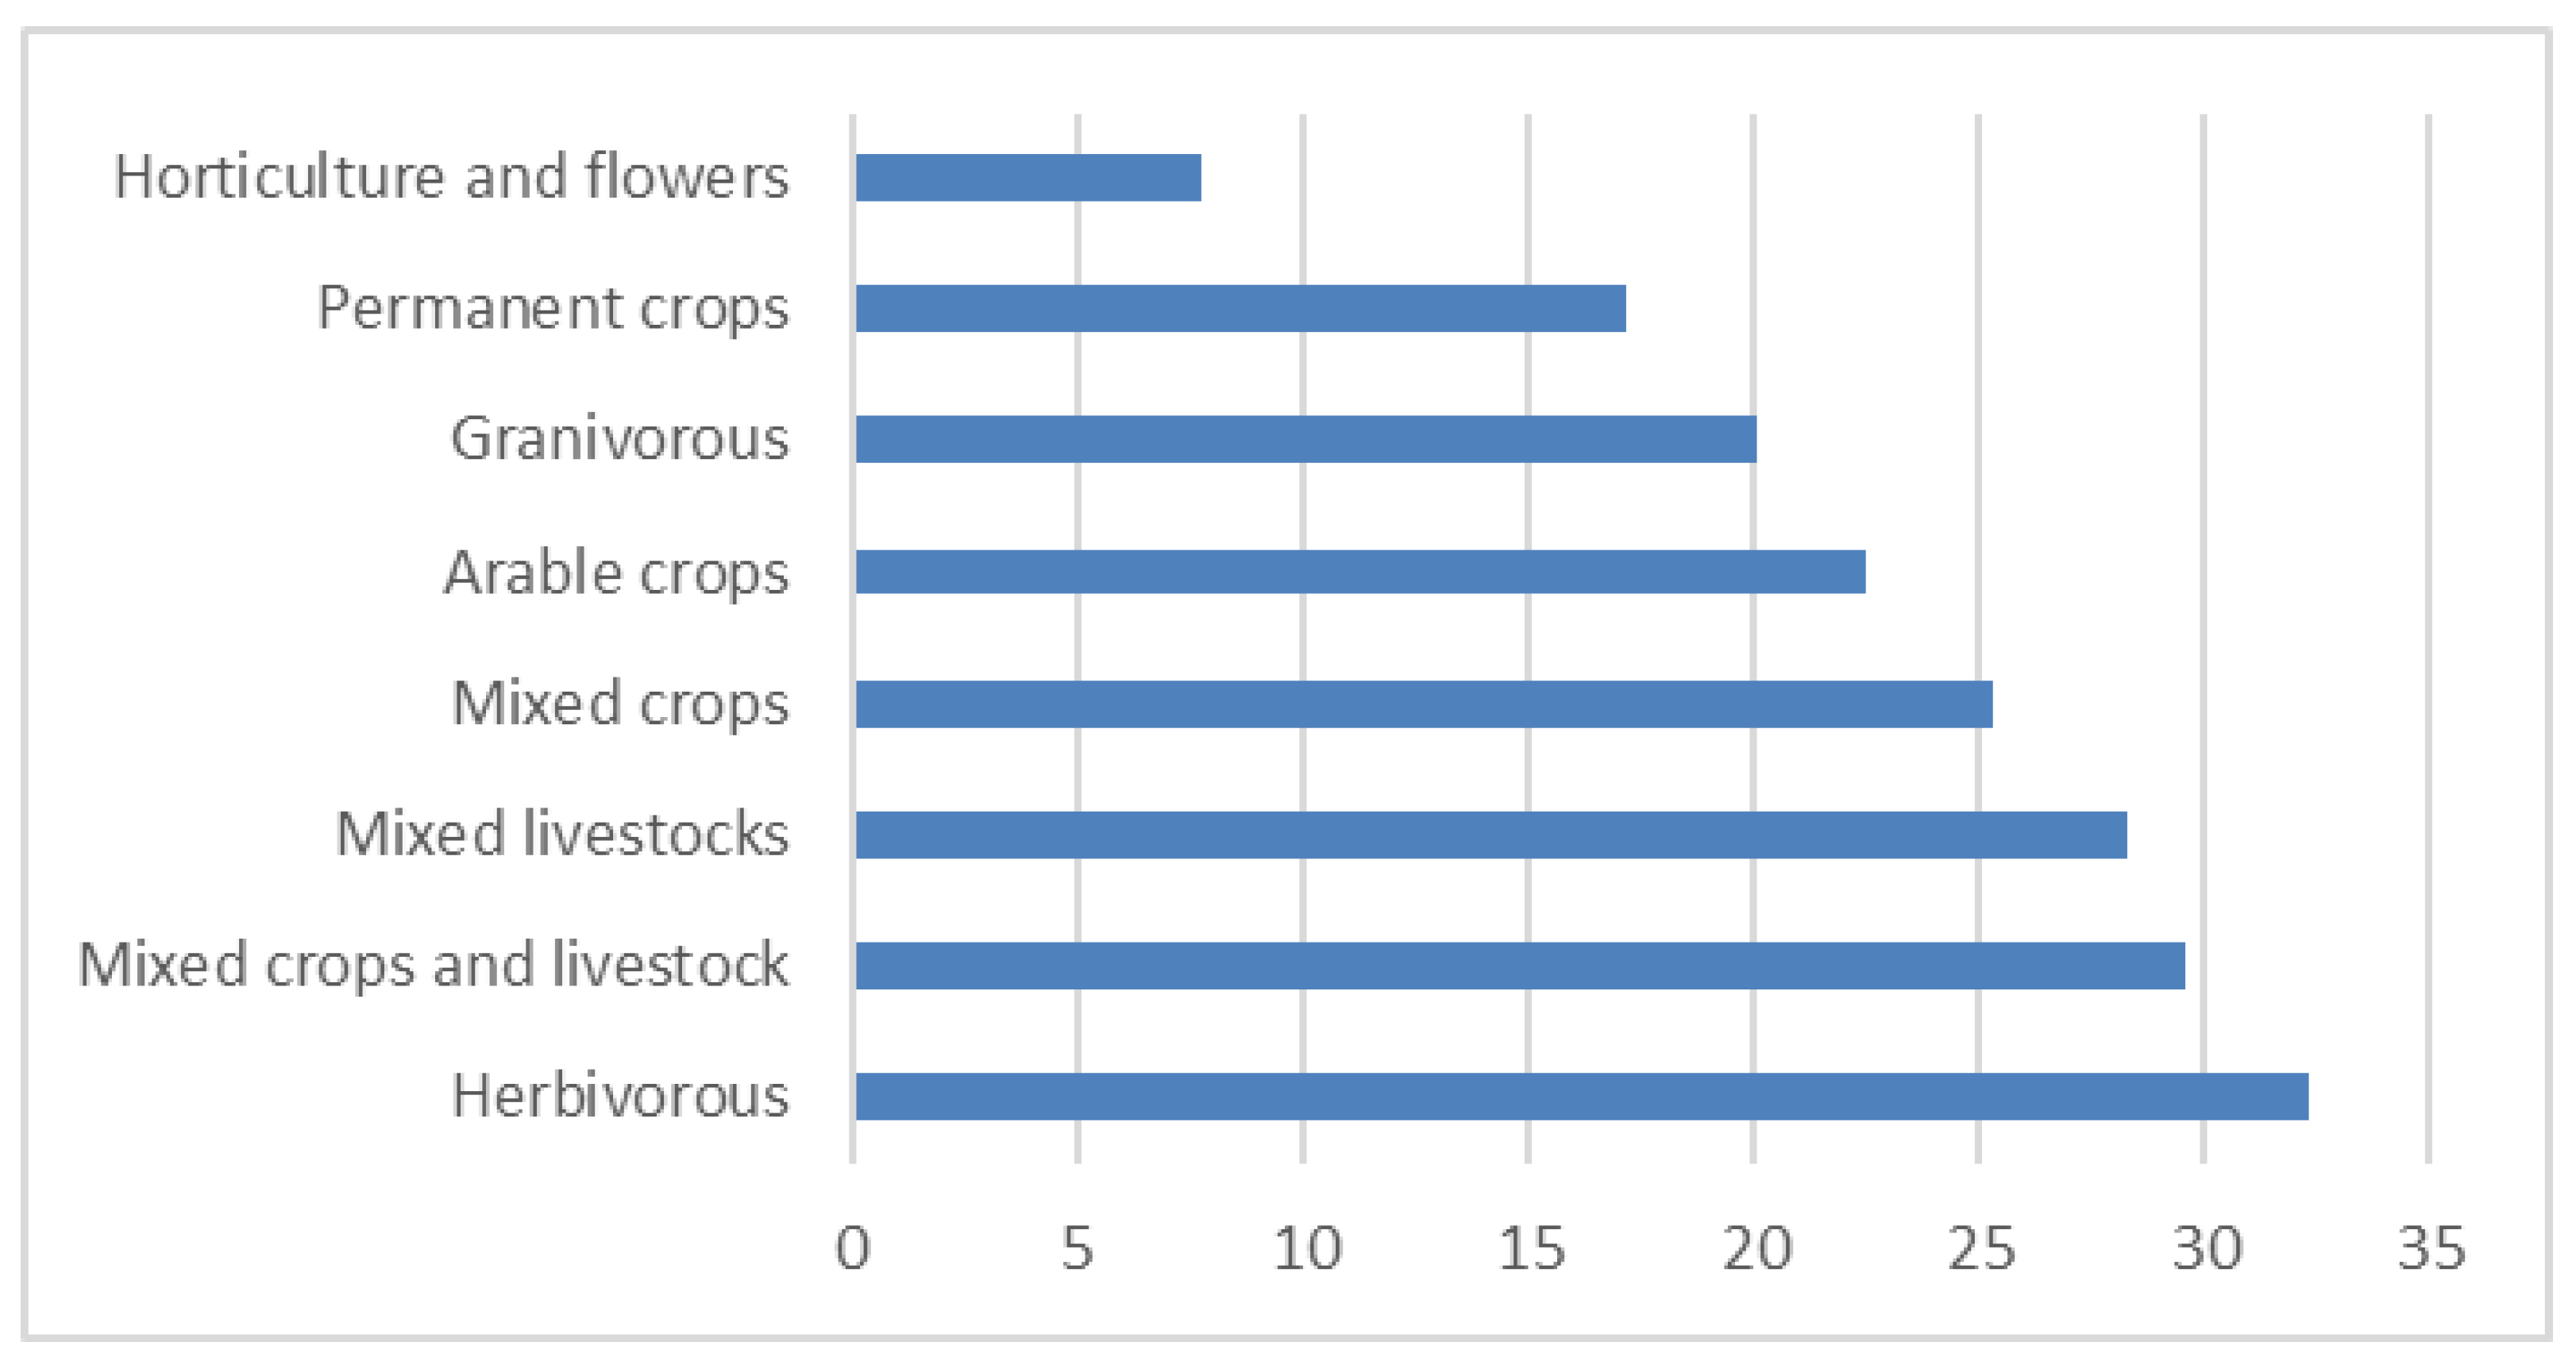
The result of the index is clearly a combination of the three levers we considered as most relevant, and it is also influenced by the main farm types in the FADN sample, which in turn affect the three levers here considered. In Figure 5, we reported the value of T-LAB by farm type: it ranks from 32.4 for herbivorous to only 7.7 for horticulture and flowers, mostly grown in greenhouses. Livestock, and especially bovines and sheep and goats, are often associated in Italy with pasture and meadows, and they also receive special attentions from farmers in terms of practices, as well as dedicated policies for the reduction of intensity and the development of more sustainable ways of breeding.
Looking at Natura2000 areas, findings show that South Italy is more biodiverse than the rest of the country thanks to land use strategies as well as to farmer practices. Conversely, the role of CAP support is more relevant for the northern regions.
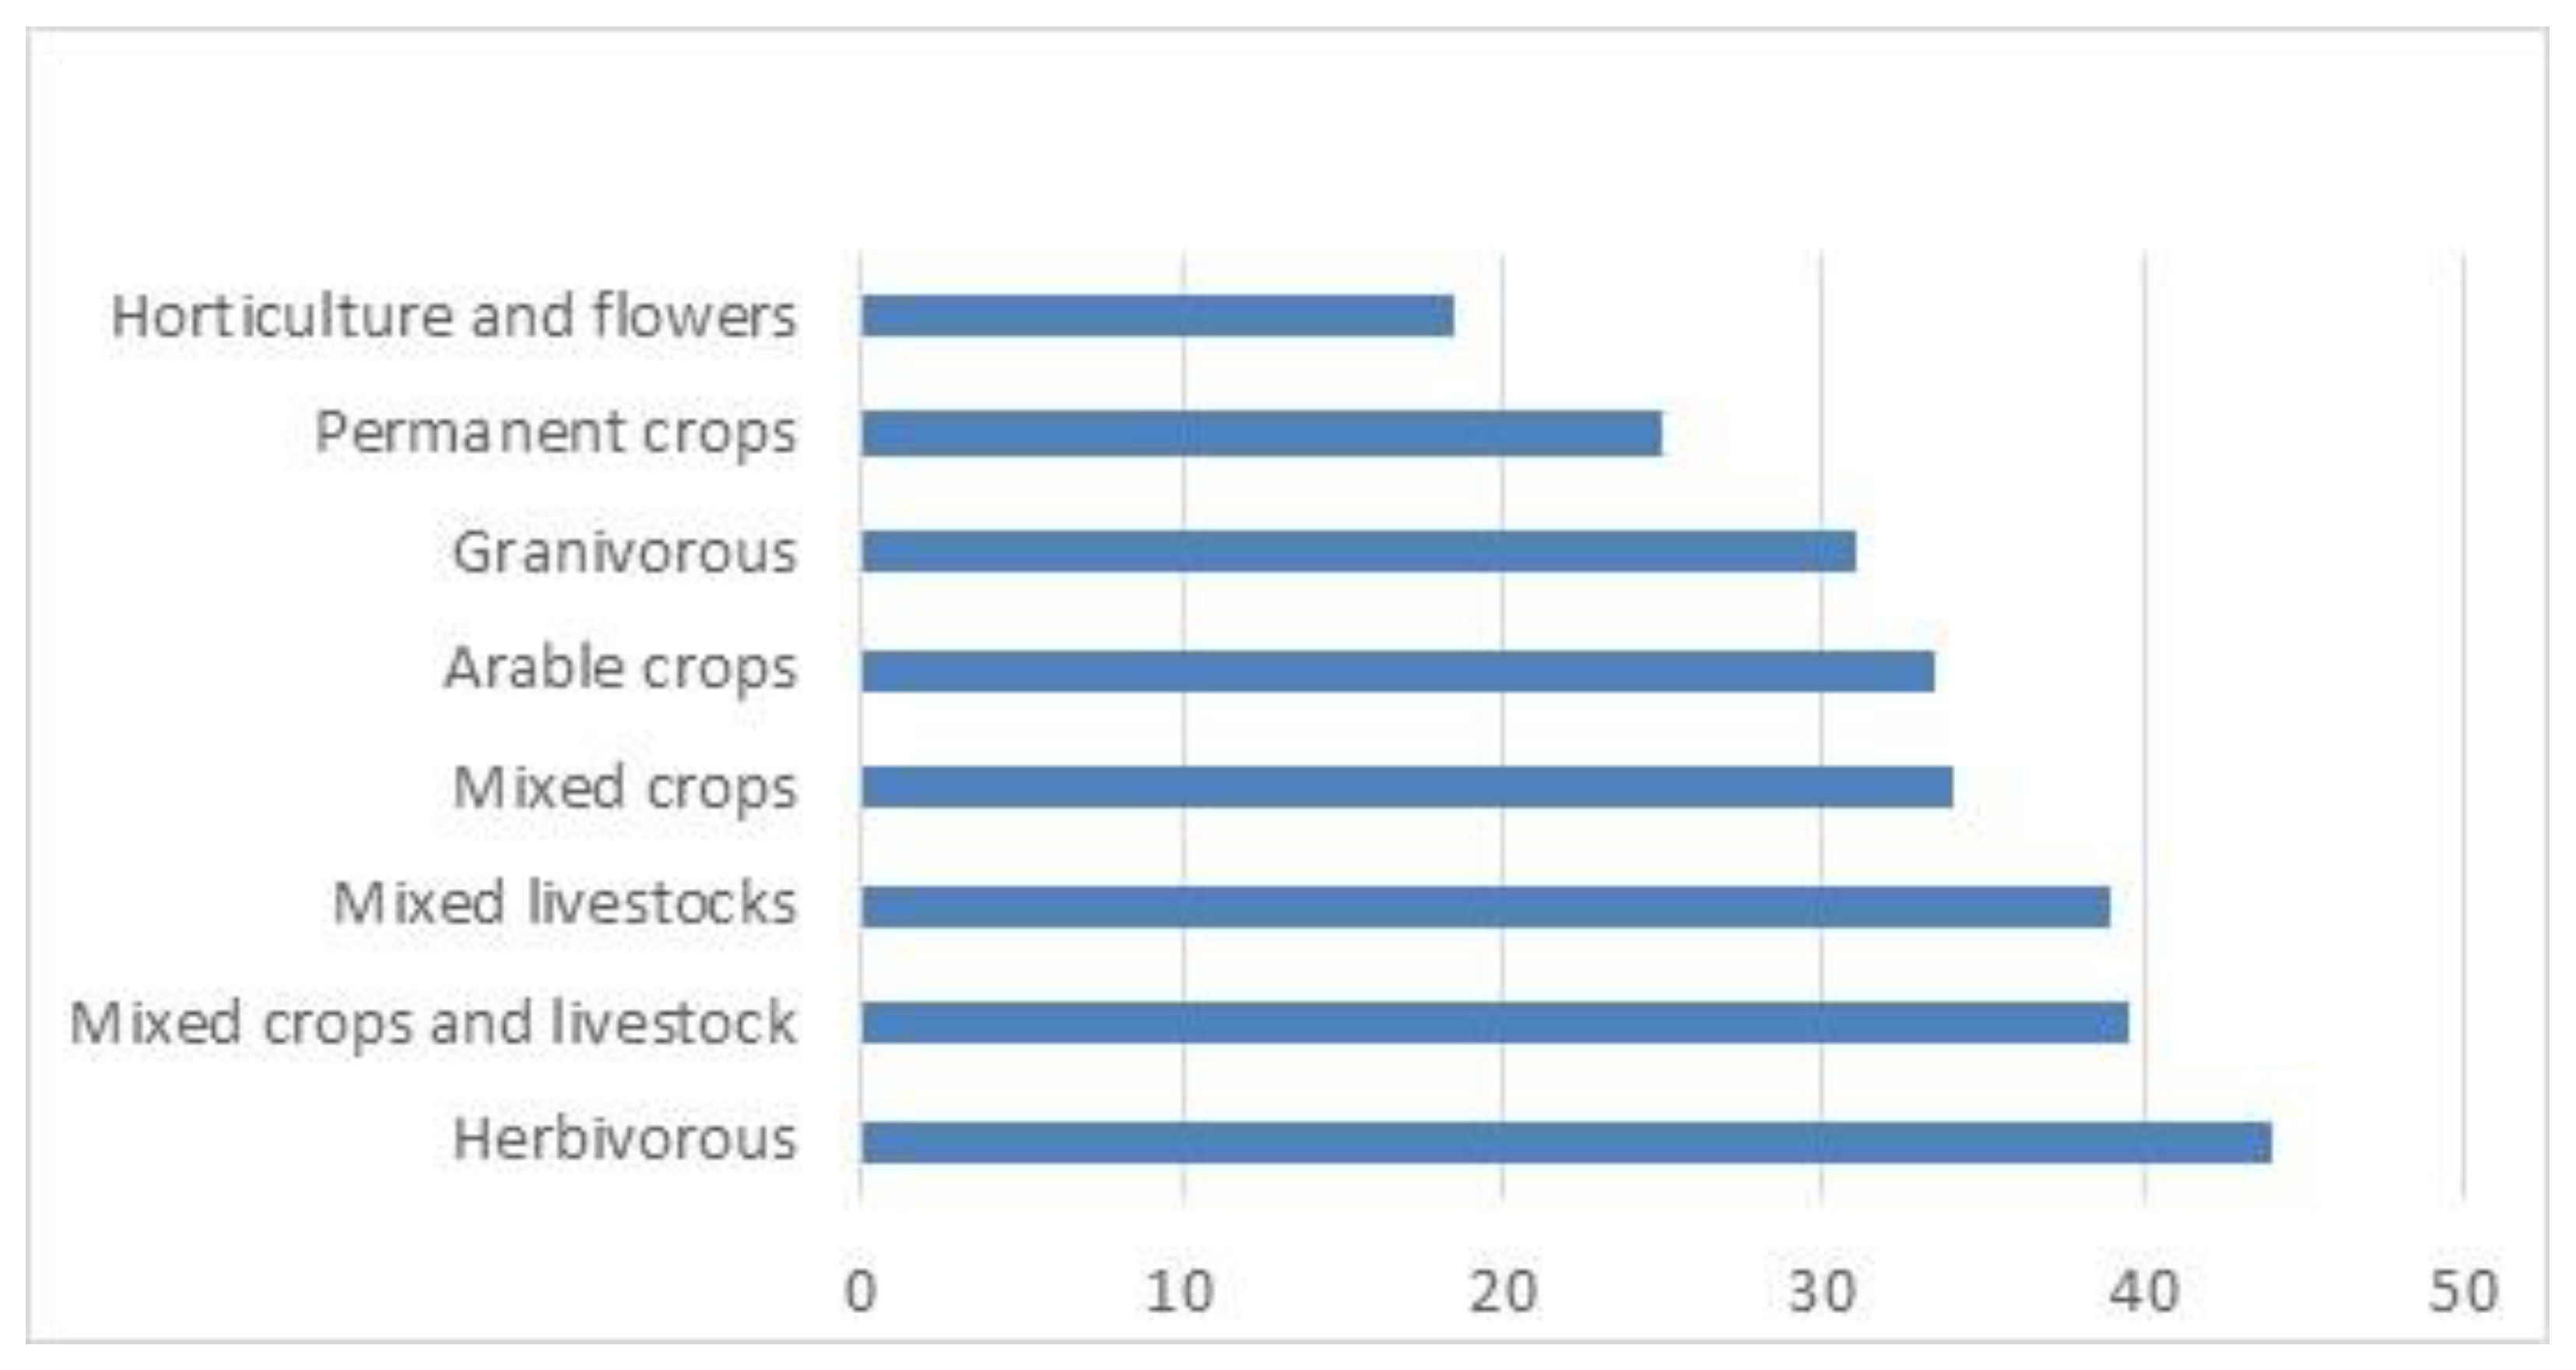
In Figure 6, we reported the value of the index by farm type in the Nature2000 FADN sample. It is worth noting that the rank of the value of the index is exactly the same, comparing Natura2000 and the whole sample of FADN farms, but the intensity of the value changes, showing how in Natura2000 areas generally more attention is paid to ABD.
The paper contributes to the discussion about which should be a good strategy to account for the different factors affecting the ABD performance at the sub-national level. It is, in fact, widely recognised by the recent literature that an analysis of the drivers of ABD cannot be led at a very aggregated level such as the national level, given that is it highly influenced by territorial variables and other tools such as policies that work at the regional and even local levels [37,38,39] (Buckland et al., 2012; Biasi et al., 2015; Simoncini, 2015). On the other hand, to our knowledge, a multidimensional complex index of ABD at the regional level has never been proposed.
5. Concluding Remarks
We identified and measured the most relevant levers affecting contextually and at the same level ABD, so to have as a result a synthetic multidimensional indicator of ABD. T-LAB includes three key aspects to measure BD and its impact on agriculture activities and economy: soil use, agricultural practices, and financial resources supplied by the CAP. These elements are key in enhancing sustainable practices in favour of BD. BD is a public good associated with agricultural activities and can contribute not only to environmental aspects of sustainability but also to economic and social ones. T-LAB highlights differences in agricultural systems and soil use connected to sustainable on-farm practices and access to the financial resources of the CAP. We considered the three levers as acting simultaneously and with the same intensity on ABD, and this can be a limit of this work that might need to be investigated more in detail and with a higher articulation at the territorial level.
The innovative contribution of this paper was to study the socio-economic channels through which farmers mainly shape ABD by applying a novel index (T-LAB) in one country (Italy) using regions (NUTS2) as units of observations and distinguishing between conventional and protected geographical areas (Natura2000).
In terms of policy recommendations, this index can be used to compare different areas and different specialisations in order to better calibrate policy instruments at the proper territorial scale. This can be particularly relevant since the EU policy is facing a new season of better targeting, more highly selective and more effective policies, especially when the long-term target at stake is sustainability and the production of eco-systemic services [40,41]. A higher level of BD is one of the main goals of the EU Green Deal and the agricultural sector is definitely called for a higher commitment both in terms of conservation and socio-economic sustainability of BD. Farms within Natura2000 sites show a higher level of ABD in each Italian region, which confirms the importance of preserving specific constraints in production practices in those areas and, at the same time, of promoting sustainable behaviours through public policies. This is crucial for large farms in plain areas, where decades of implementation of a productivity model of development have pushed in favour of intensive agricultural systems that reduce biodiversity. However, the still limited diffusion of Natura2000 sites and the scarce coverage of proper statistics of these areas are serious constraints to an effective analysis of the effects of Natura2000 in enhancing BD and to a proper evaluation of policies in favour of EU special and high-value natural sites [42,43]. The switch to a sustainable multifunctional model of production is still slow, and for this reason policies are more and more relevant in supporting a post-productivity, innovative, diversified model based on the three pillars of sustainability.
Finally, our analysis based on the Italian FADN database shows the relevance of implementing a European harmonized database which includes different aspects of farm structures and performances, even if it was mainly designed for accounting reasons. However, two considerations arise from the exercise presented here. One is that the Italian FADN is particularly rich in the size of the sample (and it is fully representative of the universe, even at the regional level) and in the information collected (far beyond the EU requirements) [31]. This, of course, made the multidimensional analysis possible and particularly rich in results. However, if according to the EU “Farm to Fork”11 strategy the FADN must become the European Farm Sustainability data network (from FADN to FSDN), then further work is necessary to enrich the database with proper information about land use, sustainable practices and policies and make that representative of the entire farm population, particularly so in the case of areas with specific environmental concerns. Verifying the linkage explored by this study in other European countries, and with the new FSDN data, will be important as a sensitive analysis to generalize policy reflections. This task remains in our future research agenda.
Author Contributions
Conceptualization, R.H. and C.V.-P.; methodology, R.H.; software: C.V.-P.; validation, R.H. and C.V.-P.; formal analysis, C.V.-P.; investigation, R.H. and C.V.-P., resources, R.H. and C.V.-P.; data curation, C.V.-P.; writing—original draft preparation, R.H. and C.V.-P.; writing—review and editing, R.H.; visualization, C.V.-P.; supervision, R.H. All authors have read and agreed to the published version of the manuscript.
Funding
This research has in part received funding from PON “Ricerca e Innovazione 2014–2020—Azione IV.6. Contratti di ricerca su tematiche Green”, D.M. 1062/2021, Ministero dell’Università e della Ricerca.
Data Availability Statement
All data are available upon request.
Conflicts of Interest
The authors declare no conflict of interest.
Appendix A. List and Map of ITALY-NUTS Level2 According to EUROSTAT Classification
| Code | Nuts1 | Nuts2 |
|---|---|---|
| ITC1 | North West | Piemonte |
| ITC2 | North West | Valle d’Aosta |
| ITC3 | North West | Liguria |
| ITC4 | North West | Lombardia |
| ITH1 | North East | Alto Adige |
| ITH2 | North East | Trentino |
| ITH3 | North East | Veneto |
| ITH4 | North East | Friuli-Venezia Giulia |
| ITH5 | North East | Emila Romagna |
| ITI1 | Centre | Toscana |
| ITI2 | Centre | Umbria |
| ITI3 | Centre | Marche |
| ITI4 | Centre | Lazio |
| ITF1 | South | Abruzzo |
| ITF2 | South | Molise |
| ITF3 | South | Campania |
| ITF4 | South | Puglia |
| ITF5 | South | Basilicata |
| ITF6 | South | Calabria |
| ITG1 | Islands | Sicilia |
| ITG2 | Islands | Sardegna |

| 1 | Convention on Biological Diversity, Article 2, 1992. Available at http://www.cbd.int/doc/legal/cbd-en.pdf (accessed on 12 May 2022). |
| 2 | Natura2000 is a network of core breeding and resting sites for rare and threatened species, and some rare natural habitat types which are protected. It stretches across all EU countries, both on land and at sea. The objective is to ensure the long-term survival of Europe’s most valuable and threatened species and habitats, listed under both the Birds Directive (Dir. 2009/147/CE “Uccelli”) and the Habitats Directive (Dir. 92/43/CEE “Habitat”). |
| 3 | See https://solagro.com/index.php, accessed on 31 March 2020. |
| 4 | Regarding territorial disaggregation, FADN data lose representativeness at a territorial scale lower than the regional. The representativeness between matrix dimensions (in our case, region-year) is always guaranteed by the sample selection. Since 2010, the economic size has been measured in terms of standard output rather than in terms of the total standard gross margin of the holding. Holdings included in the sample account for a standard output higher than 8000 euros. |
| 5 | Italy is, in fact, mainly dominated by small-sized farms and aged farmers: 58.7% of holdings have less than five hectares and the average size (11 ha) is smaller than the EU-27 average (around 16 ha). Moreover, 57.6% of farmers are over 60 years of age. |
| 6 | More information is available at: http://ec.europa.eu/eurostat/statistics-explained/index.php/Agri-environmental_indicators, accessed on 1 June 2023. |
| 7 | For the identification of the Italian regions in this and the next maps, please see the map in the annex, where names and codes of regions (European Nuts 2) are reported. |
| 8 | Trento and Bolzano being the two Autonomous Provinces of the region of Trentino Alto Adige, which plan their own Rural Development plans and other regional policies. |
| 9 | The overview of the Natura2000 network of sites covered by EU Birds and Habitats Directives is provided by the Natura2000 barometer, which is available at: https://www.eea.europa.eu/data-and-maps/dashboards/natura-2000-barometer, accessed on 1 June 2023. |
| 10 | Despite the limited number, they still provide very useful information, especially for adopting evaluation procedures to evaluate the effectiveness of specialisation, practices and policies supporting ABD. |
| 11 | https://food.ec.europa.eu/horizontal-topics/farm-fork-strategy_en, accessed on 31 March 2023. |
References
- Wilson, E.O. Biodiversity; National Academy Press: Washington, DC, USA, 1998. [Google Scholar]
- United Nations. Convention on Biological Diversity; United Nations: Rio de Janeiro, Brasil; New York, NY, USA, 1992. [Google Scholar]
- European Commission. EU biodiversity Strategy for 2030. In Bringing Nature Back into Our Lives; European Commission: Brussels, Belgium, 2020. [Google Scholar]
- Thrupp, L.A. Linking Biodiversity and Agriculture: Challenges and Opportunities for Sustainable Food Security; World Resource Institute: Washington, DC, USA, 1997. [Google Scholar]
- Jackson, L.E.; Pulleman, M.M.; Brussaard, L.; Bawa, K.S.; Brown, G.G.; Cardoso, I.M.; de Ruiter, P.C.; García-Barrios, L.; Hollander, A.D.; Lavelle, P.; et al. Social-ecological and regional adaptation of agrobiodiversity management across a global set of research regions. Glob. Environ. Chang. 2012, 22, 623–639. [Google Scholar] [CrossRef]
- Duelli, P.; Obrist, M.K. Biodiversity indicators: The choice of values and measures. Agric. Syst. Environ. 2003, 98, 87–98. [Google Scholar] [CrossRef]
- Herzog, F.; Balázs, K.; Dennis, P.; Friedel, J.; Geijzendorffer, I.; Jeanneret, P.; Kainz, M.; Pointereau, P. Biodiversity indicators for European farming systems: A guidebook. ART-Schriftenreihe 2012, 17, 98. [Google Scholar]
- Maiorano, L.; Falcucci, A.; Garton, E.O.; Boitani, L. Contribution of the Natura2000 Network to Biodiversity Conservation in Italy. Conserv. Biol. 2007, 21, 1433–1444. [Google Scholar] [CrossRef] [PubMed]
- Zisenis, M. Is the Natura2000 network of the European Union the key land use policy tool for preserving Europe’s biodiversity heritage? Land Use Policy 2012, 69, 408–416. [Google Scholar] [CrossRef]
- Princé, K.; Rouveyrol, P.; Pellissier, V.; Touroult, J.; Jiguet, F. Long-term effectiveness of Natura2000 network to protect biodiversity: A hint of optimism for common birds. Biol. Conserv. 2021, 253, 108871. [Google Scholar] [CrossRef]
- Bianchi, F.J.J.A.; Mikos, V.; Brussaard, L.; Delbaere, B.; Pulleman, M.M. Opportunities and limitations for functional agrobiodiversity in the European context. Environ. Sci. Policy 2013, 27, 223–231. [Google Scholar] [CrossRef] [Green Version]
- Labeyrie, V.; Antona, M.; Baudry, J.; Bazile, D.; Bodin, Ö.; Caillon, S.; Leclerc, C.; Le Page, C.; Louafi, S.; Mariel, J.; et al. Networking agrobiodiversity management to foster biodiversity-based agriculture. A review. Agron. Sustain. Dev. 2021, 41, 4. [Google Scholar] [CrossRef]
- Salvioni, C.; Henke, R.; Vanni, F. The impact of non-agricultural diversification on financial performance: Evidence from family farm in Italy. Sustainability 2020, 12, 486. [Google Scholar] [CrossRef] [Green Version]
- Keylock, C.J. Simpson diversity and the Shannon-Wiener index as special cases of a generalized entropy. Oikos 2005, 109, 203–207. [Google Scholar] [CrossRef]
- Roswell, M.; Dushoff, J.; Winfree, R. A conceptual guide to measuring species diversity. Oikos 2021, 130, 321–338. [Google Scholar] [CrossRef]
- Bélanger, J.; Pilling, D. The State of the World’s Biodiversity for Food and Agriculture; Food and Agriculture Organisation: Rome, Italy, 2019. [Google Scholar]
- Verones, F.; Hellweg, S.; Antón, A.; Azevedo, L.B.; Chaudhary, A.; Cosme, N.; Cucurachi, S.; De Baan, L.; Dong, Y.; Fantke, P.; et al. LC-IMPACT: A regionalized life cycle damage assessment method. J. Ind. Ecol. 2020, 24, 1201–1219. [Google Scholar] [CrossRef]
- Asselin, A.; Rabaud, S.; Catalan, C.; Leveque, B.; L’Haridon, J.; Martz, P.; Neveux, G. Product Biodiversity Footprint—A novel approach to compare the impact of products on biodiversity combining Life Cycle Assessment and Ecology. J. Clean. Prod. 2020, 248, 119262. [Google Scholar] [CrossRef]
- Beatty, C.R.; Raes, L.; Vogl, A.L.; Hawthorne, P.L.; Moraes, M.; Saborio, J.L.; Meza Prado, K. Landscapes, at Your Service; Applications of the Restoration Opportunities Optimization Tool (ROOT); IUCN: Gland, Switzerland, 2018; ISBN 978-2-8317-1925-2. [Google Scholar]
- Fordham, D.; Akçakaya, H.; Alroy, J.; Saltre, F.; Wigley, T.M.; Brook, B.W. Predicting and mitigating future biodiversity loss using long-term ecological proxies. Nat. Clim. Chang. 2016, 6, 909–916. [Google Scholar] [CrossRef]
- De’ath, G.; Fabricius, K. Water quality as a regional driver of coral biodiversity and macroalgae on the Great Barrier Reef. Ecol. Appl. 2010, 20, 840–850. [Google Scholar] [CrossRef] [PubMed]
- Alcocer, I.; Lima, H.; Sugai, L.S.M.; Llusia, D. Acoustic indices as proxies for biodiversity: A meta-analysis. Biol. Rev. 2022, 97, 2209–2236. [Google Scholar] [CrossRef]
- De Valck, J.; Rolfe, J. Reviewing the use of proxies to value coastal and marine biodiversity protection: The Great Barrier Reef in Australia. Mar. Policy 2022, 136, 104890. [Google Scholar] [CrossRef]
- Bailey, A. (Ed.) Mainstreaming Agrobiodiversity in Sustainable Food Systems: Scientific Foundations for an Agrobiodiversity Index—Summary; Bioversity International: Rome, Italy, 2016; ISBN 978-92-9255-059-2. [Google Scholar]
- ISPRA. Indicatori di Biodiversità Per la Sostenibilità in Agricoltura—Linee Guida, Strumenti e Metodi per la Valutazione Della Qualità degli Agroecosistemi; ISPRA: Roma, Italy, 2008; ISBN 978-88-448-0337-7. [Google Scholar]
- Agroscope. Biodiversity Indicators for European Farming Systems—A Guidebook; Research Station ART: Zurich, Switzerland, 2012; ISBN 978-3-905 733-26-6. [Google Scholar]
- Trisorio, A.; De Natale, F.; Pignatti, G. Le aree agricole ad alto valore naturale in Italia: Una stima a livello regionale. Agriregionieuropa 2013, 9, 70–74. [Google Scholar]
- Jones, S.K.; Remans, R.; Dulloo, M.E.; Estrada Carmona, N.; Bailey, A.; Grazioli, F.; Villani, C.; Bissessur, P. Agrobiodiversity Index Report 2021: Assessing Mediterranean Food Systems; Bioversity International: Rome, Italy, 2022. [Google Scholar]
- Jones, S.K.; Estrada-Carmona, N.; Stella, D.; Juventia, S.D.; Dulloo, M.E.; Laporte, M.A.; Villani, C.; Remans, R. Agrobiodiversity Index scores show agrobiodiversity is underutilized in national food systems. Nat. Food 2021, 2, 712–723. [Google Scholar] [CrossRef]
- Picone, C.; Henke, R.; Ruberto, M.; Calligaris, E.; Zucaro, R. A Synthetic Indicator for Sustainability Standards of Water Resources in Agriculture. Sustainability 2021, 13, 8221. [Google Scholar] [CrossRef]
- Henke, R.; De Leo, S.; Longhitano, D.; Sardone, R. The new CAP and the challenge of sustainability: A synthetic indicator for the Italian wine sector. Wine Econ. Policy 2023. [Google Scholar] [CrossRef]
- Marino, D.; Palmieri, M.; Marucci, A.; Pili, S. Long-term land cover changes and ecosystem services variation: Have the anthropogenic transformations degraded human well-being in Italy? REA—Ital. Rev. Agric. Econ. 2022, 77, 7–23. [Google Scholar] [CrossRef]
- ELN-FAB. Functional Agrobiodiversity: Nature Serving Europe’s Farmers; ECNC-European Centre for Nature Conservation: Tilburg, The Netherlands, 2012. [Google Scholar]
- Kelemen, E.; Nguyen, G.; Gomiero, T.; Kovács, E.; Choisis, J.P.; Choisis, N.; Paoletti, M.G.; Podmaniczky, L.; Ryschawy, J.; Sarthou, J.P.; et al. Farmers’ perceptions of biodiversity: Lessons from a discourse-based deliberative valuation study. Land Use Policy 2013, 35, 318–328. [Google Scholar] [CrossRef]
- Remans, R.; Jones, S.; Quiros, C.; Smith, A.G.; Attwood, S.; Werneck, F.; Negra, C.; Hoogendoorn, C.; Menza, G.; Villani, C.; et al. The Agrobiodiversity Index: Methodology Report v.1.0; Bioversity International: Rome, Italy, 2018. [Google Scholar]
- Osterman, O.P. The need for management of nature conservation sites designated under Natura2000. J. Appl. Ecol. 1998, 35, 968–973. [Google Scholar] [CrossRef]
- Buckland, S.T.; Baillie, S.R.; Dick, J.M.C.P.; Elston, D.A.; Magurran, A.E.; Scott, E.M.; Smith, R.I.; Somerfield, P.J.; Studeny, A.C.; Watt, A. How should regional biodiversity be monitored? Environ. Ecol. Stat. 2012, 19, 601–626. [Google Scholar] [CrossRef]
- Biasi, R.; Brunori, E.; Smiraglia, E.; Salvati, L. Linking traditional tree-crop landscapes and agro-biodiversity in central Italy using a database of typical and traditional products: A multiple risk assessment through a data mining analysis. Biodivers. Conserv. 2015, 24, 3009–3031. [Google Scholar] [CrossRef]
- Simoncini, F. Introducing territorial and historical contexts and critical thresholds in the analysis of conservation of agro-biodiversity by Alternative Food Networks, in Tuscany, Italy. Land Use Policy 2015, 42, 355–366. [Google Scholar] [CrossRef]
- Lawrence, A.; Friedrich, F.; Beierkuhnlein, C. Landscape fragmentation of the Natura2000 network and its surrounding areas. PLoS ONE 2021, 16, e0258615. [Google Scholar] [CrossRef]
- Henke, R.; Benos, T.; De Filippis, F.; Giua, M.; Pierangeli, F.; Pupo D’Andrea, M.R. The new common agricultural policy: How do Member States respond to flexibility? J. Common. Mark. Studis 2018, 56, 403–419. [Google Scholar] [CrossRef]
- Cagliero, R.; Mazzocchi, G.; Monteleone, A.; Pierangeli, F.; Manzoni di Chiosca, P.; Romano, E. A participative methodology for prioritising intervention logic in the design of the Italian CAP Strategic Plan. REA—Ital. Rev. Agric. Econ. 2022, 77, 25–50. [Google Scholar] [CrossRef]
- Kubacka, M.; Smaga, Ł. Effectiveness of Natura2000 areas for environmental protection in 21 European countries. Reg. Environ. Chang. 2019, 19, 2079–2088. [Google Scholar] [CrossRef] [Green Version]
Figure 1.
T-LAB by NUTS2 regions. Note: Darker areas denote higher values of territorial identity. Source: Authors’ elaboration based on FADN data.
Figure 1.
T-LAB by NUTS2 regions. Note: Darker areas denote higher values of territorial identity. Source: Authors’ elaboration based on FADN data.

Figure 2.
T-LAB’s dimensions by NUTS2 regions. Note: Darker areas denote higher values of territorial identity. Source: Authors’ elaboration based on FADN data.
Figure 2.
T-LAB’s dimensions by NUTS2 regions. Note: Darker areas denote higher values of territorial identity. Source: Authors’ elaboration based on FADN data.


Figure 3.
T-LAB by NUTS2 regions—Natura2000 sites. Note: Darker areas denote higher values of territorial identity. Source: Authors’ elaboration based on FADN data.
Figure 3.
T-LAB by NUTS2 regions—Natura2000 sites. Note: Darker areas denote higher values of territorial identity. Source: Authors’ elaboration based on FADN data.

Figure 4.
T-LAB’s dimensions by NUTS2 regions—Natura2000 sites. Note: Darker areas denote higher values of territorial identity. Source: Authors’ elaboration based on FADN data.
Figure 4.
T-LAB’s dimensions by NUTS2 regions—Natura2000 sites. Note: Darker areas denote higher values of territorial identity. Source: Authors’ elaboration based on FADN data.

Figure 5.
T-LAB by farm type in FADN, all farms sample. Source: Authors’ elaborations based on FADN data.
Figure 5.
T-LAB by farm type in FADN, all farms sample. Source: Authors’ elaborations based on FADN data.

Figure 6.
T-LAB by farm type in FADN Natura2000 farms. Source: Authors’ elaborations on FADN data.


Table 1.
2014–2020 CAP agro-biodiversity related measures.
| I Pillar | |
| Greening | |
| II Pillar—farmers’ actions and environmental commitments | |
| Investments in physical assets | non-productive investments linked to the achievement of agro-environment-climate objectives (code: 4.4) |
| Investments in forest area development and improvement of the viability of forests | afforestation/creation of woodland (code: 8.1) |
| Investments in forest area development and improvement of the viability of forests | establishment and maintenance of agro-forestry systems (code: 8.2) |
| Agro-environment-climate | agro-environment-climate commitments (code: 10.1) |
| Organic farming | payment to convert to organic farming practices and methods (code: 11.1) |
| Organic farming | payment to maintain organic farming practices and methods (code: 11.2) |
| Forest-environmental and climate services and forest conservation | payment for forest-environmental and climate commitments (code: 15.1) |
| II Pillar—farmers’ contextual conditions | |
| Natura2000 and Water Framework Directive payments | compensation payment for Natura2000 agricultural areas (code: 12.1) |
| Payments to areas facing natural or other specific constraints | compensation payment in mountain areas (code: 13.1) |
| Payments to areas facing natural or other specific constraints | compensation payment for other areas facing significant natural constraints (code: 13.2) |
| Payments to areas facing natural or other specific constraints | compensation payment to other areas affected by specific constraints (code: 13.3) |
Note: The complete list of 2014–2020 CAP measures is available at: https://agriculture.ec.europa.eu/common-agricultural-policy/rural-development/measures_en. Accessed on 31 March 2023.
Table 2.
T-LAB by NUTS2 regions.
| NUTS2 Code | Region | Number of Farms | Av T-LAB (%) |
|---|---|---|---|
| ITC2 | V. D’Aosta | 246 | 36.8 |
| ITG2 | Sardegna | 530 | 30.69 |
| ITI2 | Umbria | 441 | 30.35 |
| ITF5 | Basilicata | 367 | 30.29 |
| ITG1 | Sicilia | 673 | 29.49 |
| ITH1 | P.A. Bolzano | 311 | 27.24 |
| ITI3 | Marche | 430 | 26.99 |
| ITF2 | Molise | 342 | 26.82 |
| ITI1 | Toscana | 562 | 26.53 |
| ITI4 | Lazio | 578 | 24.97 |
| Italy | 10,764 | 23.5 | |
| ITH4 | Friuli V.G. | 399 | 22.8 |
| ITC1 | Piemonte | 600 | 22.16 |
| ITH3 | Veneto | 674 | 20.18 |
| ITF6 | Calabria | 501 | 19.94 |
| ITF4 | Puglia | 704 | 19.23 |
| ITF1 | Abruzzo | 563 | 18.48 |
| ITH5 | Emilia R. | 858 | 18.42 |
| ITF3 | Campania | 598 | 17.13 |
| ITC4 | Lombardia | 674 | 17.03 |
| ITC3 | Liguria | 431 | 14.73 |
| ITH2 | P.A. Trento | 282 | 13.29 |
Source: Authors’ elaboration based on FADN data. Note: NUTS2 Code refers to the EUROSTAT Nomenclature of territorial units for statistics and corresponds to Italian regions. The map with the specific code for each region is reported in Appendix A.
Table 3.
T-LAB by NUTS2 regions—Natura2000 sites. Source: Authors’ elaboration based on FADN data.
| NUTS2 Code | Region | Number of Farms | Av T-LAB (%) |
|---|---|---|---|
| ITC2 | V. D’Aosta | 10 | 54.08 |
| ITI1 | Toscana | 2 | 44.74 |
| ITH3 | Veneto | 3 | 43.96 |
| ITF1 | Abruzzo | 10 | 43.18 |
| ITF2 | Molise | 1 | 42.94 |
| ITG1 | Sicilia | 66 | 40.758 |
| ITF3 | Campania | 51 | 38.12 |
| ITI2 | Umbria | 6 | 37.28 |
| ITF5 | Basilicata | 18 | 37.1 |
| ITC1 | Piemonte | 10 | 37.05 |
| Italy | 230 | 36.39 | |
| ITI4 | Lazio | 12 | 35.1 |
| ITI3 | Marche | 10 | 33.56 |
| ITC4 | Lombardia | 1 | 31.49 |
| ITF4 | Puglia | 21 | 29.798 |
| ITH5 | Emila R. | 5 | 25.49 |
| ITC3 | Liguria | 2 | 24.81 |
| ITH4 | Friuli V. G. | 2 | 19.22 |
Note: NUTS2 Code refers to the EUROSTAT Nomenclature of territorial units for statistics and corresponds to Italian regions. The map with the specific code for each region is reported in Appendix A.
Disclaimer/Publisher’s Note: The statements, opinions and data contained in all publications are solely those of the individual author(s) and contributor(s) and not of MDPI and/or the editor(s). MDPI and/or the editor(s) disclaim responsibility for any injury to people or property resulting from any ideas, methods, instructions or products referred to in the content. |
© 2023 by the authors. Licensee MDPI, Basel, Switzerland. This article is an open access article distributed under the terms and conditions of the Creative Commons Attribution (CC BY) license (https://creativecommons.org/licenses/by/4.0/).
Share and Cite
MDPI and ACS Style
Henke, R.; Vaquero-Piñeiro, C. Measuring Agro-Biodiversity through Leverage Factors: Land Use, Farmer Practices and Public Policies. Land 2023, 12, 1499. https://doi.org/10.3390/land12081499
AMA Style
Henke R, Vaquero-Piñeiro C. Measuring Agro-Biodiversity through Leverage Factors: Land Use, Farmer Practices and Public Policies. Land. 2023; 12(8):1499. https://doi.org/10.3390/land12081499
Chicago/Turabian StyleHenke, Roberto, and Cristina Vaquero-Piñeiro. 2023. "Measuring Agro-Biodiversity through Leverage Factors: Land Use, Farmer Practices and Public Policies" Land 12, no. 8: 1499. https://doi.org/10.3390/land12081499
Note that from the first issue of 2016, this journal uses article numbers instead of page numbers. See further details here.