Article

Descriptive and Network Post-Occupancy Evaluation of the Urban Public Space through Social Media: A Case Study of Bryant Park, NY

1
Department of Landscape Architecture, Oklahoma State University, 107 Whitehurst, Stillwater, OK 74078, USA
2
Department of Landscape Architecture, Texas A&M University, 400 Bizzell St, College Station, TX 77843, USA
3
School of Architecture, Beijing Jiao Tong University, Haidian District, Beijing 100044, China
4
Landscape Architecture and Spatial Planning Group, Wageningen University and Research, Droevendaalsesteeg 4, 6708 PB Wageningen, The Netherlands
5
School for Environment and Suitability, University of Michigan, Ann Arbor, MI 48109, USA
6
School of Architecture, Tianjin University, Nankai District, Tianjin 300072, China
7
Department of Landscape Architecture, Shanghai Academy of Landscape Architecture Science and Planning, Xuhui District, Shanghai 200232, China
8
Department of Landscape Architecture, University of Nevada, Las Vegas, 4505 S Maryland Pkwy, Las Vegas, NV 89154, USA
*
Authors to whom correspondence should be addressed.
Land 2023, 12(7), 1403; https://doi.org/10.3390/land12071403
Submission received: 8 June 2023 / Revised: 9 July 2023 / Accepted: 10 July 2023 / Published: 13 July 2023

Abstract

:
In modern cities, urban public spaces, such as parks, gardens, plazas, and streets, play a big role in people’s social activities, physical activities, mental health, and overall well-being. However, the traditional post-occupancy evaluation (POE) process for public spaces such as large urban parks is extremely difficult, especially for long-term user experiences through observations, surveys, and interviews. On the other hand, social media has emerged as a major media outlet recording millions of user experiences to the public, which provides opportunities to inform how public space is used and perceived by users. Furthermore, unlike previous research that primarily presented descriptive characters of park programs, our study employs a network model to elucidate the interactive relationships and intensities among reported park elements, human activities, and experiences. This approach enables us to track the sources within the space that impact people’s perceptions, such as weather conditions, food options, and notable landmarks. The utilization of this network model opens avenues for future research to comprehensively investigate the factors shaping people’s perceptions in public open spaces. This study uses Bryant Park as an example and presents a new analytical framework, POSE (post-occupancy social media evaluation), to support long-term POE studies for large public spaces. Methods such as data automation, descriptive statistics, and social network analysis were used. The identification and quantification of meaningful park activities, scenes, and sentiments as well as their relationships will help optimize the design and management of park programs.

1. Introduction

1.1. Urban Public Spaces and Post-Occupancy Evaluation

In modern cities, urban public spaces, such as parks, gardens, plazas, and streets, play a big role in people’s social activities, physical activities, mental health, and overall well-being [1,2]. Urban public spaces are a part of urban green spaces which provide ecological services in microclimate, air quality, carbon sequestration, biodiversity, and habitat provision [3]. They are also an essential part of human welling because of the benefits of social interactions and engagement [4]. The World Health Organization [5] and Gehl Institute have listed qualities of successful urban public spaces in categories of protection, comfort, and enjoyment. Other important factors that attract people’s usage and engagement are cleanliness, naturalness, aesthetics, safety, access, and appropriateness of development [3]. Van Herzele and Wiedemann [6] defined the attractiveness of public spaces through attributes of spaciousness, nature, culture and history, quietness, and facilities. These qualities span across the physical, social, organizational, and economic dimensions of the environment, and they possess a strong correlation with the patterns of space utilization and the level of engagement exhibited by individuals within that space [7].
To have people engage with the public parks and benefit from their services, it is important to evaluate park performances and ensure key park qualities through Post-Occupancy Evaluation (POE) which investigates people’s uses, experiences, satisfactions, psychological perceptions, or sociability [8,9]. POE is a widely used approach that measures the quality of the built environment. Originally, it focused on gaining insight into the performance of a site from end users’ perspectives instead of designers or administrators [10]. Over the past 30 years, the concept of POE has been further developed to describe the ‘virtuous circles of improvement’ within the built environment’s lifespan [11,12]. Many researchers have adopted POE to study building and environmental performances with a wide variety of focuses. The efficiency of buildings’ energy use, thermal performance, and indoor environmental quality is well-reflected by the POE method [13]. Acoustics is also a common branch of application of POE, focusing on the change of soundscape’s influence on people’s perception [14,15]. Aside from evaluating the built environment from the environmental and sustainable aspect, POE can also be used in the dimension of well-being and social equity. A large body of research has demonstrated that POE helps improve user satisfaction, react to user demand, and lower the risk of investment uncertainty for projects such as housing, hospitality, health, dining, etc. [14,16] Kalantari and Shepley [17] revealed the negative impact of high-rise environments on vulnerable groups by applying the POE method. The research results of Paraskevopoulou and Kamperi [18] have demonstrated that the POE method is useful in designing healing gardens for different target users.
These benefits can also be seen in studies of urban public spaces. For example, Boffi et al. [19] applied the visual POE method to assess how different restorative gardens affect the elderly and young people. Lygum et al. [20] have provided recommendations for safer, positively distractive, and versatile spaces for a Crisis Shelter Garden through observation and interviews. Mehta [8] constructed an observation methodology called the public space index (PSI) and applied it to four public spaces in downtown Tampa, suggesting improvements in safety, comfortability, and meaningful programming. Despite the success of POE in environmental evaluation, it is still difficult to employ large-scale applications on public spaces in the field of urban design or landscape architecture [21]. Typical methods such as surveys, interviews, and observations pose challenges such as cost, time, low response rates, and outdated information [22,23]. There are also difficulties in collecting reliable POE data as well as concerns of oversimplification and consistency issues [24] given the fact that public space users vary at different times of the day, weekdays, and seasons.
For this study, we aim to explore the park scenes, activities, and perceptions reported by social media users who visited Bryant Park. The main question addressed by our research is to understand the diverse experiences of park visitors and identify any variations that occur monthly. Additionally, we aim to investigate the interconnections among scenes, activities, and perceptions through a network model. This approach allows us to examine the impacts of programs and activities on visitors’ perceptions, gain specific understandings that depict the effects of landscape elements and related activities, and ultimately provide actionable insights that can instantly optimize open space usage. By examining these factors, we seek to gain insights into the dynamic nature of visitor experiences and contribute to the existing body of knowledge on urban park usage.

1.2. Social Media and Built Environment Research

Traditionally, researchers have relied on observation and interviews to understand these spaces. However, the rise of social media platforms has provided an additional lens through which to explore and analyze urban public spaces (Nguyen et al., 2019). In particular, hashtags offer researchers a valuable means to tap into the collective experiences and perceptions shared by users on these platforms. Platforms such as Instagram, Twitter, Tripadvisor, and Google Places have attracted millions of users who post images, videos, reviews, and hashtags on a daily basis. Compared with traditional data-collecting methods, social media enables more interactive forms. Different from surveys that ask targeted questions, social media data provides user-generated content through self-motivated postings driven by self-representation [25]. Varying the involvement intensity [26], due to the availability of mobile phones and wireless services, citizens have easier access to social media tools, and thus the communication between planners, policymakers, and the public is direct and has larger sample sizes [27,28]. On the other hand, even without an exact activity, planners can still obtain large amounts of information by extracting data with keyword tags from social media to understand public preferences and forecast user demands [29]. Either way, the collected results can be quantified as planning support, thus promoting the realization of democracy. Additionally, social media helps to conduct research among certain groups, for instance, to assess teenagers’ opinions towards future transport transition and gender differences in travel experience by launching specific social media groups [30]. This characteristic of social media can bring unique perspectives for urban planning and design, such as the disabled, thus further promoting social equity. In a nutshell, the high volume, richness, and speed of social media data [31] promotes citizen science’s involvement and participation. Meanwhile, the usage of social media provides opportunities for researchers and policymakers to understand social engagement and public opinions [32]. However, unstructured data with lots of noise are sometimes too scattered to generate sound conclusions. A critical examination of database construction, filtering, and analysis was suggested to ensure a robust research design [33].
In built environment research, social media data has been widely adopted in urban planning research. Twitter, as a microblogging platform, has been used to assess seasonal variations in physical activities and engagement [34] and reveal public emotions about large public events such as the 2012 London Olympics [35]. The spatial distributions of Flickr photos and hashtags helped Dunkel [36] to visualize the landscape perception and value in Yosemite Valley, High Line Manhattan, and San Francisco Coit Tower. Zhou et al. [37] have used online reviews on Tripadvisor.com to conduct hospitality and tourism studies. There are also a handful of social media studies focusing on urban public spaces. Song and Zhang [38] assessed landscape values using Instagram hashtags and photos for Freeway Park in Seattle. Kim et al. [23] also conducted POE studies using Twitter on the High Line Park in New York City. However, few studies have used social media data to comprehensively evaluate the environmental and behavioral dynamics of public spaces.

1.3. Post-Occupancy Social Media Evaluation (POSE)

Post-Occupancy Evaluation (POE) encompasses a diverse range of investigations, including various specific physical and perceptual characteristics of settings, along with broader social configurations [14]. Since POE is a comprehensive method for assessing the performance and user satisfaction of built environments, it is essential to acknowledge that its scope may be limited when it comes to capturing the entirety of its applications. Consequently, post-occupancy social media evaluation can only supplement a certain dimension of the applications [39,40]. Based on previous studies, we think social media data are most suitable to assess people’s perceptions and thus evaluate landscape design quality and effectiveness [41,42]. This study proposes an approach to examine one of the most successful public spaces; Bryant Park in New York City.
Social media data from Instagram will be collected to investigate the public space usage and perception for the period of a whole year. We will also explore the possibility of social network visualization of social media data for urban public spaces. Two research questions will be addressed:
  • What scenes, activities, and perceptions are reported by park visitors each month in Bryant Park?
  • What is the relationship between different scenes, activities, and perceptions in the park?
Our results could demonstrate the potential of social media data in POE studies and facilitate its applications for future public spaces.

2. Materials and Methods

2.1. Study Site

Bryant Park, formerly a pottery yard, was renamed in 1884 to honor William Cullen Bryant. From the mid-20th century to the end of the 20th century, Bryant Park gradually became a gathering place for crime and social issues. However, after thorough transformation and reconstruction, it has now developed into one of the most prosperous and vibrant urban parks in New York City. Located in the western part of Manhattan, adjacent to the commercial and cultural district of downtown New York City, the park covers approximately 39,000 square meters and has made a significant impact in integrating into the urban fabric, attracting the attention of scholars, urban planners, and creative individuals. Bryant Park’s look today is largely a result of the work of Laurie Olin. Olin is a distinguished teacher, author, and one of the most renowned landscape architects practicing today. From vision to realization, he has guided many of OLIN’s signature projects, which span the history of the studio from the Washington Monument Grounds in Washington, DC to Bryant Park in New York City. His recent projects include the AIA award-winning Barnes Foundation in Philadelphia, Pennsylvania and Simon and Helen Director Park in Portland, Oregon.
The park provides a multifunctional space that harmoniously blends natural landscapes with man-made features. Its expansive lawns and meticulously designed flower beds offer a comfortable and relaxing green environment. The park also features a library, various dining facilities, and recreational amenities to cater to a range of entertainment and social needs. Additionally, the park hosts numerous public events, including concerts, film screenings, and cultural festivals, attracting a large number of residents and visitors. Over time, Bryant Park has achieved an iconic status in the urban landscape of New York City, while also playing a significant role in the overall urban development of the city. Based on the progress and activities provided by the park, we can see what scenes, activities, and perceptions are most recorded by social media users [43,44,45].

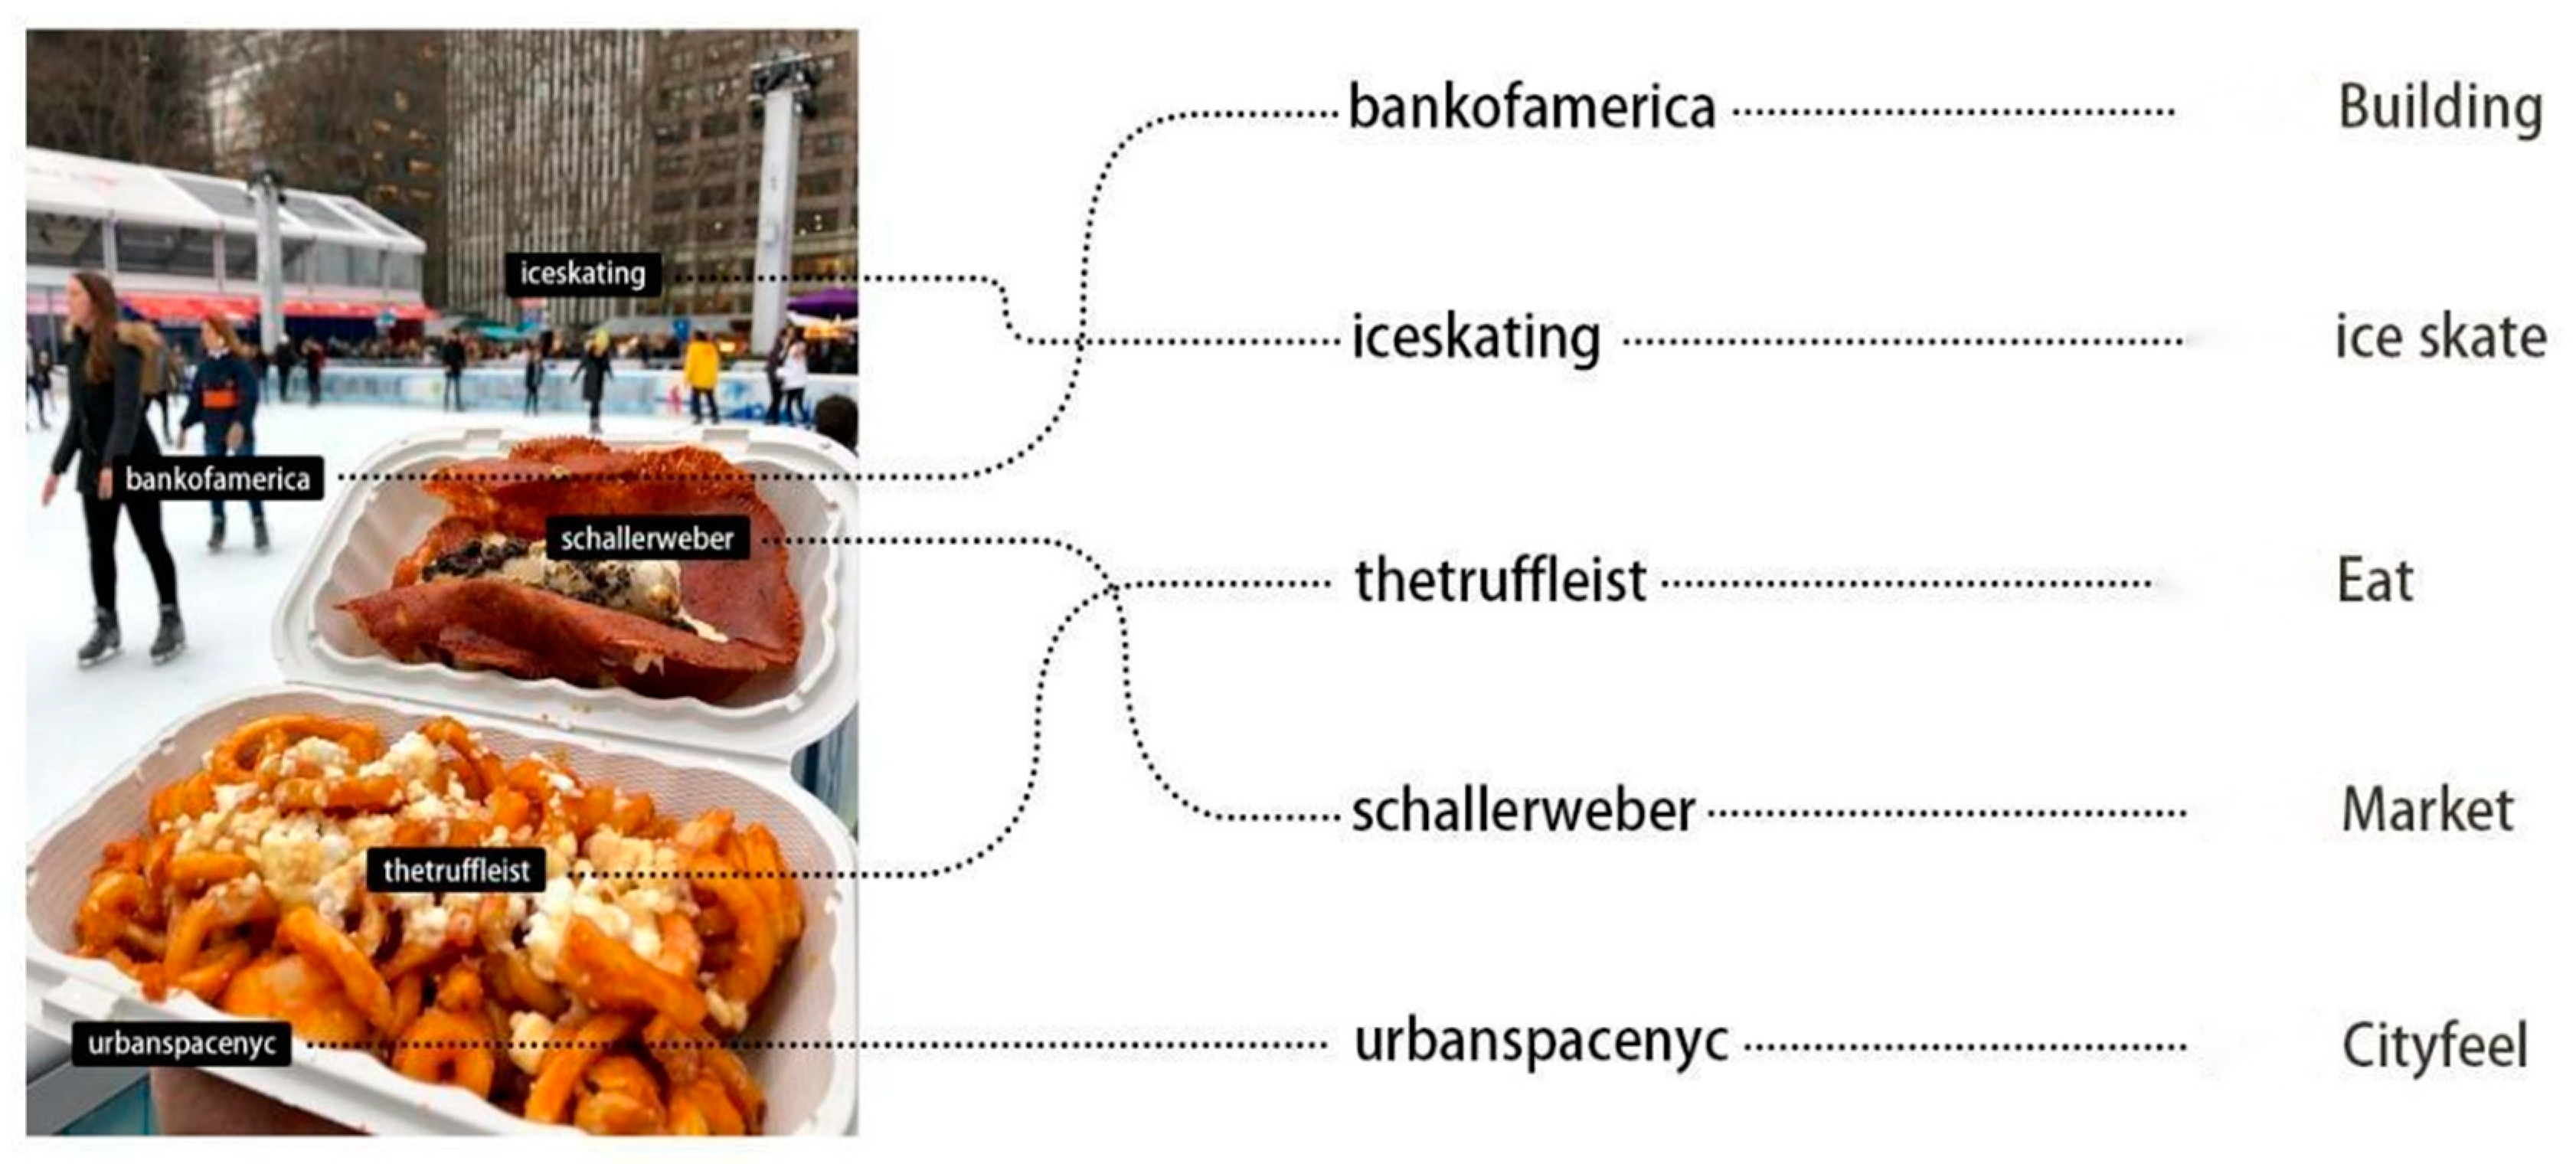
2.2. Hashtag Collection and Categorization

Instagram hashtags were selected as the major data source. Instagram is a prominent online mobile application that focuses on photo sharing and social networking [46,47]. Its geolocation feature enables users to tag and share their activities and experiences in specific public spaces. As of January 2023, Instagram had surpassed 2 billion monthly active users, with approximately 30% of the user population in the age groups of 18–24, 25–34, and 35 years and above [48]. Previous studies have indicated that Instagram primarily serves as a platform for sharing relaxed personal moments and leisure activities [49]. Consequently, its data holds significant potential as a source for monitoring visitor numbers in natural areas, providing valuable insights into the popularity of parks as well as patterns of visitation over time [50]. We collected Instagram data from the location tag ‘Bryant Park’ in New York City from 1 January 2017 to 31 December 2017. This specific period was chosen to ensure consistency in the dataset and account for the park’s ongoing construction work and development between 2018 and 2019, as well as the impact of the COVID-19 pandemic on citizens’ outings after 2020. Due to the significant changes taking place during those years, we opted to exclude the data from 2018 to 2022 to focus on a period when the park’s features and user-generated content were more representative of its pre-construction state.
Research by Song and Zhang (2020) found that social media data can provide valuable insights into user activities, motivations, and emotions, offering a comprehensive understanding of their experiences. Similarly, Jang and Kim (2019) conducted a study on urban park usage using social media data and highlighted the benefits of this approach in capturing real-time information and diverse user perspectives. Furthermore, a study by Paukaeva et al. (2020) explored the use of social media data in urban planning and found that it can serve as a reliable source of information for evaluating public spaces. They emphasized that social media data analysis provides a cost-effective and timely method for monitoring and understanding user preferences.
By utilizing the 2017 data, 102,435 data from Instagram posts with 109,258 hashtags were mined. 5313 hashtags that occurred more than 10 times were selected and categorized into three main categories including scenes, activities, and perceptions. These hashtags were then further coded into subcategories with 110 in total (Figure 1 as an example). The scenes include environmental elements such as objects, peoples, facilities, landscapes, etc., with a total of 36 subcategories. The activities encompass 35 subcategories, which can be further classified into four main activity types: (1) social activities: cosplay, wedding, and fireworks; (2) health and game: walk and run, exercises and sports, yoga, ice skating, chess, game, and read; eat and dining are the most popular subcategory reported by the park visitors; (3) large events: concert/movie/show, protest, philanthropy, and market; (4) food and drink: drink coffee and water, ice cream, eat and dine, and lunch break. The category of Perceptions is a representation of visitor attitudes to the park experiences. It includes hashtags that indicate certain moods, opinions, feelings, or preferences, with a total of 39 subcategories. These subcategories can be classified into two feelings: (1) Positive: Seasons, Festive, Reflective, Sociality and Publicity, Local Pride, Design, Discovery; (2) Negative: Reminiscence/Negative, Attachment. The data for categories and subcategories are presented in Table 1.
Instagram hashtags were selected as the major data source for this study, providing a low-cost and faster approach to obtaining information compared to traditional methods such as surveys, interviews, and on-site observations. However, it is important to acknowledge the limitations of relying solely on Instagram data. The study did not compare the Instagram findings to on-site observations or surveys, which could have provided a more comprehensive understanding of park users. Additionally, as social media platforms can be prone to fashion changes and have varying user demographics, focusing solely on Instagram may not capture the complete profile of park users or their diverse opinions.

2.3. Data Analysis

2.3.1. Data Downloading

The analysis conducted for this study involved two main components. Firstly, we undertook a comprehensive examination of hashtag occurrences across all three categories and their respective subcategories. To accomplish this, we calculated the frequencies of hashtags in each category and subcategory, enabling us to gain insights into their popularity. These results were then utilized to generate monthly popularity patterns for the subcategories. By employing a crosstab table, we were able to compare these patterns and identify any notable trends or variations.

2.3.2. Data Categorization

The second part of our analysis focused on investigating the co-occurrence relationships between pairs of hashtags within individual Instagram posts. By studying these relationships, we gained a deeper understanding of how different hashtags were used together, providing valuable insights into user behavior and content preferences. To visualize these findings, we employed Gephi (version 0.9.1), an open-source network analysis and visualization software. Utilizing the graph theory syntax, we incorporated various elements such as node size, node centrality, edge number, and edge width into our visualizations. These visual representations, referred to as “Social network visualizations”, allowed us to depict the connectivity between different park subcategories within various timeframes. Through the use of Gephi, we were able to create compelling visualizations that unveiled the intricate relationships between various aspects of park usage and user experiences. These visualizations shed light on the physical, programmatic, and experiential connections within the park. By deciphering these relationships, we gained valuable insights into how users interacted with different aspects of the park and their overall experiences. In addition, we employed the Python programming language. Python proved to be a powerful tool for various tasks, including data wrangling, preprocessing, table transformation, and automation. Its versatility and extensive library support allowed us to efficiently handle and manipulate the data, ensuring accurate and reliable results.
Furthermore, the analysis process consisted of several steps to ensure the accuracy and validity of the findings. Initially, we collected a large dataset of Instagram posts related to parks, which served as the foundation for our analysis. The dataset encompassed a wide range of geographical locations and periods, providing a comprehensive view of park-related activities and discussions. The analysis in this study primarily relied on Instagram data from 2017, which, although providing valuable insights, has limitations. The study did not distinguish between the opinions of local inhabitants and visitors from other regions or abroad, limiting the understanding of different perspectives. Furthermore, while the high frequencies of sub-categories like attachment and local pride suggest positive emotions, the analysis did not explicitly categorize visitors’ feelings and emotions as positive or negative. It is important to note that the study acknowledged the need for survey data to compensate for these limitations and provide a more comprehensive analysis of park experiences.

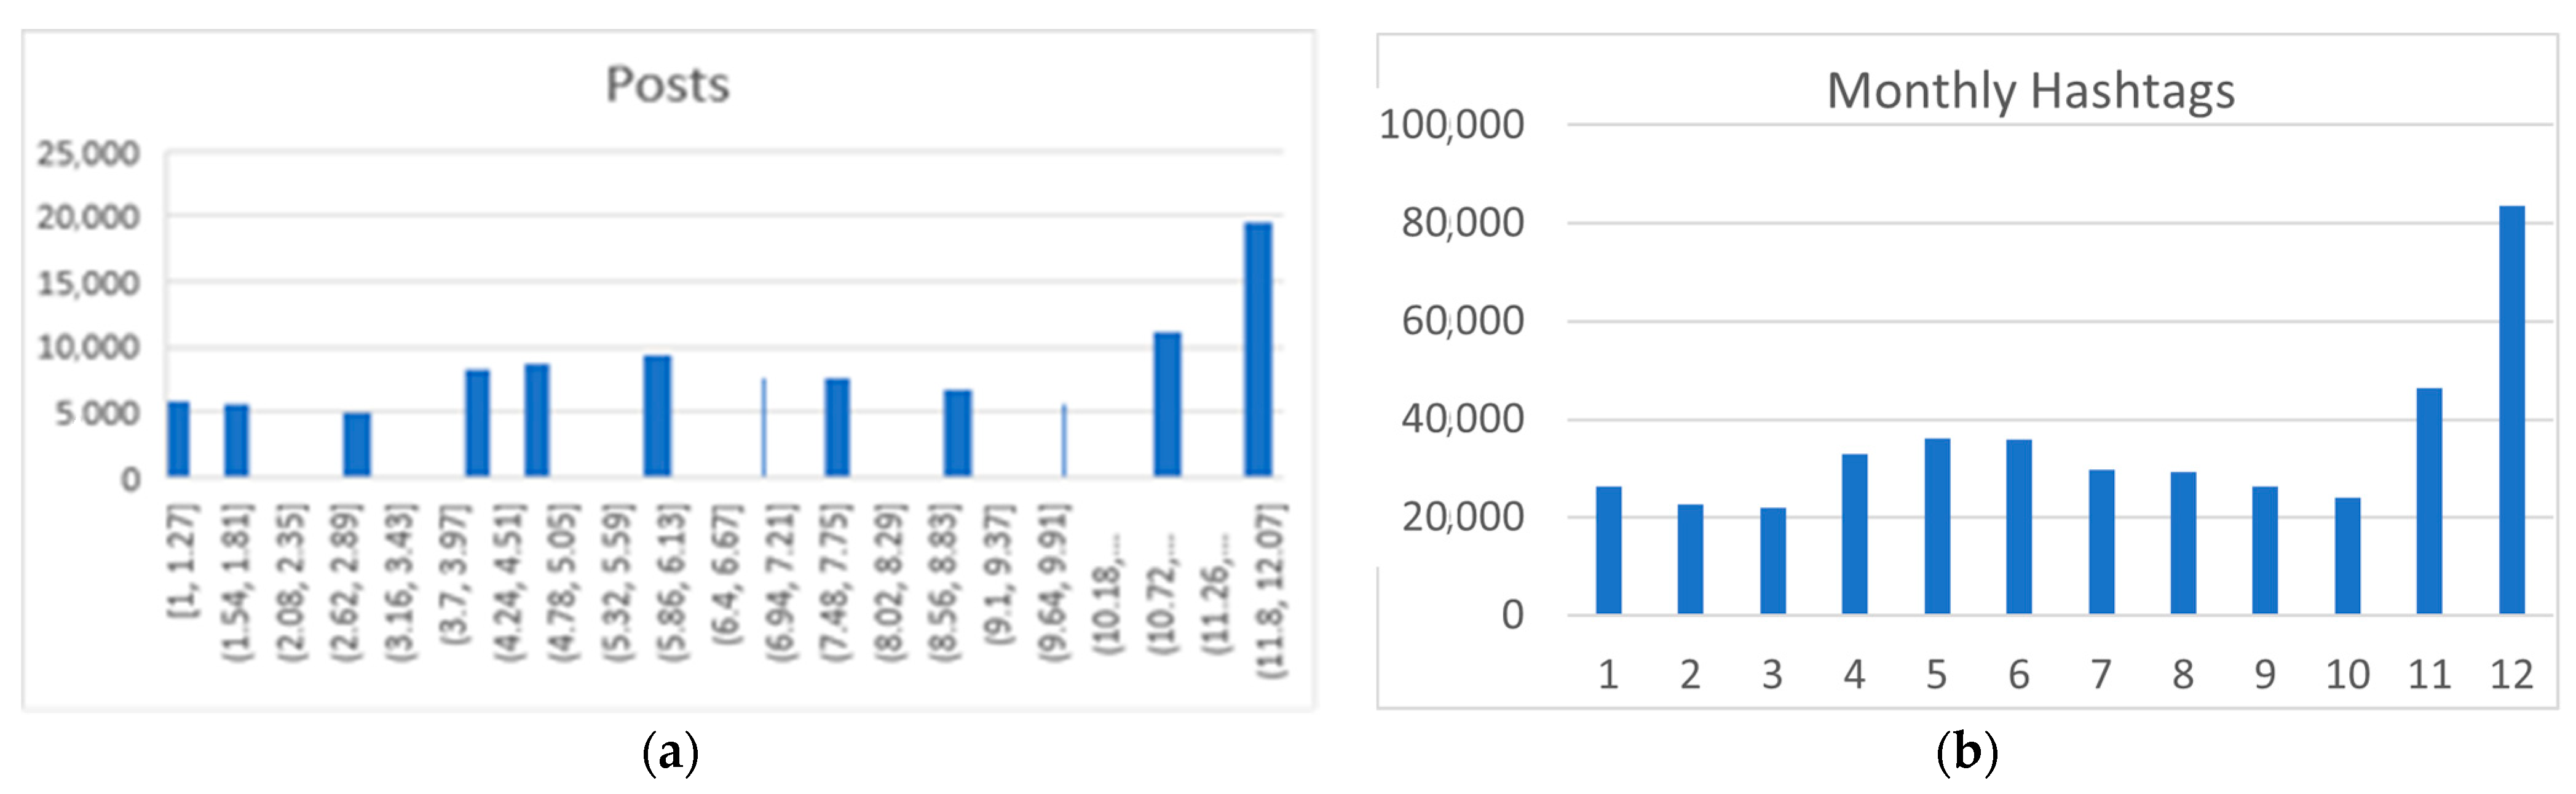
2.3.3. Data Frequency Study

Data wrangling played a vital role in preparing the dataset for analysis. We employed Python’s data manipulation capabilities to clean and preprocess the raw data, addressing issues such as missing values, inconsistencies, and formatting discrepancies. This step was crucial in ensuring the quality and integrity of the dataset, enabling us to draw reliable conclusions from the subsequent analysis. Once the data was cleaned, we proceeded to transform it into a suitable format for further exploration. Leveraging Python’s data transformation capabilities, we organized the data into tables and structures that facilitated the calculation of hashtag frequencies, co-occurrence relationships, and other relevant metrics. This transformation process allowed us to derive meaningful insights from the dataset and extract valuable information about park usage and user experiences. To examine the monthly popularity patterns of subcategories, we aggregated the hashtag frequencies over time and visualized them using graphs and charts. This enabled us to identify any significant fluctuations or trends within each subcategory, providing valuable information about the changing interests and preferences of park visitors. The co-occurrence analysis involved examining the relationships between pairs of hashtags within Instagram posts. By identifying hashtags that frequently appeared together, we gained insights into the connections and associations between different aspects of park-related content. This analysis not only helped us understand how users grouped and associated certain themes or activities but also provided a basis for creating social network visualizations.

2.3.4. Social Network Study

The relationship between different subcategories was represented through a series of social network diagrams. These diagrams have two components including nodes and edges with the following properties:
  • Node Size: bigger nodes have higher popularity than smaller nodes.
  • Edge Width: thicker edges suggest stronger connections between two entities.
  • Edge Number: a node with more edges is better connected within the network.
  • Edge Dash lines: connected nodes of the same categories, indicating the association between nodes (e.g., attachment associated with festive feeling).
  • Centrality: a node in the central region of the network is more important than those in the fringe.
Overall, the integration of Python programming, data wrangling, preprocessing, and analysis techniques, along with the utilization of Gephi for network visualization, enabled us to conduct a comprehensive and in-depth analysis of park-related data. The combination of these tools and methodologies provided a robust framework for extracting insights and uncovering valuable information about the physical, programmatic, and experiential relationships within the park environment.

3. Results

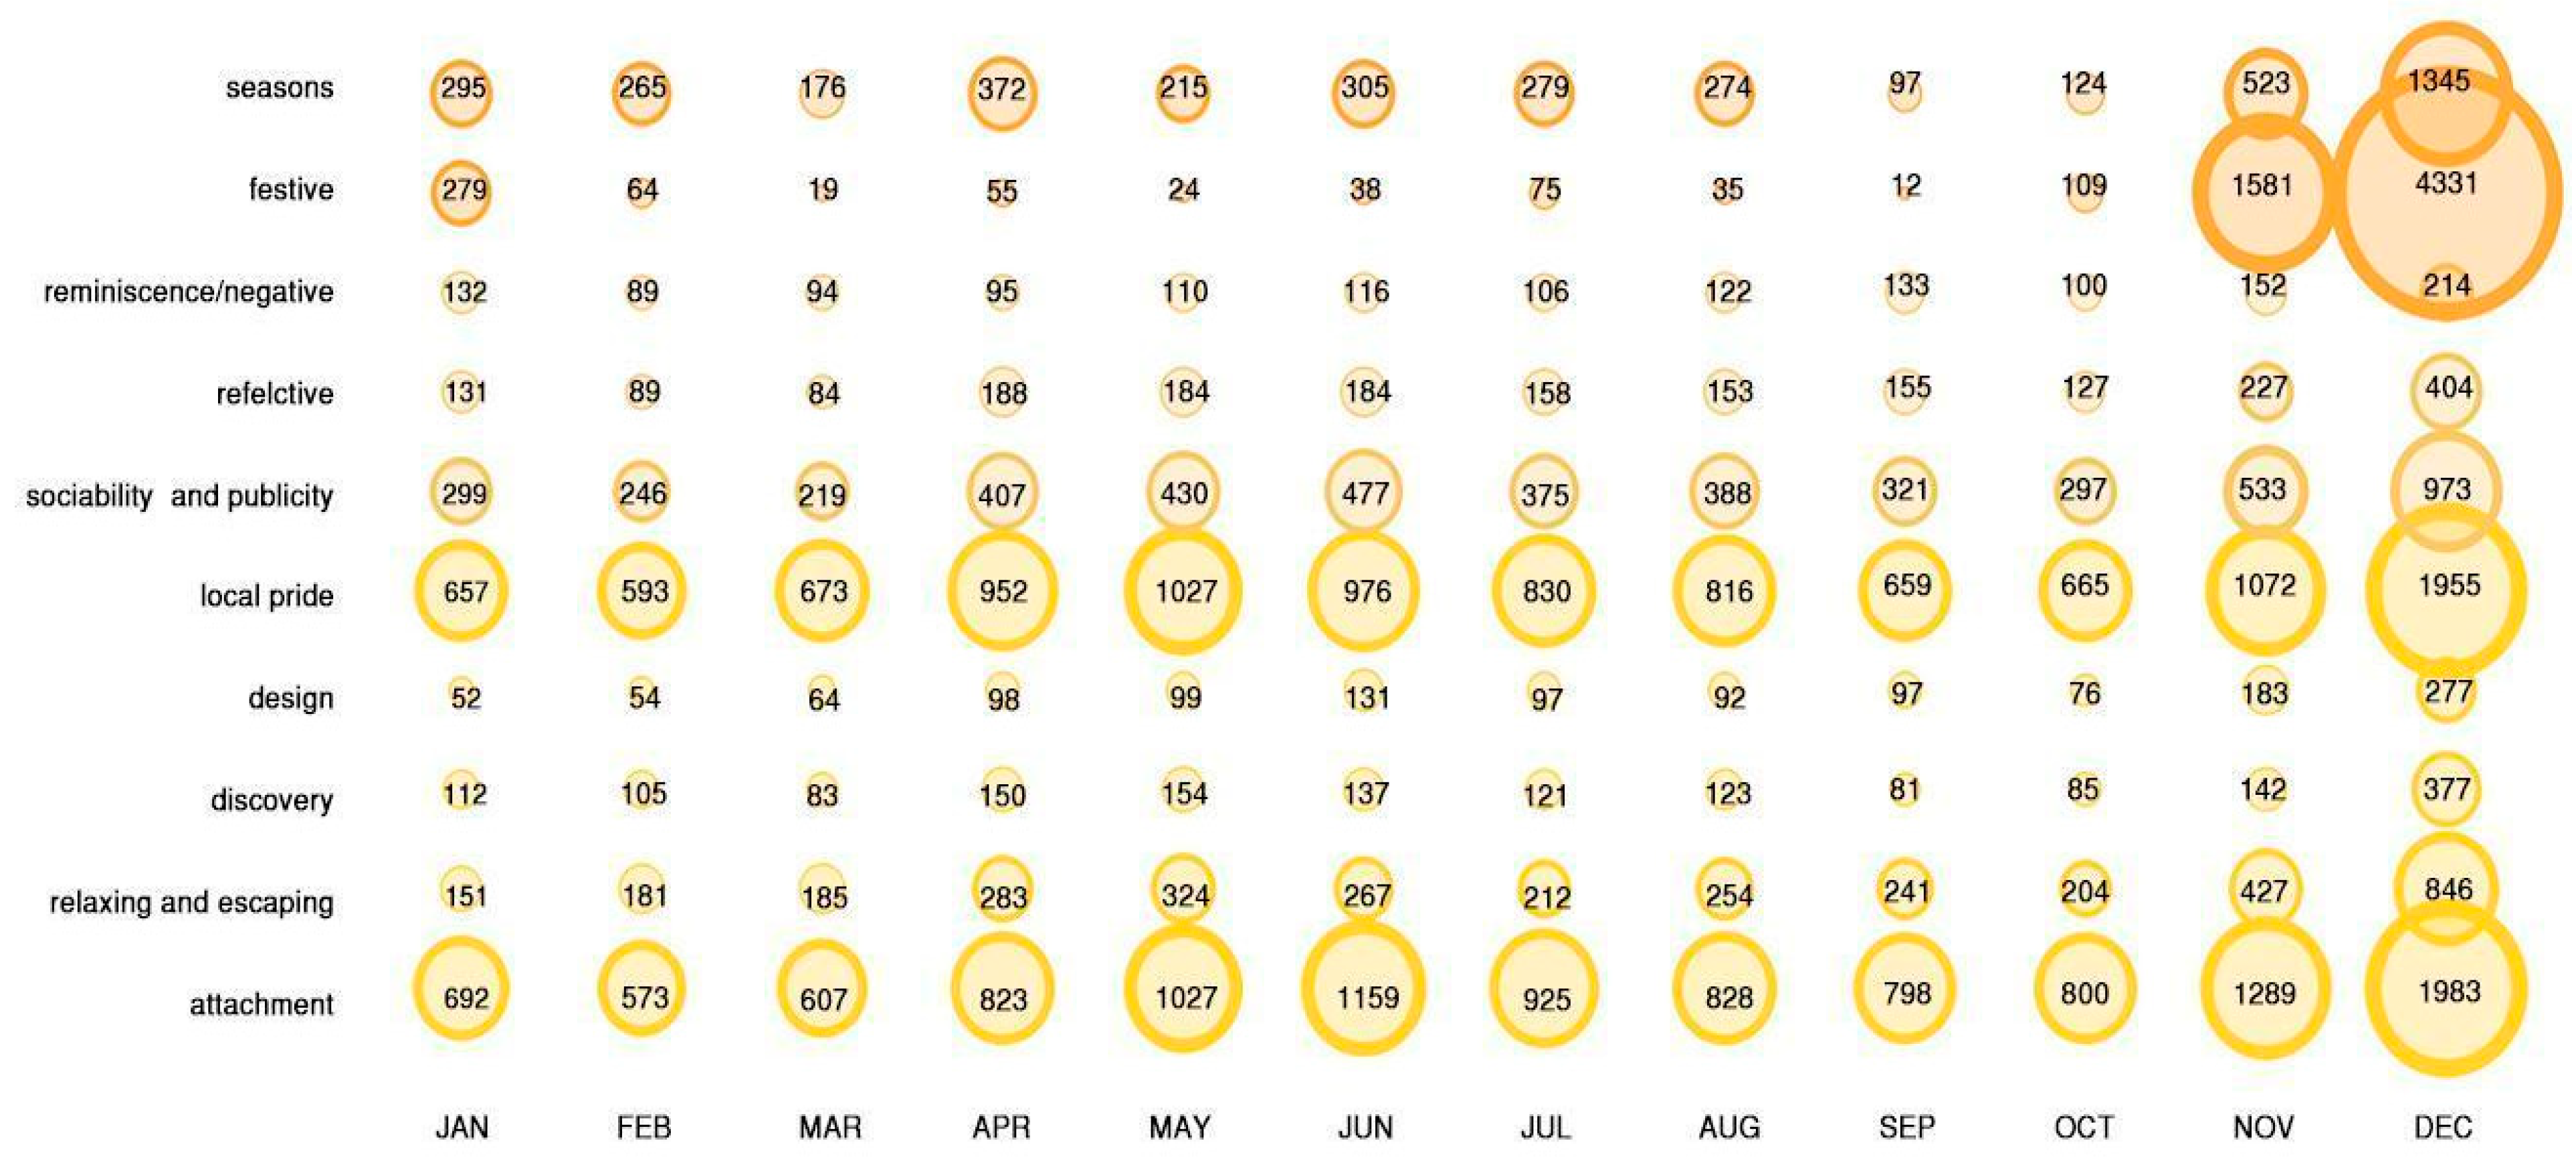
3.1. Popularity Study

As can be seen in Figure 2, the posts and hashtags present similar overall monthly distribution. The monthly average posting is 8536 and the monthly hashtag total is 34,629. November and December are the most active months, then April to June is the second most popular time of the year. December is the most dominant month as both its postings and hashtag frequencies are more than double the size of the annual average. March, the first month of spring, is surprisingly the least active month on Instagram. Previous urban public space studies using social media suggest applying categorization to extract meaningful data from hashtags (Song & Zhang, 2020). By repeatedly examining and comparing the semantic meanings and corresponding images of each hashtag, this study divided data hashtags into three main categories: (1) scene, (2) activity, and (3) perception. In the statistical analysis of the results, certain subcategories with low occurrence were excluded. First, the category of scenes in urban public space studies using social media refers to the hashtags that users utilize to capture and share their observations of park spaces. These hashtags provide insights into the physical elements and visual characteristics of the parks. To further analyze and categorize these hashtags, they can be divided into several subcategories, including animals, concrete structures, natural scenes, water, sky, etc. Second, the category of activities in urban public space studies using social media refers to the hashtags used to depict various human activities occurring within parks. These hashtags provide insights into the types of behaviors and engagements taking place in these spaces. Third, the category of experiences in urban public space studies using social media encompasses hashtags that reflect users’ subjective perceptions of the park. These hashtags provide insights into how individuals perceive and experience the parking space.

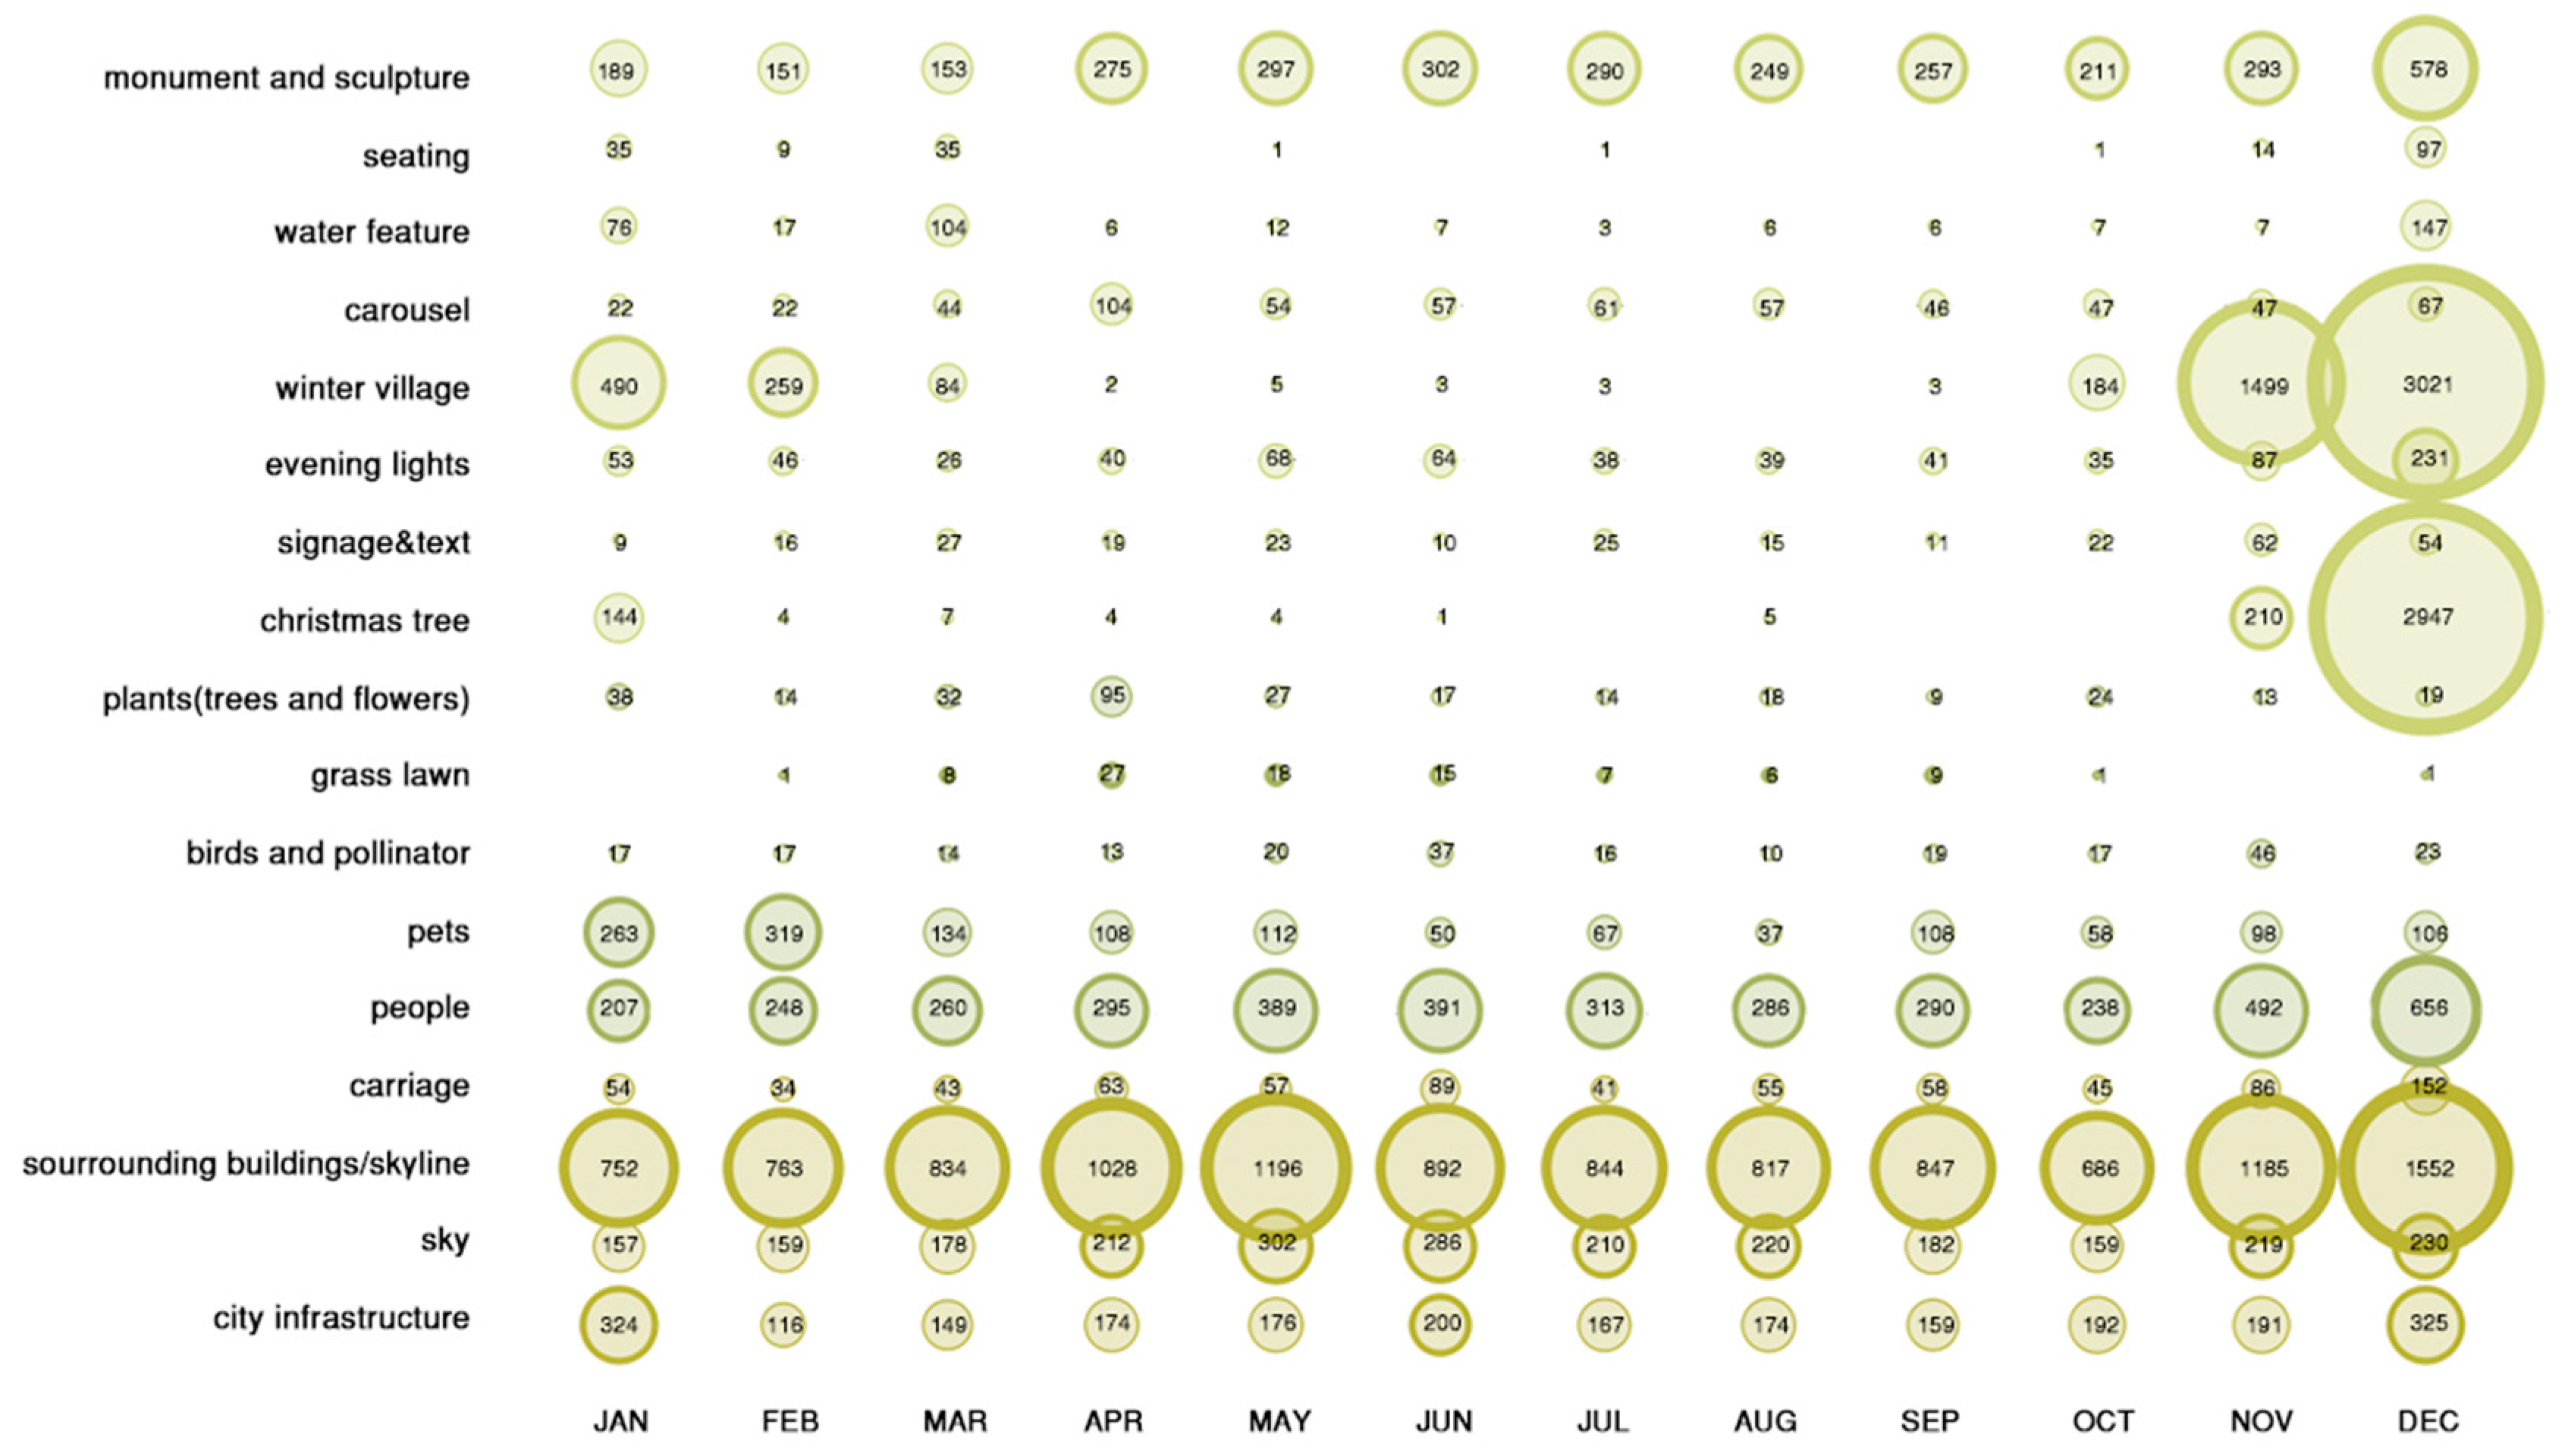
3.1.1. Monthly Popularity of Park Scenes

Figure 3 shows the monthly popularity for the key subcategories in the category of Scenes. The surrounding buildings/skyline, sky, and city infrastructure are major subcategories; however, these are not descriptions of the park itself. Winter villages and Christmas trees are most popular subcategories during the winter. People and pets are subcategories that are highly tagged throughout the year. The carousel is the most popular attraction amenity all year round. Evening lights also show a consistent amount every month, indicating the activity level and sense of safety of the park during nighttime.

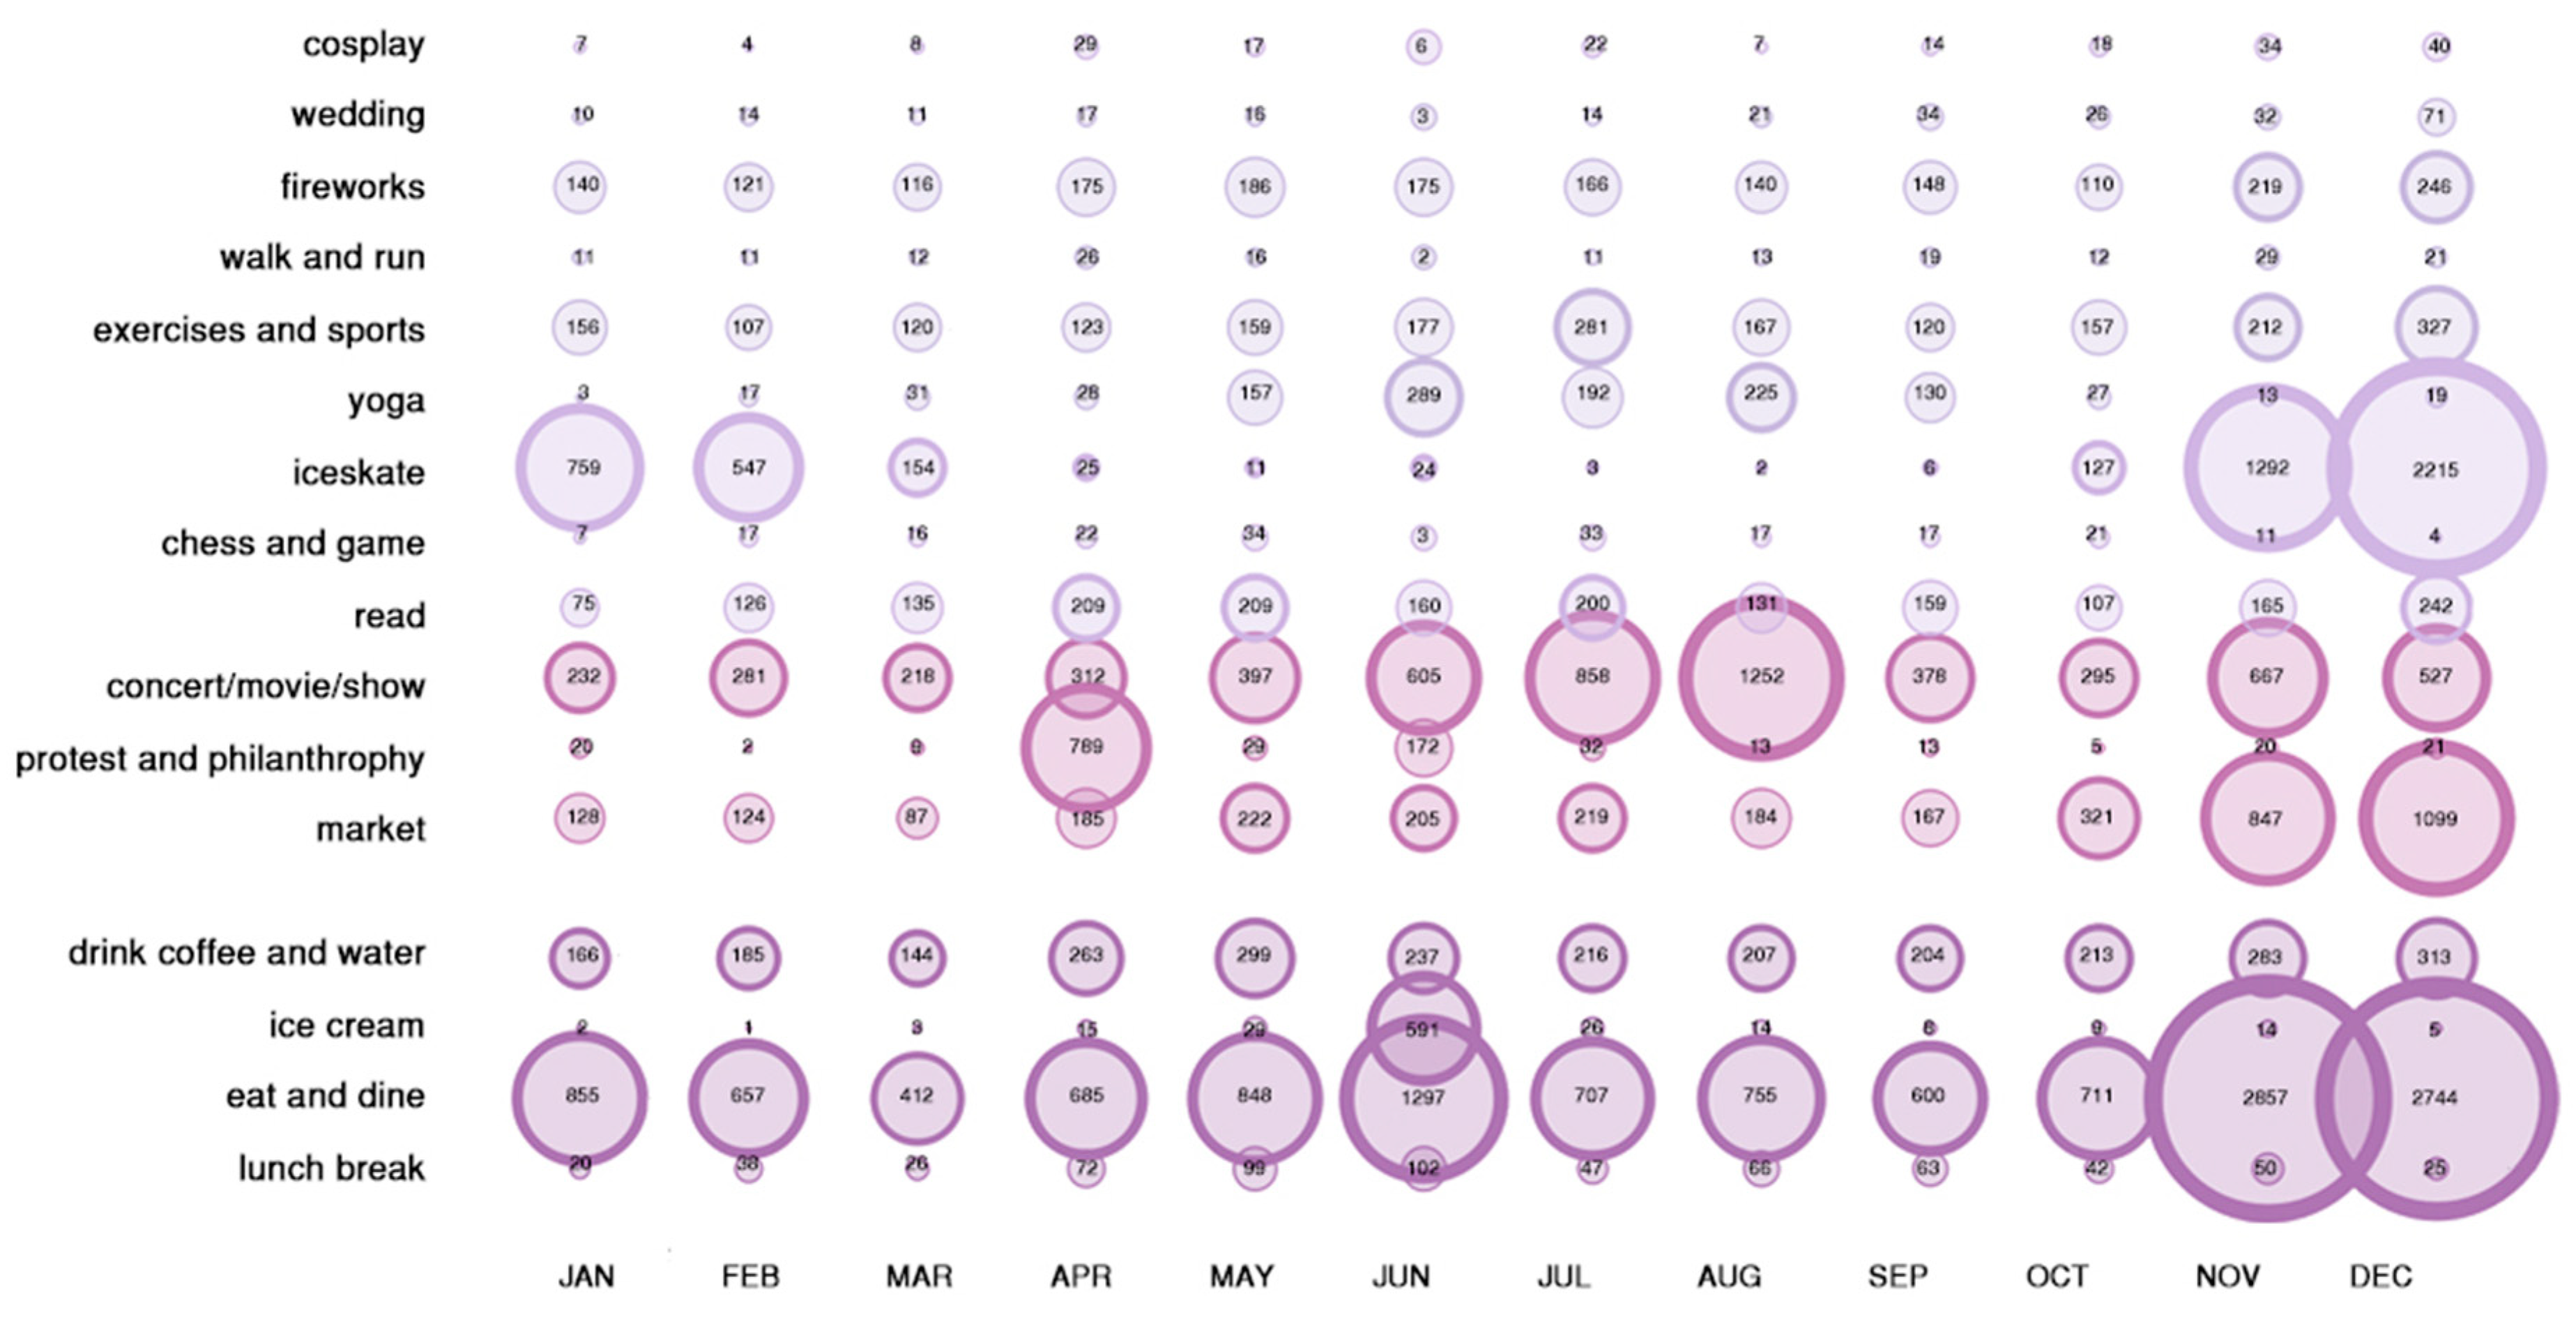
3.1.2. Monthly Popularity of Park Activities

The park activities are essential for the success of Bryant Park. Figure 4 shows the monthly distribution of the key subcategories in park activities. The eat and dine is the most popular sub-category in the park, and the other largely tagged subcategory in food and drink group is drink coffee and water. The subcategory of fireworks is a big attraction, though they do not necessarily occur within the park. Exercises and sports are reported in the park during all twelve months, showing that these activities regularly occur in the park. Ice skating in the winter and yoga in the summer form a pair of alternating seasonal activities. Read is also a strong subcategory that lasts the whole year. The high popularity of concerts/movies/shows, as well as markets, indicate the success of many organized big events that are held in all seasons, especially in the summer.

3.1.3. Monthly Popularity of Park Perceptions

In Figure 5, the hashtag occurrences in 10 key subcategories were reported. Relaxing and escaping from the subcategory of attachment and local pride have the highest annual frequencies in the group; thus, we see Bryant Park has brought positive emotions to people and cultivated a strong sense of community for the city. Sociability and publicity, relaxing and escaping, and discovery are also well-tagged by many. This indicates the success of Bryant Park for social life, mental health, and physical activities. Except for the subcategories of seasons and festive, all other subcategories present a generally consistent pattern throughout the year. The winter festivals in Nov, Dec, and Jan still significantly dominate other seasons, although New York City does have a variety of festivals all year around.

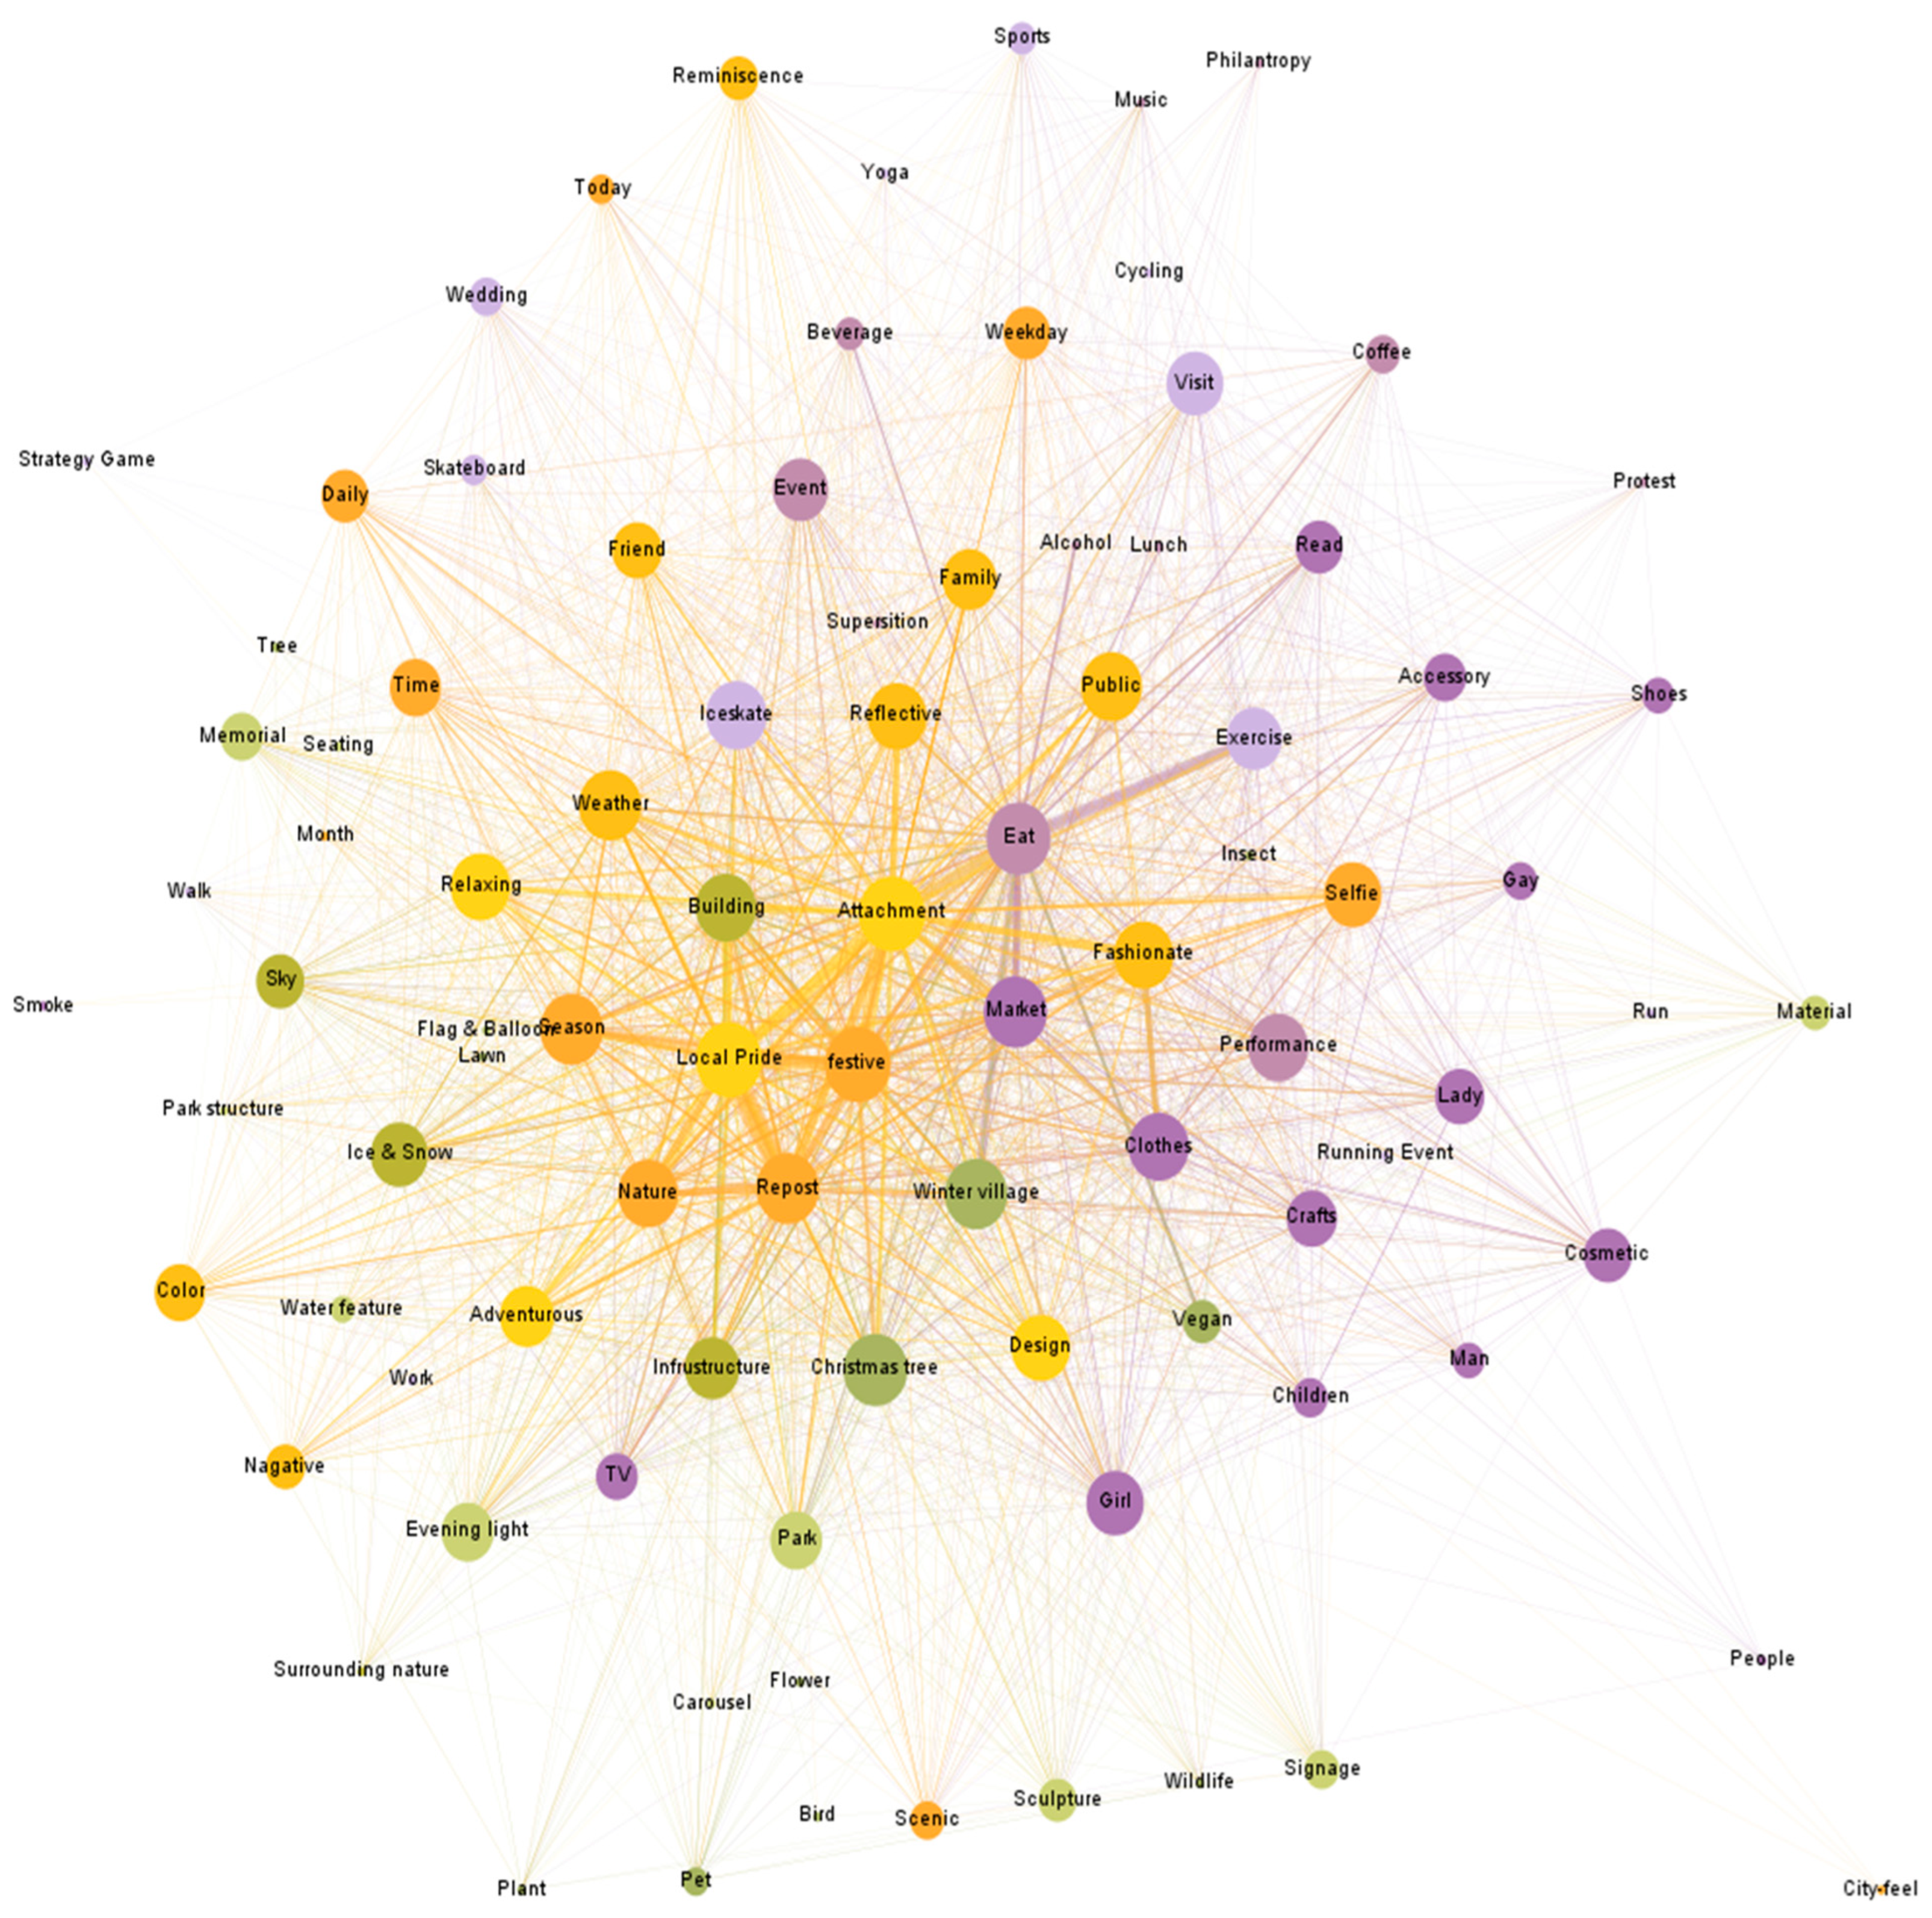
3.2. Social Network Visualization

Figure 6 presents the social network diagram of all subcategories for the whole year. By visually looking at the size and location of different nodes, we could understand the central experiences and their relationships in Bryant Park. Seven results were found in correspondence with the labels in Figure 6, as follows:
  • Subcategories associated with Time (season, year, month, weekday, day) are not a central perception in Bryant Park.
  • Scenes about surrounding environments such as subway, bus, and nearby skyscrapers are more important in the Bryant Park experiences than the scenes in the park itself.
  • We see a pattern that subcategories related to social life tend to appear in the center while environmental subcategories are usually located in the fringe area.
  • “People like to look at people”; people in the park are viewed and recorded in large amounts by other people in the park. Looking at people is also an important source of positive moods in the park.
  • Work and exercise are the central nodes in the network, indicating that they are the major service provided by the park.
  • Attachment, locality, city feel, and relaxing are core perceptions people experienced in the park.
  • Centralized in the network, organized collective activities are those which determine the success of the park.
Bryant Park has a wide variety of public programs that are scheduled throughout the year. While large events such as concerts/movies/shows drew lots of visitors, the subcategory of eat and dine is the most significant activity in the park (Figure 4). It is also a subcategory that has been mentioned as the central theme throughout the year. From our comparisons of the hashtag network between June and Dec, we see the subcategory node of eat stay in the central area as one of the most significant experiences, while the subcategory node of the concert only appears in the central area in June (Figure 7). The following is an explanation for Figure 7:
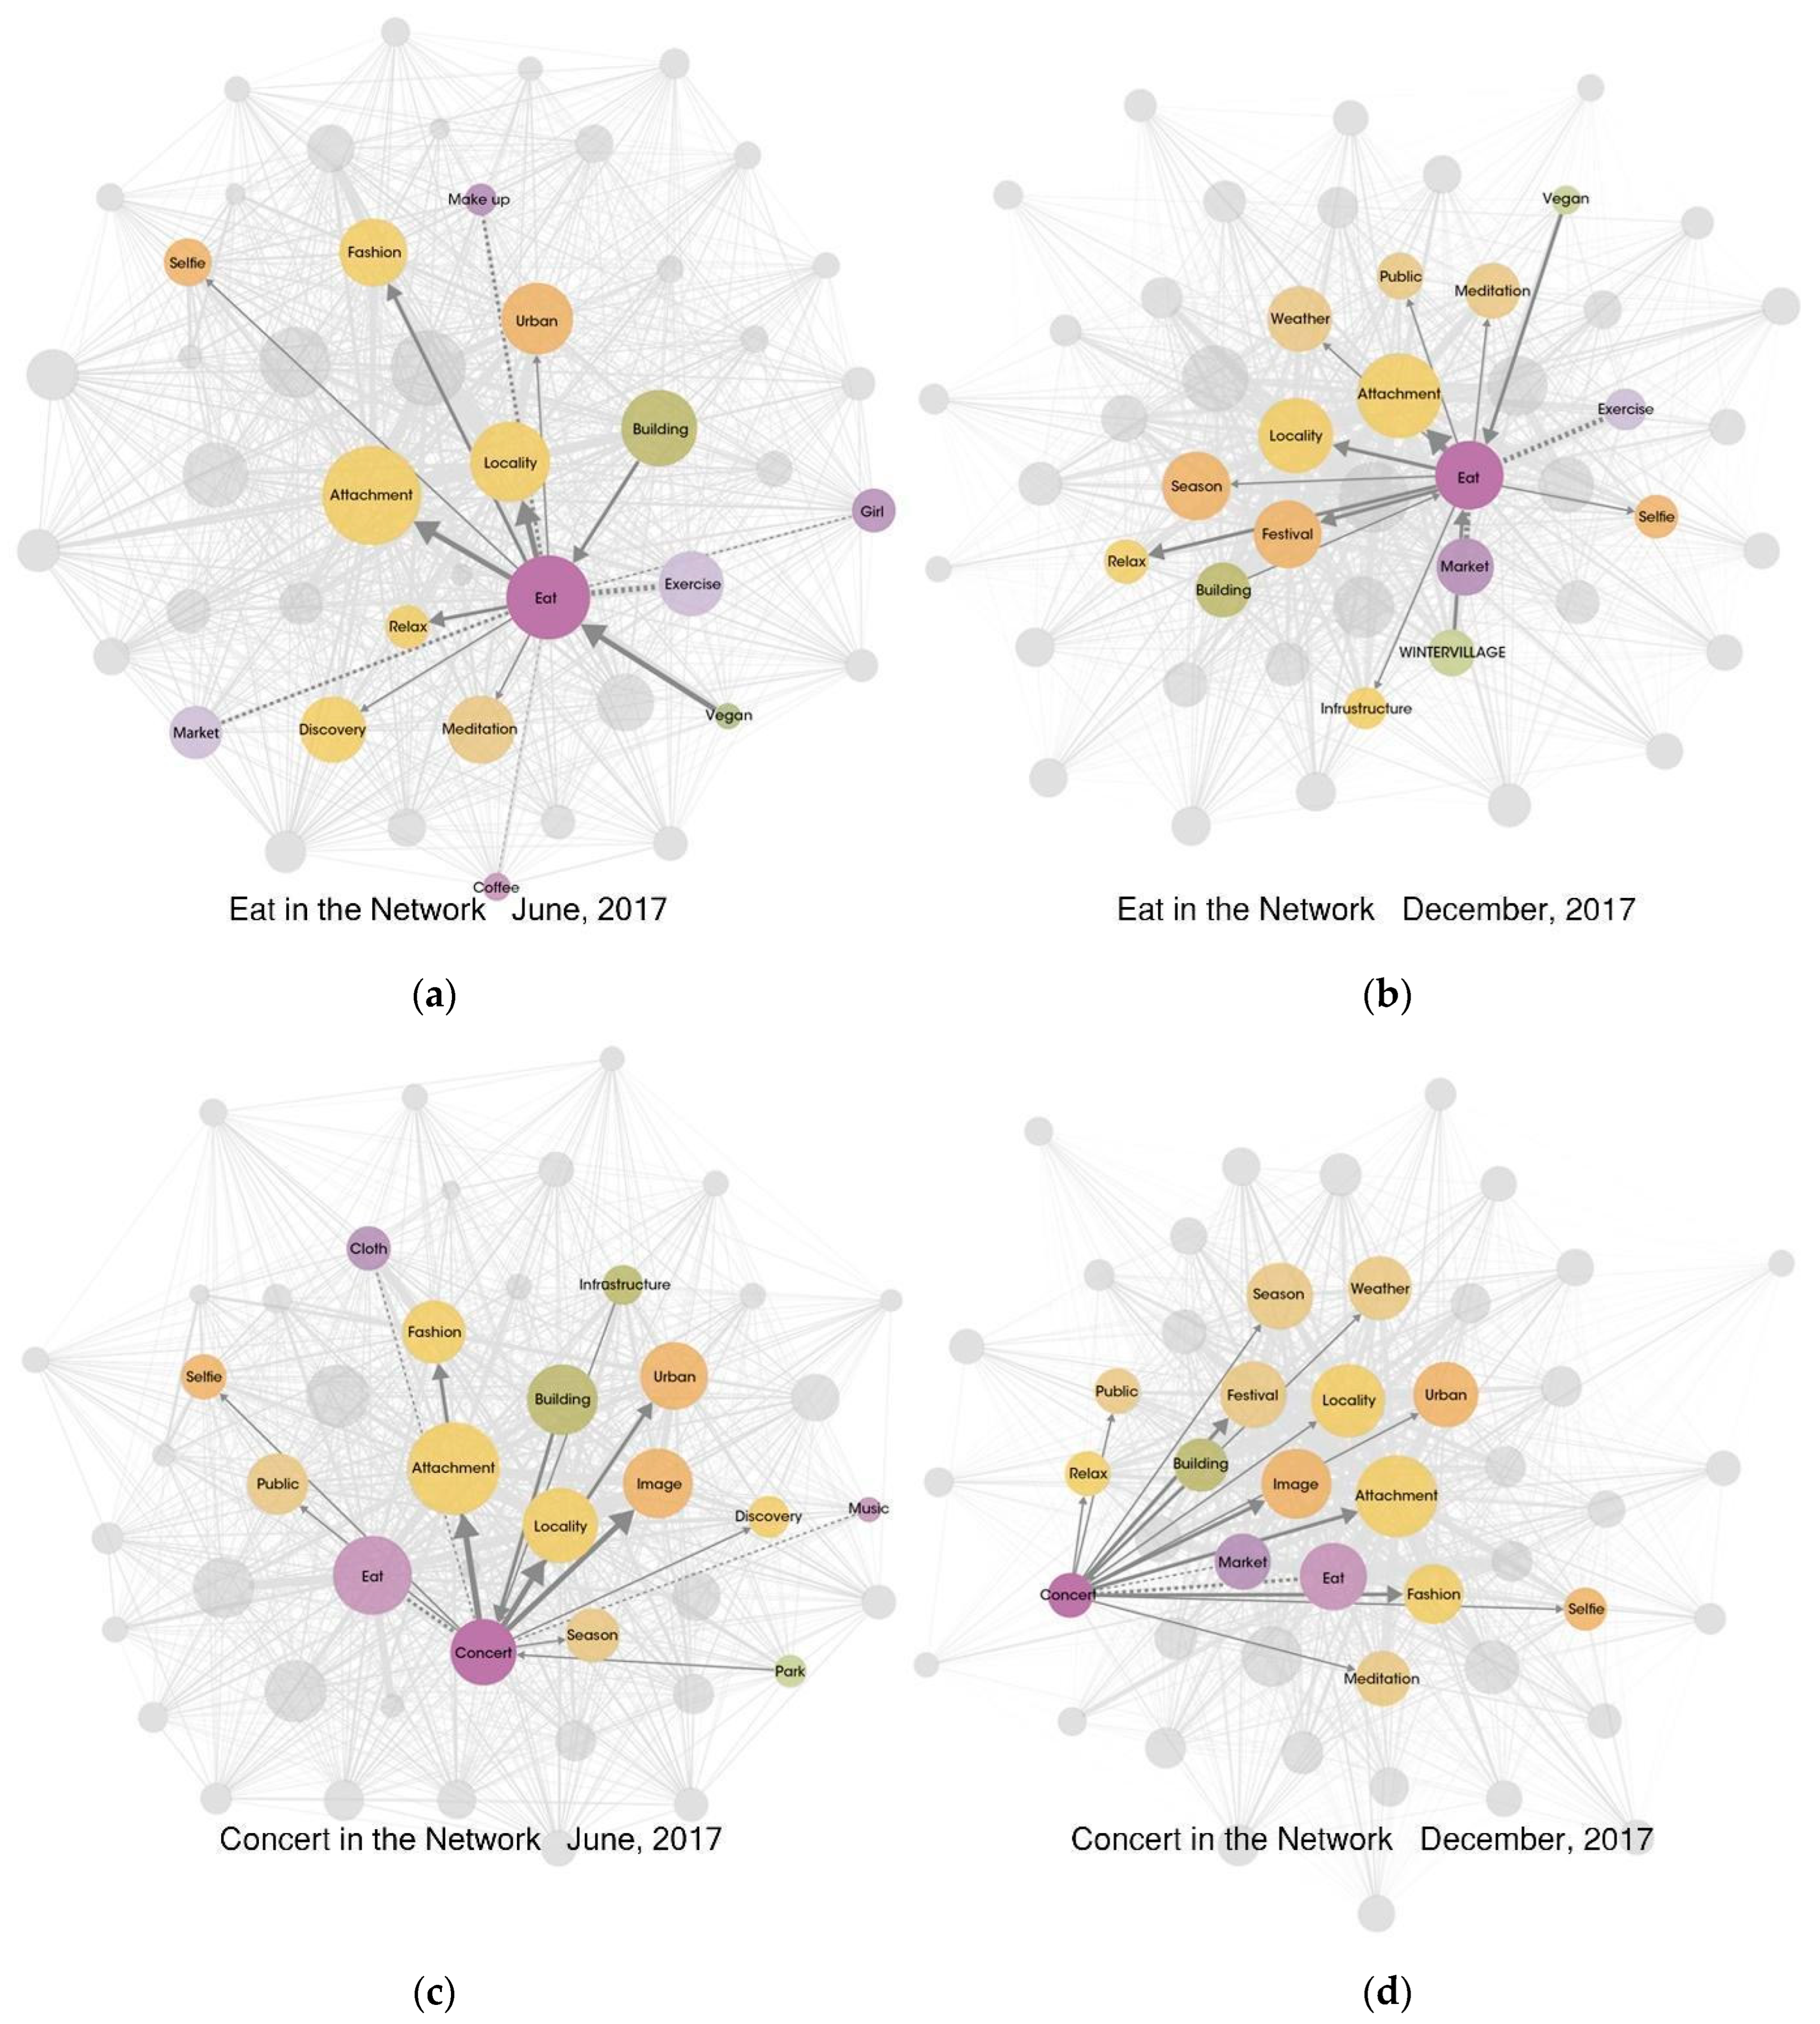
  • In June, “building” and “vegan” are the major park programs that are important to Eat in the park. The “big bubbles”, such as “attachment”, “locality”, and “relax” are the most reported experiences that linked with Eat. Other activities that are closely associated with Eat include “exercise”, “market”, “coffee”, “girl”, and “make up”.
  • In December, “building” and “winter village” are the major park programs that are important to Eat in the park. The “big bubbles”, such as “attachment”, “locality”, “season”, and “festival” are the most reported experiences that linked with Eat. Other activities that are closely associated with Eat include “exercise” and “market”.
  • In June, “building”, “park”, and “infrastructure” are the major park programs that are important to Concert in the park. The “big bubbles”, such as “attachment”, “locality”, “urban”, “fashion”, and “image” are the most reported experiences that linked with Concert. Other activities that are closely associated with Concert include “eat”, “cloth”, and “music”.
  • In December, “building” is the major park program that is important to Concert in the park. The “big bubbles”, such as “attachment”, “image”, and “festival” are the most reported experiences that linked with Concert. Other activities that are closely associated with Concert include “eat” and “market”.

4. Discussion

4.1. Overall Success

As an urban public park, Bryant Park was overall very successful in supporting public life for people. First, we see a high level of park engagement in our data. Assuming people who make Instagram posts are the ones who have gained meaningful and memorable experiences, Bryant Park demonstrated a strong connection to the people who have visited the park with annual data of 109,258 hashtags in 102,435 Instagram posts. This is a lot more than Seattle Freeway Park which shares a similar location of the city and downtown context but only has 1105 Instagram posts and 1823 hashtags each year [38]. Second, Bryant Park effectively delivered a variety of activities and programs to the public which makes it a great destination and place to thrive since users have a range of reasons (10+) to be there (“The Power of 10” n.d.). From the result of the Monthly popularity of Park Activities (Figure 4), 16 activity subcategories were shown in our datasets including social activities, health and game, large events, and food and drink. Many of these activities were tagged consistently throughout the year and corresponded to the public programs listed by Bryant Park Corporation (https://bryantpark.org/programs accessed on 1 July 2023). This high mention rate in social media indicates how park programs can influence and engage park users. Additionally, the presence of a subcategory of evening lights and city infrastructure in Figure 3 suggests a high quality of safety and accessibility which further ensured the success of park activities. Third, Bryant Park shows significant visitor satisfaction and attachment. From our results in the monthly popularity of park perceptions (Figure 5), there are very few negative emotions or expressions seen in our data. Attachment and festive are the most tagged subcategories. Many studies have demonstrated the mental health benefits of urban parks and green spaces [44,45]. In this context, our results align with these previous discoveries. Given the excellent high engagement level and park management, it is not surprising that Bryant Park made a significant contribution to the public well-being of New York City. Fourth, as integral parts that tie in with each other, the success of Bryant Park is not exclusive to the vitality of Midtown Manhattan. From our results in Figure 3, park users took many photos of the surrounding buildings, more than the scenes inside the park. People like the great skyline views from the park. On the other hand, they also have strong local pride (Figure 5) and attachment to the community they live in. Therefore, life in Bryant Park has become a representation of the life of New York City. This explains why we saw lots of posts where people hashtag the name of New York City instead of Bryant Park during our categorization work.

4.2. Food and Social Interactions

According to Southworth [46], food vendors, such as food markets, street cafes, food truck pods, etc., are crucial in supporting vibrant public life. These amenities are supplying demands which are not being met by the regular commercial establishment. As affordable and delicious food flourishes when combined with outdoor life and people, more people and businesses will come, and then attract even more people and businesses [47]. Bryant Park has a multitude of food and drink choices with different tastes and price levels. From the to-go kiosks, casual eateries, or elegant sit-down restaurants, the park could afford any needs of the public. Moreover, the 1000 lightweight movable chairs that could be freely moved around, the well-placed trees that provide a combination of shade and sun, and a large lawn area that creates views and hold large events offer even more options for the public and keep people stay in the park (‘Bryant Park’, n.d.).

5. Conclusions

This study presents the potential of using social media data to conduct POE studies for an urban public park. Public parks such as Bryant Park are a social platform that cater to numerous public needs. They are also constantly evolving as technology, culture, and the economy change. Therefore, many parks will develop their programs or spaces rather than stick with the initial park design concepts. To evaluate park performance effectively, it is necessary to conduct POE studies periodically to track and compare park usage and perceptions through time. With the limitations of the traditional methods such as survey, interviews, and site observation, our research shows the opportunities of using Instagram hashtag data as the proxy to investigate park experiences. The findings reveal the richness and complexity of visitor experiences through Instagram hashtag analysis, providing valuable insights into park usage and user perceptions. To further strengthen the methodology, future research could integrate on-site observations and surveys, while extending the analysis to longer timeframes for a more comprehensive understanding of human–environment relationships.
Traditional POE methods face challenges in widespread application to public spaces such as urban design. They are characterized by high human resource consumption, low response efficiency, and difficulties in collecting reliable data within a reasonable timeframe [21,22,23,24]. Our results of the popularity study reveal full-year patterns of scenes, activities, and perceptions that visitors tagged with more richness and complexity. Social network visualization informs the relationships of different scenes, activities, and perceptions through graph theory algorithms. In the future, the researchers could further address the robustness of the Instagram study by triangulating it with on-site observations and surveys. Additionally, the result of this study could be compared with data in a longer timeframe to find more reliable human–environment relationships. Meanwhile, this article makes notable contributions in terms of data accuracy, complexity, and applicability. By employing rigorous methodologies, the study ensures the accuracy of its findings, offering a more precise understanding of the scenes, activities, and perceptions associated with Bryant Park. Additionally, the research delves into the richness and diversity of visitor experiences, unraveling intricate interconnections within the park environment. This nuanced examination provides a deeper comprehension of the multifaceted aspects of park usage and user perceptions. Furthermore, the practical applicability of the study goes beyond previous efforts by enabling future researchers and designers to track evolving visitor needs and preferences, thus optimizing park design and management. Overall, this article represents a significant advancement in the field, leveraging social media data to enhance our understanding of urban public spaces and contribute to their improved design and utilization.

Author Contributions

Methodology, B.Z.; Software, S.G.; Validation, D.L.; Formal analysis, Y.S., Z.Z., Y.W. and W.W.; Writing—review & editing, Q.Y. and Y.W.; Visualization, Q.Y.; Supervision, X.S. All authors have read and agreed to the published version of the manuscript.

Funding

This research received no external funding.

Institutional Review Board Statement

Not applicable.

Informed Consent Statement

Not applicable.

Data Availability Statement

Not applicable.

Conflicts of Interest

The authors declare no conflict of interest.

References

  1. De Vries, S.I.; Hopman-Rock, M.; Bakker, I.; Hirasing, R.A.; Van Mechelen, W. Built Environmental Correlates of Walking and Cycling in Dutch Urban Children: Results from the SPACE Study. Int. J. Environ. Res. Public Health 2010, 7, 2309–2324. [Google Scholar] [CrossRef] [PubMed] [Green Version]
  2. Plunz, R.A.; Zhou, Y.; Vintimilla, M.I.C.; Mckeown, K.; Yu, T.; Uguccioni, L.; Sutto, M.P. Twitter sentiment in New York City parks as measure of well-being. Landsc. Urban Plan. 2019, 189, 235–246. [Google Scholar] [CrossRef]
  3. Fongar, C.; Aamodt, G.; Randrup, T.B.; Solfjeld, I. Does Perceived Green Space Quality Matter? Linking Norwegian Adult Perspectives on Perceived Quality to Motivation and Frequency of Visits. Int. J. Environ. Res. Public Health 2019, 16, 2327. [Google Scholar] [CrossRef] [Green Version]
  4. Thompson, C.W. Urban open space in the 21st century. Landsc. Urban Plan. 2002, 60, 59–72. [Google Scholar] [CrossRef]
  5. World Health Organization. Regional Office for Europe towards More Physical Activity in Cities: Transforming Public Spaces to Promote Physical Activity—A Key Contributor to Achieving the Sustainable Development Goals in Europe; World Health Organization, Regional Office for Europe: Barcelona, Spain, 2017.
  6. Van Herzele, A.; Wiedemann, T. A monitoring tool for the provision of accessible and attractive urban green spaces. Landsc. Urban Plan. 2003, 63, 109–126. [Google Scholar] [CrossRef]
  7. Ries, A.V.; Voorhees, C.C.; Roche, K.M.; Gittelsohn, J.; Yan, A.F.; Astone, N.M. A Quantitative Examination of Park Characteristics Related to Park Use and Physical Activity Among Urban Youth. J. Adolesc. Health 2009, 45, S64–S70. [Google Scholar] [CrossRef] [PubMed]
  8. Mehta, V. Evaluating Public Space. J. Urban Des. 2013, 19, 53–88. [Google Scholar] [CrossRef]
  9. Gehl, J. Life between Buildings: Using Public Space; The Danish Architectural Press: Copenhagen, Denmark, 2011. [Google Scholar]
  10. Malkoc, E.; Ozkan, M.B. Post-occupancy Evaluation of a Built Environment: The Case of Konak Square (İzmir, Turkey). Indoor Built Environ. 2010, 19, 422–434. [Google Scholar] [CrossRef]
  11. Leaman, A.; Bordass, B. Assessing building performance in use 4: The Probe occupant surveys and their implications. Build. Res. Inf. 2001, 29, 129–143. [Google Scholar] [CrossRef]
  12. Roberts, C.J.; Edwards, D.J. Post-occupancy evaluation: Identifying and mitigating implementation barriers to reduce environmental impact. J. Clean. Prod. 2022, 374, 133957. [Google Scholar] [CrossRef]
  13. Geng, Y.; Ji, W.; Wang, Z.; Lin, B.; Zhu, Y. A review of operating performance in green buildings: Energy use, indoor environmental quality and occupant satisfaction. Energy Build. 2019, 183, 500–514. [Google Scholar] [CrossRef]
  14. Zuo, J.; Yuan, X.L.; Pullen, S. Post Occupancy Evaluation Study in Hospital Buildings—A Pilot Study. Appl. Mech. Mater. 2011, 94–96, 2248–2256. [Google Scholar] [CrossRef]
  15. Aburawis, A.A.M.; Yorukoglu, P.N.D. An integrated framework on soundscape perception and spatial experience by adapting post-occupancy evaluation methodology. Build. Acoust. 2018, 25, 3–16. [Google Scholar] [CrossRef] [Green Version]
  16. Cooper, I. Post-occupancy evaluation-where are you? Build. Res. Inf. 2001, 29, 158–163. [Google Scholar] [CrossRef]
  17. Kalantari, S.; Shepley, M. Psychological and social impacts of high-rise buildings: A review of the post-occupancy evaluation literature. Hous. Stud. 2021, 36, 1147–1176. [Google Scholar] [CrossRef]
  18. Paraskevopoulou, A.T.; Kamperi, E. Design of hospital healing gardens linked to pre- or post-occupancy research findings. Front. Arch. Res. 2018, 7, 395–414. [Google Scholar] [CrossRef]
  19. Boffi, M.; Pola, L.G.; Fermani, E.; Senes, G.; Inghilleri, P.; Piga, B.E.A.; Stancato, G.; Fumagalli, N. Visual post-occupancy evaluation of a restorative garden using virtual reality photography: Restoration, emotions, and behavior in older and younger people. Front. Psychol. 2022, 13, 927688. [Google Scholar] [CrossRef]
  20. Lygum, V.L.; Poulsen, D.V.; Djernis, D.; Djernis, H.G.; Sidenius, U.; Stigsdotter, U.K. Post-Occupancy Evaluation of a Crisis Shelter Garden and Application of Findings Through the Use of a Participatory Design Process. Health Environ. Res. Des. J. 2018, 12, 153–167. [Google Scholar] [CrossRef]
  21. Cooper Marcus, C. Why Don’t Landscape Architects Perfom More Poes? Letter to the Editor. J. Landsc. Archit. 2008, 98, 16–18. [Google Scholar]
  22. Wang, L.; Ge, M.; Chen, N.; Ding, J.; Shen, X. An Evaluation Model of Riparian Landscape: A Case in Rural Qingxi Area, Shanghai. Land 2022, 11, 1512. [Google Scholar] [CrossRef]
  23. Kim, H.J.; Chae, B.K.; Park, S.B. Exploring public space through social media: An exploratory case study on the High Line New York City. Urban Des. Int. 2018, 23, 69–85. [Google Scholar] [CrossRef]
  24. Scrimshaw, N.S.; Gleason, G.R. Qualitative and Quantitative: Two Styles of Viewing the World or Two Categories of Reality? RAP, Rapid Assessment Procedures: Qualitative Methodologies for Planning and Evaluation of Healthrelated Programmes. Available online: https://archive.unu.edu/unupress/food2/UIN08E/UIN08E06.HTM#3.%20qualitative%20and%20quantitative:%20two%20styles%20of%20viewing%20the%20world%20or%20two%20categori (accessed on 2 June 2023).
  25. Dobson, A.S. Postfeminist Digital Cultures: Femininity, Social Media, and Self-Representation; Springer: Berlin/Heidelberg, Germany, 2015; ISBN 1-137-40839-1. [Google Scholar]
  26. De Waal, R.; Kempenaar, J.; van Lammeren, R.; Stremke, S. Application of Social Media in a Regional Design Competition: A Case Study in the Netherlands. In Proceedings of the 14th International Conference on Information Technologies in Landscape Architecture, DLA Conference 2013, Bernburg, Germany, 6–8 June 2013; pp. 186–200. [Google Scholar]
  27. Evans-Cowley, J.S.; Griffin, G. Microparticipation with Social Media for Community Engagement in Transportation Planning. Transp. Res. Rec. J. Transp. Res. Board 2012, 2307, 90–98. [Google Scholar] [CrossRef]
  28. Gal-Tzur, A.; Grant-Muller, S.M.; Kuflik, T.; Minkov, E.; Nocera, S.; Shoor, I. The potential of social media in delivering transport policy goals. Transp. Policy 2014, 32, 115–123. [Google Scholar] [CrossRef]
  29. Zannat, K.E.; Choudhury, C.F. Emerging Big Data Sources for Public Transport Planning: A Systematic Review on Current State of Art and Future Research Directions. J. Indian Inst. Sci. 2019, 99, 601–619. [Google Scholar] [CrossRef] [Green Version]
  30. Anik, M.A.H.; Sadeek, S.N.; Hossain, M.; Kabir, S. A framework for involving the young generation in transportation planning using social media and crowd sourcing. Transp. Policy 2020, 97, 1–18. [Google Scholar] [CrossRef]
  31. Holsapple, C.; Hsiao, S.-H.; Pakath, R. Business Social Media Analytics: Definition, Benefits, and Challenges. 2014. Available online: https://www.researchgate.net/publication/261472056_Business_Social_Media_Analytics_Definition_Benefits_and_Challenges (accessed on 1 July 2023).
  32. Kaplan, A.M.; Haenlein, M. Users of the World, Unite! The Challenges and Opportunities of Social Media. Bus. Horiz. 2010, 53, 59–68. [Google Scholar] [CrossRef]
  33. Schofield, P. Big data in mental health research–do the Ns justify the means? Using large data-sets of electronic health records for mental health research. BJPsych Bull. 2017, 41, 129–132. [Google Scholar] [CrossRef] [Green Version]
  34. Roberts, H.; Sadler, J.; Chapman, L. Using Twitter to investigate seasonal variation in physical activity in urban green space. Geo Geogr. Environ. 2017, 4, e00041. [Google Scholar] [CrossRef]
  35. Kovacs-Gyori, A.; Ristea, A.; Havas, C.; Resch, B.; Cabrera-Barona, P. #London2012: Towards Citizen-Contributed Urban Planning Through Sentiment Analysis of Twitter Data. Urban Plan. 2018, 3, 75–99. [Google Scholar] [CrossRef]
  36. Dunkel, A. Visualizing the perceived environment using crowdsourced photo geodata. Landsc. Urban Plan. 2015, 142, 173–186. [Google Scholar] [CrossRef]
  37. Zhou, X.; Wang, M.; Li, D. From stay to play–A travel planning tool based on crowdsourcing user-generated contents. Appl. Geogr. 2017, 78, 1–11. [Google Scholar] [CrossRef]
  38. Song, Y.; Zhang, B. Using social media data in understanding site-scale landscape architecture design: Taking Seattle Freeway Park as an example. Landsc. Res. 2020, 45, 627–648. [Google Scholar] [CrossRef]
  39. Zimring, C.M.; Reizenstein, J.E. Post-Occupancy Evaluation. Environ. Behav. 1980, 12, 429–450. [Google Scholar] [CrossRef]
  40. Kennett, E. Post Occupancy Evaluations|WBDG-Whole Building Design Guide. Available online: https://www.wbdg.org/resources/post-occupancy-evaluations (accessed on 2 June 2023).
  41. Shen, X. Identifying the role of technology within the discipline of 21st century landscape architecture. Des. J. 2023, 26, 351–361. [Google Scholar] [CrossRef]
  42. Song, Y.; Yang, R.; Lu, H.; Fernandez, J.; Wang, T. Why do we love the high line? A case study of understanding long-term user experiences of urban greenways. Comput. Urban Sci. 2023, 3, 18. [Google Scholar] [CrossRef]
  43. Bryant Park. Available online: https://www.pps.org/article/greatesthits2 (accessed on 2 June 2023).
  44. Lin, Z.; Wang, Y.; Song, Y.; Huang, T.; Gan, F.; Ye, X. Research on Ecological Landscape Design and Healing Effect Based on 3D Roaming Technology. Int. J. Environ. Res. Public Health 2022, 19, 11406. [Google Scholar] [CrossRef]
  45. Shen, X.; Ge, M.; Handel, S.N.; Wang, W.; Jin, Z.; Kirkwood, N.G. Advancing environmental design with phytoremediation of brownfield soils using spontaneous invasive plants. Sci. Total Environ. 2023, 883, 163635. [Google Scholar] [CrossRef]
  46. Southworth, M. Public Life, Public Space, and the Changing Art of City Design. J. Urban Des. 2013, 19, 37–40. [Google Scholar] [CrossRef]
  47. Whyte, W.H. The Social Life of Small Urban Spaces. Urban Life 1980, 10, 466–468. [Google Scholar] [CrossRef]
  48. STATISTA. Instagram-Statistics & Facts. STATISTA. 2023. Available online: https://www.statista.com/topics/1882/instagram/#topicOverview (accessed on 1 July 2023).
  49. Manikonda, L.; Meduri, V.V.; Kambhampati, S. Tweeting the mind and instagramming the heart: Exploring differentiated content sharing on social media. In Proceedings of the International AAAI Conference on Web and Social Mediap, Cologne, Germany, 17–20 May 2016; Volume 10, pp. 639–642. [Google Scholar]
  50. Tenkanen, H.; Di Minin, E.; Heikinheimo, V.; Hausmann, A.; Herbst, M.; Kajala, L.; Toivonen, T. Instagram, Flickr, or Twitter: Assessing the usability of social media data for visitor monitoring in protected areas. Sci. Rep. 2017, 7, 17615. [Google Scholar] [CrossRef] [Green Version]
Figure 1. An example of collecting and categorizing hashtags.
Land 12 01403 g001
Figure 2. Instagram post study. (a) The monthly number of posts; (b) Monthly number of hashtags.
Land 12 01403 g002
Figure 3. Monthly popularity of park scenes. Note that for better illustration, some subcategories are merged.
Land 12 01403 g003
Figure 4. Monthly popularity of activities.
Land 12 01403 g004
Figure 5. Monthly popularity of park perceptions.
Land 12 01403 g005
Figure 6. Social network diagram of all subcategories.
Land 12 01403 g006
Figure 7. Comparisons of hashtag network (Eat and Concert) between June and December. (a) Hashtag Eat network in June 2017; (b) Hashtag Eat network in December 2017; (c) Hashtag Concert network in Jun 2017; (d). Hashtag concert network in December 2017.
Land 12 01403 g007
Table 1. The categories and subcategories data extracted from Instagram.
CategorySubcategoryCategorySubcategoryCategorySubcategory
ActivitiesCosplay/Imaginative activitesPerceptionsAttachmentScenesParks
Travel
Photography
Relax/Escape Image view/Perspective/Emphasis
Wedding Discovery Sculpture/Art
Fireworks Meditation/Reflection Park Structures
Exercise Reminiscence Seating
Walk Negative Water feature
Run Family Signage/Text
Yoga Sociality Evening Lights
Sports Friend Materials
Cycle Public Monument/Memorial
Enjoy/Play/Chess Me/Selfie/Face/Hair Carousel
Skateboard Weather Christmas Tree
Iceskate Ice/Show Winter village
Social event communication Seasons Vegan
Solo music dance Festival Flag/Balloon
Concert/Party Time in a day Color
Fundraising philantropy Weekdays Wildlife
Supersition activities Today Pet
Political events/Protest Month of year Birds
Movie/Show Year Wildlife/Insects/Pollinator
Food/Eat Daily Plants
Coffee/Cafe drinking City feeling scene Trees
Beer drinking/Wine USA Flowers
Soda water/Drink NY Lawn/Grass
Picnic NYC Arch/Buildings/Skyline
Food truck Manhattan Sky
Lunch/Lunch break/Lunch box Bryant Park Artificial city infrastructure
Ice cream Midtown Surrounding nature
Reading/Library/Book/Magazine Central Park People
Sale/Market Eastcoast Children
Painting drawing/Sale art Olmsted Eldly participants
Make up Nature Gay
Hat/Jewelry/Glasses Design/Designers/Design sense Pedestrian
Canapies/Marijana Locality Girl
Smoke Reflective Lady
Clothes
Shoes
Man
Carriage
Disclaimer/Publisher’s Note: The statements, opinions and data contained in all publications are solely those of the individual author(s) and contributor(s) and not of MDPI and/or the editor(s). MDPI and/or the editor(s) disclaim responsibility for any injury to people or property resulting from any ideas, methods, instructions or products referred to in the content.

