

Comparative Resilience Evaluation—Case Study for Six Cities in China, Europe, and the Americas


1
Advancing Systems Analysis, International Institute for Applied Systems Analysis, A-2361 Laxenburg, Austria
2
Department of Biological Sciences, Towson University, Towson, MD 21252, USA
3
Department of Environmental Studies, Masaryk University, 601 77 Brno, Czech Republic
*
Author to whom correspondence should be addressed.
Land 2023, 12(6), 1182; https://doi.org/10.3390/land12061182
Submission received: 12 May 2023
/
Revised: 30 May 2023
/
Accepted: 1 June 2023
/
Published: 3 June 2023
(This article belongs to the Special Issue Urban Resilience and Urban Sustainability under Climate Change)
Abstract
:The historical development of the urban realm has brought marvelous benefits to humankind, which has profited from the infrastructure, services, and social networks provided by cities. Nonetheless, considering current and future risks, understanding how cities can absorb impacts and reorganize their structure while keeping their identities is fundamental and timely. In other words, understanding how to promote resilience is crucial. This study developed a comparative urban resilience index (CURI) formed by 29 indicators and applied it to case studies in Europe, China, and the Americas (Malmö, Vienna, Beijing, Shanghai, Baltimore, and São Paulo). An innovative identity dimension was built to embrace the cultural traits of studied cities. Results point to a systemic property of CURI when comparing cities in both timeframes (2000 and 2020). In addition, two groups were formed: Malmö, Beijing, and Baltimore increased their resilience due to higher performance in at least two dimensions; Shanghai, Vienna, and São Paulo decreased their resilience due to lower performance in at least three dimensions. Ranking the data in terms of the benchmark promoted a quick understanding of which city is the “best in class” for each dimension, creating a clear way forward for other cities to follow.
1. Introduction
The global population is growing and becoming concentrated in cities, which 56% of humans inhabited in 2020 [1]. Projections for a world population of 9.1 to 9.4 billion in 2050 [2] indicate that cities will concentrate more people and, therefore, questions about the sustainability, ecological impacts, and resilience of this urban development model are ubiquitous. It is necessary to discuss how to make the urban environment in balance with the natural environment and, at the same time, more livable and resilient for its human inhabitants.
Resilience in Ecological systems was first proposed by Holling [3], and since then, it has grown exponentially as a research and a practitioner’s field [4]. In addition, resilience is becoming a mainstream concept that complements the idea of sustainability or even replaces the latter in some discourses [5]. In this intense history, resilience was conceptualized in different ways, accommodating the initial idea into different fields and uses. This flexibility, although convenient, caused concerns about its capacity to analyze ecological and social-ecological systems [6]. Therefore, despite the importance of helping society to understand and face contemporary risks [7,8], there are criticisms about the definition of the concept, the lack of representation of the social sciences, the applicability and integrative capacity to build on the social and ecological sciences [9,10,11].
In addition, some critics come to the scope of the resilience analysis, while it can focus on a single type of shock, such as floods or heatwaves, versus more general undefined resilience that would embrace multiple effects coming from climate change, technological failures, resources shortages [5] or interactions between these elements in multiple timeframes and scales. Therefore specifying the scale and period for which the resilience analysis is being done is fundamental [12].
Recently, several attempts were made to integrate data into a replicable index applicable to the urban realm [13,14,15,16,17,18] without providing an exhaustive list. These initiatives embraced the multiple dimensions of the city environment related to resilience, with emphasis on infrastructure [17], water supply [19], COVID-19 epidemic [20] integrated social-ecological systems [16], and others. Some of these works were operationalized in a very simple and smart form [15,21]; others had their variables integrated linearly into one index [22,23,24,25], which might be discussed vis a vis the possibility of full substitutability of their variables as stated in the discussion of strong vs. weak sustainability [26]; most of these works were based on one or a couple of cities with few exceptions for comparative cases (e.g., Suárez et al., 2016) [5]. However, what makes the present work timely and innovative is, first, the understanding of resilience in cities as the property of a social-ecological system, an emergent trait of society and nature taken as coupled through a complex network of intertwined links and feedback between its elements; second, the index is built from the adoption of the concept of resilience as seeing the “system as adapting but keeping its identity” [4]:
Resilience is the capacity of a system to absorb disturbance and reorganize while undergoing change so as to still retain essentially the same function, structure, and feedback, and therefore identity, that is, the capacity to change in order to sustain identity; resilience is a dynamic concept focusing on how to persist with change [27,28], how to evolve with change.
In terms of urban planning, the focus has moved from a “regional integration, social welfare, and urban renaissance” mainstream in the 1980s and 1990s to a broader perspective, pointing to “participatory processes, political economy and global cities” [29]. These new guidelines show an alignment of urban planning to global concerns, from which smart cities, urban green spaces, and resilience become fundamental contributions. Furthermore, many cities created plans to adapt to climate change [30], started reformulations of the transport system [31], health [32], and other dimensions that showed great results in terms of social wellbeing (see the discussion section), but also enhanced urban resilience. Thus, the aim of the present paper is to present a form of measuring resilience that facilitates cities to embrace this dimension of planning and compare their performance with other cities in time. The index proposed here comes from a systematic understanding of resilience and embraces an identity/cultural dimension, both of which are timely novelties in the field. Lastly, the approach is designed to be mathematically feasible, facilitating its replicability and promoting comparability between cities and with the same city over time.
Identity as Culture
A clear definition of the identity term is not only absent in mainstream resilience literature [4,27,28] but also a challenging task [33]. Some clues of how it emerges point to the idea of identity in a social-ecological system to be built from the social subsystem primarily, highlighting the aspect of culture as the main attribute related to a social-ecological system’s (SES) identity. In this case, the ecological subsystem appears as a complementary role to the social realm. Culture is implied from the interactions of individuals, communities, and societies, embracing language, meaning, tradition, and institutions:
Some authors [33] call attention to the necessity to observe the continuity along time and space of the “dynamical relations that determine systems identity by binding the system together.” That necessity emerges due to the evolutionary character of identity and from the necessity of recognition of this identity over time, despite these changes. During the dynamic development of an urban socio-economic system, it will go through “structure-preserving” transformations, maintaining its core functions and identity. Moreover, as an open and adaptive system, it must also engage in “wholeness-extending” transformations [34] such that it links to other complex adaptive systems through trade and exchange of resources, people, and information in a socio-ecological, evolutionary dance. The authors [33] claim that the “system’s identity resides in the continued presence, both space and time, of key components and key relationships.” In this paper, we understand the evolutionary continuity of identity and the set of key relationships and components to be represented by culture [35,36,37] that are maintained or discarded over time and space through the role of culture-related institutions and focus our assessment of identity in culture-related indicators. In other words, the present work collaborates with the view of culture as helping transcend the mainstream economic/environmental constructs regarding sustainability and forming the building blocks of identity [38].
Assessing identities at the societal level is not trivial. First, there is no official identity for a city or society. As cities and societies are formed by an amalgam of peoples, nationalities, cultures, genders, and ethnicities, assuming one official culture is to exclude the others. Extrapolating the identity concept, at one end, one would meet the individual self-determined identity (essentialists), and on the other, the culturally constructed social identity, where the social group determines the individual identity (constructivists) [39]. In addition, identities can also change over time, tensioned by new group influences and education, influenced by the wholeness-extending tendencies mentioned above. Identity, specifically the recognition of different identities, also brings the idea of justice to the center of the debate, considering the relevance of recognition as a condition sine qua non for justice [40].
We adopted the concept of identity at the collective level: plural, cross-cutting, live, and divided [39]. More broadly: cultures are groups of people who share knowledge, beliefs, norms, and behaviors [41]. Despite all the inconsistencies regarding the identity concept, “shared meanings” or a semiotic perspective for identity (or a “pragmatic theory of the self” as stated by Wiley [42] led this research in terms of embracing identity in the resilience analysis. In other words, we used a high level of generality to integrate the identity dimension in the comparative resilience analysis of our case studies, and discussed this applicability.
Much has been made in terms of culture/identity indicators [43,44], ranking [45], sustainability [46], and urban identity [47], and also the field of sociology of culture [48] provides qualitative as well as quantitative measurements techniques that were considered as proxies to inform the current resilience analysis about the identity assessment on a city level. A comprehensive review of culture/identity indicators can be found in Ortega-Villa & Ley-Garcia [49] and extrapolates the scope of the present paper.
At last, measuring culture has always been controversial. The discussion starts with the very definition of culture and identity and moves into the swamp of how the theories are related to the methods, what aspects of the meaningful, rich environment can be captured by a numeric indicator, and most important: what we lose and gain when we operationalize culture via such imperfect calibrations [48]. We echo the authors that measuring culture is reductionist, as current methods are just scratching the complexity of this construct; nonetheless, ignoring culture and identity in resilience analysis is worse than measuring it with high uncertainty (see Section 4. Discussion).
The present paper thus aims at two goals: first, to challenge these difficulties in both resilience and culture objective measurements to present an intersection between the identity-as-culture realm with the social-ecological perspective of resilience; and second, to develop a comparative study within six cities (Malmo, Vienna, Beijing, Shanghai, Baltimore, and São Paulo) in terms of resilience of the urban system to climate change.
2. Materials and Methods
2.1. Location of the Study
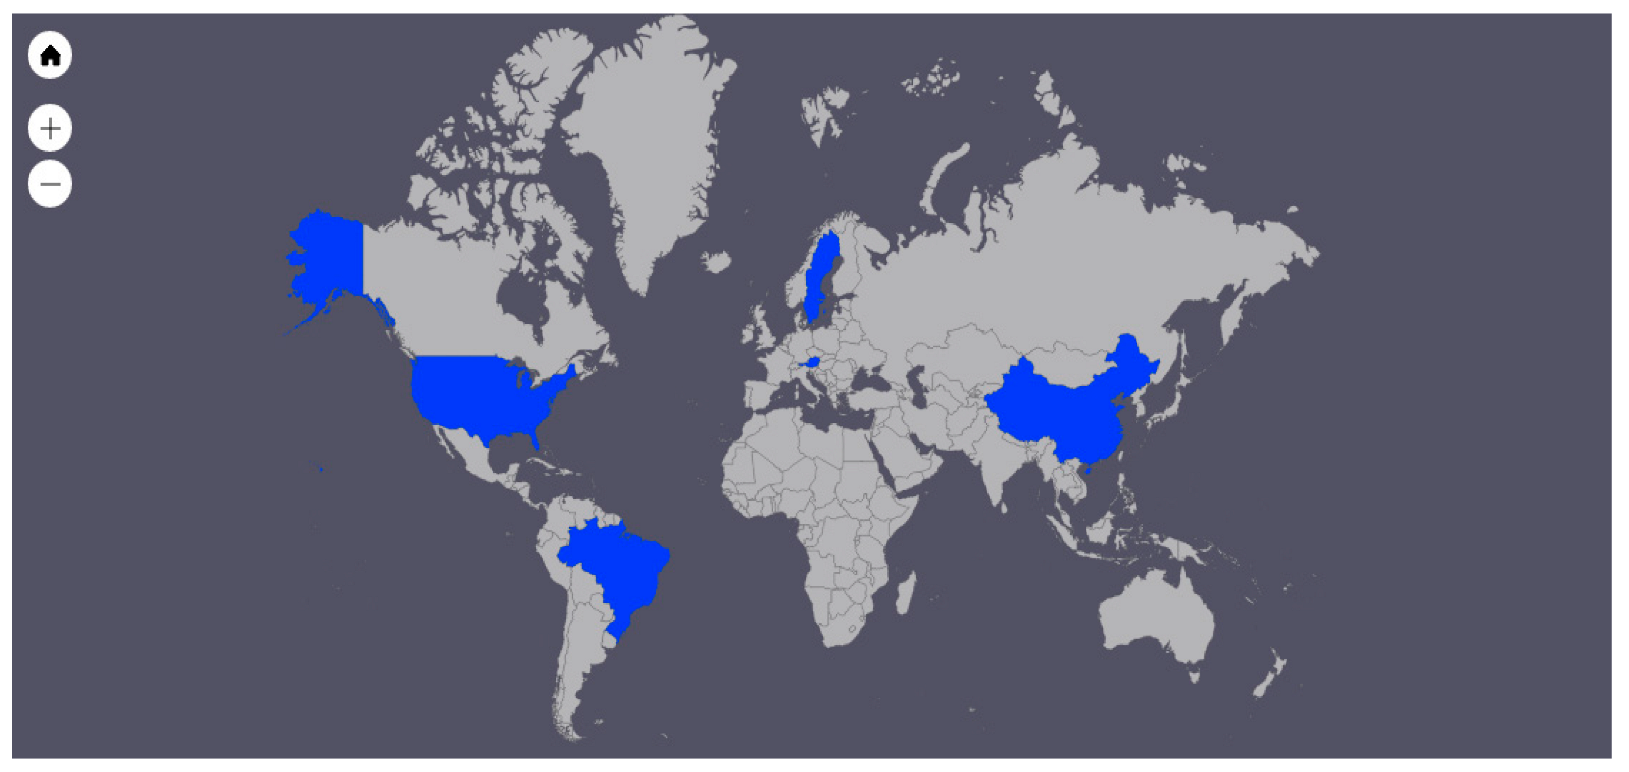
This study was developed under the scope of the Sustainable Urbanization in the Context of Economic Transformation and Climate Change: Sustainable and Liveable Cities and Urban Areas, Europe-China Joint Call for Proposals. The RECREATE project (Resource nexus for transformation to circular, resilient, and liveable cities in the context of climate change) aimed to create sustainable, resilient, and liveable cities. The RECREATE project focuses on four cities: Malmö (Sweden), Vienna (Austria), Beijing, and Shanghai (China) (Figure 1). In addition, this study was also applied in Baltimore (United States) and São Paulo (Brazil) to see if a different perspective from the Americas to the comparative resilience analysis can bring a broader understanding of the theme.
2.2. Comparative Urban Resilience Index
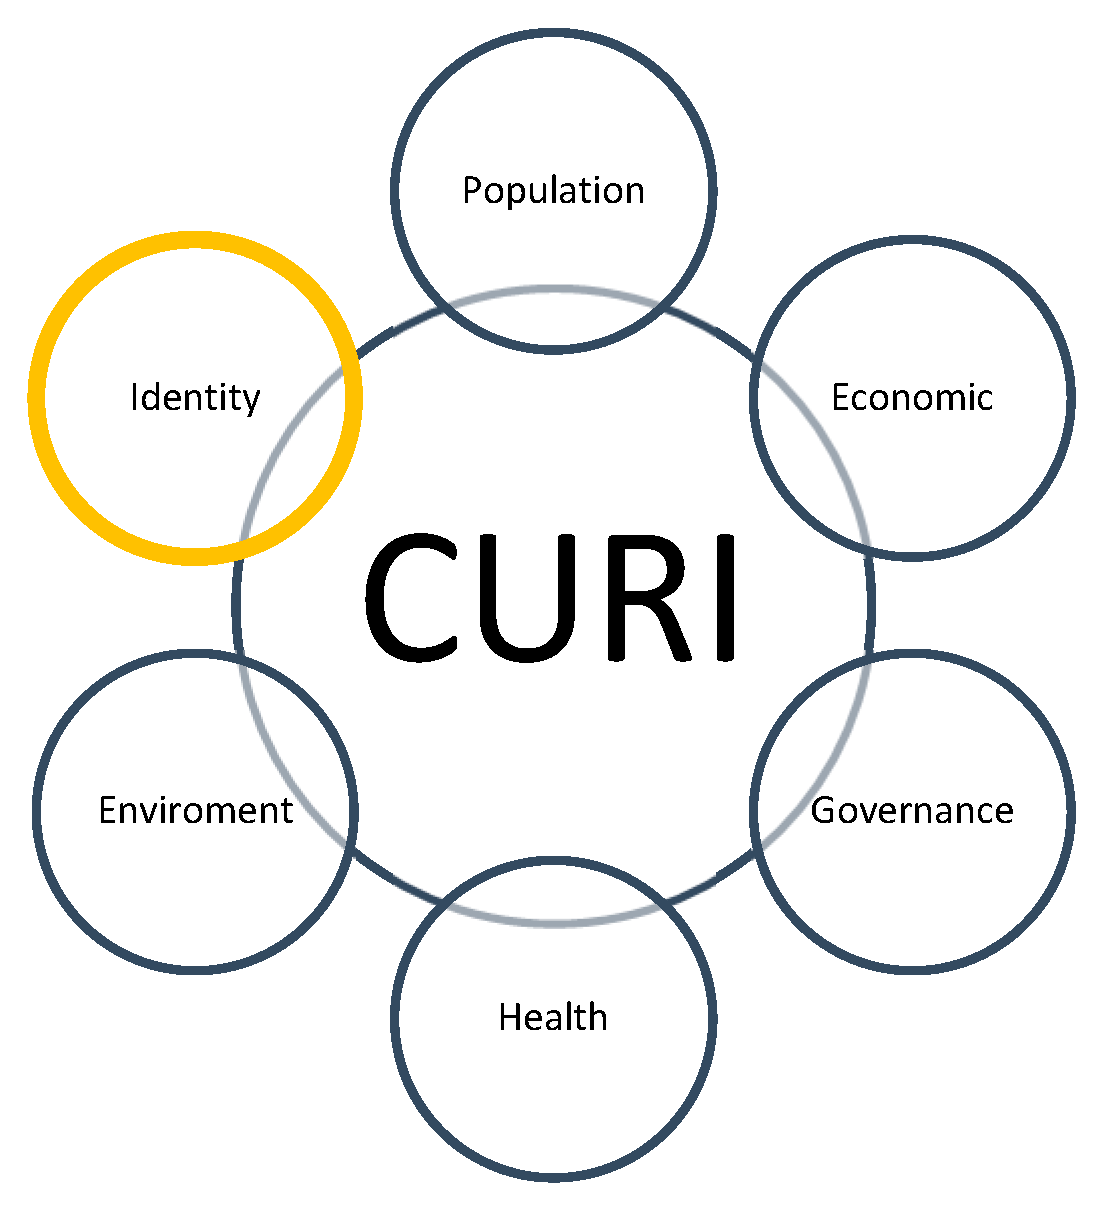
The present urban resilience framework (Figure 2) shows the six dimensions of urban systems that were integrated into the comparative urban resilience index (CURI). These dimensions were adapted/modified from the most recent assessments on urban-related resilience [13,18,20,21,50] and complemented when necessary (particularly with the identity dimension). The criteria for choosing indicators from the literature were the experience of the researchers and the relevance of these indicators in defining resilience as an emergent property of the system. It is also possible that future analysis would provide a different set of indicators relevant for a determined set of cities to understand and compare their resilience. We echo the understanding that resilience is not only broadly defined but also a living concept that might be assessed in different forms [51]. Part of these indicators was not used due to the lack of data, and therefore, what is present in CURI is the possible fraction of the desirable set of indicators.
CURI starts with the population and economic dimensions as proxies of the relative size and affluence of the city. Furthermore, it uses governance as a driver of overall resilience due to the power governance has in directing the investments and development of the city. All these dimensions must also include health because it is crucial that any adaptation plan assures human health, but also because society can have different responses to climate change effects depending on their age and health state (also understood as a vulnerability driver). Environment represents the quality of the environment in the city, and this is most important because greener cities can absorb more rainwater from storms (avoiding floods) but also diminish the heat island formation, which enhances the quality of life and diminishes the distance between communities and a good response to extreme events. Identity brings the cultural dimension to the index.
Each of these six dimensions is described by a set of 29 indicators (Table 1). Each indicator shows the source reference where it was validated before the present study. We collected these data for two periods (the year 2000 ± 3 and 2020 ± 3) which represent two snapshots in time of the situation of the city. The data used in this paper came from official statistics time series or grey literature when those official data were not available (to find each data source see Supplementary Materials). All individual data were normalized between 0 and 1 using the ranking technique [52]. Missing data of up to three variables were extrapolated from the available data and limited to the first quartile. Missing data for more than 3 variables had the indicator excluded from the analysis (originally 44, reduced to the present 29).
2.3. Integration of Indicators
Indicators were aggregated using a dimension-weighted resilience index which considers every dimension with the same weight, and then different weights will happen to each indicator inside each dimension, according to the number of indicators it has. For example, the dimension population has three indicators, and therefore each one will weigh (1/3) of that dimension weight (1/6 of the whole index, considering that six dimensions were used) (Equation (1)).
In addition, some indicators (Table 1) have a negative effect on resilience, and therefore, their weight is negative, showing they are diminishing the resilience of the city. As an example, in the health dimension, the higher the proportion of the vulnerable population, the lower the resilience of this city because it is more exposed to environmental extremes such as high temperatures or floods. All indicators were integrated using a Cobb-Douglas-like function [16,53].
2.4. Limits and Caveats
Several aspects of this kind of comparison between cities must be considered. First, normalizing the data using ranking is a valid approach [52] yet nonintuitive, but it has the positive side of always showing the benchmark for a determined dimension or indicator. On the negative side, the benchmark is considered the best result available, acting like a cap on the whole set of cities as if that was the best result possible. This might have consequences in terms of the comparison with future situations even in the development of these cities. Furthermore, a city that was the benchmark in one timeframe, by being surpassed in its relative position in the new timeframe, shows a reduction of the performance that is attributable to the performance growth in the other cities, not necessarily to the reduction in the performance of the former one. That is not necessarily a flaw but an issue of this kind of comparison. The quality of an analysis using rankings can be seen by the congruence of results in the present study when compared with the available literature (Section 3.1). When new cities are inserted in the set to be compared, a new analysis must be done to check the ranking again. Missing data were inferred as the lower first quartile, which can bring some problems of misleading inference in cities that do not have the desired data or these data were not found. These inferences were made clear in the Supplementary Materials and can be complemented by available data in the future. On the other hand, these inferences were important to keep the set of indicators at a desired level (of 29 indicators).
3. Results
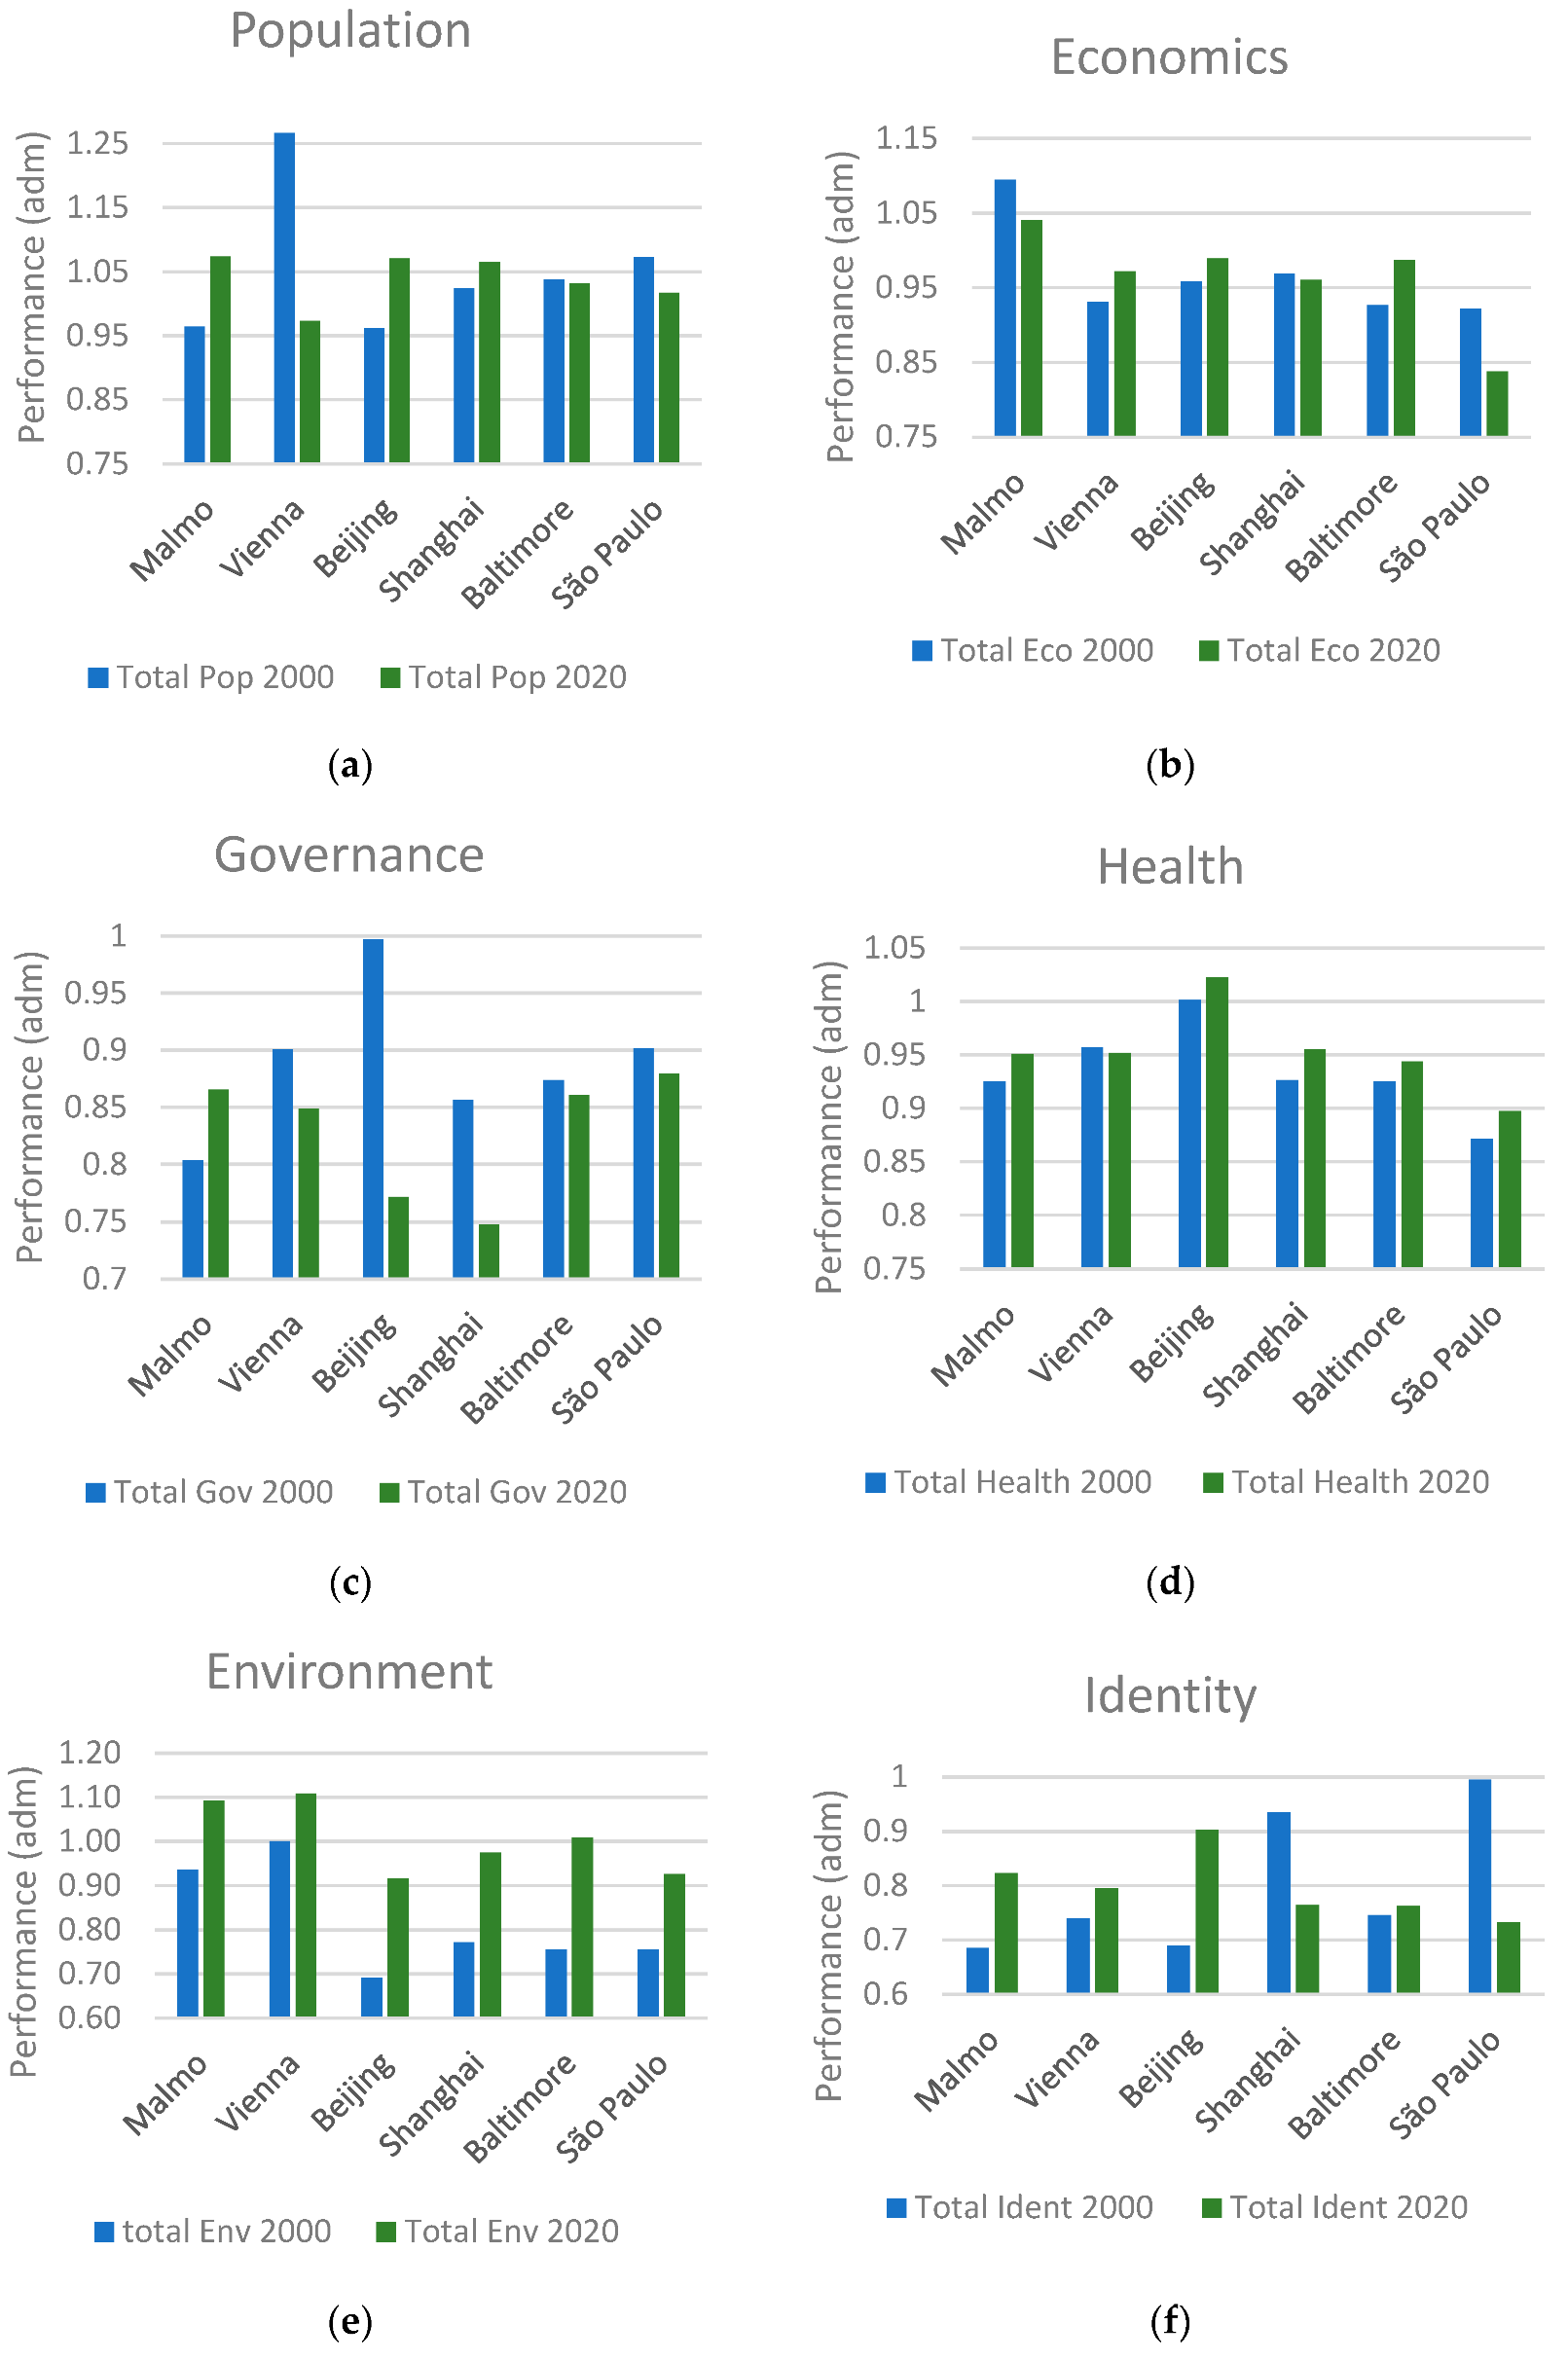
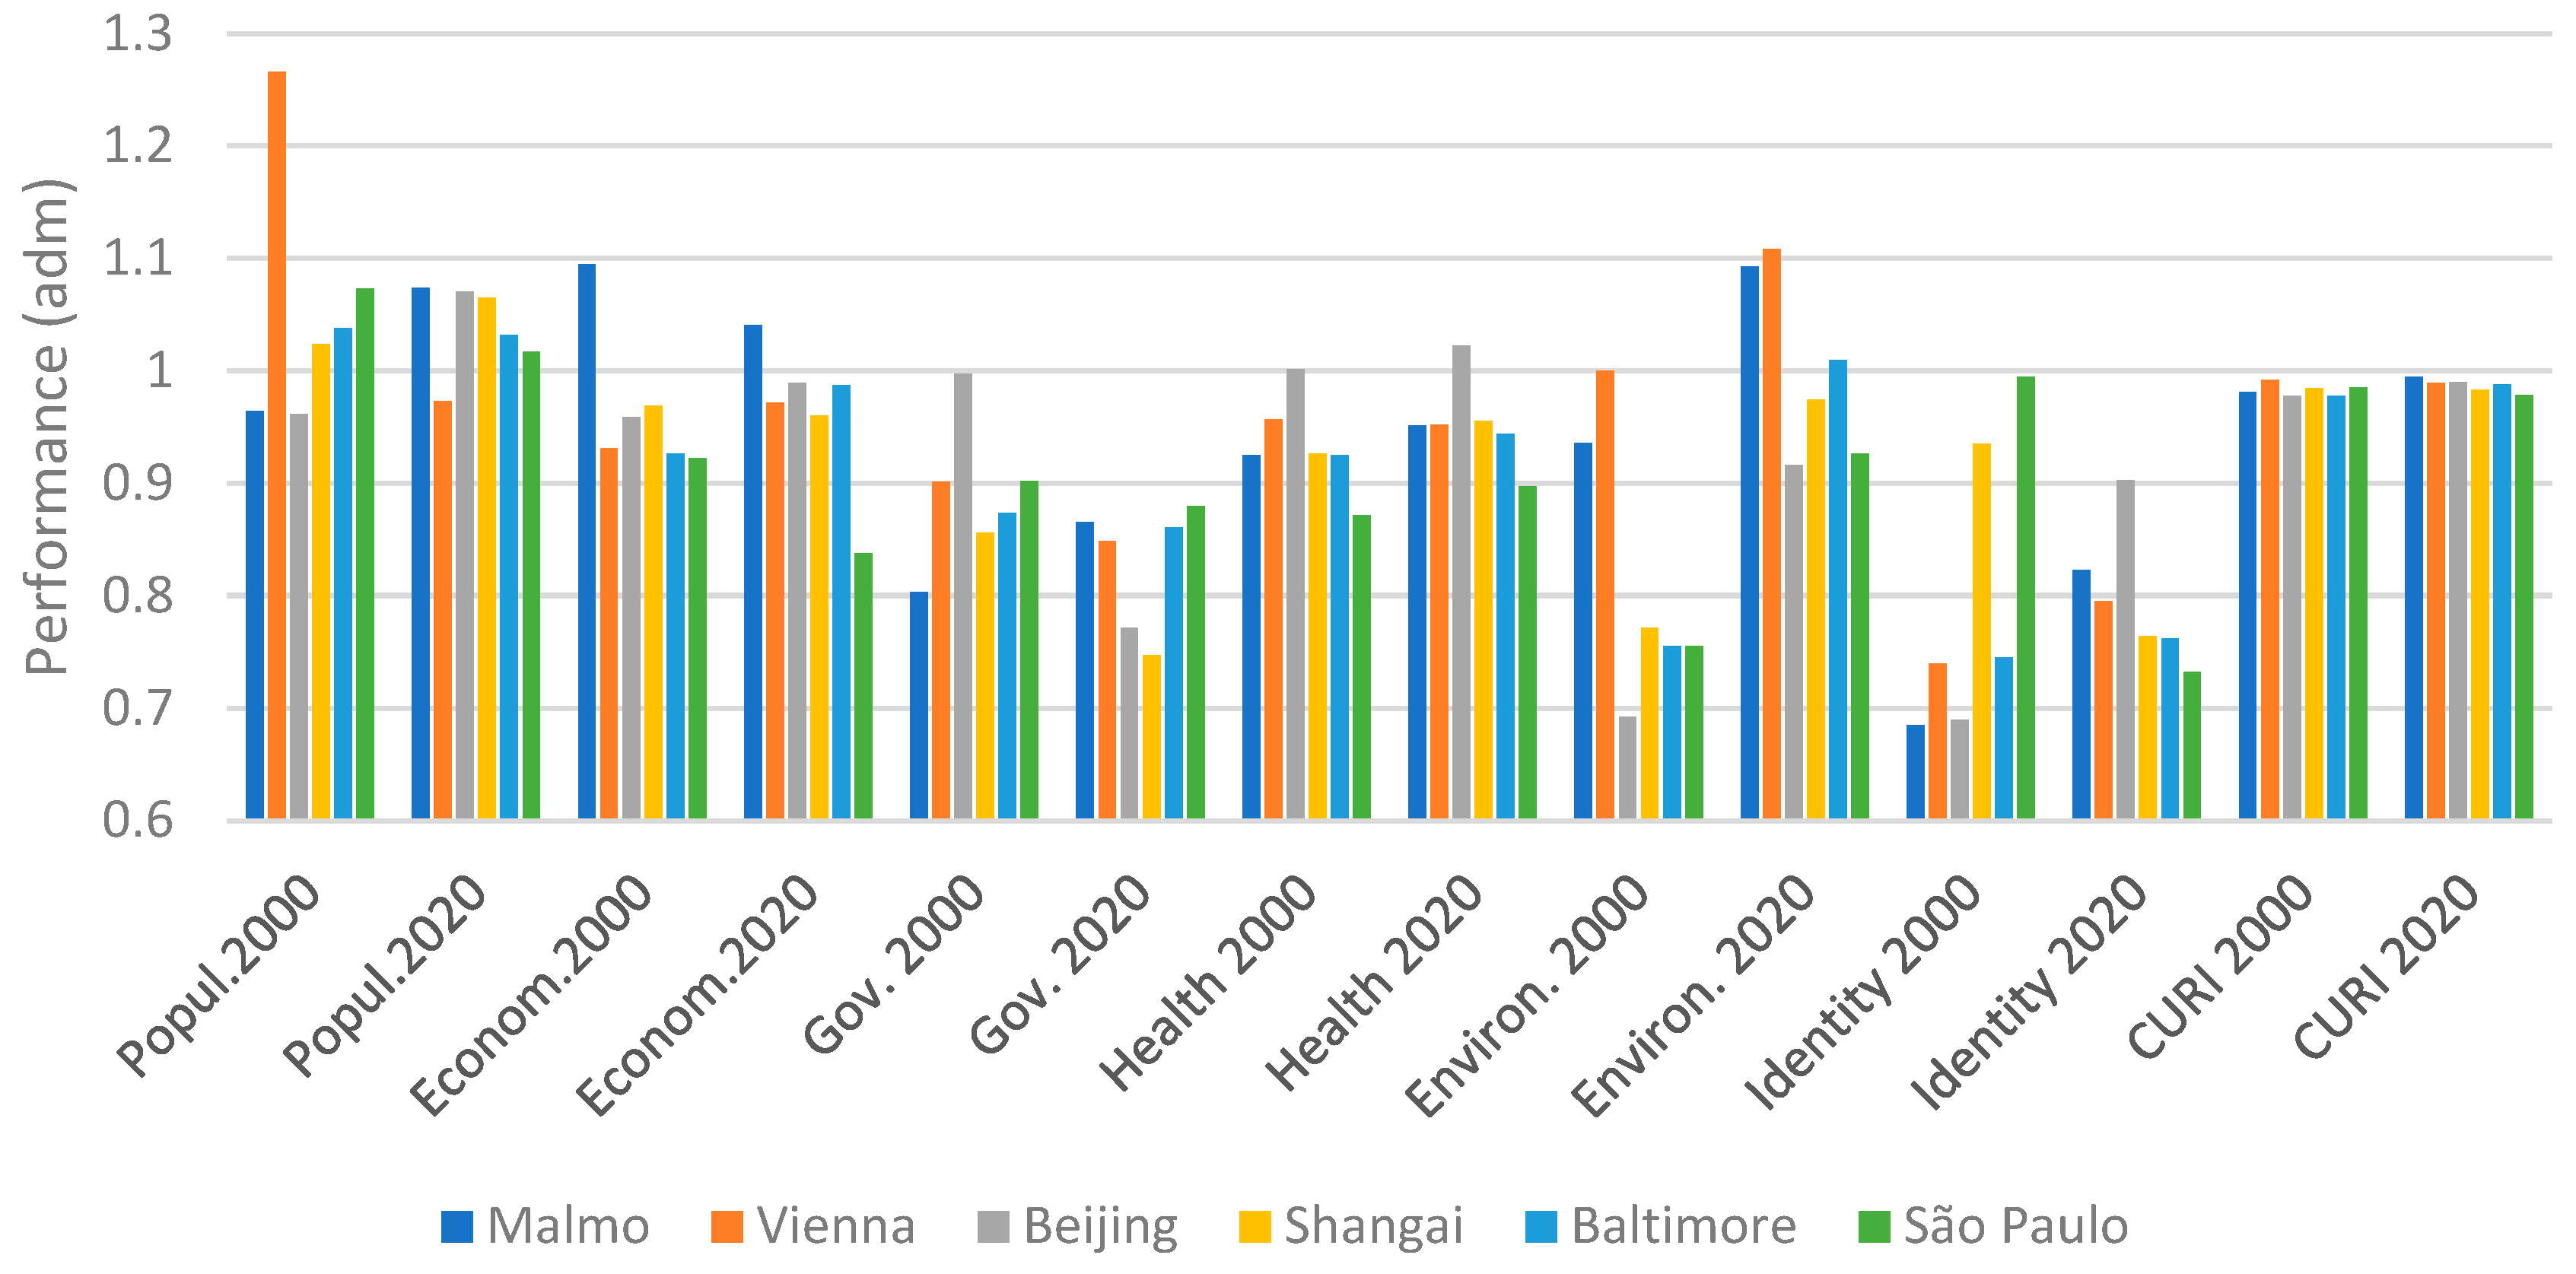
The results for each dimension (Figure 3a–f) show that cities, in general, have an improvement regarding their comparative performance from the year 2000 to 2020, except for the cases described (Figure 3, Table 2 and Table 3).
3.1. Results and Discussion for Dimensions
The population dimension brings three indicators (P1—population density, P2—population living with minimum standards, and P3—HDI). Two of them (P1 and P3) are positively correlated with CURI, but P2 is negatively correlated. Between 2000 and 2020, the highest values for P2 and P3 were those of Malmö, but both indicators changed the highest values to Vienna in 2020, which explains Vienna having the major variance in this dimension. This result is congruent with the Austrian policies for affordable housing and the inclusion of migrants into the city’s labor force [54]. This result is also adherent with the high quality of the "social dimension” of Kuty et al. [55], which showed Vienna in a high position among European smart cities after an in-depth statistical analysis for the period 2015–2020. Our data pointed to São Paulo being the highest population density (P1) in both 2000 and 2020.
The economic dimension starts with per capita GDP (E1) and disposable income (E2) to capture the level of affluence in that city and the possible amount of money that would be available in case of emergency. The proportion of infrastructure investment in the whole budget (E3) is relevant due to the relevance infrastructure and its maintenance has for resilience in the urban realm. The proportion of environmental expenditure in fiscal expenditure (E6) is a proxy to capture the dependencies the urban realm has with the underpinning environment. It is complemented by the environmental dimension. In addition, two indicators are negatively correlated with resilience (E4—living cost and E5—unemployment).
Malmö had a good balance in this set of indicators, having the highest per capita GDP (E1) in both time frames and keeping a good balance of the other indicators in both situations despite the small reduction of this dimension’s absolute value; this city still has the best economic situation when compared to the other cities. All other cities presented comparatively small variations in both timeframes but showed a better situation for Vienna and Beijing which comparatively reduced their living cost (E4) and increased a lot their expenditure in the environmental sector (E6), and Baltimore which had a strong increase in per capita GDP (E1). Baltimore’s development in the economic dimension is also pushed by the steep increase in the investment in infrastructure (focused on increasing transport quality), which doubled from 2000–2020 [56]. For the Beijing case, the increase in investments in the environmental sector might be attributed to a response to the SARS-2 pandemic in 2002 [20], complemented by the “Beautiful China” initiative promoted in the 18th National Congress of the Communist Party of China (2012) [57].
The governance dimension embraces the variables reflecting the capacity of the government to solve pressing problems in each city. It starts with a historical perspective (G1—infrastructure density and G2—correct disposal of waste) that reveals the capacity of the public services to reach the population properly and is followed by an estimate of the level of development of this society in terms of energy consumption (G4—energy consumption per capita). Then, recycling and the use of renewable energy (G3 and G5) demonstrate the fine-tuning regarding city management. The governance dimension showed a balanced result for all cities except for Beijing, which diminished the comparative performance in this dimension. As the indicators show performance related to the correct disposal of waste and recycling waste, the increase of these activities in European cities (Malmö and Vienna) reduced the comparative performance of both Chinese cities. As São Paulo was the benchmark for renewables in both 2000 and 2020, little room was available for the other cities to benchmark in this indicator.
The highlight of the governance dimension is the case of Malmö. Malmö’s excellent waste management in 2020 can be understood by their waste management policies which started in 1994–95 regarding producers’ responsibility over the waste. It had been complemented by specific laws related to electronic waste (2002) and household organic waste (2005), with specific and progressive targets, which included broad participation and integration of different workforces, from private owners to the municipality, in different tasks of the management process. This calls attention to the fact that this system included an information system focused on usuaries regarding household waste management and the producers’ responsibility over the packages [58].
The health dimension brings life expectancy (H1), insurance penetration (H2), and public health facilities per capita (H4) as proxies for understanding the availability and coverage of health systems to the population. The proportion of the vulnerable population (H3) shows a negative impact on resilience once it represents the proportion of the population more prone to be affected by extreme events. The dimension showed Beijing as the benchmark in 2000 and still increasing the difference with the other cities in 2020. Shanghai follows as second. That performance is due to the high life expectancy at birth and public health facilities per capita in 2000, with an addition of the reduction of the section of the population considered vulnerable (16 < age > 60). All other cities had intermediary performances, and São Paulo had the lower standards, probably due to the low number of public facilities per capita in comparison with the other cities.
The Beijing and Shanghai excellence in the health dimension is probably a product of the massive investments made in the health sector in a major two-steps-reform plan. The first act (2009) focused on the expansion of coverage, the establishment of a national essential medicines system, improving primary health care (PHC), and other actions [59]. The second act (2017) focused on reducing drug markups by a hierarchical medical service fee, encouraging the use of PHC, and decreasing the prices for diagnostics [60]. There might still have some issues regarding patients’ financial risk [61], but this is far from the scope of the present analysis.
The environment dimension showed Malmö and Vienna at the best position in both timeframes. That result is due to the high number of green areas (En3) and permeability (En1), as to the good air quality (En4) and the great proportion of people who walk/bike to work daily (En5). In the Vienna case, those green areas have been kept due to a strong state-based approach which also helped the city to face other structural challenges such as heatwaves and increased population density [54]. All cities improved in this dimension, but permeability seems to require an improvement in most cities. Floods are the most frequent type of disaster globally [62], and the high proportion of impervious areas increases the vulnerability to floods [63]. Only in the last decade, one-half million people were made homeless by landslides and floods in Brazil, and 123 million were affected by natural disasters in general [64].
The identity dimension is composed of six indicators (Table 1). The first three are representatives of the cultural background of each city and are formed by indicators related to the reproduction of the current/traditions/education. Therefore, the number of cultural landmarks and culture-promoting places (e.g., museums) (I1) is an attempt to transmit this culture to future generations. The literacy and educational attainment dimension (I2) represents the average number of years spent in school, taking school as a social institution responsible for educating the population, in other words, transmitting to new people the old people’s knowledge, behavior, practices, values, etc. To complement that background comes the total budget spent on culture indicator (I3), showing how important it is to that city, the transmission of cultures to their citizens. The three final indicators inside the identity dimension represent the observation that each human settlement will have to face climate change by adapting common practices to their own set of challenges, space, and culture, and therefore, they must innovate even when using known infrastructure or knowledge from other cities. Therefore, the number of startups (I4) and patents (I6) are proxies for an idea of innovation, while the number of students in universities (I5) brings the idea of an informed labor force or highly skilled and educated part of society, presumably able to lead necessary future transformations.
The results for the identity dimension showed a good transition between the benchmark in 2000 being with São Paulo and Shanghai, but in 2020 moving to Beijing, Malmö, and Vienna. For the first timeframe, the proportion of students in universities and the proportion of protected, cultural, and historical places were determinants. There are other studies pointing to the lack of local capacity regarding urban resilience [64] that might be extrapolated to understand the need for more investment in universities and technological development in São Paulo. For the 2020 result, the investment in culture and the number of startups seem to be responsible for the change in the picture regarding Malmö and Vienna. For Beijing, that was also followed by an increase in the number of students in universities.
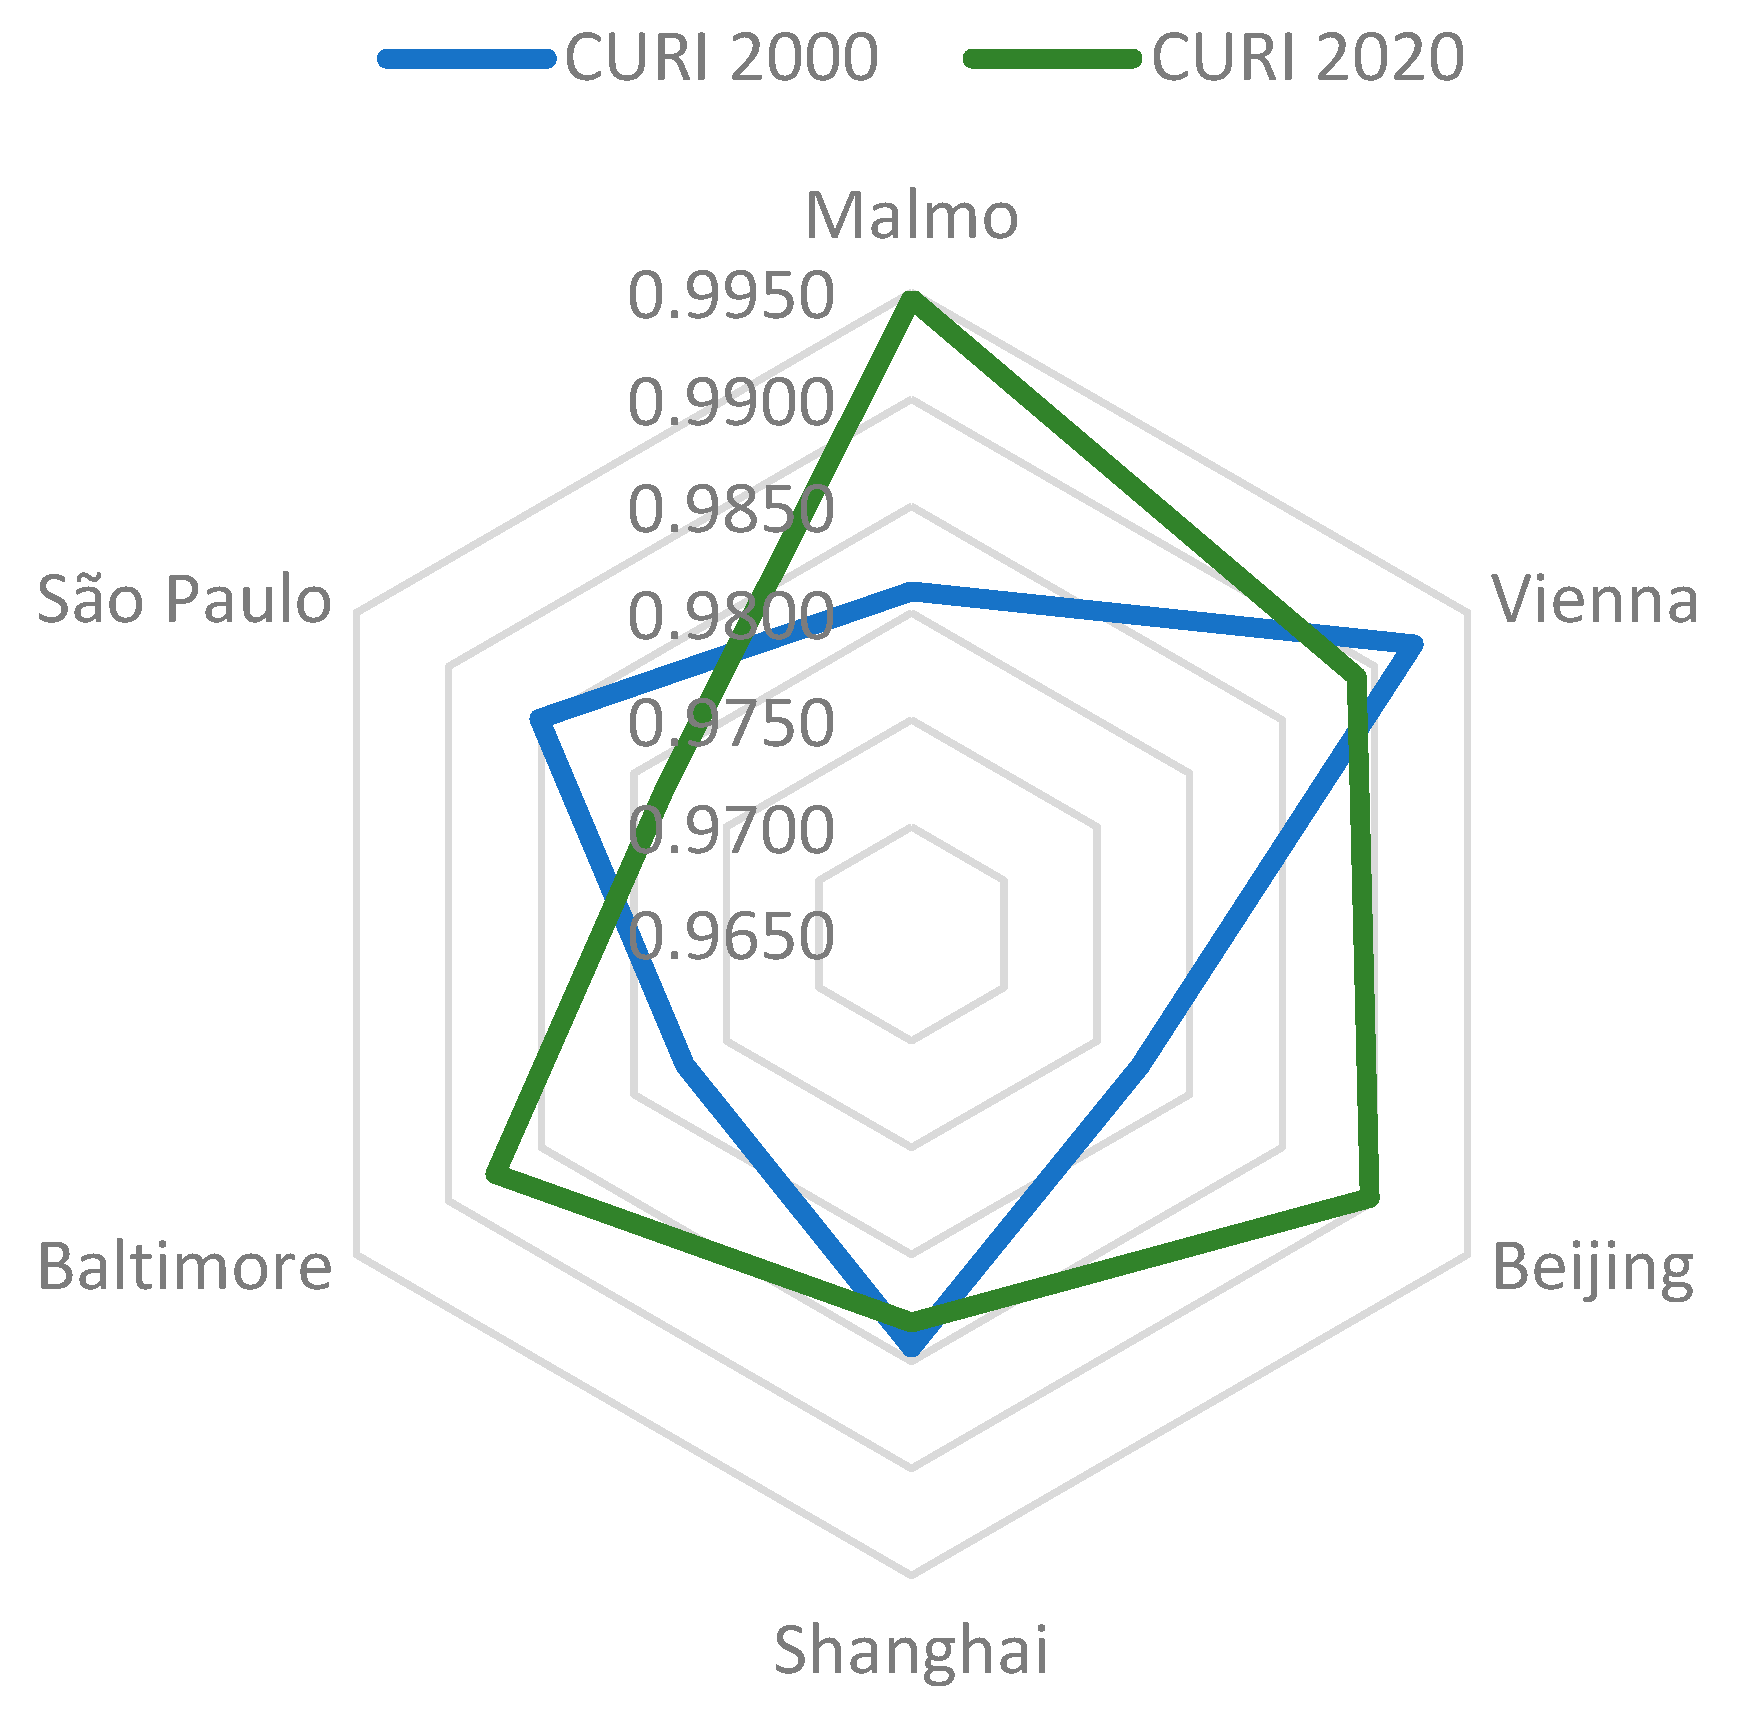
The integration of all these dimensions in CURI (Table 2 and Table 3 and Figure 4 and Figure 5) points to two different groups of cities. The first group is formed by the cities whose resilience increased in the studied period (Malmö, Beijing, and Baltimore), and the other group (Shanghai, Vienna, and São Paulo), whose resilience slightly diminished in the same timeframe.
Malmö had a steeper increase in resilience by increasing performance in every dimension (except for economics). Beijing increased its resilience due to the overall increase in almost every dimension (except for governance). Baltimore had a less steep increase in all dimensions and a decrease in two indicators (Population and Governance). For the cities whose resilience diminished, the situation is different. Shanghai had a small diminishing in resilience due to losses in economics, governance, and identity. For Vienna, the dimensions were population, governance, and health. Finally, São Paulo had a major decrease in resilience due to lower performance in population, economics, governance, and identity (Figure 4 and Figure 5).
4. Discussion
The pattern that emerges from these results is that CURI represents resilience as a systemic property, being formed by the overall product of dimensions, more than a high performance in an individual dimension or indicator. This is congruent with [18] for the Beijing case. This justifies that every city that increased its CURI performance did so in at least two dimensions (Table 2 and Table 3). Every city that decreased its performance in CURI decreased in at least three dimensions.
Previous studies showing that the average resilience of main cities in China and the Yangtze River delta [20] increased from 1998 to 2017 [57] are consistent with our own. Even though, in our case, Shanghai showed a small decrease in the comparative index, this happened due to the comparative trait of our index, meaning Shanghai’s resilience decreased in 2020 in comparison to an index that considers the growth in other cities (in which indicators improved faster than Shanghai). The overall performance of Chinese cities is great, probably due to the investments in environmental quality and health at the beginning of the century, as discussed before (see Section 3.1). In addition, these results for Chinese cities ‘resilience are coherent with the ecological network resilience verified by Wang et al. (2023) [65] for Beijing. The great performance of Malmö is related to the investment plans the city undertakes in almost every dimension. Vienna had a slight decrease in the performance of several indicators. That seems to be the case when compared with other cities’ fast and massive development leading to a decrease in the comparative performance of Vienna. The American cities had several benchmarks that must be recognized. Baltimore had literacy in 2020, and São Paulo had population density, percentage of infrastructure investment, use of renewable energy, correct disposal, and others that could put the city in a better position in the ranking. However, São Paulo also was the reference in indicators that are drains on overall resilience, such as the proportion of the vulnerable population, living cost, unemployment, and poor air quality. Furthermore, the American cities are much younger than the others, and from them, São Paulo is the only middle-income country. Despite the differences in age and affluence, both American cities provided a good comparison due to their high-quality indicators that should serve as a benchmark for European and Chinese cities to follow.
The creation of the CURI index contributes to spreading the knowledge and skills necessary for cities to understand and promote open transformative futures, namely in the area of climate adaptation. Considering the need for more local capacities [64] and the context of the cities in the US and Latin America [66], the methods and data used in CURI are directly aligned with the requirements of conceiving resilience in a transparent, anticipatory, and equitable way [66].
Regarding the cultural/identity dimension, measuring it is usually considered a difficult task for several reasons: Culture is pervasive and multidimensional, covering all aspects of human life in multiple scales (city, community, and individual). Culture is a complex abstraction not easily defined and measured [48,67,68]. The absence of an agreement on the definition and frameworks regarding culture and the lack of suitable data [36] make the situation more complex. We echo the authors regarding these issues to measure identity, and we make clear the understanding that the current identity dimension is reductionist, assuming the idea of identity and culture in such different urban realms cannot be captured by a reduced number of indicators. Nonetheless, some arguments support our option of including this dimension in the present study. First, including a proxy for an idealized identity dimension, yet to be pursued or improved in further studies, is better than not including it. Removing the identity dimension would result in an index that is known to be incomplete. As the very definition of resilience adopted in the present study considers identity as part of the meaning of resilience [27,28], zero is the only value we know identity cannot assume. With that, it is better to have a proxy that considers identity, even with imperfections bounded by the possibility of being improved in the future, than to omit it. Omitting identity is equivalent to saying it has zero effect, which is the only value that is known to be wrong [69,70]. Second, Montalto (op. cit.) included 29 indicators in a full assessment of culture in cities; we included six in a resilience assessment, in which the focus is much different. It is not just about the number of indicators but the focus. We are not measuring just culture/identity but resilience. Moreover, the identity dimension information is aggregated with five other dimensions; Third, most of the current urban resilience assessments [13,17,20,24,50] do not consider identity and did not embrace this dimension in the analysis, which is taken as a novelty for the present index, and collaboration to fill a knowledge gap in the field.
The final comments point to the challenge of finding suitable data at the city level. Most of the relevant data were available at the country or regional level but not the city level. Even the Chinese statistical yearbooks were not complete nor available for both timeframes. We also found it extremely difficult to find complete data older than the year 2000. There are ten countries responsible for 96.5% of the resilience studies in the world (EUA, England, China, Australia, Netherlands, Canada, Germany, Italy, Spain, and Japan) [71], meaning there is a massive knowledge gap in Latin America and Africa, especially at the city level. In addition, the 20-year timeframe was responding to an idea of comparison between states, but more adequate would probably be shorter periods of 5 to 10 years to follow up on resilience development in cities.
5. Conclusions
In order to build the comparative urban resilience index, this paper used a mixed literature review and composite indicator techniques that unfold with a broad index that provided information and a comparative status between the six cities under study. The goal of the paper was to integrate the 29 indicators regarding the urban realm, understood as a social-ecological system, into six dimensions of resilience, and finally, these dimensions into one index: CURI (Comparative Urban Resilience Index), in such a way that allows cities to understand their performance regarding resilience promptly in comparison with other cities.
The integration of indicators through the Cobb-Douglas function brought an interesting systemic perspective to the index once the variations in CURI were significant when two or more dimensions of the resilience analysis were impacted by data, not from just a single dimension. For the cities in which resilience decreased, three dimensions were affected from one timeframe to the other.
The overall analysis showed three cities increased their resilience during the 2000-to-2020-time frame: Malmö increased its resilience by increasing the performance of all dimensions (except for economics). Beijing had the same performance (except for governance). Baltimore had a less steep increase, with a decrease in two indicators (Population and Governance).
On the other hand, three cities had decreased their resilience: Shanghai had a minimum diminishing in resilience due to losses in economics, governance, and identity. For Vienna, the dimensions were population, governance, and health. Finally, São Paulo had a major decrease in resilience due to lower performance in population, economics, governance, and identity.
In concluding remarks, the index showed an interesting form to integrate the data and presented results that are congruent with other literature visited, but with the advantage of being a rapid assessment with much fewer requirements in data collection and statistical analyses. Furthermore, the present study showed that ranking the data in terms of the benchmark promotes a quick understanding of which city is the “best in class” in each dimension, proportioning a very clear way forward to the other cities which want to increase their resilience and do not have much room for experimentation, once the best in class is a probable demonstration of a better development strategy.
Supplementary Materials
The following supporting information can be downloaded at: https://www.mdpi.com/article/10.3390/land12061182/s1, Supplementary Materials file.
Author Contributions
Conceptualization, B.D.F. and B.O.; methodology, B.O.; formal analysis, B.O.; investigation, B.D.F.; resources, B.D.F.; data curation, B.D.F. with complements from IVL Sweden; writing—original draft preparation, B.O.; writing—review and editing, B.D.F. All authors have read and agreed to the published version of the manuscript.
Funding
The presented work is a result of the research project Sustainable Urbanisation in the Context of Economic Transformation and Climate Change (RECREATE), made possible by JPI Urban Europe and funded by the Swedish Energy Agency, the Austrian Research Promotion Agency, and the National Natural Science Foundation of China. This research was funded by EU Horizon 2020 grant number 857160.
Data Availability Statement
Data used and sources of the data are available in the Supplementary Materials.
Acknowledgments
Authors would like to thank IVL Swedish Environmental Research Institute, especially Alexandra Wu, for help in collecting the data and discussing the results. The authors would like to thank Arda Bell from Towson University for helping to collect the city-level data for Baltimore.
Conflicts of Interest
The authors declare no conflict of interest. The funders had no role in the design of the study; in the collection, analyses, or interpretation of data; in the writing of the manuscript; or in the decision to publish the results.
| 1 | https://www.amcharts.com/visited_countries/#AT,SE,US,BR,CN (accessed on 25 November 2022). |
References
- Population Reference Bureau. World Population Data Sheet; Population Reference Bureau: Washington, DC, USA, 2020; ISBN 978-0-917136-14-6. [Google Scholar]
- Bremner, J. World Population Highlights: Key Findings from PRB’s 2010 World Population Data Sheet. Popul. Bull. 2010, 16, 1–12. [Google Scholar]
- Holling, C.S. Resilience and Stability of Ecological Systems. Annu. Rev. Ecol. Syst. 1973, 4, 24. [Google Scholar] [CrossRef] [Green Version]
- Folke, C. Resilience (Republished). Ecol. Soc. 2016, 21, 44. [Google Scholar] [CrossRef]
- Suárez, M.; Gómez-Baggethun, E.; Benayas, J.; Tilbury, D. Towards an Urban Resilience Index: A Case Study in 50 Spanish Cities. Sustainability 2016, 8, 774. [Google Scholar] [CrossRef] [Green Version]
- Brand, F.; Jax, K. Focusing the Meaning(s) of Resilience: Resilience as a Descriptive Concept and a Boundary Object. Ecol. Soc. 2007, 12, 16. [Google Scholar] [CrossRef] [Green Version]
- Beck, U. Risk Society. In Essential Concepts of Global Environmental Governance; Routledge: New York, NY, USA, 2014; ISBN 978-0-203-55356-5. [Google Scholar]
- Pörtner, H.-O.; Roberts, D.C.; Tignor, M.; Poloczanska, E.S.; Mintenbeck, K.; Alegría, A.; Craig, M.; Langsdorf, S.; Löschke, S.; Möller, V.; et al. (Eds.) IPCC, 2022: Summary for Policymakers. In Climate Change 2022: Impacts, Adaptation and Vulnerability. Contribution of Working Group II to the Sixth Assessment Report of the Intergovernmental Panel on Climate Change; Cambridge University Press: Cambridge, UK; New York, NY, USA, 2022; pp. 3–33. [Google Scholar] [CrossRef]
- Brown, K. Global Environmental Change I: A Social Turn for Resilience? Prog. Hum. Geogr. 2014, 38, 107–117. [Google Scholar] [CrossRef] [Green Version]
- Cretney, R. Resilience for Whom? Emerging Critical Geographies of Socio-Ecological Resilience. Geogr. Compass 2014, 8, 627–640. [Google Scholar] [CrossRef]
- Stone-Jovicich, S. Probing the Interfaces between the Social Sciences and Social-Ecological Resilience: Insights from Integrative and Hybrid Perspectives in the Social Sciences. Ecol. Soc. 2015, 20, 23. [Google Scholar] [CrossRef]
- Carpenter, S.; Walker, B.; Anderies, J.M.; Abel, N. From Metaphor to Measurement: Resilience of What to What? Ecosystems 2001, 4, 765–781. [Google Scholar] [CrossRef]
- Bottero, M.; Datola, G.; De Angelis, E. A System Dynamics Model and Analytic Network Process: An Integrated Approach to Investigate Urban Resilience. Land 2020, 9, 242. [Google Scholar] [CrossRef]
- Ilmola, L. Approaches to Measurement of Urban Resilience. In Urban Resilience; Yamagata, Y., Maruyama, H., Eds.; Advanced Sciences and Technologies for Security Applications; Springer International Publishing: Cham, Switzerland, 2016; pp. 207–237. ISBN 978-3-319-39810-5. [Google Scholar]
- Li, G.; Kou, C.; Wang, Y.; Yang, H. System Dynamics Modelling for Improving Urban Resilience in Beijing, China. Resour. Conserv. Recycl. 2020, 161, 104954. [Google Scholar] [CrossRef]
- Oliveira, B.M.; Boumans, R.; Fath, B.D.; Othoniel, B.; Liu, W.; Harari, J. Prototype of Social-Ecological System’s Resilience Analysis Using a Dynamic Index. Ecol. Indic. 2022, 141, 109113. [Google Scholar] [CrossRef]
- Wang, L.; Xue, X.; Wang, Z.; Zhang, L. A Unified Assessment Approach for Urban Infrastructure Sustainability and Resilience. Adv. Civ. Eng. 2018, 2018, 2073968. [Google Scholar] [CrossRef] [Green Version]
- Zheng, Y.; Xie, X.-L.; Lin, C.-Z.; Wang, M.; He, X.-J. Development as Adaptation: Framing and Measuring Urban Resilience in Beijing. Adv. Clim. Change Res. 2018, 9, 234–242. [Google Scholar] [CrossRef]
- Heenetigala, U.; Kapetas, L.; Fenner, R. Building Resilience in Water Supply Infrastructure in the Face of Future Uncertainties: Insight from Cape Town. In Water-Wise Cities and Sustainable Water Systems: Concepts, Technologies, and Applications; Wang, X.C., Fu, G., Eds.; IWA Publishing: London, UK, 2021; pp. 201–233. ISBN 978-1-78906-076-8. [Google Scholar]
- Chen, X.; Quan, R. A Spatiotemporal Analysis of Urban Resilience to the COVID-19 Pandemic in the Yangtze River Delta. Nat. Hazards 2021, 106, 829–854. [Google Scholar] [CrossRef] [PubMed]
- Varis, O.; Taka, M.; Kummu, M. The Planet’s Stressed River Basins: Too Much Pressure or Too Little Adaptive Capacity? Earth’s Future 2019, 7, 1118–1135. [Google Scholar] [CrossRef]
- Barreiro, J.; Lopes, R.; Ferreira, F.; Matos, J.S. Index-Based Approach to Evaluate City Resilience in Flooding Scenarios. Civ. Eng. J. 2021, 7, 197–207. [Google Scholar] [CrossRef]
- Chen, C.; Xu, L.; Zhao, D.; Xu, T.; Lei, P. A New Model for Describing the Urban Resilience Considering Adaptability, Resistance and Recovery. Saf. Sci. 2020, 128, 104756. [Google Scholar] [CrossRef]
- Fu, X.; Wang, X. Developing an Integrative Urban Resilience Capacity Index for Plan Making. Env. Syst. Decis. 2018, 38, 367–378. [Google Scholar] [CrossRef]
- Masnavi, M.R.; Gharai, F.; Hajibandeh, M. Exploring Urban Resilience Thinking for Its Application in Urban Planning: A Review of Literature. Int. J. Environ. Sci. Technol. 2019, 16, 567–582. [Google Scholar] [CrossRef]
- Dietz, S.; Neumayer, E. Weak and Strong Sustainability in the SEEA: Concepts and Measurement. Ecol. Econ. 2007, 61, 617–626. [Google Scholar] [CrossRef] [Green Version]
- Folke, C.; Carpenter, S.; Walker, B.; Scheffer, M.; Chapin, T.; Rockström, J. Resilience Thinking: Integrating Resilience, Adaptability and Transformability. Ecol. Soc. 2010, 15, 9. [Google Scholar] [CrossRef]
- Walker, B.; Holling, C.S.; Carpenter, S.; Kinzig, A. Resilience, Adaptability and Transformability in Social–Ecological Systems. Ecol. Soc. 2004, 9, 5. [Google Scholar] [CrossRef]
- Haghani, M.; Sabri, S.; De Gruyter, C.; Ardeshiri, A.; Shahhoseini, Z.; Sanchez, T.W.; Acuto, M. The Landscape and Evolution of Urban Planning Science. Cities 2023, 136, 104261. [Google Scholar] [CrossRef]
- Mi, Z.; Guan, D.; Liu, Z.; Liu, J.; Viguié, V.; Fromer, N.; Wang, Y. Cities: The Core of Climate Change Mitigation. J. Clean. Prod. 2019, 207, 582–589. [Google Scholar] [CrossRef]
- Gassner, A.; Lederer, J.; Kanitschar, G.; Ossberger, M.; Fellner, J. Extended Ecological Footprint for Different Modes of Urban Public Transport: The Case of Vienna, Austria. Land Use Policy 2018, 72, 85–99. [Google Scholar] [CrossRef]
- Khomenko, S.; Nieuwenhuijsen, M.; Ambròs, A.; Wegener, S.; Mueller, N. Is a Liveable City a Healthy City? Health Impacts of Urban and Transport Planning in Vienna, Austria. Environ. Res. 2020, 183, 109238. [Google Scholar] [CrossRef]
- Cumming, G.; Collier, J. Change and Identity in Complex Systems. Ecol. Soc. 2005, 10, 13. [Google Scholar] [CrossRef] [Green Version]
- Alexander, C. The Nature of Order: An Essay on the Art of Building and the Nature of the Universe, Book 1—The Phenomenon of Life, 1st ed.; Center for Environmental Structure: Berkeley, CA, USA, 2002; ISBN 978-0-9726529-1-9. [Google Scholar]
- Martínez, J.G. Selling Avant-Garde: How Antwerp Became a Fashion Capital (1990–2002). Urban Stud. 2007, 44, 2449–2464. [Google Scholar] [CrossRef]
- Montalto, V.; Tacao Moura, C.J.; Langedijk, S.; Saisana, M. Culture Counts: An Empirical Approach to Measure the Cultural and Creative Vitality of European Cities. Cities 2019, 89, 167–185. [Google Scholar] [CrossRef]
- Rizzo, I.; Throsby, D. Chapter 28 Cultural Heritage: Economic Analysis and Public Policy. In Handbook of the Economics of Art and Culture; Ginsburg, V.A., Throsby, D., Eds.; Elsevier: Amsterdam, The Netherlands, 2006; Volume 1, pp. 983–1016. [Google Scholar]
- Rana, R.; Piracha, A. Cultural Frameworks. In Urban Crisis: Culture and the Sustainability of Cities; United Nations University Press: New York, NY, USA, 2007. [Google Scholar]
- Calhoun, C. Social Theory and the Politics of Identity; Wiley-Blackwell: Cambridge, MA, USA, 1994. [Google Scholar]
- Schlosberg, D. Defining Environmental Justice: Theories, Movements, and Nature; Oxford University Press: Oxford, UK, 2007; ISBN 978-0-19-928629-4. [Google Scholar]
- Geertz, C. The Interpretation of Cultures; Basic Books: , London, UK, 1977; ISBN 978-0-465-09719-7. [Google Scholar]
- Wiley, N. The Politics of Identity in American History. In Social Theory and the Politics of Identity; Blackwell: Cambridge, MA, USA, 1994; pp. 130–149. [Google Scholar]
- Cristiano, S.; Zucaro, A.; Liu, G.; Ulgiati, S.; Gonella, F. On the Systemic Features of Urban Systems. A Look at Material Flows and Cultural Dimensions to Address Post-Growth Resilience and Sustainability. Front. Sustain. Cities 2020, 2, 12. [Google Scholar] [CrossRef]
- Shao, Y.; Lange, E.; Thwaites, K.; Xue, Z.; Xu, X. Understanding Landscape Identity in the Context of Rapid Urban Change in China. Land 2020, 9, 298. [Google Scholar] [CrossRef]
- Bina, V.; Chantepie, P.; Deroin, V.; Frank, G.; Kommel, K.; Kotýnek, J.; Robin, P. ESSnet Culture—European Statistical System Network on Culture. Available online: https://ec.europa.eu/eurostat/cros/content/essnet-culture-final-report_en (accessed on 18 July 2022).
- Duxbury, N.; Jeannotte, M.S. Making It Real: Measures of Culture in Local Sustainability Planning and Implementation. In Making Culture Count: The Politics of Cultural Measurement; MacDowall, L., Badham, M., Blomkamp, E., Dunphy, K., Eds.; New Directions in Cultural Policy Research; Palgrave Macmillan UK: London, UK, 2015; pp. 145–161. ISBN 978-1-137-46458-3. [Google Scholar]
- Ziyaee, M. Assessment of Urban Identity through a Matrix of Cultural Landscapes. Cities 2018, 74, 21–31. [Google Scholar] [CrossRef]
- Mohr, J.W.; Bail, C.A.; Frye, M.; Lena, J.C.; Lizardo, O.; McDonnell, T.E.; Mische, A.; Tavory, I.; Wherry, F.F. Measuring Culture; Columbia University Press: New York, NY, USA, 2020; p. 256. ISBN 978-0-231-54258-6. [Google Scholar]
- Ortega-Villa, L.M.; Ley-Garcia, J. Analysis of Cultural Indicators: A Comparison of Their Conceptual Basis and Dimensions. Soc. Indic. Res. Int. Interdiscip. J. Qual. Life Meas. 2018, 137, 413–439. [Google Scholar] [CrossRef]
- Feldmeyer, D.; Wilden, D.; Jamshed, A.; Birkmann, J. Regional Climate Resilience Index: A Novel Multimethod Comparative Approach for Indicator Development, Empirical Validation and Implementation. Ecol. Indic. 2020, 119, 106861. [Google Scholar] [CrossRef]
- Goličnik Marušić, B.; Dremel, M.; Ravnikar, Ž. A Frame of Understanding to Better Link Nature-Based Solutions and Urban Planning. Environ. Sci. Policy 2023, 146, 47–56. [Google Scholar] [CrossRef]
- OECD; Union, E.; Commission, J.R.C.-E. Handbook on Constructing Composite Indicators: Methodology and User Guide; OECD Publishing: Paris, France, 2008; ISBN 978-92-64-04346-6. [Google Scholar]
- Cobb, C.W.; Douglas, P.H. Douglas A Theory of Production. Am. Econ. Rev. 1928, 18, 139–165. [Google Scholar]
- Kazepov, Y.; Verwiebe, R. Vienna: Still a Just City? 1st ed.; Routledge: London, UK, 2021; ISBN 978-1-00-313382-7. [Google Scholar]
- Kutty, A.A.; Wakjira, T.G.; Kucukvar, M.; Abdella, G.M.; Onat, N.C. Urban Resilience and Livability Performance of European Smart Cities: A Novel Machine Learning Approach. J. Clean. Prod. 2022, 378, 134203. [Google Scholar] [CrossRef]
- BMC. Update to MDOT Project Categorization Metodology in the Financial Forecast and Anote Regarding Inclusion of the Urbanized Area of Queen’s Anne County; Baltimore Metropolitan Council: Baltimore, Maryland, 2022. [Google Scholar]
- Liu, L.; Lei, Y.; Fath, B.D.; Hubacek, K.; Yao, H.; Liu, W. The Spatio-Temporal Dynamics of Urban Resilience in China’s Capital Cities. J. Clean. Prod. 2022, 379, 134400. [Google Scholar] [CrossRef]
- Schott, A.B.S.; Aspegren, H.; Bissmont, M.; La Cour Jansen, J. Modern Solid Waste Management in Practice: The City of Malmö Experience; SpringerBriefs in Applied Sciences and Technology; Springer: London, UK, 2013; ISBN 978-1-4471-6262-9. [Google Scholar]
- Yip, W.C.-M.; Hsiao, W.C.; Chen, W.; Hu, S.; Ma, J.; Maynard, A. Early Appraisal of China’s Huge and Complex Health-Care Reforms. Lancet 2012, 379, 833–842. [Google Scholar] [CrossRef]
- Zhou, S.; Xu, J.; Ma, X.; Yuan, B.; Liu, X.; Fang, H.; Meng, Q. How Can One Strengthen a Tiered Healthcare System through Health System Reform? Lessons Learnt from Beijing, China. Int. J. Environ. Res. Public Health 2020, 17, 8040. [Google Scholar] [CrossRef] [PubMed]
- The Lancet What Can Be Learned from China’s Health System? Lancet 2012, 379, 777. [CrossRef] [PubMed]
- Hochrainer-Stigler, S.; Laurien, F.; Velev, S.; Keating, A.; Mechler, R. Standardized Disaster and Climate Resilience Grading: A Global Scale Empirical Analysis of Community Flood Resilience. J. Environ. Manag. 2020, 276, 111332. [Google Scholar] [CrossRef] [PubMed]
- Chen, K.-F.; Leandro, J. A Conceptual Time-Varying Flood Resilience Index for Urban Areas: Munich City. Water 2019, 11, 830. [Google Scholar] [CrossRef] [Green Version]
- Young, A.F.; Marengo, J.A.; Martins Coelho, J.O.; Scofield, G.B.; de Oliveira Silva, C.C.; Prieto, C.C. The Role of Nature-Based Solutions in Disaster Risk Reduction: The Decision Maker’s Perspectives on Urban Resilience in São Paulo State. Int. J. Disaster Risk Reduct. 2019, 39, 101219. [Google Scholar] [CrossRef]
- Wang, Y.; Cai, Y.; Xie, Y.; Chen, L.; Zhang, P. An Integrated Approach for Evaluating Dynamics of Urban Eco-Resilience in Urban Agglomerations of China. Ecol. Indic. 2023, 146, 109859. [Google Scholar] [CrossRef]
- Muñoz-Erickson, T.A.; Meerow, S.; Hobbins, R.; Cook, E.; Iwaniec, D.M.; Berbés-Blázquez, M.; Grimm, N.B.; Barnett, A.; Cordero, J.; Gim, C.; et al. Beyond Bouncing Back? Comparing and Contesting Urban Resilience Frames in US and Latin American Contexts. Landsc. Urban Plan. 2021, 214, 104173. [Google Scholar] [CrossRef]
- Spears, R. Group Identities: The Social Identity Perspective. In Handbook of Identity Theory and Research; Schwartz, S.J., Luyckx, K., Vignoles, V.L., Eds.; Springer Science+Business Media: New York, NY, USA, 2011; pp. 201–224. [Google Scholar]
- Unger, J.B. Cultural Identity and Public Health. In Handbook of Identity Theory and Research; Schwartz, S.J., Luyckx, K., Vignoles, V.L., Eds.; Springer: New York, NY, USA, 2011; pp. 811–825. ISBN 978-1-4419-7988-9. [Google Scholar]
- Forrester, J.W. Industrial Dynamics; MIT Press: Cambridge, MA, USA, 1961. [Google Scholar]
- Sterman, J.D. All Models Are Wrong: Reflections on Becoming a Systems Scientist. Syst. Dyn. Rev. 2002, 18, 501–531. [Google Scholar] [CrossRef]
- Wang, L. Exploring a Knowledge Map for Urban Resilience to Climate Change. Cities 2022, 131, 104048. [Google Scholar] [CrossRef]
Figure 1.
World map showing the distribution of the cases covered by the study as marked in blue. Spatial Map built using Amchart1.
Figure 1.
World map showing the distribution of the cases covered by the study as marked in blue. Spatial Map built using Amchart1.

Figure 2.
Dimensions of the comparative urban resilience index. Note in yellow the highlight of identity as a distinctive approach of this index when compared to the literature.
Figure 2.
Dimensions of the comparative urban resilience index. Note in yellow the highlight of identity as a distinctive approach of this index when compared to the literature.

Figure 3.
(a–f): Comparative performance by dimension. (a): population for 2000 and 2020. Major variations were in Vienna, followed by Beijing and Malmö. (b): Economics for 2000 and 2020. Major variations in Malmö and São Paulo (downward) and Baltimore and Vienna (upward). (c): Governance for 2000 and 2020. Note the decline in Beijing and Shanghai and the increase in Malmo. (d): Health for 2000 and 2020. The situation improved in every city except for Vienna. (e): Environment for 2000 and 2020. Every city increased its environmental quality. Highlights are Baltimore and Beijing. (f): Identity for 2000 and 2020. All cities have improved their identity dimension except for Shanghai and São Paulo.

Figure 4.
CURI performance in 2000 and 2020 for each city.

Figure 5.
Comparative performance 2000–2020.


Table 1.
Comparative urban resilience index indicators. Indicators per source. Indicators followed by * represent these indicators that are negatively correlated to the index.
Table 1.
Comparative urban resilience index indicators. Indicators per source. Indicators followed by * represent these indicators that are negatively correlated to the index.
| Dimension | Indicator | Source | |
|---|---|---|---|
| Population | P1 | Population density | [18,20] |
| P2 | The proportion of the population with minimum living standard * | [18,50] | |
| P3 | Human development index | [21] | |
| Economic | E1 | Per capita GDP | [17,18,20,50] |
| E2 | Per capita (disposable) income | modified from [17,18] | |
| E3 | The proportion of infrastructure investment in all investment | [17] | |
| E4 | Living costs * | modified from [17] | |
| E5 | Unemployment * | [13,20,50] | |
| E6 | The proportion of environmental expenditure in fiscal expenditure (%) | [18] | |
| Governance | G1 | Infrastructure density (area covered by infrastructure/total area) | [17] |
| G2 | Correct disposal of waste | [17] | |
| G3 | Recycle waste | [17] | |
| G4 | Energy consumption per GDP * | Our contribution | |
| G5 | Use of renewable energy | [17] | |
| Health | H1 | Life expectancy | [18] |
| H2 | Insurance penetration and density (e.g., Percentage of population covered by health insurance) | [18,20,50] | |
| H3 | The proportion of the vulnerable population (<16 or >60 years old) * | [13,50] | |
| H4 | Public health facilities per capita | [17,20] | |
| Environment | En1 | Proportion of permeable surface | [13,50] |
| En2 | Proportion of area converted into urban area * | [13,18] | |
| En3 | Green area per capita | [18,20,50] | |
| En4 | Days of poor air quality * | [18,50] | |
| En5 | The proportion of bikes relative to cars | Our contribution | |
| Identity | I1 | Nº protected and historical landmarks, cultural places (cinemas, museums) per capita (×100k) | Adapted from [17,36] |
| I2 | Literacy and educational attainment | Our contribution | |
| I3 | Percentage of total budget spent on culture | Our contribution | |
| I4 | Number of startups | Our contribution | |
| I5 | Students in universities per 10k people | Our contribution | |
| I6 | Number of patents per 10k people | Our contribution |
Table 2.
Values for each dimension (2000).
| Popul. | Econ. | Governance | Health | Environ. | Identity | CURI 2000 | |
|---|---|---|---|---|---|---|---|
| Malmö | 0.9641 | 1.0944 | 0.8035 | 0.9249 | 0.9356 | 0.6847 | 0.9810 |
| Vienna | 1.2660 | 0.9309 | 0.9010 | 0.9569 | 1.0000 | 0.7396 | 0.9921 |
| Beijing | 0.9616 | 0.9586 | 0.9970 | 1.0012 | 0.6919 | 0.6892 | 0.9773 |
| Shanghai | 1.0238 | 0.9684 | 0.8562 | 0.9263 | 0.7714 | 0.9350 | 0.9843 |
| Baltimore | 1.0381 | 0.9264 | 0.8737 | 0.9249 | 0.7549 | 0.7454 | 0.9772 |
| São Paulo | 1.0728 | 0.9217 | 0.9018 | 0.8715 | 0.7549 | 0.9945 | 0.9851 |
Table 3.
Calculated values for the year 2020. Blue means increase, and red means decrease when compared to 2000.
Table 3.
Calculated values for the year 2020. Blue means increase, and red means decrease when compared to 2000.
| Popul. | Econ. | Governance | Health | Environ. | Identity | CURI 2020 | |
|---|---|---|---|---|---|---|---|
| Malmö | 1.0736 | 1.0402 | 0.8655 | 0.9510 | 1.0926 | 0.8227 | 0.9947 |
| Vienna | 0.9730 | 0.9717 | 0.8488 | 0.9518 | 1.1083 | 0.7948 | 0.9890 |
| Beijing | 1.0703 | 0.9889 | 0.7712 | 1.0220 | 0.9163 | 0.9024 | 0.9897 |
| Shanghai | 1.0646 | 0.9600 | 0.7474 | 0.9554 | 0.9745 | 0.7643 | 0.9832 |
| Baltimore | 1.0317 | 0.9869 | 0.8606 | 0.9435 | 1.0091 | 0.7622 | 0.9875 |
| São Paulo | 1.0168 | 0.8378 | 0.8797 | 0.8972 | 0.9262 | 0.7320 | 0.9784 |
Disclaimer/Publisher’s Note: The statements, opinions and data contained in all publications are solely those of the individual author(s) and contributor(s) and not of MDPI and/or the editor(s). MDPI and/or the editor(s) disclaim responsibility for any injury to people or property resulting from any ideas, methods, instructions or products referred to in the content. |
© 2023 by the authors. Licensee MDPI, Basel, Switzerland. This article is an open access article distributed under the terms and conditions of the Creative Commons Attribution (CC BY) license (https://creativecommons.org/licenses/by/4.0/).
Share and Cite
MDPI and ACS Style
Oliveira, B.; Fath, B.D. Comparative Resilience Evaluation—Case Study for Six Cities in China, Europe, and the Americas. Land 2023, 12, 1182. https://doi.org/10.3390/land12061182
AMA Style
Oliveira B, Fath BD. Comparative Resilience Evaluation—Case Study for Six Cities in China, Europe, and the Americas. Land. 2023; 12(6):1182. https://doi.org/10.3390/land12061182
Chicago/Turabian StyleOliveira, Bruno, and Brian D. Fath. 2023. "Comparative Resilience Evaluation—Case Study for Six Cities in China, Europe, and the Americas" Land 12, no. 6: 1182. https://doi.org/10.3390/land12061182
Note that from the first issue of 2016, this journal uses article numbers instead of page numbers. See further details here.