
Are Floods Becoming a More Expensive Hazard? A Damages Review of the Southeastern Spanish Coast (1996–2016)


Geography Department, University of Málaga, 29010 Málaga, Spain
Land 2023, 12(5), 1035; https://doi.org/10.3390/land12051035
Submission received: 24 March 2023
/
Revised: 27 April 2023
/
Accepted: 27 April 2023
/
Published: 9 May 2023
(This article belongs to the Special Issue Methods and Tools for Spatial Modelling of Urban Processes: Multidimensionality, Temporality and Territoriality)
Abstract
:Over the last few decades, an increasing economic and social flooding damages trend has been recorded worldwide. Although this situation was initially associated with climate change, recently different institutions and scientific papers have related this trend to two main reasons: (i) a human population increase and (ii) the number of assets located in floodable areas. In this regard, this paper analyses evolutions in flood damages and their causes in a Mediterranean area, the provinces of Alicante and Murcia, between 1996 and 2016. The duration of this period, from a flood risk management policy point of view, is very important because it encompasses one of the most important legislative periods at a national and European level. As a main result, this paper establishes a temporal and spatial pattern related to increases in flood damages and their main influence on coastal areas, respectively, due to certain economic, spatial and temporal factors. As a conclusion, these trends demonstrate the inefficiency of flood risk management policies, especially those connected with spatial planning.
1. Introduction
According to records, economic and social impacts joined with natural hazards have been growing over time, especially in the case of floods [1,2]. In fact, regarding international databases [1,3], floods have become the most recurrent natural phenomenon during the last ten years (e.g., 345 floods were recorded worldwide with 6505 deaths and damages of approximately EUR 30 billion in 2017). However, although this trend has traditionally been associated with natural climatic variations [4] and, recently, with the current and future consequences derived from anthropogenic climate change [5], a multitude of studies highlighted the importance of socio-economic factors as the main cause of people’s exposure increase [2,6,7,8,9]. In this regard, it should be emphasized that, according to the last EU report on exposure to natural hazards, while the population exposed to flooding doubled between 1975 and 2015, the built-up area in flood zones increased by 181% in the same period [10].
Unfortunately, these human-made risk scenarios reach worrying rates in coastal areas [10,11], such as along the Mediterranean basin [2,12] and, especially, on the Spanish coast [9,13,14]. Within the Spanish territory, this dramatic exposure scenario was related to the neoliberal real estate development registered since the 1980s [15,16], which raised urban growth rates above any other historical period [17]. A paradigmatic example of this excessive real estate development is reflected in the records achieved in the year 2006, when the property rates in Spain were greater than in Belgium, Denmark, Finland, Greece, Italy and the United Kingdom combined [18]. Among all the Spanish areas, this disproportionate construction pattern was especially worrying on the Mediterranean coast [16,19], where both the number of people exposed to floods [9,20] and the total amount of economic losses [6,21] created a phenomenon called the “costalization of risk” [22]. In this regard, according to the works of [16,23], the main socio-economic factor that boosted this process was linked to the intense speculation of land resources. Indeed, while at the national level the average urban land increased by 12% between 2004 and 2007, in Mediterranean provinces it increased by 47% [24]. In addition to these speculative circumstances and their associated urban bubble [13,19], Mediterranean coastal population centers have also undergone an intense demographic transformation process [12,13,17,25]. In the first place, the beneficial working conditions and employment rates drove a strong national migratory movement to coastal areas [26], a situation that implied a considerable increase in the demand for second homes [27]. Secondly, although more than eight million people (approximately 18% of the Spanish population) reside in this area [28], the massive and growing tourism flows recorded since Spain joined the European Union in 1986 have changed the traditional population dynamic [29]. In fact, these people, referred to by [25] as “sun migrants”, came to represent 25% of the total immigration (more than 700,000 people).
In addition to socio-economic factors, current risk scenarios have also been heavily conditioned and influenced, in several cases negligently, by the local land-use planners’ permissiveness [9,30]. In this respect, the disproportionate building ratios recorded in flood-prone areas [9,14,20] could be connected with two main causes: (i) the false sense of security granted to structural measures’ effectiveness [31,32,33] and (ii) the disregard of floods as an intrinsic component of the local climate [34]. As a consequence, these human factors, called “institutional vulnerability” in the scientific literature [14,35,36], generated one of the greatest contradictions in Spain: the development of multiple mandates involved with flood risk management policies (i.e., specific plans and sectoral measures at national, autonomic and local levels), which had a subsequent ineffective application in practice [9,30].
Therefore, the occupation of flood-prone areas due to rapid and unplanned urbanization growth represents the main problem join with exposure increase and, consequently, vulnerability [9,12,14,20]. In fact, according to [37], flooding in Spain became the natural hazard with the highest number of processed files (almost 70%, 553,428 records), economic impact (approximately EUR 4.9 billion) and fatalities (184 people) between 1987 and 2016. However, although there are different quantitative databases and publications about flood damages at global [1,3], European [2,38,39] and national levels [6,22,37], the scientific literature lacks a study in charge of evaluating the different economic, social and territorial factors underlying this phenomenon, an important gap that this paper will try to fill.
Thus, in light of the above, the main aim of this paper is to quantify the evolutions in economic flood damages and to determine their root causes. As a result, three associated aspects are expected to be addressed: (i) establishing a flood damages trend, (ii) detecting spatial and temporal patterns, and (iii) identifying the socio-economic factors related to them. To achieve these purposes, the study was focused on the Spanish Mediterranean coast, specifically in the southern provinces of Alicante and Murcia, one of the areas most affected by riverine and coastal floods [37,40]. Additionally, the study was developed according to official data, i.e., financial compensation for floods paid by the Spanish Insurance Compensation Consortium between 1996 and 2016. Finally, after adjusting the values for inflation, the data were analyzed from a statistical, socio-economic and cartographic point of view.
2. Materials and Methods
2.1. Study Area
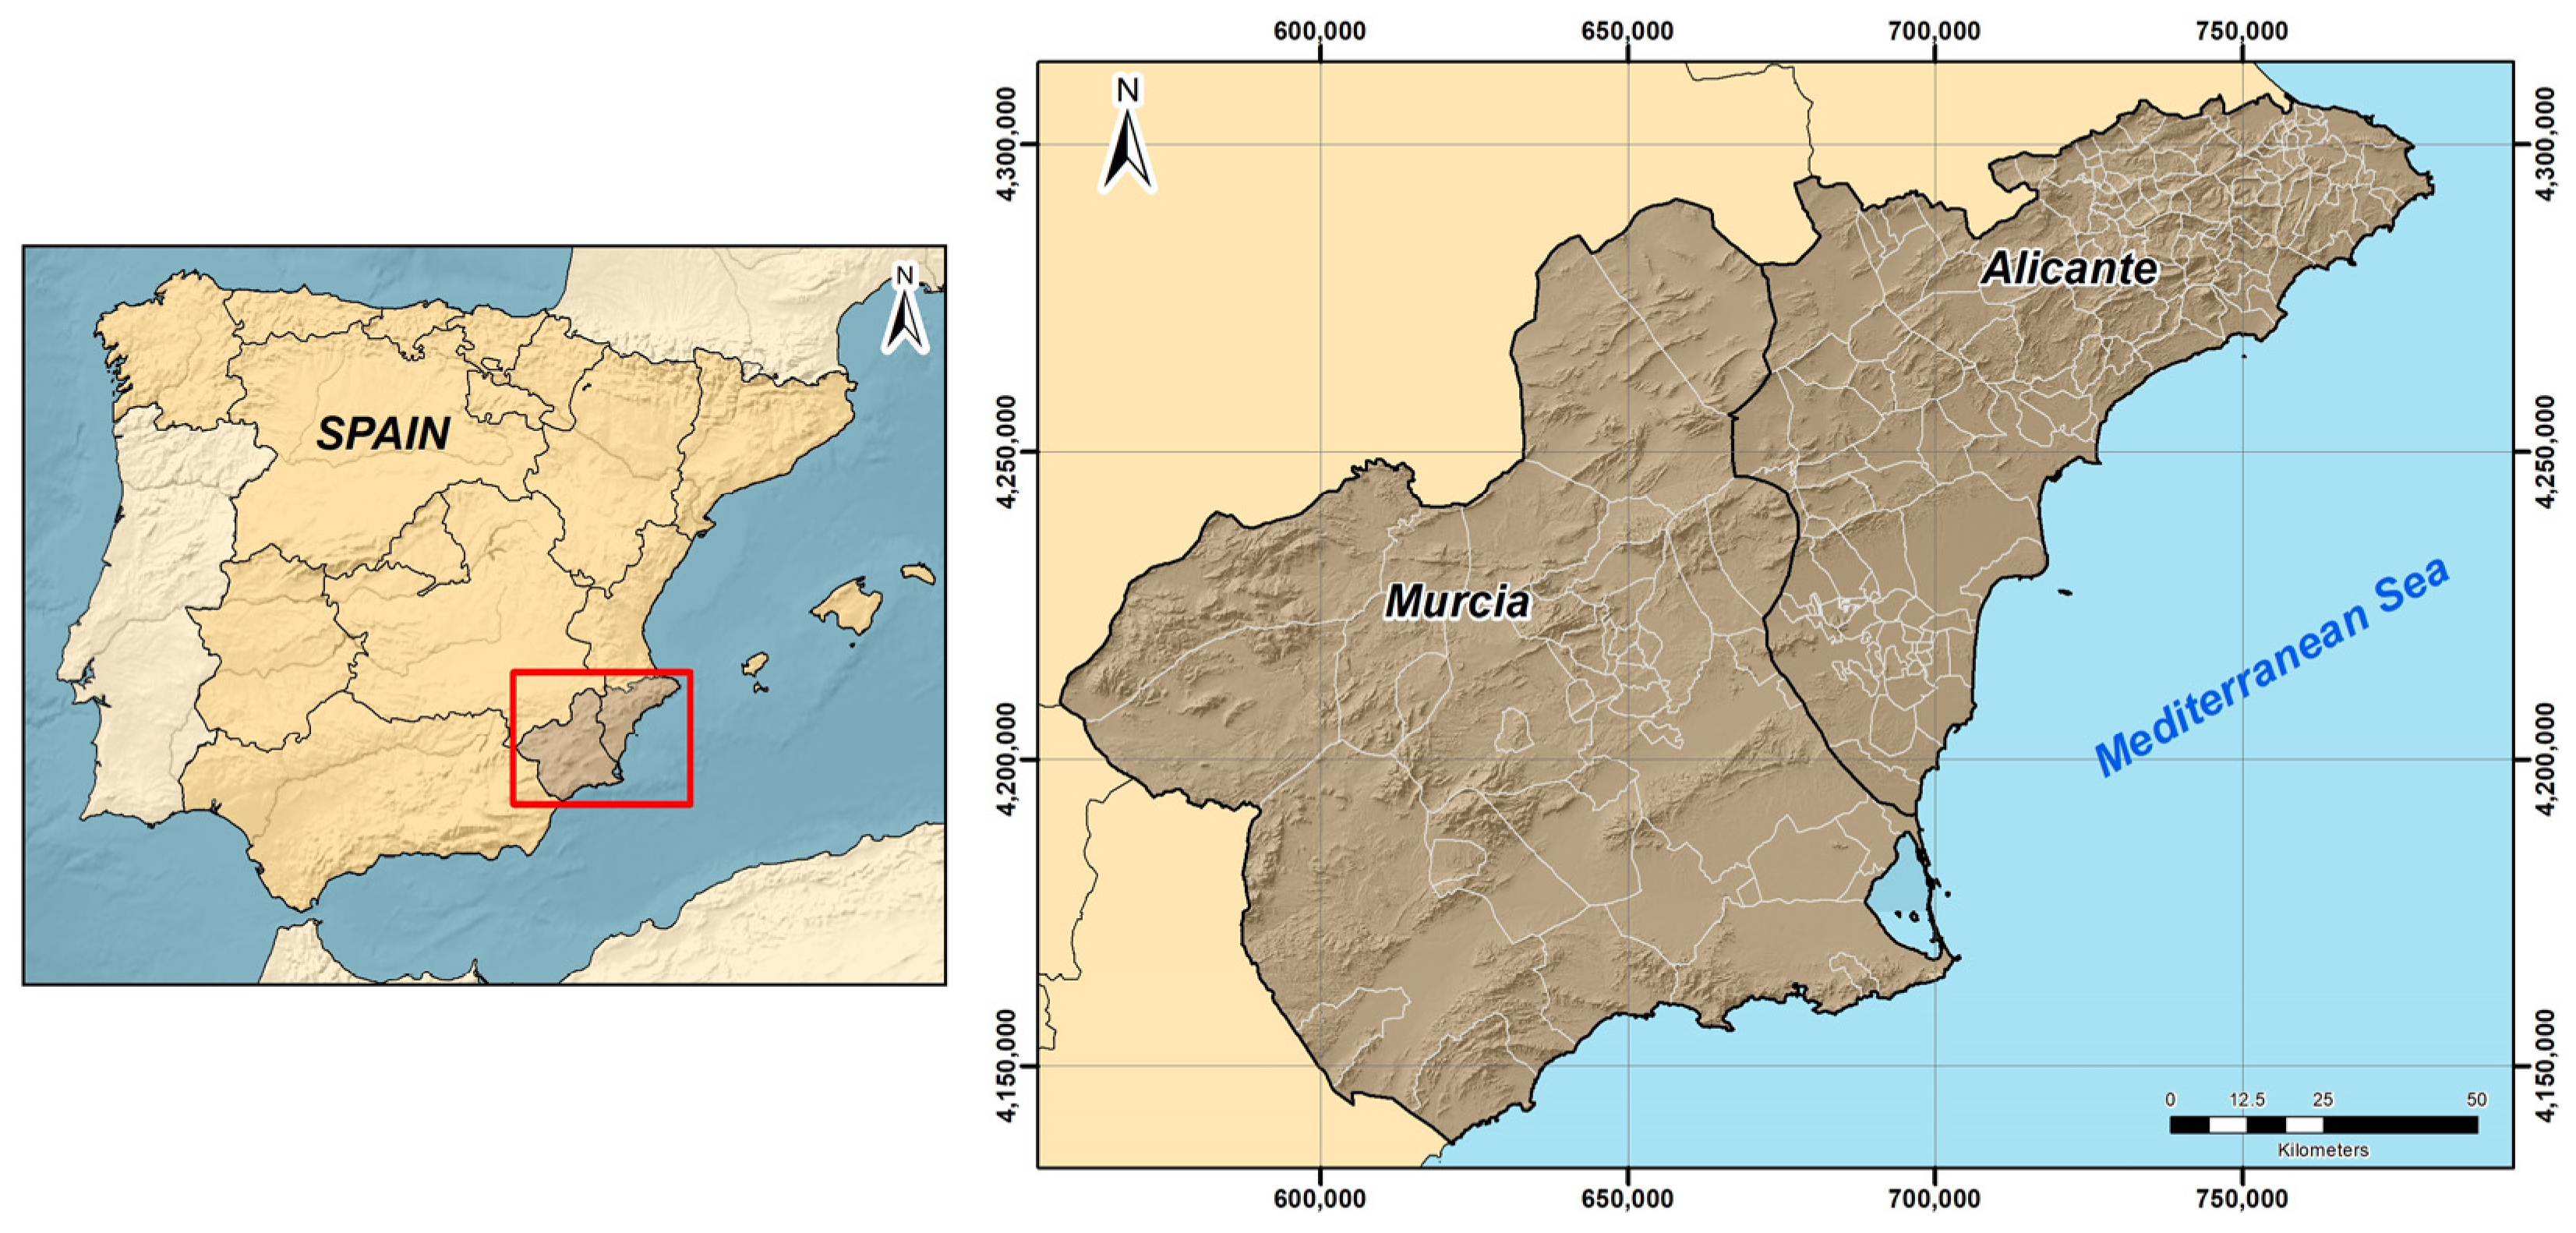
Among all the regions surrounded by the Mediterranean Sea, this paper has been focused on the southern Spanish coastline, specifically in the provinces of Alicante (Community of Valencia) and Murcia (Region of Murcia) (Figure 1). This assumption was based on two fundamental aspects: (i) these provinces represent one of the Spanish areas where the effects of flooding have been widely studied, e.g., [9,14,20,30,41], and (ii) disproportionate construction rates (dwellings and developed area) were recorded in each province [22,24], in fact, in 2006 Alicante and Murcia became the fifth and third provinces with the highest number of dwellings built in Spain, respectively [9,30]. Additionally, two other paradigmatic examples related to the characteristics of the area reinforce its selection. Firstly, Spanish coastal municipalities recorded a major increase in exposure to flood hazards [14,20,21,41], and in the number of inhabitants [9,13,15,16,17,25].
From a demographic point of view, the study area is home to approximately 3.3 million inhabitants, i.e., 7% of the Spanish population [28]. However, during the summer season, the area receives near to 6% of Spain’s total tourism (more than 5.5 million visitors) and increases its population by almost 167% [28]. Consequently, as has been highlighted by several works e.g., [9,12,14,20], the combination of excessive real estate development and demographic factors has resulted in an ideal breeding ground for an increase in the built capital and population in floodable areas.
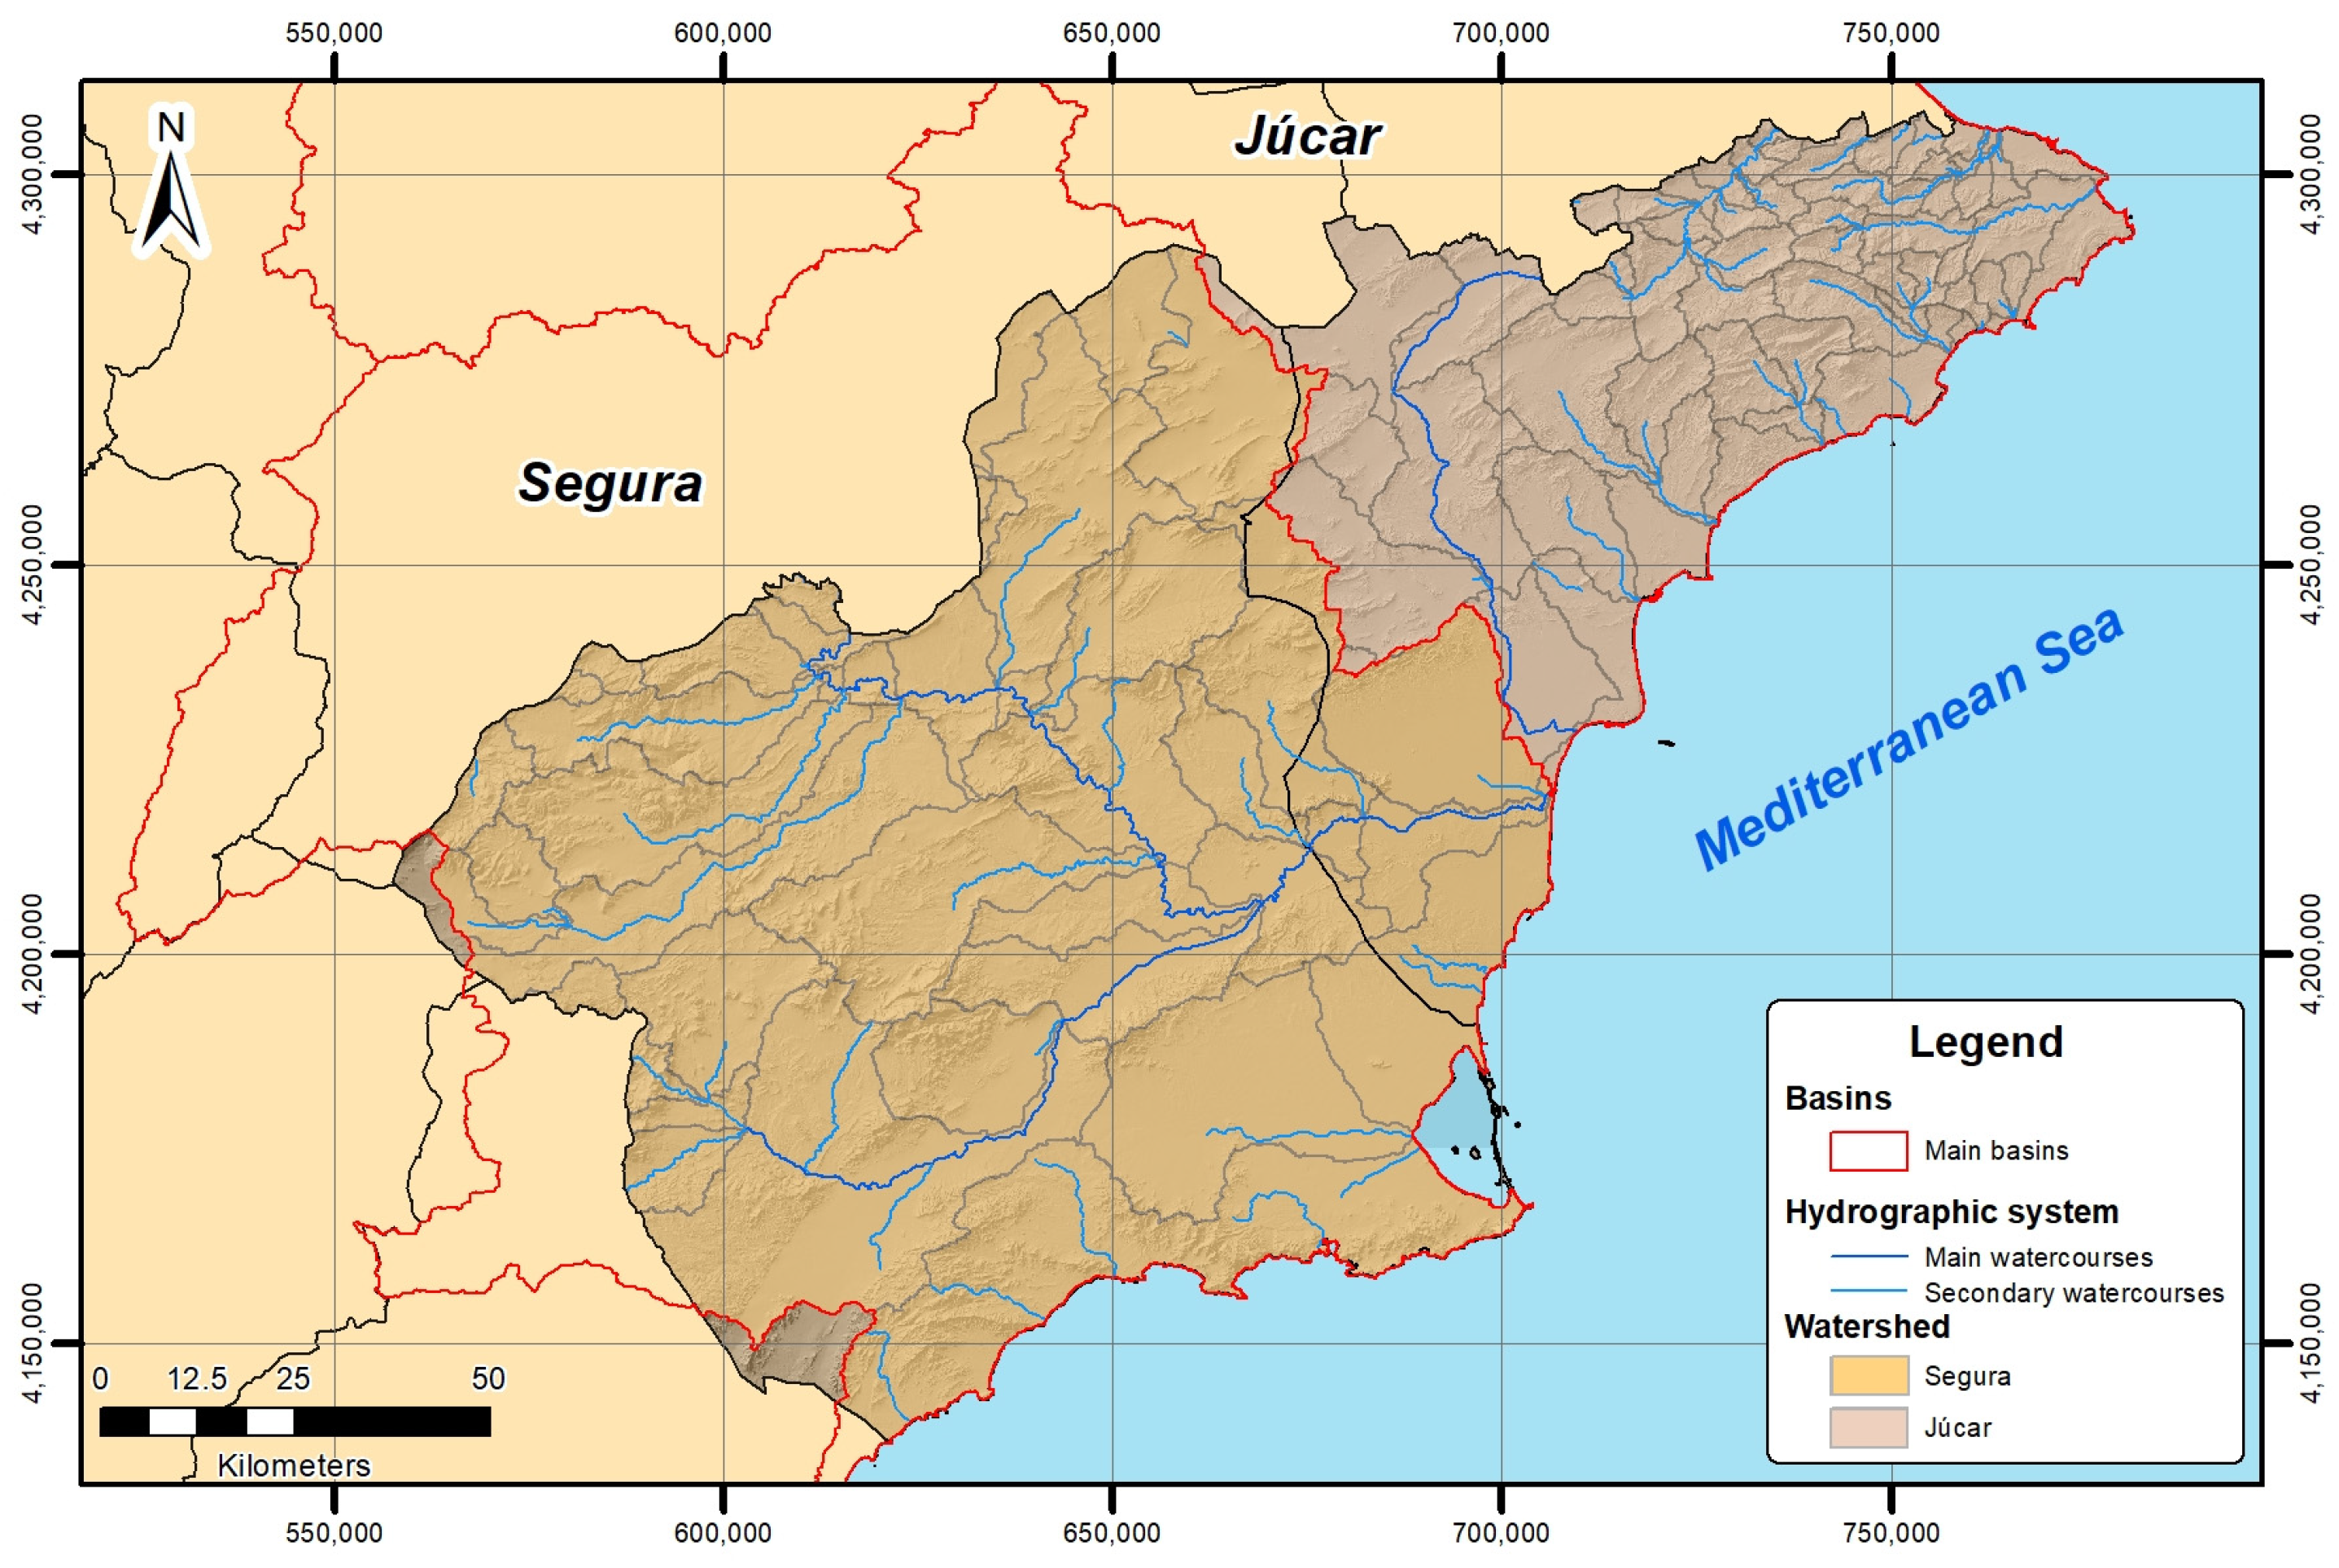
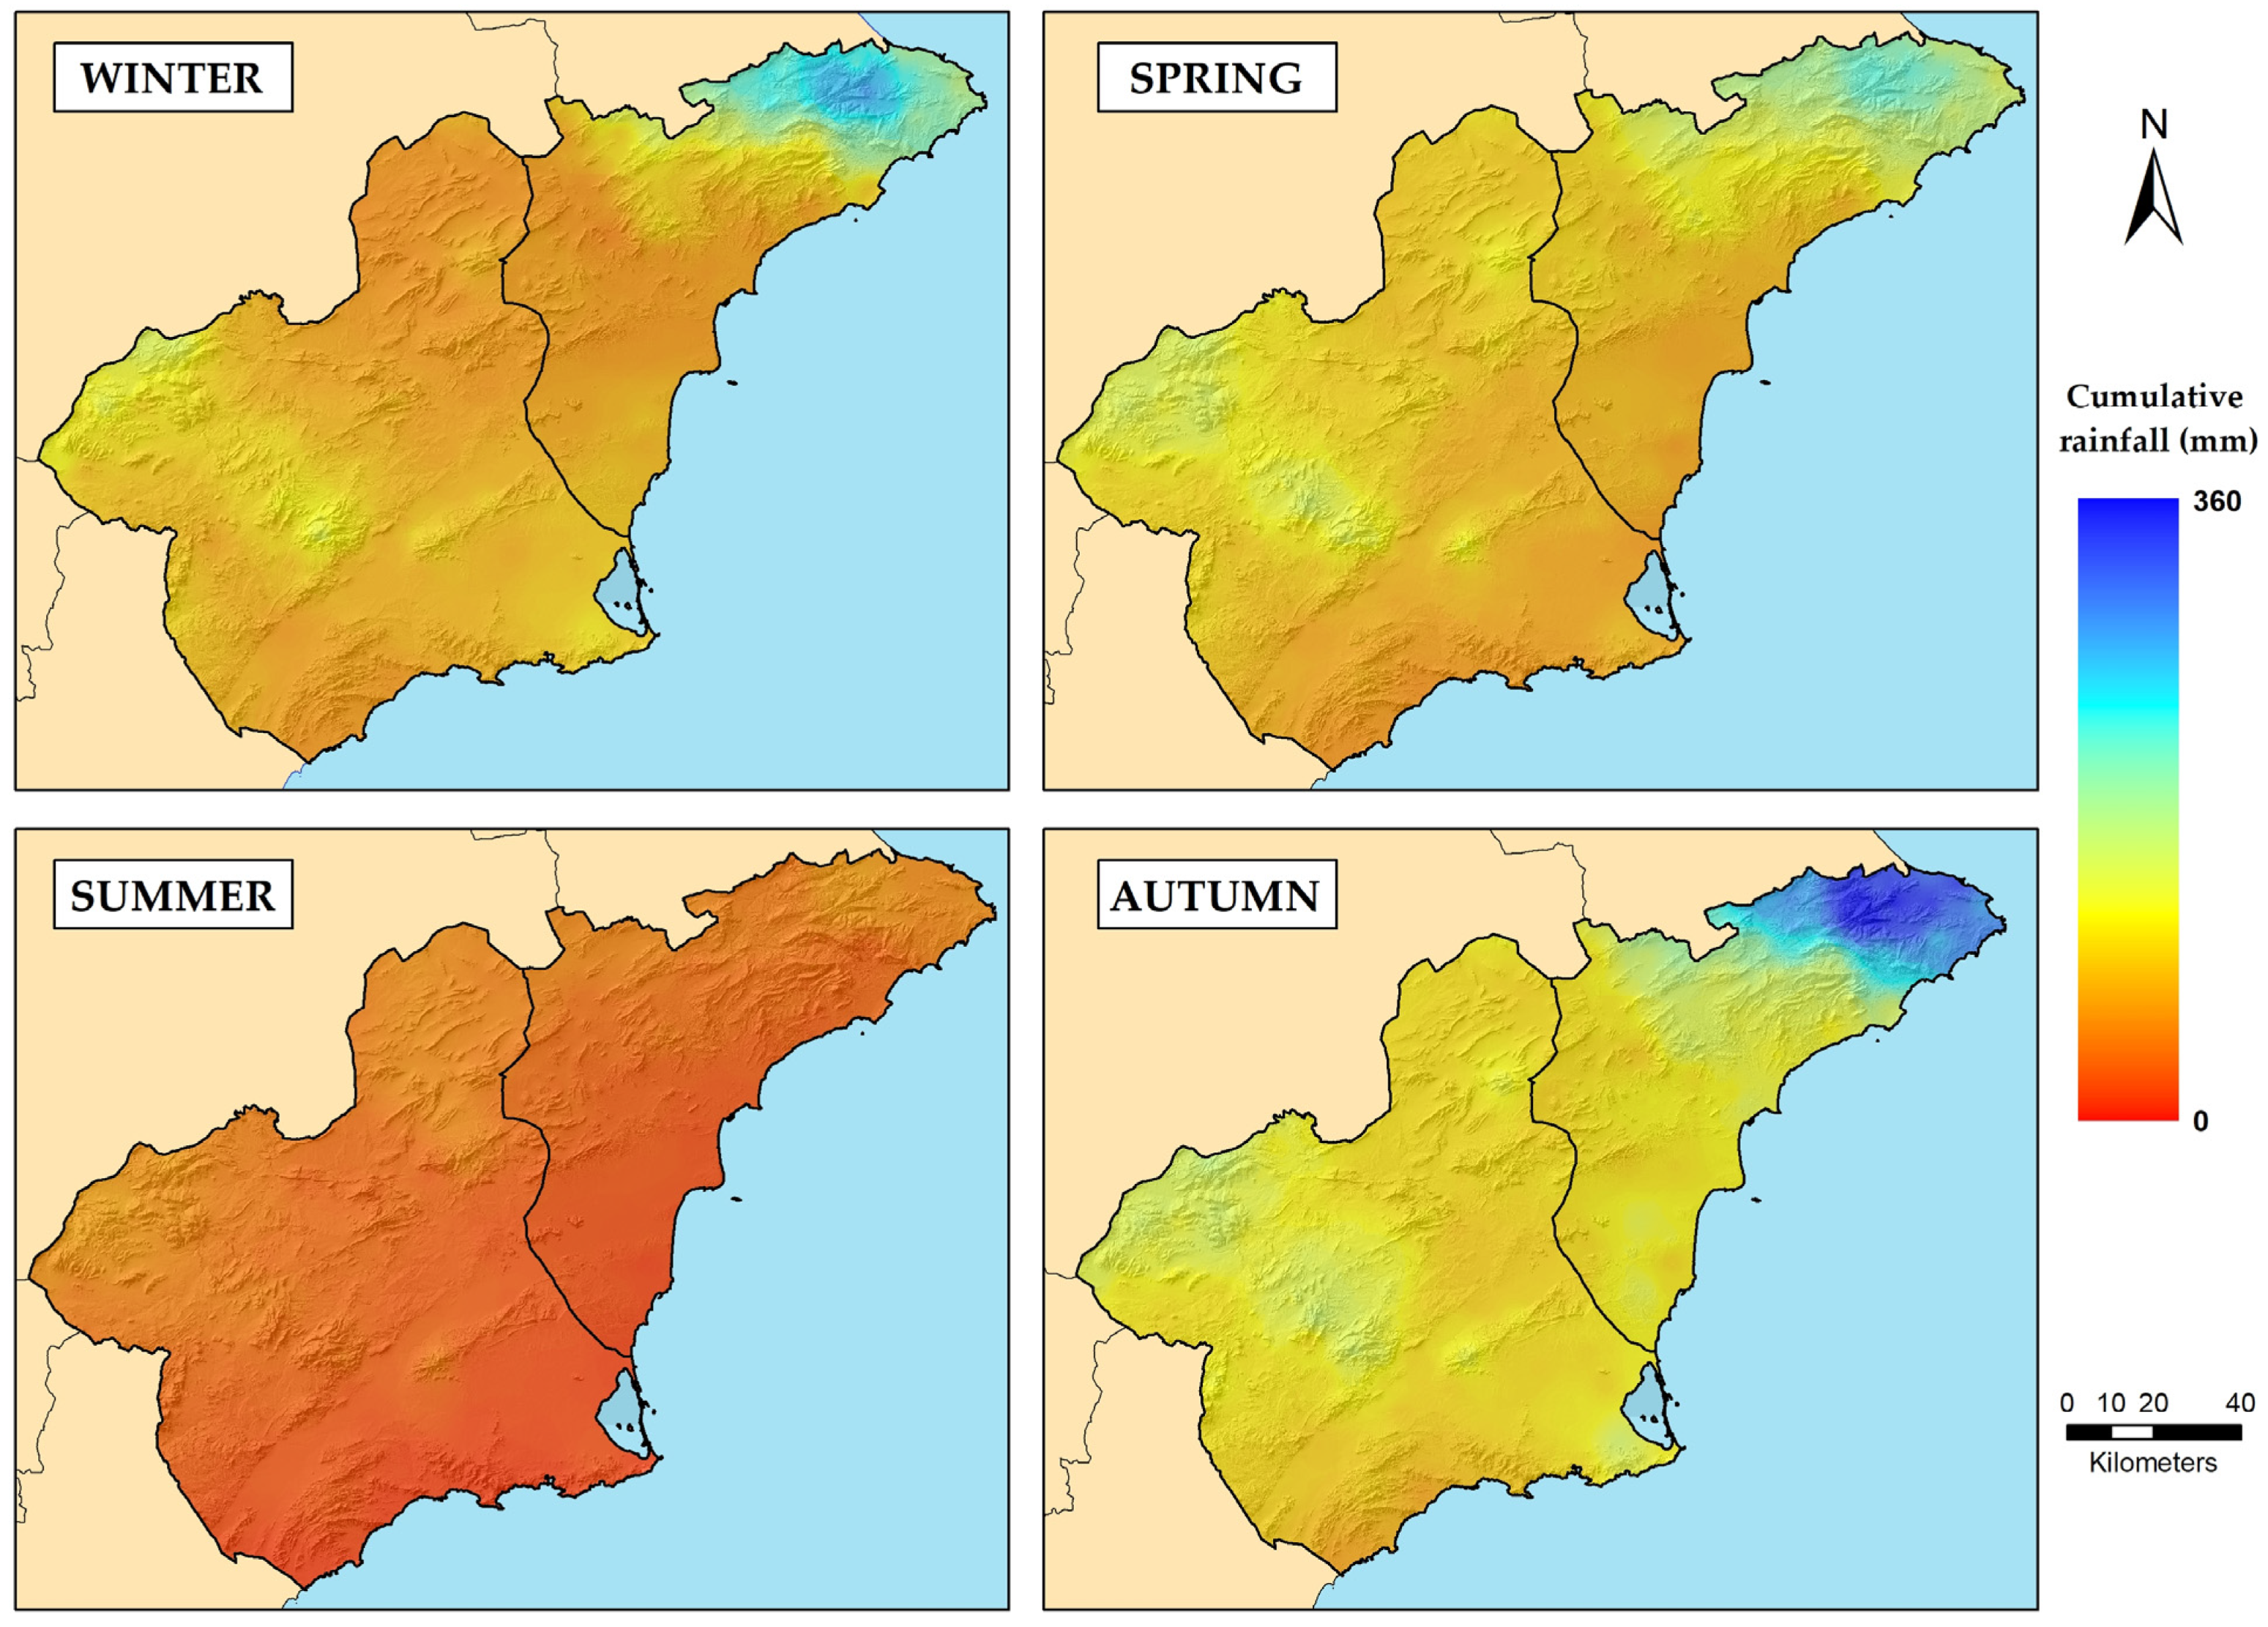
Hydrological and social factors have also played an important role in shaping the current risk scenarios. In this regard, although each province is embedded in a main river basin (the Júcar basin for Alicante and Segura for Murcia), the hydrological network is made up of several small watersheds (Figure 2) with torrential behavior and a responsibility for a multitude of flash floods [2,34,38,42]. Additionally, due to the fact that the hydrographic system is dry most of the year (except in certain seasons [43] when rainfall peaks occur, see Figure 3) and it is also regulated by several hydraulic infrastructures [20,44], the inhabitants have developed a false sense of security [9,45] that is faithfully reflected in their flood risk perception [27,28,30]. In fact, in spite of the fact that the population living in this area perceives flooding as an important issue at the municipal level [41,46,47], it is not considered to be the main environmental problem that they face [8,41,48,49,50]. Paradoxically, this situation is even more worrying in the city of Alicante, where, despite the recurrent flooding events [14,20,30], most of the inhabitants believe that they live in a non-flood-prone area [9].
2.2. Legal Framework
In contrast to other European countries, such as France, Greece or Italy, the Spain government has not developed any state-law framework concerning natural hazards [9,14]. However, to counteract this legal loophole, different management policies were included in a particular mode of governance [51] where sectoral mandatories (e.g., coastal zones, protected areas, environment management or industry), mainly those related to spatial planning, water and civil protection, achieved an essential role [9,22,41]. From a spatial planning perspective, the Spanish state has a wide range of regulations about land uses; in fact, the first national law was published in 1956 and the last one in 2015. Among all the regulations published to cope with the administrative, territorial and socio-demographic changes that occurred in Spain over the last sixty years, three laws stand out according to their novelty in regards to their precepts on flood management. The first is the 1998 Land Law, which introduced a strong land liberalization responsible for the last urban bubble [13,16,52] and considered natural hazards as a compulsory condition to define land uses [9,20]. The second is the 2008 Land Law, in charge of defining a more restrictive paradigm where hazard cartography took on a primordial role [9,22,30,41]. The last is the 2015 Land Law, where several issues of its predecessor were extended [14,16]. In addition, the current hierarchy and competence distribution introduced by the Spanish Constitution in 1978 should also be noted. According to this democratic framework, there are three public administrations responsible for spatial planning: (i) the national government, which is responsible for establishing a planning framework; (ii) autonomous communities, which define spatial planning and approve municipal instruments; and (iii) municipalities, which are administrations that actually determine land-use planning.
In addition to spatial planning policies, other national and international mandates have also considered several flood risk management policies. At the national level, the 1985 Water Law was the first Spanish regulation able to merge land uses and water governance [9,22], an incipient model that has been maintained to the present day and that could be called “spatial water governance” [51]. This novel approach was endorsed and extended years later by the Basic Guideline of Civil Protection for Planning Flood Risk, an innovative regulation published in 1995, which is in charge of people defense [9,14,30]. According to its legislative precepts (e.g., the definition of a special plan against floods, classification of flood zones and establishment of an action protocol), each autonomous community had to develop the flood-prone areas’ cartography in regard to different return periods (50, 100 and 500 years). Subsequently, these results formed the official cartography for river basins’ flood-prone areas, cartography that had to be considered as compulsory during spatial planning processes according to the 1998 Land Law [33,53].
Finally, this legal framework was completed at the European level by the Floods Directive (2007/60/EC), the first flood risk management directive focusing on prevention, protection and preparation [21] that really granted a fundamental role to land-use planning in order to reduce exposure [20,22,23,53]. However, this important paradigm change was not transposed into the Spanish legislation framework by a single mandate but rather progressively through different legislation [9,14]. Additionally, the Floods Directive also developed a new national cartographic model: the National System for Cartography of Flood-Prone Areas, which replaced the Basic Guideline as the official cartography for spatial planning [22,33,53].
2.3. Data and Methodology
Economic damages data from floods have been provided digitally by the Spanish Insurance Compensation Consortium (“Consorcio de Compensación de Seguros”, CCS for its acronym in Spanish). The Consortium is a public reinsurance institution coordinated by the current Ministry of Economic Affairs and Digital Transformation [54], but its origins date back to 1941, when it was created to cover damages derived from the Spanish Civil War (1936–1939). Among the different functions assigned to it [54], the following should be noted: (i) those related to compulsory automobile insurance, (ii) those related to managing extraordinary natural and human-made hazards that occur in Spain, (iii) those related to coping with personal damages resulting from extraordinary events occurring abroad to Spanish nationals, and (iv) those related to environmental liability insurance.
In the case of extraordinary hazards (i.e., those arising from nature, violent events or armed forces actions), the CCS copes with their associated damages, even if they are not included in an ordinary insurance policy [54]. In this regard, and according to the different natural hazards that appear in Spain [20,30], floods are the most damaging extraordinary hazard [54]; in fact, the Consortium covered 23,016 files with a total amount of EUR 64.62 million in 2017. Following this economic point of view, some of the most important flooding events that took place this year occurred in the Community of Valencia in January (EUR 7.5 million) and March (EUR 11.5 million), Jerez de la Frontera (Cádiz, Andalucía) in October (EUR 9.3 million) and Málaga (Andalucía) in February (EUR 6.9 million) [37].
Additionally, although floods could be classified in different ways, e.g., [2,38,55,56], the CCS establishes five classes according to the main causes that develop them: heavy rainfall, snow and ice-melt, lake, riverine and coastal floods. Among all these, this work focuses on the last two, because they are the most important according to their recurrence and economic and social importance. As mentioned above, flood damages data were provided by the CCS at the municipal level for the provinces of Alicante and Murcia between 1996 and 2016. These data included several fields related to (i) event date, (ii) location, (iii) municipality, (iv) zip code, (v) affected assets (businesses, industry assets, civil engineering, offices, motor vehicles or dwellings), and (vi) compensation paid (expressed in EUR). However, after analyzing the data in a greater level of detail, different minor tasks had to be adjusted (e.g., filling in empty fields, checking municipalities, zip codes or number format). Subsequently, in order to compare the different amounts of compensation paid regardless of their currency (until 2002, the peseta was the official circulation coinage in Spain) or event date (the data series cover 20 years), this field was updated to December 2017 according to the annual variation in the CPI [28]. Finally, the data were analyzed by the RStudio statistical software [57] and integrated into a GIS where map algebra was applied; therefore, these approaches establish important methodological contributions that differentiate this work from strictly quantitative ones, e.g., [6,16,35,39].
However, although this study tried to evaluate the influence of the different scenarios defined in the three land laws commented on above, it was finally decided to divide and analyze the data in two periods: (i) 1996–2005 and (ii) 2006–2016. In this regard, this assumption was established according to (i) the short application lifecycle of several laws according to their influence on spatial planning, (ii) the strong climatic variability in the Mediterranean area [58,59], especially rainfall records in western areas [21,59], and (iii) the flood damages data available. Lastly, despite the fact that data were provided monthly and, therefore, two identical periods could be established, they were was defined by ten and eleven years due to the fact that (i) 2006 was one of the years with less flood damages variability and a lower total amount of losses, especially regarding its predecessor and successor, respectively; (ii) annual registers are the most efficient way to simplify further calculations (better than monthly), and (iii) each period covers, respectively, a 65% and 69% likelihood of including damages caused by floods with a high probability (likely return period = 10 years) according to hazard scenarios defined by the Floods Directive.
3. Results
3.1. Flood Losses’ Evolution in the Study Area
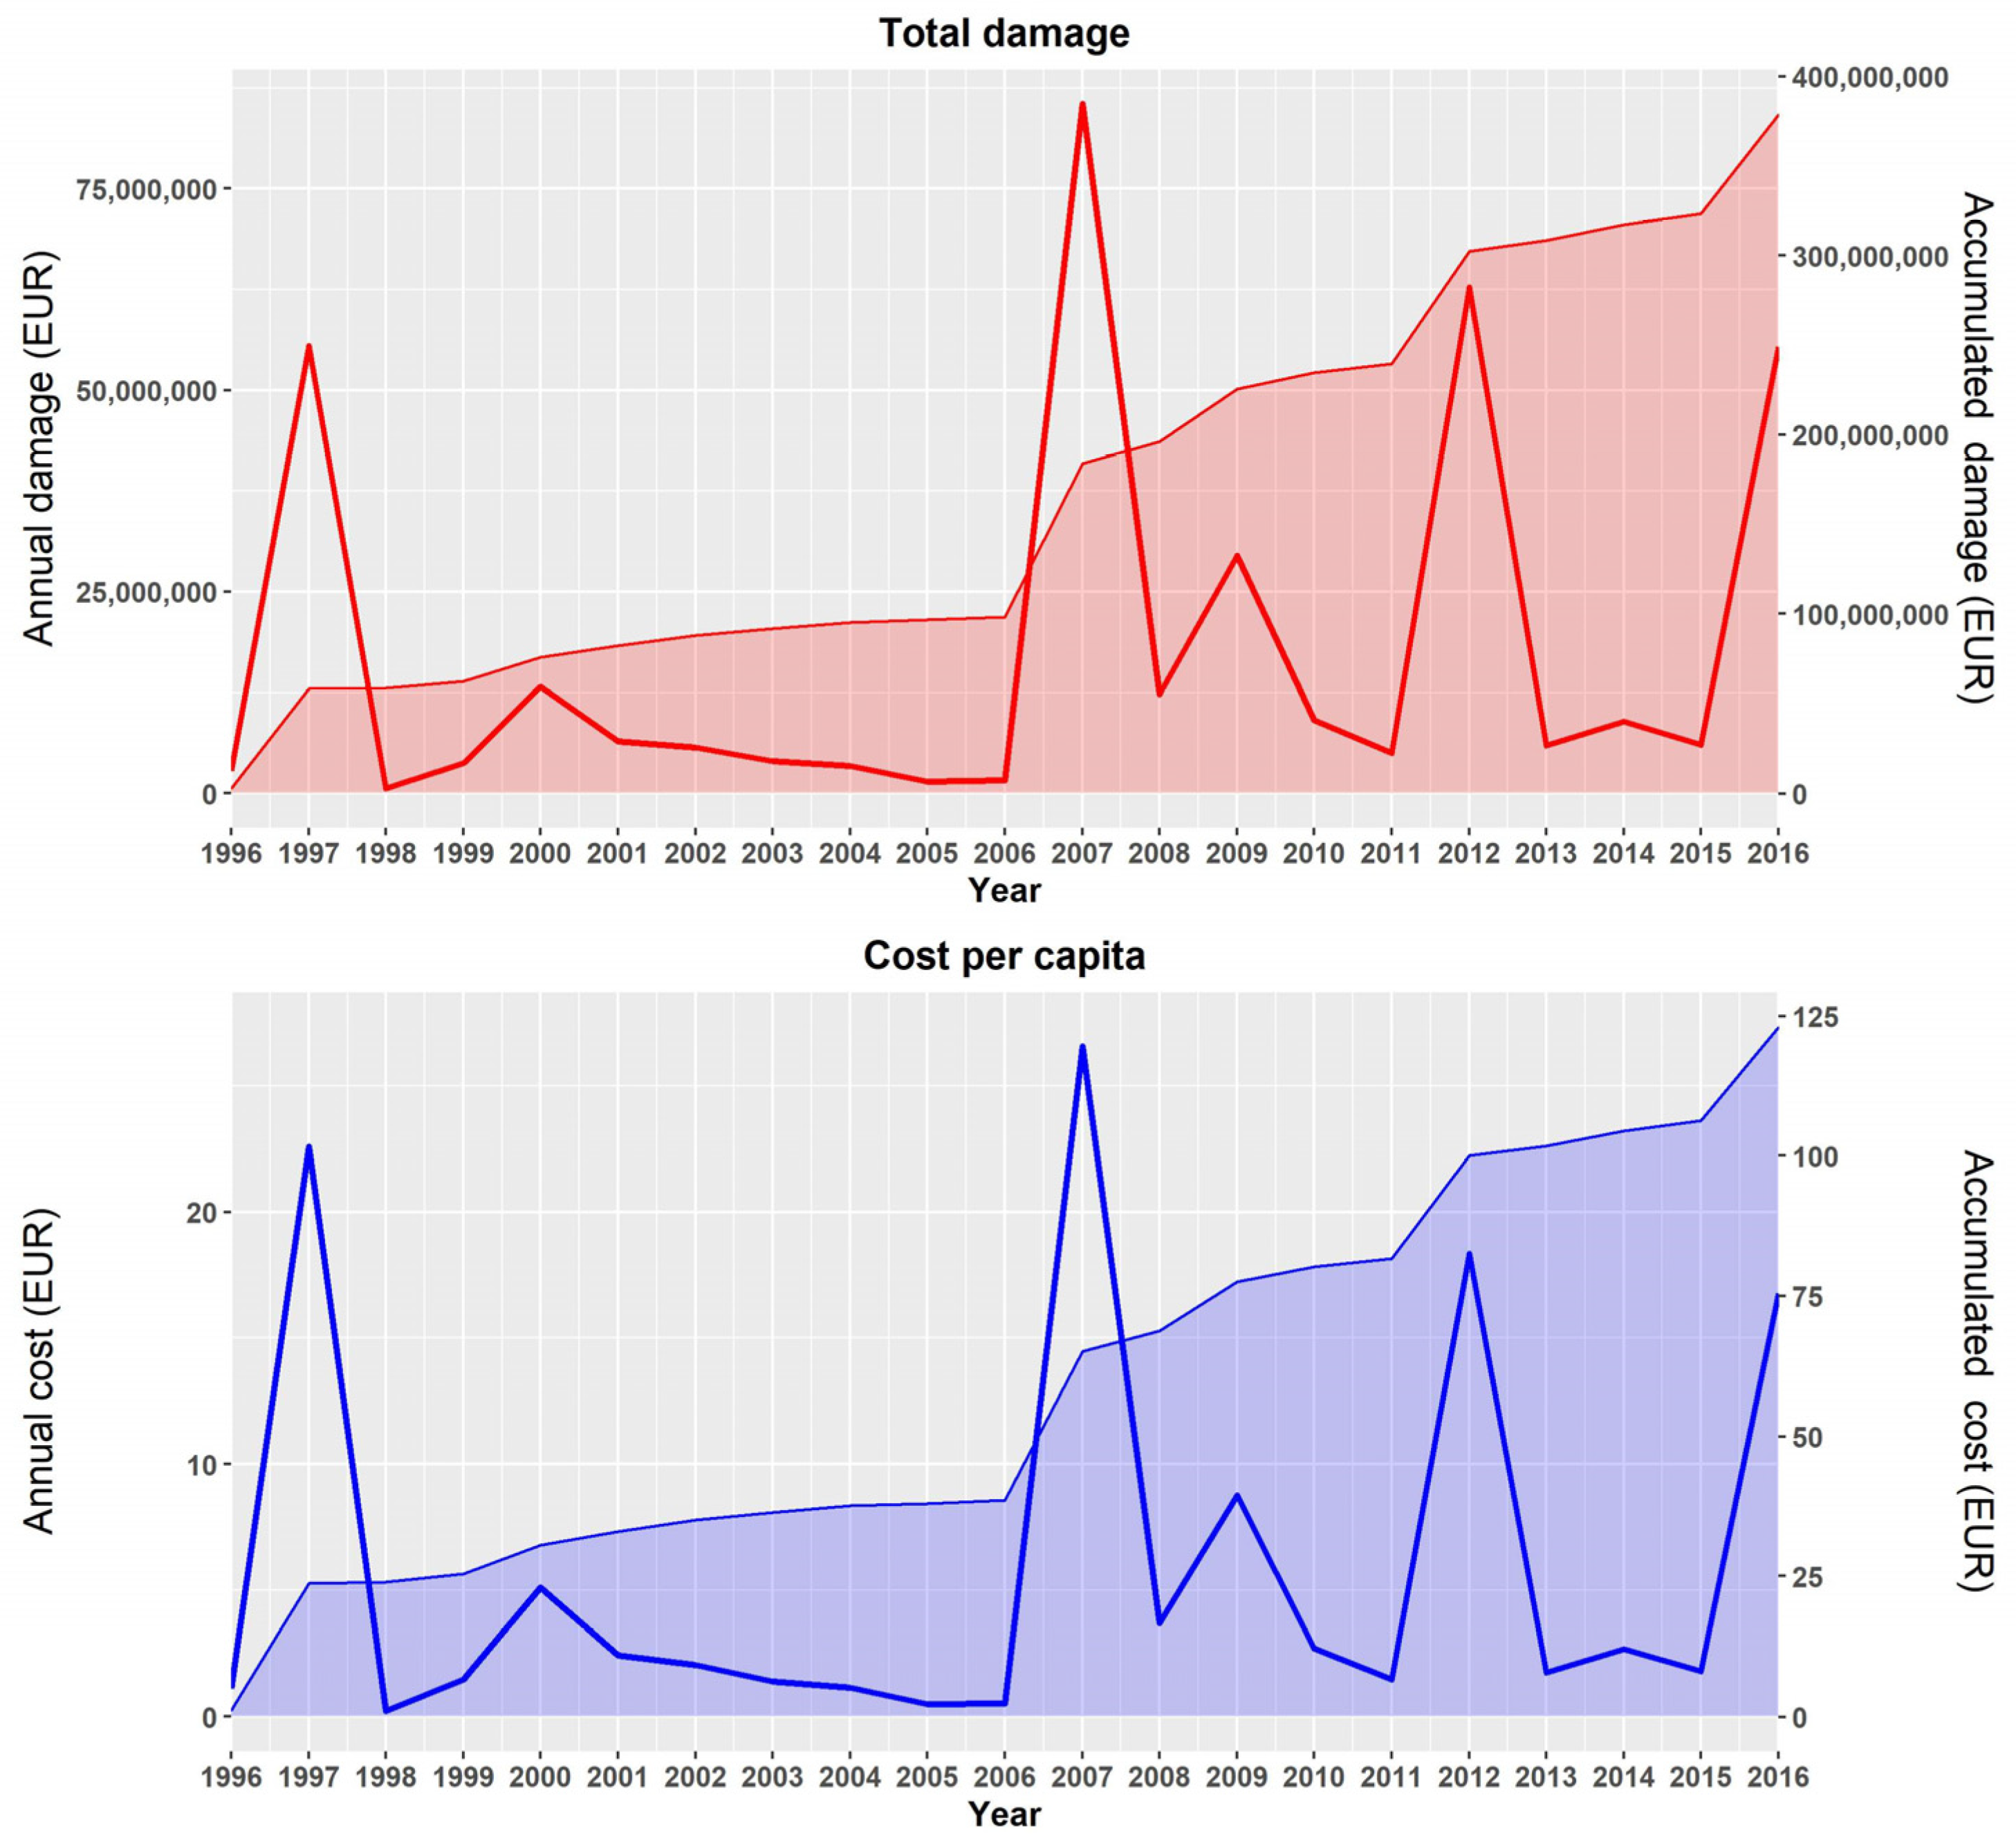
The results show a general increase in flood economic damages between 1996 and 2016 (Figure 4 (up)). In fact, considering overall damages, in this Mediterranean region flood losses were around EUR 380 million, i.e., an annual average growth higher than EUR 18 million. However, this situation was particularly worrying during the second part (2006–2016) of the period analyzed, when the damages were greater (about 189%) than the first period (1996–2005) (Wilcoxon signed-rank test, p-value < 0.05). In addition, translating this data to a socio-economic point of view, each inhabitant of the study area should pay an average of 6 EUR/year to compensate flood damages covered by the CCS, an amount that reached 23 EUR/year and 27 EUR/year in 1997 and 2007, respectively (see Figure 4 (down)).
In general, although the compensation paid increased by over EUR 50 million during the period studied (an average of more than 2.6 million EUR/year), the series is characterized by a high inter-annual variability (a EUR 25 million standard deviation). However, according to the change-point test regarding mean value, four different flood damages stages could be established (Table 1). In this way, despite the decrease in flood damages in the second stage, it should be highlighted that there was a significant increase in the other stages, especially in the last one, when four of the most catastrophic events happened.
Analyzing the results in regard to each asset, the data obtained are quite alarming (Table 2). In this context, the total damages amount covered has increased by almost two thousand times in only twenty years, a situation that, together with the significant financial outlay it represents for the CCS, questions the influence of (i) the constraints established by the different land laws, (ii) the Basic Guideline of Civil Protection for Planning Flood Risk cartography, and (iii) the principles of the Floods Directive (2007/60/EC) on spatial planning. However, although this flood hazard scenario could be related to natural climate oscillation, it should be remembered that, while rainfall intensity has remained stable in the Mediterranean region over the last few decades [59,60,61,62], conversely, urban growth in floodable areas had not stopped increasing [10,14,20] and it is expected to continue to do so [63].
In greater detail, i.e., according to the damages increase by asset, offices achieve the highest value (11,452%), followed by businesses (2524%) and motor vehicles (2478%). However, in spite of the fact that the changes recorded in each period for dwellings, offices and motor vehicles are the most significant (see Table 2), regarding relevance to total economic losses, the three highest values are for dwellings (46%, more than EUR 173 million), businesses (26%, around EUR 100 million) and motor vehicles (14%, nearly EUR 55 million). As a consequence, the disproportionate damages increase for properties and human settlements is a notorious fact that reflects both the gradual urbanization of floodable areas and the location of higher-value assets on them.
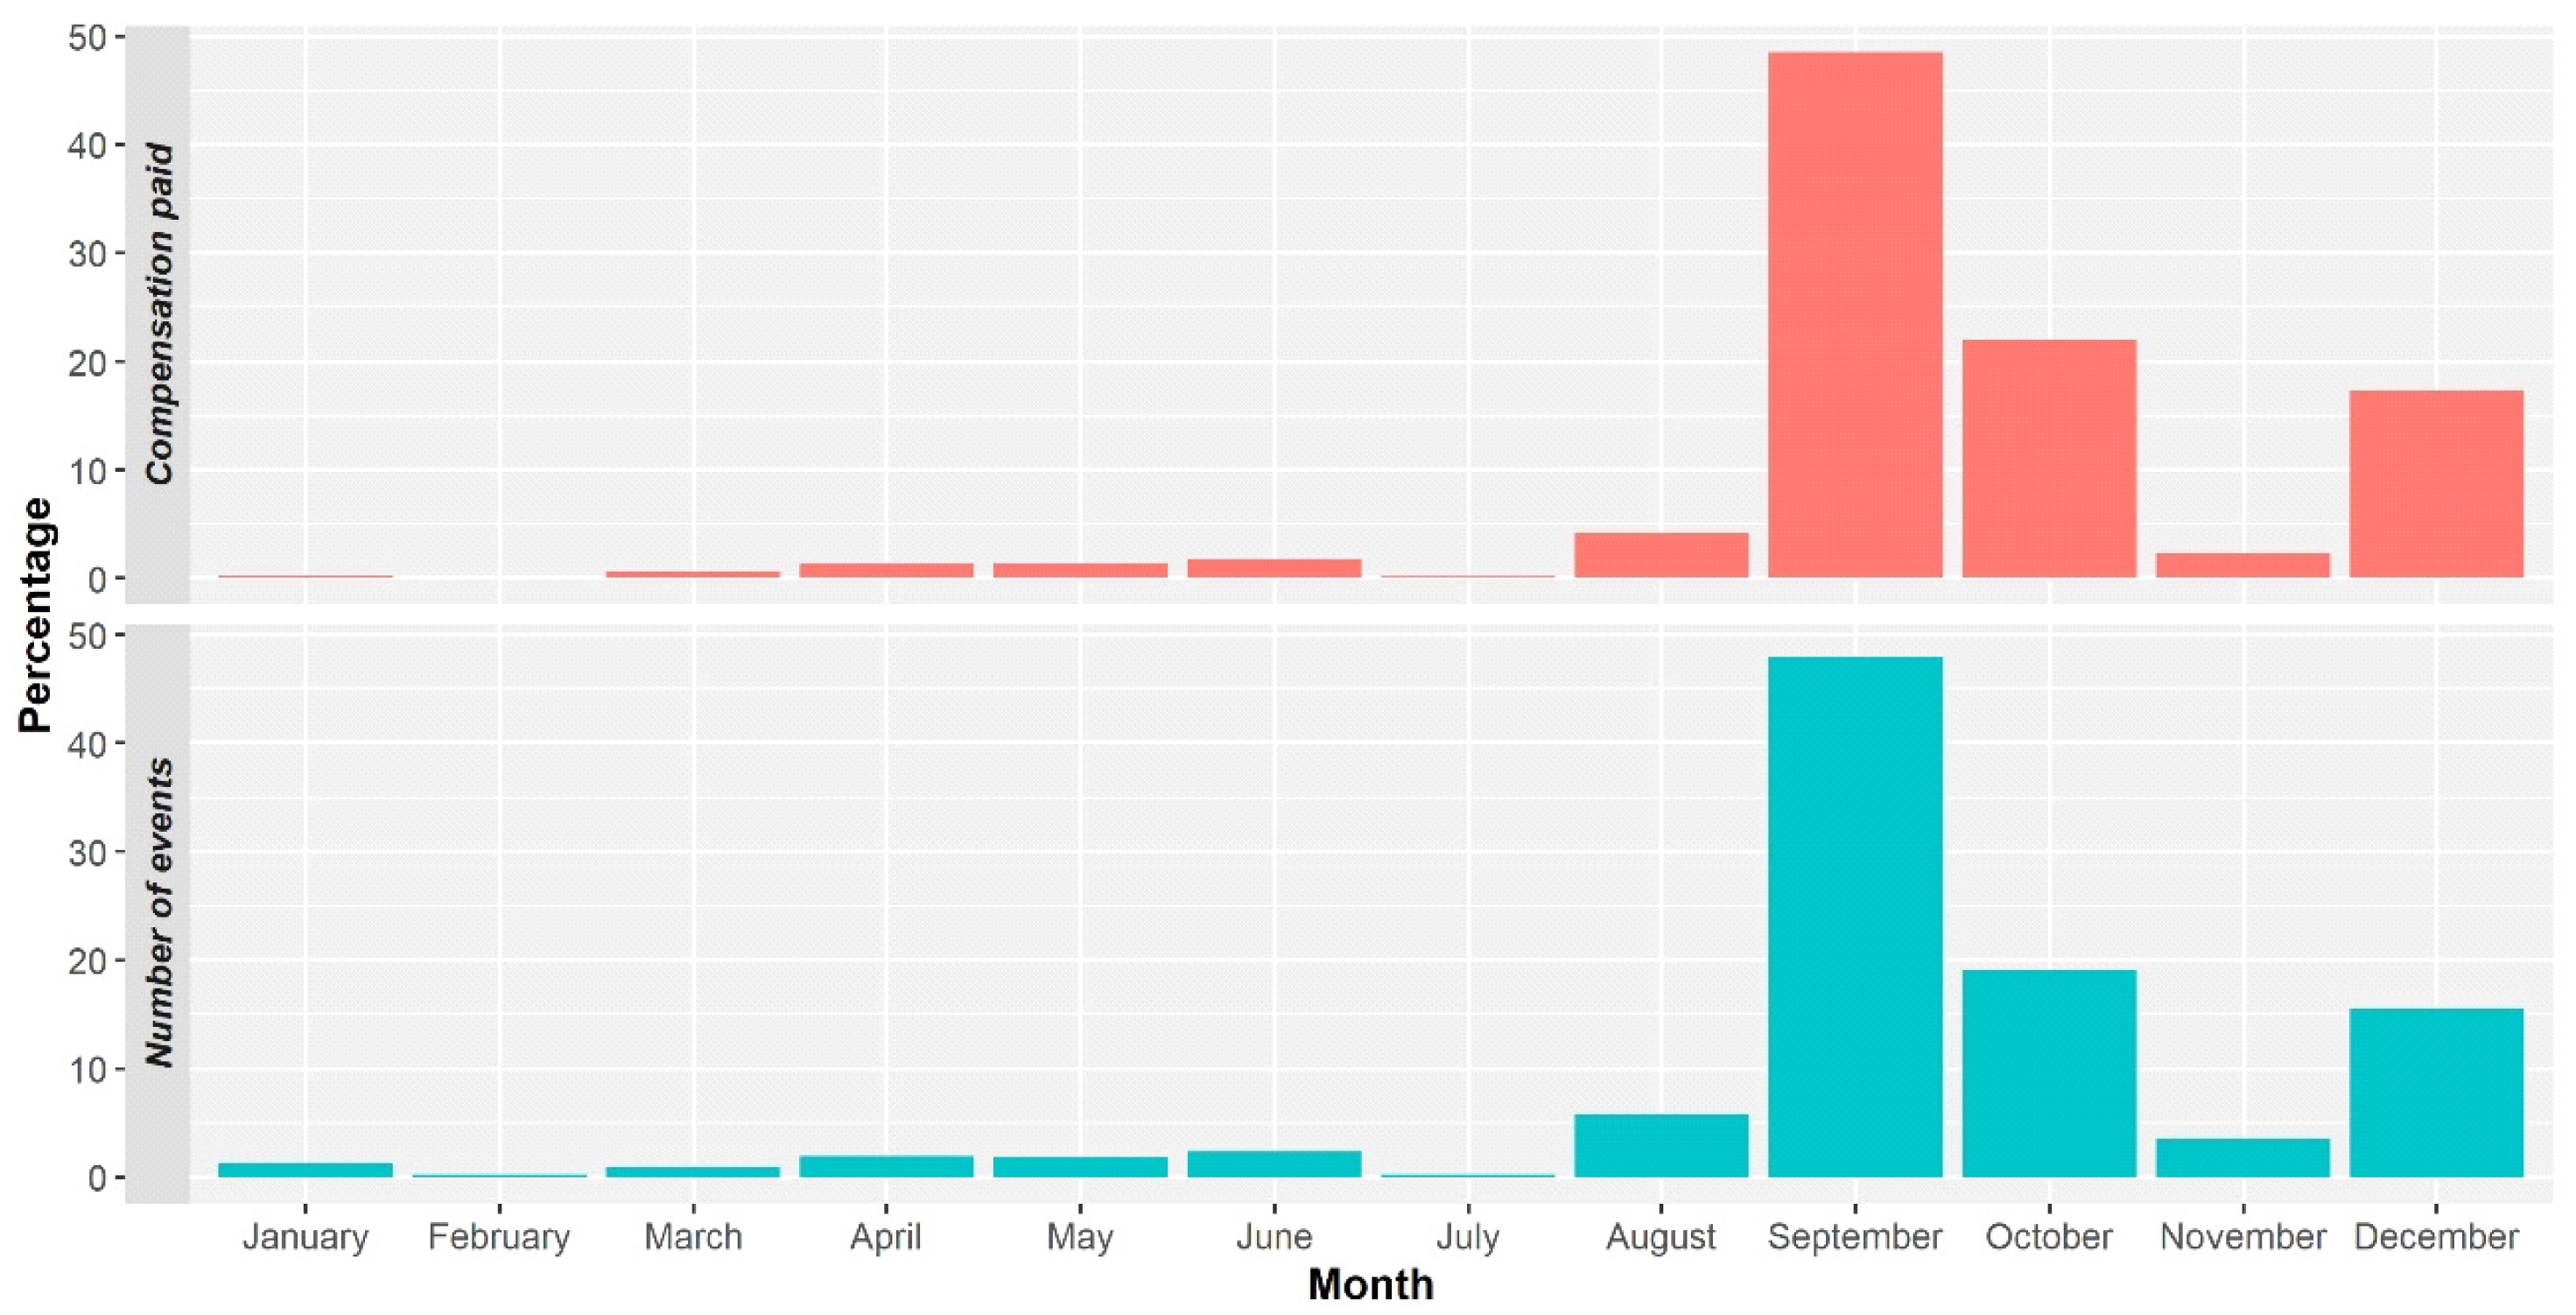
Thus, demonstrating that new man-made hazard scenarios are growing over time, it is important to consider how the hydro-geomorphological and local climate characteristics influence floods’ variability. Firstly, the area has plenty of small watersheds with torrential ephemeral streams that are generally dry all year [45] but whose nature and energy are responsible for flash floods; indeed, the Spanish Mediterranean coast is one of the areas most affected by this type of flooding [2,34,38,40]. Secondly, regarding the temporal distribution of reported flood damages (Figure 5), the losses and number of events follow the same pattern (Wilcoxon signed-rank test, p-value > 0.05), and their maximums are concentrated in the first two months of autumn [21,40,43,59]. In short, these geographical and climatic circumstances reinforce the importance of integrating environmental variables in flood risk management policies, an assumption that remembers the premises of the hazard-of-place model established by [64,65].
3.2. Flood Damages by Province
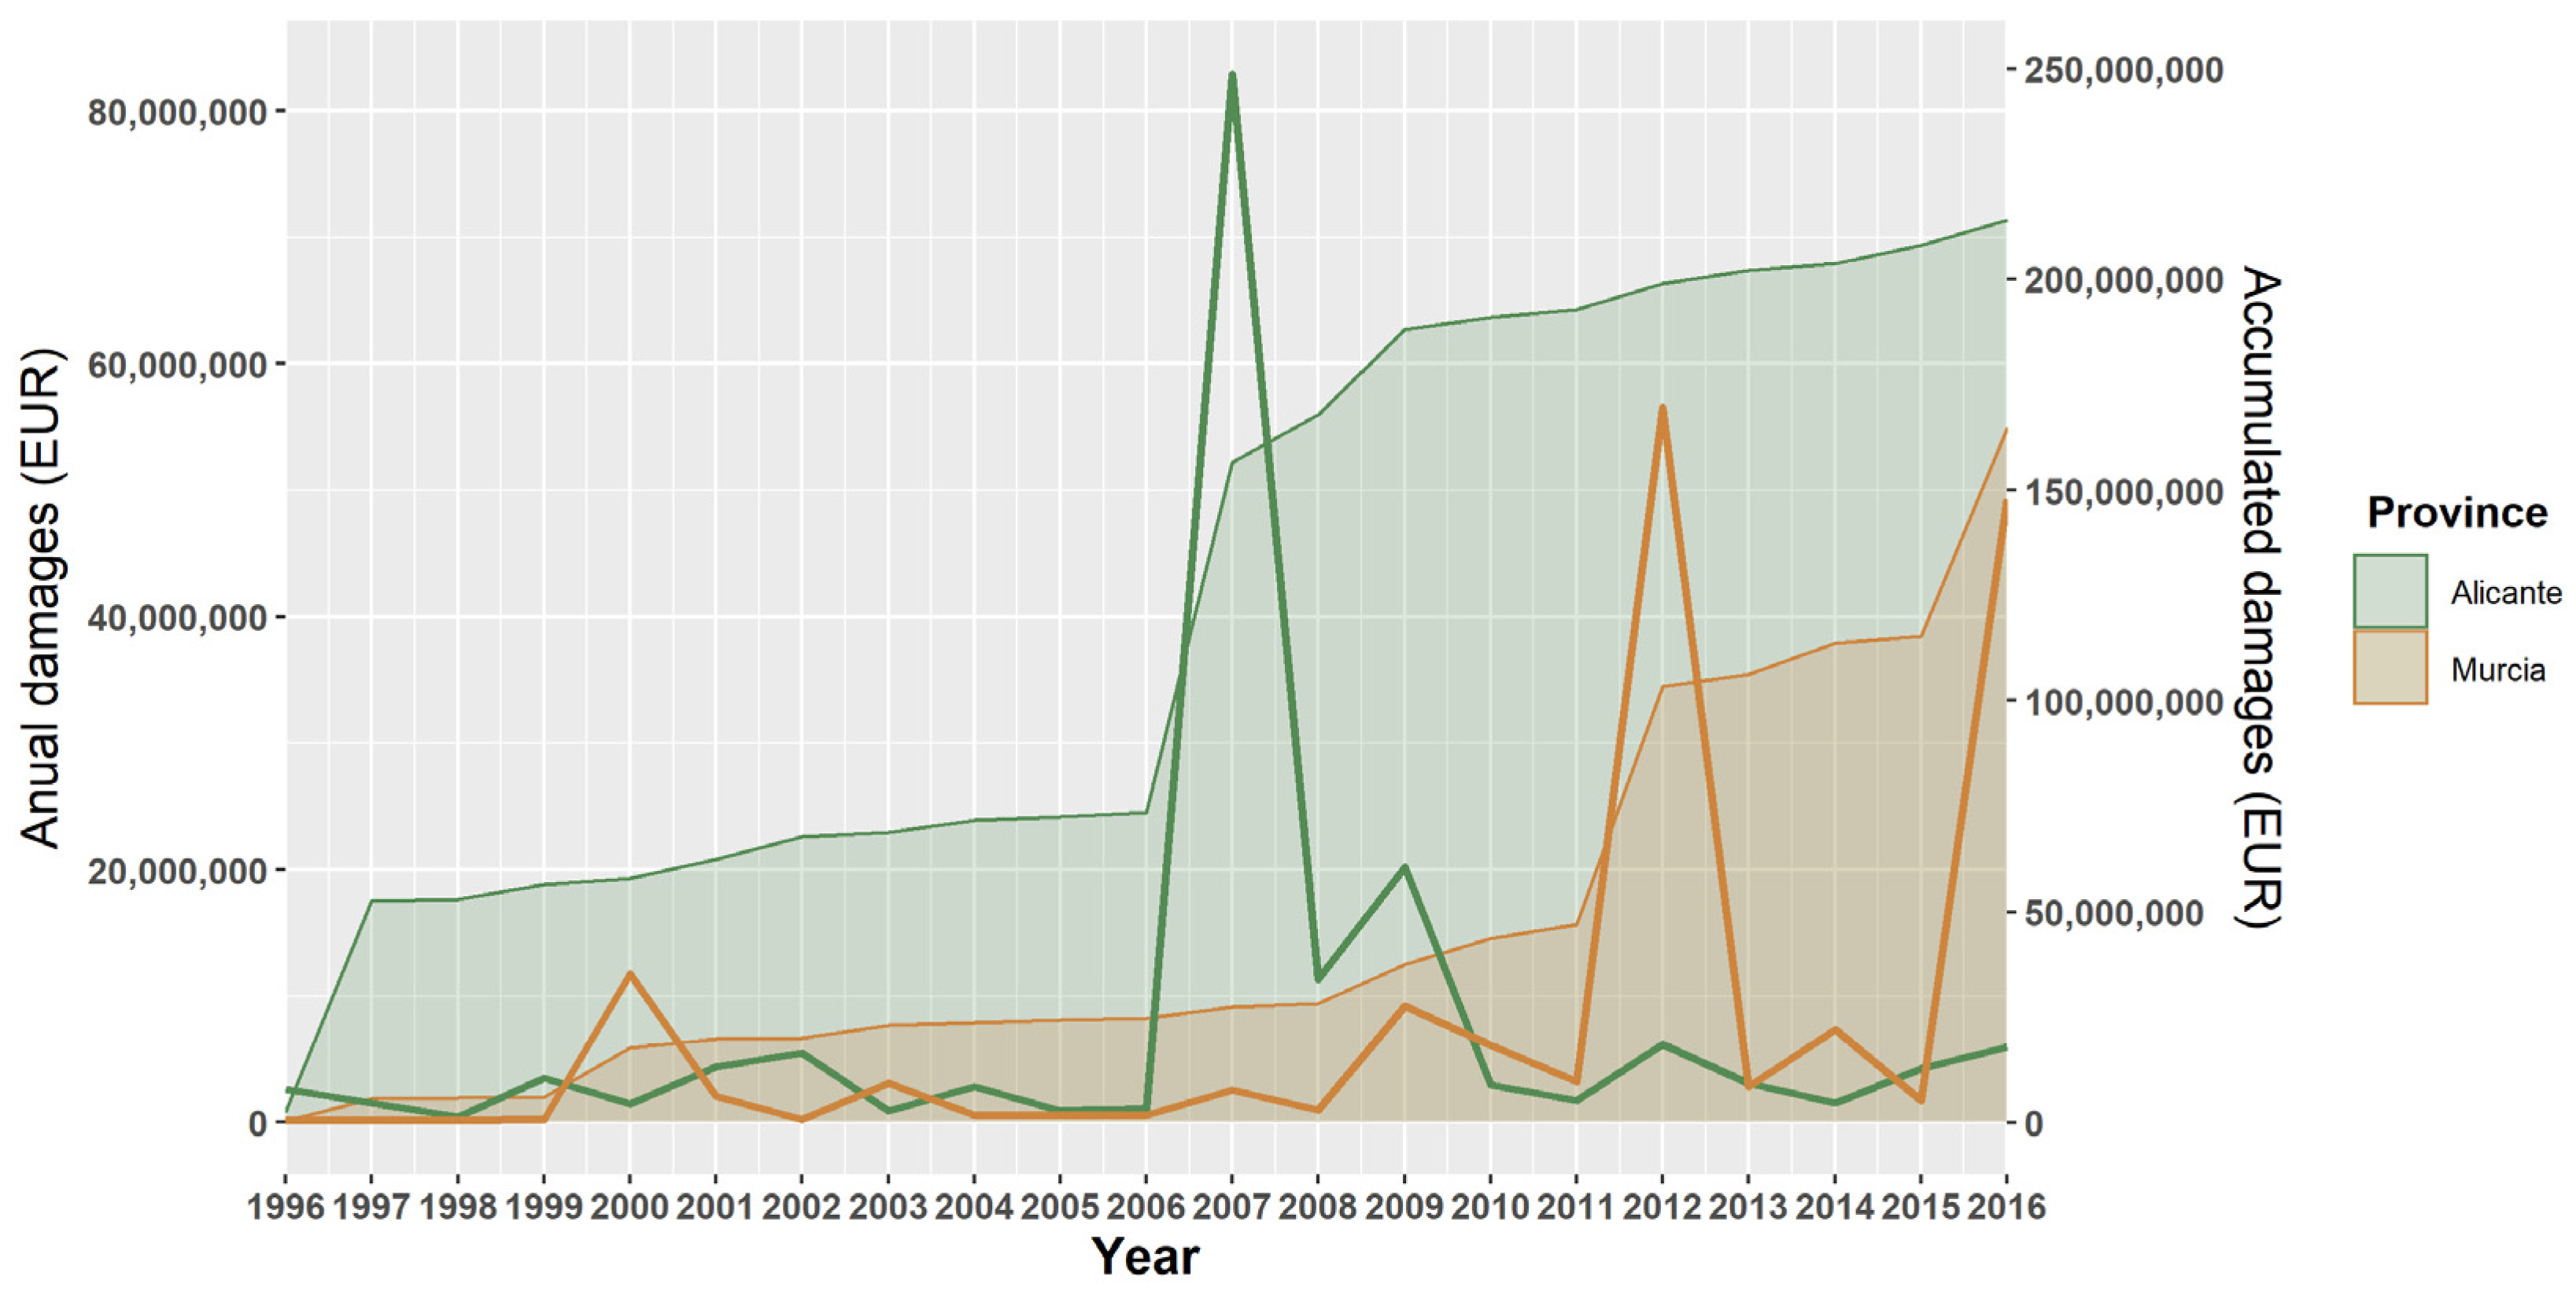
From an administrative point of view, while flood damages have been increasing in the same way between provinces (Wilcoxon signed-rank test, p-value > 0.05), a different pattern evolution was detected (Figure 6). Thus, despite the fact that Alicante is the province with the highest damages amount during the period studied, more than EUR 214 million (30% more than Murcia, with nearly EUR 165 million), for the last few years there was a general decrease in flood losses. This trend started after the floods of September 2007 [66], one of the major events recorded at the European [39] and national [9] level, which was responsible for losses of EUR 83 million and six fatalities [66]. Conversely, in the province of Murcia, a progressively increasing trend was registered until 2011, when the compensation paid amounted to about 68% of total damages and two historical maximums were recorded: 2012 [9,40,67] and 2016. As a result, these patterns show two different approaches related to learning, integrating and adapting flood risk management policies to extreme hydrological data.
Although each province recorded a different percentage and total damages amount by assets (Table 3), there are no significant differences between them (Wilcoxon signed-rank test, p-value > 0.05). However, the existence of significant differences in damages by asset (Mann–Whitney U test and Kruskal–Wallis H test, p-value > 0.05) allowed us to establish a flood damages ranking at the provincial level. On this matter, while the most damaged assets in decreasing order for the province of Alicante were dwellings followed by businesses, industry assets and motor vehicles, offices and, lastly, civil engineering, for Murcia province this ranking is composed of dwellings, businesses, motor vehicles, industry, civil engineering and finally offices. Thus, despite the differences in damages order, assets related to urban uses (residential, industrial and services) achieve the highest values in both provinces, a situation that reflects the exposure map reflected in the work of [42].
3.3. Spatial Distribution of Flood Events
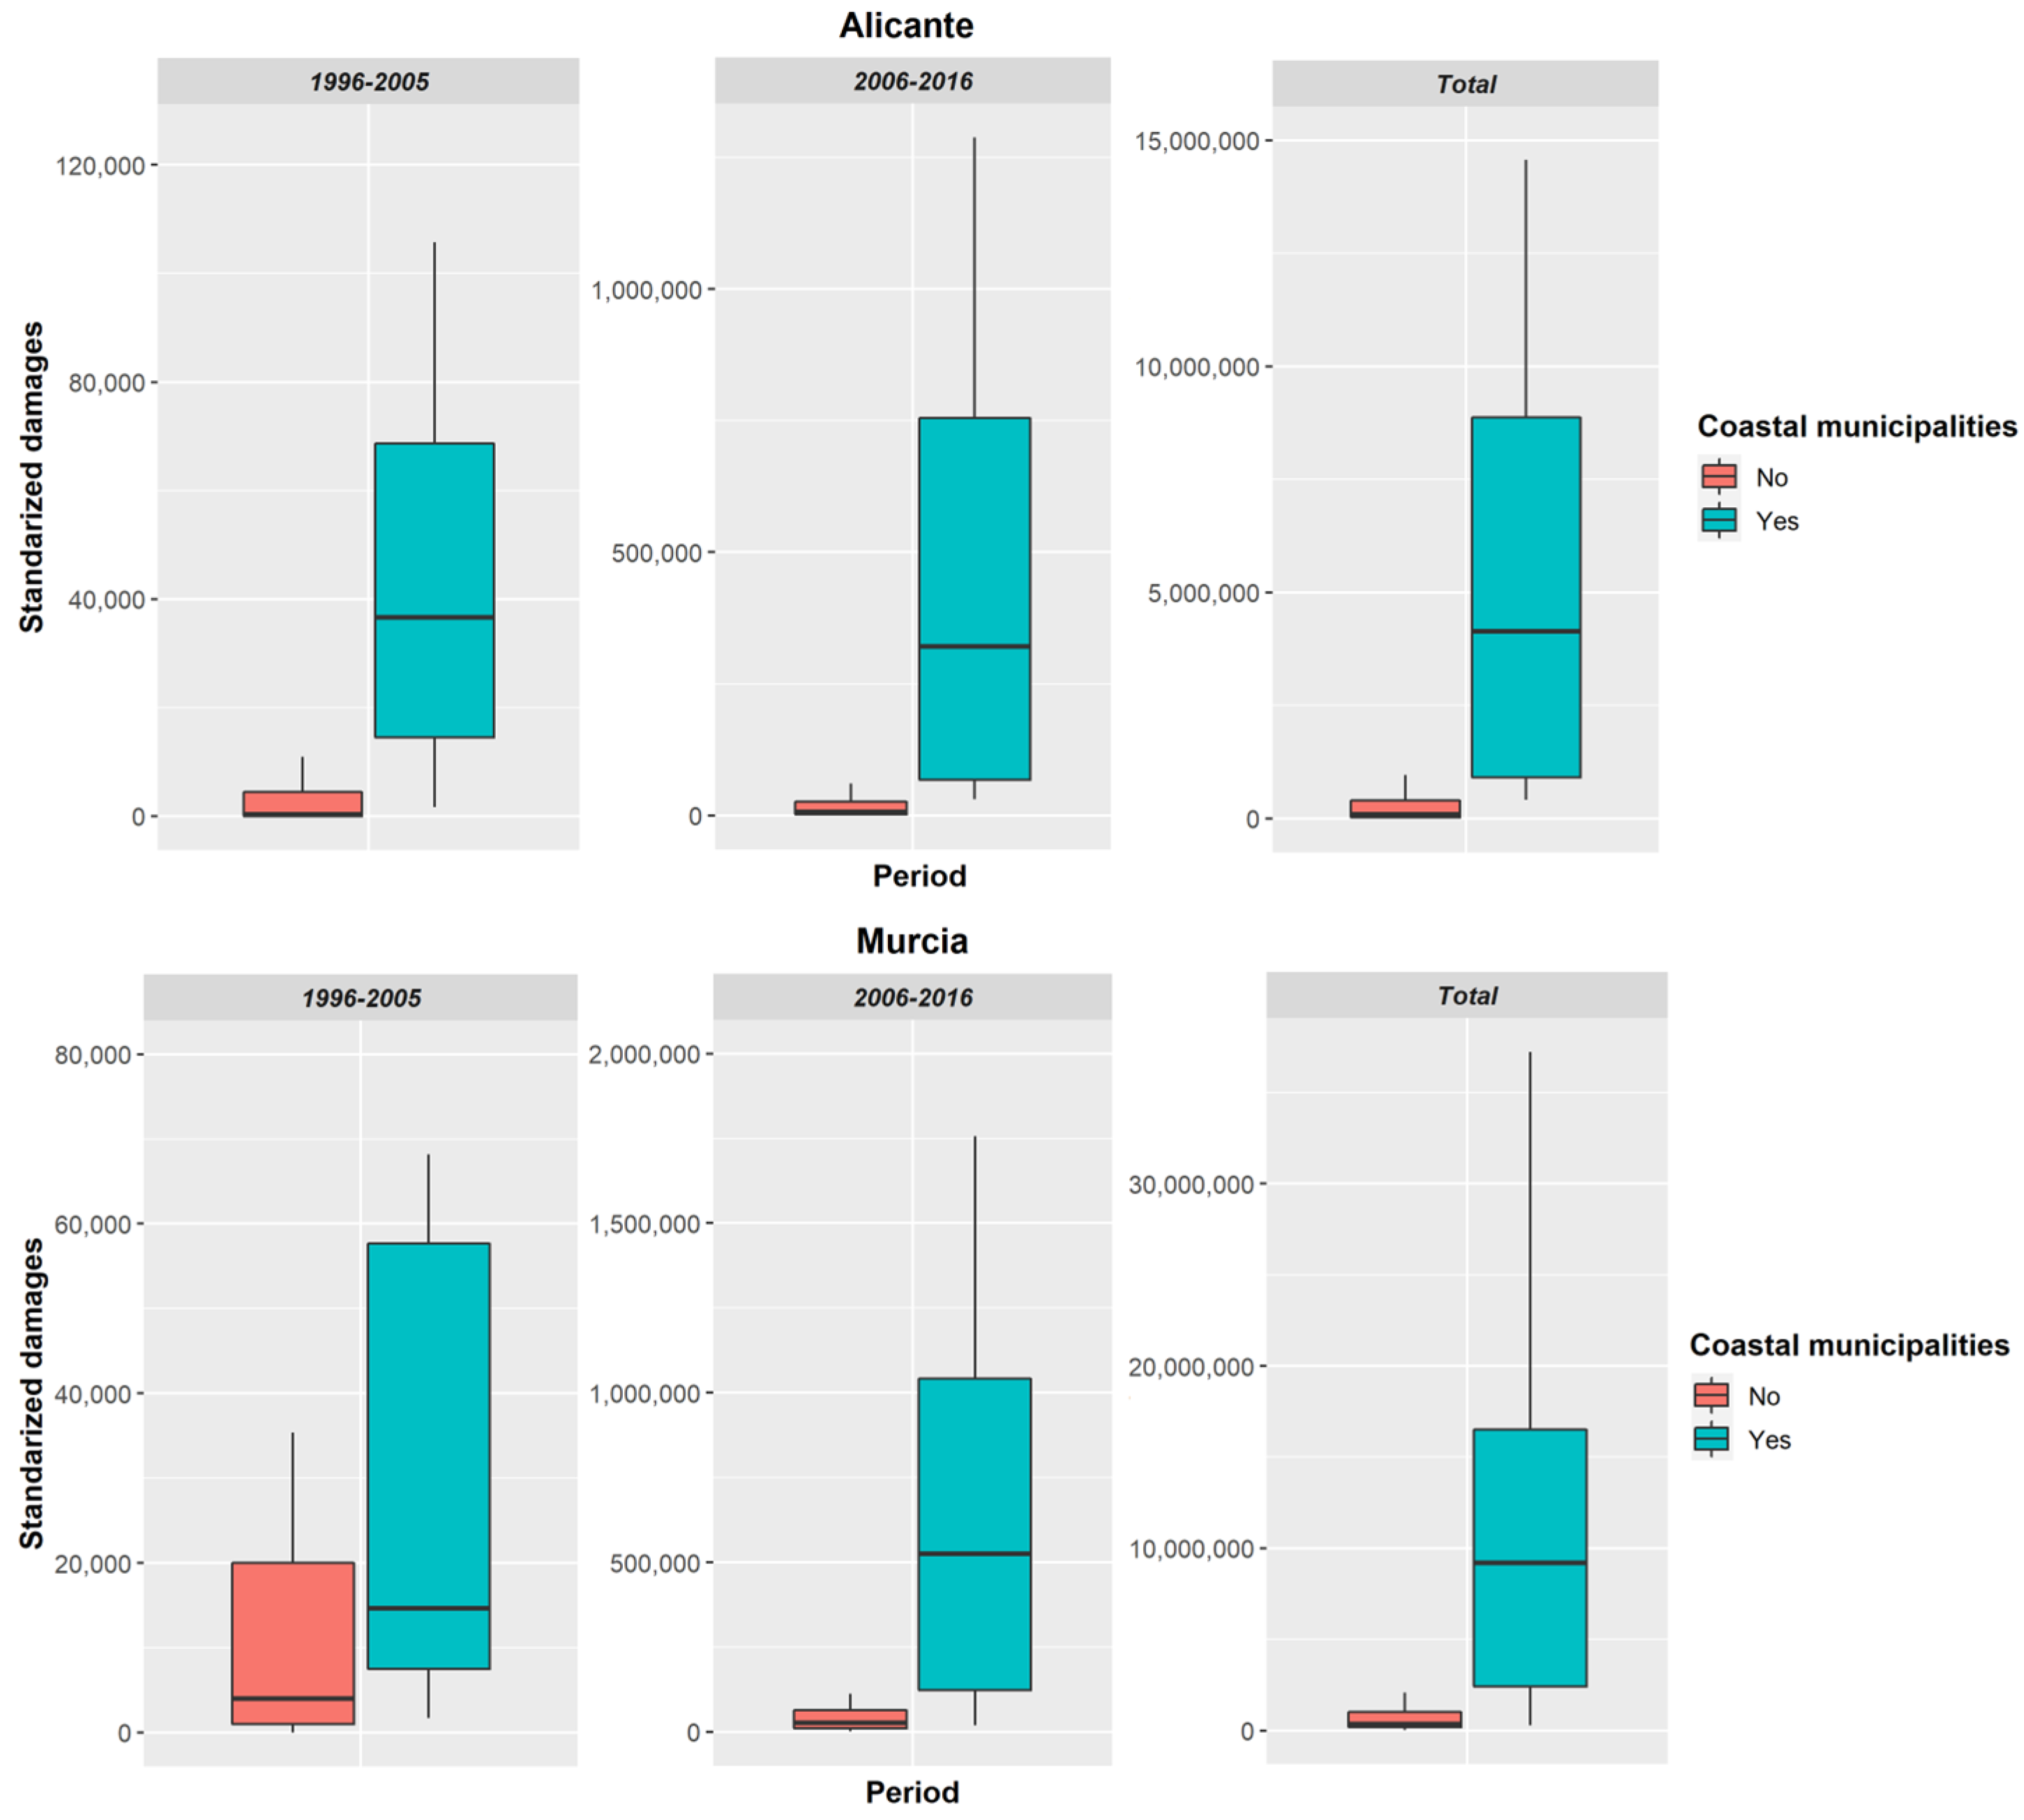
After the allocation of total flood losses to each municipality, a spatial and temporal trend appeared according to the location and period studied (Figure 7). In the first place, flood damages in Alicante and Murcia coastal municipalities have been statistically higher than in inland municipalities during all the periods studied (Wilcoxon signed-rank test, p-value < 0.05). Secondly, regarding the standardized flood damages paid in each period, in both provinces the total amount covered by the CCS during the second period was higher than in the first (Wilcoxon signed-rank test, p-value < 0.05).
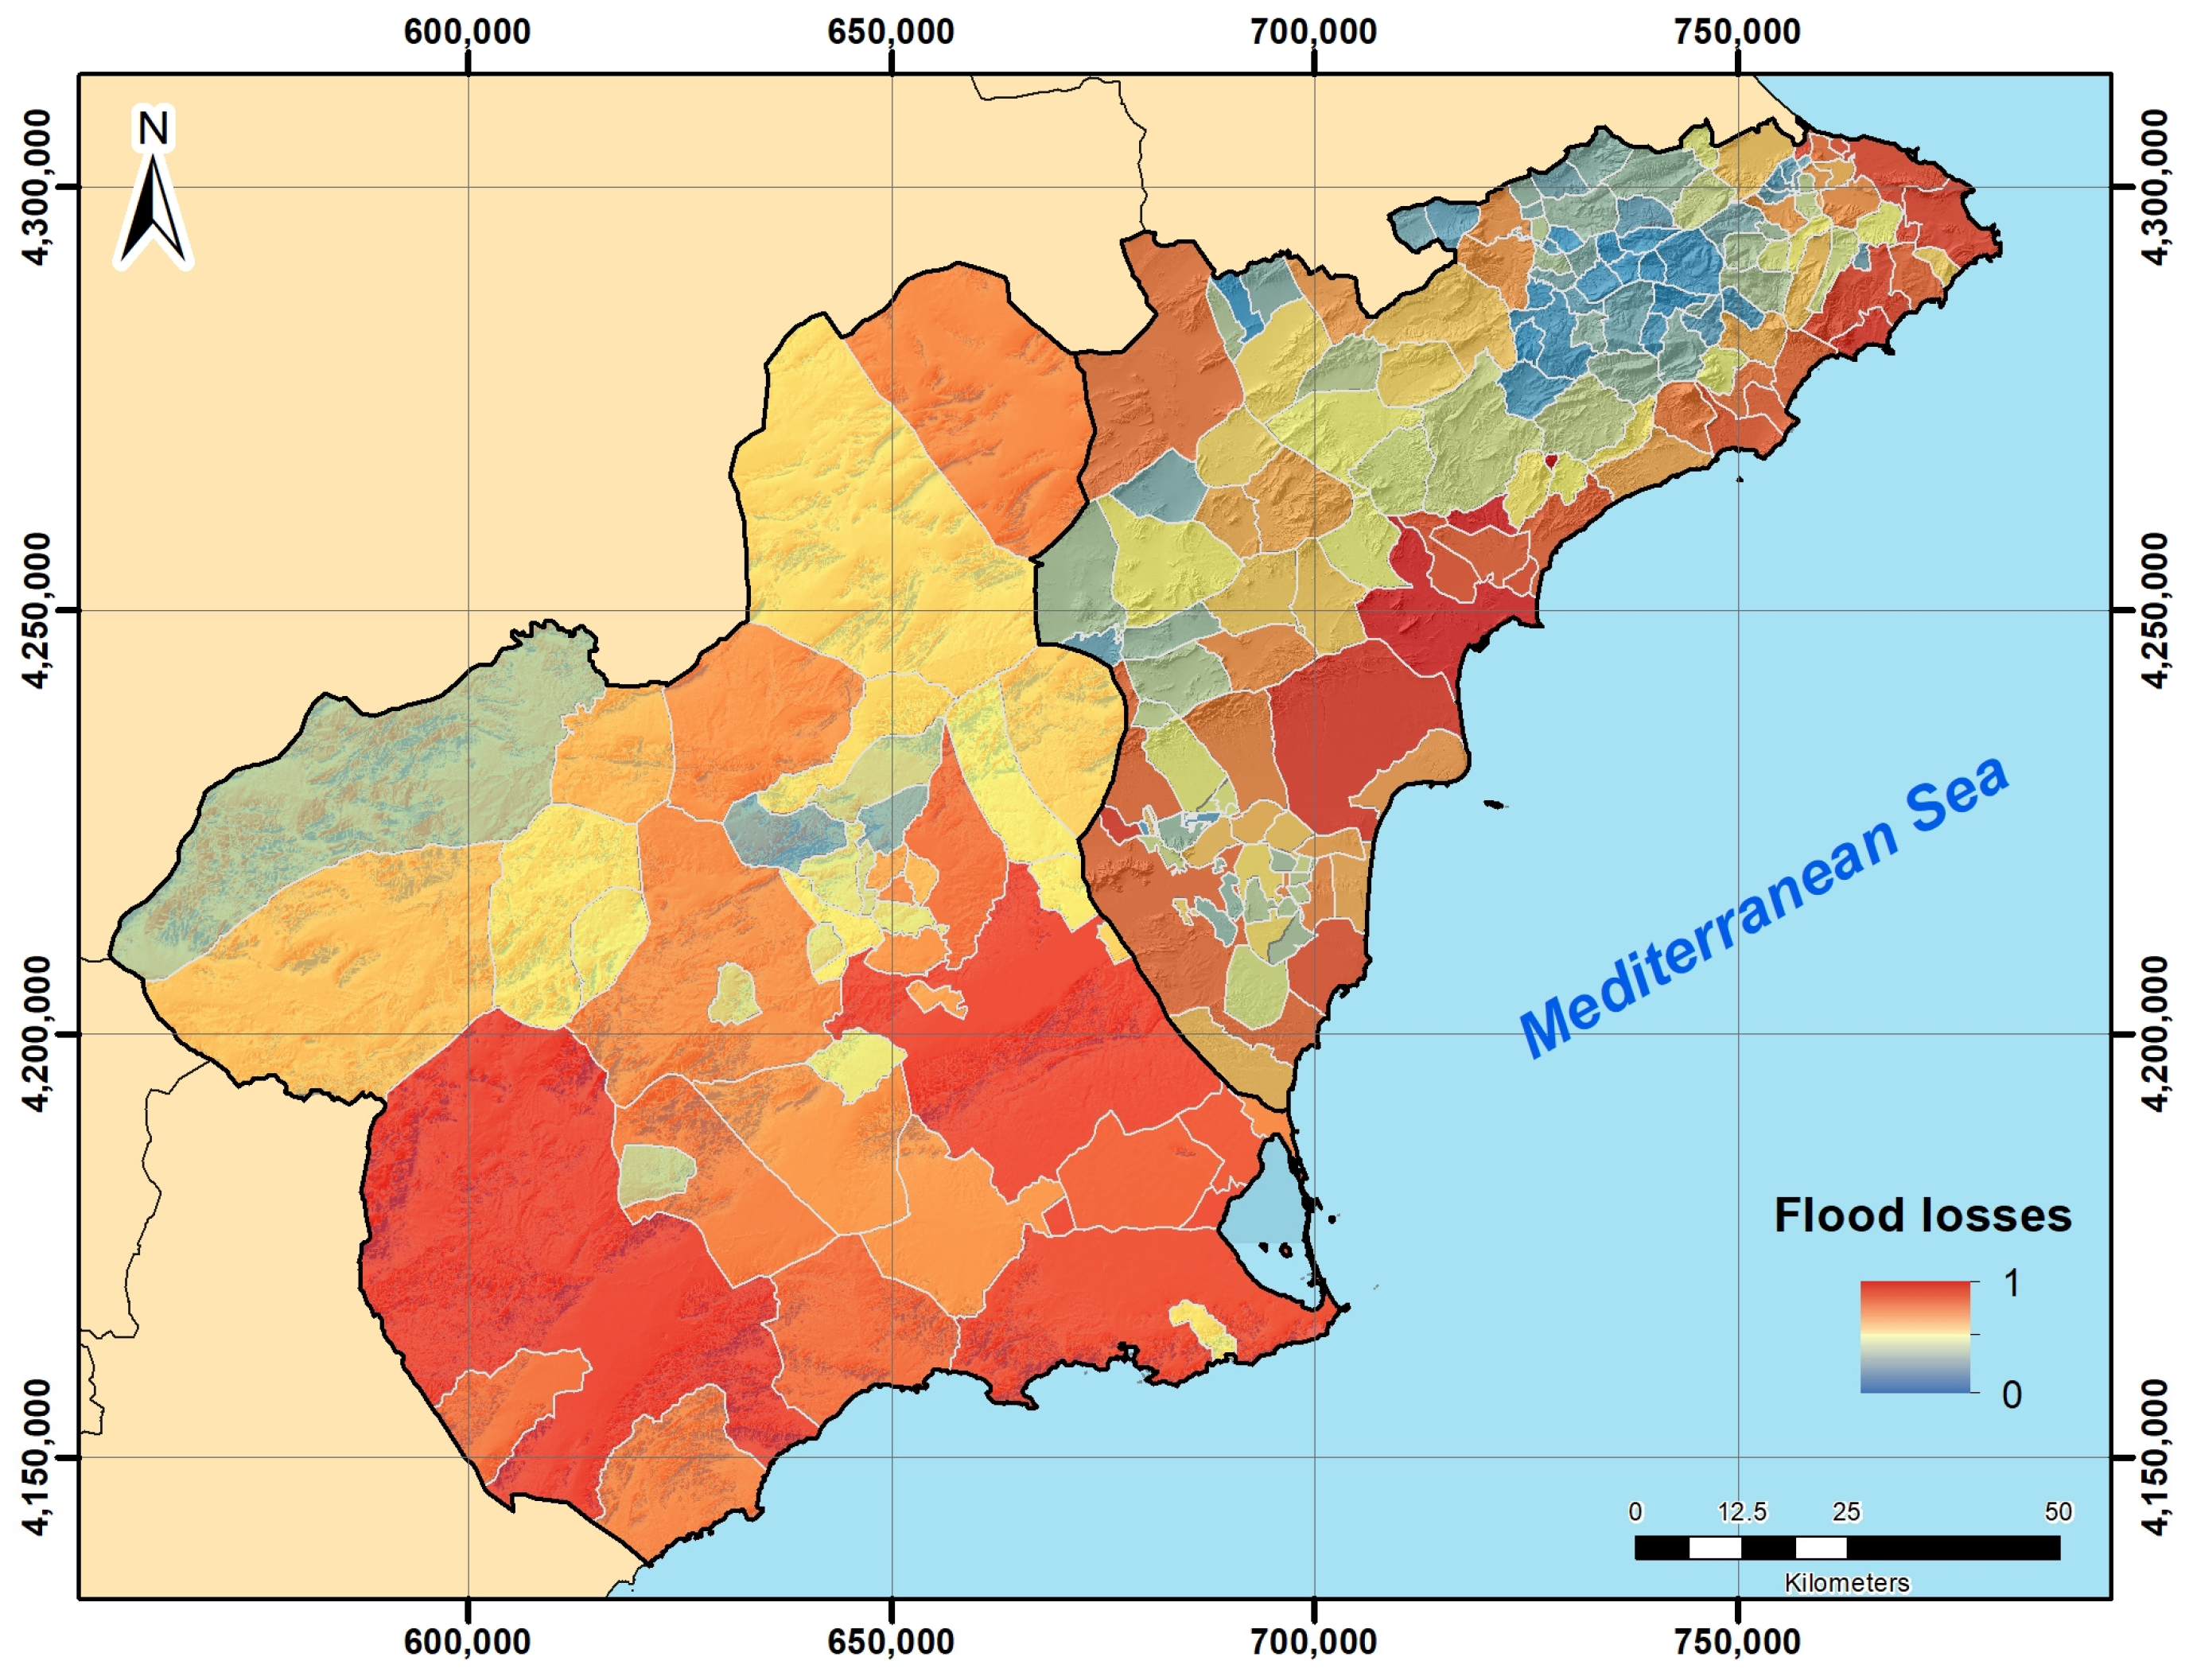
The spatial pattern differences revealed at the provincial level are also reflected at the municipal level (Figure 8). In this regard, according to the total flood damages, the local Moran’s I spatial cluster (p-value < 0.05) demonstrates the existence of a spatial pattern of flood damages along the coastal municipalities of the study area that does not match with the maximum rainfall distribution [43]. Additionally, together with the statistical differences found between flood losses in coastal and inland municipalities (Mann–Whitney U test and Wilcoxon signed-rank test, p-value < 0.05), damages were clearly higher in the second period defined than in the first (Wilcoxon signed-rank test, p-value < 0.05). However, in the same way that happened previously, although the absence of climatological data prevents us from defining rainfall as the root cause of this trend, previous works, e.g., [20,21,42,63], demonstrated that the most urbanized areas achieve the highest damages values.
4. Discussion
4.1. Temporal Flood Losses Evolution
According to the data recorded and studies developed in other areas [1,2,3,6,10], the compensation paid by the CCS to counteract flood damages has increased over the last few decades [6,9,20,63]. Thus, considering that rainfall in the Mediterranean region has remained stable [59,60,61,62], this hazardous scenario reinforces the influence of institutional vulnerability [14,35,36,63], i.e., the inefficiency of local planners in implementing previously established flood risk management policies (e.g., land laws, Basic Guideline, or Directive 2007/60/EC). In addition, translating this trend into an economic perspective, along with all local taxes, insurances and personal measures against floods that inhabitants have to cope with, flood damages should also be added, because it should be remembered that the CCS is a public institution whose budget relies on citizen contribution.
However, regarding the last stage defined according to the change-point test (2008–2016), it should be highlighted that, despite the urbanization restriction established by 2008 Land Law [14,30], four of the most significant events are concentrated in this period. Consequently, this situation reinforces that, while from a compulsory point of view institutional vulnerability to floods has decreased [9,14,30], climate change could hold different and potentially negative floods effects that have not yet been considered [9,12,22]. As a consequence, although the number of territorial policies related to reducing urban growth in floodable areas has been growing for the last two decades [9,14,30], future climate change scenarios represent an emerging task that should be integrated into spatial planning regulations and considered by local planners in the short term, especially regarding the latest flood severity trends [2,51].
Due to the fact that this work has not considered climatological data because it is focused on the socio-economic influence into flood damages; no relationship between flood damages and the rainfall trend has been established. This assumption relies on two approaches: (i) the rainfall stability of the last few decades [59,60,61,62] and (ii) the increasing human influence on flood damages, i.e., physical and economic exposure, [6,9,12,14,50]. According to this, the pattern of increasing flood damages found in this work is in line with the results of [14,20,30,67], who demonstrated how the urbanization of floodable areas (whose incidence has increased around 260% since 1975 to 2015, [63]) has resulted in new risk scenarios. As a result, this situation can also be associated with the false psychological effectiveness of flood management policies adopted on society, especially structural and permanent mitigation measures (dams, drainage networks or underground storage tanks), which create a false sense of security that has incentivized urban development in flood-prone areas [20,30,49,50] and the consequent increase in the amount of compensation paid [37]; i.e., the “hydraulic paradox” defined by [68,69] several decades ago is repeated.
In further detail, regarding the asset damage, the results highlight a very important aspect related to both flood mitigation measures’ effectiveness and their social perception. In this regard, although the number of fatalities has decreased [1,2,3,37], neither hydraulic infrastructures nor spatial planning policies have been able to contain or reduce damages on civil properties [9,14,20,44]. In fact, considering the mean flood damages values recorded, these data faithfully reflect the permissiveness of construction patterns in flood-prone areas during the last decades [9,14,20,50], because dwellings losses have increased more (418%) than the other assets insured (Kruskal–Wallis H and Wilcoxon signed-rank test, p-value < 0.05). In addition to this disproportionate percentage variation recorded in different aspects, office assets deserve a special mention, because their damages variation could be more associated with more expensive material equipment, office location and number of assets rather than land speculation [70].
Lastly, the temporal flood distribution shows that these events take place in autumn [21,34,38,59,71,72], especially in the first months of the season, i.e., September (48%) and October (19%), when in the Spanish east coast there have been recorded several extreme flood and intense rainfall events connected with backdoor cold fronts [40,73,74]. Among such events, some worth mentioning are those that happened in September 1997 in Alicante with five deaths [9,41], October 2000 in Murcia with a maximum of 166 mm. [40], October 2007 in Alicante with more than 200 mm and unrecorded economic consequences [65,74], September 2009 in Alicante, one of the worst backdoor cold front phenomena in the area [20], and September 2012 in Murcia, when 150 mm was exceeded in less than two hours [67]. However, despite these “extreme” rainfall records, the multiple floods recorded by the CCS reflect that watershed and climatological characteristics are not primarily responsible for the pattern increase commented on above [21].
Consequently, this situation confirms the importance of climatological [5,61,62,74], temporal [9,21,40,59] and damages [21,45,50,66] patterns reflected in previous works developed in Mediterranean areas, but in a natural or water year there is one season more hazardous than any other. In short, this set of features should be considered not only by local land-use planners but also by national and regional legislators, because they constitute an intrinsic part of the territory similar to other environmental factors, such as protected areas, public realm spaces or interest zones.
4.2. Provincial Measures against Floods
Regarding the evolution in flood damages shown previously, despite the fact that both provinces recorded the same increase, Alicante reached the highest economic amount due to the three catastrophic flood events commented on above (1997, 2007 and 2009). Conversely, in the province of Murcia only two historical extreme hydrological data were recorded: 2012 [9,67] and 2016, which had lower economic damages. Therefore, since these data only describe climatological patterns, they confirm that Alicante is the province, especially its northeastern area [43,73,74,75], with the highest torrential rainfall concentration and, subsequently, is where flash-floods are more dangerous because of these rainfall peaks [40,75].
The results also demonstrate that local planners have not been able to reduce the numbers of assets placed in floodable areas, i.e., they reflect the inefficiency of public administrations to apply the different flood risk management policies and their ability to generate new hazard scenarios [12,14,20,50]. Unfortunately, this situation became especially worrying after the 1998 national Land Law publication, a paradoxical spatial planning policy that (i) was proclaimed after the occurrence of three catastrophic flooding events responsible for nearly 120 deaths [9,22,33,41], (ii) was the first policy really in charge of reducing the impact of natural hazards to classify these areas as “non-urban land” [9], and (iii) was responsible for strong speculation [13] and land market liberalization [52], which led to an urban bubble. Therefore, due to its main flaws, this Land Law was replaced by another two in 2008 and 2015, policies that partially incorporated some terms established in the Directive 2007/60/EC, in particular, those related to the consideration and preparation of risk maps with the aim to control urban growth in flood-prone areas.
Nevertheless, analyzing the effectiveness of these last two land laws in avoiding build-up in floodable areas and reducing flood damages is very difficult due to three main factors: (i) the elevated building rates achieved during the last urban bubble recorded in Spain [13], (ii) the massive urban development that took place in these zones since 1975 [14], and (iii) the fact that flood compensation paid data are linked with the damages date instead of the construction year of each building. As a consequence, and according to the flood damages results, it could be established that none of the three spatial planning laws were really able to reduce this hazardous pattern, and the trend seems to relate more to the exhaustion of floodable areas than to the influence of the different policies adopted [14,63].
In addition to the mandatory requirements established at the national level, each province has developed several sectoral policies and instruments in charge of flood risk management [14]. In this regard, in the province of Murcia there are three plans focused on flood control: the Special Plan Against Floods (also known as “Plan INUNMUR” in Spanish), Industrial Land Plan and Coastal Land Management Plan. In the province of Alicante appears the Action Plan on Flood Risk in the Valencia Region (known as “PATRICOVA” in Spanish). However, due to the publication delay of each plan with regard to the first national Land Law (2007, 2004, 2006 and 2003, respectively), their efficiency was significantly reduced due to the large amount of urban development built or approved before their assumption [30,41]. In addition, each plan has not had the same degree of success; thereby, although in the province of Alicante the PATRICOVA was able to reduced exposure [9,30] by reclassifying as “non-urban land” some 7300 ha. of floodable areas previously considered “developable land” [41], the different plans defined for the Murcia province had a minimal effect [20,44]. Therefore, regardless of publication date, it should also be highlighted that the effectiveness in each province is more related to the plans’ consideration by local and regional planners than to the number of policies approved.
Furthermore, from a flood management point of view, the damages ranking (see Table 3) proves that no province has effectively decreased the flood exposure of their citizens, because in both cases the three assets with the highest damages are dwellings and industry and business assets. Consequently, this assumption demonstrates a very worrying future scenario, especially regarding the percentage damages increase (45% on average) in dwellings (residential areas), the places with the highest level of human exposure throughout the day [42,45]. Hence, despite all the conditions introduced in spatial planning and sectoral policies, it seems that the only solution to really solve this problem lies in structural measures [49]. Additionally, there are some particular circumstances of the study area that deserve special comment. Firstly, according to total amount and percentage variation of compensation paid, dwellings experienced the main asset damages in both provinces; however, in Alicante flood damages exceed (64%) those of Murcia due to greater urban development rates [13,15,19,49], including the total (141 vs. 45) and coastal (20 vs. 8) municipalities. Civil engineering was the fifth-highest asset damaged in the province of Murcia (four times more than in Alicante province), a situation that could be connected with (i) the traditional inclusion of floodable areas as road infrastructure [40,48,67] and ii) the numerous historical structural measures against floods present in the area, which started in the Roman era [76]. Thirdly, in both provinces motor vehicles occupy an intermediate position in the damages ranking because they are linked with different places (dwellings and business or industry assets). Lastly, offices are the least damaged assets in both provinces, a situation related to the fact that they are not located near water courses, because those areas are reserved for other types of buildings more suited to their surrounding area, mainly dwellings [14].
4.3. Flood Events’ Spatial Distribution
Both the provinces of Alicante and Murcia show that flood damages in coastal municipalities have been statistically higher than in inland municipalities during the first period, second period and all periods studied (Wilcoxon signed-rank test, p-value < 0.05). However, despite the different sectoral plans against floods approved in each province [9,14,20], this situation demonstrates two uncomfortable features. Firstly, these plans have been insufficiently integrated into spatial planning by local planners, a scenario that reduced their efficiency as a direct consequence [14,20,44]. Secondly, their flood management policies are not ambitious enough and restrictive; e.g., although the PATRICOVA was able to reduce construction rates on floodable areas for the province of Alicante effectively [20,41], flood damages have continued increasing. In this regard, as the Murcia province advanced in its Coastal Land Management Plan, coastal municipalities represent the main hot-spot where flood risk management policies should be adopted in Mediterranean areas, especially considering the extensive urban development recorded [14,21] and that they are one of the main touristic holiday destinations at the regional and national levels.
Finally, as in previously works [2,11,12,13,21], flood damages at the municipal level demonstrated the existence of a spatial pattern along coastal areas. Consequently, this assumption reinforces the influence of the construction rate increases in floodable areas recorded in previous works [14,20,41,49], as one of the principal conditions influencing human exposure, especially considering that the municipalities with the highest rainfall peaks [43] do not record the most expensive damages (see Figure 3 and Figure 8). Finally, regardless of where the municipality is located, flood damages were clearly higher in the second period considered than in the first (Wilcoxon signed-rank test, p-value < 0.05). However, in the same way that happened previously, the absence of climatological data prevents us from defining unplanned urbanization as the root cause of this trend; in fact, the most urbanized areas achieve the highest damages values [12,21,42].
5. Conclusions
In contrast to other quantitative works, this study is a first step in uncovering the socio-economic factors underlying flood damages trends in two of the Mediterranean provinces most affected to these events: Alicante and Murcia. Firstly, between 1996 and 2016, flood economic damages increased by almost EUR 53 million, i.e., an average annual amount of EUR 18 million that directly impacts on the citizens’ economy. However, regarding rainfall trends, this pattern seems to be more related to deficient territorial planning, which is the reason why damages on dwellings and other economic sectors (e.g., businesses, offices or industry assets) have increased. In a greater level of detail, regarding the two periods defined, in the second one (2006–2016) damages were close to 2000% higher than those recorded in the first (1996–2005). Unquestionably, this dramatic situation cannot be attributed exclusively to the efficiency of land laws, the Basic Guideline or the Floods Directive. It can also be attributed to their consideration by local planners in spatial planning instruments. In this regard, it would be very interesting to develop a future study to analyze the effects of climate change on flood damages, especially considering the higher recurrence of extreme events.
However, regarding the damages caused by floods to each asset, dwellings have recorded the highest total amount (more than EUR 173 million, 46% from total compensation paid), along with the highest percentage increase in economic losses (418%). Therefore, this trend reinforces how local planners’ permissiveness has increased the number of assets placed on floodable areas; in fact, after dwellings, businesses (26%), motor vehicles (14%) and industry assets (11%) recorded the highest damages. As a result, this situation reflects three realities: (i) the lack of consideration of land uses in spatial planning despite the fact that they are mandatory, (ii) the low efficiency of the structural flood measures implemented, especially in regard to future climate change effects on flood events, and (iii) the false sense of security generated by both, a perspective reflected in inhabitants’ floods perception. In addition, the work has also reinforced the existence of a temporal flood damages pattern in the first two months of autumn, a period that coincides with the maximum rainfall and number of events. Thus, flood damages have a minimum rainfall level that unplanned urbanization could decrease.
Thirdly, although flood economic damages have increased in the provinces of Alicante and Murcia at the same level, Alicante has been able to decrease it over the last few years, especially considering that this area recorded the highest rainfall. In this regard, considering that both provinces followed the same legislative framework established at the national level by land laws, this different preventative pattern could be connected with the autonomous plans against floods, PATRICOVA and INUNMUR, respectively, whose effects on flood exposure have been opposed in each province. However, despite the PATRICOVA effectiveness in reducing flood exposure, no significant differences between the total damages amount in each province were detected, but some were detected by asset. In this way, while dwellings, followed by businesses, industry assets, motor vehicles, offices and, lastly, civil engineering, were the assets most damaged in decreasing order for the province of Alicante, for the Murcia province this ranking is ordered dwellings, industry assets, civil engineering, motor vehicles, businesses and, lastly, offices. Nevertheless, regardless of the asset position in each province, it should be highlighted that the elevated percentage of those related to places where people spend a lot of time.
Lastly, the results also show a different spatial pattern in terms of the location area and the periods established. Firstly, regardless of the period considered, at the provincial level the flood damages are higher in coastal municipalities than in inland municipalities. As a consequence, in spite of the differences of each autonomous plan in efforts to reduce the risk of flooding, these situations also demonstrate that additional or more restrictive regulations should be established depending on the location of each municipality. However, regardless of the province, the data again demonstrate that flood damages are higher along the coastal municipalities of the study area, especially in the second period, a pattern that does not match with the rainfall distribution.
Funding
Partial funding for open access charge: Universidad de Málaga.
Data Availability Statement
The date analyzed during this study were provided by CCS.
Acknowledgments
Special thanks to CCS for providing the economic data, Ruiz Álvarez for the climatological data shown in Figure 3 and the reviewers for their helpful comments.
Conflicts of Interest
The author declares no conflict of interest.
References
- EM-DAT. The International Disaster Database. Available online: https://www.emdat.be/ (accessed on 26 November 2021).
- Paprotny, D.; Sebastian, A.; Morales-Nápoles, O.; Jonkman, S.N. Trends in flood losses in Europe over the past 150 years. Nat. Commun. 2018, 9, 1985. [Google Scholar] [CrossRef] [PubMed]
- Munich Re. NatCatSERVICE. Available online: https://www.munichre.com/ (accessed on 10 August 2022).
- Elleder, L. Historical changes in frequency of extreme floods in Prague. Hydrol. Earth Syst. Sci. 2015, 19, 4307–4315. [Google Scholar] [CrossRef]
- Barrera-Escoda, A.; Llasat, M.C. Evolving flood patterns in a Mediterranean region (1301–2012) and climatic factors—The case of Catalonia. Hydrol. Earth Syst. Sci. 2015, 19, 465–483. [Google Scholar] [CrossRef]
- Barredo, J.I.; Saurí, D.; Llasat, M.C. Assessing trends in insured losses from floods in Spain 1971–2008. Nat. Hazards Earth Syst. Sci. 2012, 12, 1723–1729. [Google Scholar] [CrossRef]
- Bouwer, L. Have Disaster Losses Increased Due to Anthropogenic Climate Change? Bull. Am. Meteorol. Soc. 2011, 92, 36–46. [Google Scholar] [CrossRef]
- Llasat, M.C.; Llasat-Botija, M.; Barnolas, M.; López, L.; Altava-Ortiz, V. An analysis of the evolution of hydrometeorological extremes in newspapers: The case of Catalonia, 1982–2006. Nat. Hazards Earth Syst. Sci. 2009, 9, 1201–1212. [Google Scholar] [CrossRef]
- Olcina Cantos, J.; Sauri, D.; Hernández, M.; Ribas, A. Flood policy in Spain: A review for the period 1983–2013. Disaster Prev. Manag. 2016, 25, 41–58. [Google Scholar] [CrossRef]
- Pesaresi, M.; Ehrlich, D.; Kemper, T.; Siragusa, A.; Florczyk, A.; Freire, S.; Corbane, C. Atlas of the Human Planet 2017: Global Exposure to Natural Hazard; Publications Office of the European Union: Luxembourg, 2017. [Google Scholar]
- IPPC. Managing the Risks of Extreme Events and Disasters to Advance Climate Change Adaptation; Cambridge University Press: Cambridge, UK, 2012. [Google Scholar]
- Freddy, V.; Mohamed, E.S.; Douvinet, J.; Fehri, N.; Nasrallah, W.; Menad, W.; Mellas, S. Urbanization and land use as a driver of flood risk. In The Mediterranean Region under Climate Change; Moatti, J.P., Thiébault, T., Eds.; Institut de Recherche pour le Développment: Marseilles, France, 2016; pp. 563–575. [Google Scholar]
- Burriel, E. Empty urbanism: The bursting of the Spanish housing bubble. Urban Res. Pract. 2015, 9, 158–180. [Google Scholar] [CrossRef]
- López-Martínez, F.; Pérez-Morales, A.; Illán-Fernández, E.J. Are local administrations really in charge of flood risk management governance? The Spanish Mediterranean coastline and its institutional vulnerability issues. J. Environ. Plan. Manag. 2019, 63, 257–274. [Google Scholar] [CrossRef]
- Díaz Orueta, F. Turismo, urbanización y cambio social. Rev. Argent. Sociol. 2014, 2, 115–127. [Google Scholar]
- Romero, J.; Jiménez, F.; Villoria, M. (Un) sustainable territories: Causes of the speculative bubble in Spain (1996–2010) and its territorial, environmental, and sociopolitical consequences. Environ. Plan C Politics Space 2012, 30, 467–486. [Google Scholar] [CrossRef]
- Fernández Muñoz, S. La ausencia de referentes internacionales en el desarrollo del litoral español. Estud. Turísticos 2007, 172–173, 83–88. [Google Scholar]
- EMF. Hypostat 2009: A Review of Europe’s Mortgage and Housing Markets. Available online: https://hypo.org/emf/ (accessed on 17 July 2020).
- Burriel, E. La década prodigiosa del urbanismo español (1997–2006). Scr. Nova 2008, 270. [Google Scholar]
- Pérez-Morales, A.; Gil-Guirado, S.; Olcina-Cantos, J. Housing bubbles and increase of the exposure to floods. Failures in the flood management in the Spanish coast. J. Flood Risk Manag. 2015, 11, 5302–5313. [Google Scholar] [CrossRef]
- Llasat, M.C.; Marcos, R.; Llasat-Botija, M.; Gilabert, J.; Turco, M.; Quintana-Seguí, P. Flash flood evolution in North-Western Mediterranean. Atmos. Res. 2014, 149, 230–243. [Google Scholar] [CrossRef]
- Olcina Cantos, J. Cambio climático y riesgos climáticos en España. Investig. Geográficas 2009, 49, 197–220. [Google Scholar] [CrossRef]
- Iglesias, F. Urbanismo y Democracia. Alternativas Para Evitar la Corrupción; Fundación Alternativas: Madrid, Spain, 2007. [Google Scholar]
- Ministerio de Fomento. Estimación del Parque de Viviendas 2018. Available online: https://www.mitma.gob.es/ (accessed on 15 June 2020).
- Membrado Tena, J.C. Sunny Spain: Migrantes del sol y urbanismo expansivo en el litoral mediterráneo español. Ciudad. Territ. Estud. Territ. 2013, 178, 687–708. [Google Scholar]
- Romero Valiente, J.M. Migraciones. In Tendencias Demográficas Durante el Siglo XX en España; Arroyo Pérez, A., Ed.; Instituto Nacional de Estadística: Madrid, Spain, 2003; pp. 207–254. [Google Scholar]
- Serrano Martínez, J.M. Las viviendas de segunda residencia en la sociedad del “bienestar”. El caso de un país turístico: España. Cuad. Tur. 2003, 12, 53–76. [Google Scholar]
- INE. España en Cifras. 2019. Available online: https://www.ine.es/ (accessed on 7 December 2022).
- Harrison, J. Economic crisis and democratic consolidation in Spain, 1973–1982. IFCS—Work. Pap. Econ. Hist. 2006, 6, 1–33. [Google Scholar]
- Olcina Cantos, J.; Morote Seguido, Á.F.; Hernández Hernández, M. Evaluación de los riesgos naturales en las políticas de ordenación urbana de los municipios de la provincia de Alicante. Legislación y cartografía de riesgo. Cuad. Geográficos Univ. Granada 2018, 57, 152–176. [Google Scholar] [CrossRef]
- Fuchs, S.; Keiler, M.; Zischg, A.P. A spatiotemporal multi-hazard exposure assessment based on property data. Nat. Hazards Earth Syst. Sci. 2015, 15, 2127–2142. [Google Scholar] [CrossRef]
- Fuchs, S.; Röthlisberger, V.; Thaler, T.; Zischg, A.P.; Keiler, M. Natural hazard management from a coevolutionary perspective: Exposure and policy response in the European Alps. Ann. Am. Assoc. Geogr. 2017, 107, 382–392. [Google Scholar] [CrossRef] [PubMed]
- Lane, S.N.; Landström, C.; Whatmore, S.J. Imagining flood futures: Risk assessment and management in practice. Philos. Trans. R. Soc. A 2011, 369, 1784–1806. [Google Scholar] [CrossRef] [PubMed]
- Llasat, M.C.; Llasat-Botija, M.; Prat, M.A.; Porcu, F.; Price, C.; Mugnai, A.; Lagouvardos, K.; Kotroni, V.; Katsanos, D.; Michaelides, S.; et al. High-impact floods and flash floods in Mediterranean countries: The FLASH preliminary database. Adv. Geosci. 2010, 23, 47–55. [Google Scholar] [CrossRef]
- Fuchs, S. Susceptibility versus resilience to mountain hazards in Austria—Paradigms of vulnerability revisited. Nat. Hazards Earth Syst. Sci. 2009, 9, 337–352. [Google Scholar] [CrossRef]
- Parker, D.; Tapsell, S. Relations between Different Types of Social and Economic Vulnerability; ENSURE: Belgium, Brussels, 2009. [Google Scholar]
- CCS. Informe Anual 2019; Ministerio de Economía, Industria y Competitividad: Madrid, Spain, 2017. [Google Scholar]
- Barredo, J.I. Normalised flood losses in Europe: 1970–2006. Nat. Hazards Earth Syst. Sci. 2009, 9, 97–104. [Google Scholar] [CrossRef]
- Svetlana, D.; Radovan, D.; Ján, D. The economic impact of floods and their importance in different regions of the world with emphasis on Europe. Procedia Econom. Bus. Adm. 2015, 34, 649–655. [Google Scholar] [CrossRef]
- Castejón Porcel, G.; Romero Díaz, A. Inundaciones en la Región de Murcia en los inicios del siglo XXI. Biblio 3W Rev. Bibliográfica Geogr. Cienc. Soc. XIX 2014, 19, 41. [Google Scholar] [CrossRef]
- Olcina Cantos, J. El tratamiento de los riesgos naturales en la planificación territorial de escala regional. Pap. Geogr. 2010, 51–52, 223–234. [Google Scholar]
- Camarasa-Belmonte, A.M.; López-García, M.J.; Soriano-García, J. Mapping temporally-variable exposure to flooding in small Mediterranean basins using land-use indicators. Appl. Geogr. 2011, 31, 136–145. [Google Scholar] [CrossRef]
- Ruiz Álvarez, V. Estimating the Impact of Global Change on Drought Risk in Southeastern Spain: Assessment and Forecasting of Water Resources and Water Use. Ph.D. Thesis, University of Murcia, Murcia, Spain, 2020. [Google Scholar]
- Pérez-Morales, A.; Gil Guirado, S.; García Martín, F. Veinte años de protección de cauces en el litoral de la Región de Murcia (1994–2013). Evaluación de la eficiencia de las medidas de Ordenación del Territorio. An. Geogr. Univ. Complut. Madr. 2014, 35, 169–185. [Google Scholar] [CrossRef]
- Camarasa-Belmonte, A.M.; Soriano-García, J. Flood risk assessment and mapping in peri-urban Mediterranean environments using hydrogeomorphology. Application to ephemeral streams in the Valencia region (eastern Spain). Landsc. Urban Plan 2012, 104, 189–200. [Google Scholar] [CrossRef]
- Lara, A.; Saurí, D.; Ribas, A.; Pavón, D. Social perceptions of floods and flood management in a Mediterranean area (Costa Brava, Spain). Nat. Hazards Earth Syst. Sci. 2010, 10, 2081–2091. [Google Scholar] [CrossRef]
- Saurí, D.; Rivas, A.; Lara, A.; Pavón, D. La percepción del riesgo de inundación: Experiencias de aprendizaje en la Costa Brava. Pap. Geogr. 2010, 51–52, 269–278. [Google Scholar]
- Álvarez Rogel, Y.; Navarro Hervás, F.; Granell Pérez, M.C. Aproximación al riesgo de inundación en dos diputaciones de la ciudad de Cartagena (Murcia, España). Pap. Geogr. 2010, 51–52, 33–43. [Google Scholar]
- Rico Amorós, A.; Hernández Hernández, M.; Olcina Cantos, J.; Martínez Ibarra, E. Percepción del riesgo de inundaciones en municipios litorales alicantinos: ¿aumento de la vulnerabilidad? Pap. Geogr. 2010, 51–52, 245–256. [Google Scholar]
- Saurí, D.; Roset-Pagès, D.; Ribas-Palom, A.; Pujol-Caussa, P. The ‘escalator effect’ in flood policy: The case of the Costa Brava, Catalonia, Spain. Appl. Geogr. 2001, 21, 127–143. [Google Scholar] [CrossRef]
- Hartmann, T.; Driessen, P. The Flood Risk Management Plan: Towards Spatial Water Governance. J. Flood Risk Manag. 2017, 10, 145–154. [Google Scholar] [CrossRef]
- Jiménez, F. Building Boom and Political Corruption in Spain. South Eur. Soc. Politics 2009, 14, 255–272. [Google Scholar] [CrossRef]
- Olcina Cantos, J. De los mapas de zonas afectadas a las cartografías de riesgo de inundación en España. An. Geogr. Univ. Complut. 2012, 32, 91–131. [Google Scholar] [CrossRef]
- CCS. Actividad y Funciones; Ministerio de Economía, Industria y Competitividad: Madrid, Spain, 2018. [Google Scholar]
- Berz Gerhard, K.; Wolfgang, L.; Thomas, R.; Eric Schimetschek, J.; Schmieder, J.; Siebert, A.; Smolka, A.; Wirtz, A. World map of natural hazards—A global view of the distribution and intensity of significant exposures. Nat. Hazards 2001, 23, 443–465. [Google Scholar] [CrossRef]
- Jonkman, S.N. Global perspectives on loss of human life caused by floods. Nat. Hazards 2005, 34, 151–175. [Google Scholar] [CrossRef]
- RStudio Team. Integrated Development for R. Available online: https://posit.co/downloads/ (accessed on 15 July 2020).
- Barriendos, M.; Llasat, M.C. The case of the ‘Maldá’ anomaly in the western Mediterranean basin (AD 1760–1800): An example of a strong climatic variability. Clim. Change 2003, 61, 191–216. [Google Scholar] [CrossRef]
- Dünkeloh, A.; Jacobeit, J. Circulation dynamics of Mediterranean precipitation variability 1948–98. Int. J. Climatol. 2003, 23, 1843–1866. [Google Scholar] [CrossRef]
- Gallego, M.C.; Trigo, R.; Vaquero, J.; Brunet, M.; García, J.; Sigró, J.; Valente, M. Trends in frequency indices of daily precipitation over the Iberian Peninsula during the last century. J. Geophys. Res. Atmos. 2011, 116, 1–18. [Google Scholar] [CrossRef]
- Benito, G.; Machado, M. Floods in the Iberian Peninsula. In Changes in Flood Risk in Europe; Kundzewicz, Z., Ed.; CRC Press: London, UK, 2012; pp. 372–383. [Google Scholar] [CrossRef]
- Cortesi, N.; González-Hidalgo, J.C.; Brunetti, M.; Martin-Vide, J. Daily precipitation concentration across Europe 1971–2010. Nat. Hazards Earth Syst. Sci. 2012, 12, 2799–2810. [Google Scholar] [CrossRef]
- López-Martínez, F.; Gil-Guirado, S.; Pérez-Morales, A. Who can you trust? Implications of institutional vulnerability in flood exposure along the Spanish Mediterranean coast. Environ. Sci. Policy 2017, 76, 29–39. [Google Scholar] [CrossRef]
- Cutter, S.L. Vulnerability to environmental hazards. Prog. Hum. Geogr. 1996, 20, 529–539. [Google Scholar] [CrossRef]
- Cutter, S.L.; Boruff, B.J.; Shirley, W.L. Social vulnerability to environmental hazards. Soc. Sci. Q. 2003, 84, 242–261. [Google Scholar] [CrossRef]
- Martínez Ibarra, E. A geographical approach to post-flood analysis: The extreme flood event of 12 October 2007 in Calpe (Spain). Appl. Geogr. 2012, 32, 490–500. [Google Scholar] [CrossRef]
- Gil Meseguer, E.; Morales, A.; Espín, J.M. Precipitaciones y avenidas del 28 de septiembre de 2012 en el cuadrante suroccidental de la cuenca de Segura, (municipios de Lorca, Puerto Lumbreras y Pulpí). Pap. Geogr. 2012, 55–56, 75–94. [Google Scholar]
- White, G.F. Changes in Urban Occupance of Flood Plains in the United States; University of Chicago: Chicago, IL, USA, 1958. [Google Scholar]
- White, G.F. Natural hazards research. In Directions in Geography, 1st ed.; Chorley, R.J., Ed.; Routledge: London, UK, 1973; pp. 1–24. [Google Scholar]
- Martínez-Gomariz, E.; Forero-Ortiz, E.; Guerrero-Hidalga, M.; Castán, S.; Gómez, M. Flood Depth–Damage Curves for Spanish Urban Areas. Sustainability 2020, 12, 2666. [Google Scholar] [CrossRef]
- Gaume, E.; Bain, V.; Bernardara, P.; Newinger, O.; Barbuc, M.; Bateman, A.; Blaškovičová, L.; Blöschl, G.; Borga, M.; Dumitrescu, A.; et al. A compilation of data on European flash floods. J. Hydrol. 2009, 367, 70–78. [Google Scholar] [CrossRef]
- Marchi, L.; Borga, M.; Preciso, E.; Gaume, E. Characterisation of selected extreme flash floods in Europe and implications for flood risk management. J. Hydrol. 2010, 394, 118–133. [Google Scholar] [CrossRef]
- Millán, E.; Millán, M.J.; Miró, J. Rainfall components: Variability and spatial distribution in a Mediterranean Area (Valencia Region). J. Clim. 2005, 18, 2682–2705. [Google Scholar] [CrossRef]
- Martín-Vide, J.; Moreno-García, M.C.; López-Bustins, J.A. Synoptic causes of torrential rainfall in South-eastern Spain (1941–2017). Cuad. Investig. Geográfica 2021, 47, 143–162. [Google Scholar] [CrossRef]
- Pastor, F.; Gómez, I.; Estrela, M.J. Numerical study of the October 2007 flash flood in the Valencia region (Eastern Spain): The role of orography. Nat. Hazards Earth Syst. Sci. 2010, 10, 1331–1345. [Google Scholar] [CrossRef]
- Romero Díaz, A.; Maurandi Guirado, A. Las inundaciones en la cuenca del Segura en las dos últimas décadas del siglo XX: Actuaciones de prevención. Ser. Geográfica 2000, 9, 93–120. [Google Scholar]
Figure 1.
Study area. Municipalities are represented by white lines.

Figure 2.
River system distribution map.

Figure 3.
Seasonal cumulative rainfall (mm).

Figure 4.
General (up) and personal (down) flood losses paid for the period 1996–2016 according to the number of annual inhabitants. Lines represent annual value and shadows their accumulated.
Figure 4.
General (up) and personal (down) flood losses paid for the period 1996–2016 according to the number of annual inhabitants. Lines represent annual value and shadows their accumulated.

Figure 5.
Percentage of compensation paid (up) and number of events (down) by month.

Figure 6.
Evolution of flood damages by province.

Figure 7.
Flood damages in inland and coastal municipalities for each period considered.

Figure 8.
Spatial trends in floodable areas after standardized total damages paid by CCS.


Table 1.
Flood damages stages. Data expressed in EUR.
| Year | Mean Amount | Amount | % | Accumulated Amount | Accumulated % |
|---|---|---|---|---|---|
| 1996–1997 | 29,280,875 | 58,206,804 | 15 | 58,206,804 | 15 |
| 1998–2006 | 4,723,710 | 40,298,775 | 11 | 98,505,579 | 26 |
| 2007 | 85,475,562 | 85,475,562 | 23 | 183,981,141 | 49 |
| 2008–2016 | 21,736,264 | 194,770,700 | 51 | 378,751,841 | 100 |
Table 2.
Total, percentual and variation flood damages by asset in different periods. Data expressed in EUR.
Table 2.
Total, percentual and variation flood damages by asset in different periods. Data expressed in EUR.
| Assets | Flood Damages | |||||||
|---|---|---|---|---|---|---|---|---|
| 1996 | 2016 | % Increase | Average 1996–2005 | Average 2006–2016 | % Increase | Total Amount (1996–2016) | % | |
| Businesses | 774,544 | 19,548,384 | 2524 | 3,169,579 | 5,944,748 | 188 | 97,087,905 | 26 |
| Industry | 148,066 | 3,050,219 | 2060 | 1,630,132 | 2,173,277 | 133 | 40,206,817 | 11 |
| Civil engineering | 88,001 | 1,370,144 | 1557 | 247,671 | 495,526 | 200 | 7,926,984 | 2 |
| Offices | 5318 | 608,991 | 11,452 | 103,180 | 377,875 | 366 | 5,188,011 | 1 |
| Motor vehicles | 261,495 | 6,480,502 | 2478 | 1,431,444 | 3,679,524 | 257 | 54,789,082 | 14 |
| Dwellings | 1,499,693 | 24,281,590 | 1619 | 3,102,283 | 12,957,316 | 418 | 173,553,042 | 46 |
| Total amount | 2,777,116 | 55,339,829 | 1993 | 9,684,290 | 25,628,265 | 265 | 378,751,841 | - |
Table 3.
Flood damages’ evolution by province and asset. Data expressed in EUR.
| Province | Assets | Flood Damages | |||||||
|---|---|---|---|---|---|---|---|---|---|
| 1996 | 2016 | Variation (%) | Average 1996–2005 | Average 2006–2016 | Variation (%) | Total Amount (1996–2016) | % | ||
| Alicante | Businesses | 735,880 | 1,261,369 | 71 | 2,416,220 | 2,465,784 | 2 | 51,285,796 | 24 |
| Industry | 124,444 | 370,014 | 197 | 1,081,879 | 656,941 | −39 | 18,044,914 | 8 | |
| Civil engineering | 0 * | 428,652 | 42,865,200 | 151,592 | 54,390 | −64 | 2,114,003 | 1 | |
| Offices | 5318 | 20,022 | 277 | 73,581 | 156,719 | 113 | 2,459,421 | 1 | |
| Motor vehicles | 256,222 | 520,317 | 103 | 1,037,655 | 2,011,755 | 94 | 32,505,795 | 15 | |
| Dwellings | 1,485,340 | 3,422,749 | 130 | 2,495,064 | 7,514,851 | 201 | 107,613,905 | 50 | |
| Total amount | 2,607,204 | 6,023,123 | 131 | 7,255,990 | 12,860,441 | 77 | 214,023,834 | - | |
| Murcia | Businesses | 38,664 | 18,287,015 | 47,198 | 753,359 | 3,478,963 | 362 | 45,802,190 | 28 |
| Industry | 23,623 | 2,680,204 | 11,246 | 548,254 | 1,516,336 | 177 | 22,161,903 | 13 | |
| Civil engineering | 88,001 | 941,492 | 970 | 96,079 | 441,136 | 359 | 5,812,981 | 4 | |
| Offices | 0 * | 588,969 | 58,896,900 | 29,599 | 221,156 | 647 | 2,728,590 | 2 | |
| Motor vehicles | 5273 | 5,960,185 | 112,931 | 393,789 | 1,667,769 | 324 | 22,283,287 | 14 | |
| Dwellings | 14,352 | 20,858,840 | 145,235 | 607,219 | 5,442,464 | 796 | 65,939,137 | 40 | |
| Total amount | 169,913 | 49,316,706 | 28,925 | 2,428,299 | 12,767,824 | 426 | 164,728,007 | - | |
* These zero values could be considered records omissions.
Disclaimer/Publisher’s Note: The statements, opinions and data contained in all publications are solely those of the individual author(s) and contributor(s) and not of MDPI and/or the editor(s). MDPI and/or the editor(s) disclaim responsibility for any injury to people or property resulting from any ideas, methods, instructions or products referred to in the content. |
© 2023 by the author. Licensee MDPI, Basel, Switzerland. This article is an open access article distributed under the terms and conditions of the Creative Commons Attribution (CC BY) license (https://creativecommons.org/licenses/by/4.0/).
Share and Cite
MDPI and ACS Style
López-Martínez, F. Are Floods Becoming a More Expensive Hazard? A Damages Review of the Southeastern Spanish Coast (1996–2016). Land 2023, 12, 1035. https://doi.org/10.3390/land12051035
AMA Style
López-Martínez F. Are Floods Becoming a More Expensive Hazard? A Damages Review of the Southeastern Spanish Coast (1996–2016). Land. 2023; 12(5):1035. https://doi.org/10.3390/land12051035
Chicago/Turabian StyleLópez-Martínez, Francisco. 2023. "Are Floods Becoming a More Expensive Hazard? A Damages Review of the Southeastern Spanish Coast (1996–2016)" Land 12, no. 5: 1035. https://doi.org/10.3390/land12051035
Note that from the first issue of 2016, this journal uses article numbers instead of page numbers. See further details here.