Response of Runoff-Sediment System to Vegetation Variation in the Yellow River Basin in the Last 20 Years


1
Institute of Geographic Sciences and Natural Resources Research, Chinese Academy of Sciences, Beijing 100101, China
2
University of Chinese Academy of Sciences, Beijing 100049, China
*
Author to whom correspondence should be addressed.
Land 2023, 12(2), 428; https://doi.org/10.3390/land12020428
Submission received: 26 December 2022
/
Revised: 29 January 2023
/
Accepted: 3 February 2023
/
Published: 6 February 2023
Abstract
:The Yellow River basin suffers from the most serious soil erosion of any area in the world. It is also a key area for soil–water conservation and ecological protection in China. It is important to determine the status of the ecological protection of the Yellow River basin in recent years. We examined the vegetation patterns and spatio-temporal changes in runoff sediment in the Yellow River basin in the last 20 years. The results can provide a sound basis for regional ecological management. Vegetation coverage in the Yellow River basin has increased in the last two decades. The natural runoff has more than doubled over this time and the runoff coefficient has increased by more than 30%. However, the growth in the measured runoff has significantly weakened owing to continually high water consumption. The sediment concentration from Toudaoguai to Tongguan has decreased by 74.11% and the sediment modulus has decreased by 34.75%. Ecological protection of the Yellow River has significantly improved the vegetation coverage since 2000. The functions of water and soil conservation have improved, but the latter function needs to be strengthened. In addition, measures for ecological protection are needed to strengthen the overall management of water resources.
1. Introduction
The runoff and sediment of most rivers in the world have changed significantly over the past few decades, and different rivers are in varying stages of this process [1]. The changing characteristics of the runoff-sediment system have become an important part of research exploring changes in the global ecology and ecological management of watersheds [2]. The geomorphology of the Yellow River basin suffers from the most serious soil erosion in the world, and its sediment accounts for 6% of the total sediment of rivers worldwide [3]. It is not only a key area for soil and water conservation, and, thus, ecological protection in China, but is also an important grain-producing region [4,5]. Since 2000, China has carried out a large-scale project of reverting farmlands to forests (grassland) in the Yellow River basin, and this has helped control soil erosion and advance ecological protection in the region [6,7]. It is thus important to determine the relationship between ecological protection and changes in the sediment runoff in the Yellow River basin in recent years.
Many researchers have studied the characteristics of sediment runoff in the Yellow River basin, including variations in the runoff and sediment [8], the runoff–sediment relationship [9,10], the supply of and demand for water resources [11,12], soil erosion [13], and water pollution [14]. Reasons for changes in the runoff–sediment relationship in the Yellow River basin also constitute a popular subject of research. The causes of such changes are mainly reflected in direct and indirect effects, including changes in land use [15], vegetation coverage [16], climate [5] and water use [17].
The spatio-temporal changes in the vegetation and the relationship between runoff and sediment in the Yellow River basin are hot issues for multi-disciplinary scholars [18,19]. Many related studies have been carried out in the Yellow River basin, mainly involving the overall Yellow River basin, the source area, and the Loess plateau in the middle reaches of the Yellow River [20]. Some studies indicate that the overall vegetation in the Yellow River basin shows an improvement trend, especially since the implementation of the “Grain For Green” project [21,22]. However, there are spatial differences within the Yellow River basin. The temperature and evaporation in the source area of the Yellow River have increased due to climate change, which have a negative impact on vegetation growth [23,24,25,26]. The vegetation changes in the midstream and downstream of the Yellow River are more affected by human activities [27,28,29]. Many studies have investigated the changes in a runoff-sediment time series and the relationship with vegetation changes, among which the sharp decrease in runoff sediment of the Yellow River is particularly concerned [30,31]. However, the physical mechanism between the sharp decrease in runoff sediment and the vegetation changes in the basin has not been clarified.
The main stream of the Yellow River is 5464 km long and has a drainage area of 795,000 km2. The Yellow River basin flows through nine provinces from the west to the east of China. The main tributaries of the Yellow River include the Taohe River, Kuye River, Wuding River, Fenhe River, Weihe River, Jinghe River, Beiluo River, and Qinhe River. Under the combined action of natural and human factors, the runoff sediment conditions in the Yellow River basin have exhibited new characteristics in recent years that are worthy of attention. This study examined the ecological protection of the Yellow River basin in the last 20 years, potentially providing a sound basis for regional ecological management. The innovation and necessity of our research mainly include: firstly, the vegetation changes in the whole Yellow River basin in the past 20 years are revealed through a long time series; secondly, the causes of changes in water conservation and water-soil conservation are revealed through the comprehensive study of the changes in the runoff-sediment system (runoff, sediment load, runoff coefficient, sediment concentration, and sediment modulus) in the past 20 years; and finally, the influence mechanism of vegetation change on runoff-sediment system change is revealed through the correlation between changes in vegetation and the runoff-sediment system.
2. Materials and Methods
2.1. Materials
This research was based on the annual precipitation, runoff, and sediment load of 16 main hydrological stations and the Normalized Difference Vegetation Index (NDVI) in the Yellow River basin. NDVI quantifies vegetation by measuring the difference between near-infrared and infrared light. The range of NDVI is always −1–1. When the value is negative, it is likely to be water. If the NDVI value is close to 1, it is likely to be dense green leaves. When NDVI is close to zero, it may even be an urbanized area. The NDVI can accurately reflect the surface vegetation coverage. At present, NDVI time series data based on satellite remote sensing images such as SPOT/VEGETATION and MODIS have been widely used in to monitor dynamic changes in vegetation, detect land use/cover changes, classify macro-vegetation cover, and estimate primary productivity in regions at various scales. The “runoff-sediment system” refers to runoff, sediment load, runoff coefficient, sediment concentration, and sediment modulus. The data on the annual runoff and sediment load were taken from the Yellow River Sediment Bulletin issued by the Yellow River Water Resources Commission of the Ministry of Water Resources (http://www.yrcc.gov.cn/ (accessed on 1 May 2021)) (Figure 1). The annual precipitation and NDVI data were taken from the Resource and Environment Science and Data Center of the Chinese Academy of Sciences (http://www.resdc.cn/ (accessed on 1 May 2021)). The time series of the data was 2000–2020.
2.2. Methods
2.2.1. Division of the Basin
We selected Toudaoguai, Tongguan, and Lijin as the control hydrological stations in the upper, middle, and lower reaches of the Yellow River, respectively, and chose the Tangnaihai and Lanzhou hydrological stations to further divide the upper reaches of the river to ensure the representativeness and continuity of the data (to avoid interference by data from the Xiaolangdi Reservoir and other reservoirs). The Yellow River was divided into five regions: I: above Tang Naihai, with a drainage area of 122,000 km2; II: the controlled drainage area of 100,600 km2 between Tangnaihai and Lanzhou hydrological stations; III: the controlled drainage area of 145,300 km2 between Lanzhou and Toudaoguai hydrological stations (I, II, and III represent the upper reaches of the Yellow River); IV: the watershed area controlled between Toudaoguai and Tongguan hydrological stations in the middle reaches of the Yellow River, covering 314,300 km2; and V: the area of the lower reaches of the Yellow River between Lijin and Tongguan, covering 69,700 km2. The 11 tributaries were the Taohe River, Huangfuchuan River, Kuye River, Wuding River, Yanhe River, Jinghe River, Beiluo River, Weihe River, Fenhe River, Yiluo River, and Qinhe River (Table 1).
To explore the relationship between vegetation cover and changes in the runoff–sediment system in the Yellow River basin, we calculated the results for each section of the river separately, whereas data from the station at each tributary remained unchanged. For example, the runoff in Upstream 3 is the runoff in Toudaoguai Station minus the runoff in Lanzhou Station. Although this calculation may lead to negative values, they can still reveal change trends in the runoff. Compared with direct analysis, this method can more clearly indicate the change trend of each river section. Other indicators were also calculated in the same way (Figure 2).
2.2.2. Pearson Correlation Analysis
The Pearson correlation coefficient is used to measure the linear relationship between distance-related variables. If ρ = 0, there is no linear correlation between X and Y (X, Y are two variables). The closer the correlation coefficient is to 1 or −1, the stronger the degree of correlation. The closer the correlation coefficient is to zero, the weaker the correlation. The Pearson correlation coefficient was calculated as follows:
where the Pearson’s correlation coefficient is equal to the covariance of the two variables divided by their standard deviation.
2.2.3. Hydrological Index
The runoff coefficient (RC) refers to the ratio of the depth of runoff in any period to the depth of precipitation in the same period. The runoff coefficient comprehensively reflects the influence of natural geographical factors on the precipitation–runoff relationship in the basin:
where α is the runoff coefficient, R is the depth of the runoff (in mm), and P is the depth of precipitation (in mm). α varies from zero to one.
The sediment concentration (SC) refers to the amount of sediment contained in a unit volume of muddy water and is the most direct representation of soil conservation in a given area. Its unit of measurement is kg/m3:
where X is the sediment concentration in a given river, S is its sediment transport (in kg), and V is runoff (in m3).
The sediment modulus (SM) refers to the ratio of the sediment load to the corresponding catchment area in a certain period. It is used to express the intensity of erosion and sediment yield. A high sediment modulus indicates that erosion is significant and the capacity of the river channel to carry sediment load is large. On the contrary, a low value means that erosion is minor and the capacity of the river to carry sediment load is small. Its unit of measurement is t/km2•year:
where M is the sediment modulus, S is the sediment load of the river (in t), and A is the basin area (in km2).
3. Results
3.1. Spatio-Temporal Changes in Vegetation Cover from 2000 to 2020
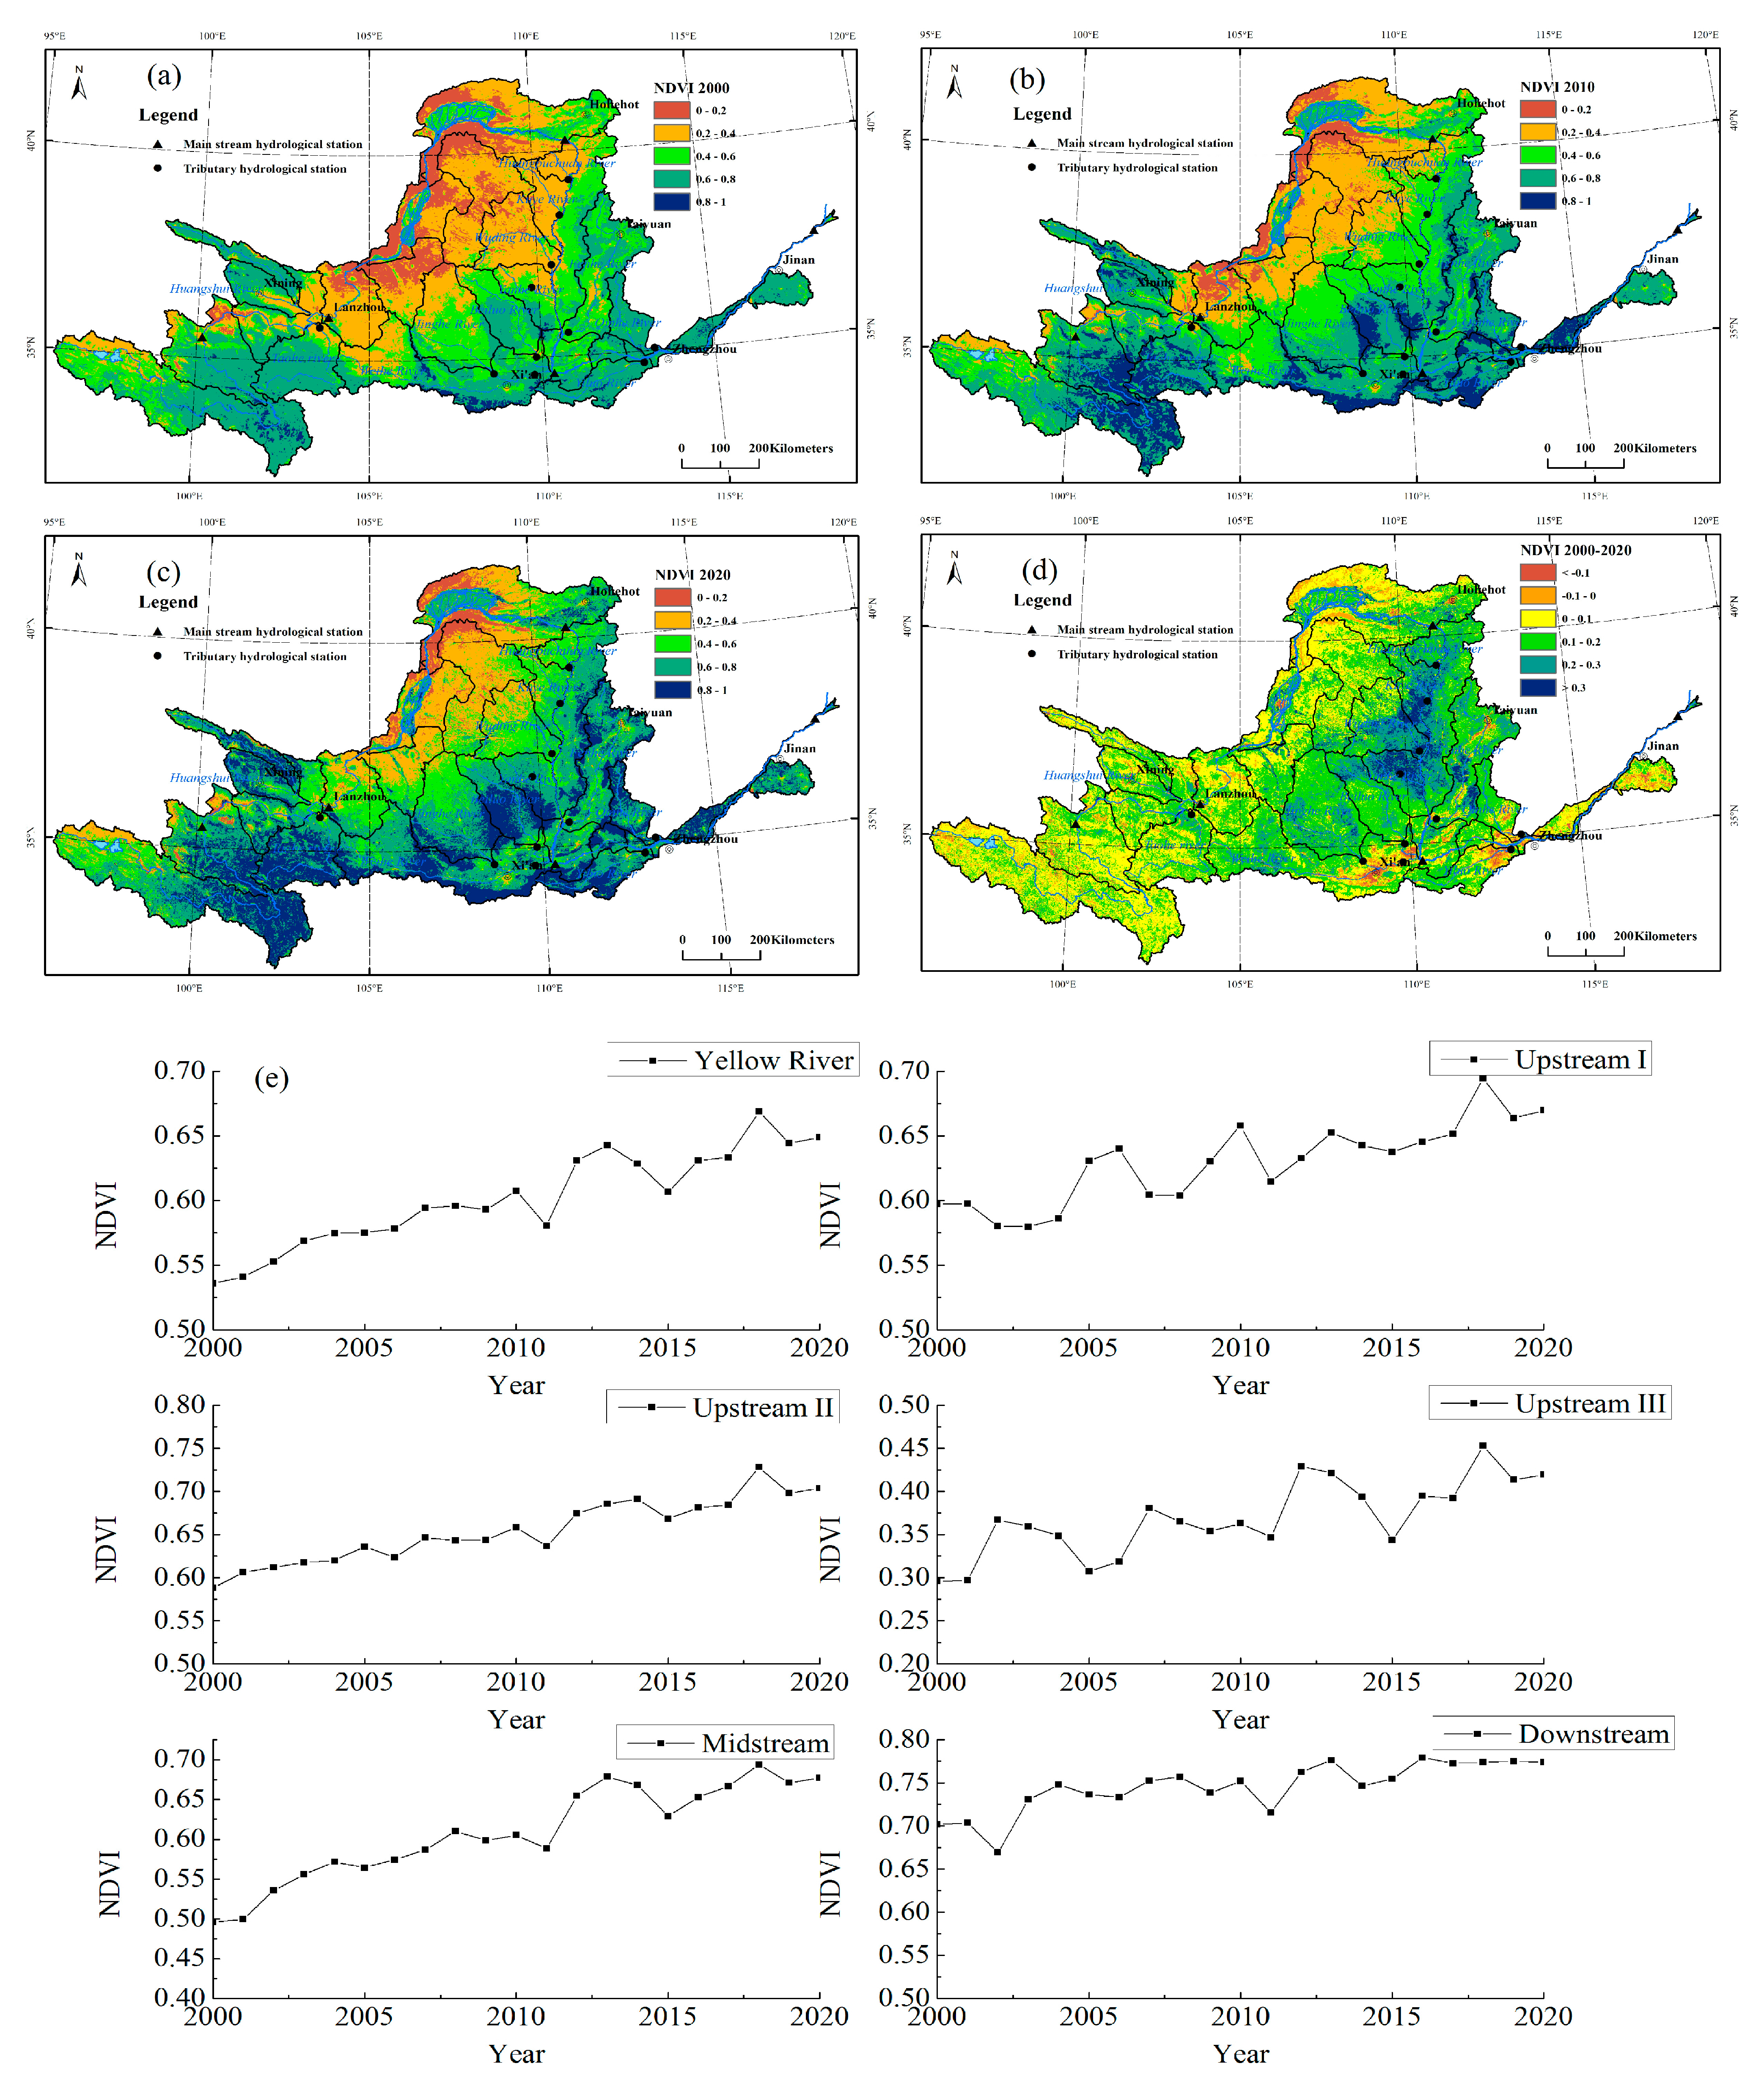
The highest overall NDVI (Normalized Difference Vegetation Index) value over the course of the study period was recorded in the lower reaches of the Yellow River and the lowest NDVI value was recorded in its upper reaches, indicating that vegetation coverage in the latter region was the highest, followed by the middle reaches, and was lowest in the higher reaches of the river. Among the main tributaries of the Yellow River basin, Yanhe River, Jinghe River, Beiluo River, Weihe River, Fenhe River, Yiluo River, and Qinhe River had high NDVI values and good vegetation coverage. The lowest NDVI values over the years were recorded in the Huangfuchuan River, Kuye River, and Wuding River basins, where the vegetation coverage was the worst (Figure 3a–d).
Overall, the vegetation cover in the Yellow River basin has increased in the past 20 years, resulting in a prominent effect in terms of ecological protection. The degree of increase in vegetation cover in the middle reaches of the Yellow River was higher than in the upper and lower reaches. The NDVI values of the entire Yellow River basin increased from 0.54 to 0.67 in the study period, representing a net increase of 35.2%. The spatial pattern of vegetation cover in the middle and upper reaches of the Yellow River (basins III and IV) increased most significantly, with an average increase in the NDVI values from 0.4 to 0.57, representing a net increase of 47%. The lower Yellow River (basin V) had the smallest range of growth, with the average NDVI value increasing from 0.7 to 0.77—a net increase of only 10%. The growth rates of vegetation cover in areas I and II in the upper reaches of the Yellow River were 16% and 24%, respectively.
The degree of improvement in vegetation coverage in the west bank basin of the middle reaches of the Yellow River was much higher than that in the east bank basin. Huangfuchuan River, Kuye River, Wuding River, Yanhe River, Jinghe River, Beiluo River, and Weihe River are located on the west bank, while Fenhe River, Yiluo River, and Qinhe River are located on the east bank. The vegetation cover in the Huangfuchuan River, Kuye River, Wuding River, Yanhe River, and Jinghe River basins increased most significantly (more than 50%). This was followed by increases in vegetation cover in the Beiluo River, Weihe River, and Fenhe River of 25–35% and increases in the Yiluo River and Qin River basins of only 11% and 17%, respectively (Figure 3e).
The vegetation cover in some areas of the lower Yellow River decreased. For example, the Weihe River basin is an urban agglomeration centered on Xi’an and Shaanxi and the Yiluo River and Qinhe River basins are urban agglomerations centered on Zhengzhou and Henan. In the past 20 years, large-scale urbanization in the lower reaches of the Yellow River (mainly in Henan and Shandong Provinces) has led to a reduction in vegetation cover.
3.2. Dynamic Variations in Hydrological Indices in the Last 20 Years
3.2.1. Variations in Precipitation
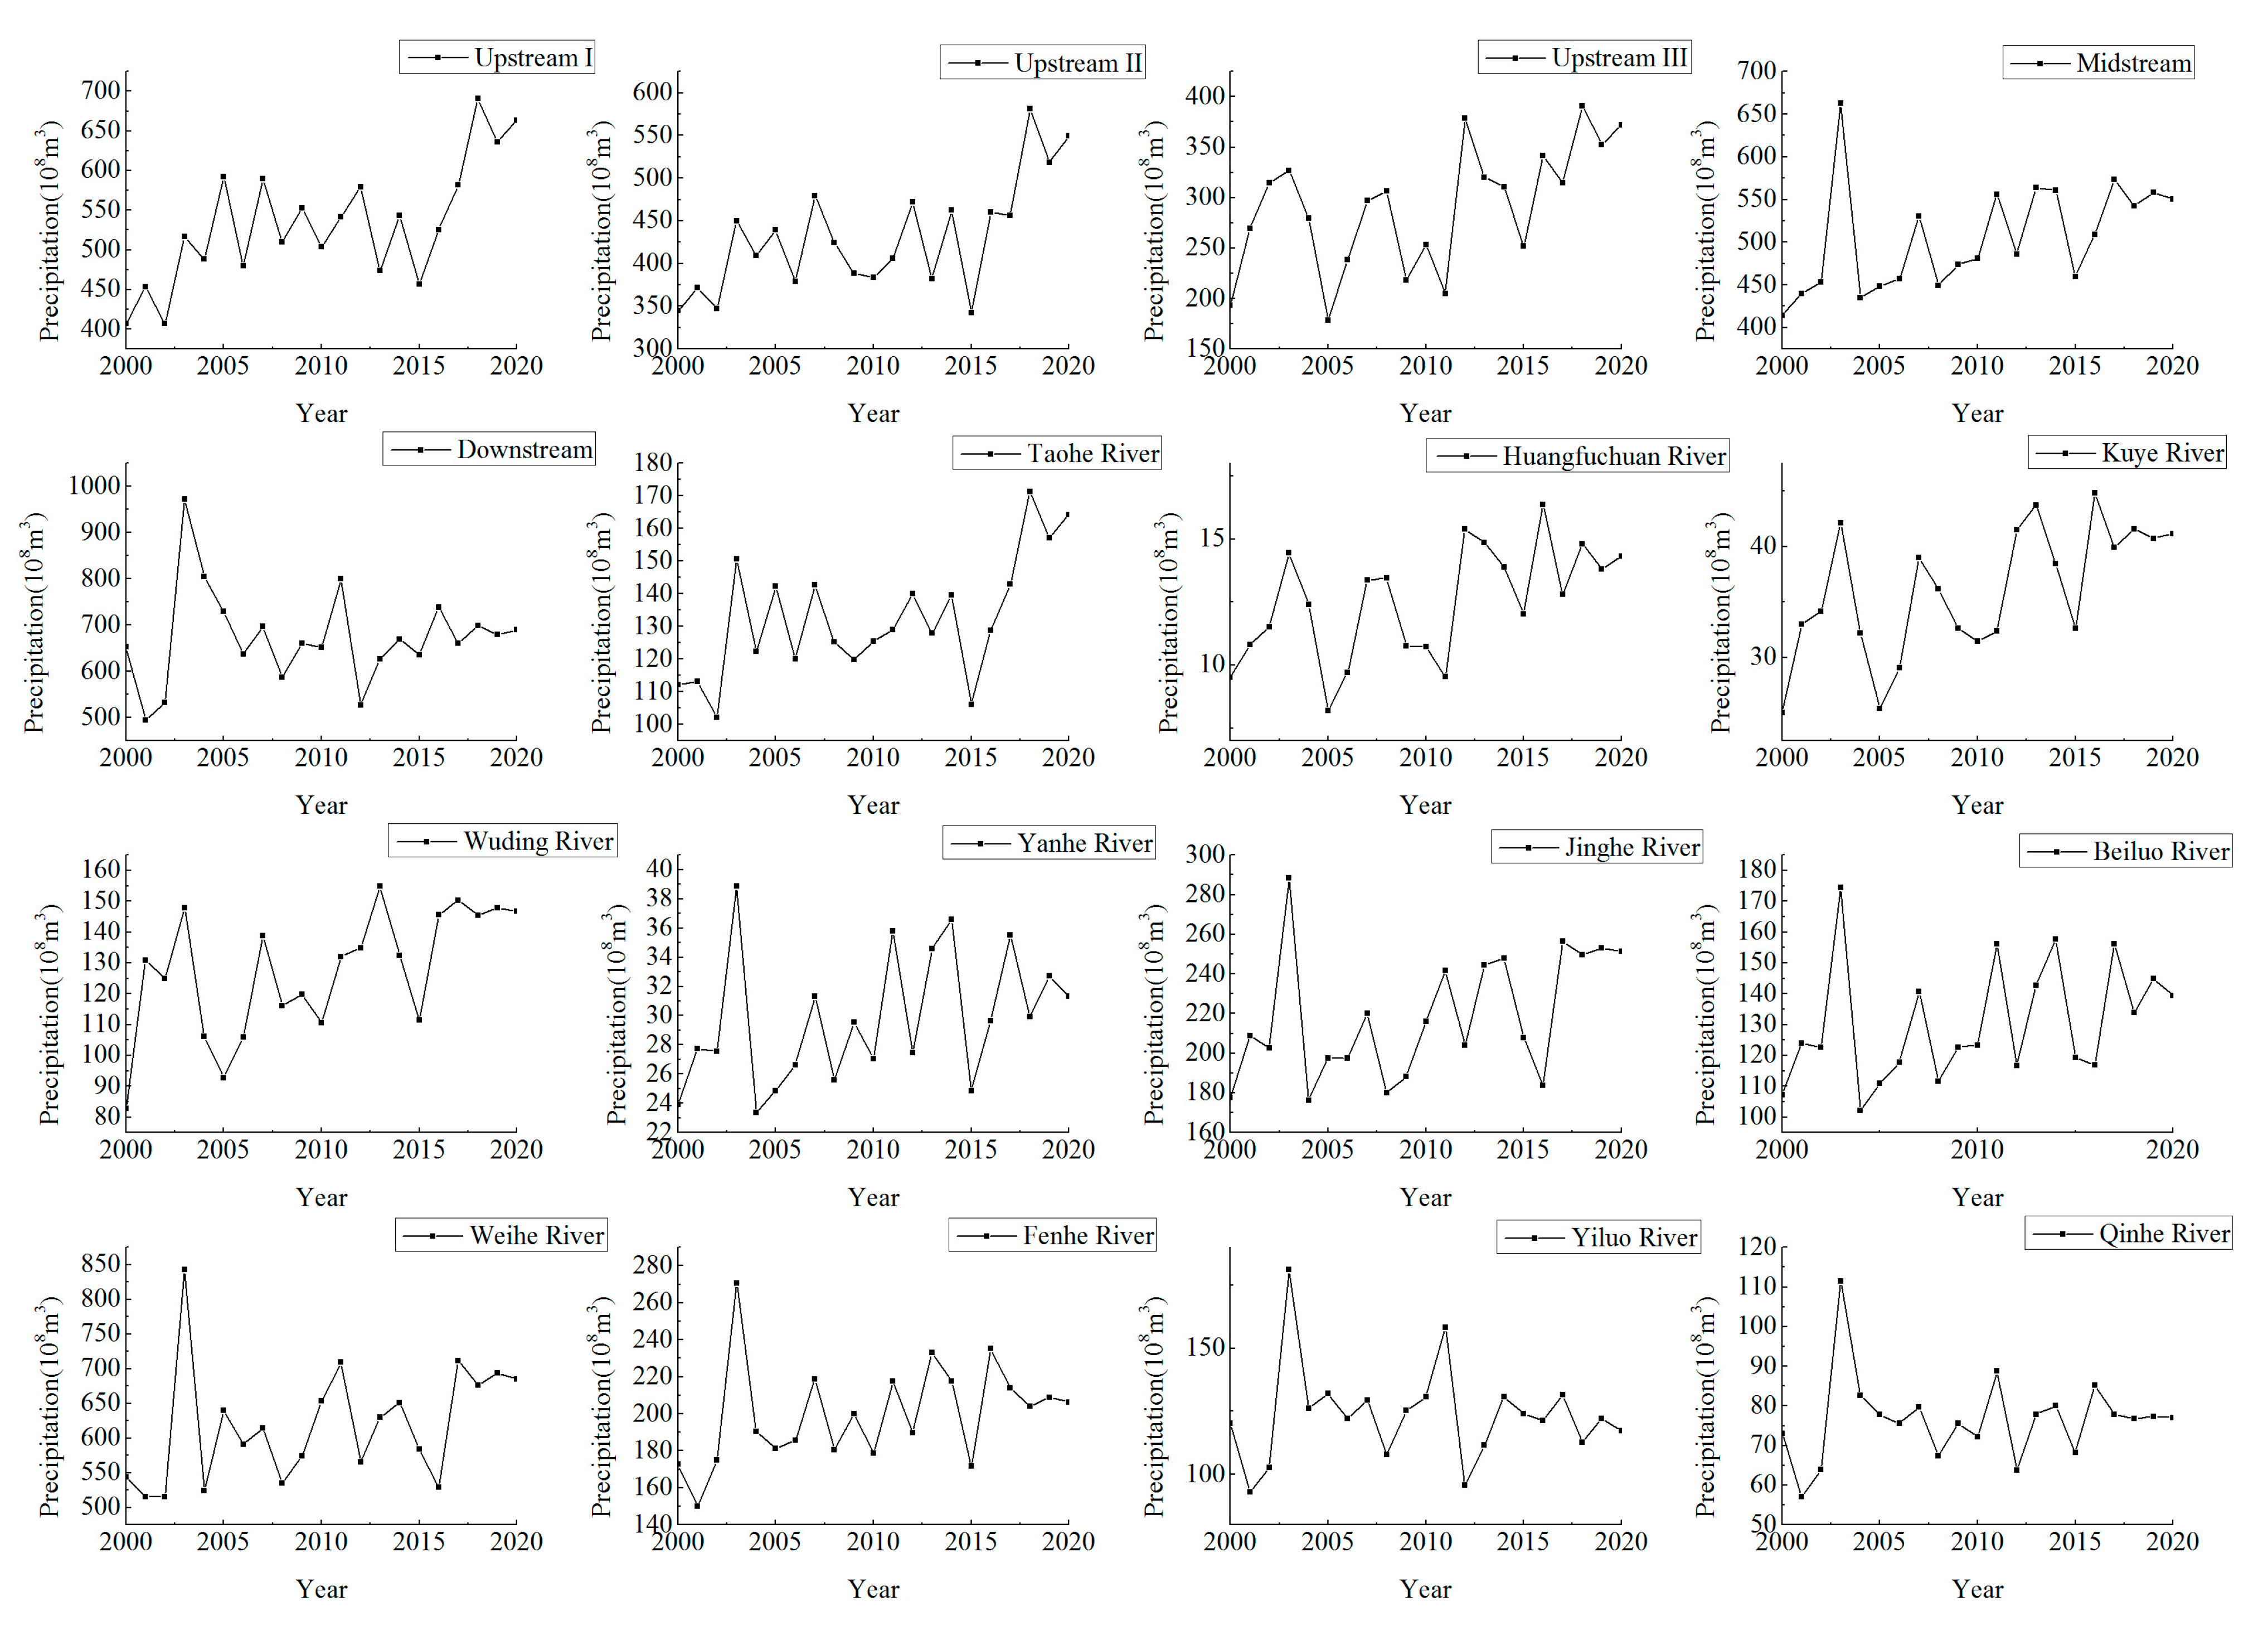
In the last 20 years, precipitation in the Yellow River Basin has shown a prominent increasing trend of 2.0 × 10¹⁰ m3 (converted into runoff according to precipitation) (Figure 4). The average annual precipitation increased by 23.6% in the middle reaches of the Yellow River, 6.6% the lower reaches of the Yellow River, 41%, in the upper reaches, 40.7% in area II, and 50.5% in area III. The precipitation in the main tributaries of the Taohe River, Huangfuchuan River, Kuye River, Wuding River, Yanhe River, Jinghe River, Beiluo River, Weihe River, Fenhe River, Yiluo River, and Qinhe River increased by 40.16%, 45.05%, 62.95%, 78.53%, 36.63%, 42.60%, 35.13%, 27.54%, 20.99%, 1.58%, and 5.89% respectively.
3.2.2. Variation in Runoff
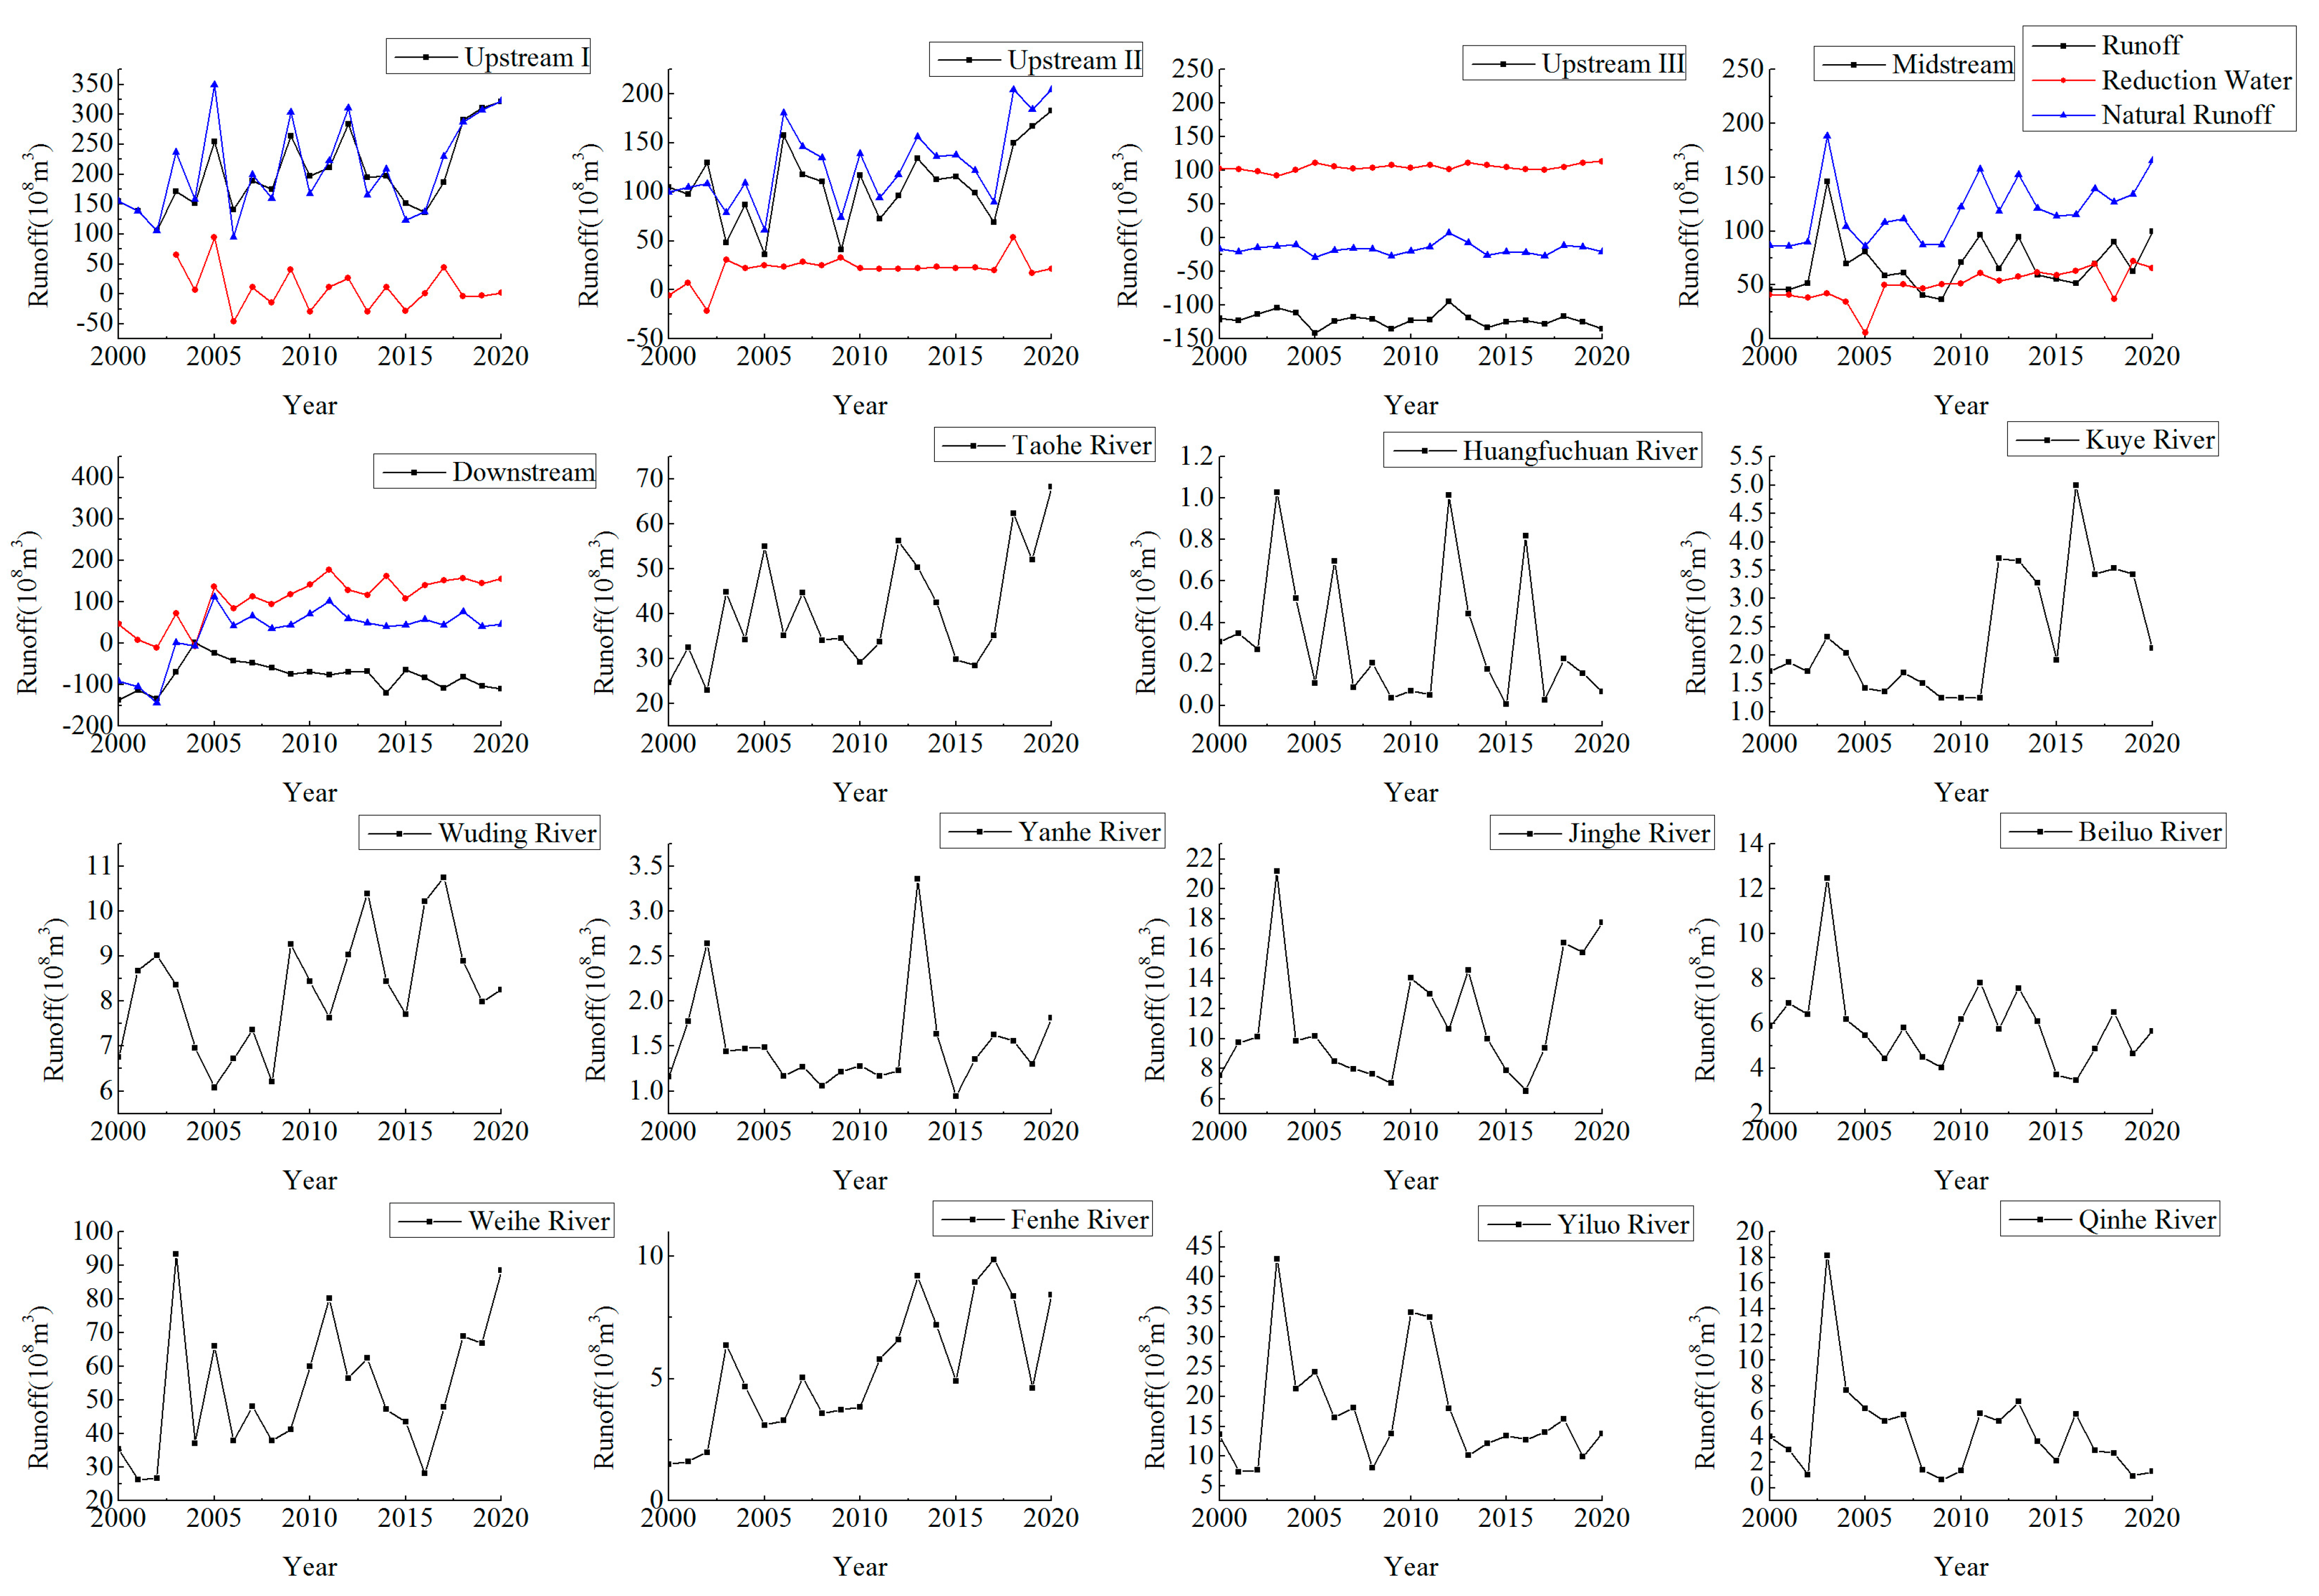
Natural runoff refers to the sum of measured runoff, water intake, and water storage in a given river. We calculated the natural runoff of the Yellow River basin according to the measured and reduced runoff (the sum of water consumption and storage) to adequately reflect the changes in the runoff.
The runoff increased by 109.15% above Tangnaihai, 105.37% from Tangnaihai to Lanzhou, 91.25% from Lanzhou to Toudaoguai, 91.25% from Toudaoguai to Tongguan, and 8.62% from Tongguan to Lijin (Figure 5). Of the 11 main tributaries, the runoff of seven tributaries showed an increasing trend. The runoff of Tao River, Kuye River, Wuding River, Yan River, Jing River, Wei River, and Fen River increased by 110.89%, 99.42%, 18.46%, 12.38%, 108.48%, 88.13%, and 206.37%, respectively. The runoff of the other four tributaries showed a decreasing trend: those of Huangfuchuan River, Beiluo River, Yiluo River, and Qin River decreased by 49.12%, 20.85%, 27.42%, and 76.81%, respectively. It is clear that the runoff in the rivers was characterized by a global increasing trend and local decreases.
Changes in the runoff showed that the maximum reduced runoff in the Yellow River basin was 3.5 × 10¹⁰ m3, accounting for more than 50% of the total natural runoff. The river sections of Lanzhou-Toudaoguai and Tongguan-Lijin recorded the largest reduced runoff (above 1.0 × 10¹⁰ m3 throughout the year), which increased year by year. The reduced runoff from Toudaoguai to Tongguan was relatively small and stable at 7.0 × 10⁹ m3. The runoff in sections above Tangnaihai and from Tangnaihai to Lanzhou was the smallest at 3.0 × 10⁹ m3.
The natural runoff of the Yellow River basin reached 6.5 × 10¹⁰ m3 and had tripled over the past 20 years. The natural runoff above Tangnaihai and Tangnaihai-Lanzhou was higher than 1.0 × 10¹⁰ m3 in most years, showing an increasing trend each year. The natural runoff of Lanzhou-Toudaoguai was negative and had not changed significantly for many years. The natural runoff of the section from Toudaoguai to Tongguan was maintained at 7.5 × 10⁹ m3 and had increased each year. The natural runoff of the Tongguan-Lijin reach gradually increased from a negative value to 5.0 × 10⁹ m3 and had remained stable.
On the whole, the sections above Tangnaihai, and from Tangnaihai to Lanzhou contributed the most to the water yield of the entire Yellow River basin, but the water consumption was low. These areas constitute the “water towers” of the Yellow River. The sections from Lanzhou to Toudaoguai, Toudaoguai to Tongguan, and Tongguan to Lijin consumed 75% of the water in the Yellow River basin. The reach from Toudaoguai to Tongguan was the largest (more than 7.5 × 10⁹ m3), followed by that from Tongguan to Lijin (about 5.0 × 10⁹ m3). The contribution of the Lanzhou-Toudaoguai reach to the water yield of the Yellow River was the smallest (negative value), indicating that the water intake of this section far exceeded the amount of water that it provided.
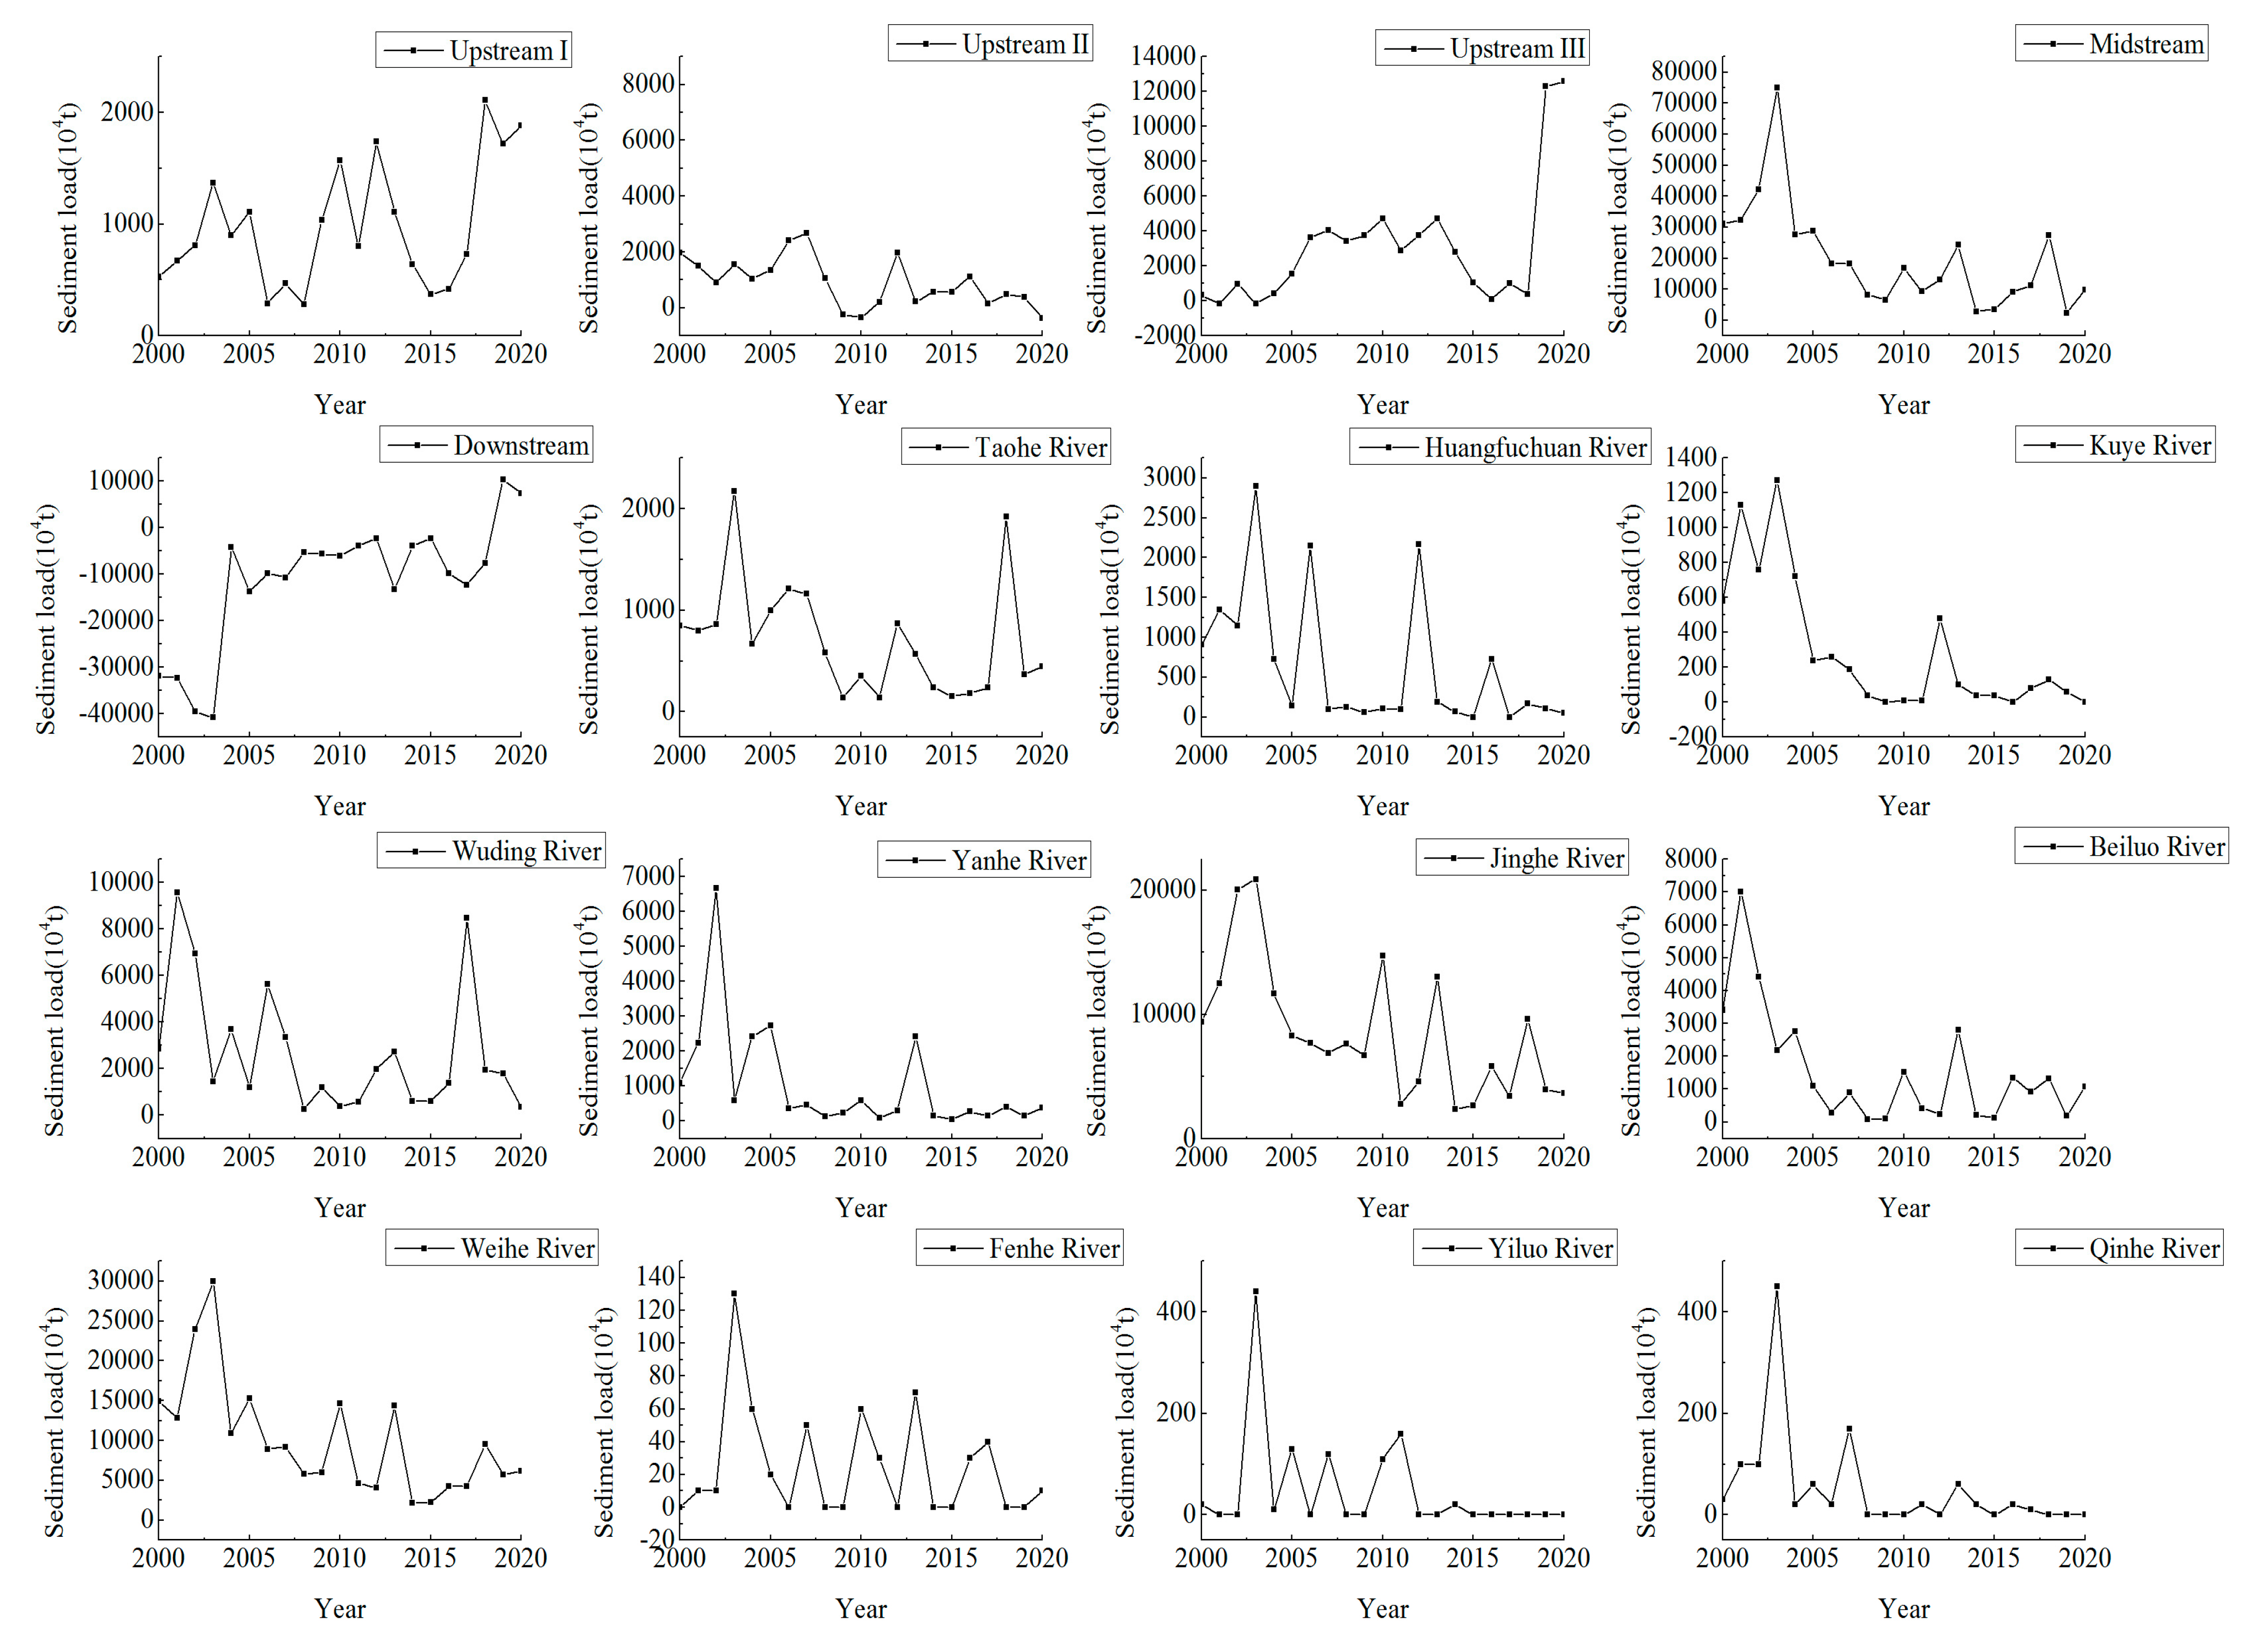
3.2.3. Variation in Sediment
The annual sediment load increased by 224.53% in region I of the upper reaches of the Yellow River, decreased by 80.91% in region II, and increased by 12.12% in region III (Figure 6). The average annual sediment discharge decreased by 92.32% in the middle reaches of the Yellow River (region IV) and increased by 132.31% in the lower Yellow River (region V). The sediment load in the middle reaches of the Yellow River was much higher than that in its upper and lower reaches, and that in the west bank of the middle reaches was much greater than that in the east bank. The sediment load of the main tributaries of the Yellow River Basin showed a decreasing trend. Those of Kuye River, Huangpuchuan River, Wuding River, Yanhe River, Jinghe River, Beiluo River, and Weihe River decreased by 81%, 78%, 32%, 62%, 64%, 61%, and 36%, respectively. The sediment loads of Fenhe River, Qinhe River, and Yiluo River were very small. The sediment load in the Yellow River Basin decreased significantly on the whole. Specifically, the sediment load in the upper reaches of the Yellow River showed a decreasing trend, but there were differences among reaches. The sediment load in the sections above Tangnaihai and from Lanzhou to Toudaoguai increased gradually, while that in the section from Tangnaihai to Lanzhou decreased each year. The sediment load from Toudaoguai to Tongguan decreased the most and that from Tongguan to Lijin increased only slightly.
3.3. Variations in Water and Soil Conservation Functions
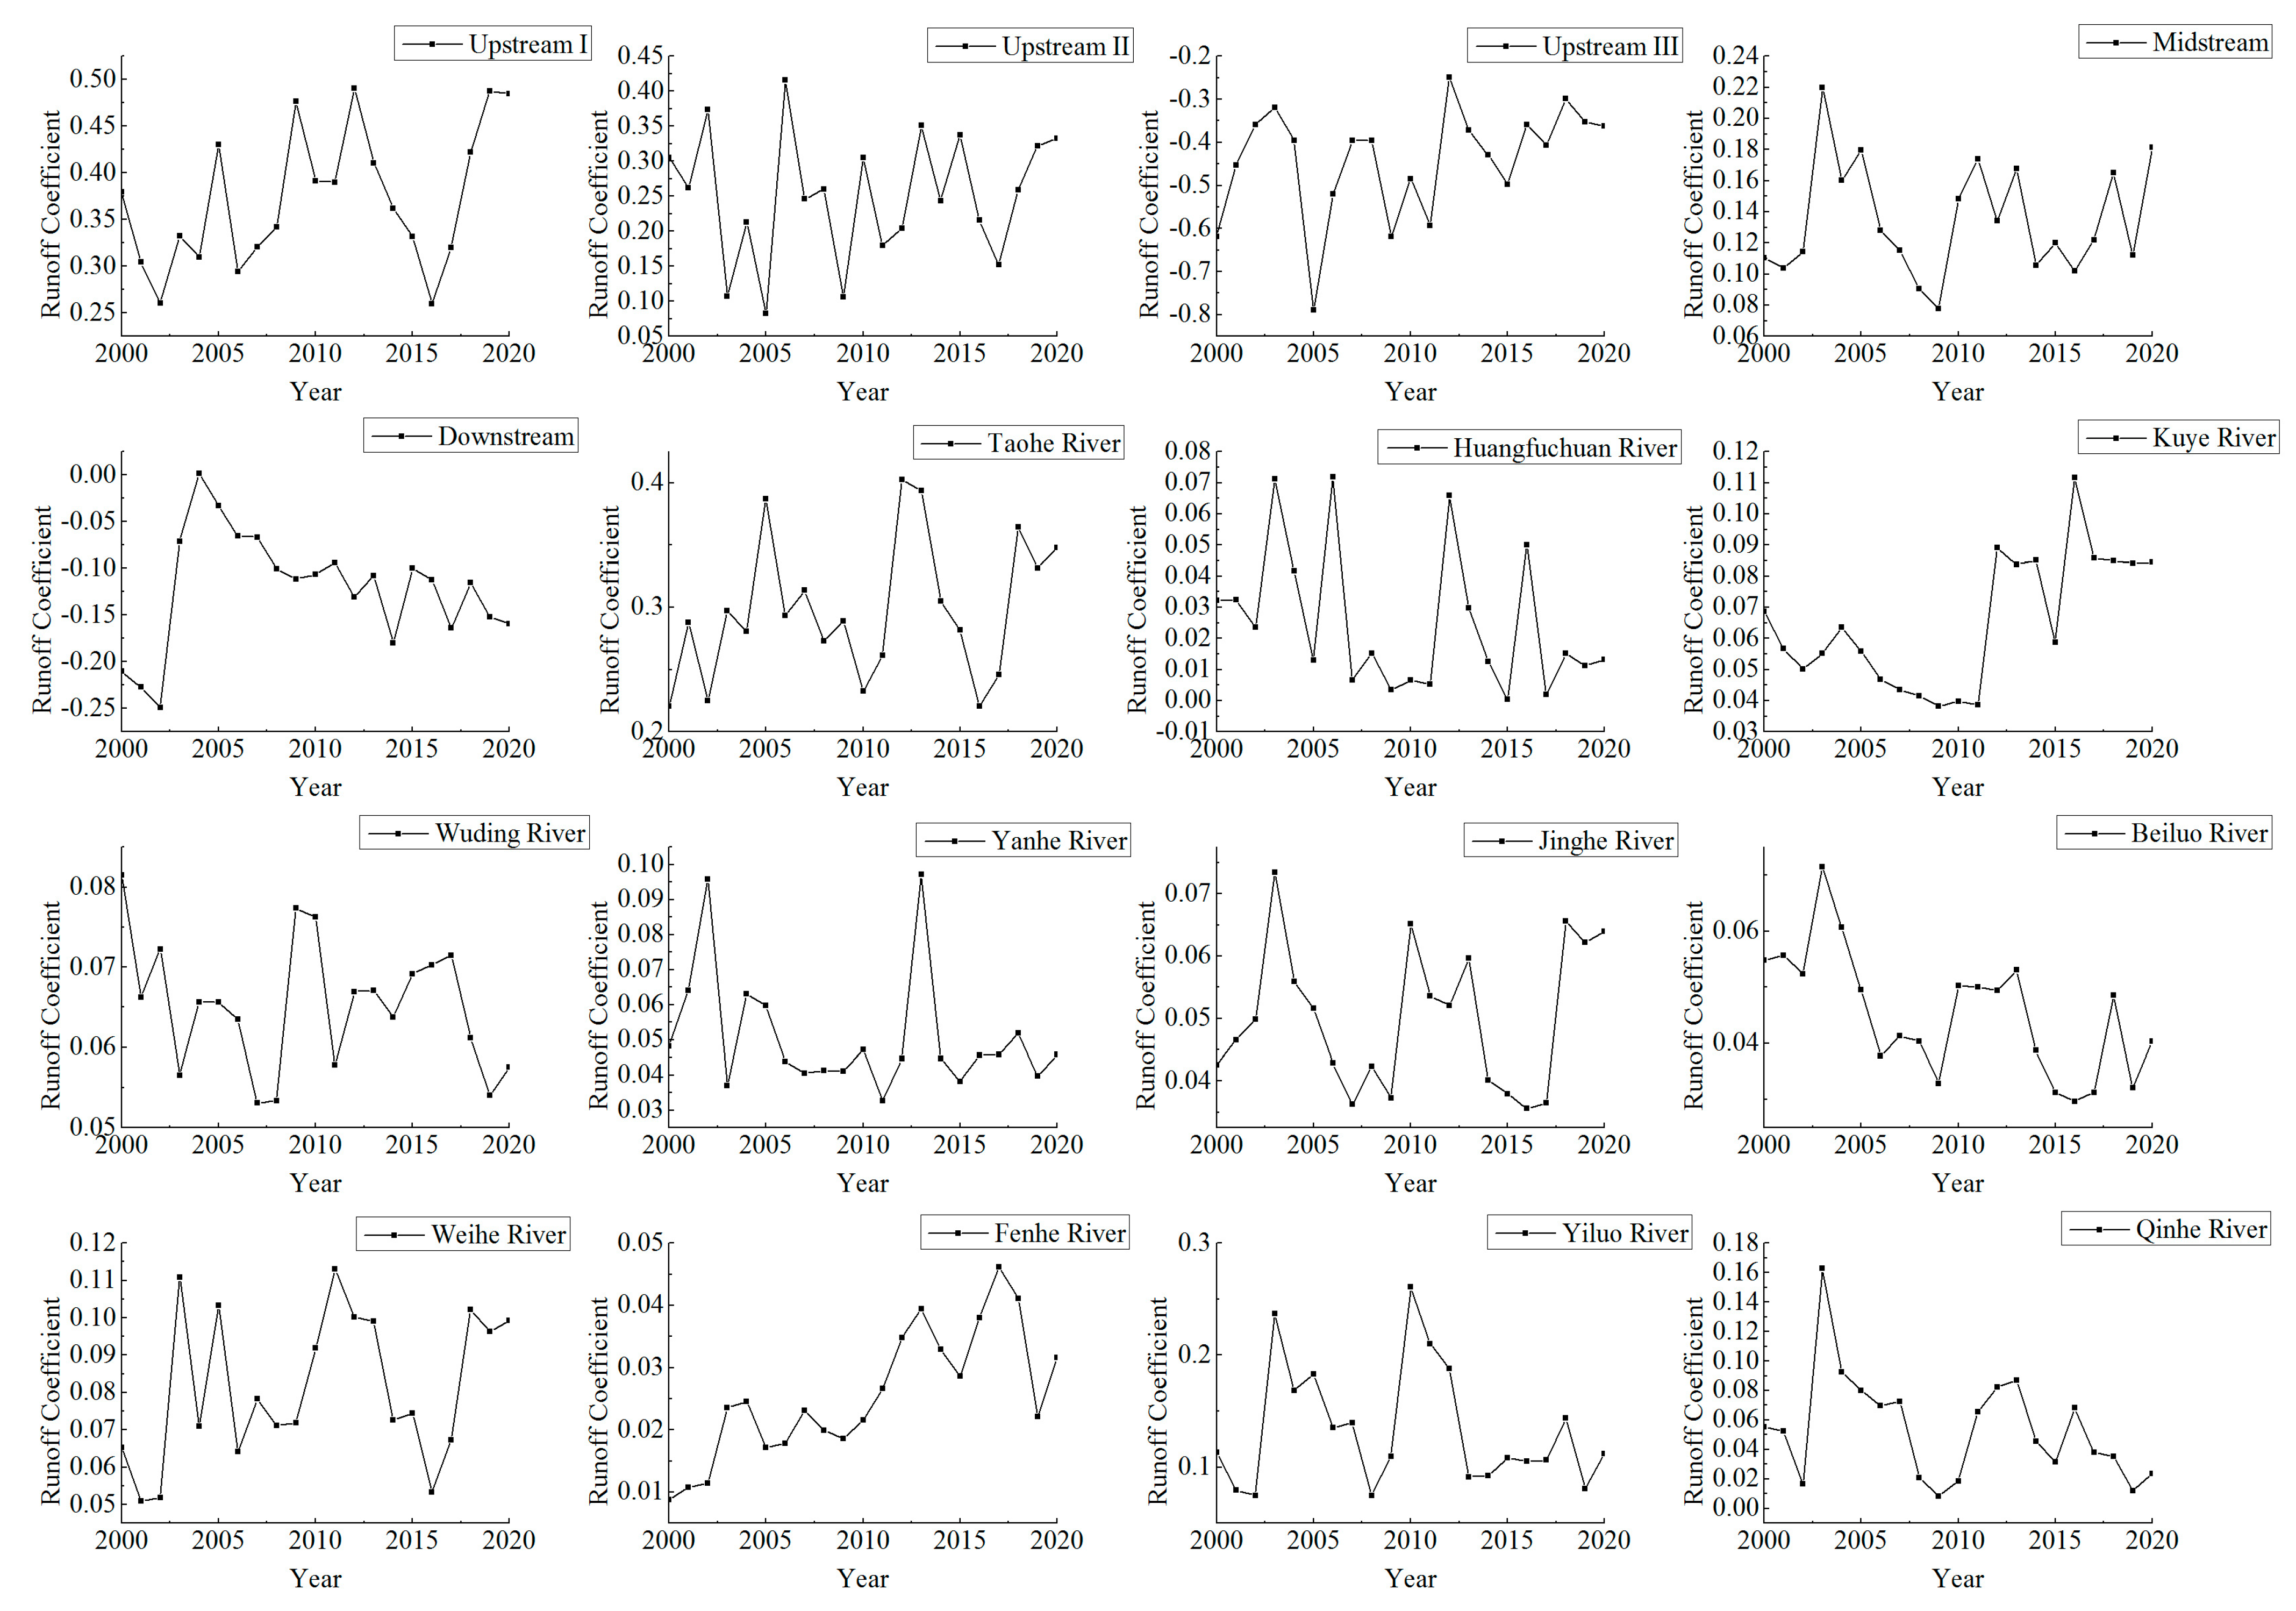
3.3.1. Variations in the Runoff Coefficient
The runoff coefficient is the ratio of precipitation to runoff and reflects the influence of the geographical factors in the basin on the process whereby precipitation leads to runoff. The runoff coefficients of the five main hydrological stations in the Yellow River basin showed an increasing trend (increases in the runoff coefficients were 27.57%, 9.06%, 41.36%, 64.09%, and 24.16%) (Figure 7). Among the hydrological stations of the 11 tributaries, the runoff coefficients of five stations exhibited an increasing trend (Taohe River, Kuye River, Jinghe River, Weihe River, and Fenhe River) while those of the other six stations showed a decreasing trend (Huangpuchuan River, Wuding River, Yanhe River, Beiluo River, Yiluo River, and Qinhe River). The NDVI values of these tributaries were also relatively low. On the whole, the runoff coefficient of the Yellow River basin showed an overall increasing trend and local decreases. The improvement in the runoff of the Toudaoguai-Tongguan reach was the most prominent. The water conservation function of the basin significantly improved on the whole, but it did not increase significantly and even deteriorated in some tributaries.
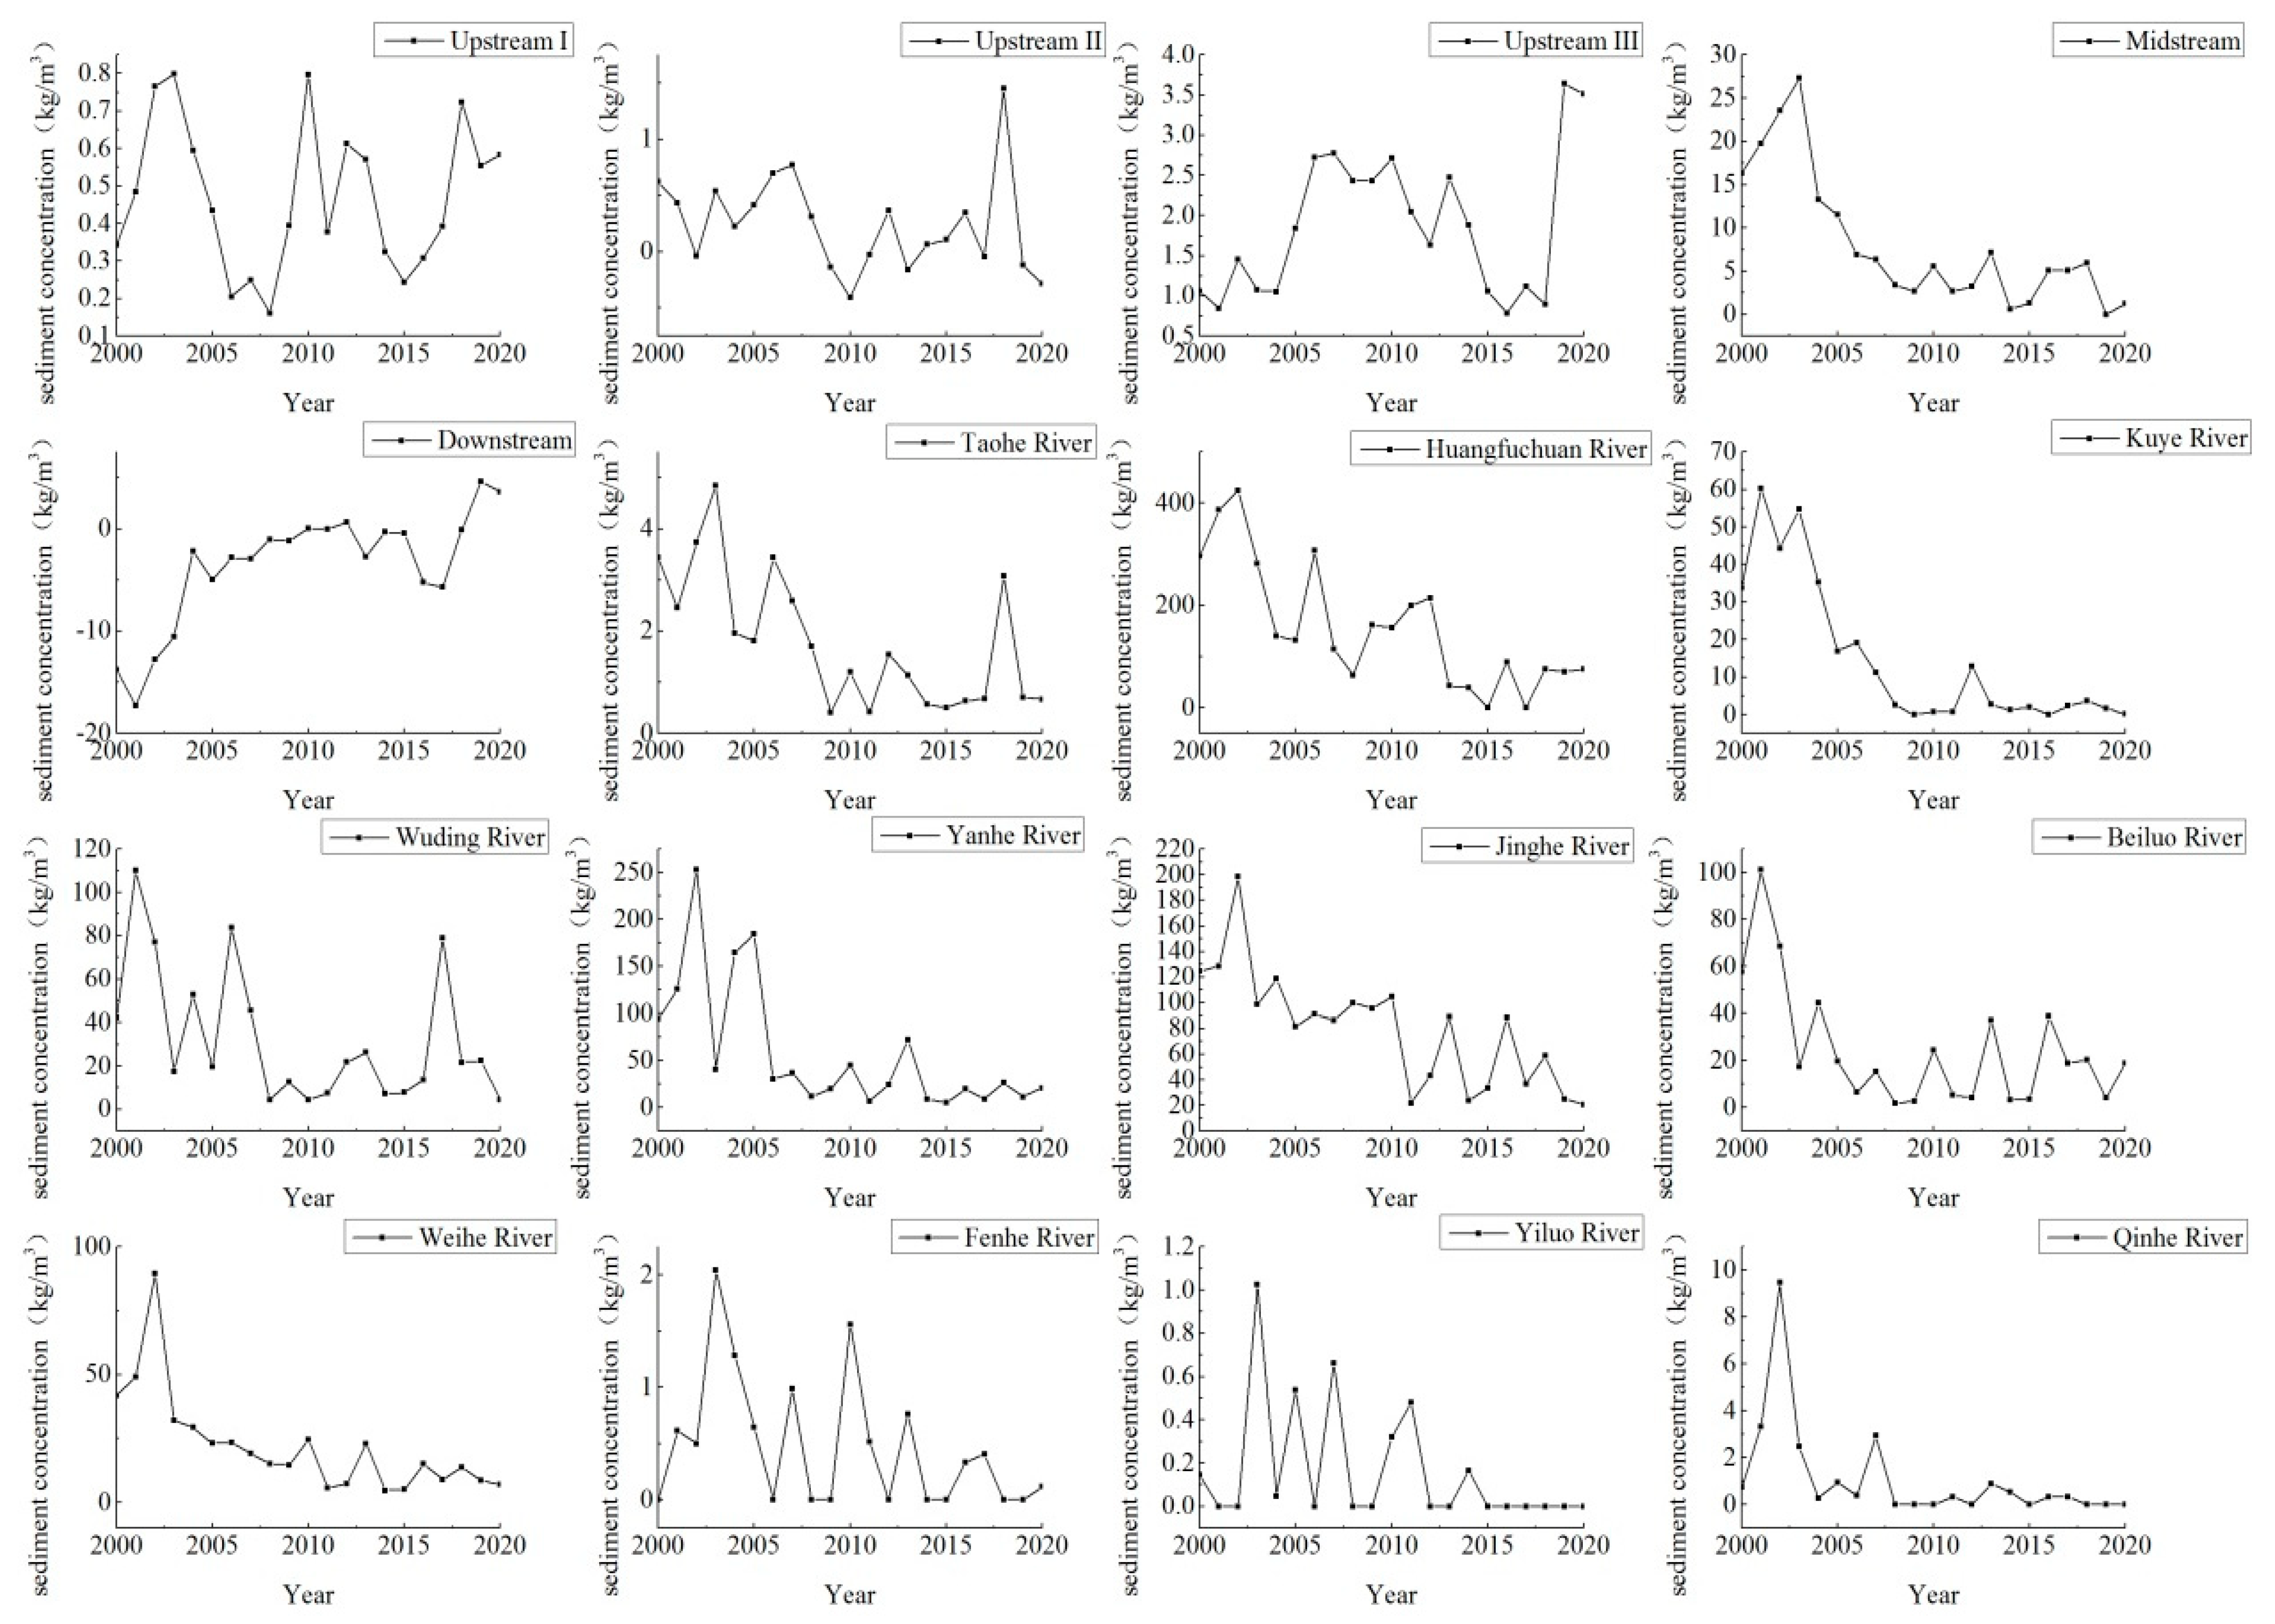
3.3.2. Variations in Sediment Concentration
It is generally believed that less water and soil loss leads to a lower sediment concentration in the river, as well as the opposite. Of the five hydrological stations in the main stream of the Yellow River basin, sediment concentrations in the Tangnaihai-Lanzhou and Toudaoguai-Tongguan sections decreased by 40.07% and 74.11%, respectively. The sediment concentrations in the sections above Tangnaihai, from Lanzhou to Toudaoguai, and from Tongguan to Lijin increased by 70.41%, 231.66%, and 126.31%, respectively (Figure 8). The sediment concentrations of the 11 tributary hydrological stations (Taohe River, Huangfuchuan River, Kuye River, Wuding River, Yanhe River, Jinghe River, Beiluo River, Weihe River, Fenhe River, Yiluo River, and Qinhe River) decreased by 84.91%, 90.58%, 97.24%, 90.64%, 96.37%, 88.07%, 94.99%, 94.81%, and 98.24%, respectively. The sediment concentration in the upper reaches of the Yellow River showed a decreasing trend but different sections of the river exhibited differences in this regard. The sections above Tangnaihai and from Lanzhou to Toudaoguai showed an increasing trend while the section from Tangnaihai to Lanzhou showed a decreasing trend. The decrease in the sediment concentration in the middle reaches of the Yellow River (Toudaoguai-Tongguan section) was the largest and that in its lower reaches was the smallest. The reduction in soil and water loss in the middle reaches of the Yellow River was the most prominent, whereas it was not significant in the lower reaches.
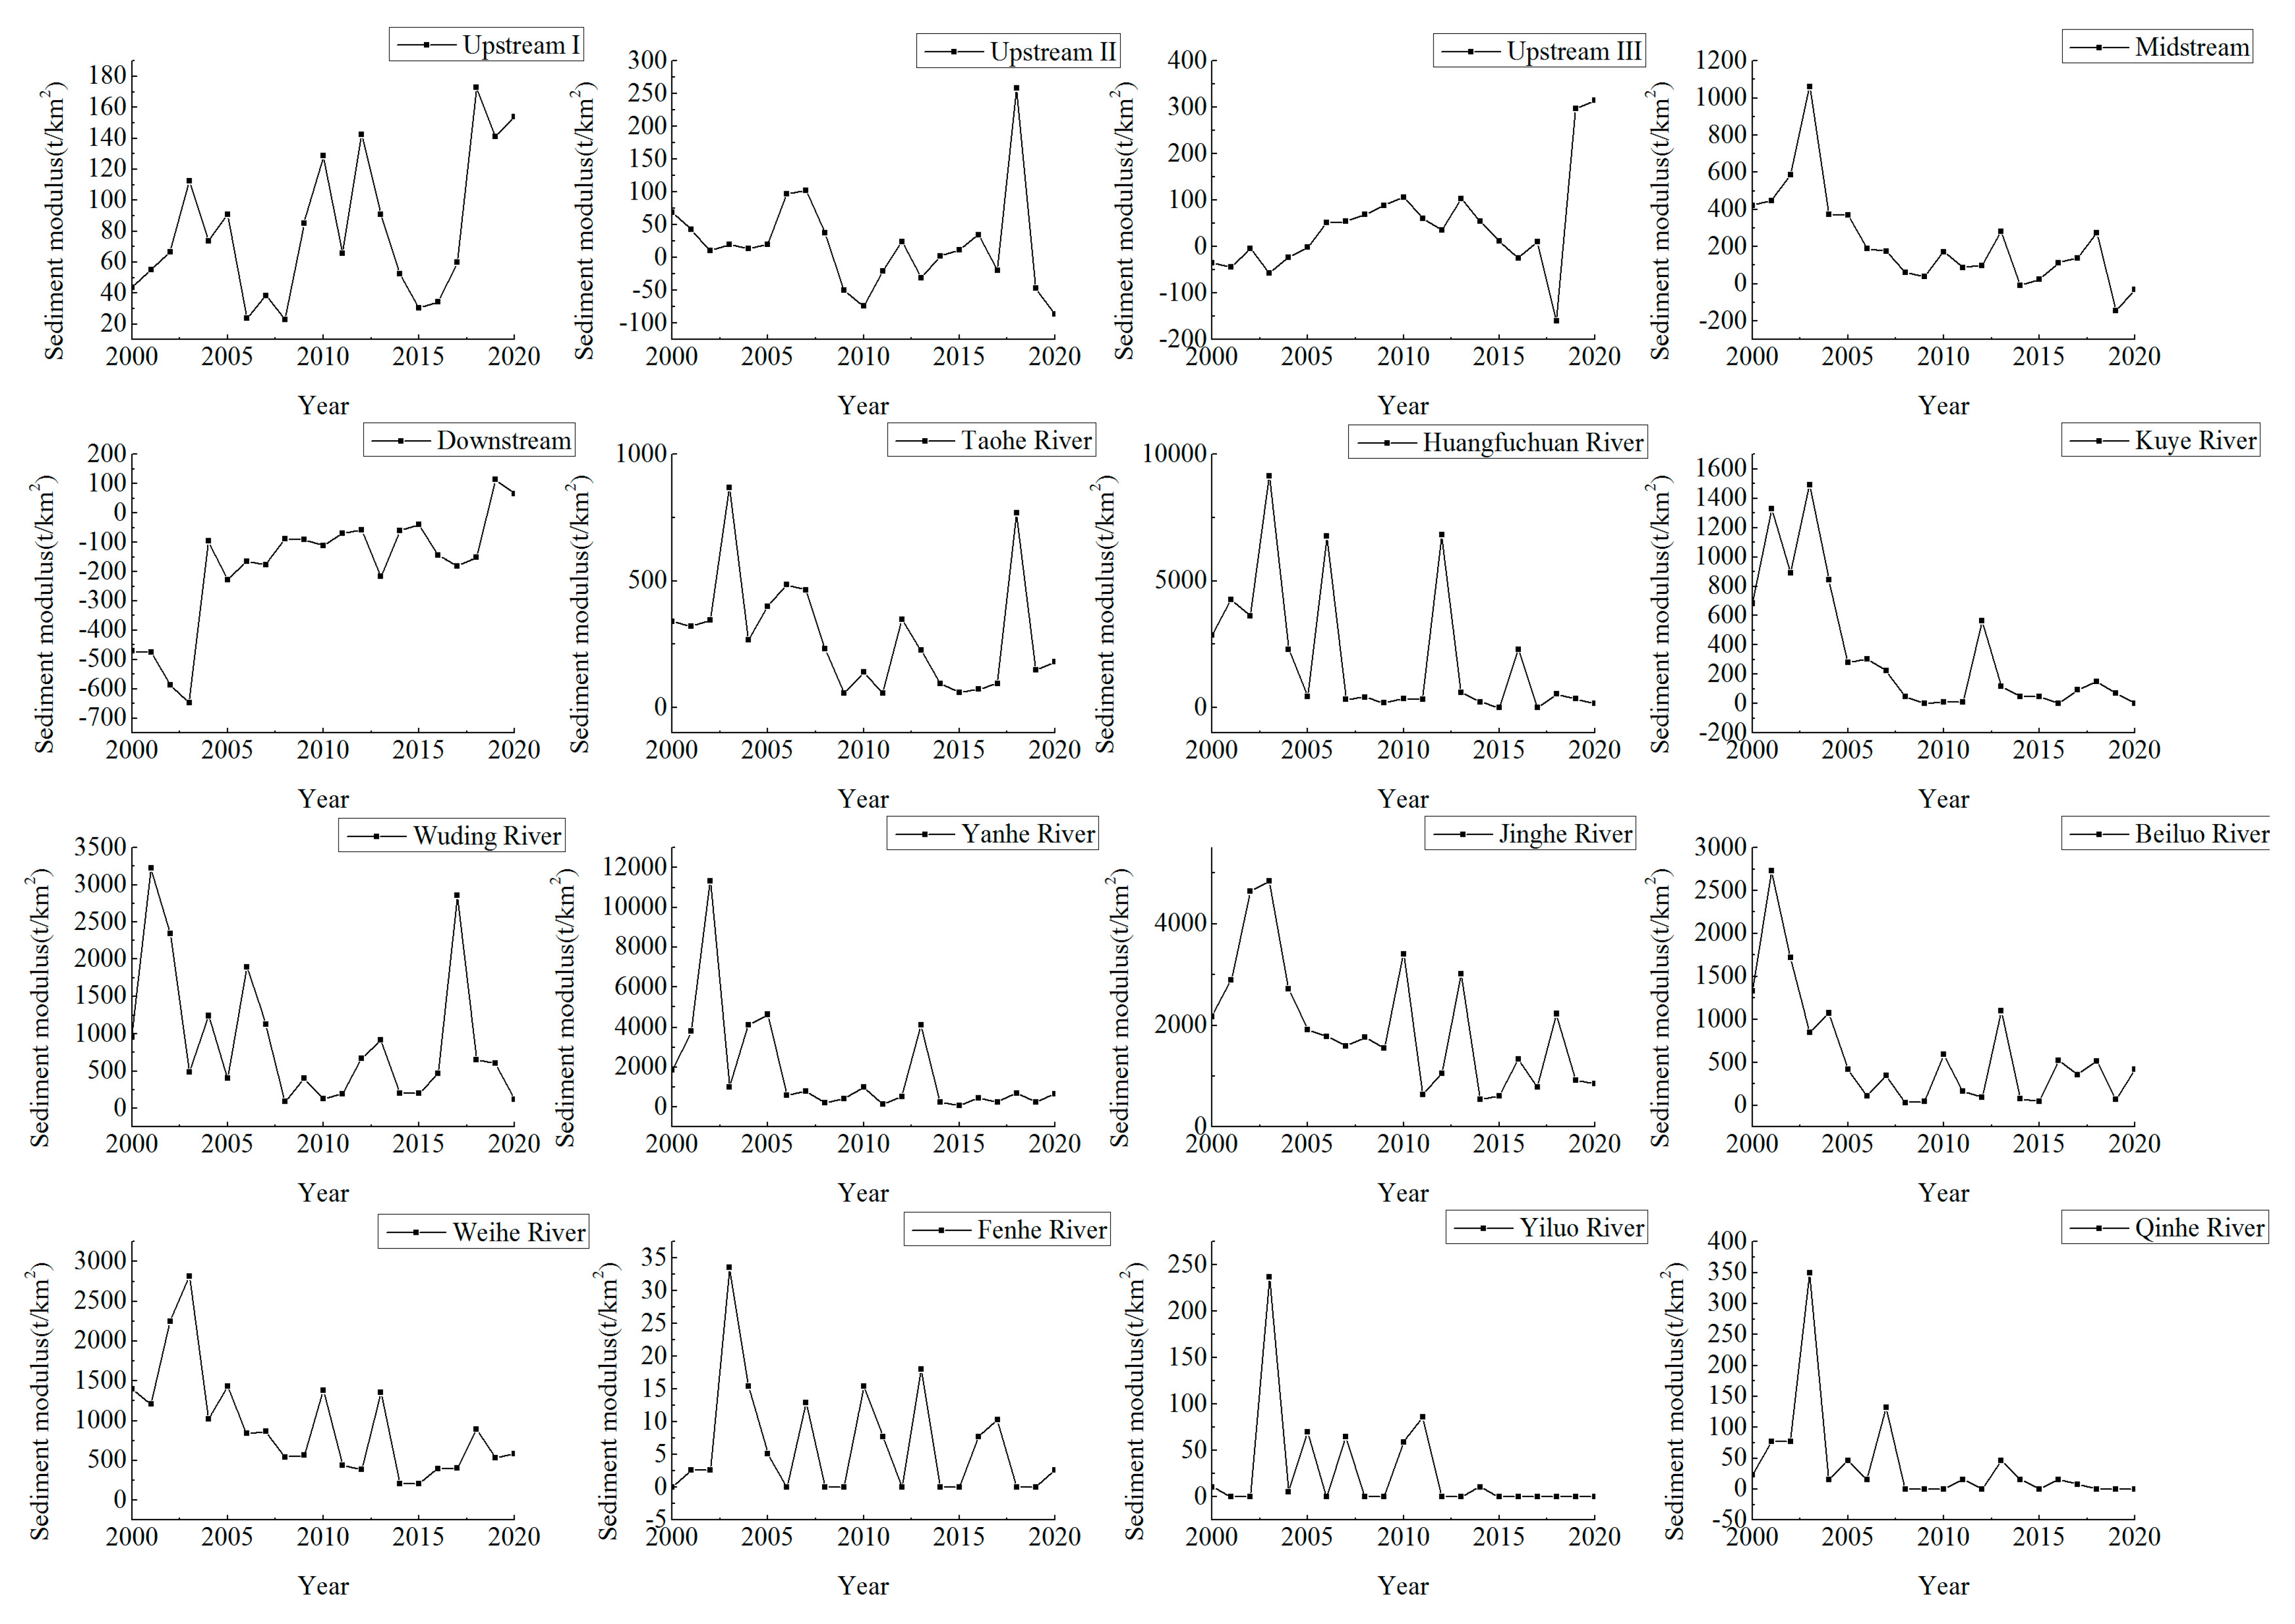
3.3.3. Variations in the Sediment Modulus
The sediment modulus is used to express the intensity of erosion and the sediment yield. A high sediment modulus indicates that the intensity of soil erosion is high. Of the five hydrological stations in the main stream of the Yellow River Basin, the sediment moduli of Tangnaihai-Lanzhou and Toudaoguai-Tongguan decreased (49.86% and 34.75%, respectively) and those above Tangnaihai, Lanzhou-Toudaoguai, and Tongguan-Lijin increased (254.72%, 12.12%, and 67.73%, respectively). The sediment moduli of the 11 tributary hydrological stations (Taohe River, Huangfuchuan River, Kuye River, Wuding River, Yanhe River, Jinghe River, Beiluo River, Weihe River, Fenhe River, Yiluo River, and Qinhe River) decreased by 56.47%, 87.91%, 89.66%, 36.84%, 86.24%, 57.98%, 94.41%, 61.68%, 69.23%, 90.00%, and 90.00%, respectively (Figure 9). The water and soil loss of the Tangnaihai-Lanzhou and Toudaoguai-Tongguan reaches significantly decreased, but the improvement in soil conservation in the sections above Tangnaihai, Lanzhou-Toudaoguai, and Tongguan-Lijin was not prominent.
3.4. Relationship between Vegetation and Changes in Runoff–Sediment Relationship
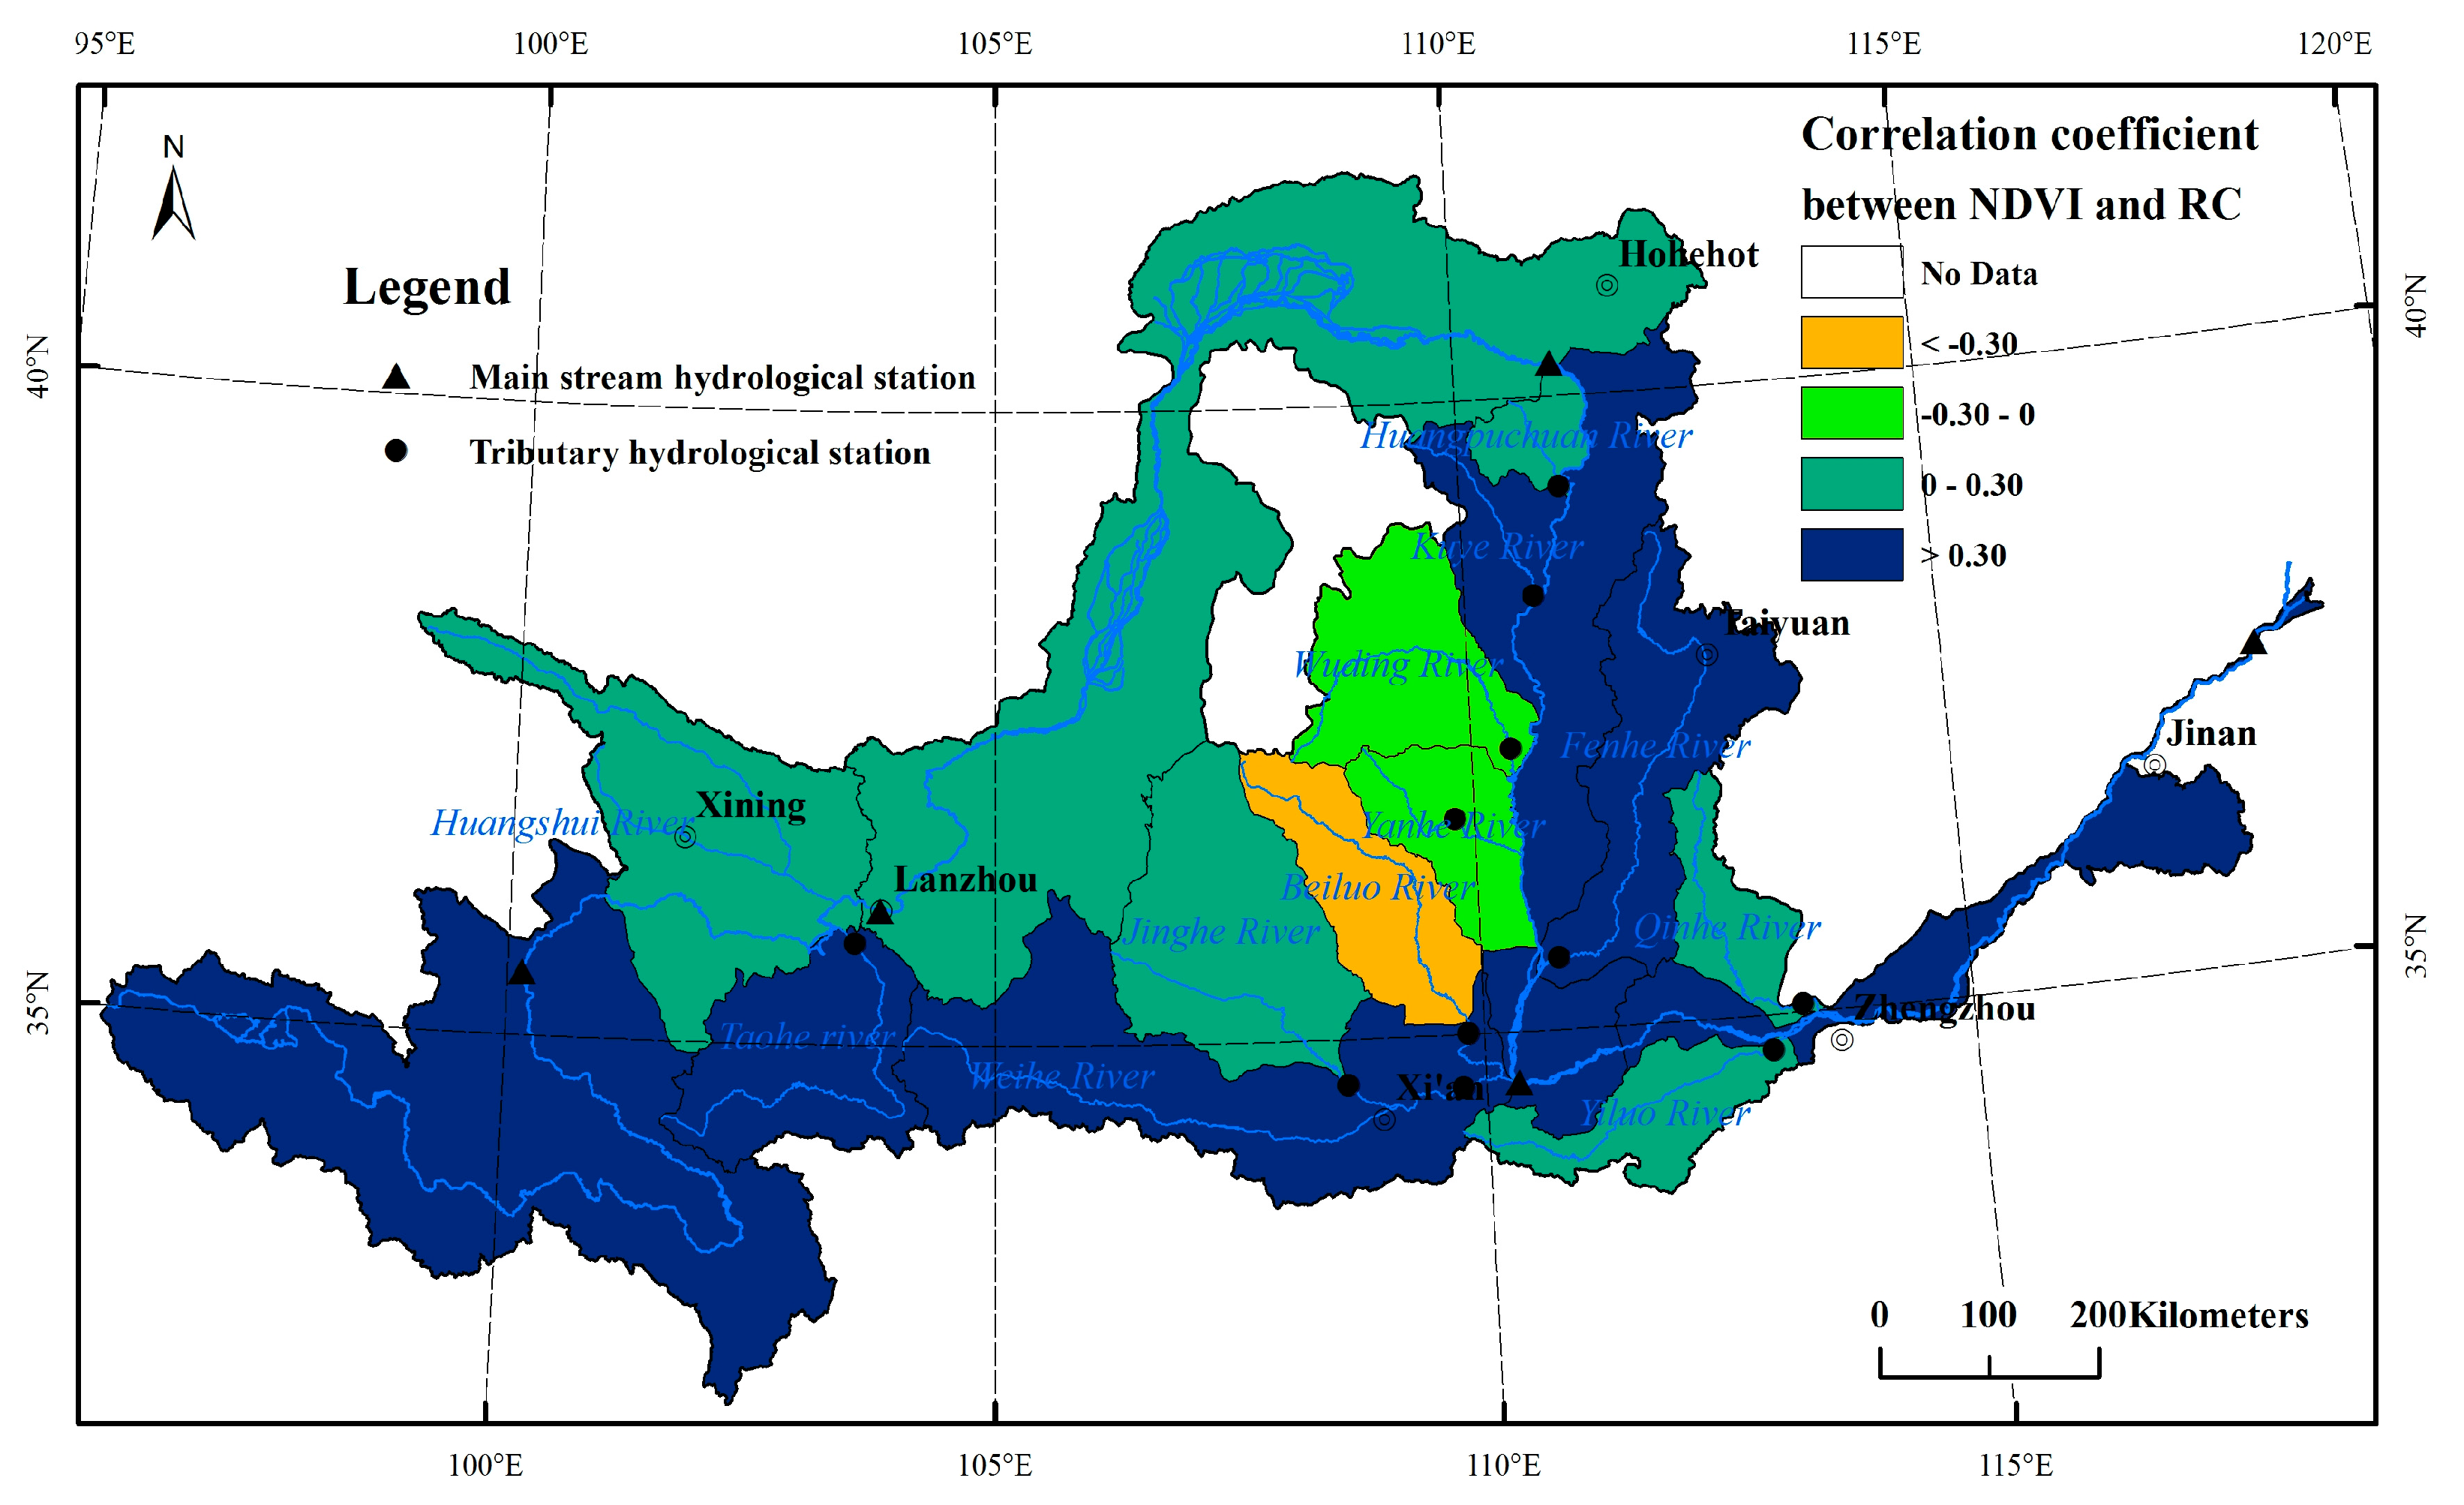
Among the 16 hydrological stations considered in this study, the Pearson correlation coefficient between NDVI and the runoff coefficient for 10 stations were greater than zero and those of the other six were below zero. NDVI was negatively correlated with the runoff coefficient in Huangfuchuan River, Yiluo River, Qinhe River, Beiluo River, Yanhe River, and Wuding River (Figure 10).
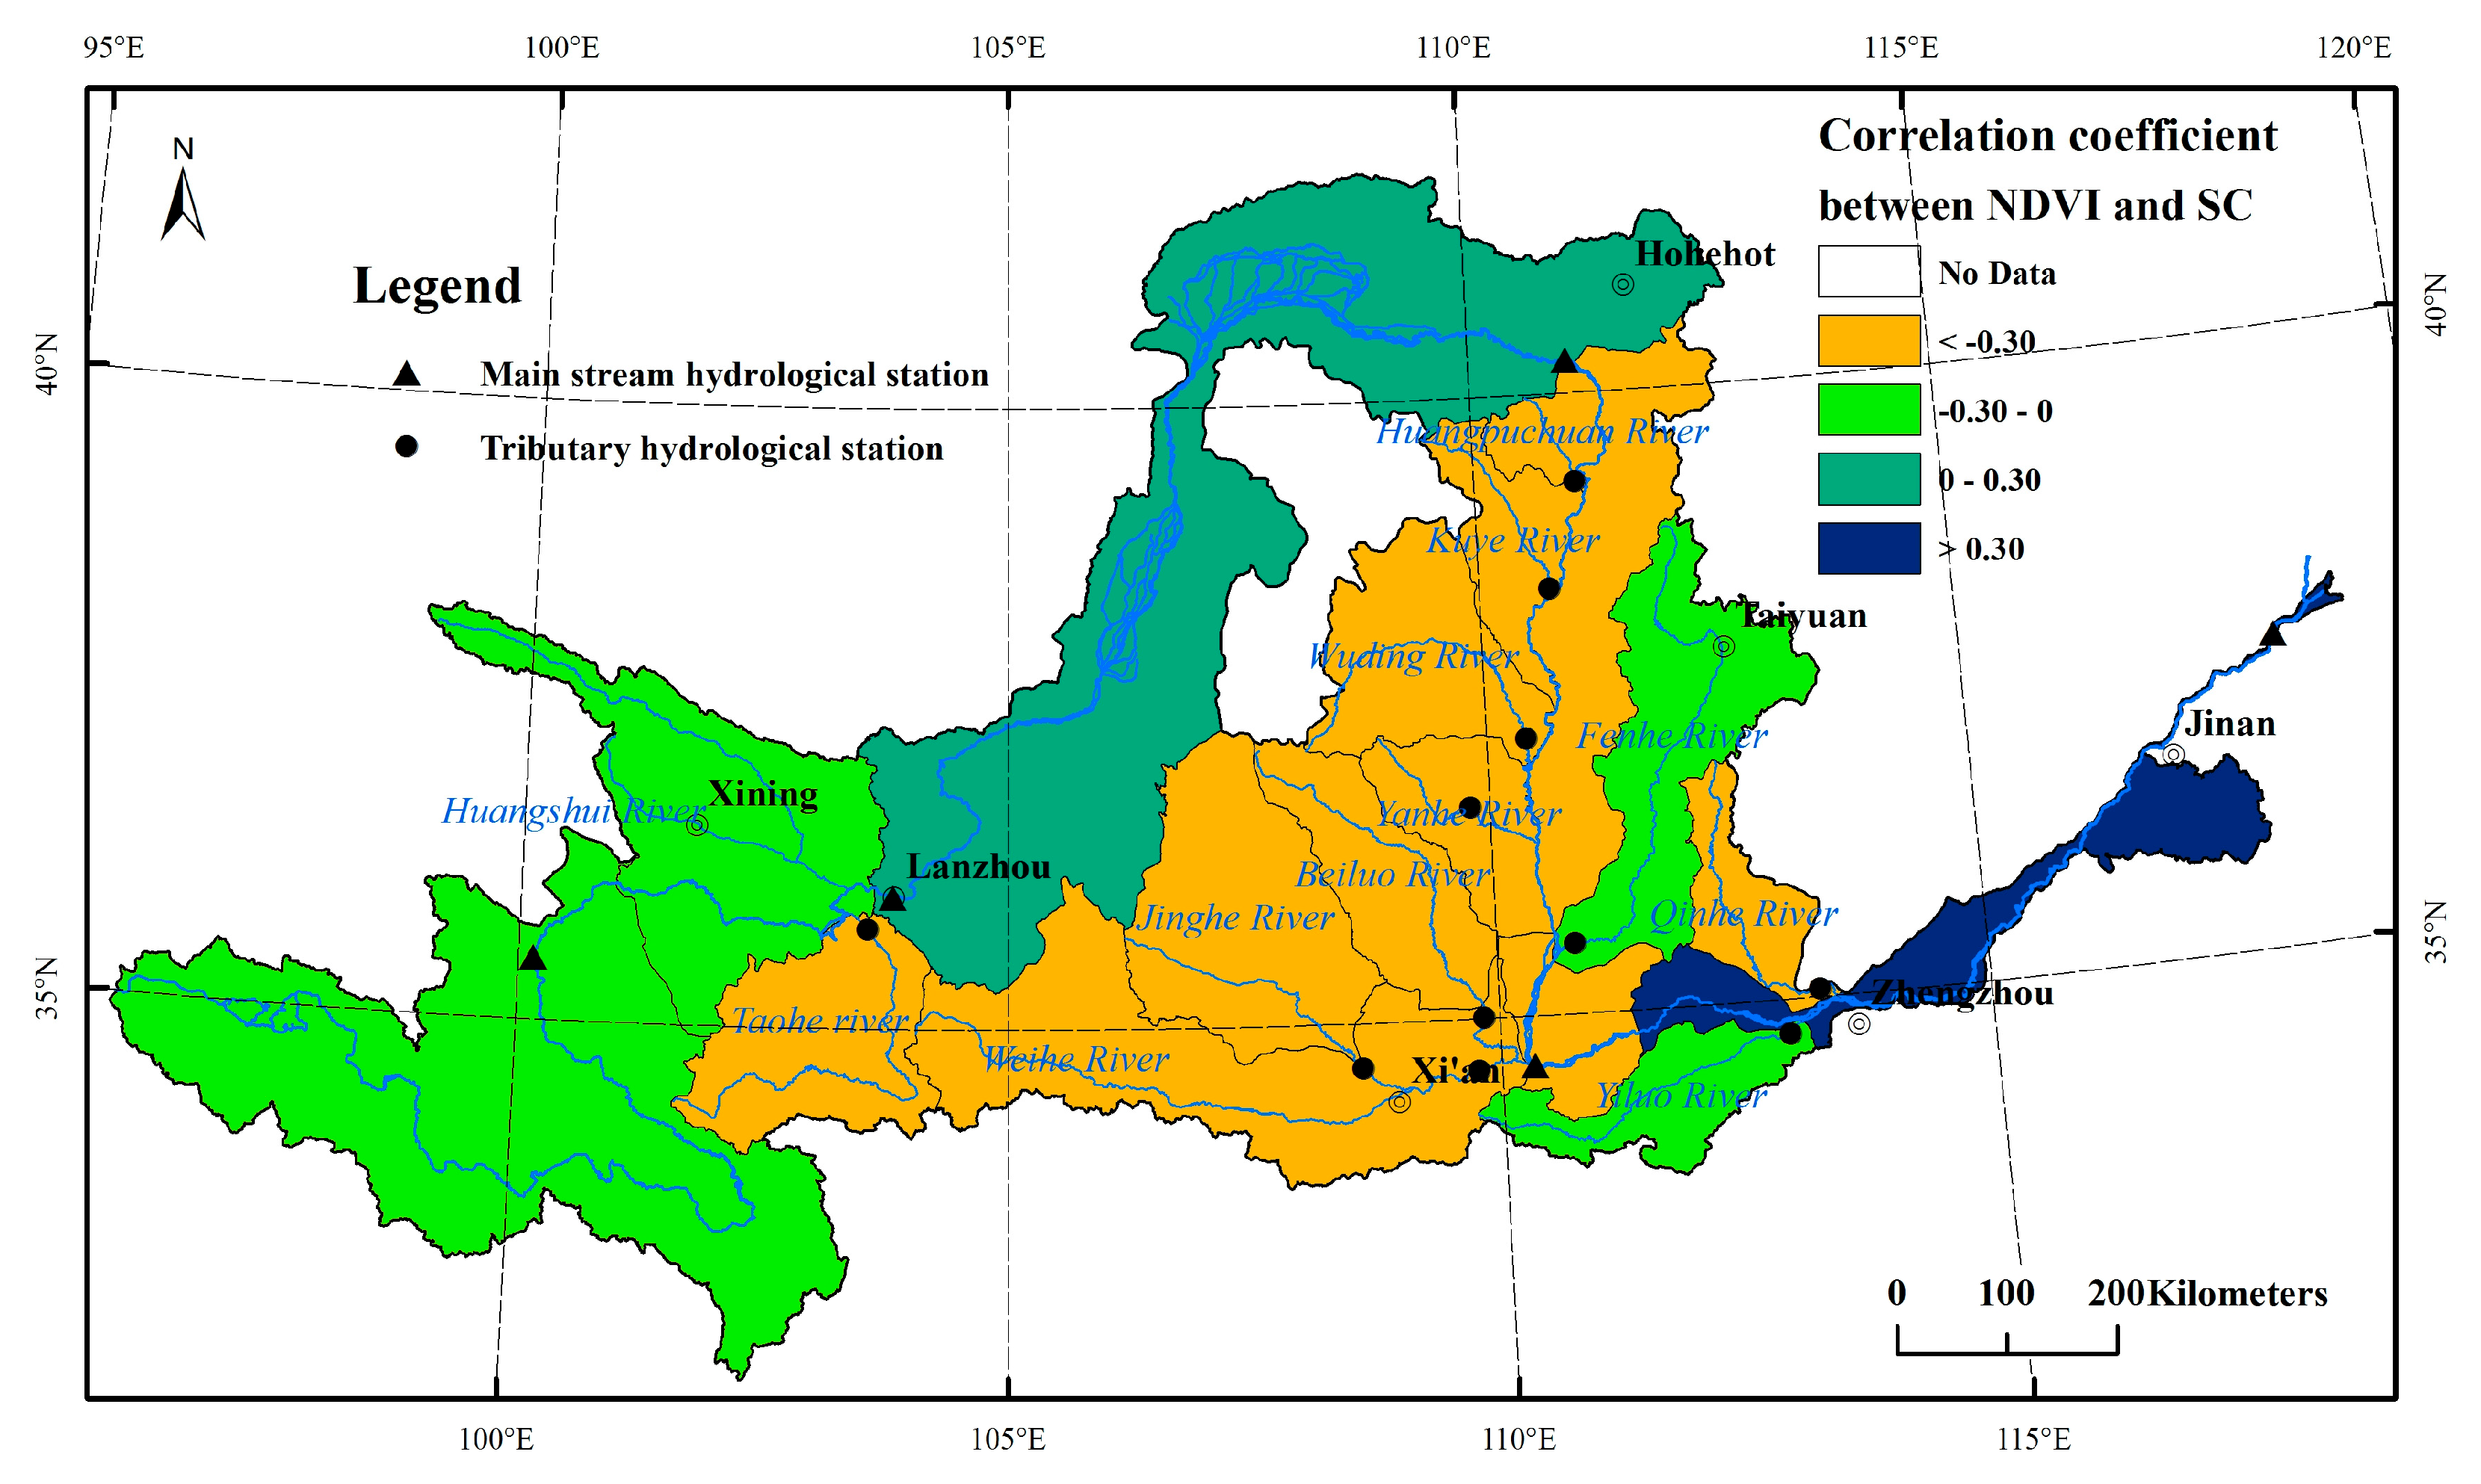
Of the 16 hydrological stations, the correlation coefficient between NDVI and the sediment concentration for 13 hydrological stations was less than zero, that of two hydrological stations was greater than zero, and that of one station was equal to zero (Tangnaihai). There was a positive correlation between NDVI and the sediment concentration in the Tangnaihai-Lanzhou and Toudaoguai-Tongguan reaches and a negative correlation in the other basins (Figure 11).
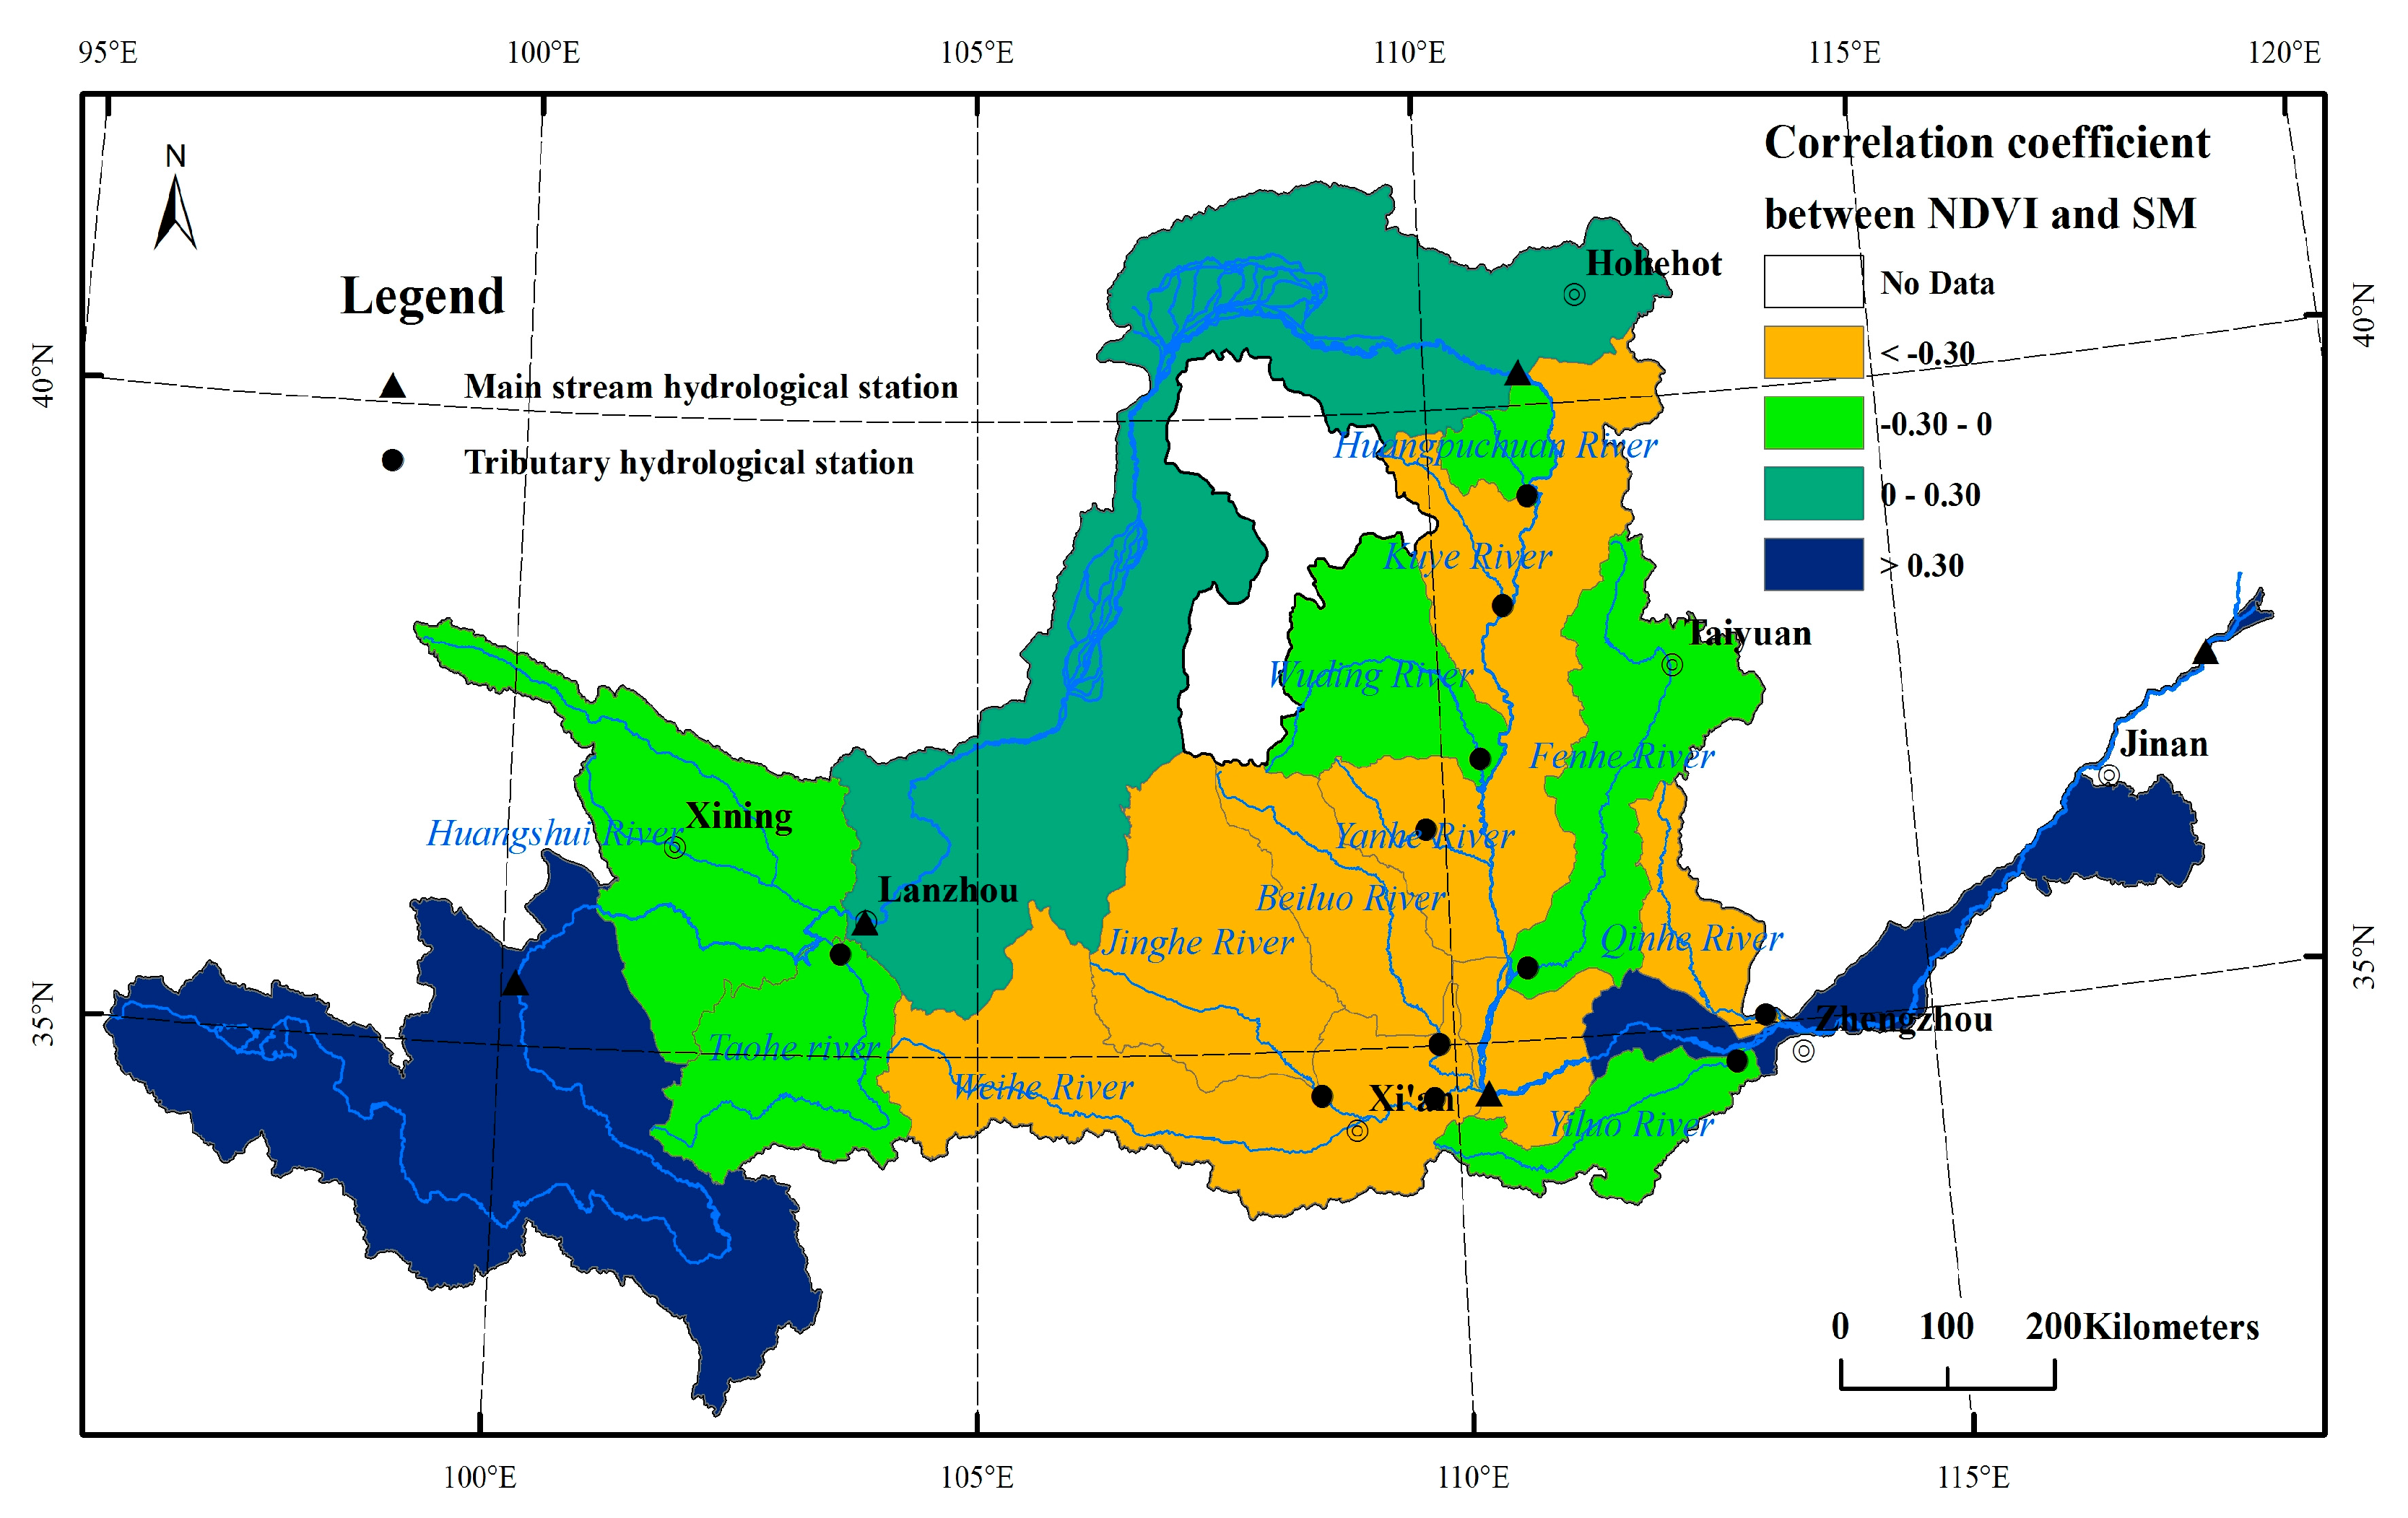
The correlation coefficient between NDVI and the sediment modulus of 13 hydrological stations was less than zero and that of the remainder was greater than zero. NDVI was positively correlated with the sediment modulus for the reaches above Tangnaihai, from Lanzhou to Toudaoguai, and from Tongguan to Lijin, and negatively correlated with the sediment modulus for the other watersheds (Figure 12).
The results showed that with the increase in NDVI in the Yellow River basin, a higher runoff coefficient was associated with a lower sediment concentration and smaller sediment modulus. On the whole, the large-scale ecological protection of the Yellow River basin improved its vegetation coverage, played an important role in controlling runoff and sediment, and improved its water conservation and soil conservation functions.
4. Discussion
The Yellow River basin has the most significant soil erosion in the world. A large amount of sediment is carried into the Yellow River. The restoration of vegetation owing to large-scale ecological protection is the key factor influencing changes in the runoff–sediment relationship in the Yellow River basin. Changes in runoff and sediment are also affected by factors such as social and economic development and water use.
For the upper reaches of the Yellow River, vegetation coverage is increasing overall and the water conservation function has been improved [32]. However, the soil conservation function from Tangnaihai-Lanzhou to Toudaogui still needs to be strengthened [33]. For the middle reaches of the Yellow River, ecological construction has significantly improved the vegetation coverage since 2000 and has played a beneficial role in the control of water and sediment [5,10,34,35,36]. Although the natural runoff in the middle reaches of the Yellow River has increased significantly, the growth in the measured runoff in the river has been significantly weakened by the large increase in economic water consumption [37,38]. The ecological protection of the Yellow River basin needs to strengthen the overall management of water resources and control the economic water consumption [39,40]. For the lower reaches of the Yellow River, vegetation coverage in some areas has decreased due to large-scale urbanization expansion. In this area, water production is small but water consumption is huge, such that water production in the middle and upper reaches is consumed [41,42]. The water conservation function of the lower reaches of the Yellow River has been improved, but the soil conservation function still needs to be strengthened.
The change in the runoff-sediment system in the Yellow River basin is a problem that has attracted the interest of scholars. Our research involved investigating the relationship between NDVI and the runoff-sediment system by carrying out a statistical analysis. The spatial heterogeneity of the relationship between vegetation change and runoff-sediment system change in the Yellow River basin reflects the complexity of the driving mechanism of runoff-sediment change. Our research results will provide a basis for water resource management and ecological construction in the Yellow River basin.
5. Conclusions
This study used data on the Normalized Difference Vegetation Index (NDVI), precipitation, runoff, and sediment load to identify changes and spatio-temporal differences in the relationship between NDVI, runoff, and sediment in the Yellow River basin in the last 20 years. The results showed that vegetation coverage in the basin has increased as a whole (the average NDVI value has increased by more than 25%) and its effect in terms of ecological protection is clear. The improvement in vegetation coverage was most prominent in the middle reaches of the Yellow River (the average NDVI value increased by 47%), but urban expansion in the lower reaches had decreased vegetation coverage. Over the past 20 years, the water conservation function of the Yellow River basin has improved significantly and natural runoff has increased (the natural runoff of the Yellow River Basin has more than doubled and the runoff coefficient has increased by more than 30%). However, owing to continually high water consumption in the middle and lower reaches of the Yellow River, growth in the measured runoff has significantly weakened (the maximum reduced runoff of the Yellow River basin was more than 3.5 × 10¹⁰ m3, accounting for approximately half of the natural runoff and equivalent to the measured runoff). The overall soil conservation function of the Yellow River basin has improved significantly, but not above Tangnaihai and in the sections from Lanzhou to Toudaoguai (the sediment concentration from Toudaoguai to Tongguan decreased by 74.11% and the sediment modulus decreased by 34.75%). Pearson correlation analysis showed that with the increase in NDVI in the Yellow River basin, a larger runoff coefficient was associated with a lower sediment concentration and smaller sediment modulus. Thus, the increased vegetation coverage has improved the water conservation function and reduced soil erosion in the Yellow River basin.
Author Contributions
Conceptualization, L.J. and Y.L.; methodology, Y.L.; formal analysis, L.J.; resources, L.J. and Y.L.; data curation, L.J. and Y.L.; writing of original draft, L.J. and Y.L.; writing, review, and editing, L.J. and Y.L.; supervision, L.J. and Y.L.; project administration, L.J.; funding acquisition, L.J. All authors have read and agreed to the published version of the manuscript.
Funding
This research was funded by the National Natural Science Foundation of China (grant number 42071253).
Data Availability Statement
This research is based on the annual precipitation, runoff, and sediment load of 16 main hydrological stations and the Normalized Difference Vegetation Index (NDVI) in the Yellow River basin. The data on the annual runoff and sediment load were taken from the Yellow River Sediment Bulletin issued by the Yellow River Water Resources Commission of the Ministry of Water Resources (http://www.yrcc.gov.cn/ (accessed on 1 May 2021)). The annual precipitation and NDVI data were taken from the Resource and Environment Science and Data Center of the Chinese Academy of Sciences (http://www.resdc.cn/ (accessed on 1 May 2021)). The time series of the data was 2000–2020.
Acknowledgments
The authors thank the editors and anonymous referees for their valuable comments on an earlier version of this manuscript.
Conflicts of Interest
The authors declare no conflict of interest.
References
- Milly, P.; Dunne, K.; Vecchia, A. Global pattern of trends in streamflow and water availability in a changing climate. Nature 2005, 438, 347–350. [Google Scholar] [CrossRef] [PubMed]
- Ning, Z.; Gao, G.Y.; Fu, B.J. Changes in streamflow and sediment load in the catchments of the Loess Plateau, China: A review. Acta Ecol. Sin. 2020, 40, 2–9. [Google Scholar] [CrossRef]
- Wang, H.; Yang, Z.; Yoshiki, S.; Liu, P.; Sun, X.; Wang, Y. Stepwise decreases of the Huanghe (Yellow River) sediment load (1950–2005): Impacts of climate change and human activities. Glob. Planet. Change 2007, 57, 331–354. [Google Scholar] [CrossRef]
- Jixia, H.; Qibin, Z.; Jing, T.; Depeng, Y.; Quansheng, G. Association between forestry ecological engineering and dust weather in Inner Mongolia: A panel study. Phys. Chem. Earth A/B/C 2018, 104, 76–83. [Google Scholar] [CrossRef]
- Qiu, M.; Yang, Z.; Zuo, Q.; Wu, Q.; Jiang, L.; Zhang, Z.; Zhang, J. Evaluation on the relevance of regional urbanization and ecological security in the nine provinces along the Yellow River, China. Ecol. Indic. 2021, 132, 108346. [Google Scholar] [CrossRef]
- Zhang, Y.; Yuan, J.; You, C.; Cao, R.; Tan, B.; Li, H.; Yang, W. Contributions of national key forestry ecology projects to the forest vegetation carbon storage in China. For. Ecol. Manag. 2020, 462, 117981. [Google Scholar] [CrossRef]
- Jiang, W.; Gao, W.; Gao, X.; Ma, M.; Zhou, M.; Du, K.; Ma, X. Spatio-temporal heterogeneity of air pollution and its key influencing factors in the Yellow River Economic Belt of China from 2014 to 2019. J. Environ. Manag. 2021, 296, 113172. [Google Scholar] [CrossRef]
- Zhang, X.; Zhang, L.; Zhao, J.; Rustomji, P.; Hairsine, P. Responses of streamflow to changes in climate and land use/cover in the Loess Plateau, China. Water Resour. Res. 2008, 44, W00A07. [Google Scholar] [CrossRef]
- Chen, J.; Liu, M.; Naishuang, B.; Yang, Y.; Wu, X.; Fan, D.; Wang, H. Variability of heavy metal transport during the water–sediment regulation period of the Yellow River in 2018. Sci. Total Environ. 2021, 798, 149061. [Google Scholar] [CrossRef]
- Wang, H.; Sun, F. Variability of annual sediment load and runoff in the Yellow River for the last 100 years (1919–2018). Sci. Total Environ. 2021, 758, 143715. [Google Scholar] [CrossRef]
- Chen, Y.; Fu, B.; Zhao, Y.; Wang, K.; Zhao, M.M.; Ma, J.F.; Wu, J.H.; Xu, C.; Liu, W.G.; Wang, H. Sustainable development in the Yellow River Basin: Issues and strategies. J. Clean. Prod. 2020, 263, 121223. [Google Scholar] [CrossRef]
- Li, H.; Shi, C.; Sun, P.; Zhang, Y.; Adrian, L.C. Attribution of runoff changes in the main tributaries of the middle Yellow River, China, based on the Budyko model with a time-varying parameter. CATENA 2021, 206, 105557. [Google Scholar] [CrossRef]
- Zhao, Y.; Hu, C.; Zhang, X.; Lv, X.; Yin, X.; Wang, Z. Response of sediment discharge to soil erosion control in the middle reaches of the Yellow River. CATENA 2021, 203, 105330. [Google Scholar] [CrossRef]
- Chen, X.; An, Y.; Zhang, Z.; Hu, C. Equilibrium relations for water and sediment transport in the Yellow River. Int. J. Sediment Res. 2021, 36, 328–334. [Google Scholar] [CrossRef]
- Li, J.; Sun, W.; Li, M.; Meng, L. Coupling coordination degree of production, living and ecological spaces and its influencing factors in the Yellow River Basin. J. Clean. Prod. 2021, 298, 126803. [Google Scholar] [CrossRef]
- Wang, D.L.; Feng, H.M.; Zhang, B.Z.; Wei, Z.; Tian, Y.L. Quantifying the impacts of climate change and vegetation change on decreased runoff in china’s yellow river basin. Ecohydrol. Hydrobiol. 2022, 22, 310–322. [Google Scholar] [CrossRef]
- Singh, D.K.; Xu, M.; Nandita, S.; Lei, F. Perspectives on emerging pressures and their integrated impact on large river systems: An insight from the Yellow River basin. J. Environ. Manag. 2021, 298, 113423. [Google Scholar] [CrossRef]
- Li, H.; Shi, C.; Zhang, Y.; Ning, T.; Sun, P.; Liu, X.; Ma, X.; Liu, W.; Adrian, L.C. Using the Budyko hypothesis for detecting and attributing changes in runoff to climate and vegetation change in the soft sandstone area of the middle Yellow River basin, China. Sci. Total Environ. 2020, 703, 135588. [Google Scholar] [CrossRef]
- Li, J. A simulation approach to optimizing the vegetation covers under the water constraint in the Yellow River Basin. For. Policy Econ. 2021, 123, 102377. [Google Scholar] [CrossRef]
- Shen, J.; Zhang, H.; Zhao, Y.; Song, J. An examination of the mitigation effect of vegetation restoration on regional water poverty: Based on panel data analysis of 9 provinces in the Yellow River basin of China from 1999 to 2019. Ecol. Indic. 2023, 146, 109860. [Google Scholar] [CrossRef]
- Zhang, W.; Wang, L.; Xiang, F.; Qin, W.; Jiang, W. Vegetation dynamics and the relations with climate change at multiple time scales in the Yangtze River and Yellow River Basin, China. Ecol. Indic. 2020, 110, 105892. [Google Scholar] [CrossRef]
- Ren, Z.; Tian, Z.; Wei, H.; Liu, Y.; Yu, Y. Spatiotemporal evolution and driving mechanisms of vegetation in the Yellow River Basin, China during 2000–2020. Ecol. Indic. 2022, 138, 108832. [Google Scholar] [CrossRef]
- Xu, S.; Yu, Z.; Yang, C.; Ji, X.; Zhang, K. Trends in evapotranspiration and their responses to climate change and vegetation greening over the upper reaches of the Yellow River Basin. Agric. For. Meteorol. 2018, 263, 118–129. [Google Scholar] [CrossRef]
- Yuan, M.; Zhao, L.; Lin, A.; Li, Q.; She, D.; Qu, S. How do climatic and non-climatic factors contribute to the dynamics of vegetation autumn phenology in the Yellow River Basin, China? Ecol. Indic. 2020, 112, 106112. [Google Scholar] [CrossRef]
- Zhan, C.; Liang, C.; Zhao, L.; Jiang, S.; Niu, K.; Zhang, Y. Drought-related cumulative and time-lag effects on vegetation dynamics across the Yellow River Basin, China. Ecol. Indic. 2022, 143, 109409. [Google Scholar] [CrossRef]
- Zhao, F.; Ma, S.; Wu, Y.; Qiu, L.; Wang, W.; Lian, Y.; Chen, J.; Sivakumar, B. The role of climate change and vegetation greening on evapotranspiration variation in the Yellow River Basin, China. Agric. For. Meteorol. 2022, 316, 108842. [Google Scholar] [CrossRef]
- Shi, L.; Liu, Q.; Huang, C.; Gao, X.; Li, H.; Liu, G. Mapping quasi-circular vegetation patch dynamics in the Yellow River Delta, China, between 1994 and 2016. Ecol. Indic. 2021, 126, 107656. [Google Scholar] [CrossRef]
- Tian, F.; Liu, L.; Yang, J.; Wu, J. Vegetation greening in more than 94% of the Yellow River Basin (YRB) region in China during the 21st century caused jointly by warming and anthropogenic activities. Ecol. Indic. 2021, 125, 107479. [Google Scholar] [CrossRef]
- Yuan, L.; Gao, Y.; Cheng, F.; Du, J.; Hu, Z.; Yang, X.; Wang, H.; Kong, X.; Fu, Z.; Wang, W.; et al. The influence of oil exploitation on the degradation of vegetation: A case study in the Yellow River Delta Nature Reserve, China. Environ. Technol. Innov. 2022, 28, 102579. [Google Scholar] [CrossRef]
- Jiang, D.; Fu, X.; Shen, Y.; Yu, Q. Vegetation dynamics and their response to freshwater inflow and climate variables in the Yellow River Delta, China. Quat. Int. 2013, 304, 75–84. [Google Scholar] [CrossRef]
- Li, C.; Zhang, Y.; Shen, Y.; Yu, Q. Decadal water storage decrease driven by vegetation changes in the Yellow River Basin. Sci. Bull. 2020, 65, 1859–1861. [Google Scholar] [CrossRef] [PubMed]
- Ji, P.; Yuan, X.; Jiao, Y. Future hydrological drought changes over the upper Yellow River basin: The role of climate change, land cover change and reservoir operation. J. Hydrol. 2023, 617, 129128. [Google Scholar] [CrossRef]
- Ouyang, W.; Hao, F.; Andrew, K.; Skidmore, A.G. Soil erosion and sediment yield and their relationships with vegetation cover in upper stream of the Yellow River. Sci. Total Environ. 2010, 409, 396–403. [Google Scholar] [CrossRef] [PubMed]
- Wu, G.-L.; Liu, Y.; Fang, N.-F.; Deng, L.; Shi, Z.-H. Soil physical properties response to grassland conversion from cropland on the semi-arid area. Ecohydrology 2016, 9, 1471–1479. [Google Scholar] [CrossRef]
- Li, X.; Zhang, X.; Wang, S. Managing conflicts and equitability in hierarchical decision making for water resources planning under fuzzy uncertainty: A case study of Yellow River, China. J. Hydrol. Reg. Stud. 2021, 38, 100963. [Google Scholar] [CrossRef]
- Zhang, X.; Jin, X. Vegetation dynamics and responses to climate change and anthropogenic activities in the Three-River Headwaters Region, China. Ecol. Indic. 2021, 131, 108223. [Google Scholar] [CrossRef]
- Wang, P.; Xu, M. Evaluating the inter-annual surplus/deficit dynamic of water retention service in the Yellow River Basin, China. Ecol. Indic. 2022, 145, 109695. [Google Scholar] [CrossRef]
- Ren, L.; Yuan, S.; Yang, X.; Jiang, S.; Li, G.; Zhu, Q.; Fang, X.; Liu, Y.; Yan, Y. Initiatives to clarify mechanisms of hydrological evolution in human-influenced Yellow River Basin. Water Sci. Eng. 2023. [Google Scholar] [CrossRef]
- Liu, W.; Shi, C.; Zhou, Y. Trends and attribution of runoff changes in the upper and middle reaches of the Yellow River in China. J. Hydro-Env. Res. 2021, 37, 57–66. [Google Scholar] [CrossRef]
- Yang, R.; Chen, H.; Chen, S.; Ye, Y. Spatiotemporal evolution and prediction of land use/land cover changes and ecosystem service variation in the Yellow River Basin, China. Ecol. Indic. 2022, 145, 109579. [Google Scholar] [CrossRef]
- Fan, X.; Wang, L.; Li, X.; Zhou, J.; Chen, D.; Yang, H. Increased discharge across the Yellow River Basin in the 21st century was dominated by precipitation in the headwater region. J. Hydrol. Reg. Stud. 2022, 44, 101230. [Google Scholar] [CrossRef]
- Wang, Y.; Wang, H.; Liu, G.; Zhang, J.; Fang, Z. Factors driving water yield ecosystem services in the Yellow River Economic Belt, China: Spatial heterogeneity and spatial spillover perspectives. J. Environ. Manag. 2022, 317, 115477. [Google Scholar] [CrossRef] [PubMed]
Figure 1.
Annual precipitation and locations of hydrological and meteorological stations in the Yellow River basin.
Figure 1.
Annual precipitation and locations of hydrological and meteorological stations in the Yellow River basin.

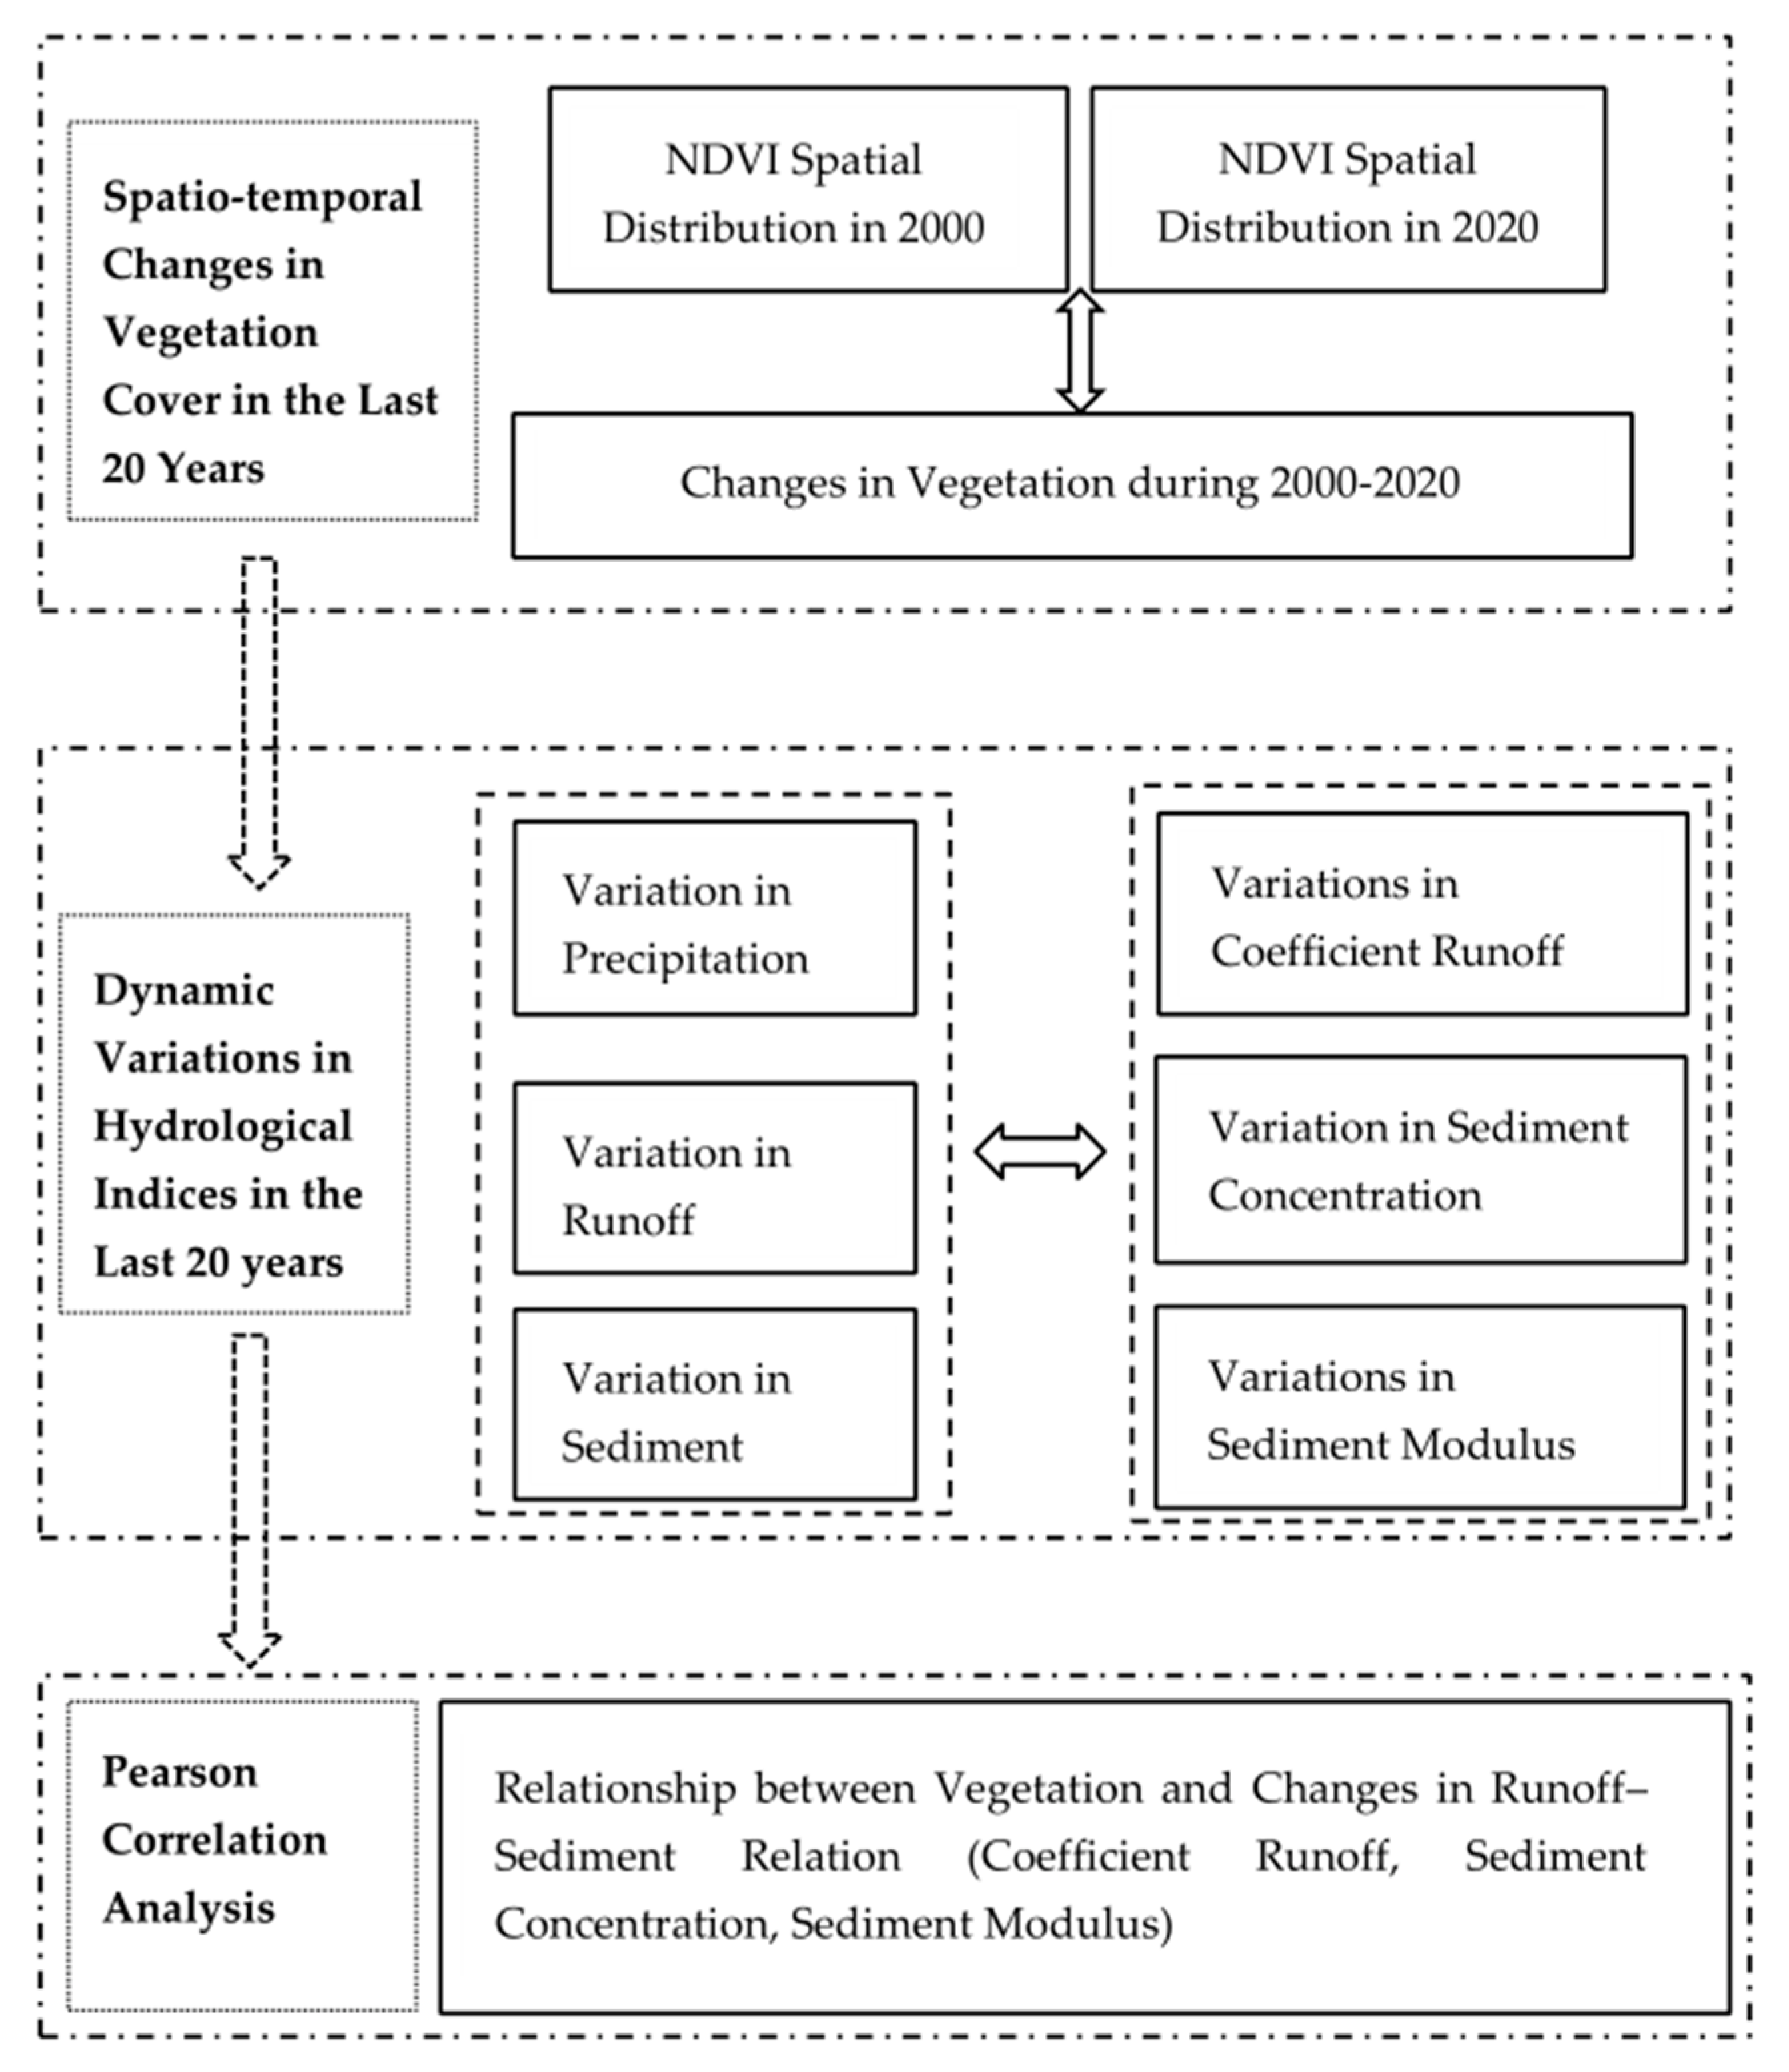
Figure 2.
The overall workflow of this study.

Figure 3.
Spatio-temporal changes in the Yellow River basin from 2000 to 2020; (a–c) spatial distribution of NDVI values in the Yellow River basin in 2000, 2010, and 2020; (d) spatio-temporal variations of NDVI values in the Yellow River basin from 2000 to 2020; (e) NDVI variations of each division in the Yellow River basin from 2000 to 2020.

Figure 4.
Dynamic changes in precipitation in the Yellow River basin; this figure includes the change of runoff in each division of the main stream and main tributaries.
Figure 4.
Dynamic changes in precipitation in the Yellow River basin; this figure includes the change of runoff in each division of the main stream and main tributaries.

Figure 5.
Dynamic changes in the runoff, reductive runoff, and natural runoff in the Yellow River basin; this figure includes the change in runoff in each division of the main stream and tributaries.
Figure 5.
Dynamic changes in the runoff, reductive runoff, and natural runoff in the Yellow River basin; this figure includes the change in runoff in each division of the main stream and tributaries.

Figure 6.
Dynamic changes in the sediment load in the Yellow River basin; this figure includes the change in sediment load in each division of the main stream and tributaries.
Figure 6.
Dynamic changes in the sediment load in the Yellow River basin; this figure includes the change in sediment load in each division of the main stream and tributaries.

Figure 7.
Changes in the runoff coefficients of the main stream and tributaries of the Yellow River basin; this figure includes the change in runoff coefficients in each division of the main and main tributaries.
Figure 7.
Changes in the runoff coefficients of the main stream and tributaries of the Yellow River basin; this figure includes the change in runoff coefficients in each division of the main and main tributaries.

Figure 8.
Changes in sediment concentration in the main stream and tributaries of the Yellow River basin; this figure includes the change in sediment concentration in each division of the main stream and tributaries.
Figure 8.
Changes in sediment concentration in the main stream and tributaries of the Yellow River basin; this figure includes the change in sediment concentration in each division of the main stream and tributaries.

Figure 9.
Changes in the sediment modulus in the main stream and tributaries of the Yellow River basin; this figure includes the change in sediment modulus in each division of the main stream and tributaries.
Figure 9.
Changes in the sediment modulus in the main stream and tributaries of the Yellow River basin; this figure includes the change in sediment modulus in each division of the main stream and tributaries.

Figure 10.
Correlation coefficients between NDVI and the runoff coefficient in the Yellow River basin.
Figure 10.
Correlation coefficients between NDVI and the runoff coefficient in the Yellow River basin.

Figure 11.
Correlation coefficients between NDVI and the sediment concentration in the Yellow River basin.
Figure 11.
Correlation coefficients between NDVI and the sediment concentration in the Yellow River basin.

Figure 12.
Correlation coefficients between NDVI and the sediment concentration in the Yellow River basin.
Figure 12.
Correlation coefficients between NDVI and the sediment concentration in the Yellow River basin.


Table 1.
Correspondence between hydrological stations and rivers considered in this study.
| Hydrological Station | Representative River | Hydrological Station | Representative River |
|---|---|---|---|
| Tangnaihai | Upstream I | Baijiachuan | Wuding |
| Lanzhou | Upstream II | Ganguyi | Yanhe |
| Toudaoguai | Upstream III | Zhangjiashan | Jinghe |
| Tongguan | Midstream IV | Zhuangtou | Beiluo |
| Lijin | Downstream V | Huaxian | Weihe |
| Hongqi | Taohe | Hejin | Fenhe |
| Huangpu | Huangfuchuan | Heishiguan | Yiluo |
| Wenjiachuan | Kuye | Wushe | Qinhe |
Disclaimer/Publisher’s Note: The statements, opinions and data contained in all publications are solely those of the individual author(s) and contributor(s) and not of MDPI and/or the editor(s). MDPI and/or the editor(s) disclaim responsibility for any injury to people or property resulting from any ideas, methods, instructions or products referred to in the content. |
© 2023 by the authors. Licensee MDPI, Basel, Switzerland. This article is an open access article distributed under the terms and conditions of the Creative Commons Attribution (CC BY) license (https://creativecommons.org/licenses/by/4.0/).
Share and Cite
MDPI and ACS Style
Jiang, L.; Liu, Y. Response of Runoff-Sediment System to Vegetation Variation in the Yellow River Basin in the Last 20 Years. Land 2023, 12, 428. https://doi.org/10.3390/land12020428
AMA Style
Jiang L, Liu Y. Response of Runoff-Sediment System to Vegetation Variation in the Yellow River Basin in the Last 20 Years. Land. 2023; 12(2):428. https://doi.org/10.3390/land12020428
Chicago/Turabian StyleJiang, Luguang, and Ye Liu. 2023. "Response of Runoff-Sediment System to Vegetation Variation in the Yellow River Basin in the Last 20 Years" Land 12, no. 2: 428. https://doi.org/10.3390/land12020428
Note that from the first issue of 2016, this journal uses article numbers instead of page numbers. See further details here.