Article

Spatial Patterns Exploration and Impacts Modelling of Carbon Emissions: Evidence from Three Stages of Metropolitan Areas in the YREB, China

1
School of Architecture and Urban Planning, Huazhong University of Science and Technology, Wuhan 430074, China
2
Hubei Engineering and Technology Research Center of Urbanization, Wuhan 430074, China
3
The Key Laboratory of Urban Simulation for Ministry of Natural Resources, Wuhan 430074, China
4
Wuhan Huazhong University of Science and Technology Architectural Planning and Design Institute Co., Ltd., Wuhan 430074, China
5
Key Laboratory of Urban Land Resources Monitoring and Simulation, Ministry of Natural Resources, Shenzhen 518034, China
*
Author to whom correspondence should be addressed.
These authors contributed equally to this work.
Land 2022, 11(10), 1835; https://doi.org/10.3390/land11101835
Submission received: 23 September 2022 / Revised: 13 October 2022 / Accepted: 16 October 2022 / Published: 18 October 2022
(This article belongs to the Special Issue Impacts of Land Use Pattern in Metropolitan Area)

Abstract

:
Metropolitan areas in China are not only the core spatial carriers of urbanization development but also the main generators of land use carbon emission (LUCE). However, existing research lacks comparative studies on the differential patterns and impact factors of LUCE in different stages of metropolitan areas. Therefore, this paper deeply analyzes the spatial characteristics of LUCE and the coupling coordination degree (CCD) of the economy contributive coefficient (ECC) and ecological support coefficient (ESC) in three different stages of metropolitan areas in the Yangtze River Economic Belt (YREB), China. Moreover, quantitative modelling of the impact factors of LUCE in these different stages of metropolitan areas is furtherly revealed. Results show that: (1) The more mature stage of the metropolitan area, the higher the amount of LUCE, and the more districts or counties with high carbon emissions levels are clustered. (2) At the metropolitan area scale, the more mature the metropolitan area is and the lower the CCD between ECC and ESC is, while at the finer scale, more developed counties have lower CCD. (3) Resident population, per capita GDP, and urbanization rate have good explanatory effects on carbon emissions in these three metropolitan areas; however, except for the urbanization rate, which has a negative effect on LUCE in Nanchang metropolitan area (NMA), the other two factors have positive effects on LUCE in these three metropolitan areas. This study has important implications for different stages of metropolitan areas to formulate targeted LUCE reduction policies.

1. Introduction

Climate change brings enormous challenges to the natural environment and human society. Studies have reported that carbon dioxide is one of the dominant contributors to climate change [1], which has become the main area of concern at home and overseas. Since the industrial revolution, land use carbon emissions (LUCE) have contributed around 30% of human carbon emissions (CE) [2,3]. At present, research on LUCE is relatively rich in mainly two parts. Firstly, in terms of research content, the spatio-temporal characteristics of LUCE and the influencing factors [4,5], the relationships of LUCE [6], the network relationship and spillover effects [7], the efficiency [8], the economy contributive coefficient (ECC) and ecological support coefficient (ESC) of LUCE [9,10] are the research concerns of most studies. However, these studies do not focus as much on the CCD (coupling coordination degree) between ECC and ESC of LUCE and are unable to offer specific improvements to this relationship. Secondly, in terms of spatial scales, studies have been carried out on the urban agglomeration [11], provincial or state [12], municipal [13], and watershed scales [14], while few studies have been conducted in metropolitan area scale. However, as the main form of urbanization [15], the land use of metropolitan areas is not only the spatial projection of the main economic activities of human society but also the main generator of carbon emissions [16,17]. Therefore, it is of great urgency to scientifically identify the CCD between ECC and ESC and the impact factors of carbon emissions in metropolitan areas, which is helpful for formulating targeted low-carbon development measures in this kind of important area.
Studies have reported that different regions and areas had different network synergistic capabilities and driving power [18]. Similarly, the LUCE characteristics of metropolitan areas at different development stages may also differ significantly. When Fujii et al. studied the relationship between economic development and CO2 emissions in 276 global metropolitan areas, they assumed that the urban CO2 emissions per capita in the same sector would show differences in different urban economic development stages [19]. However, verifications of the above assumptions have not been conducted. In addition, the current studies on CO2 emissions in urban areas of China are usually focused on a single evolution type of study area [20,21]. The same problem also exists for the Yangtze River Economic Belt (YREB), which is leading China’s high-quality economic development. For instance, much attention has been paid to the environmental and economic development of the YREB, which is crucial to both regional ecological security and sustainable development in China [22]. The existing studies mainly concern the patterns [23], the influencing factors [24,25], and the efficiency of LUCE [26] in the YREB. For example, spatial autocorrelation [27], social network analysis (SNA) [7], and information entropy model [28] are often introduced to analyze the spatio-temporal patterns of LUCE in the YREB. The grey relational analysis model [29], regression models regarding spatial lag model, spatial error model [30], or LMDI [31] are used to model the impact factors; DEA, SBM-DEA [32], and SBM-UN model [33] are often used to measure efficiency under the constraint of LUCE. In addition, over 95% population lives in the 34 metropolitan areas in China, but few studies have compared the LUCE characteristics of metropolitan areas in different development stages. Therefore, a systematic study on the spatial differentiation of LUCE in metropolitan areas at different development stages is needed.
In summary, existing studies have made some achievements in regional LUCE in the YREB. However, there is still a lack of comparative investigations in metropolitan areas with different development stages. Simultaneously, the CCD between ECC and ESC of LUCE and impact factors are rarely analyzed. Therefore, the purpose of this study is to conduct a comparative study on the spatial patterns of LUCE in metropolitan areas at various development stages in the YREB and to explore the CCD between ECC and ESC, and the impact factors of LUCE in each metropolitan area. Contributions of this paper are two-fold: Firstly, the spatial differentiation characteristics and the spatial patterns of LUCE in cultivating, developmental and mature metropolitan areas are identified, which is conducive to the determination of sub-regional and differentiated low-carbon sustainable development goals for each metropolitan area. Secondly, differential analysis of the impact factors of LUCE from metropolitan areas is conducive to the targeted formulation of carbon reduction measures for each metropolitan area. The findings of this study can serve implications for the low-carbon development of metropolitan areas at different development stages.

2. Materials and Methods

2.1. Study Area

The Yangtze River Economic Belt (YREB) is an important strategic area for China’s economic development [34,35]. YREB is divided into three parts (namely, the upper, middle, and lower reaches). Chongqing, Sichuan, Guizhou, and Yunnan provinces are in the upper reach. Hubei, Jiangxi, and Hunan provinces are in the middle of reach. Anhui, Zhejiang, Jiangsu, and Shanghai provinces are in the lower reach. The lower reach is the most developed, which has the famous Yangtze River Delta (YRD), while the economic levels of the other two reaches are relatively low [36]. The Chengdu, Nanchang, and Hangzhou metropolitan areas are located in the upper, middle, and lower reaches of the YREB, respectively. According to the China Metropolitan Area Development Report 2021 [37] announced by the China Institute of New Urbanization of Tsinghua University, the Chengdu, Nanchang, and Hangzhou metropolitan areas belong to the developmental type, cultivating type, and mature type respectively. Thus, these three different stages of metropolitan areas are the study cases of this research (as shown in Figure 1).
Chengdu Metropolitan Area (CMA) is in the upper reach of the YREB and the economic centers of southwestern China. According to the CMA Development Plan, the CMA is centered in Chengdu City and consists of 30 districts or counties with an area of 2.70 × 10⁴ km2; the resident population of the CMA in 2020 is 27.61 million, and the economic output accounts for 2.11% of China’s Gross Domestic Product (GDP).
Nanchang Metropolitan Area (NMA) is in the middle reach of YREB. According to NMA Plan (2015–2030), the NMA consists of 18 districts or counties with a total area of 2.45 × 10⁴ km2; the resident population of NMA reaches 11.58 million in 2020, and its total GDP accounts for 0.71% of China.
Hangzhou Metropolitan Area (HMA) is located downstream of the YREB. According to the HMA Development Plan (2020–2035), the HMA includes 6 cities, including Hangzhou, Jiaxing, Huzhou, Shaoxing, Quzhou, and Huangshan, with a total of 44 districts or counties and a total area of about 5.48 × 10⁴ km2; by 2020, the population of HMA was 27.46 million, and its GDP accounted for 3.11% of the country.

2.2. Data Sources and Pre-Processing

Land use classification results are 30-meter spatial resolution GlobeLand30 images of year 2020 (http://www.globallandcover.com/) (accessed on 10 May 2022), which has become quite popular for many scholars to conduct related research [38,39]. Social and economic data are respectively derived from the 2020 Statistical Yearbooks of each province and China City Statistical Yearbook involved in the study areas. The resident population data are mainly from the 7th National Census bulletin and the statistical yearbooks and bulletins of the corresponding districts or counties. The energy consumption per unit of GDP was calculated from the total energy consumption and total GDP in the statistical yearbooks of each region.

2.3. Methods

In this study, the total LUCE of each metropolitan area is obtained by measuring the number of sources and sinks of LUCE in the three stages of metropolitan areas. The relationship between the ECC and ESC of each district and county in the metropolitan areas is studied by the CCD model, and the STIRPAT model is introduced to investigate the dominant factors affecting LUCE in the three types of metropolitan areas. Figure 2 shows the analysis clue of this study.

2.3.1. Measurement of LUCE

The total amount of LUCE is equal to the sum of carbon sources and sinks [40], as shown in Equation (1):
C E = C O 2   s o u r c e s + C O 2   s i n k s
where C E is the total amount of LUCE; C O 2   s o u r c e s represents the number of carbon sources of LUCE; and C O 2   s i n k s represents the number of carbon sinks of LUCE.
(1)
Calculation of the number of carbon sources
The number of land use carbon sources for each district and county in the metropolitan areas is calculated from the cultivated and construction land. The number of LUCE from cultivated land use is the area of this kind of land use multiplied by its carbon emission factor, which is taken as 0.0422 according to Sun [41] and Zhang [42]. The number of LUCE from construction land use is usually measured indirectly based on the energy consumption of the city (such as coal, oil, natural gas, electricity, etc.). However, energy consumption data for each district and county in the metropolitan areas is difficult to obtain. According to relevant studies [43,44], since the value of secondary and tertiary industries is mainly contributed by construction land, the number of carbon emissions from construction land in each district and county can be approximated from the total GDP of secondary and tertiary industries. The calculation formula of carbon sources amount is as follows:
C O 2   s o u r c e s = A c × δ c + P i × M i × θ i
where C O 2   s o u r c e s is the total land use carbon sources; A c represents the area of cultivated land use; δ c represents the coefficient of cultivated land; P i represents the energy consumption per unit of GDP; M i represents the total GDP of secondary and tertiary industries in each district and county; and θ i is the coefficient of standard coal.
(2)
Calculation of the number of carbon sinks
Land with carbon sink function and its corresponding carbon sink coefficient [45] are involved in calculating the carbon sinks of each district and county in the metropolitan areas. The land with carbon sink function includes green lands (such as grassland, woodland, and shrubland), water (such as wetland, water, and sea), unutilized land, permanent snow and ice, and so on. According to relevant research, woodland and shrubland [42] and water and sea were combined [46]. Referring to existing studies, the corresponding carbon sink coefficients δ i for different land use types are shown in Table 1. Since the percentage of permanent snow and ice in these study areas is only 0.0017%, this study uses the LUCE coefficient of water to replace its coefficient. The carbon sinks are calculated as follows:
C O 2   s i n k s = e i = A i × δ i
where C O 2   s i n k s is the total amount of carbon sink; e i represents the amount of carbon sink generated by land use type i; A i and δ i represent the spatial area; and sink coefficient of land use type, respectively.

2.3.2. Global Moran’s I

Global Moran’s I is used to analyze the overall correlation degree of LUCE spatial distribution of each metropolitan area [49], and the calculation formula is as follows:
Moran s   I = n i = 1 n j = 1 n W i j x i x ¯ x j x ¯ i = 1 n j = 1 n W i j i = 1 n x i x ¯ 2
where n is the number of districts and counties in the metropolitan area; x i and x j are the LUCE of district or county i and j , respectively; W i j is the spatial weight matrix of district or county i and j ; and x ¯ is the average value. The values of Moran’s I range from [−1, 1]; Moran’s I > 0, Moran’s I < 0, and Moran’s I = 0 represent positive correlation, negative correlation, and no spatial correlation, respectively.

2.3.3. Measurement of CCD

The CCD model is introduced to measure the relationship between the ECC and ESC of CE for each district and county in the metropolitan areas. The calculation formula of CCD [50] is as follows:
C = U 1 U 2 U 1 + U 2 2 2 = 2 U 1 U 2 U 1 + U 2
T = a 1 U 1 + a 2 U 2
CCD = C × T
where CCD is between 0 and 1; C and T are the coupling degree and integrated coordination index between ECC and ESC, respectively; U 1 and U 2 are the values of ECC and ESC respectively; a 1 and a 2 are the weights of indicators ECC and ESC, in this study, ECC and ESC are considered equally important, so the weights of both indicators a 1 and a 2 are taken as 0.5, then T = 0.5 U 1 + 0.5 U 2 .
According to the CCD grading method [51,52], the CCD was classified into five classes as shown in Table 2:
(1)
Calculating ECC
ECC is introduced to estimate the equity of economic contribution of CE among districts or counties within a metropolitan area [53] and can reflect the socio-economic benefits that accompany the process of generating carbon emissions. ECC is calculated as:
E C C = G i G / C i C
where G i and G are the GDP of each district and county and the whole metropolitan area, respectively; and C i and C are the carbon emissions of each district and county and the whole metropolitan area, respectively. When the economic contribution of a district or county is greater than its share of carbon emissions (ECC > 1), it indicates that the district or county has a high level of economic efficiency and green development. When ECC is less than 1, the economic contribution of the district is smaller than its carbon emissions contribution, and its economic efficiency of carbon emission is relatively low.
(2)
Calculating ESC
ESC is introduced to estimate the equity of contribution of carbon ecological capacity among districts or counties in the metropolitan area [54], which could reflect the carbon sink capacity of each district and county [55] as a reflection of ecological benefits. ESC is calculated by the ratio of the carbon sink of each city to the carbon sink of all cities, divided by the ratio of carbon emissions of each city to the carbon emissions of all cities. The calculation formula of ESC is:
E S C = C A i C A / C i C
where C A i and C A are the carbon sinks of each district or county and the whole metropolitan area, respectively. Districts with carbon sinks contribution greater than their share of carbon emissions (ESC > 1), indicate positive impacts on the absorption of CE in the whole metropolitan area and generate positive externalities that help other districts or counties, while districts with ESC less than 1 indicate negative externality to other districts or counties.
(3)
Data normalization
Since the distribution range of ECC and ESC values are different, the coupling coordination degree between the two cannot be calculated directly, so they must be normalized. According to existing research [56,57], the formulas of positive and negative standardization are:
Y i = X i min X i max X i min X i
Y i = max X i X i max X i min X i
where Y i represents the standardized value of X i ; X i represents the actual value of indicator i; max X i , min X i are the maximum and minimum values of X i , respectively.

2.3.4. Impact Factor Measurement Model

STIRPAT is a commonly used model to investigate the impact of population, affluence, and technology on the environment in the field of carbon emissions [58], which is expressed as follows:
I = a P b A c T d e
where a is a constant variable; b , c , and d represent the coefficients of population, affluence, and technology, respectively; and e is an error variable.
Equation (11) transforms to Equation (12) by logarithms method:
ln I = a + b ln P + c ln A + d ln T + e
where I is the LUCE of each district and county in each metropolitan area; P , A , and T are the residential population, per capita GDP and urbanization rate of each district or county, respectively; a is a constant variable; b , c , and d represent the coefficients of P, A, and T, respectively; e is an error variable.

3. Results

3.1. Spatial Characteristics of LUCE

3.1.1. Structures of LUCE in Metropolitan Areas

Overall, the total amount of LUCE in the metropolitan area is consistent with its development stage. The total LUCE in HMA (the mature metropolitan area) of 7802.7285 × 104 t is the highest, which is much higher than the total carbon emissions in CMA (the developmental metropolitan area) of 4678.7527 × 104 t, and in NMA (the cultivating metropolitan area) of 1421.2675 × 104 t. Construction land use types are the main contributor of LUCE in these three metropolitan areas, accounting for 99.18%, 96.71%, and 98.34%, respectively, while the proportion of LUCE from cultivated land use types is much lower. Regarding the composition structure of carbon sequestration, the carbon sinks of the three metropolitan areas are also very similar, with woodland accounting for the largest proportion of carbon sequestration, 95.29%, 84.93%, and 95.84% of the carbon sinks in HMA, NMA, and CMA, respectively, while wetland and unutilized land are both weaker due to their smaller carbon sink coefficients and weaker carbon sink capacities, as shown in Table 3.

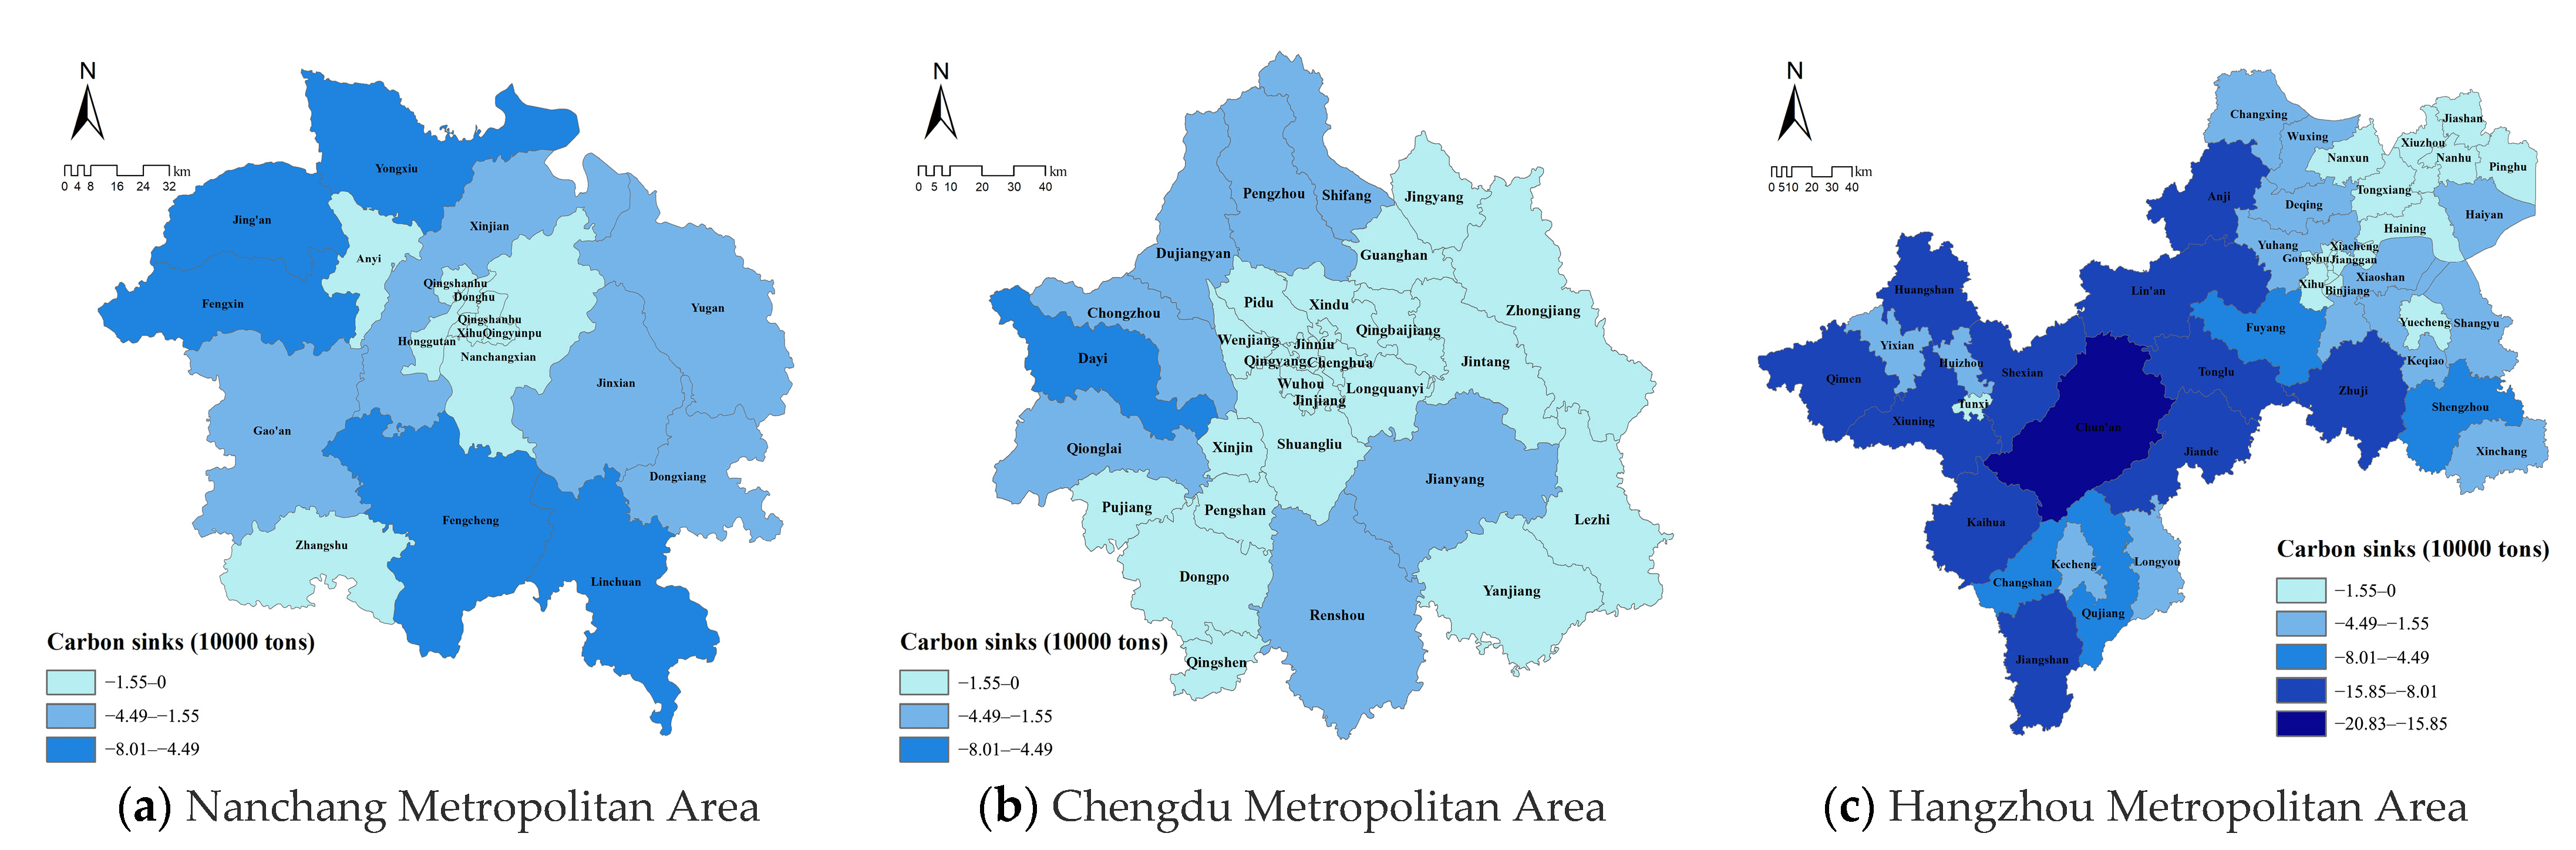
3.1.2. Spatial Differentiation of LUCE in Metropolitan Areas

The spatial distribution characteristics of LUCE in NMA, CMA, and HMA metropolitan areas are weak core cluster type, strong core cluster type, and flat extension respectively. Based on the natural breakpoint method, the sources and sinks of LUCE of the three metropolitan areas were reclassified, as shown in Figure 3 and Figure 4. The areas with high carbon emissions (more than 74.62 × 10⁴ tons) in NMA are mainly concentrated in the southwest, probably due to the higher development level of the economy in its southwest, such as the “Feng-Zhang-Gao” (Fengcheng-Zhangshu-Gaoan) industrial development area. The areas with high carbon sinks (more than 4.49 × 10⁴ tons) were mainly concentrated in two parts (the northwestern and southeastern parts) of the region. However, the LUCE of districts or counties in the CMA shows an obvious “core-edge” spatial distribution pattern, with carbon emissions decreasing from the middle to the periphery of the metropolitan area. Areas with large carbon absorption are in the northwest of the CMA. The cause of this spatial distribution may be due to the concentration of construction land being mainly distributed in the central CMA, and the fact that the non-agricultural industries are also most developed in the central part of the area and the central city of the metropolitan area is more attractive. The spatial distribution of LUCE in the HMA shows a “flattened” extension. Areas with large carbon emissions (more than 74.62 × 10⁴ tons) are distributed in the northeast of the metropolitan area. Areas with large carbon absorption (more than 4.49 × 10⁴ tons) are concentrated in the southwest of this metropolitan area. From the west to the east, the carbon emissions of districts or counties gradually increased.

3.1.3. Spatial Clustering Characteristics of LUCE in Metropolitan Areas

Except for NMA (the cultivating metropolitan area), which showed no significant positive spatial correlation, the carbon sources in CMA (the developmental metropolitan area) and HMA (the mature metropolitan area) showed significant positive correlation results. The Moran’s I value is 0.7957 in the Hangzhou metropolitan area, which is larger than that of 0.7425 in CMA (Table 4). In addition, the carbon sequestration of all three metropolitan areas shows a significant positive correlation result (Table 5). The specific Moran’s I value of NMA is 0.8501, which is much higher than 0.4795 of HMA, and 0.4561 of CMA, due to the contiguous distribution of carbon sink spaces, such as woodland and water, within the metropolitan area.
Overall, the more mature the development stage of the metropolitan area, the more clustered districts or counties with high LUCE levels. The districts or counties with high LUCE levels are more distributed in the core circles of the CMA compared to the NMA, while the districts or counties with high carbon emission levels in the HMA are more widely clustered in contiguous areas. This is related to the high concentration of construction land, industry, population, and other elements in and around the core area of the metropolitan area.

3.2. Coupling Coordination Degree Analysis of LUCE

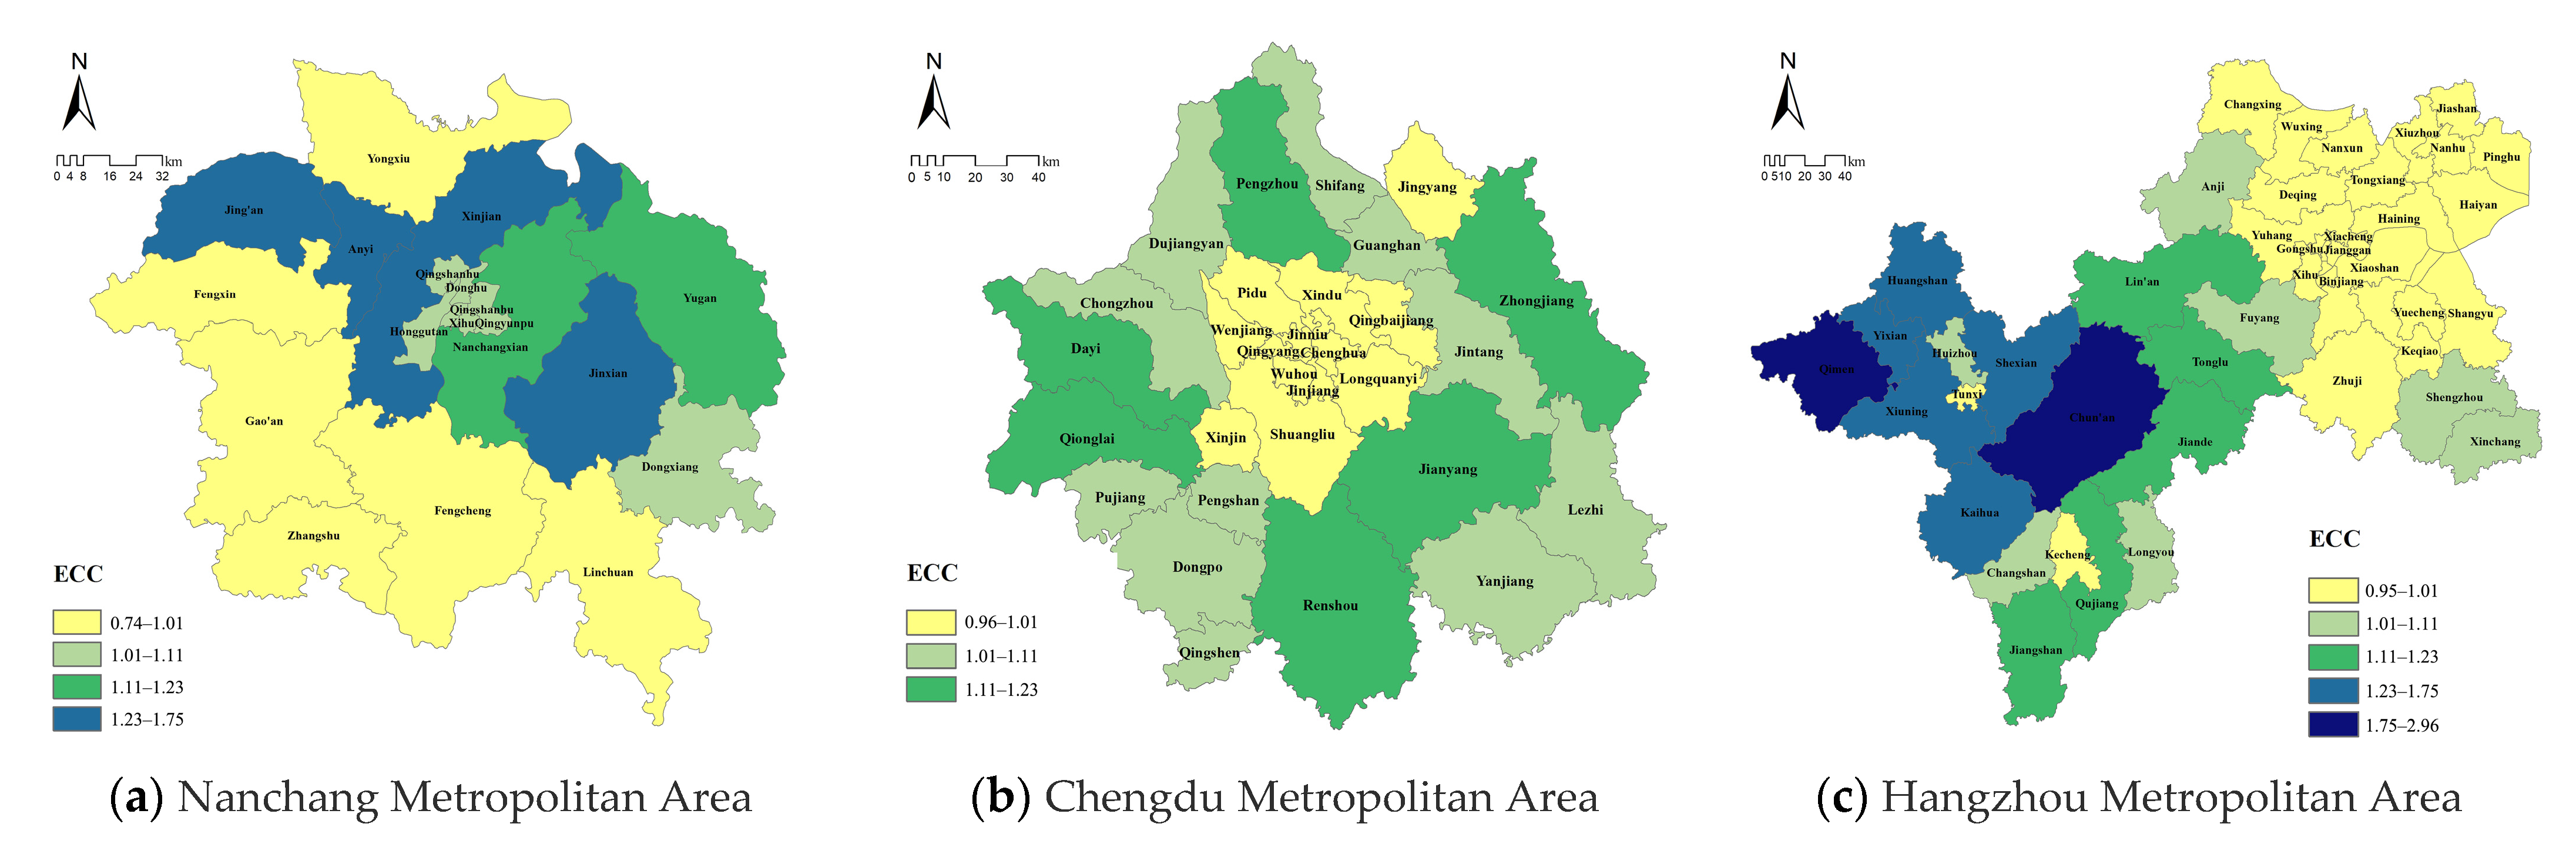
3.2.1. ECC of LUCE in Metropolitan Areas

Districts or counties with high economic contribution coefficient (ECC) of LUCE are generally concentrated in the central part or the periphery and edge part of the metropolitan area (Figure 5). The average values of ECC of carbon emissions of districts or counties in NMA, CMA, and HMA are 1.07, 1.04, and 1.13, respectively. The districts or counties with high ECC in Nanchang metropolitan area (cultivating metropolitan area), i.e., districts or counties with ECC higher than 1.23, are mainly located in the periphery of its central city. Nanchang, as the central city, accounts for 22.22% of the number of districts or counties in NMA, indicating that the economic efficiency of LUCE in the periphery of the central city is higher. The counties with higher ECC, i.e., those with ECC higher than 1.11, are mainly located in the periphery of the CMA, accounting for 20.00% of the total number of counties in the CMA, indicating that the contribution of the counties in the periphery to the economy of the entire metropolitan area is greater than the contribution of their LUCE to the LUCE of the entire metropolitan area. The ECC of HMA (mature metropolitan area) gradually decreases from west to east. The districts or counties with high ECC, i.e., districts or counties with ECC higher than 1.23, are concentrated in the western edge of the HMA, accounting for 15.91% of the total number of districts or counties in the HMA. The districts or counties in this area have higher economic efficiency than LUCE.

3.2.2. ESC of Carbon Emission in Metropolitan Areas

The districts or counties with high ecological support coefficients (ESC) in the three metropolitan areas are all located in the peripheral regions of each metropolitan area (as shown in Figure 6), indicating that the carbon sinks capacity in the peripheral regions contributes more than their carbon emissions contribute to the carbon emissions of each metropolitan area. The mean values of ESC of NMA, CMA, and HMA are 2.31, 2.18, and 5.61, respectively. In addition, the number of districts or counties with higher ESC value in HMA and CMA, i.e., ESC higher than 3.58 is 29.55% and 26.67% respectively, which are much higher than the corresponding number of districts or counties in NMA, which is 11.11%. The results show that HMA and CMA are not only ahead of NMA in terms of the economic development stage, but also, the proportion of districts or counties with high contribution of carbon sink capacity is higher than the proportion of districts or counties at the corresponding level in NMA.

3.2.3. CCD of LUCE in Metropolitan Areas

The CCD (coupling coordination degree) between the ECC and ESC of each metropolitan area is closely bound up to the development stage of the metropolitan area. On the one hand, the more developed the metropolitan area, the lower the CCD. On the other hand, the more developed the economic districts or counties within the metropolitan area, the lower the CCD. The average CCD of NMA, CMA, and HMA is 0.27, 0.34, and 0.18 respectively. The more mature the development stage of the metropolitan area, the more unbalanced the economy contributive coefficient of LUCE and the ESC. Regarding the spatial distribution, there is an extreme imbalance between the ECC and ESC of carbon emissions of districts or counties in the core circles of CMA and NMA. The number of districts or counties with extreme imbalance accounts for 40.00% and 44.44% in each metropolitan area, respectively. The spatial distribution characteristics of the CCD of ECC and ESC of the developmental metropolitan area (CMA) and cultivating metropolitan area (NMA) show similarity, except that the number of seriously unbalanced districts or counties in the developmental metropolitan area accounts for a larger proportion. The eastern part of HMA is seriously unbalanced and the western part is more balanced overall. The amount of seriously unbalanced districts or counties account for 65.91% of the total amount of districts or counties in HMA (as shown in Figure 7).

3.3. Driving Factors of LUCE in Different Stages of Metropolitan Areas

The LUCE of each district and county in the metropolitan areas are taken as the dependent variables, while the resident population, per capita GDP, and urbanization rate are the independent variables, and the carbon emissions of the three metropolitan areas are analyzed by the STIRPAT model. Regression results are shown in Table 6. The R-Square of all three models is close to 1, and the influencing factors of the model have good explanatory power. The lowest value of R-Square is 0.926 in NMA, indicating that the influencing factors in the model can explain carbon emissions to a degree of 92.60%, and the remaining 7.40% is not explained by the influencing factors selected by the model. The highest value of R-square is 0.998 in the CMA, and the influencing factors of its model can explain the carbon emissions of its districts or counties to 99.80%.
The results of NMA are shown in Table 7. The order of influence of carbon emission influencing factors is per capita GDP (A) > resident population (P) > urbanization rate (T). Meanwhile, the influence of resident population and per capita GDP on the LUCE of the NMA is positive, and the significance test value is 0.000 < 0.050, which both pass the significance test. However, the influence of the urbanization rate on the LUCE of districts or counties is negative, and the significance test value is 0.183 > 0.050, which does not pass the significance test. Therefore, for the NMA (the cultivating metropolitan area), increasing the urbanization rate of its districts or counties will be a good strategy to reduce LUCE in the region.
The regression results for CMA are shown in Table 8. The order of influence of carbon emission factors is resident population (P) > per capita GDP (A) > urbanization rate (T). The influence of all three factors on carbon emission in the CMA is positive. The significance test values of influencing factors are all 0.000, and all pass the significance test. Therefore, there exists a significant positive correlation between resident population, per capita GDP, urbanization rate, and carbon emissions for the CMA. In the process of continuous concentration of population, industry, and other factors, the carbon emissions of this area should be reduced by other strategies such as improving the carbon emission efficiency and optimizing the energy structure of districts or counties.
The results for the HMA are shown in Table 9. Similar to CMA, the order of influence of the factors affecting carbon emissions in the districts or counties of the HMA is resident population (P) > per capita GDP (A) > urbanization rate (T); besides, the impact of all three factors on LUCE in HMA is positive, except for the significance test value of urbanization rate on carbon emissions which is 0.054 > 0.050, which does not pass the significance test. The significance of resident population and per capita GDP all passed the test. Therefore, for the HMA (the mature metropolitan area), the influence degree of the resident population on LUCE of districts or counties is the strongest among the three metropolitan areas, and its urbanization rate has already reached a relatively high level. While in the process of continuous concentration of population and industries, the LUCE efficiency of districts or counties should be improved by other ways to reduce carbon emissions in the region.

4. Discussion

4.1. Factors Influencing the LUCE of Different Stages Metropolitan Area

Previous studies on the spatial patterns and impact modeling of LUCE have mainly concentrated on a single aspect of the research object [59,60,61], such as analyzing the spatial evolution characteristics [62] or the influencing factors of carbon emissions [63,64,65]. Few studies have focused on research objects at different development stages at the same time, thus failing to identify the spatial differentiation patterns and influencing factors of LUCE among different types of research objects. Different from previous studies, this study quantifies the LUCE of three different development stages of metropolitan areas in the lower, middle, and upper reaches of the YREB and measures the CCD and influencing factors of LUCE in each metropolitan area. The findings of this study show that the urbanization rate only had a negative impact on the LUCE of the cultivating metropolitan area (such as NMA), while the resident population and per capita GDP had a positive impact on the LUCE of the three stages of metropolitan areas. Similarly, Chel et al. found that population and per capita GDP are also positively related to LUCE after studying 103 metropolitan statistical areas (MSAs) in the United States [66]. The possible reason is that the level of social and economic development and urbanization of the cultivating metropolitan area (such as NMA) are lower than those of developmental and mature metropolitan areas (such as CMA and HMA respectively). Besides, the distribution of urban and rural populations, industry, land use, and other factors are not intensive and efficient enough. Therefore, it is necessary to formulate corresponding strategies to reduce LUCE for different types of metropolitan areas.

4.2. Policy Implications

For cultivating metropolitan areas, large numbers of the rural population will be continuously promoted to gather into central cities in the future to increase the urbanization rate. Meanwhile, changing spatial planning from incremental to stock will be accompanied by the development trend of more intensive urban and rural land use and more concentrated industries, etc. The above changes may make the carbon emissions from construction land in cultivating metropolitan area decrease to a certain extent.
For mature and developmental metropolitan areas, it may be possible to learn from the research of Yang et al. on metropolitan areas in the United States, that is, to increase the number of high-density areas (urban centers) in the metropolitan area to reduce commuting time and distance [67], thereby reducing traffic carbon emissions in the metropolitan area.

4.3. Limitations

However, there are some limitations and potential uncertainties in this study:
(1)
Due to the tiny percentage of permanent snow and ice in the research area, we substituted the permanent snow and ice emission coefficient with the water emission coefficient. However, if it occurs in other research regions where there is a sizable amount of permanent snow and ice or sea, it might lead to unreasonable results. Therefore, future studies should further explore the coefficient of permanent snow and ice and sea.
(2)
This study is only based on the STIRPAT model, which examines the effects on LUCE in metropolitan areas at each development stage regarding population (P), affluence (A), and technology (T), without selecting control variables, which may result in an incomplete analysis of the influencing factors.
(3)
Related studies show that regional climate and carbon cycle changes affect CO2 emission pathways [68]. In addition, some studies have reported that the CO2 emission level of metropolitan areas with a high level of sprawl is generally high [69]. However, climate change, urban form, and other aspects of the metropolitan area are not considered in this research. Therefore, further relevant studies are needed in the future.

5. Conclusions

Based on the GlobeLand30 land use type data of 2020 with 30-meter spatial resolution, this study calculated the total LUCE, analyzed the spatial characteristics, and revealed the relationship between the ECC and ESC of LUCE in each district and county of three metropolitan areas at different development stages, namely NMA, CMA and HMA in YREB. The STIRPAT model was further introduced to explore the impacts of various socio-economic factors on land use carbon emissions in these three metropolitan areas. The main conclusions of this work are drawn as follows.
(1)
The more mature the stage of the metropolitan area, the higher the amount of LUCE is. Meanwhile, the spatial distribution patterns of LUCE of Nanchang, Chengdu, and Hangzhou metropolitan areas show weak core grouping, strong core clustering, and flattening extension patterns respectively. In general, the more mature the development stage of the metropolitan area, the more concentrated the districts or counties with high carbon emission levels.
(2)
The districts or counties with a higher economy contributive coefficient (ECC) are generally concentrated in the central cities or on the periphery or edge of the metropolitan areas. The districts or counties with higher ecological support coefficient (ESC) in the three metropolitan areas are in the peripheral areas of each metropolitan area. Meanwhile, the more developed the metropolitan area, the lower the CCD between ECC and ESC. The more economically developed districts or counties are within the metropolitan area, the lower CCD is.
(3)
Based on the STIRPAT model, the resident population, per capita GDP, and urbanization rate have good explanatory effects on the carbon emissions of the three metropolitan areas. All these three factors have positive effects on carbon emissions, except for the urbanization rate, which contributes to a negative effect on the LUCE of NMA.
Our empirical study revealed the spatial patterns and CCD between the ECC and ESC of LUCE, and verified the effects of the resident population, per capita GDP, and urbanization rate on LUCE in each metropolitan area by applying the STIRPAT model. Both the characteristics of LUCE in metropolitan areas and the influencing factors show specific correlations with the development stage of metropolitan areas. Findings can help to identify sustainable development strategies [70] and formulate corresponding carbon reduction measures for metropolitan areas at different stages of development and different regions within the metropolitan areas. In future studies, we will conduct further comparative analysis on the spatio-temporal evolution patterns of LUCE and other drivers in metropolitan areas at different development stages.

Author Contributions

Conceptualization, Y.D., Y.H. and S.L.; methodology, Y.D. and S.L.; software, Y.D., S.L. and L.Z.; validation, Y.D., S.L. and L.Z.; formal analysis, S.L. and L.X.; investigation, Y.D., L.X., C.H. and Y.C.; resources, Y.H.; data curation, Y.D. and S.L.; writing—original draft preparation, Y.D. and Y.H.; writing—review and editing, S.L.; visualization, Y.D. and S.L.; supervision, S.L.; project administration, Y.H.; funding acquisition, Y.H. All authors have read and agreed to the published version of the manuscript.

Funding

This research was funded by the National Natural Science Foundation of China (No. 51978299 and No. 41901390), the Natural Science Foundation of Hubei Province (No. 2021CFB012), Key Program of the National Social Science Foundation of China (21AZD048), and Open Fund of Key Laboratory of Urban Land Resources Monitoring and Simulation, Ministry of Natural Resources (KF-2020-05-005).

Institutional Review Board Statement

Not applicable.

Informed Consent Statement

Not applicable.

Data Availability Statement

The data used in this study can be requested from the authors.

Conflicts of Interest

The authors declare no conflict of interest.

References

  1. Akimoto, K.; Sano, F.; Oda, J.; Kanaboshi, H.; Nakano, Y. Climate Change Mitigation Measures for Global Net-Zero Emissions and the Roles of CO2 Capture and Utilization and Direct Air Capture. Energy Clim. Chang. 2021, 2, 100057. [Google Scholar] [CrossRef]
  2. Lai, L.; Huang, X.; Yang, H.; Chuai, X.; Zhang, M.; Zhong, T.; Chen, Z.; Chen, Y.; Wang, X.; Thompson, J.R. Carbon Emissions from Land-Use Change and Management in China between 1990 and 2010. Sci. Adv. 2016, 2, e1601063. [Google Scholar] [CrossRef] [PubMed] [Green Version]
  3. Houghton, R.A.; Hackler, J.L. Emissions of Carbon from Forestry and Land-Use Change in Tropical Asia. Glob. Chang. Biol. 1999, 5, 481–492. [Google Scholar] [CrossRef]
  4. Garofalo, D.F.T.; Novaes, R.M.L.; Pazianotto, R.A.A.; Maciel, V.G.; Brandão, M.; Shimbo, J.Z.; Folegatti-Matsuura, M.I.S. Land-Use Change CO2 Emissions Associated with Agricultural Products at Municipal Level in Brazil. J. Clean. Prod. 2022, 364, 132549. [Google Scholar] [CrossRef]
  5. Cameron, C.; Hutley, L.B.; Friess, D.A.; Munksgaard, N.C. Hydroperiod, Soil Moisture and Bioturbation Are Critical Drivers of Greenhouse Gas Fluxes and Vary as a Function of Landuse Change in Mangroves of Sulawesi, Indonesia. Sci. Total Environ. 2019, 654, 365–377. [Google Scholar] [CrossRef]
  6. Ahmad, M.; Rehman, A.; Shah, S.A.A.; Solangi, Y.A.; Chandio, A.A.; Jabeen, G. Stylized Heterogeneous Dynamic Links among Healthcare Expenditures, Land Urbanization, and CO2 Emissions across Economic Development Levels. Sci. Total Environ. 2021, 753, 142228. [Google Scholar] [CrossRef]
  7. Yu, Z.; Chen, L.; Tong, H.; Chen, L.; Zhang, T.; Li, L. Spatial Correlations of Land-Use Carbon Emissions in the Yangtze River Delta Region: A Perspective from Social Network Analysis. Ecol. Indic. 2022, 142, 109147. [Google Scholar] [CrossRef]
  8. Miura, T.; Tamaki, T.; Kii, M.; Kajitani, Y. Efficiency by Sectors in Areas Considering CO2 Emissions: The Case of Japan. Econ. Anal. Policy 2021, 70, 514–528. [Google Scholar] [CrossRef]
  9. Ghosh, S.; Dinda, S.; Das Chatterjee, N.; Dutta, S.; Bera, D. Spatial-Explicit Carbon Emission-Sequestration Balance Estimation and Evaluation of Emission Susceptible Zones in an Eastern Himalayan City Using Pressure-Sensitivity-Resilience Framework: An Approach towards Achieving Low Carbon Cities. J. Clean. Prod. 2022, 336, 130417. [Google Scholar] [CrossRef]
  10. Liu, G.; Zhang, F. Land Zoning Management to Achieve Carbon Neutrality: A Case Study of the Beijing–Tianjin–Hebei Urban Agglomeration, China. Land 2022, 11, 551. [Google Scholar] [CrossRef]
  11. Liu, J.; Peng, K.; Zuo, C.; Li, Q. Spatiotemporal Variation of Land-Use Carbon Emissions and Its Implications for Low Carbon and Ecological Civilization Strategies: Evidence from Xiamen-Zhangzhou-Quanzhou Metropolitan Circle, China. Sustain. Cities Soc. 2022, 86, 104083. [Google Scholar] [CrossRef]
  12. Breetz, H.L. Regulating Carbon Emissions from Indirect Land Use Change (ILUC): U.S. and California Case Studies. Environ. Sci. Policy 2017, 77, 25–31. [Google Scholar] [CrossRef]
  13. Gim, T.H.T. Analyzing the City-Level Effects of Land Use on Travel Time and CO2 Emissions: A Global Mediation Study of Travel Time. Int. J. Sustain. Transp. 2022, 16, 496–513. [Google Scholar] [CrossRef]
  14. Marescaux, A.; Thieu, V.; Garnier, J. Carbon Dioxide, Methane and Nitrous Oxide Emissions from the Human-Impacted Seine Watershed in France. Sci. Total Environ. 2018, 643, 247–259. [Google Scholar] [CrossRef]
  15. Ali, G.; Pumijumnong, N.; Cui, S. Valuation and Validation of Carbon Sources and Sinks through Land Cover/Use Change Analysis: The Case of Bangkok Metropolitan Area. Land Use Policy 2018, 70, 471–478. [Google Scholar] [CrossRef]
  16. Ali, G.; Nitivattananon, V. Exercising Multidisciplinary Approach to Assess Interrelationship between Energy Use, Carbon Emission and Land Use Change in a Metropolitan City of Pakistan. Renew. Sustain. Energy Rev. 2012, 16, 775–786. [Google Scholar] [CrossRef]
  17. Aryapratama, R.; Pauliuk, S. Life Cycle Carbon Emissions of Different Land Conversion and Woody Biomass Utilization Scenarios in Indonesia. Sci. Total Environ. 2022, 805, 150226. [Google Scholar] [CrossRef]
  18. Shen, W.; Liang, H.; Dong, L.; Ren, J.; Wang, G. Synergistic CO2 Reduction Effects in Chinese Urban Agglomerations: Perspectives from Social Network Analysis. Sci. Total Environ. 2021, 798, 149352. [Google Scholar] [CrossRef]
  19. Fujii, H.; Iwata, K.; Chapman, A.; Kagawa, S.; Managi, S. An Analysis of Urban Environmental Kuznets Curve of CO2 Emissions: Empirical Analysis of 276 Global Metropolitan Areas. Appl. Energy 2018, 228, 1561–1568. [Google Scholar] [CrossRef] [Green Version]
  20. Shi, Y.; Wang, H.; Shi, S. Relationship between Social Civilization Forms and Carbon Emission Intensity: A Study of the Shanghai Metropolitan Area. J. Clean. Prod. 2019, 228, 1552–1563. [Google Scholar] [CrossRef]
  21. Luo, Z.; Wu, Y.; Zhou, L.; Sun, Q.; Yu, X.; Zhu, L.; Zhang, X.; Fang, Q.; Yang, X.; Yang, J.; et al. Trade-off between Vegetation CO2 Sequestration and Fossil Fuel-Related CO2 Emissions: A Case Study of the Guangdong–Hong Kong–Macao Greater Bay Area of China. Sustain. Cities Soc. 2021, 74, 103195. [Google Scholar] [CrossRef]
  22. China National Development and Reform Commission National Development and Reform Commission on the Issuance of the “14th Five-Year Plan” Implementation Plan for the Development of the Urban Agglomeration in the Middle Reaches of the Yangtze River. Available online: http://www.gov.cn/zhengce/zhengceku/2022-03/16/content_5679303.htm (accessed on 15 February 2022).
  23. Chuai, X.; Feng, J. High Resolution Carbon Emissions Simulation and Spatial Heterogeneity Analysis Based on Big Data in Nanjing City, China. Sci. Total Environ. 2019, 686, 828–837. [Google Scholar] [CrossRef]
  24. Xia, C.; Li, Y.; Xu, T.; Chen, Q.; Ye, Y.; Shi, Z.; Liu, J.; Ding, Q.; Li, X. Analyzing Spatial Patterns of Urban Carbon Metabolism and Its Response to Change of Urban Size: A Case of the Yangtze River Delta, China. Ecol. Indic. 2019, 104, 615–625. [Google Scholar] [CrossRef]
  25. Guo, R.; Leng, H.; Yuan, Q.; Song, S. Impact of Urban Form on CO2 Emissions under Different Socioeconomic Factors: Evidence from 132 Small and Medium-Sized Cities in China. Land 2022, 11, 713. [Google Scholar] [CrossRef]
  26. Danling, C.; Xinhai, L.U.; Bing, K.; Ulue, U. Dynamic Evolution and Spatial Convergence of Urban Land Use Efficiency in the Middle Reaches of the Yangtze River. China Popul. Environ. 2018, 28, 106–114. [Google Scholar]
  27. Cui, Y.; Li, L.; Chen, L.; Zhang, Y.; Cheng, L.; Zhou, X.; Yang, X. Land-Use Carbon Emissions Estimation for the Yangtze River Delta Urban Agglomeration Using 1994–2016 Landsat Image Data. Remote Sens. 2018, 10, 1334. [Google Scholar] [CrossRef] [Green Version]
  28. Yang, S.; Fu, W.; Hu, S.; Ran, P. Watershed Carbon Compensation Based on Land Use Change: Evidence from the Yangtze River Economic Belt. Habitat Int. 2022, 126, 102613. [Google Scholar] [CrossRef]
  29. Liu, C.; Sun, W.; Li, P. Characteristics of Spatiotemporal Variations in Coupling Coordination between Integrated Carbon Emission and Sequestration Index: A Case Study of the Yangtze River Delta, China. Ecol. Indic. 2022, 135, 108520. [Google Scholar] [CrossRef]
  30. Yang, B.; Wang, Z.; Zou, L.; Zou, L.; Zhang, H. Exploring the Eco-Efficiency of Cultivated Land Utilization and Its Influencing Factors in China’s Yangtze River Economic Belt, 2001–2018. J. Environ. Manag. 2021, 294, 112939. [Google Scholar] [CrossRef]
  31. Shen, X.; Zheng, H.; Jiang, M.; Yu, X.; Xu, H.; Zhong, G. Multidimensional Impact of Urbanization Process on Regional Net CO2 Emissions: Taking the Yangtze River Economic Belt as an Example. Land 2022, 11, 1079. [Google Scholar] [CrossRef]
  32. Tan, S.; Hu, B.; Kuang, B.; Zhou, M. Regional Differences and Dynamic Evolution of Urban Land Green Use Efficiency within the Yangtze River Delta, China. Land Use Policy 2021, 106, 105449. [Google Scholar] [CrossRef]
  33. Wu, H.; Fang, S.; Zhang, C.; Hu, S.; Nan, D.; Yang, Y. Exploring the Impact of Urban Form on Urban Land Use Efficiency under Low-Carbon Emission Constraints: A Case Study in China’s Yellow River Basin. J. Environ. Manag. 2022, 311, 114866. [Google Scholar] [CrossRef] [PubMed]
  34. Portal, C.C.G. The Outline of the Development Plan of the Yangtze River Economic Belt Was Officially Printed and Distributed. Available online: http://www.gov.cn/xinwen/2016-09/12/content_5107501.htm (accessed on 12 September 2016).
  35. China, N.D. and R.C of The National Development and Reform Commission Issued the Development Plan of Urban Agglomeration in the Middle Reaches of the Yangtze River. Available online: http://www.gov.cn/xinwen/2015-04/16/content_2848120.htm (accessed on 16 April 2015).
  36. Wang, M.; Wang, Y.; Wu, Y.; Yue, X.; Wang, M.; Hu, P. Identifying the Spatial Heterogeneity in the Effects of the Construction Land Scale on Carbon Emissions: Case Study of the Yangtze River Economic Belt, China. Environ. Res. 2022, 212, 113397. [Google Scholar] [CrossRef] [PubMed]
  37. Yin, Z.; Lu, Q.; Lv, X.; Wang, Q. China Metropolitan Area Development Report 2021, 1st ed.; Tsinghua University: Beijing, China, 2021. [Google Scholar]
  38. Jokar Arsanjani, J. Characterizing, Monitoring, and Simulating Land Cover Dynamics Using GlobeLand30: A Case Study from 2000 to 2030. J. Environ. Manag. 2018, 214, 66–75. [Google Scholar] [CrossRef] [PubMed]
  39. Kim, D.; Lim, C.H.; Song, C.; Lee, W.K.; Piao, D.; Heo, S.; Jeon, S. Estimation of Future Carbon Budget with Climate Change and Reforestation Scenario in North Korea. Adv. Sp. Res. 2016, 58, 1002–1016. [Google Scholar] [CrossRef]
  40. Fattah, M.A.; Morshed, S.R.; Morshed, S.Y. Impacts of Land Use-Based Carbon Emission Pattern on Surface Temperature Dynamics: Experience from the Urban and Suburban Areas of Khulna, Bangladesh. Remote Sens. Appl. Soc. Environ. 2021, 22, 100508. [Google Scholar] [CrossRef]
  41. Sun, H.; Liang, H.M.; Chang, X.L.; Cui, Q.C.; Tao, Y. Land Use Patterns on Carbon Emission and Spatial Association in China. Econ. Geogr. 2015, 35, 154–162. [Google Scholar]
  42. Zhang, C.-Y.; Zhao, L.; Zhang, H.; Chen, M.-N.; Fang, R.-Y.; Yao, Y.; Zhang, Q.-P.; Wang, Q. Spatial-Temporal Characteristics of Carbon Emissions from Land Use Change in Yellow River Delta Region, China. Ecol. Indic. 2022, 136, 108623. [Google Scholar] [CrossRef]
  43. Hussain, M.; Wang, W.; Wang, Y. Natural Resources, Consumer Prices and Financial Development in China: Measures to Control Carbon Emissions and Ecological Footprints. Resour. Policy 2022, 78, 102880. [Google Scholar] [CrossRef]
  44. Zhang, A.; Wen, L.; Chatalova, L.; Gao, X. Reduction of Carbon Emissions through Resource-Saving and Environment-Friendly Regional Economic Integration–Evidence from Wuhan Metropolitan Area, China. Technol. Forecast. Soc. Chang. 2021, 166, 120590. [Google Scholar] [CrossRef]
  45. Carpio, A.; Ponce-Lopez, R.; Lozano-García, D.F. Urban Form, Land Use, and Cover Change and Their Impact on Carbon Emissions in the Monterrey Metropolitan Area, Mexico. Urban Clim. 2021, 39, 100947. [Google Scholar] [CrossRef]
  46. Xu, J.; Pan, H.; Huang, P. Carbon Emission and Ecological Compensation of Main Functional Areas in Sichuan Province Based on LUCC. Chin. J. Eco-Agric. 2019, 27, 142–152. [Google Scholar] [CrossRef]
  47. Fang, J.Y.; Guo, Z.D.; Piao, S.L.; Chen, A.P. Terrestrial Vegetation Carbon Sinks in China, 1981–2000. Sci. China Ser. D Earth Sci. 2007, 50, 1341–1350. [Google Scholar] [CrossRef]
  48. Yang, B.; Chen, X.; Wang, Z.; Li, W.; Zhang, C.; Yao, X. Analyzing Land Use Structure Efficiency with Carbon Emissions: A Case Study in the Middle Reaches of the Yangtze River, China. J. Clean. Prod. 2020, 274, 123076. [Google Scholar] [CrossRef]
  49. Yao, L.; Yu, Z.; Wu, M.; Ning, J.; Lv, T. The Spatiotemporal Evolution and Trend Prediction of Ecological Wellbeing Performance in China. Land 2021, 10, 12. [Google Scholar] [CrossRef]
  50. Tomal, M. Evaluation of Coupling Coordination Degree and Convergence Behaviour of Local Development: A Spatiotemporal Analysis of All Polish Municipalities over the Period 2003–2019. Sustain. Cities Soc. 2021, 71, 102992. [Google Scholar] [CrossRef]
  51. Ariken, M.; Zhang, F.; Liu, K.; Fang, C.; Kung, H. Te Coupling Coordination Analysis of Urbanization and Eco-Environment in Yanqi Basin Based on Multi-Source Remote Sensing Data. Ecol. Indic. 2020, 114, 106331. [Google Scholar] [CrossRef]
  52. Yang, Z.; Zhan, J.; Wang, C.; Twumasi-Ankrah, M.J. Coupling Coordination Analysis and Spatiotemporal Heterogeneity between Sustainable Development and Ecosystem Services in Shanxi Province, China. Sci. Total Environ. 2022, 836, 155625. [Google Scholar] [CrossRef]
  53. Yang, Y.; Fan, M. Analysis of the Spatial-Temporal Differences and Fairness of the Regional Energy Ecological Footprint of the Silk Road Economic Belt (China Section). J. Clean. Prod. 2019, 215, 1246–1261. [Google Scholar] [CrossRef]
  54. Rong, T.; Zhang, P.; Jing, W.; Zhang, Y.; Li, Y.; Yang, D.; Yang, J.; Chang, H.; Ge, L. Carbon Dioxide Emissions and Their Driving Forces of Land Use Change Based on Economic Contributive Coefficient (ECC) and Ecological Support Coefficient (ESC) in the Lower Yellow River Region (1995–2018). Energies 2020, 13, 2600. [Google Scholar] [CrossRef]
  55. Yuan, S.; Tang, Y. Spatial Differentiation of Land Use Carbon Emission in the Yangtze River Economic Belt Based on Low Carbon Perspective. Econ. Geogr. 2019, 39, 190–198. [Google Scholar]
  56. Martyka, A.; Jopek, D.; Skrzypczak, I. Analysis of the Sustainable Development Index in the Communes of the Podkarpackie Voivodeship: A Polish Case Study. Sustainability 2022, 14, 10237. [Google Scholar] [CrossRef]
  57. Liu, Y.; Yang, R.; Sun, M.; Zhang, L.; Li, X.; Meng, L.; Wang, Y.; Liu, Q. Regional Sustainable Development Strategy Based on the Coordination between Ecology and Economy: A Case Study of Sichuan Province, China. Ecol. Indic. 2022, 134, 108445. [Google Scholar] [CrossRef]
  58. Vélez-Henao, J.A.; Font Vivanco, D.; Hernández-Riveros, J.A. Technological Change and the Rebound Effect in the STIRPAT Model: A Critical View. Energy Policy 2019, 129, 1372–1381. [Google Scholar] [CrossRef]
  59. Hutyra, L.R.; Yoon, B.; Hepinstall-Cymerman, J.; Alberti, M. Carbon Consequences of Land Cover Change and Expansion of Urban Lands: A Case Study in the Seattle Metropolitan Region. Landsc. Urban Plan. 2011, 103, 83–93. [Google Scholar] [CrossRef]
  60. Raihan, A.; Tuspekova, A. The Nexus between Economic Growth, Renewable Energy Use, Agricultural Land Expansion, and Carbon Emissions: New Insights from Peru. Energy Nexus 2022, 6, 100067. [Google Scholar] [CrossRef]
  61. Sowby, R.B.; Capener, A. Reducing Carbon Emissions through Water Conservation: An Analysis of 10 Major U.S. Cities. Energy Nexus 2022, 7, 100094. [Google Scholar] [CrossRef]
  62. Baldassini, P.; Bagnato, C.E.; Paruelo, J.M. How May Deforestation Rates and Political Instruments Affect Land Use Patterns and Carbon Emissions in the Semi-Arid Chaco, Argentina? Land Use Policy 2020, 99, 104985. [Google Scholar] [CrossRef]
  63. Zhao, Y.; Chen, R.; Sun, T.; Yang, Y.; Ma, S.; Xie, D.; Zhang, X. Urbanization Influences CO2 Emissions in the Pearl River Delta: A Perspective of the “Space of Flows”. Land 2022, 11, 1373. [Google Scholar] [CrossRef]
  64. Domon, S.; Hirota, M.; Kono, T.; Managi, S.; Matsuki, Y. The Long-Run Effects of Congestion Tolls, Carbon Tax, and Land Use Regulations on Urban CO2 Emissions. Reg. Sci. Urban Econ. 2022, 92, 103750. [Google Scholar] [CrossRef]
  65. Dumortier, J.; Elobeid, A. Effects of a Carbon Tax in the United States on Agricultural Markets and Carbon Emissions from Land-Use Change. Land Use Policy 2021, 103, 105320. [Google Scholar] [CrossRef]
  66. Chel, M.; Kang, M.; Kim, S. Urban Climate Does Polycentric Development Produce Less Transportation Carbon Emissions ? Evidence from Urban Form Identified by Night-Time Lights across US Metropolitan Areas. Urban Clim. 2022, 44, 101223. [Google Scholar] [CrossRef]
  67. Yang, J.; French, S.; Holt, J.; Zhang, X. Measuring the Structure of U.S. Metropolitan Areas, 1970–2000 Measuring the Structure of U.S. Metropolitan Areas, 1970–2000. J. Am. Plan. Assoc. 2012, 78, 197–209. [Google Scholar] [CrossRef]
  68. Nohara, D.; Yoshida, Y.; Misumi, K.; Ohba, M. Dependency of Climate Change and Carbon Cycle on CO2 Emission Pathways. Environ. Res. Lett. 2013, 8, 014047. [Google Scholar] [CrossRef] [Green Version]
  69. Bereitschaft, B.; Debbage, K. Urban Form, Air Pollution, and CO2 Emissions in Large U.S. Metropolitan Areas. Prof. Geogr. 2013, 65, 612–635. [Google Scholar] [CrossRef]
  70. Li, M.; Li, X.; Liu, S.; Lyu, X.; Dang, D.; Dou, H.; Wang, K. Analysis of the Spatiotemporal Variation of Landscape Patterns and Their Driving Factors in Inner Mongolia from 2000 to 2015. Land 2022, 11, 1410. [Google Scholar] [CrossRef]
Figure 1. Study areas. (a) Locations of the study areas in China. (bd) land use of the Hangzhou, Chengdu, and Nanchang metropolitan areas, respectively.
Land 11 01835 g001
Figure 2. Research framework.
Land 11 01835 g002
Figure 3. County-level distribution of LUCE in Nanchang, Chengdu, and Hangzhou metropolitan areas.
Land 11 01835 g003
Figure 4. County-level distribution of LUCE sinks in Nanchang, Chengdu, and Hangzhou metropolitan areas.
Land 11 01835 g004
Figure 5. Economic contribution coefficients of three metropolitan areas.
Land 11 01835 g005
Figure 6. Ecological support coefficients of three metropolitan areas.
Land 11 01835 g006
Figure 7. CCD between ECC and ESC in three metropolitan areas.
Land 11 01835 g007
Table 1. CE coefficient of different land use types (kg·m−2·a−1).
Land UseCoefficientReferences
Woodland/Shrubland−0.0644Zhang et al., [42]; Fang et al., [47]
Grassland−0.0021Sun et al., [41]; Zhang et al., [42]
Wetland−0.0001Zhang et al., [42]
Water/Sea −0.0253Yang et al., [48]
Unutilized −0.0005Yang et al., [48]
Table 2. Levels of CCD.
Development CategoryLevelBalanced or NotDegree
Coordinated 0.8 < CCD ≤ 1.0BalancedHighly
Transformation0.6 < CCD ≤ 0.8BalancedModerately
Uncoordinated0.4 < CCD ≤ 0.6BalancedBasically
0.2 < CCD ≤ 0.4UnbalancedModerately
0 < CCD ≤ 0.2UnbalancedSeriously
Table 3. Land use carbon emissions/sinks of three metropolitan areas (×104 t/a).
Cultivated LandConstruction LandWoodlandGrasslandWetlandWaterUnutilized LandTotal
Nanchang Metropolitan Area48.49641424.5591−43.9845−0.2845−0.0006−7.5160−0.00241421.2675
Chengdu Metropolitan Area77.97514631.6161−29.5562−0.2083−0.0003−1.07370.00004678.7527
Hangzhou Metropolitan Area65.68417936.4449−190.0182−0.2788−0.0006−9.1028−0.00017802.7285
Table 4. Global Moran’s I of LUCE sources.
Moran’s Iz-Scorep-Value
Nanchang Metropolitan Area0.02660.50650.6125
Chengdu Metropolitan Area0.74259.06000.0000
Hangzhou Metropolitan Area0.79577.82380.0000
Table 5. Global Moran’s I of LUCE sinks.
Moran’s Iz-Scorep-Value
Nanchang Metropolitan Area0.85015.34120.0000
Chengdu Metropolitan Area0.45615.40080.0000
Hangzhou Metropolitan Area0.47954.68000.0000
Table 6. Models Summary Table of Three Metropolitan Areas.
ModelRR-SquareAdjusted R-SquareStandard Error in EstimationDurbin-Watson
Nanchang Metropolitan Area (NMA)0.9620.9260.9100.2301.604
Chengdu Metropolitan Area (CMA)0.9990.9980.9980.0341.865
Hangzhou Metropolitan Area (HMA)0.9910.9820.9810.1552.619
Table 7. Model test results of Nanchang metropolitan area.
VariablesNon-Standardized
Coefficient
Standardized Coefficient Colinearity Statistics
BStd. ErrorBetatSignificanceToleranceVIF
CONSTANT−2.8470.655 −4.3430.001
Resident population1.0840.0920.91611.7950.0000.8761.141
Per capita GDP1.3760.1860.7587.3930.0000.5031.988
Urbanization rate−0.3900.279−0.138−1.4010.1830.5411.847
Table 8. Model test results of Chengdu metropolitan area.
VariablesNon-Standardized
Coefficient
Standardized Coefficient Colinearity Statistics
BStd. ErrorBetatSignificanceToleranceVIF
CONSTANT−1.3080.134 −9.7600.000
Resident population0.9840.0150.74866.8410.0000.5011.996
Per capita GDP0.9660.0330.45528.9210.0000.2543.936
Urbanization rate0.2420.0500.0884.8120.0000.1875.345
Table 9. Model test results of Hangzhou metropolitan area.
VariablesNon-Standardized
Coefficient
Standardized Coefficient Colinearity Statistics
BStd. ErrorBetatSignificanceToleranceVIF
CONSTANT−2.1170.256 −8.2660.000
Resident population1.1420.0410.70028.1290.0000.7171.394
Per capita GDP1.0780.0660.43816.3140.0000.6141.627
Urbanization rate0.2650.1340.0591.9840.0540.5091.966
Publisher’s Note: MDPI stays neutral with regard to jurisdictional claims in published maps and institutional affiliations.

