
Spatial Distribution of Optimal Plant Cover and Its Influencing Factors for Populus simonii Carr. on the Bashang Plateau, China
by
 , ,
, ,
Yu Zhang
1,2,3 ,
,
Wei Li
4,5,*,
Shaodan Li
1,2,3,
Baoni Xie
4,5,
Fangzhong Shi
6 and
Jianxia Zhao
7 1
School of Geographical Sciences, Hebei Normal University, Shijiazhuang 050024, China
2
Hebei Key Laboratory of Environmental Change and Ecological Construction, Shijiazhuang 050024, China
3
Hebei Technology Innovation Center for Remote Sensing Identification of Environmental Change, Shijiazhuang 050024, China
4
School of Land Science and Space Planning, Hebei GEO University, Shijiazhuang 050031, China
5
International Science and Technology Cooperation Base of Hebei Province: Hebei International Joint Research Center for Remote Sensing of Agricultural Drought Monitoring, Hebei GEO University, Shijiazhuang 050031, China
6
School of Natural Resources, Faculty of Geographical Science, Beijing Normal University, Beijing 100875, China
7
College of Geography and Land Engineering, Yuxi Normal University, Yuxi 653100, China
*
Author to whom correspondence should be addressed.
Land 2022, 11(6), 890; https://doi.org/10.3390/land11060890
Submission received: 18 May 2022
/
Revised: 8 June 2022
/
Accepted: 9 June 2022
/
Published: 11 June 2022
(This article belongs to the Special Issue Advances in Characterizing and Addressing Land Degradation and Associated Ecosystem Responses)
Abstract
:The Bashang Plateau is the core zone of the agro-pastoral ecotone in northern China and represents an ecological barrier for preventing the invasion of wind-blown sand in the Beijing–Tianjin–Hebei region. Increasing plant cover to control soil erosion is an effective measure to address land degradation; however, plant cover is different from climatic conditions. In this study, we determined the optimal spatial distribution of Populus simonii Carr., which is a widely planted species used for revegetation on the Bashang Plateau. A modified Biome-BGC model was used to simulate the dynamics of the net primary productivity (NPP), actual evapotranspiration (AET), and leaf-area index (LAI). The model was validated using field-observed tree-ring and MODIS AET and NPP data. The dynamics of AET, NPP and LAI for P. simonii at 122 representative sites in the study area for the period 1980–2019 were simulated by the validated model. The results showed that the spatial distributions of mean AET, NPP, and LAI generally decreased from southeast to northwest. The ranges of optimal plant cover in terms of maximum LAI for P. simonii were 3.3 in the Fengning–Weichang area, 1.9 in the Shangyi–Zhangbei–Guyuan area and 1.3 in the Kangbao area. Mean annual precipitation (MAP), elevation, soil texture and mean annual temperature were the main factors influencing the distribution of AET, NPP and LAI. As the MAP decreased, the correlations between AET, NPP, LAI and precipitation gradually decreased. In different subregions, the factors influencing optimal-plant-cover distribution varied significantly. These quantitative findings provide the optimal plant cover for the dominant tree in different subregions and provide useful information for land degradation management on the Bashang Plateau.
1. Introduction
Afforestation of degraded land is one of the major strategies for improving the ecological conditions at the regional levels by controlling soil erosion [1], enhancing soil-vegetation carbon sinks, maintaining biodiversity [2,3] and regulating hydroclimatic conditions [4]. However, immense afforestation may consume excess water and cause a severe soil water deficit [5,6], which in turn will negatively affect the ecological functions of vegetation in semiarid and arid regions. Attaining an optimal plant cover is vital to afforestation projects for balancing soil water consumption, fostering plant growth and maintaining the ecosystem health of restored ecosystems [7,8].
An optimal plant cover is one that reaches the maximum leaf-area index (LAI) in the given climate–soil conditions and vegetation types without causing a permanent soil water deficit [9]. Several studies on optimal plant cover for different vegetation types have been conducted at varying scales ranging from plot and field scales to small watershed and regional scales using field experiments and numerical simulations in semiarid and subhumid areas [9,10,11,12]. Fu et al. combined field experimental data with the SHAW model to calculate the optimal cover corresponding to a maximum LAI of 1.27 for C. korshinkii and 0.70 for S. psammophila in the northern region of China’s Loess Plateau [9]. Mo et al. used Eagleson’s ecohydrological optimality method to determine the optimal canopy cover in Horqin Sands of China [8]. In the Northeast China Transect, Cong et al. determined that the optimal canopy cover for forests equates to 0.822 [13]. However, most field experiments used in research on optimal plant cover last only 1–3 years and cannot represent variations in long-term climate characteristics. An eco-physiological process model can estimate the dynamics of plant coverage using long-term climate records and has proven to be an effective tool to estimate optimal plant cover. Jia et al. estimated the spatial distributions of optimal plant cover for three exotic plant species across China’s Loess Plateau using the Biome-BGC model [12]. The Biome-BGC model has been proven to simulate the optimal plant cover for typical species in arid and semi-arid regions.
The Bashang Plateau is one of the most vulnerable and sensitive portions of northern China and is a major source of dust and sand storms that affect Beijing and its surrounding areas (the Beijing–Tianjin–Hebei region) [14,15]. To prevent further land degradation and restore degraded lands is especially important in this area. A series of afforestation projects have been implemented by China’s government over the last four decades [16], e.g., the Grain-for-Green Program, the Three-North Shelterbelt Program and the Beijing–Tianjin Sand Source Restoration Project, to address land degradation and improve the regional ecological environment. Since then, the vegetation cover has dramatically increased, and wind and sand erosion have been effectively controlled [17,18]. The excessive introduction of fast-growing plant species with high planting density caused a very large consumption of local water resources and further aggravated land degradation. Populus simonii Carr. is the dominant revegetation species used [19]; however, in recent decades, there has been a great deal of degeneration and death among P. simonii trees. Nearly 80% of the planted forest is degraded, whereas approximately one-third of it is dead [20]. Drought is associated with tree mortality at the regional level [21]. Thus, determining the optimal plant cover for P. simonii under Bashang Plateau conditions is crucial for accelerating recovery and combating land degradation.
The optimal plant cover for a given vegetation type depends on many factors and is sensitive to changes in the local environment and climate [12]. There were obvious subregional differences in climatic and soil conditions in the Bashang Plateau. However, previous studies have only determined the optimal plant cover and influencing factors at the regional scale. Few studies analyze the main influencing factors in different subregions. We hypothesized that the spatial distribution of optimal plant cover for P. simonii showed heterogeneity and the main influencing factors varied in different subregions. Thus, the objectives of this research were to (1) determine the spatial distribution of optimal plant cover for P. simonii in the study area based on long-term variations in net primary productivity (NPP), actual evapotranspiration (AET), and LAI for P. simonii using a modified Biome-BGC model and (2) determine the main factors that influence the spatial distribution of the optimal plant cover in three subregions with different climate, soil and topography conditions. This information should be useful in policy decision support for addressing land degradation through spatially explicit optimal plant cover for the major afforestation species on the Bashang Plateau of China.
2. Materials and Methods
2.1. Study Area
The Bashang Plateau, which is located between 114°35′~116°45′ E and 41°00′~42°20′ N, encompasses six counties (Guyuan, Zhangbei, Kangbao, Shangyi, Weichang, and Fengning) within the northern part of Hebei Province, China (Figure 1). It covers a total area of 18,202 km2 and has an elevation range of 831~2215 m. The Bashang Plateau is characterized by a continental monsoon climate that is cold, windy, and prone to drought. The mean annual precipitation (MAP) varies from 330 mm in the northwest to 460 mm in the southeast. The mean annual temperature (MAT) ranges from 1.5 to 5 °C, and the annual potential evaporation is approximately 880~1000 mm. The soil textures are mainly composed of clayey and sandy soils. The vegetation types in this area are warm temperate deciduous broadleaf forest and temperate grassland [22]. The Bashang Plateau is characterized by vulnerable ecosystems, and various non-native plant species (including Populus L., Ulmus pumila L., Pinus tabuliformis Carr., Pinus sylvestris var. mongolica Litv., Larix principis-rupprechtii Mayr., Betula platyphylla Suk., Caragana microphylla Lam. and Hippophae rhamnoides L.) have been introduced in this area in the efforts to restore vegetation. P. simonii, a fast-growing tree that was cultivated in the 1980s to promote ecological protection, was investigated in this study. Based on the geographical and ecological characteristics, we divided the Bashang Plateau into three subregions (Table 1).
2.2. Biome-BGC Model Description
The Biome-BGC model is a typical process-based model designed to simulate biogeochemical element cycling. It can predict the dynamics of water, carbon, nitrogen and energy in terrestrial ecosystems with general stand information and daily meteorological data [23,24]. The model provides complete parameter settings for different biomes (i.e., evergreen needle leaf, evergreen broadleaf, deciduous broadleaf, shrub, and grass) [23]. Leaf area determines the potential forest productivity as well as the rainfall partitioning and evaporation from soil. The LAI is a vegetation state variable that is updated every day on the basis of the estimated leaf carbon [25]. NPP is partitioned into biomass compartments according to dynamic allocation patterns based on nitrogen limitations [26]. The effect of water stress on the rate of photosynthesis and respiration is regulated through stomatal adjustments to simulate plant growth (Figure 2). A physically based equation (i.e., the one-dimensional Richards equation with a root water extraction term) was implemented in water-cycling routines to simulate soil water movement under limited water conditions by Huang et al. [27]. The inner process of the Biome-BGC model and the rationale have been described in depth by White et al. and Thornton et al. [23,24]. The original model is not suitable for coarse soil, and this study has therefore used the modified Biome-BGC model.
2.3. Parameterization of the modified Biome-BGC Model
2.3.1. Meteorological Parameters
Measured values of the daily maximum and minimum air temperature (°C), precipitation (mm) and relative humidity (%) for 12 meteorological stations inside and around the study area were provided by the national ground stations of the China Meteorological Administration. The data were interpolated using thin-plate smoothing splines to produce maps at a spatial resolution of 1 km for 1980–2019. The MT-CLIM model was used to generate other necessary meteorological parameters based on the temperature, precipitation, and humidity data [24].
2.3.2. Soil Hydraulic Parameters
We investigated and measured the soil samples in each subregion under different topography, soil and vegetation conditions for the model evaluation. The latitude, longitude and elevation of each site were recorded by a GPS receiver, while the site slope and aspect were determined using a geological compass. At each site, several soil points were randomly selected to collect soil samples. The bulk density (BD), saturated SWC (θs) and saturated hydraulic conductivity (Ks) at each site were measured using undisturbed soil cores. Disturbed soil samples were collected using a soil-drilling sampler at depths of 0–0.2 m at each point. Various soil hydraulic parameters are necessary for the modified Biome-BGC model, and they include the residual soil water content (θr), θs, Ks and the van Genuchten model parameters (α, n and m). Ks was determined using the constant-head method, and BD was determined from the volume–dry-mass relationship [29] for each core sample. The hydraulic parameters θr, α and n were determined using the estimated soil–water-retention curves with the RETC program for each site [30]. A standard soil suction of 33 kPa was used to determine the soil water content at field capacity. The soil characteristic parameters at the simulation sites were based on previously published data from studies in this area [31,32,33] and the “National 1:1 million Digital Soil Map” developed by the Nanjing Soil Research Institute of the Chinese Academy of Sciences and Soil Environment Department of the Ministry of Agriculture of China. Digital-elevation-model (DEM) data, ASTER GDEM 30 m, were acquired from the Geospatial Data Cloud (http://www.gscloud.cn (accessed on 16 May 2022)).
2.3.3. Ecophysiological Parameters
The ecological parameters for P. simonii are summarized in Table 2. These parameters were derived from field observations for P. simonii by Kang et al. [34] and the published literature of the genera. Based on the study by Liu et al. [35], the distribution of roots for P. simonii was determined. The maximum root depth was assumed to be constant at 2 m.
2.4. Validation of the Biome-BGC Model
Tree-ring chronology can record long-term tree growth under natural conditions and can thus be used as an indicator of NPP for evaluating forest productivity in response to climate change [36]. A model simulation of the interannual variations in the NPP of P. simonii forests was tested using the tree-ring-width index (RWI) during 1982–2017 for P. simonii at the Zhangbei Ertai site derived from the published data of Liu et al. [37]. To test the performance of the modified Biome-BGC model at the spatial scales of NPP and AET, the simulated annual mean values of NPP and AET from 2001 to 2019 were compared with remote-sensing observation data in this study.
MODIS satellite images (MOD 17A3 H v006 and MOD16 A3) with a 500 m resolution were used to obtain the AET and NPP of the study area for the period from 2001 to 2019. Image processing was conducted using ENVI 5.1 software. The modified Biome-BGC model was used to simulate the past NPP and AET and to compare them with the MODIS AET and NPP. The accuracy of the modified Biome-BGC model was assessed by the coefficient of determination (R2), mean difference (MD) and root mean square error (RMSE).
2.5. Determination of Optimal Plant Cover
The modified Biome-BGC model was used to simulate annual variations in AET, NPP, and LAI for P. simonii across 122 representative sites on the Bashang Plateau from 1980 to 2019. Due to seasonal changes in LAI, the optimal plant cover equals the average of the maximum LAI during the simulation.
2.6. Statistical Analyses
Basic statistical analyses were used to analyze the simulations of AET, NPP and LAI for each subregion and the Bashang Plateau. Pearson correlation analyses were used to assess the relationships between AET, NPP and LAI and climate (precipitation and temperature), soil texture (sand, silt and clay contents) and elevation for P. simonii. A stepwise regression analysis was used to identify the major variables that accurately predicted the maximum LAI for P. simonii. All statistical analyses were conducted using SPSS 22.0. Geostatistical analyses and maps were produced by ArcGIS 10.1.
3. Results
3.1. Model Evaluation
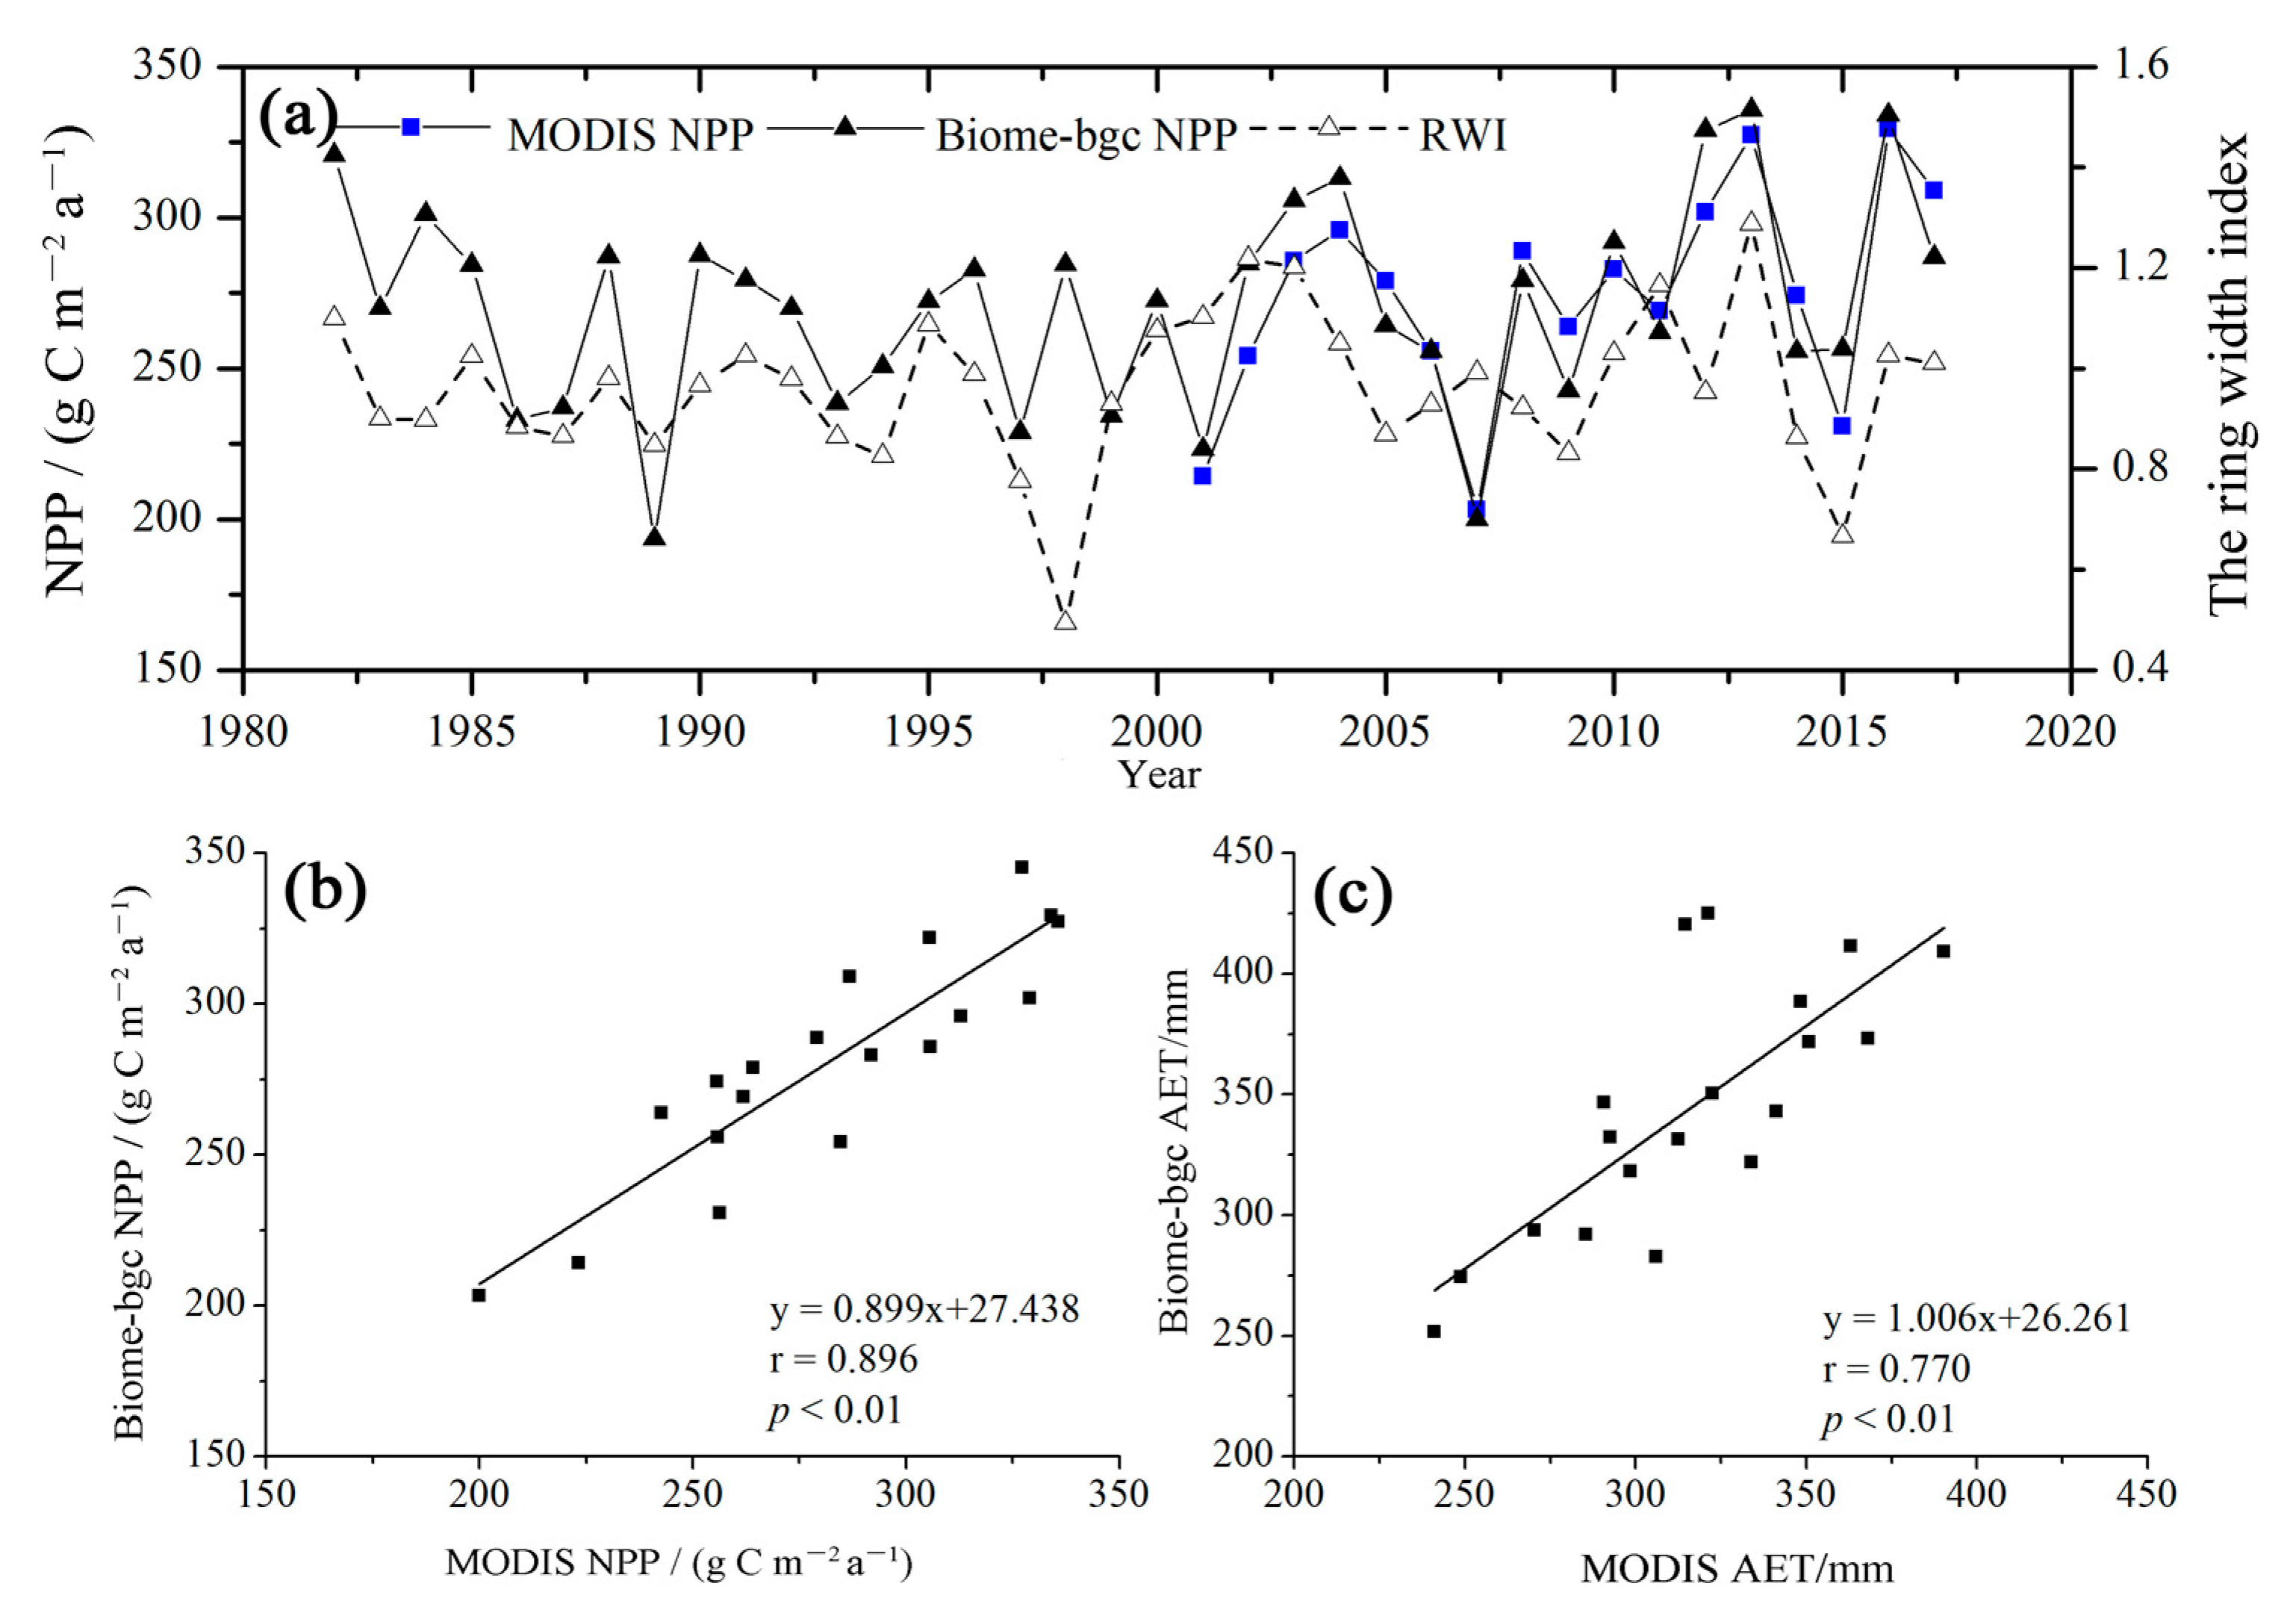
The simulated NPP values for the sample plot in Zhangbei County were consistent with the interannual variation trend in the RWI during the period of 1982–2017, except in 1998 (r = 0.40, p < 0.05) (Figure 3a), and agreed with the MODIS data during the period of 2001–2017 (r = 0.90, p < 0.01). Regardless, the values simulated by the modified Biome-BGC model were consistent with the MODIS NPP and ET data during the period of 2001–2019, and the correlations were significant (r > 0.77, p < 0.01) (Figure 3b,c). The results indicated that the temporal dynamics of NPP and AET simulated by the modified Biome-BGC model were acceptable for P. simonii.
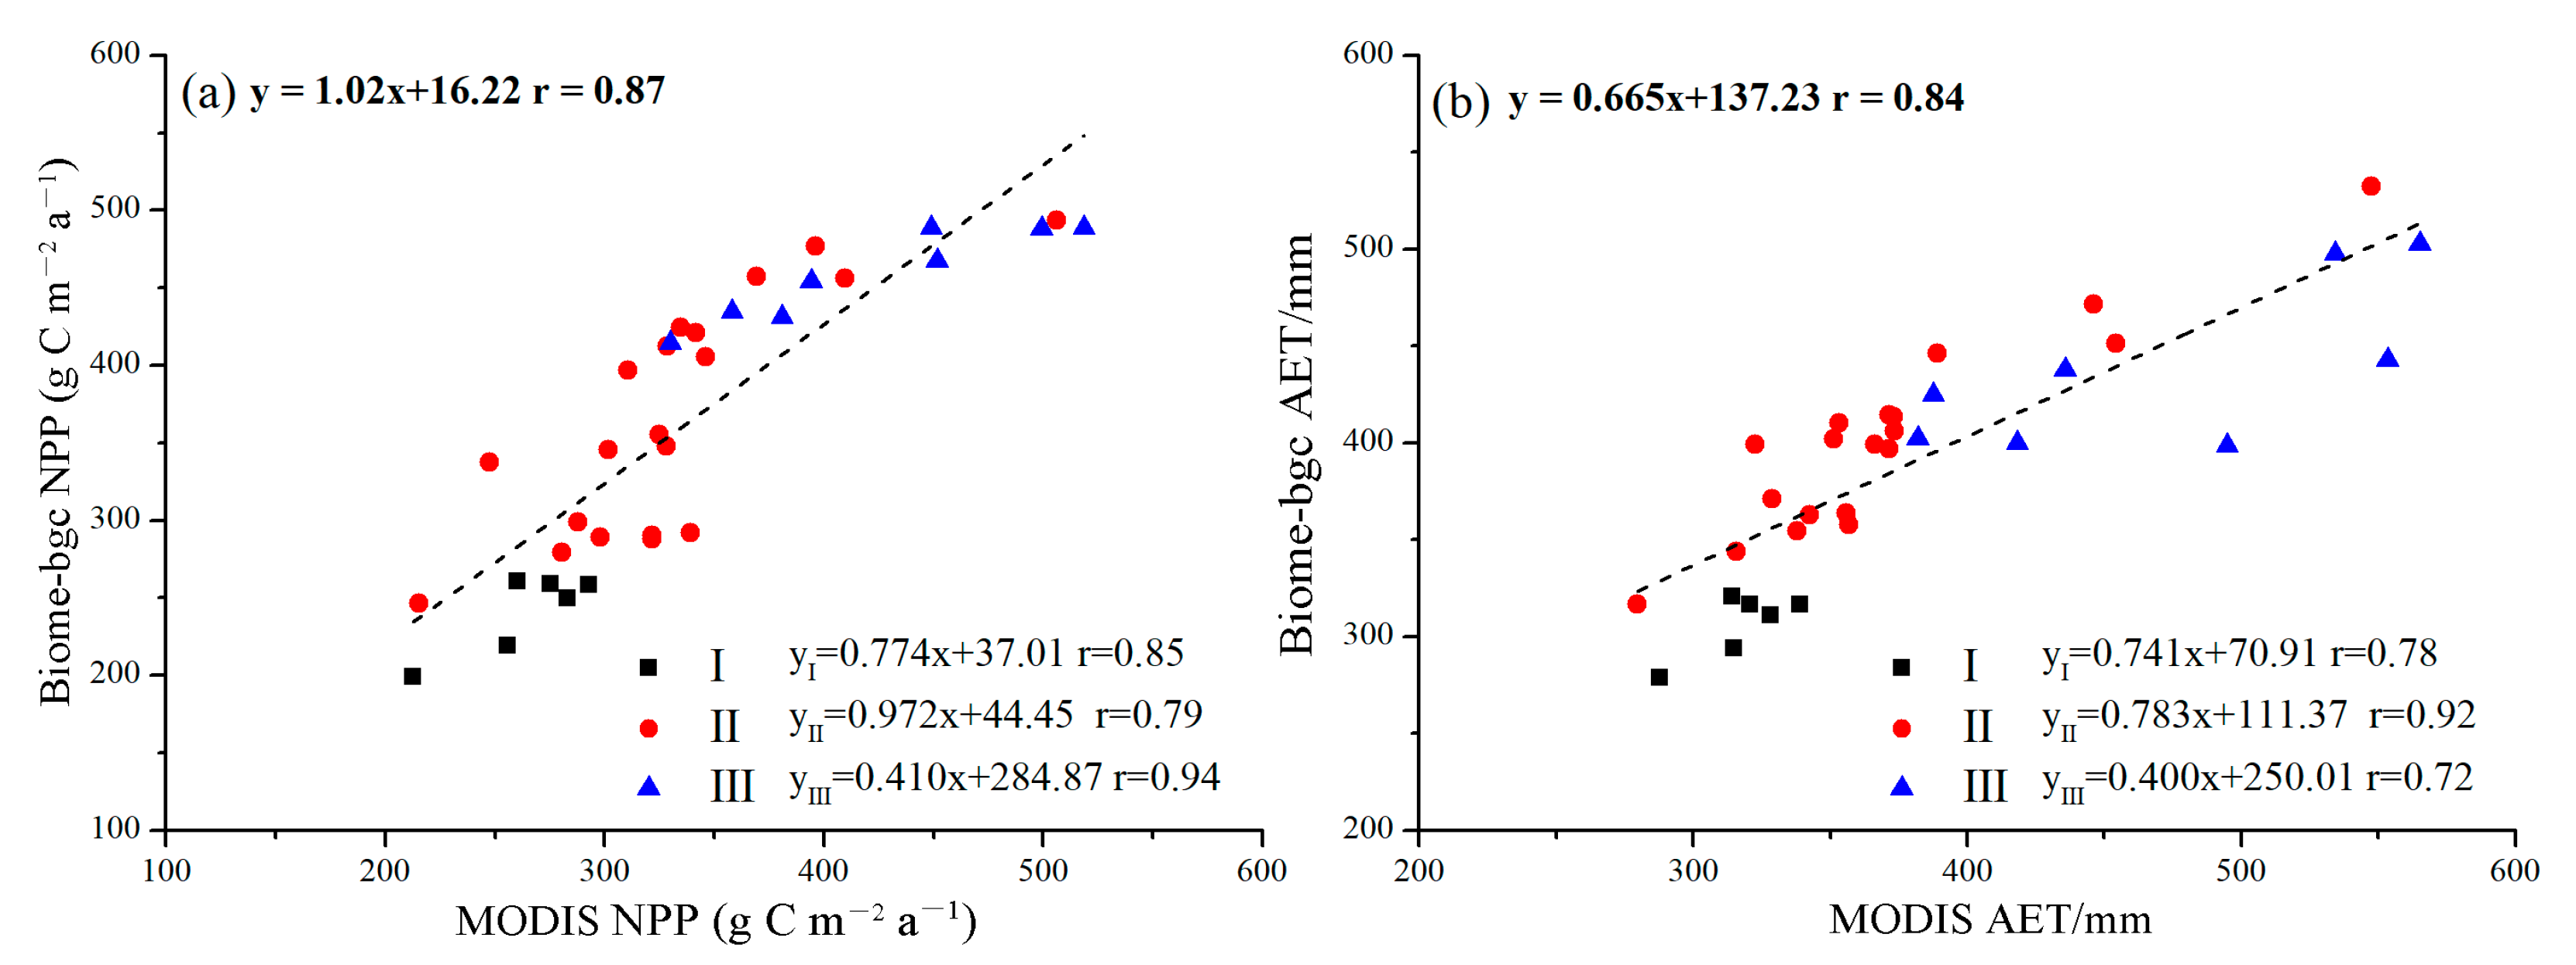
The comparisons of the annual average MODIS NPP and AET data with those simulated by the modified Biome-BGC model during the period of 2001–2019 for P. simonii at the regional scale are shown in Figure 4. In the whole Bashang Plateau, the correlations between the simulated and observed NPP and AET were >0.80, and the MD and RMSE values were low. For the three subregions, the correlations between the simulated and observed NPP and AET ranged from 0.72 to 0.94, and the MD and RMSE values were 22.53~35.51 g C m−2 a−1 and 26.29~57.34 g C m−2 a−1 for NPP, and −31.35~33.18 mm and 15.28~60.07 mm for AET, respectively (Table 3). Each subregion showed a low degree of simulated NPP and AET dispersion. The results thus indicated that the spatial dynamics of NPP and AET simulated by the modified Biome-BGC model were acceptable for P. simonii.
3.2. Spatial Distributions of AET and NPP
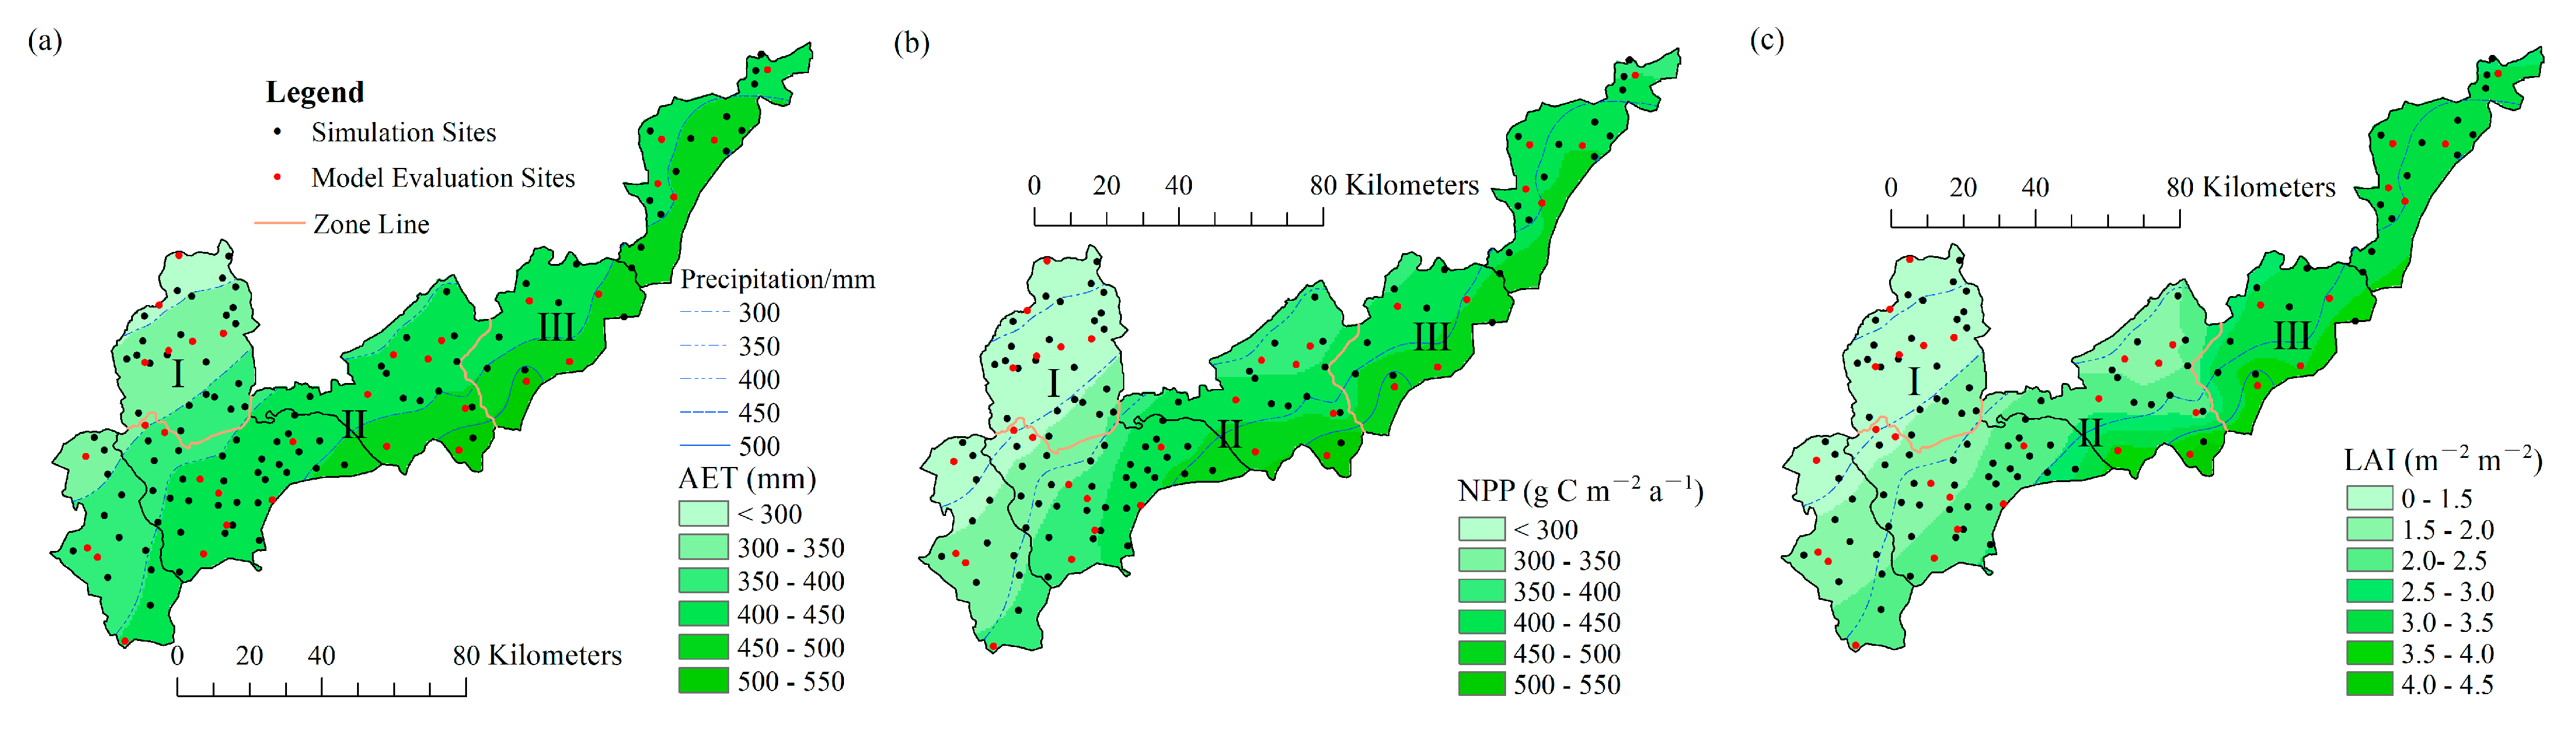
The AET and NPP were simulated by the modified Biome-BGC model using 122 representative sites across the Bashang Plateau from 1980 to 2019. The spatial distributions of the mean values of AET and NPP of P. simonii were then mapped by kriging interpolation (Figure 5a,b). The AET generally increased from the northwest to the southeast. The annual average value of the estimated AET was 398.7 mm, with a range of 283.6~532.7 mm and a spatial variation coefficient of 13.7% (Figure 5a). There were significant differences in the AET for P. simonii in different subregions, of which zone III had the highest AET (447.8 mm), and zone I had the lowest AET (323.1 mm). The AET for zone II was 408.7 mm (Table 4). The spatial pattern of the mean AET was consistent with that of the MAP.
Consistent with the mean AET, the mean NPP increased from northwest to southeast. The annual average value of the estimated NPP was 360.5 g C m−2 yr−1, with a range of 191.3~542.7 g C m−2 yr−1 and a spatial variation coefficient of 23.7% (Figure 5b). There were significant differences in NPP for P. simonii in different subregions. The highest mean NPP was 435.7 g C m−2 yr−1 in zone III, the mean NPP for zone II was 373.0 g C m−2 yr−1, and the lowest mean NPP was 251.3 g C m−2 yr−1 for zone I (Table 4).
3.3. Spatial Distribution of the LAI and Optimal Plant Cover
The spatial patterns of the mean maximum LAI of P. simonii were also mapped by kriging interpolation (Figure 5c). The optimal plant cover was calculated as the mean maximum LAI of P. simonii during the study period. In accordance with the MAP distribution, the optimal plant cover generally increased from northwest to southeast, with a range of 1.0~4.1 m2 m−2. The overall mean optimal-plant-cover value was 2.08 m2 m−2 and the spatial variation coefficient was 38.7%. The optimal plant cover varied by subregion (Table 4). It was less than 1.5 m2 m−2 in zone I with a MAP < 350 mm, and the mean value was LAI = 1.3 m2 m−2. The optimal plant cover ranged from 1.5 to 3.0 m2 m−2 in zone II with a MAP = 350~450 mm, and the mean value was LAI = 1.9 m2 m−2. The optimal plant cover was higher than 3.0 m2 m−2 in zone III with a MAP > 420 mm, and the mean value was LAI = 3.3 m2 m−2.
3.4. Mean AET, NPP and LAI Distribution Factors
Highly significant positive relationships were found between the mean AET and MAP for P. simonii on the whole Bashang Plateau and in its three subregions (r > 0.965, p < 0.01) (Table 5), suggesting that the MAP was a main influencing factor of the spatial pattern of the mean AET on the Bashang Plateau. Furthermore, the mean AET was negatively correlated with elevation (r = −0.748, p < 0.01), sand content (r = −0.714, p < 0.01) and mean annual temperature (MAT, r = −0.417, p < 0.01) on the Bashang Plateau. There were significant differences in distribution factors in different subregions. The mean AET was significantly positively correlated with the clay (r = 0.635, p < 0.01) and silt contents (r = 0.689, p < 0.01) and negatively with the sand content (r = −0.659, p < 0.01) and elevation (r = −0.390, p < 0.01) in zone I (n = 28). The mean AET was significantly correlated with elevation (r = 0.493, p < 0.01) but negatively correlated with MAT (r = −0.606, p < 0.01) in zone II (n = 68). A negative correlation was found between the mean AET and sand content (r = −0.427, p < 0.01) in zone III (n = 26). The influencing factors of the spatial variation in the NPP for P. simonii on the Bashang Plateau and its subregions were similar to those of AET except in zone III. NPP was significantly positively correlated with MAT (r = 0.413, p < 0.01) in zone III (n = 26). The influencing factors of the spatial variation in the maximum LAI in the three subregions were similar to those of the NPP. However, the maximum LAI was significantly positively correlated with silt content (r = 0.230, p < 0.01) and was negatively correlated with sand content (r = −0.550, p < 0.01), elevation (r = −0.531, p < 0.01) and MAT (r = −0.491, p < 0.01) on the Bashang Plateau (n = 122).
A stepwise regression analysis was further used to determine the relationship between the maximum LAI for P. simonii and the dominant climatic, soil and topography variables (Table 6). For the whole Bashang Plateau, the MAP, sand and silt contents explained 79.7% of the spatial variation in the maximum LAI (p < 0.01). However, for zone I with a MAP < 350 mm, the MAP and elevation explained 98.5% of the spatial variation in the maximum LAI (p < 0.01). For zone III with a MAP > 420 mm, 77.5% of the spatial variation in the maximum LAI was explained by the MAP and MAT (p < 0.01). Additionally, 78.1% of the spatial variation in the maximum LAI was explained by the MAP (p < 0.01) in zone II with a MAP = 350~450 mm.
4. Discussion
4.1. Model Validation
The performance of the modified Biome-BGC model was evaluated by comparing it with the MODIS AET and NPP on both a local scale and a regional scale. Furthermore, the RWI was used to evaluate the simulated annual NPP based on the modified Biome-BGC model. It was demonstrated that the temporal and spatial dynamics of AET and NPP for P. simonii could be rationally simulated on the Bashang Plateau. The modified Biome-BGC model could be used to calculate the LAI for P. simonii considering the strong correlations among the AET, NPP, and LAI [38,39,40,41].
The MODIS data and simulated values differed for some study sites for P. simonii, which may have been due to limitations in the observed data. For zone I and zone II, some of the study sites were shelter forests planted at equal intervals with low coverage, which may have resulted in overestimations of the plant coverage for the study sites. For zone III, relatively few sites were sampled, and the soil data required for the modified Biome-BGC model were acquired from the Harmonized World Soil Database. The RWI of P. simonii was consistent with the NPP simulated by the modified Biome-BGC model in the Zhangbei area except for some dry years. This result may be caused by the number of tree ring samplings and the differences in tree growth of P. simonii. Another limitation of the simulated values was related to the uncertainty of the eco-physiological parameters used as model inputs. Some of these parameters were taken from Kang et al. [34] rather than from measurements made under the different climate and soil conditions at the study sites, which might have led to inaccurate estimations of AET and NPP [23,42]. Regardless, based on the three metrics (MD, RMSE and R2) for the observed and simulated AET and NPP, the modified Biome-BGC model has been proven to be an appropriate tool for simulating the relationships among climate, soil, and vegetation on the Bashang Plateau.
4.2. Spatial Variations in AET and NPP and the Influencing Factors
The spatial pattern of the mean AET on the Bashang Plateau was governed by a decrease in the MAP values from the southeast toward the northwest. The Pearson correlation coefficients between the AET and MAP ranged from 0.965 to 0.998, indicating that MAP was the major factor controlling the AET in the study area. Zhang et al. [11] and Jia et al. [12] found that the long-term mean AET and MAP were well-correlated for dominant species on the Loess Plateau. Liu et al. [43] reported that precipitation was the main driver of spatiotemporal changes in AET in semiarid and arid areas of China. These results are consistent with the findings of our study. Because groundwater levels in the semiarid plateau are generally 10–11 m below the land surface, precipitation is the main source of soil water on the Bashang Plateau. A negative correlation was found between the mean AET and MAT, and the result is consistent with the study of Ma et al. [44] and Zhu et al. [45]. The reason for this result is that the AET in the study area is mainly controlled by the MAP and may also be affected by the actual sunshine duration and wind speed; therefore, the MAT has a limited influence on the AET. Additionally, the narrow range of the MAT may reduce the possibility of detecting significant variations in the AET in the study area. A positive correlation was found between the mean AET and clay content, and a negative correlation was found with the sand content. This finding is consistent with the study of Jia et al. [12]. Soil texture strongly influenced the AET [46]. This result was mainly due to the effect of soil texture on soil water storage. Khakural et al. [47] found that soil water storage was positively correlated with silt and clay contents but was negatively correlated with sand content. Fine soil texture has high water holding capacity, high available soil water and low drainage loss, and hence, a higher AET [12]. A negative correlation was found between the mean AET and elevation, indicating that elevation had a negative effect on the AET in the Bashang Plateau. This effect may be due to the fact that high elevation was correlated with a low MAT and hence a low AET [48,49].
In different subregions, the factors influencing AET distribution varied significantly. As the MAP decreased, the correlations between AET and precipitation gradually decreased. This result indicated that the influence of precipitation on the dynamic change of evapotranspiration decreased as precipitation increased. In drier areas, rainfall directly impacts water availability, thus affecting the AET. In zone I with a MAP < 350 mm, in addition to MAP, the AET was mainly affected by soil properties and elevation. This result was due to soil properties affecting soil water availability and hence affecting the AET in this area with limited precipitation [50,51]. There was no correlation between the AET and MAT because the region is drier than other regions and the water is the main limitation. For zone II with a MAP = 350~450 mm, the AET was mainly affected by the MAP, MAT and elevation but had no significant correlation with soil properties. This result may be because there was no obvious difference in soil properties in this region, and the simulation results failed to reflect the effect of soil texture on the AET. In zone III, with a MAP > 420 mm, in addition to MAP, the AET was negatively correlated with sand content. Sand content affected the AET by affecting the soil water holding capacity [52]. There was no correlation between the AET and MAT because the elevation in this region is relatively higher and no obvious differences exist. The influencing factors of the spatial variation in the NPP on the Bashang Plateau and in in zone I and zone II were similar to those of the AET. There was a strong correlation between the NPP and AET [53,54]. However, in zone III, a semi-humid region, the NPP was positively correlated with MAP and MAT but not significantly correlated with soil properties. The increase in temperature was conducive to P. simonii growth in zone III due to the low temperature. This finding is consistent with the studies of Cui et al. [55] and Chen et al. [56]. The temperature produced a greater effect on the NPP in humid regions than in arid regions.
4.3. Optimal Plant Cover and the Influencing Factors
The LAI for P. simonii was simulated by considering variations in the long-term climatic conditions throughout the period of 1980–2019. The optimal maximum LAI in the study area indicated that the plant-cover ranges were LAI = 1.3 for Kangbao, LAI = 1.9 for Shangyi–Zhangbei–Guyuan and LAI = 3.3 for Fengning–Weichang. The simulated values for P. simonii were within the LAI range of 0–6.2 with a mean of 2.14 given by Zhu [57] for vegetation on the Bashang Plateau. The optimal plant cover (expressed by the maximum LAI) was similar to that given by Jia et al. [12], with an LAI = 1.1–3.5 for deciduous broadleaf forests on China’s Loess Plateau. This is because parts of the Loess Plateau and Bashang region of Hebei Province are located in China’s agro-pastoral transitional zone and have similar climate and soil conditions.
The optimal-plant-cover variation showed significant regional differences in the study area. The maximum LAI for P. simonii indicated that the optimal plant cover with the lowest values was distributed in the west and higher values were distributed in the east of the Bashang Plateau. Precipitation was the key factor controlling the annual maximum LAI for P. simonii in the Bashang Plateau. Zhao et al. [58] reported that the precipitation gradient is the most important driver of LAI. As the MAP decreased, the correlations between the LAI and precipitation gradually decreased. Precipitation has a greater impact on soil water availability in drier regions, which indirectly affects plant growth [59]. In addition to precipitation, sand and silt contents were the main factors affecting the maximum LAI spatial distribution in the study area. This finding is consistent with the study of Jia et al. [12]. Coarse-textured soils have low water-holding capacity, high drainage loss and low soil water storage for plant growth. However, there is a lower moisture limit for plant growth on a medium-textured soil due to its water-retention characteristics [46,60].
The major factors influencing spatial distribution of optimal plant cover showed significant regional differences in the study area. In addition to the MAP, the mean maximum LAI of P. simonii in zone I was highly influenced by elevation, as it modulated the climate and/or water availability in this area with low precipitation and temperature levels. This result is consistent with the report of Jia et al. [12]. The maximum LAI was strongly affected by precipitation in zone II. The spatial variation in the mean maximum LAI was strongly correlated with temperature for P. simonii in zone III since the precipitation resources could satisfy P. simonii growth and the temperature was relatively low in this area. Similar to our findings, Kong et al. [61] found that the influence of temperature on vegetation variation in high latitude or mountainous regions was strong. According to the above results, the MAP, MAT, soil texture, and elevation are reliable indicators of the optimal plant cover of P. simonii in the Bashang Plateau.
4.4. Implications for Afforestation and Forest Management
Increasing vegetation cover is one of the most effective methods of countering land degradation. Introduced species such as P. simonii were widely planted mainly because they grow faster than native tree species and provide sand-fixation functions within a short period of time. Zhang et al. [19] found that at a P. simonii stand age of 40 years, the near-surface wind speed is reduced by more than 80%, while the surface coverage exceeds 70% and the wind erosion volume is nearly zero. Previous studies also found that planting P. simonii could improve soil conditions and the microclimate [62,63]. The P. simonii, however, is a species with high water consumption [64], and excessive planting of P. simonii increases the soil water deficit, consequently resulting in poor plant growth. As a result, an optimal plant cover is vital to maintain water balance and vegetation sustainability. In this study, the optimal plant cover for P. simonii was determined by the modified Biome-BGC model in the Bashang Plateau. Recent studies have shown that artificial mixed forests reasonably utilize forest resources and play a certain role in promoting nutrient accumulation compared with artificial pure forests. In this study, however, we considered the optimal plant cover of P. simonii pure forests because of the limitations of the model mechanism. Our research on the optimal plant cover of mixed forests will be strengthened in the future.
5. Conclusions
In this study, the AET, NPP and maximum LAI dynamics of P. simonii were simulated by the modified Biome-BGC model in the Bashang Plateau. The spatial distributions of optimal plant cover were determined by the maximum LAI. Model simulations confirmed the following scientific hypotheses of the present study: (1) The optimal plant cover for P. simonii was spatial heterogeneity on the Bashang Plateau. In general, the spatial distributions of the mean AET, NPP and maximum LAI increased from northwest to southeast. The optimal plant cover for P. simonii was 3.3 in the Fengning–Weichang area (MAP > 420 mm), 1.9 in the Shangyi–Zhangbei–Guyuan area (350 mm < MAP < 450 mm) and 1.3 in the Kangbao area (MAP < 350 mm). The MAP, elevation, soil texture and MAT were the main factors influencing the AET, NPP and maximum LAI. (2) The factors influencing the spatial distributions of the mean AET, NPP and maximum LAI were different for each subregion. For all subregions, the spatial variations in AET, NPP, and maximum LAI were primarily affected by precipitation. As the MAP decreased, the correlations between the AET, NPP, LAI and precipitation gradually decreased. In addition to precipitation, soil texture and elevation were the main influencing factors for the AET, NPP and LAI of P. simonii in zone I. Elevation was the main influencing factor for the AET, NPP and LAI of P. simonii in zone II. MAT was the main influencing factor for the NPP and LAI of P. simonii, while sand content was the main influencing factor for the AET of P. simonii in zone III. These quantitative results indicating optimal plant cover and influencing factors for different subregions on the Bashang Plateau could provide important guidance for non-native vegetation restoration.
Author Contributions
Conceptualization, Y.Z.; methodology, Y.Z. and W.L.; data curation, F.S., S.L. and B.X.; Supervision, J.Z.; Writing—original draft, Y.Z.; Writing—review & editing, Y.Z. and W.L. All authors have read and agreed to the published version of the manuscript.
Funding
This research was funded by the National Natural Science Foundation of China (No. 42101019, 42001027), Natural Science Foundation of Hebei Province (D2019205274, D2019403115), Science and Technology Project of Hebei Education Department (QN2019152), Key Laboratory of Agricultural Water Resources & Hebei Key Laboratory of Agricultural Water-Saving, Center for Agricultural Resources Research, Institute of Genetics and Developmental Biology (KFKT201903), Science and Technology Project of Hebei Education Department (BJK2022022, BJK2022031).
Conflicts of Interest
The authors declare no conflict of interest.
References
- Chen, L.; He, Z.; Zhu, X.; Du, J.; Yang, J.; Li, J. Impacts of afforestation on plant diversity, soil properties, and soil organic carbon storage in a semi-arid grassland of northwestern China. Catena 2016, 147, 300–307. [Google Scholar] [CrossRef]
- Liu, B.; Zhang, L.; Lu, F.; Deng, L.; Zhao, H.; Luo, Y.; Liu, X.; Zhang, K.; Wang, X.; Liu, W. Greenhouse gas emissions and net carbon sequestration of the Beijing-Tianjin sand source control project in China. J. Clean. Prod. 2019, 225, 163–172. [Google Scholar] [CrossRef]
- West, T.A.; Monge, J.J.; Dowling, L.J.; Wakelin, S.J.; Gibbs, H.K. Promotion of afforestation in New Zealand’s marginal agricultural lands through payments for environmental services. Ecosyst. Serv. 2020, 46, 101212. [Google Scholar] [CrossRef]
- Feng, X.; Sun, G.; Fu, B.; Su, C.; Liu, Y.; Lamparski, H. Regional effects of vegetation restoration on water yield across the Loess Plateau, China. Hydrol. Earth Syst. Sci. 2012, 16, 2617–2628. [Google Scholar] [CrossRef]
- Lu, C.; Zhao, T.; Shi, X.; Cao, S. Ecological restoration by afforestation may increase groundwater depth and create potentially large ecological and water opportunity costs in arid and semiarid China. J. Clean. Prod. 2018, 176, 1213–1222. [Google Scholar] [CrossRef]
- Xiao, Y.; Xiao, Q.; Sun, X. Ecological risks arising from the impact of large-scale afforestation on the regional water supply balance in southwest China. Sci. Rep. 2020, 10, 4150. [Google Scholar] [CrossRef]
- Zhang, S.; Yang, D.; Yang, Y.; Piao, S.; Yang, H.; Lei, H.; Fu, B. Excessive afforestation and soil drying on China’s Loess Plateau. J. Geophys. Res. Biogeosci. 2018, 123, 923–935. [Google Scholar] [CrossRef]
- Mo, K.; Cong, Z.; Lei, H. Optimal vegetation cover in the Horqin Sands, China. Ecohydrology 2016, 9, 700–711. [Google Scholar] [CrossRef]
- Fu, W.; Huang, M.; Gallichand, J.; Shao, M. Optimization of plant coverage in relation to water balance in the Loess Plateau of China. Geoderma 2012, 173–174, 134–144. [Google Scholar] [CrossRef]
- Xia, Y.; Shao, M. Soil water carrying capacity for vegetation: A hydrologic and biogeochemical process model solution. Ecol. Model. 2008, 214, 112–124. [Google Scholar] [CrossRef]
- Zhang, Y.; Huang, M.; Lian, J. Spatial distributions of optimal plant coverage for the dominant tree and shrub species along a precipitation gradient on the central Loess Plateau. Agric. For. Meteorol. 2015, 206, 69–84. [Google Scholar] [CrossRef]
- Jia, X.; Shao, M.; Yu, D.; Zhang, Y.; Binley, A. Spatial variations in soil-water carrying capacity of three typical revegetation species on the Loess Plateau, China. Agr. Ecosyst. Environ. 2019, 273, 25–35. [Google Scholar] [CrossRef]
- Cong, Z.; Li, Q.; Mo, K.; Zhang, L.; Shen, H. Ecohydrological optimality in the northeast China transect. Hydrol. Earth Syst. Sci. 2017, 21, 2449–2462. [Google Scholar] [CrossRef]
- Chu, X.; Deng, X.; Jin, G.; Wang, Z.; Li, Z. Ecological security assessment based on ecological footprint approach in Beijing-Tianjin-Hebei region, China. Phys. Chem. Earth Parts A/B/C 2017, 101, 43–51. [Google Scholar] [CrossRef]
- Wang, H.; Sun, B.; Yu, X.; Xin, Z.; Jia, G. The driver-pattern-effect connection of vegetation dynamics in the transition area between semi-arid and semi-humid northern China. Catena 2020, 194, 104713. [Google Scholar] [CrossRef]
- Cao, S.; Ma, H.; Yuan, W.; Wang, X. Interaction of ecological and social factors affects vegetation recovery in China. Biol. Conserv. 2014, 180, 270–277. [Google Scholar] [CrossRef]
- Duan, H.; Yan, C.; Tsunekawa, A.; Song, X.; Li, S.; Xie, J. Assessing vegetation dynamics in the three-north shelter forest region of China using AVHRR NDVI data. Environ. Earth Sci. 2011, 64, 1011–1020. [Google Scholar] [CrossRef]
- Niu, Q.; Xiao, X.; Zhang, Y.; Qin, Y.; Dang, X.; Wang, J.; Zou, Z.; Doughty, R.B.; Brandt, M.; Tong, X. Ecological engineering projects increased vegetation cover, production, and biomass in semiarid and subhumid Northern China. Land Degrad. Dev. 2019, 30, 1620–1631. [Google Scholar] [CrossRef]
- Zhang, J.; Jia, G.; Liu, Z.; Wang, D.; Yu, X. Populus simonii carr. Reduces wind erosion and improves soil properties in Northern China. Forests 2019, 10, 315. [Google Scholar] [CrossRef]
- Lu, W.; Yu, X.; Jia, G. Retrospective analysis of tree decline based on intrinsic water-use efficiency in semi-arid areas of north China. Atmosphere 2020, 11, 577. [Google Scholar] [CrossRef]
- Sevanto, S.; Mcdowell, N.G.; Dickman, L.T.; Pangle, R.; Pockman, W.T. How do trees die? A test of the hydraulic failure and carbon starvation hypotheses. Plant Cell Environ. 2014, 37, 153–161. [Google Scholar] [CrossRef] [PubMed]
- Zou, Y.; Sang, W.; Wang, S.; Warren-Thomas, E.; Liu, Y.; Yu, Z.; Wang, C.; Axmacher, J.C. Diversity patterns of ground beetles and understory vegetation in mature, secondary, and plantation forest regions of temperate northern China. Ecol. Evol. 2015, 5, 531–542. [Google Scholar] [CrossRef]
- White, M.A.; Thornton, P.E.; Running, S.W.; Nemani, R.R. Parameterization and sensitivity analysis of the biome–bgc terrestrial ecosystem model: Net primary production controls. Earth Interact. 2000, 4, 1–85. [Google Scholar] [CrossRef]
- Thornton, P.E.; Law, B.E.; Gholz, H.L.; Clark, K.L.; Falge, E.; Ellsworth, D.S.; Goldstein, A.H.; Monson, R.K.; Hollinger, D.; Falk, M. Modeling and measuring the effects of disturbance history and climate on carbon and water budgets in evergreen needleleaf forests. Agric. For. Meteorol. 2002, 113, 185–222. [Google Scholar] [CrossRef]
- Kimball, J.S.; Thornton, P.E.; White, M.A.; Running, S.W. Simulating forest productivity and surface–atmosphere carbon exchange in the boreas study region. Tree Physiol. 1997, 17, 589–599. [Google Scholar] [CrossRef] [PubMed]
- Running, S.W.; Gower, S.T. FOREST-BGC, a general model of forest ecosystem processes for regional applications. II. Dynamic carbon allocation and nitrogen budgets. Tree Physiol. 1991, 9, 147–160. [Google Scholar] [CrossRef] [PubMed]
- Huang, M.; Zettl, J.D.; Barbour, S.L.; Elshorbagy, A.; Si, B.C. The impact of soil moisture availability on forest growth indices for variably layered coarse-textured soils. Ecohydrology 2013, 6, 214–227. [Google Scholar] [CrossRef]
- Biome-Bgc Flow. Available online: http://www.ntsg.umt.edu/project/biome-bgc.php (accessed on 17 May 2022).
- Klute, A.; Dirksen, C. Hydraulic conductivity of saturated soils. In Methods of Soil Analysis; ASA and SSSA Madison; Soil Science Society of America: Madison, WI, USA, 1986; pp. 694–700. [Google Scholar]
- Huang, M.; Fredlund, D.; Fredlund, M. Comparison of measured and ptf predictions of SWCCs for loess soils in China. Geotech. Geol. Eng. 2010, 28, 105–117. [Google Scholar] [CrossRef]
- Chen, L.; Chen, Z.; Jia, G.; Zhou, J.; Zhao, J.; Zhang, Z. Influences of forest cover on soil freeze-thaw dynamics and greenhouse gas emissions through the regulation of snow regimes: A comparison study of the farmland and forest plantation. Sci. Total Environ. 2020, 726, 138403. [Google Scholar] [CrossRef] [PubMed]
- Liu, Z.; Jia, G.; Yu, X. Variation of water uptake in degradation agroforestry shelterbelts on the North China Plain. Agric. Ecosyst. Environ. 2020, 287, 106697. [Google Scholar] [CrossRef]
- Liu, X.; Jia, G.; Yu, X. Study on water conservation function of poplar plantation with different densities. Environ. Sci. Technol. 2017, 40, 8–13. [Google Scholar]
- Kang, M.; Zhu, L.; Xu, H.; Zha, T.; Zhang, Z. Modelling the responses of carbon and water fluxes with climate change for a poplar plantation in northern China based on the biome-bgc model. Acta Ecol. Sin 2019, 39, 2378–2390. [Google Scholar]
- Liu, Z.; Yu, X.; Jia, G.; Zhang, J.; Zhang, Z. Water consumption by an agroecosystem with shelter forests of corn and Populus in the North China Plain. Agric. Ecosyst. Environ. 2018, 265, 178–189. [Google Scholar] [CrossRef]
- Ouyang, S.; Wang, X.; Wu, Y.; Jianxin Sun, O. Contrasting responses of net primary productivity to inter-annual variability and changes of climate among three forest types in northern China. J. Plant Ecol. 2014, 7, 309–320. [Google Scholar] [CrossRef]
- Liu, Y.; Xin, Z.; Li, Z.; Keyimu, M. Climate effect on the radial tree growth of Populus simonii in northwest of Hebei for last four decades. Acta Ecol. Sin 2020, 40, 9108–9119. [Google Scholar]
- Kushida, K.; Isaev, A.P.; Maximov, T.C.; Takao, G.; Fukuda, M. Remote sensing of upper canopy leaf area index and forest floor vegetation cover as indicators of net primary productivity in a Siberian larch forest. J. Geophys. Res. Biogeosci. 2007, 112. [Google Scholar] [CrossRef]
- Sun, G.; Alstad, K.; Chen, J.; Chen, S.; Ford, C.R.; Lin, G.; Liu, C.; Lu, N.; McNulty, S.G.; Miao, H. A general predictive model for estimating monthly ecosystem evapotranspiration. Ecohydrology 2011, 4, 245–255. [Google Scholar] [CrossRef]
- Ringgaard, R.; Herbst, M.; Friborg, T.; Schelde, K.; Thomsen, A.G.; Soegaard, H. Energy fluxes above three disparate surfaces in a temperate mesoscale coastal catchment. Vadose Zone J. 2011, 10, 54–66. [Google Scholar] [CrossRef]
- Zhao, W.; Tan, W.; Li, S. High leaf area index inhibits net primary production in global temperate forest ecosystems. Environ. Sci. Pollut. Res. 2021, 28, 22602–22611. [Google Scholar] [CrossRef]
- Cao, Y.; Zhang, P.; Chen, Y. Soil C: N: P stoichiometry in plantations of N-fixing black locust and indigenous pine, and secondary oak forests in northwest China. J. Soils Sed. 2018, 18, 1478–1489. [Google Scholar] [CrossRef]
- Liu, J.; Jia, B.; Xie, Z.; Shi, C. Ensemble simulation of land evapotranspiration in China based on a multi-forcing and multi-model approach. AdAtS 2016, 33, 673–684. [Google Scholar] [CrossRef]
- Ma, X.; Zhang, M.; Li, Y.; Wang, S.; Ma, Q.; Liu, W. Decreasing potential evapotranspiration in the Huanghe River Watershed in climate warming during 1960–2010. J. Geogr. Sci. 2012, 22, 977–988. [Google Scholar] [CrossRef]
- Zhu, G.; He, Y.; Pu, T.; Wang, X.; Jia, W.; Li, Z.; Xin, H. Spatial distribution and temporal trends in potential evapotranspiration over Hengduan Mountains region from 1960 to 2009. J. Geogr. Sci. 2012, 22, 71–85. [Google Scholar] [CrossRef]
- Nosetto, M.D.; Jobbágy, E.G.; Paruelo, J.M. Land-use change and water losses: The case of grassland afforestation across a soil textural gradient in central Argentina. Glob. Chang. Biol. 2005, 11, 1101–1117. [Google Scholar] [CrossRef]
- Khakural, B.; Robert, P.; Hugins, D. Use of non-contacting electromagnetic inductive method for estimating soil moisture across a landscape. Commun. Soil Sci. Plan. 1998, 29, 2055–2065. [Google Scholar] [CrossRef]
- Tague, C.; Peng, H. The sensitivity of forest water use to the timing of precipitation and snowmelt recharge in the California Sierra: Implications for a warming climate. J. Geophys. Res.-Biogeo. 2013, 118, 875–887. [Google Scholar] [CrossRef]
- Kane, V.R.; Lutz, J.A.; Cansler, C.A.; Povak, N.A.; Churchill, D.J.; Smith, D.F.; Kane, J.T.; North, M.P. Water balance and topography predict fire and forest structure patterns. Forest Ecol. Manag. 2015, 338, 1–13. [Google Scholar] [CrossRef]
- Lutz, J.A.; Van Wagtendonk, J.W.; Franklin, J.F. Climatic water deficit, tree species ranges, and climate change in Yosemite National Park. J. Biogeogr. 2010, 37, 936–950. [Google Scholar] [CrossRef]
- Akuraju, V.R.; Ryu, D.; George, B.; Ryu, Y.; Dassanayake, K. Seasonal and inter-annual variability of soil moisture stress function in dryland wheat field, Australia. Agr. Forest Meteorol. 2017, 232, 489–499. [Google Scholar] [CrossRef]
- Warter, M.M.; Singer, M.B.; Cuthbert, M.O.; Roberts, D.; Caylor, K.K.; Sabathier, R.; Stella, J. Drought onset and propagation into soil moisture and grassland vegetation responses during the 2012–2019 major drought in Southern California. Hydrol. Earth Syst. Sci. 2021, 25, 3713–3729. [Google Scholar] [CrossRef]
- Pan, L.; Xiao, W.; Tang, W.; Lei, J.; Shi, Y.; Huang, Z.; Zeng, L.; Pang, H. Simulation of the climatic productivity of forest vegetation in Three Gorges Reservoir area. Acta Ecol. Sin 2014, 34, 3064–3070. [Google Scholar]
- Luck, G.W.; Smallbone, L.; McDonald, S.; Duffy, D. What drives the positive correlation between human population density and bird species richness in Australia? Glob. Ecol. Biogeogr. 2010, 19, 673–683. [Google Scholar] [CrossRef]
- Chen, S.; Guo, B.; Zhang, R.; Zang, W.; Wei, C.; Wu, H.; Yang, X.; Zhen, X.; Li, X.; Zhang, D. Quantitatively determine the dominant driving factors of the spatial—temporal changes of vegetation NPP in the Hengduan Mountain area during 2000–2015. J. Mt. Sci.-Engl. 2021, 18, 427–445. [Google Scholar] [CrossRef]
- Cui, J.; Wang, Y.; Zhou, T.; Jiang, L.; Qi, Q. Temperature mediates the dynamic of MODIS NPP in alpine grassland on the Tibetan Plateau, 2001–2019. Remote Sens.-Basel. 2022, 14, 2401. [Google Scholar] [CrossRef]
- Zhu, X. Forest vegetation changes and ecological functions in the Bashang Plateau and the mountainous area of northern north China. Thesis, Beijing Forestry University, Beijing, China, 2020. [Google Scholar]
- Zhao, N.; Yang, Y.; Zhou, X. Application of geographically weighted regression in estimating the effect of climate and site conditions on vegetation distribution in Haihe catchment, China. Plant Ecol. 2010, 209, 349–359. [Google Scholar] [CrossRef]
- Prince, S.D.; De Colstoun, E.B.; Kravitz, L. Evidence from rain-use efficiencies does not indicate extensive Sahelian desertification. Glob. Chang. Biol. 1998, 4, 359–374. [Google Scholar] [CrossRef]
- Fensham, R.J.; Butler, D.W.; Foley, J. How does clay constrain woody biomass in drylands? Glob. Ecol. Biogeogr. 2015, 24, 950–958. [Google Scholar] [CrossRef]
- Kong, D.; Miao, C.; Borthwick, A.G.; Lei, X.; Li, H. Spatiotemporal variations in vegetation cover on the Loess Plateau, China, between 1982 and 2013: Possible causes and potential impacts. Environ. Sci. Pollut. R. 2018, 25, 13633–13644. [Google Scholar] [CrossRef]
- Li, G.; Qu, J.; Han, Q.; Fang, H.; Wang, W. Responses of three typical plants to wind erosion in the shrub belts atop Mogao Grottoes, China. Ecol. Eng. 2013, 57, 293–296. [Google Scholar] [CrossRef]
- Zuo, X.; Zhao, X.; Zhao, H.; Zhang, T.; Guo, Y.; Li, Y.; Huang, Y. Spatial heterogeneity of soil properties and vegetation–soil relationships following vegetation restoration of mobile dunes in Horqin Sandy Land, Northern China. Plant Soil 2009, 318, 153–167. [Google Scholar] [CrossRef]
- Sun, S.; Qiu, L.; He, C.; Li, C.; Zhang, J.; Meng, P. Drought-affected Populus simonii carr. Show lower growth and long-term increases in intrinsic water-use efficiency prior to tree mortality. Forests 2018, 9, 564. [Google Scholar] [CrossRef]
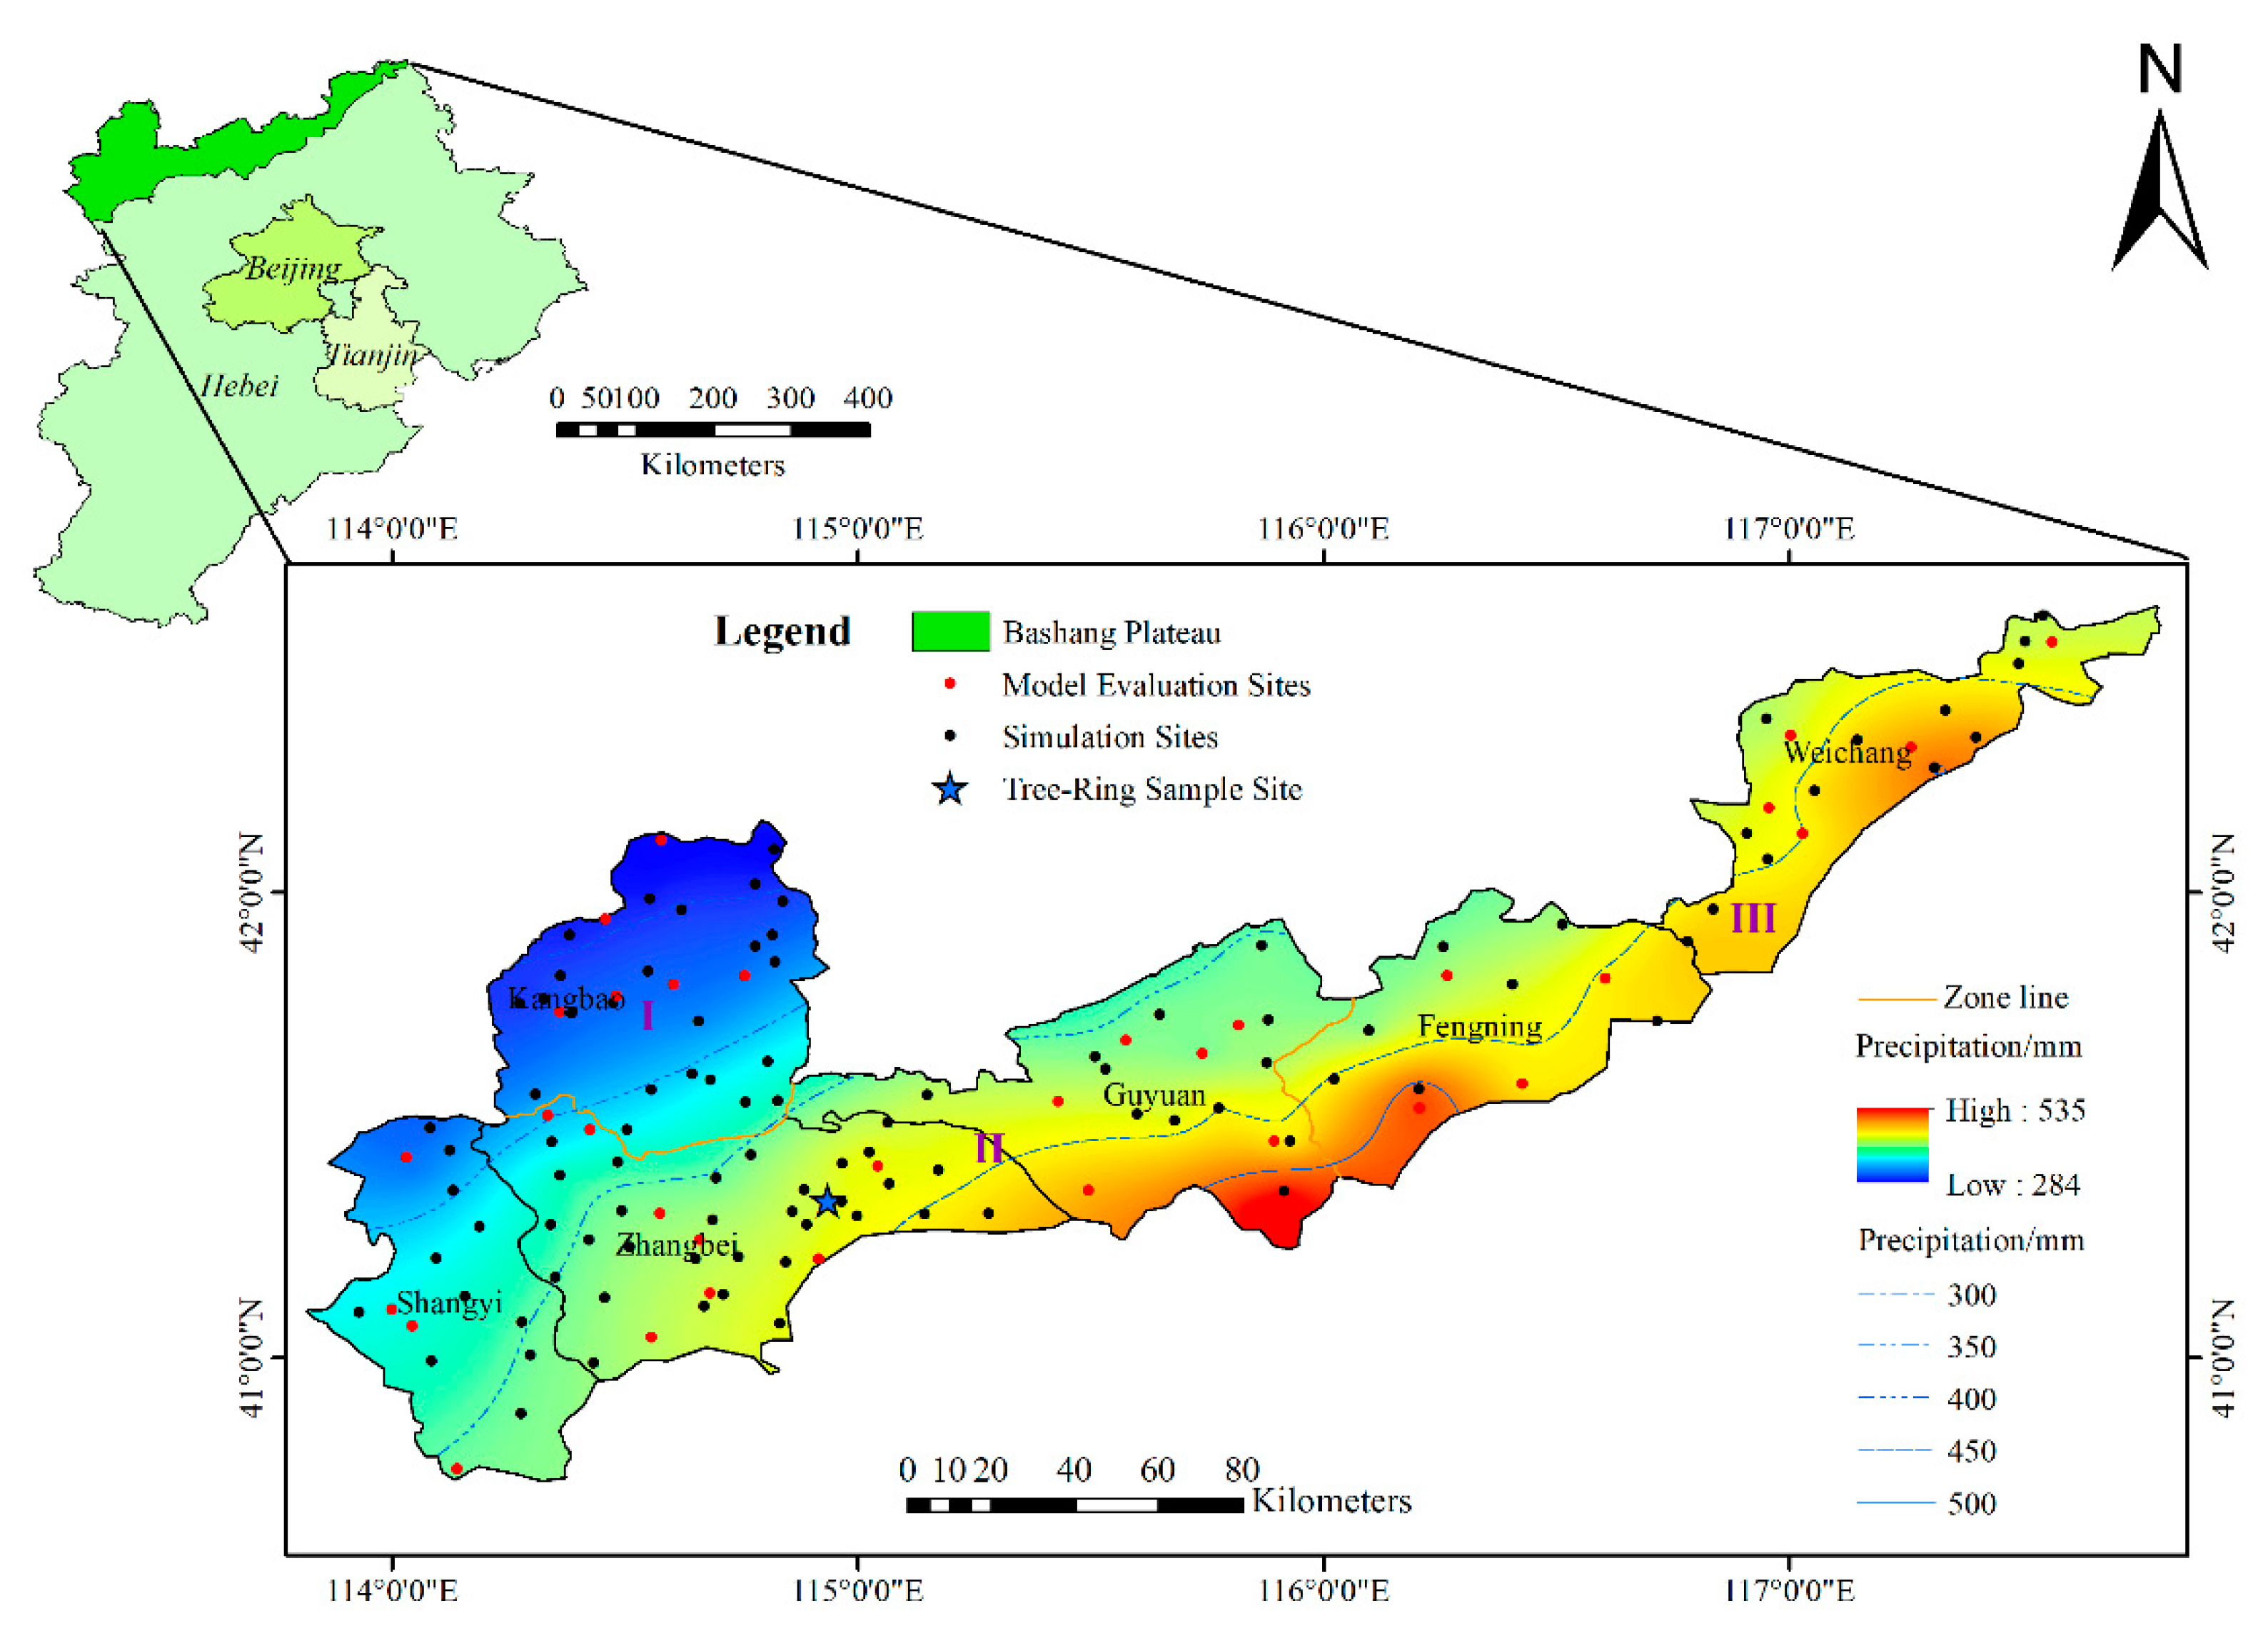
Figure 1.
The location of the study area and the distributions of the 34 model evaluation sites, 122 simulation sites and precipitation contours in the region.
Figure 1.
The location of the study area and the distributions of the 34 model evaluation sites, 122 simulation sites and precipitation contours in the region.

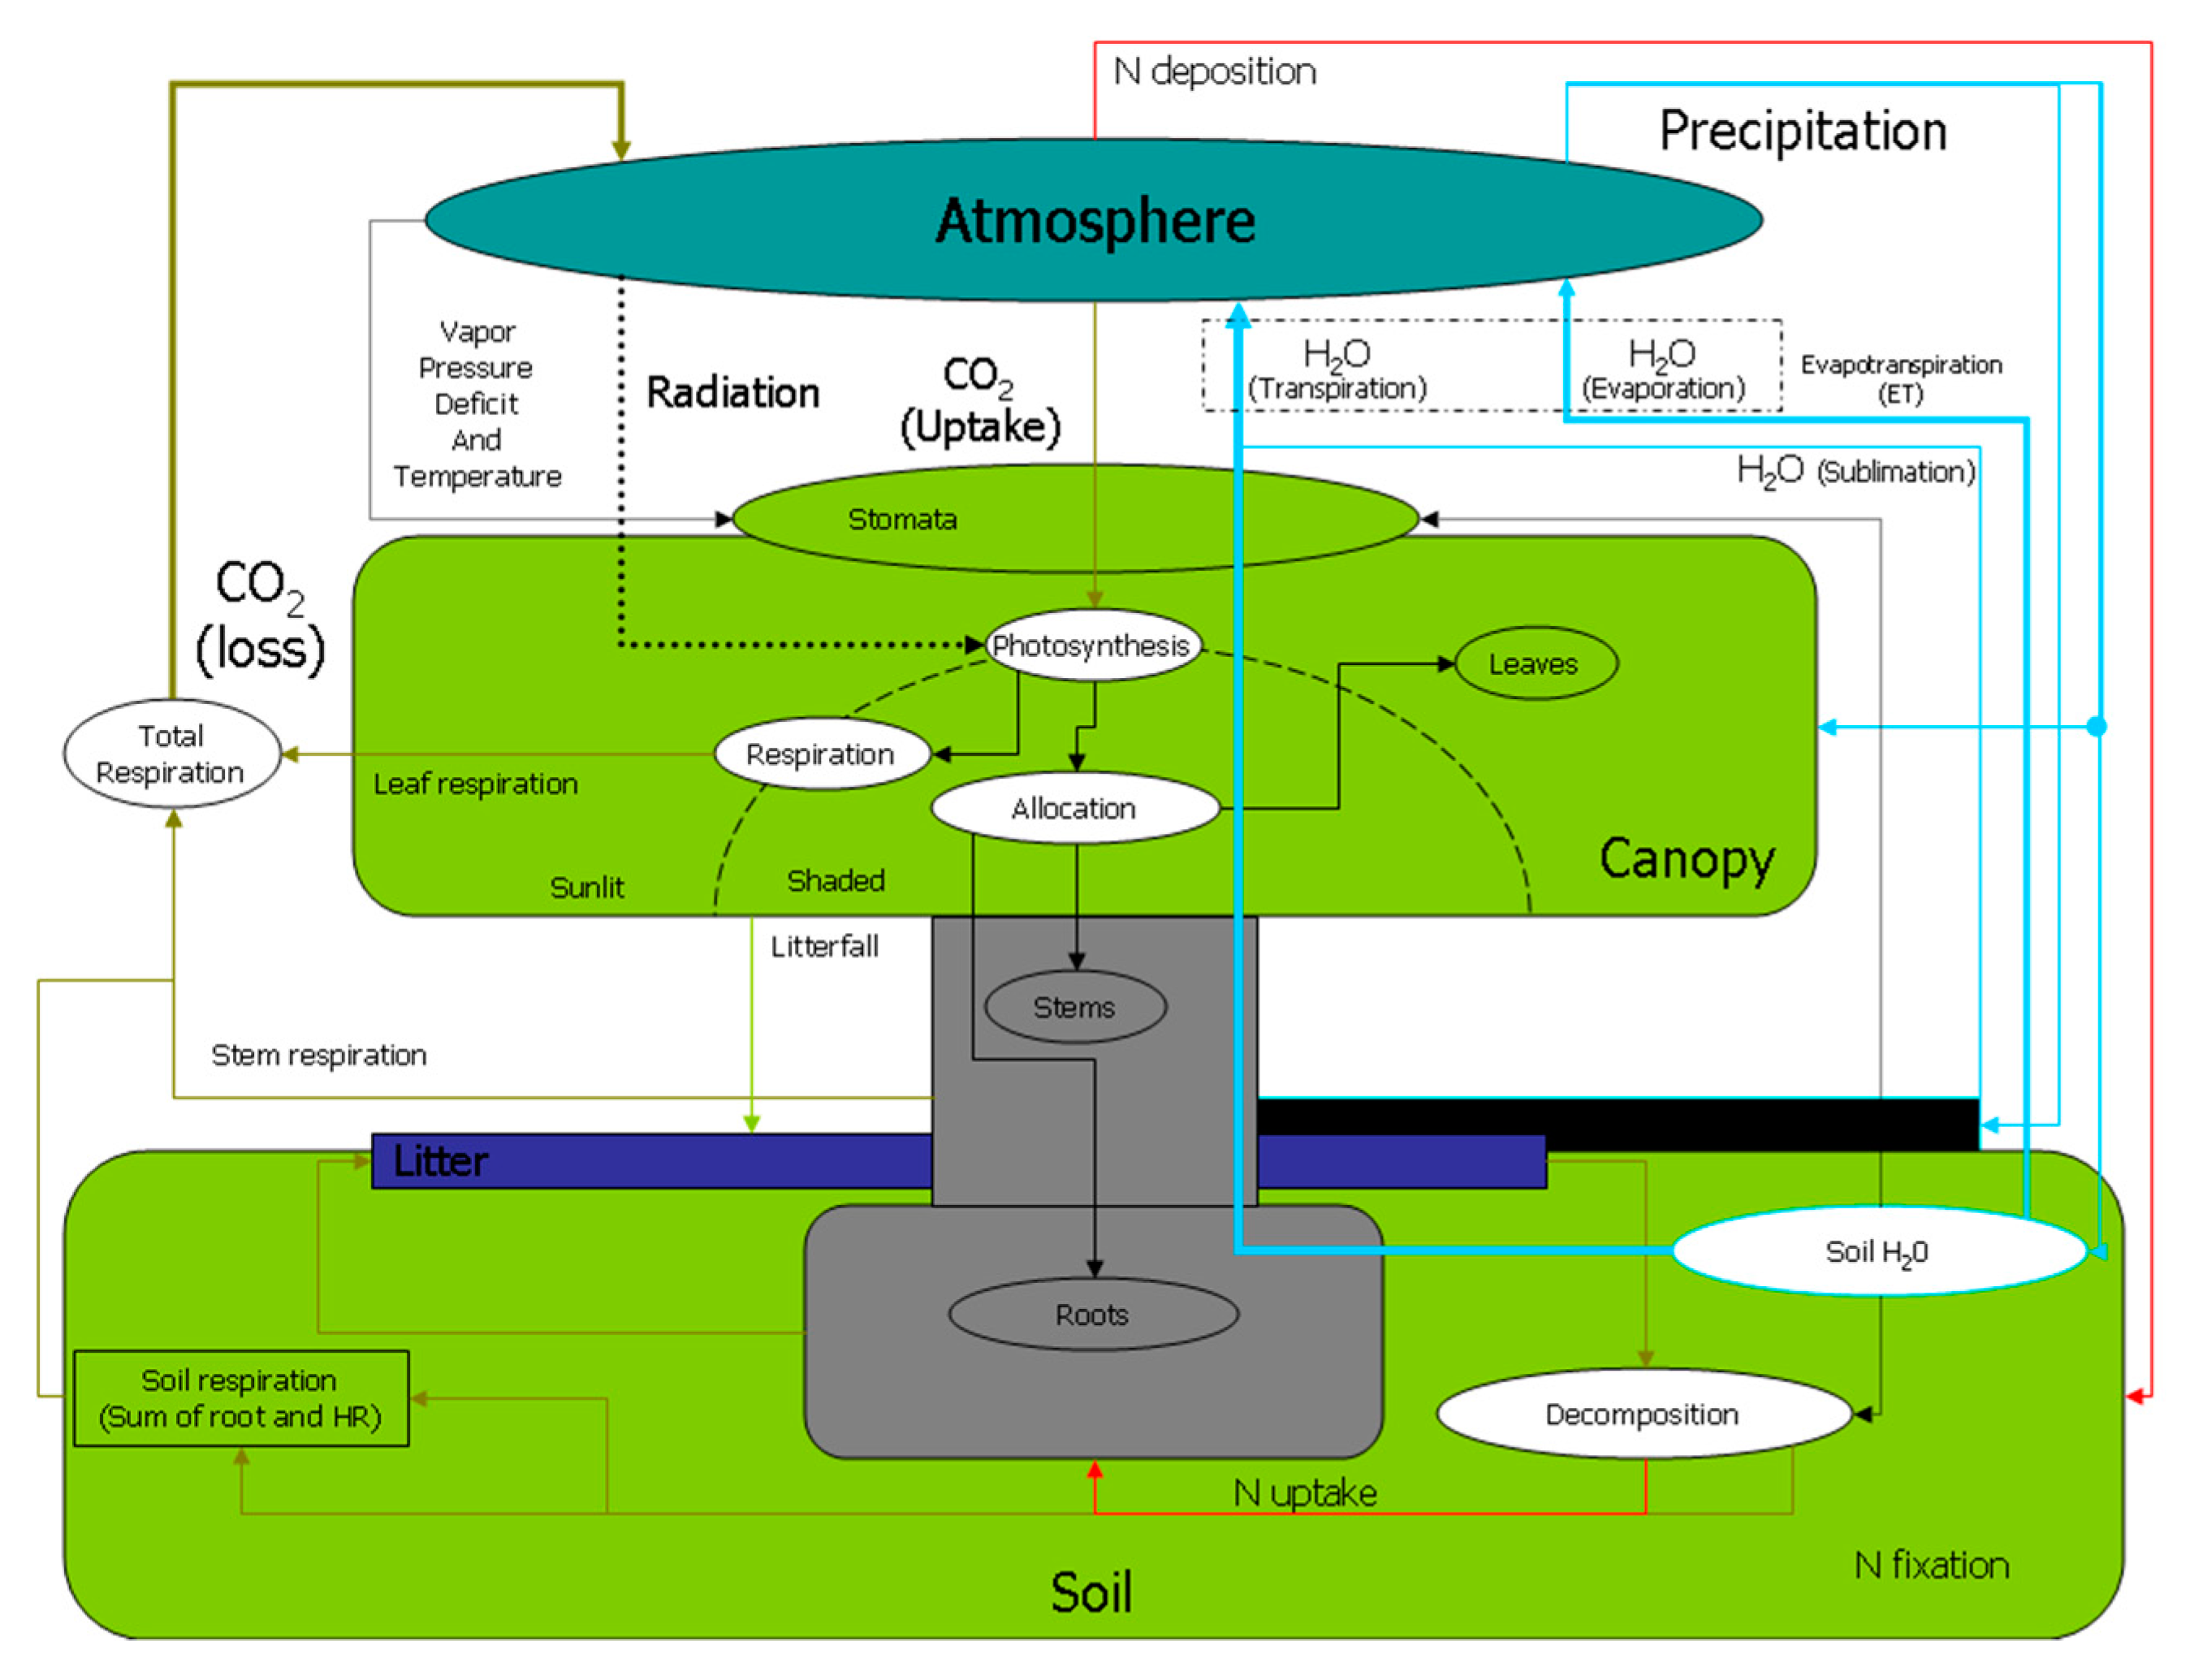
Figure 2.
Detailed flow chart of the Biome-BGC model [28].
Figure 2.
Detailed flow chart of the Biome-BGC model [28].

Figure 3.
(a) Comparisons between the P. simonii forest NPP based on the Biome-BGC model and MODIS data for NPP and the tree-ring-width index (RWI) at the Zhangbei Ertai site during the period of 1982–2017; (b) comparisons between the P. simonii forest NPP based on the Biome-BGC model and MODIS data and (c) AET based on the Biome-BGC model and MODIS data at the Zhangbei Ertai sites during the period of 2001–2019.

Figure 4.
Comparisons of the Biome-BGC modeled (a) NPP, (b) AET and MODIS data for NPP and AET from 2001 to 2019 on the Bashang Plateau.
Figure 4.
Comparisons of the Biome-BGC modeled (a) NPP, (b) AET and MODIS data for NPP and AET from 2001 to 2019 on the Bashang Plateau.

Figure 5.
Spatial distribution of the mean (a) AET and (b) NPP and (c) maximum LAI for P. simonii forest on the Bashang Plateau during 1980–2019.
Figure 5.
Spatial distribution of the mean (a) AET and (b) NPP and (c) maximum LAI for P. simonii forest on the Bashang Plateau during 1980–2019.


Table 1.
Characteristics of the three subregions in the Bashang Plateau.
| Characteristics | Region | Ⅰ | II | III |
|---|---|---|---|---|
| Location | Range | Kangbao | Shangyi, Zhangbei, Guyuan Country | The northwest of Fengning, Weichang Country |
| Climate | Temperature (℃) | 1.2 | 4.3 | 2.7 |
| Precipitation (mm) | 348 | 420 | 463 | |
| Geo | Elevation (m) | 1450 | 1436 | 1476 |
| Soil type | Chestnut soil | Chestnut soil | Chestnut soil, brown soil |
Table 2.
The ecophysiological parameters for P. simonii forest used in the Biome-BGC model.
| Parameter | Value | Unit |
|---|---|---|
| Woody/non-woody flag | 1 | (flag) |
| Evergreen/deciduous flag | 0 | (flag) |
| C3/C4 | 1 | (flag) |
| Model phenology/user specified | 1 | (flag) |
| Transfer growth period as fraction of growing season | 0.204 | (prop.) |
| Litterfall as fraction of growing season | 0.205 | (prop.) |
| Annual leaf and fine root turnover fraction | 1 | (1/yr) |
| Annual live wood turnover fraction | 0.578 | (1/yr) |
| Annual whole-plant mortality fraction | 0.04 * | (1/yr) |
| Annual fire mortality fraction | 0 | (1/yr) |
| New fine root C: new leaf C | 1.04 | (ratio) |
| New stem C: new leaf C | 3.1 | (ratio) |
| New live wood C: new total wood C | 0.228 | (ratio) |
| New root C: new stem C | 0.22 | (ratio) |
| Current growth proportion | 0.437 | (prop.) |
| C: N of leaves | 21.2 ** | (kgC/kgN) |
| C: N of leaf litter, after retranslocation | 49 | (kgC/kgN) |
| C: N of fine roots | 43.2 | (kgC/kgN) |
| C: N of live wood | 50 | (kgC/kgN) |
| C: N of dead wood | 550 | (kgC/kgN) |
| Leaf litter labile proportion | 0.2 | (DIM) |
| Leaf litter cellulose proportion | 0.51 | (DIM) |
| Leaf litter lignin proportion | 0.29 | (DIM) |
| Fine root labile proportion | 0.12 | (DIM) |
| Fine root cellulose proportion | 0.54 | (DIM) |
| Fine root lignin proportion | 0.34 | (DIM) |
| Dead wood cellulose proportion | 0.78 | (DIM) |
| Dead wood lignin proportion | 0.22 | (DIM) |
| Canopy water interception coefficient | 0.045 * | (1/LAI/d) |
| Canopy light extinction coefficient | 0.599 | (DIM) |
| All-sided to projected leaf-area ratio | 2 | (DIM) |
| Canopy average specific leaf area (projected area basis) | 32 ** | (m2/kgC) |
| Ratio of shaded SLA: sunlit SLA | 2 | (DIM) |
| Fraction of leaf N in Rubisco | 0.08 * | (DIM) |
| Maximum stomatal conductance (projected area basis) | 0.0094 | (m/s) |
| Cuticular conductance (projected area basis) | 0.000094 | (m/s) |
| Boundary layer conductance (projected area basis) | 0.01 | (m/s) |
| soil water content: start of conductance reduction | 0.7 FC | (m3 m−3) |
| soil water content: complete conductance reduction | WP | (m3 m−3) |
| Vapor pressure deficit: start of conductance reduction | 1100 | (Pa) |
| vapor pressure deficit: complete conductance reduction | 3600 | (Pa) |
Note: * is the default parameter value of the model, ** is the optimized parameter value, and the remaining data are from the literature [34]. FC is the field water capacity, and WP is the wilting point.
Table 3.
Assessment index between the modified Biome-BGC model and MODIS data for NPP and AET in the study area.
Table 3.
Assessment index between the modified Biome-BGC model and MODIS data for NPP and AET in the study area.
| Region | NPP | AET | ||
|---|---|---|---|---|
| MD | RMSE | MD | RMSE | |
| (g C m−2 a−1) | (g C m−2 a−1) | (mm) | (mm) | |
| Ⅰ | 22.53 | 26.29 | 11.33 | 15.28 |
| II | −35.24 | 57.34 | −31.35 | 38.33 |
| III | −35.51 | 52.25 | 33.18 | 60.07 |
| Bashang Plateau | −25.11 | 51.94 | −8.63 | 41.88 |
Table 4.
Mean NPP, AET and maximum LAI values simulated by the modified Biome-BGC model for P. simonii forest in three zones of the Bashang Plateau.
Table 4.
Mean NPP, AET and maximum LAI values simulated by the modified Biome-BGC model for P. simonii forest in three zones of the Bashang Plateau.
| Region | n | NPP (g C m−2 yr−1) | AET (mm yr−1) | LAI (m2 m−2) |
|---|---|---|---|---|
| Ⅰ | 28 | 251.3 ± 41.9 | 323.1 ± 28.6 | 1.3 ± 0.2 |
| II | 68 | 373.0 ± 71.0 | 408.7 ± 37.5 | 1.9 ± 0.6 |
| III | 26 | 435.7 ± 27.5 | 447.8 ± 30.2 | 3.3 ± 0.2 |
Note: The values of each property in the table are the average values ± standard deviation for the study sites in three zones of the Bashang Plateau.
Table 5.
Pearson correlation coefficients between mean ET, mean NPP, maximum LAI, climate variables, and soil texture on the Bashang Plateau.
Table 5.
Pearson correlation coefficients between mean ET, mean NPP, maximum LAI, climate variables, and soil texture on the Bashang Plateau.
| Region | n | Variable | MAP (mm) | MAT (°C) | Clay (%) | Sand (%) | Silt (%) | Elevation (m) |
|---|---|---|---|---|---|---|---|---|
| Ⅰ | 28 | AET | 0.998 ** | −0.228 | 0.635 ** | −0.659 ** | 0.689 ** | −0.390 * |
| NPP | 0.990 ** | −0.208 | 0.603 ** | −0.631 ** | 0.669 ** | −0.447 * | ||
| LAI | 0.990 ** | −0.210 | 0.605 ** | −0.633 ** | 0.671 ** | −0.446 * | ||
| II | 68 | AET | 0.986 ** | −0.606 ** | −0.130 | 0.147 | −0.172 | 0.493 ** |
| NPP | 0.929 ** | −0.737 ** | −0.070 | 0.084 | −0.106 | 0.320 ** | ||
| LAI | 0.880 ** | −0.611 ** | −0.061 | 0.082 | −0.117 | 0.443 ** | ||
| III | 26 | AET | 0.965 ** | 0.001 | 0.350 | −0.427 ** | 0.354 | 0.256 |
| NPP | 0.698 ** | 0.413 ** | 0.138 | −0.234 | 0.210 | −0.217 | ||
| LAI | 0.708 ** | 0.388 ** | 0.174 | −0.238 | 0.203 | −0.194 | ||
| Bashang Plateau | 122 | AET | 0.974 ** | −0.417 ** | 0.193 * | −0.714 ** | −0.054 | −0.748 ** |
| NPP | 0.950 ** | −0.514 ** | 0.174 * | −0.672 ** | 0.016 | −0.686 ** | ||
| LAI | 0.847 ** | −0.491 ** | −0.130 | −0.550 ** | 0.230 ** | −0.531 ** |
Note: * = Significantly correlated at p < 0.05, ** = Significantly correlated at p < 0.01.
Table 6.
Stepwise regression for the major variables influencing the spatial distribution of the mean maximum LAI for P. simonii forests on the Bashang Plateau.
Table 6.
Stepwise regression for the major variables influencing the spatial distribution of the mean maximum LAI for P. simonii forests on the Bashang Plateau.
| Region | Regression Equation | R2 | F | p | n |
|---|---|---|---|---|---|
| Ⅰ | LAI = −0.748 + 0.007 × MAP − 0.0002 × ELV | 0.985 | 865.40 | 0.000 ** | 28 |
| II | LAI = −3.334 + 0.013 × MAP | 0.781 | 267.16 | 0.000 ** | 68 |
| III | LAI = 0.809 + 0.005 × MAP + 0.109 × MAT | 0.775 | 29.895 | 0.000 ** | 26 |
| Bashang Plateau | LAI = −0.05 + 0.014 × MAP + 0.018 × Sand + 0.026 × Silt | 0.797 | 173.08 | 0.000 ** | 122 |
Note: MAP = mean annual precipitation; ELV = elevation; MAT = mean annual temperature; Sand = sand content; Silt = silt content; ** = Significantly correlated at p < 0.01.
Publisher’s Note: MDPI stays neutral with regard to jurisdictional claims in published maps and institutional affiliations. |
© 2022 by the authors. Licensee MDPI, Basel, Switzerland. This article is an open access article distributed under the terms and conditions of the Creative Commons Attribution (CC BY) license (https://creativecommons.org/licenses/by/4.0/).
Share and Cite
MDPI and ACS Style
Zhang, Y.; Li, W.; Li, S.; Xie, B.; Shi, F.; Zhao, J. Spatial Distribution of Optimal Plant Cover and Its Influencing Factors for Populus simonii Carr. on the Bashang Plateau, China. Land 2022, 11, 890. https://doi.org/10.3390/land11060890
AMA Style
Zhang Y, Li W, Li S, Xie B, Shi F, Zhao J. Spatial Distribution of Optimal Plant Cover and Its Influencing Factors for Populus simonii Carr. on the Bashang Plateau, China. Land. 2022; 11(6):890. https://doi.org/10.3390/land11060890
Chicago/Turabian StyleZhang, Yu, Wei Li, Shaodan Li, Baoni Xie, Fangzhong Shi, and Jianxia Zhao. 2022. "Spatial Distribution of Optimal Plant Cover and Its Influencing Factors for Populus simonii Carr. on the Bashang Plateau, China" Land 11, no. 6: 890. https://doi.org/10.3390/land11060890
Note that from the first issue of 2016, this journal uses article numbers instead of page numbers. See further details here.