
Connectivity Index-Based Identification of Priority Area of River Protected Areas in Sichuan Province, Southwest China


1
School of Architecture and Planning, Yunnan University, Kunming 650500, China
2
School of Business and Tourism Management, Yunnan University, Kunming 650500, China
3
School of Earth & Sustainability, Northern Arizona University, Flagstaff, AZ 86011, USA
4
Planning and Research Institute of China National Park, Kunming 650216, China
*
Author to whom correspondence should be addressed.
Land 2022, 11(4), 490; https://doi.org/10.3390/land11040490
Submission received: 29 December 2021
/
Revised: 23 March 2022
/
Accepted: 25 March 2022
/
Published: 28 March 2022
(This article belongs to the Special Issue Understanding Watershed Connectivity in a Changing Planet)
Abstract
:Identification of the priority area is of great significance for the rational layout of river protected areas (RPAs), and it also poses new challenges for protected areas’ (PAs) construction. This study started with the characteristics of RPAs and chose China’s Sichuan Province as the case for the present study, based on its characteristics of biodiversity conservation value and other characteristic elements. The study selected the river dendritic connectivity index and the other four indicators adding them according to different weights to calculate the comprehensive protected value (CPV) area. Finally, the existing PA distributions within the CPV were compared, and the priority conservation area was identified. The main conclusions are as follows: the total area of high-value areas is about 175,068 km2, accounting for 36.02% of the province and concentrated in the high mountain plateaus of the northwest and the southwest mountain region; the existing PAs are 131,687 km2 in sized, covering only 25.08% of the high-value areas of CPV. In other words, 74.92% of the high-value areas still have not been effectively protected, and the construction of RPAs is relatively lagging in these areas; the total area of priority conservation areas (PCAs) is 131,162 km2, accounting for about 26.99% of the province. The total length of the reach in the PCAs is about 9190.72 km, which is approximately 26.84% of the length of the province’s alternative reaches. The research can provide a scientific basis for the optimization and integration of nature protected areas and land space planning.
1. Introduction
The construction of river protected areas (RPAs) has become a key focus of establishing protected areas (PAs). However, since freshwater ecosystems dominated by rivers involve transboundary movement and need to consider the integration of large-scale regional methods, freshwater protection lags behind terrestrial and marine ecosystems [1]. Hence, freshwater ecosystems have become the most threatened and one of the most widely distributed habitats in the world [2].
Identification of the priority areas is a prerequisite for RPAs. As a space, RPAs should delimit a specific geographic area range to effectively protect the river’s artesian state, biodiversity, cultural diversity, socio-economic value, and riverfront communities [3]. At present, the priority area of PAs is determined by analyzing and determining two types of space: line and planar. The “line” space focuses on the river corridor itself. It identifies and divides the priority rivers for protection by analyzing and evaluating the current conditions of river-related species and water quality [4,5,6]. On the other hand, the “planar” space is based on river basin, national, province, and other scales. It uses methods such as system protection planning to identify the priority areas to protect the freshwater ecosystem and the rivers included in the priority areas [7,8,9].
At present, research on the priority space of freshwater protected areas focuses on quality (regional indicator species selection) and morphology (habitat and activity range). For example, using biodiversity indicators such as species spatial distribution and the richness of species of anomuran crabs and the family Aeglidae to identify priority protected areas in four freshwater ecoregions in South America [10]; combining the distribution of 14 freshwater fish species to identify priority protected areas in the Guadiana River Basin in Europe [11]; comparing and analyzing the distribution information of 130 endemic freshwater species within the existing network of protected areas to delineate key watersheds of freshwater ecosystems in the southern Ghats of India [12]; predicting the distribution of Elmidae by an SDM model to identify streams’ priority spaces in the shoal region of Rio Grande do Sul, Brazil [13]; building an ecosystem integrity assessment framework using the objectives of biodiversity and richness to identify priority areas for the protection of freshwater in the upper reaches of the Mississippi River, USA [14]; combining MARXAN with the distribution information regarding 14 shrimp and 20 crab species, the tidal river reaches that need to be assigned high conservation priority were identified in Kyushu, Japan [15].
Authenticity and integrity are the key indicators in determining the priority areas. At present, authenticity and integrity have been practically ensured in identifying priority areas for terrestrial PAs. Most of these identifications use indicators to quantify the authenticity and integrity of ecosystems. They also use software such as MARXAN and ZONATION to identify terrestrial priority protected areas [16,17,18]. Thus far, all these identification methods have obtained proven results. However, the existing studies on identifying priority areas for RPAs are relatively insufficient. They follow the model used to identify priority areas for terrestrial PAs and start with protecting freshwater species [19,20].
Moreover, these studies still do not even consider the ecosystem level. Li et al. [21] applied the quantitative index of authenticity and integrity from the perspective of river ecosystems to identify the priority conservation areas of RPAs in a single basin. The RPAs here are not restricted to the various rivers protected using national parks, nature reserves, and other PAs. It also includes the river sections covered by special types of river protection, such as the national water parks and the national aquatic germplasm resources protection area.
Connectivity is the basic attribute of the river ecosystem, and it is also an important foundation for identifying the priority areas of RPAs [22]. In reality, RPAs rarely involve a single basin, and one often needs to consider the river ecosystem in multiple basins. Identifying the priority areas in multiple watersheds based on the authenticity and integrity of the river ecosystem is undoubtedly an important issue worthy of further in-depth study. Connectivity provides a new idea for identifying priority areas of RPAs across different basins.
Connectivity in the context of rivers mainly refers to the connectivity of river systems [23]. Moreover, connectivity has attracted attention as an important aspect of river protection for a long time. Pinchot [24] paid attention to the problem of river connectivity protection in the 1920s and found that dam construction caused greater damage to rivers, and rivers needed to be systematically protected. Structures such as dams and gates in excessive hydropower projects block the migration of river organisms, which greatly changes the hydrological characteristics of rivers [25,26]. The change in the hydrological characteristics of rivers eventually has a significant impact on the vertical connectivity and severely damages the connectivity of the river system [27,28]. The damaged connectivity of the river system, in turn, affects regions such as urban and rural areas, agriculture, permanent grazing, etc. [3,29,30,31]. This situation is a threat to the sustainable development of human beings and the health of the river ecosystem. Therefore, it is of great significance to further consider the construction of RPAs from the perspective of river water system connectivity.
The present study found the Sichuan province, Southwest China, having a thousand rivers, to be a suitable research area to address the issue discussed above. This study starts with the characteristics of the river ecosystem and builds on it. In particular, it uses the ecosystem approach to construct an analysis model and conducts spatial visualization analysis. This analysis further identifies the priority areas of the RPAs and determines the priority conservation reach (PCR). It is also the aim of this study to provide ideas for RPAs’ system planning.
2. Materials and Methods
2.1. Study Area
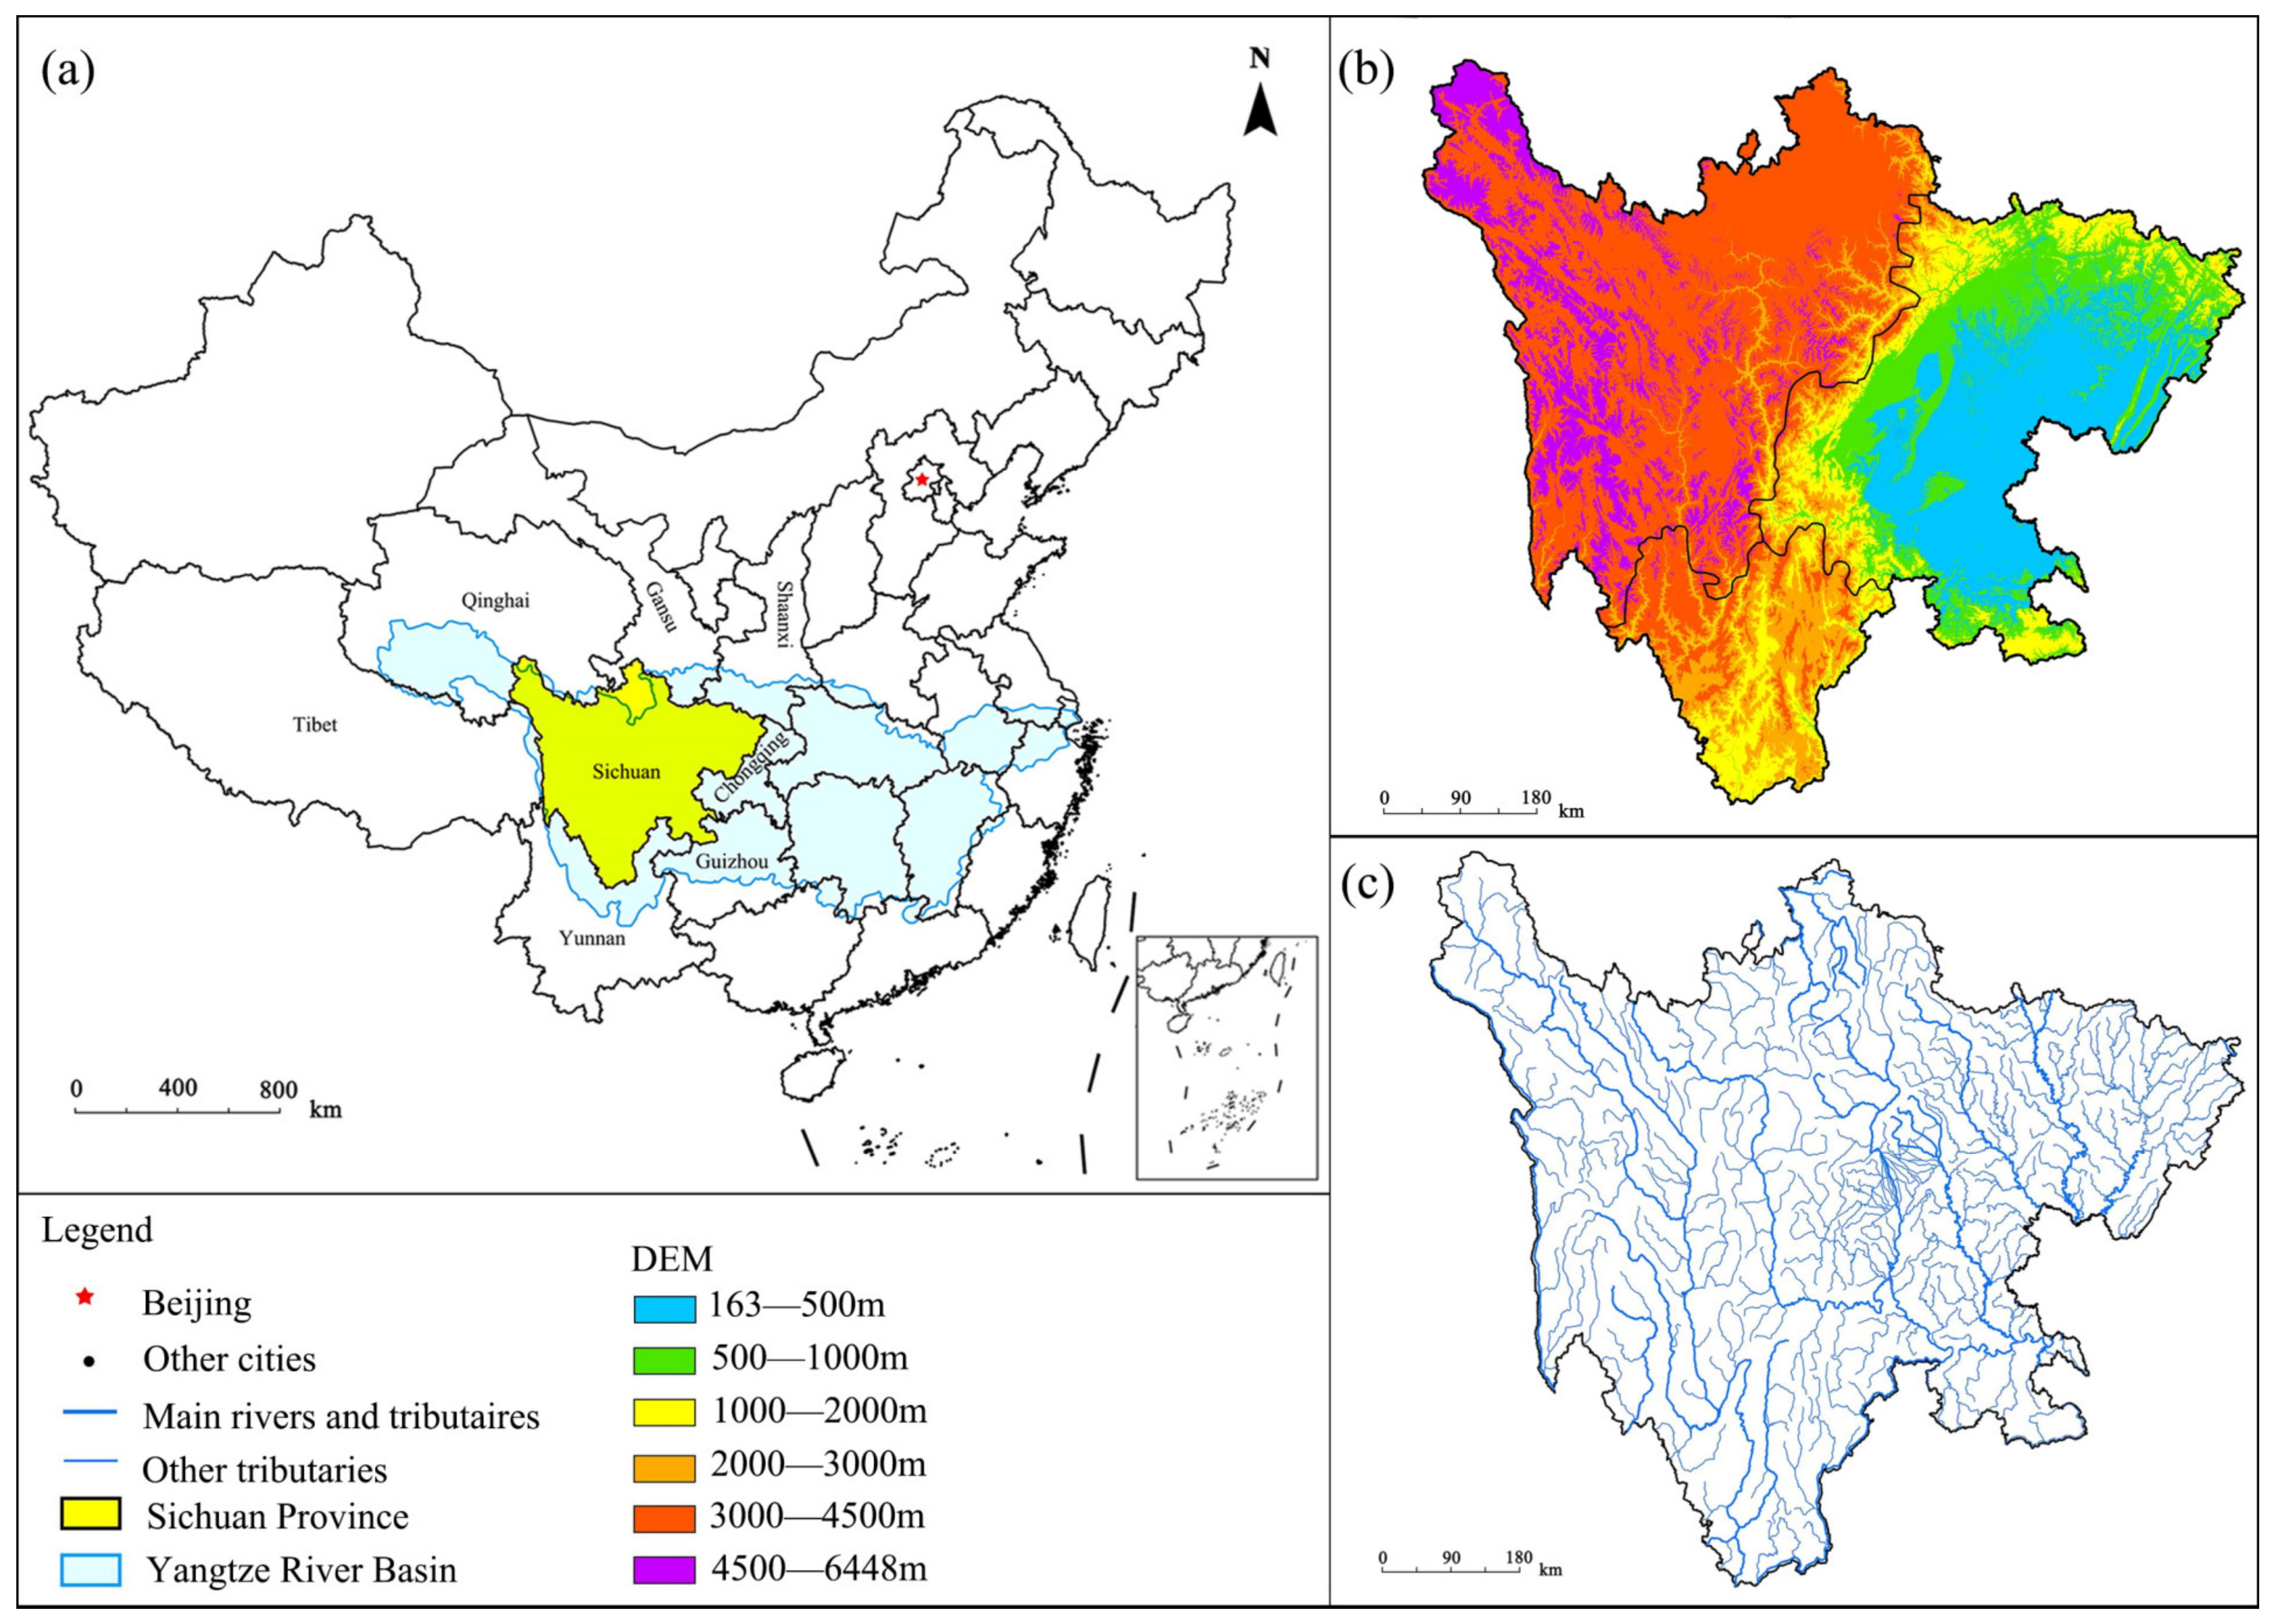
Sichuan is located in Southwest China, in the upper reaches of the Yangtze River, with geographic coordinates between 97°21′ E~108°12′ E, 26°03′ N~34°19′ N. The transition zone between the first and second steps of the three major topographic ladders in mainland China is located in Sichuan. The landforms of the whole province are quite different, showing the overall characteristics of higher west and lower east. Plateaus and mountains dominate the western region of the province, and the eastern region is dominated by hills and basins (Figure 1a).
The unique topographic features of Sichuan Province have also created the rich river system in this province (Figure 1c), giving this province the name “thousand-rivers province”. Approximately 466.6 thousand km2 of this province, which is 96% of its total area, belongs to the Yangtze River Basin. The remaining 19.4 thousand km2 belongs to the Yellow River. Specifically, there are 2816 large and small rivers in this province with a basin area of more than 50 km2 [32]. The river systems of the province have outstanding diversified values, including natural, history and culture, recreation, and tourism.
Most areas of Sichuan belong to the mountainous regions of Southwest China, one of the 34 biodiversity hotspots in the world [33], with numerous biological resources. The province has more than 10,000 species of higher plants, accounting for one-third of higher plant species in China, of which 84 are nationally rare and endangered plants. In addition, there are nearly 1300 species of vertebrates in this province, accounting for nearly half of China’s total vertebrates. Among these, 145 species of wild animals are under key protection, ranking the protection facility as first class in China. In addition, the province has a good achievement for the construction of PAs. Thus far, the province has achieved good results in this, by effectively protecting about 80% of wild animals and 70% of higher plant species in the region [34].
However, Sichuan has a large number of hydropower construction projects. Two hundred and one power dams (provided in the list of hydropower stations in Sichuan Province) have been built in the mainstream. The total installed hydropower capacity exceeds 80 MkW (as per the reports of the Sichuan Provincial Development and Reform Commission). The construction of power station dams has a serious negative impact on the river ecosystem, ecological environment of the river basin, and river protection [35]. In particular, the dam blocks the vertical connectivity of the river system. We reiterate that water system connectivity is a prominent issue that affects river protection and needs to be considered while identifying the priority areas of RPAs.
2.2. Protected Areas
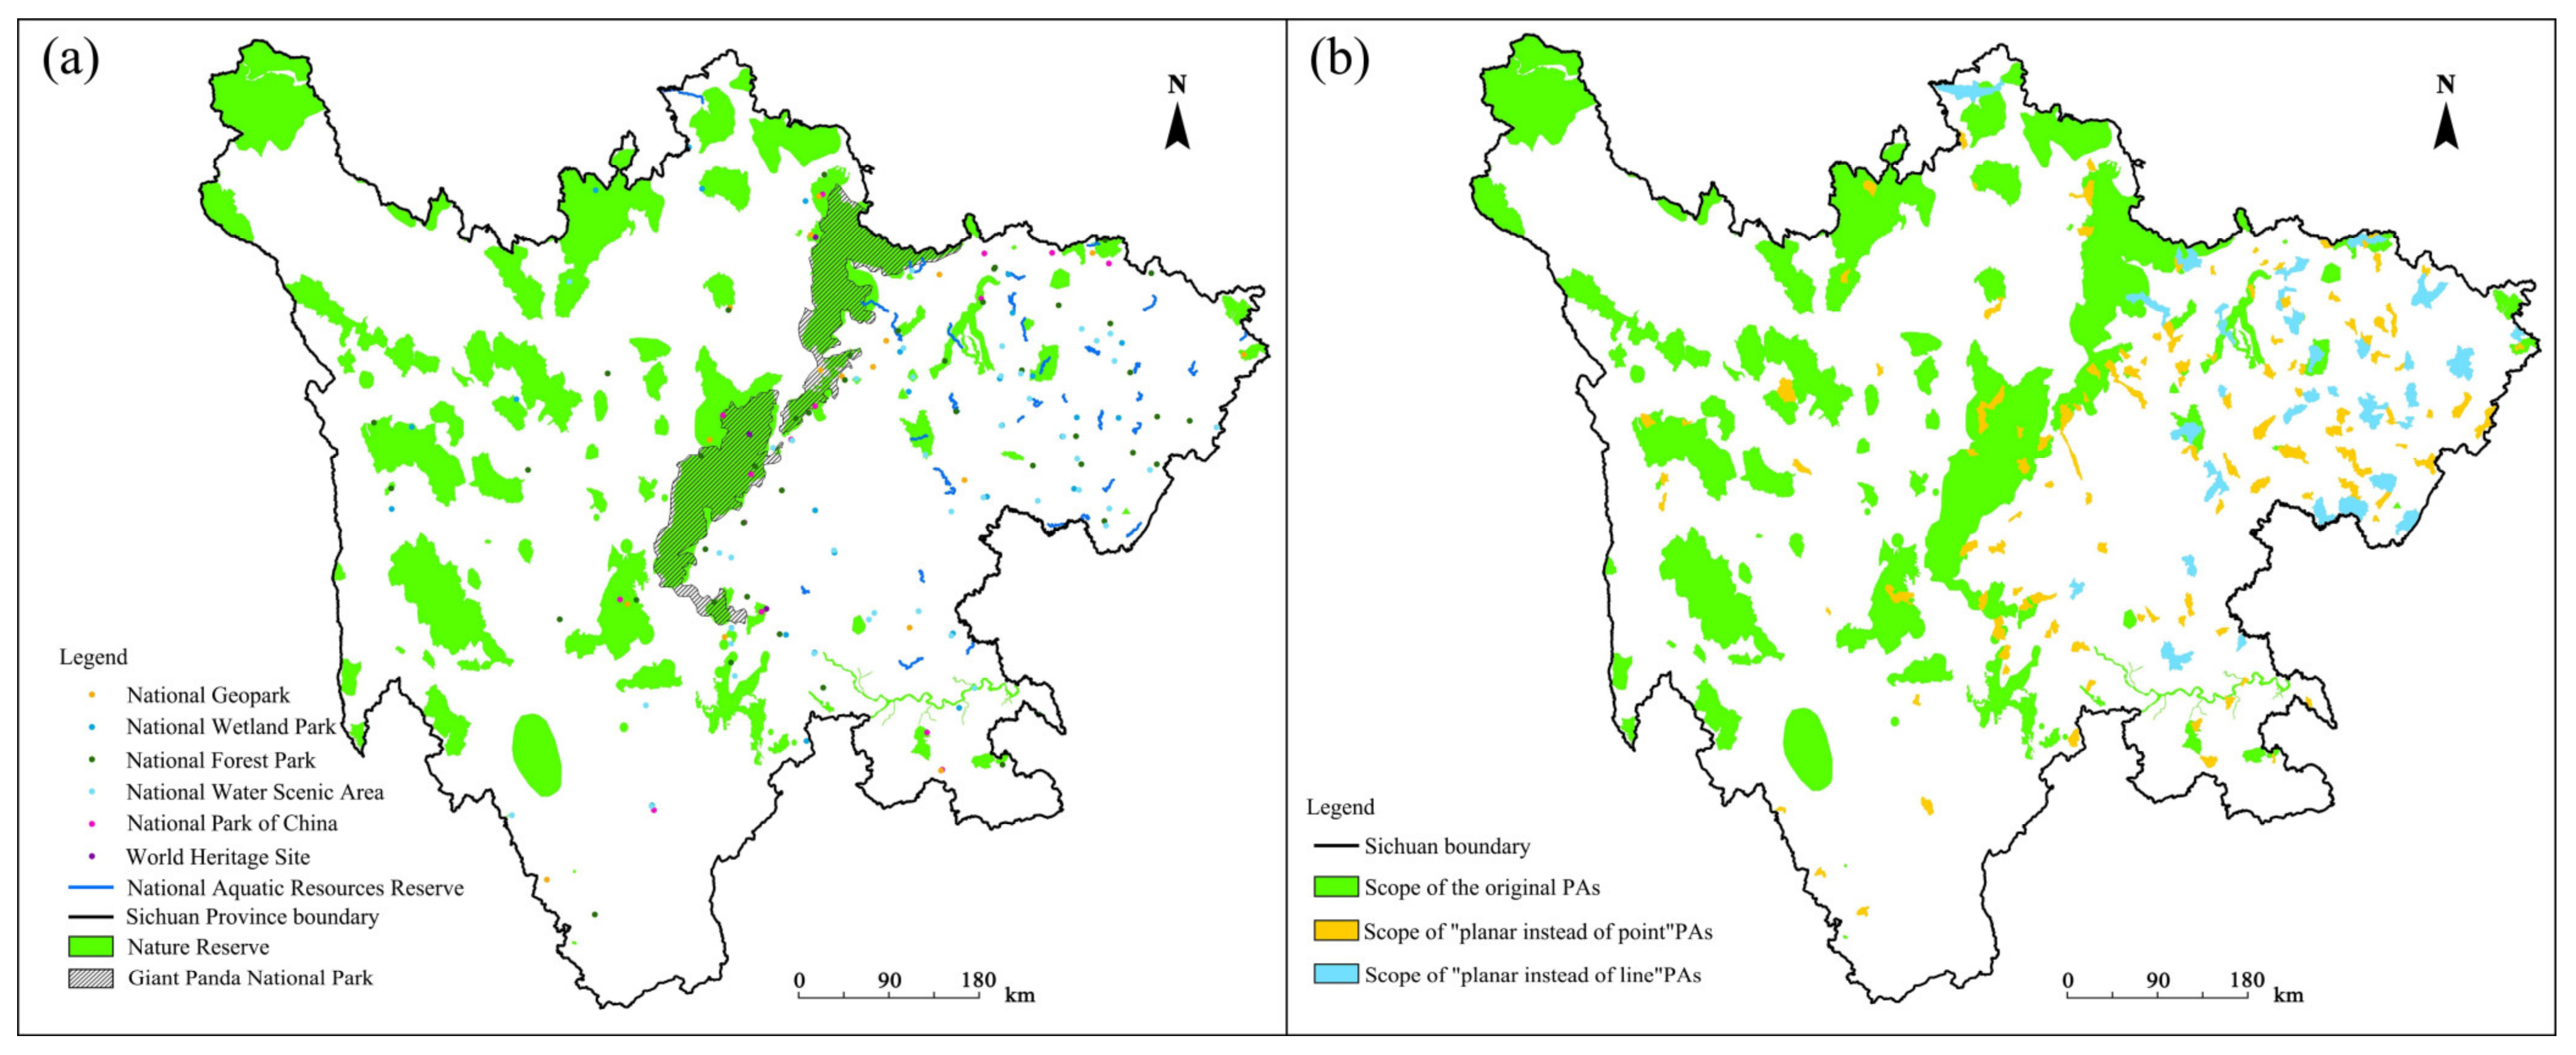
Sichuan is one of the provinces with the largest number and area of PAs in China. This study relies on the World Protected Area Database and related official websites of Sichuan to draw the existing national-level natural PAs system as the basis for identifying the priority areas of RPAs. There are nine types of PAs in Sichuan, including national geological parks, national forest parks, nature reserves, and others, that cover almost all types of PAs in China (Figure 2a). Among the PAs in China, the Giant Panda National Park covers the three provinces of Sichuan, Shaanxi, and Gansu. However, only the Giant Panda National Park in Sichuan Province is shown in the figure. The rivers, such as the Tangjia River in the Giant Panda National Park, are well protected in these PAs.
The boundary data of PAs are difficult to obtain, except for the two types of PAs’ data for some nature reserves and national parks that have demarcated clear boundaries. Uncertainty regarding the boundaries of other PA types will affect the identified priority areas. Hence, one has to research and apply the idea of “replace points with planar and lines with areas” to process point-shaped PAs’ data and linear PAs’ data. Moreover, the area of the planning unit with “points” or “lines” is regarded as the scope of the PAs (Figure 2b), based on the planning unit that was divided during the calculation of the irreplaceability index of the species. According to this method, the area of various existing PAs is 131,687 km2, accounting for 27.09% of the province’s total area.
2.3. Data Source and Processing
The data used in this research are of two categories: physical geographic and socio-economic. Part of the data come from on-site investigations, interviews, and expert consultations (Table 1). The research group conducted on-site investigations on typical river basins such as the Dadu, Fujiang, Jialing, and Minjiang river basins from 2014 to 2021. In particular, the team inspected the biodiversity, industrial structure, and community development along the river. They also cooperated with local water resources management, fish protection, forestry and other relevant government departments, and villagers to conduct interviews and obtain a lot of information and data.
Most of the data are directly downloaded from relevant authoritative websites, mainly from those of the Resource and Environment Science and Data Center of the Chinese Academy of Sciences, National Catalogue Service for Geographic Information, and various relevant government departments (Ministry of Water Resources of China and Sichuan Provincial People’s Government).
After data preprocessing operations such as cropping, mask extraction, and projection conversion in ArcGIS, the basic data of the study area in Sichuan Province are obtained as the basis for subsequent calculation of related indicators.
2.4. Methods
2.4.1. Principles for the Selection of RPAs
Ecosystem integrity, authenticity, and connectivity are the basic principles that determine the priority space of nature reserves [36,37,38,39]. RPAs, as freshwater ecosystems, are also a type of PA [40]. They play a role in linking terrestrial ecosystems with water ecosystems and should also have the basic characteristics of PAs.
- (1)
- Outstanding value of river biodiversity
The protection of rich biodiversity and high irreplaceability is the basic starting point for the construction of various PAs [41]. It is an important means to maintain the stability of regional ecosystem functions [42]. The scientific and reasonable establishment of RPAs can effectively protect river biodiversity and ecosystems, support sustainable development, and achieve the overall goal of protecting the ecosystem with minimal cost.
- (2)
- River ecosystem integrity
This refers to the comprehensive consideration of the river and the surrounding land, vegetation, environment facts, and the interaction between the river and humans at the watershed scale [43,44]. During this consideration, more bias is shown towards the integrity of the biological system, emphasizing the importance of integrity components. The long-term practical experience of the National Wild and Scenic Rivers System (NWSRS) in the U.S. shows this: the candidate rivers should have good ecosystem integrity, such as fish and wild animals, as well as outstanding scenery, recreation, history, and cultural values [45]. Furthermore, it can reflect the ecological characteristics of the composition, structure, and function of the river ecosystem, and the quality and diversity of the river ecosystem.
- (3)
- River ecosystem authenticity
The authenticity of the ecosystem includes two levels: natural authenticity and historical authenticity [46]. The authenticity of the ecosystem mainly emphasizes the resilience of the ecosystem after damage, i.e., its ability to restore as much as possible to a certain historical point in time without human disturbance [47]. The authenticity of the river ecosystem refers to the original state of the river ecosystem that has never been disturbed or is less disturbed by humans [48]. The authenticity is mainly reflected in the free flowing of the river and the rich species composition, reflecting the integrity and historical fidelity of the river ecosystem.
- (4)
- River ecosystem longitudinal connectivity
There are multiple watersheds or sub-basins within a specific region, and rivers or sub-basins must have good connectivity with other rivers to be healthy [49]. Having a good state of free flow [50] is the foundation of connectivity, and the flow of rivers must also be considered in the construction of RPAs. River connectivity includes four levels: longitudinal, horizontal, vertical, and time-varying connectivity dynamics, which have distinct four-dimensional characteristics [51]. Quantifying river connectivity through indicators and comprehensively assessing the degree of river connectivity have become very important activities to further include them in the construction of RPAs. A tree structure is the most widespread type of river system development on earth [52], and it is mostly seen in mountains and hilly areas.
This article uses the ecosystem approach to integrate the main features of the RPAs. The ecosystem approach is a technical means that comprehensively considers regional water, soil, and ecological resources, with no unified implementation form [53]. It can provide a powerful strategy for the integrated management of land, water, and biological resources and promote natural resources’ conservation and sustainable use. Therefore, the ecosystem approach can integrate the integrity, authenticity, and connectivity characteristics of the river ecosystem based on the characteristics of RPAs, and identify priority areas with high biodiversity [54]. The areas with rich biodiversity, little human influence, and little river disturbance were selected as the preferred areas for RPAs [55].
2.4.2. Calculation Process
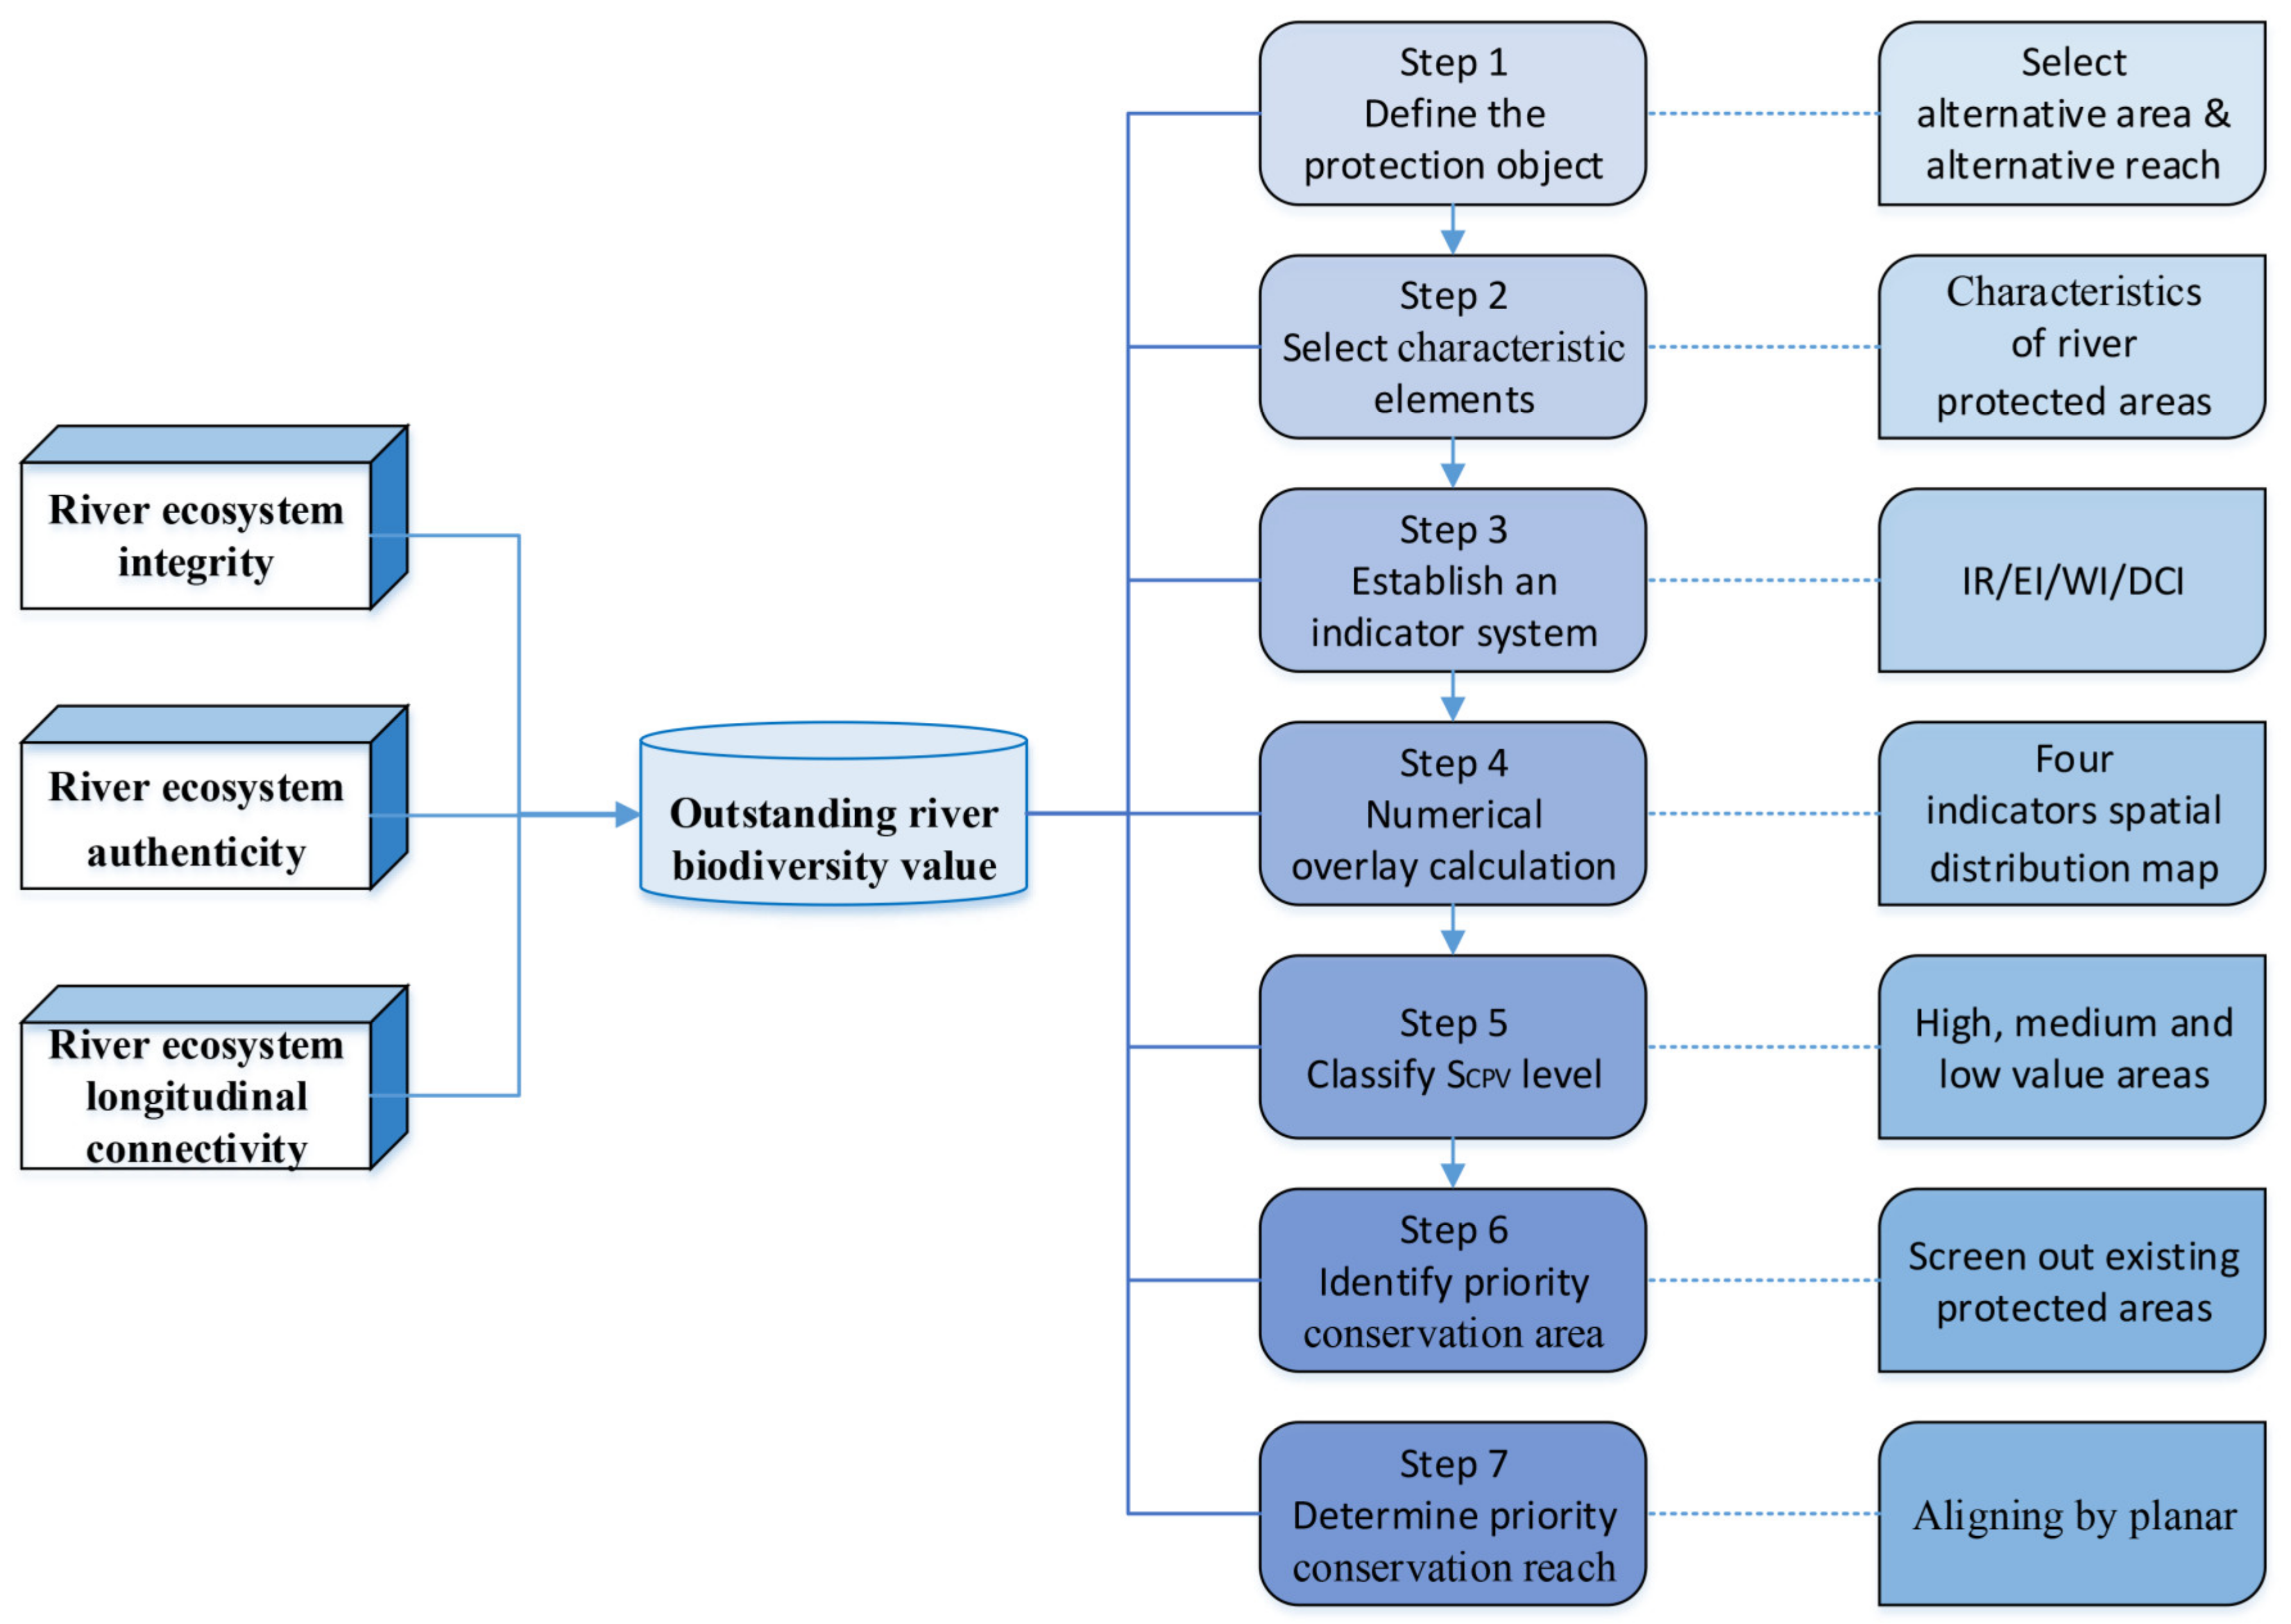
There are seven main steps in realizing RPAs’ identification based on the ecosystem approach. These seven steps are as follows: defining protection objects, selection of characteristic elements, the establishment of an indicator system, numerical overlay calculation, classification of comprehensive protection value (CPV) levels, identification of PCAs, and determination of PCRs (Figure 3).
- Step 1: Define the protection object
Defining the rivers that are the objects of protection is the first step in identifying conservation areas. These rivers that may become RPAs are referred to in this article as “candidate rivers”, similar to the candidate areas of PAs. In other words, representative rivers from many main streams and their main tributaries are selected as candidate rivers for the analysis. This research uses all the river systems in the “Sichuan Province Standard Water System Map (4th Edition)” as candidate rivers, considering the feasibility of the study and the actual conditions of the PAs. Then, the ArcGIS hydrological analysis module is used to process the DEM data to generate a river network distribution map. The adjusted and corrected distribution map gives the spatial distribution map of alternative rivers (Figure 1c).
- Step 2: Select characteristic elements
The selection of characteristic elements in this study is based on the main characteristics of RPAs. Furthermore, we abstract and extract important elements and typical characteristics of RPAs, following the principles of site selection for PAs. The important attributes of river ecosystems, such as authenticity, integrity, and connectivity, are also combined on biodiversity value.
Afterward, we select appropriate indicators to refine the above elements. These indicators have the following characteristics. First, they reasonably characterize the river ecosystem and are of two types: planar land area and linear river indicators. Furthermore, the indicators must be such that they can be quantitatively calculated and expressed in the form of spatial visualization. This research selects four indices: Irreplaceability (IR), representing the outstanding river biodiversity value; Ecological Index (EI), representing the river ecosystem integrity; Wilderness Index (WI), representing the river ecosystem authenticity; Dendritic Connectivity Index (DCI), representing the river ecosystem longitudinal connectivity. The four indices together form a calculation model for determining the spatial distribution of PRs and calculating each index’s spatial distribution map.
- Step 3: Establish an indicator system
IR. The value of river biodiversity is expressed mainly through selecting specific species to reflect the protection of the entire river ecosystem [56]. Freshwater species are selected as the basic unit of river biodiversity by comprehensively considering factors such as the representativeness and uniqueness of river ecosystem types, the degree of rare and endangered species, and threatened factors [57]. IR uses the space unit as the basic unit, indicating the degree to which the unit cannot be replaced by other units. Its value can reflect the protection priority of all planning units [58]. Furthermore, the river basin is divided into 8857 sub-basin units, and 102 species (55 species of fish and 47 species of amphibians) are chosen as representative freshwater species. A distribution map of each species is drawn, and the population density and spatial distribution of GDP are standardized simultaneously. The various elements are superimposed to obtain the spatial distribution map of protection costs as the next step. Finally, the province’s species irreplaceability index spatial distribution map SIR is obtained through the MARXAN software.
EI. This refers to the structural and functional integrities of landscape ecosystems [59]. EI is composed of three dimensions: LDI (Landscape Dominance Index), Shannon’s Diversity Index (Shannon’s Diversity Index and Shannon–Weaver Diversity Index, SHDI), and vegetation biomass VB (Vegetation Biomass). LDI characterizes the rationality of landscape structure, while SHDI and VB can characterize the functional stability of landscape [60]. The spatial distribution data of vegetation types in Sichuan are selected as the landscape data for calculating EI. Fragstats 4.2 software is used to calculate LDI and SHDI; since VB is difficult to obtain accurately, it can only be replaced by the normalized vegetation index NDVI. Finally, the spatial distribution map SEI of Sichuan Province’s ecological integrity index was calculated.
WI. This is the negative number of the human footprint index (HFP). Potential PAs usually tend to look for areas unaffected by humans or that have low human influence (i.e., low human footprint index) [61]. Most studies are based on positive thinking to directly quantify the size of human influence [62,63]. This quantification must consider that RPAs should use areas with high ecological authenticity [64], i.e., areas having a higher degree of wilderness (i.e., lower human footprint index), as candidate areas. However, the wilderness index is difficult to obtain. This study considers human influence from negative thinking and takes the negative number of HFP as the wilderness index (WI). Hence, the wilderness index has an inverse relationship with the authenticity of the ecosystem, and its value can directly represent the authenticity of the ecosystem. The human footprint index is easy to calculate, and the wilderness index spatial distribution map SWI can be calculated from 6 data layers of population distribution, land use, road distribution, railway distribution, night light, and slope [65].
DCI. David Cote first proposed the DCI in 2009, which is based on the degree of obstruction to the river to characterize the longitudinal connectivity of the river [66]. It reflects the degree of continuity and connectivity of different river flow states, can quantify the natural flow state of rivers, is an important evaluation index for studying trans-basin river ecosystems, and provides new ideas for identifying PCAs for RPAs. The biggest advantage of DCI is that it has good universality [67], is suitable for any level of watershed range, and can be used to calculate the connectivity of any river level. This study divided the province into 32 river basin units or DCI calculation units after much debugging and pre-calculating. FHI Tool software was used to calculate the DCI values of each river basin, and they were further used to obtain the spatial distribution map of river connectivity SDCI in Sichuan using ArcGIS. This analysis was based on the spatial distribution data of the candidate rivers in Figure 1b and 201 large and medium-sized dams in Sichuan.
- Step 4: Numerical overlay calculation
The spatial distribution maps of each index (respectively SIR, SEI, SWI, and SDCI) are overlaid and calculated in ArcGIS to obtain the ability to simultaneously characterize the integrity, authenticity, and connectivity of the river ecosystem. This approach is in line with the overlay processing technology in the spatial research of PAs [68,69]. This indicator can reflect the conservation value at the regional scale, and as the basis for identifying the PCAs; this article defines it as the CPV. Since the constituent elements of each river ecosystem have different degrees of influence on it, the corresponding indicators have different contributions to CPV, and the weight of each indicator needs to be considered while stacking calculations. In summary, the superposition calculation formula is summarized as follows
SCPV = α1 × SIR + α2 × SEI + α3 × SWI + α4 × SDCI
In this formula, SCPV is the spatial distribution map of CPV, SIR, SEI, SWI, and SDCI are the four index spatial distribution maps, respectively, α1, α2, α3, and α4 are their respective weights, and α1, α2, α3, and α4 ∈ (0,1). The weights are determined by combining subjective scoring by experts and objective entropy weighting methods in the stacking calculation. The results of each indicator should be allocated to each planning unit, all layers are of raster data type, and the same raster image is guaranteed meta size. Finally, ArcGIS can distribute the DCI calculation result to each planning unit.
The expert scoring method and the entropy weight method are combined to determine the weight of each indicator in the overlay calculation. The expert scoring form was distributed to 9 experts in related research fields, covering river ecology, fish biology, urban and rural planning, recreation and river protection, natural geography, landscape ecology, etc. Types of experts cover multiple levels of professors, associate professors, doctors, etc., including local fishery and forestry-related government officials. The subjective weights of the four indicators of IR, EI, WI, and DCI are calculated according to the expert score results: αa1 = 0.39, αa2 = 0.23, αa3 = 0.20, and αa4 = 0.18. The objective weight of each index is further calculated by the entropy method as αb1 = 0.10, αb2 = 0.15, αb3 = 0.24, and αb4 = 0.51. Finally, according to the principle of minimum relative information entropy, the four index combination weights are calculated as α1 = 0.22, α2 = 0.21, α3 = 0.24, and α4 = 0.33, which are used as the index weights in the final overlay calculation.
- Step 5: Classify comprehensive protection value (CPV)
The various indicators are overlaid and calculated in ArcGIS according to their respective weights, and the CPV spatial distribution map SCPV of Sichuan is obtained. We then use the ArcGIS natural breakpoint classification method to divide the results into five levels: lowest value, lower value, median value, higher value, and highest value. Each level corresponds to a type of area.
- Step 6: Priority conservation area identification
The spatial distribution map of the PAs is overlaid with the SCPV in ArcGIS, which can identify the protection vacancies with higher CPV outside the scope of the PAs as priority conservation areas (PCAs). It refers to areas with high CPV and not covered by existing PAs.
PCAs are divided into two types according to the CPV: first-level and second-level (Figure 4). The first-level PCA is located outside the existing PAs, and the highest CPV has the highest priority protection level. The second-level PCA is located outside the existing PAs with the higher value of the integrated conservation value, and the priority conservation level is the second.
- Step 7: Priority conservation reach determination
The priority conservation reaches (PCRs) refer to the high-value river reaches of CPV that the existing PAs do not protect. The high-value CPV reach of land protection is the candidate river located in the high-value protection area. The determination of the PCRs is based on the PCAs to realize the “line determination by the planar” and further determine the PCRs in the high protection value area.
Therefore, first, we determine the area, then determine the specific reaches, and finally, obtain the priority area pattern of RPAs in Sichuan. The PCRs are divided into two levels. The rivers located in the first PCAs are the first PCRs, and the rivers located in the second-level PCA are the second-level PCRs (Figure 4).
3. Results
3.1. Comprehensive Protection Value
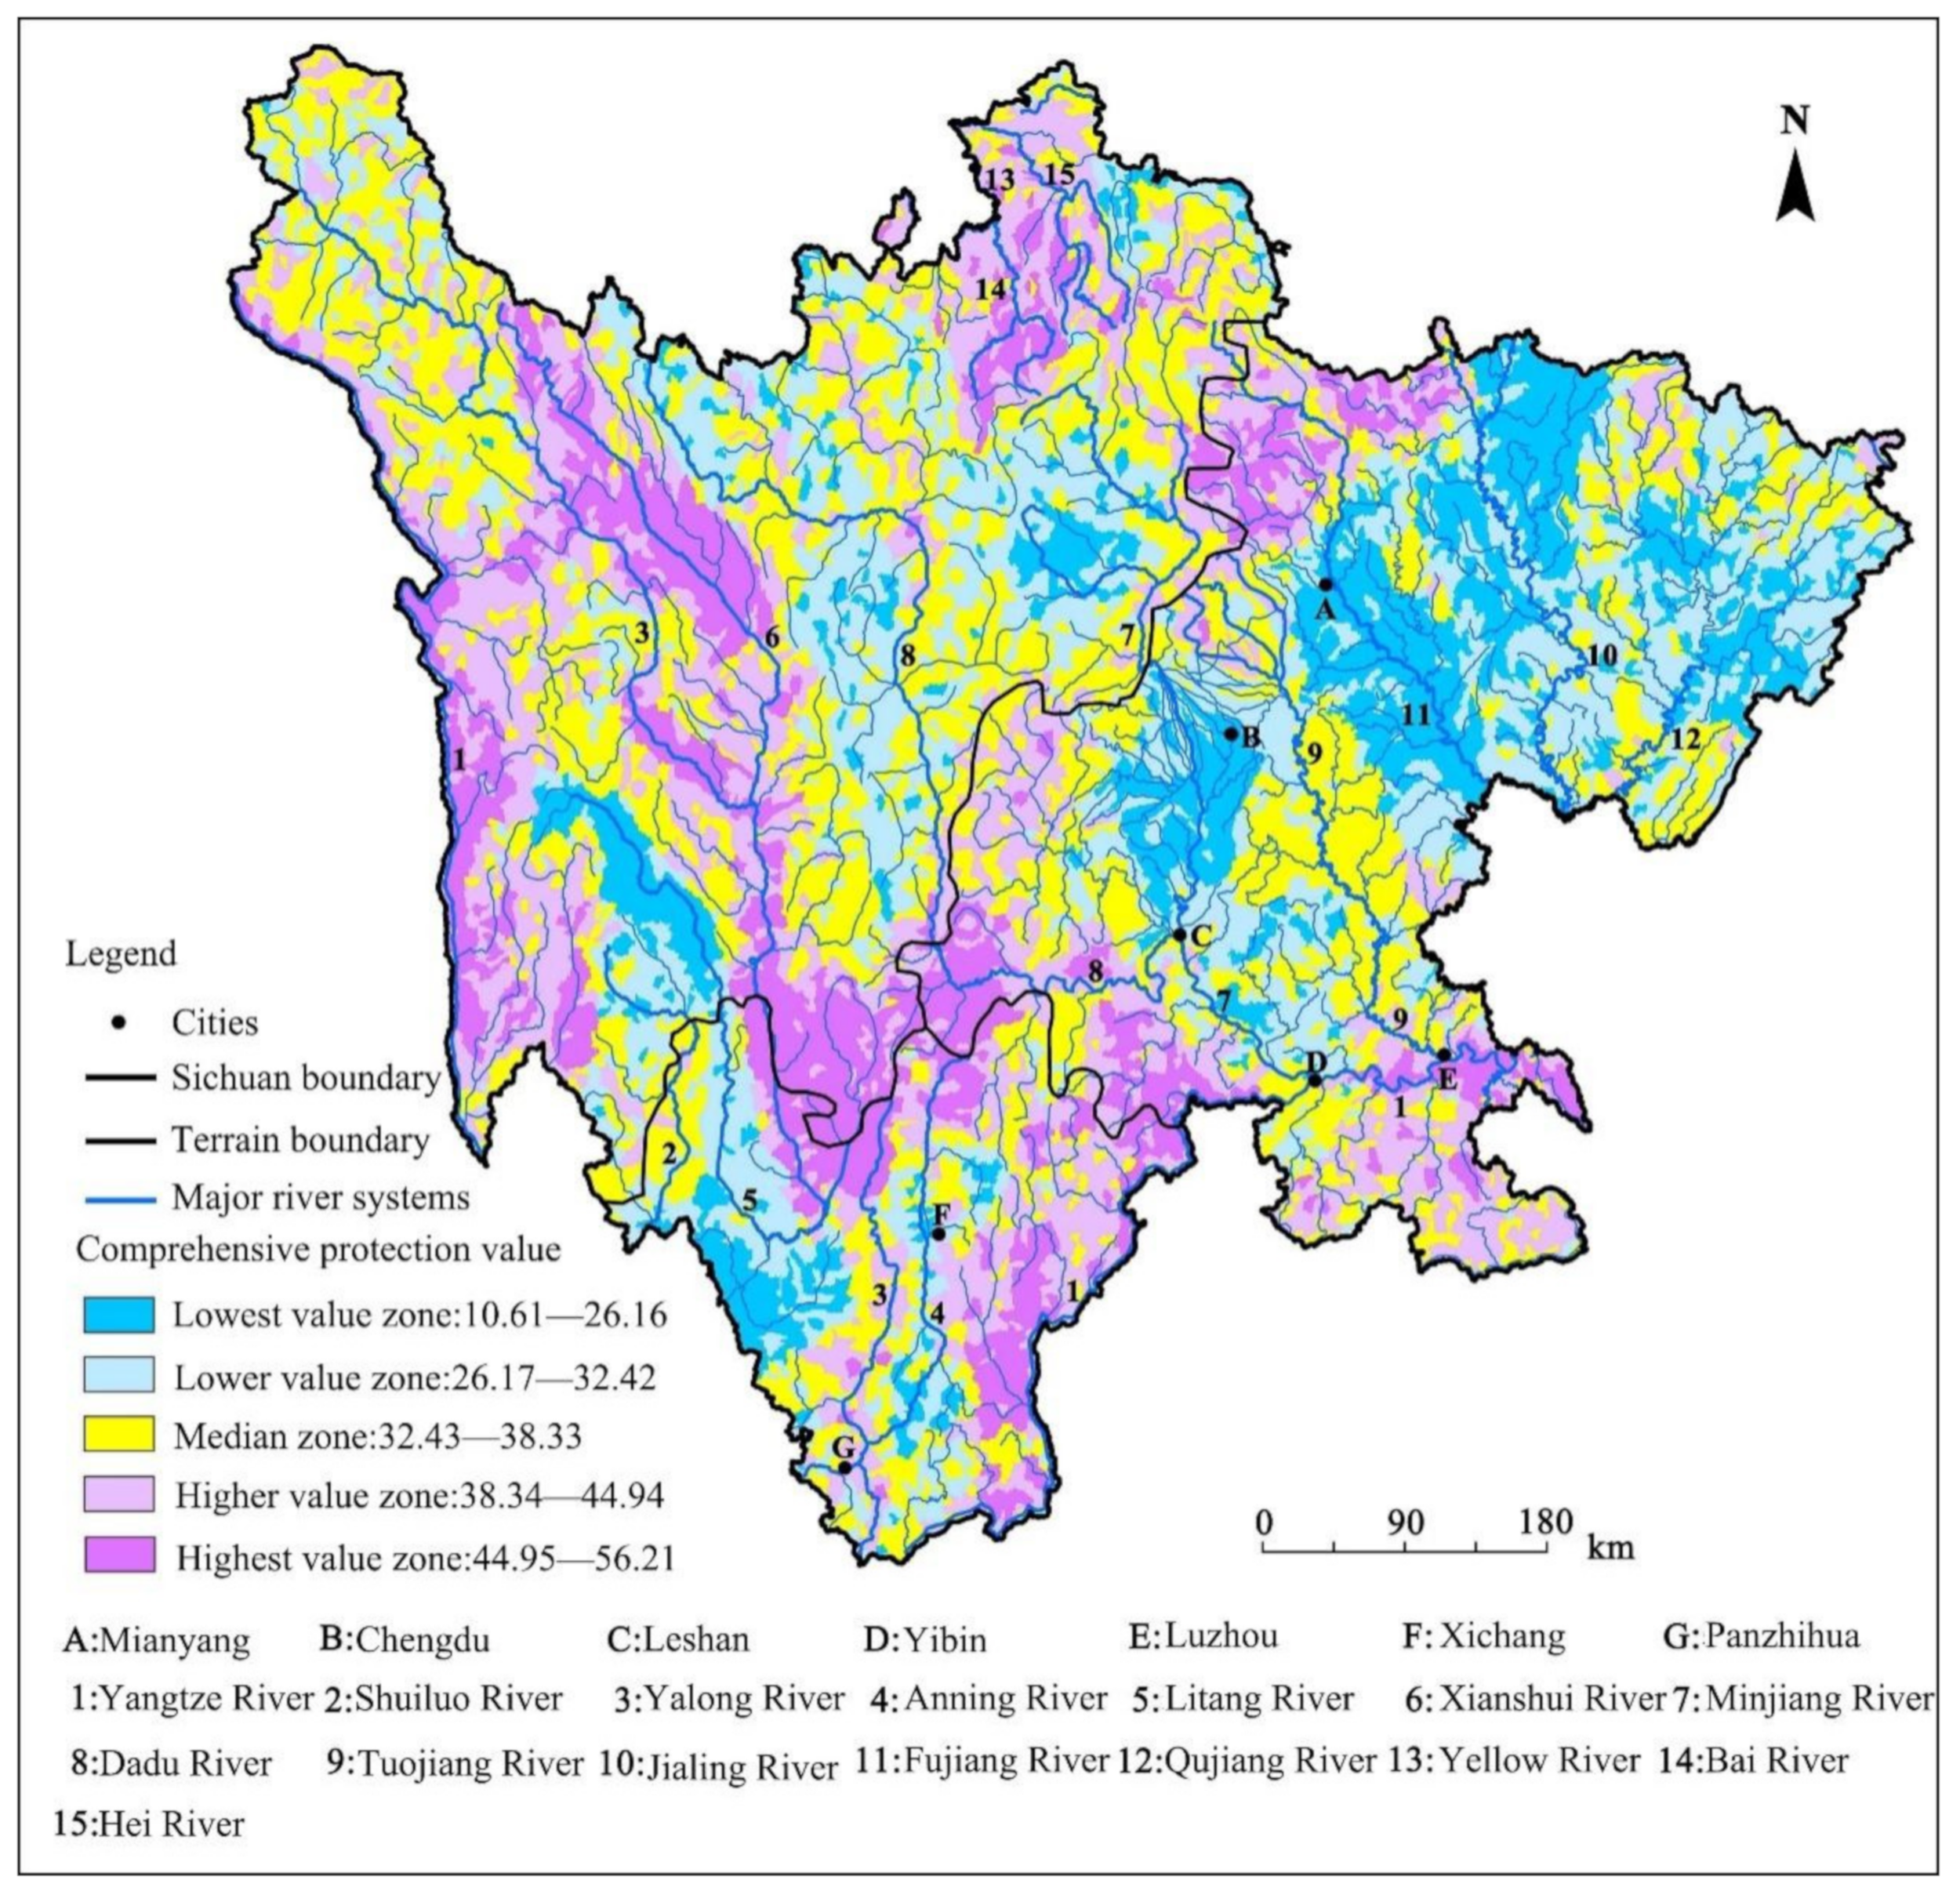
Basic information such as the number of grids and the area proportions in high, medium, and low zones of CPV is organized as shown in Table 2 after statistical analysis. The minimum value of the CPV stacking calculation is 10.61, and the maximum value is 56.21. The area of the high-value zone (38.34, 56.21) accounted for 36.02% of the total area, of which the highest value zone (44.95, 56.21) accounted for 12.74%, the higher value zone (38.34, 44.94) accounted for 23.28%, and other zones accounted for 63.98%. The statistical results in the table show that the zone with a high river protection value has an area close to 40% of the province’s area, which is, relatively, a large proportion. This observation further reflects that the overall level of river protection value in Sichuan is relatively high, and the construction of RPAs in the future will have greater potential and better practical significance.
The overall spatial distribution pattern shows that the areas with high protection value are prominently distributed in the province, concentrated in the high mountain plateau in the northwest and the southwestern mountain region. The northwest and southern regions of the Sichuan Basin also have high-value zones clustered and distributed (Figure 5). The highest and the higher value zones present a spatial pattern of “mixed and staggered, with the highest value zone inside and the higher value zone outside”. From the perspective of a river system, high-value zones are mainly distributed in the mainstream of the Yangtze River (the mainstream of the Jinsha River in the west and south of Sichuan and the mainstream of the Sichuan River from Yibin to Luzhou). They are also distributed in the mainstream of the Yellow River, the upper and middle reaches of the Yalong and Xianshui Rivers, the lower reaches of the Dadu River, the upper reaches of the Fujiang River, and the Qingzhu River, a tributary of the Bailong River.
3.2. Priority Conservation Areas of RPAs
3.2.1. Overall Spatial Characteristics
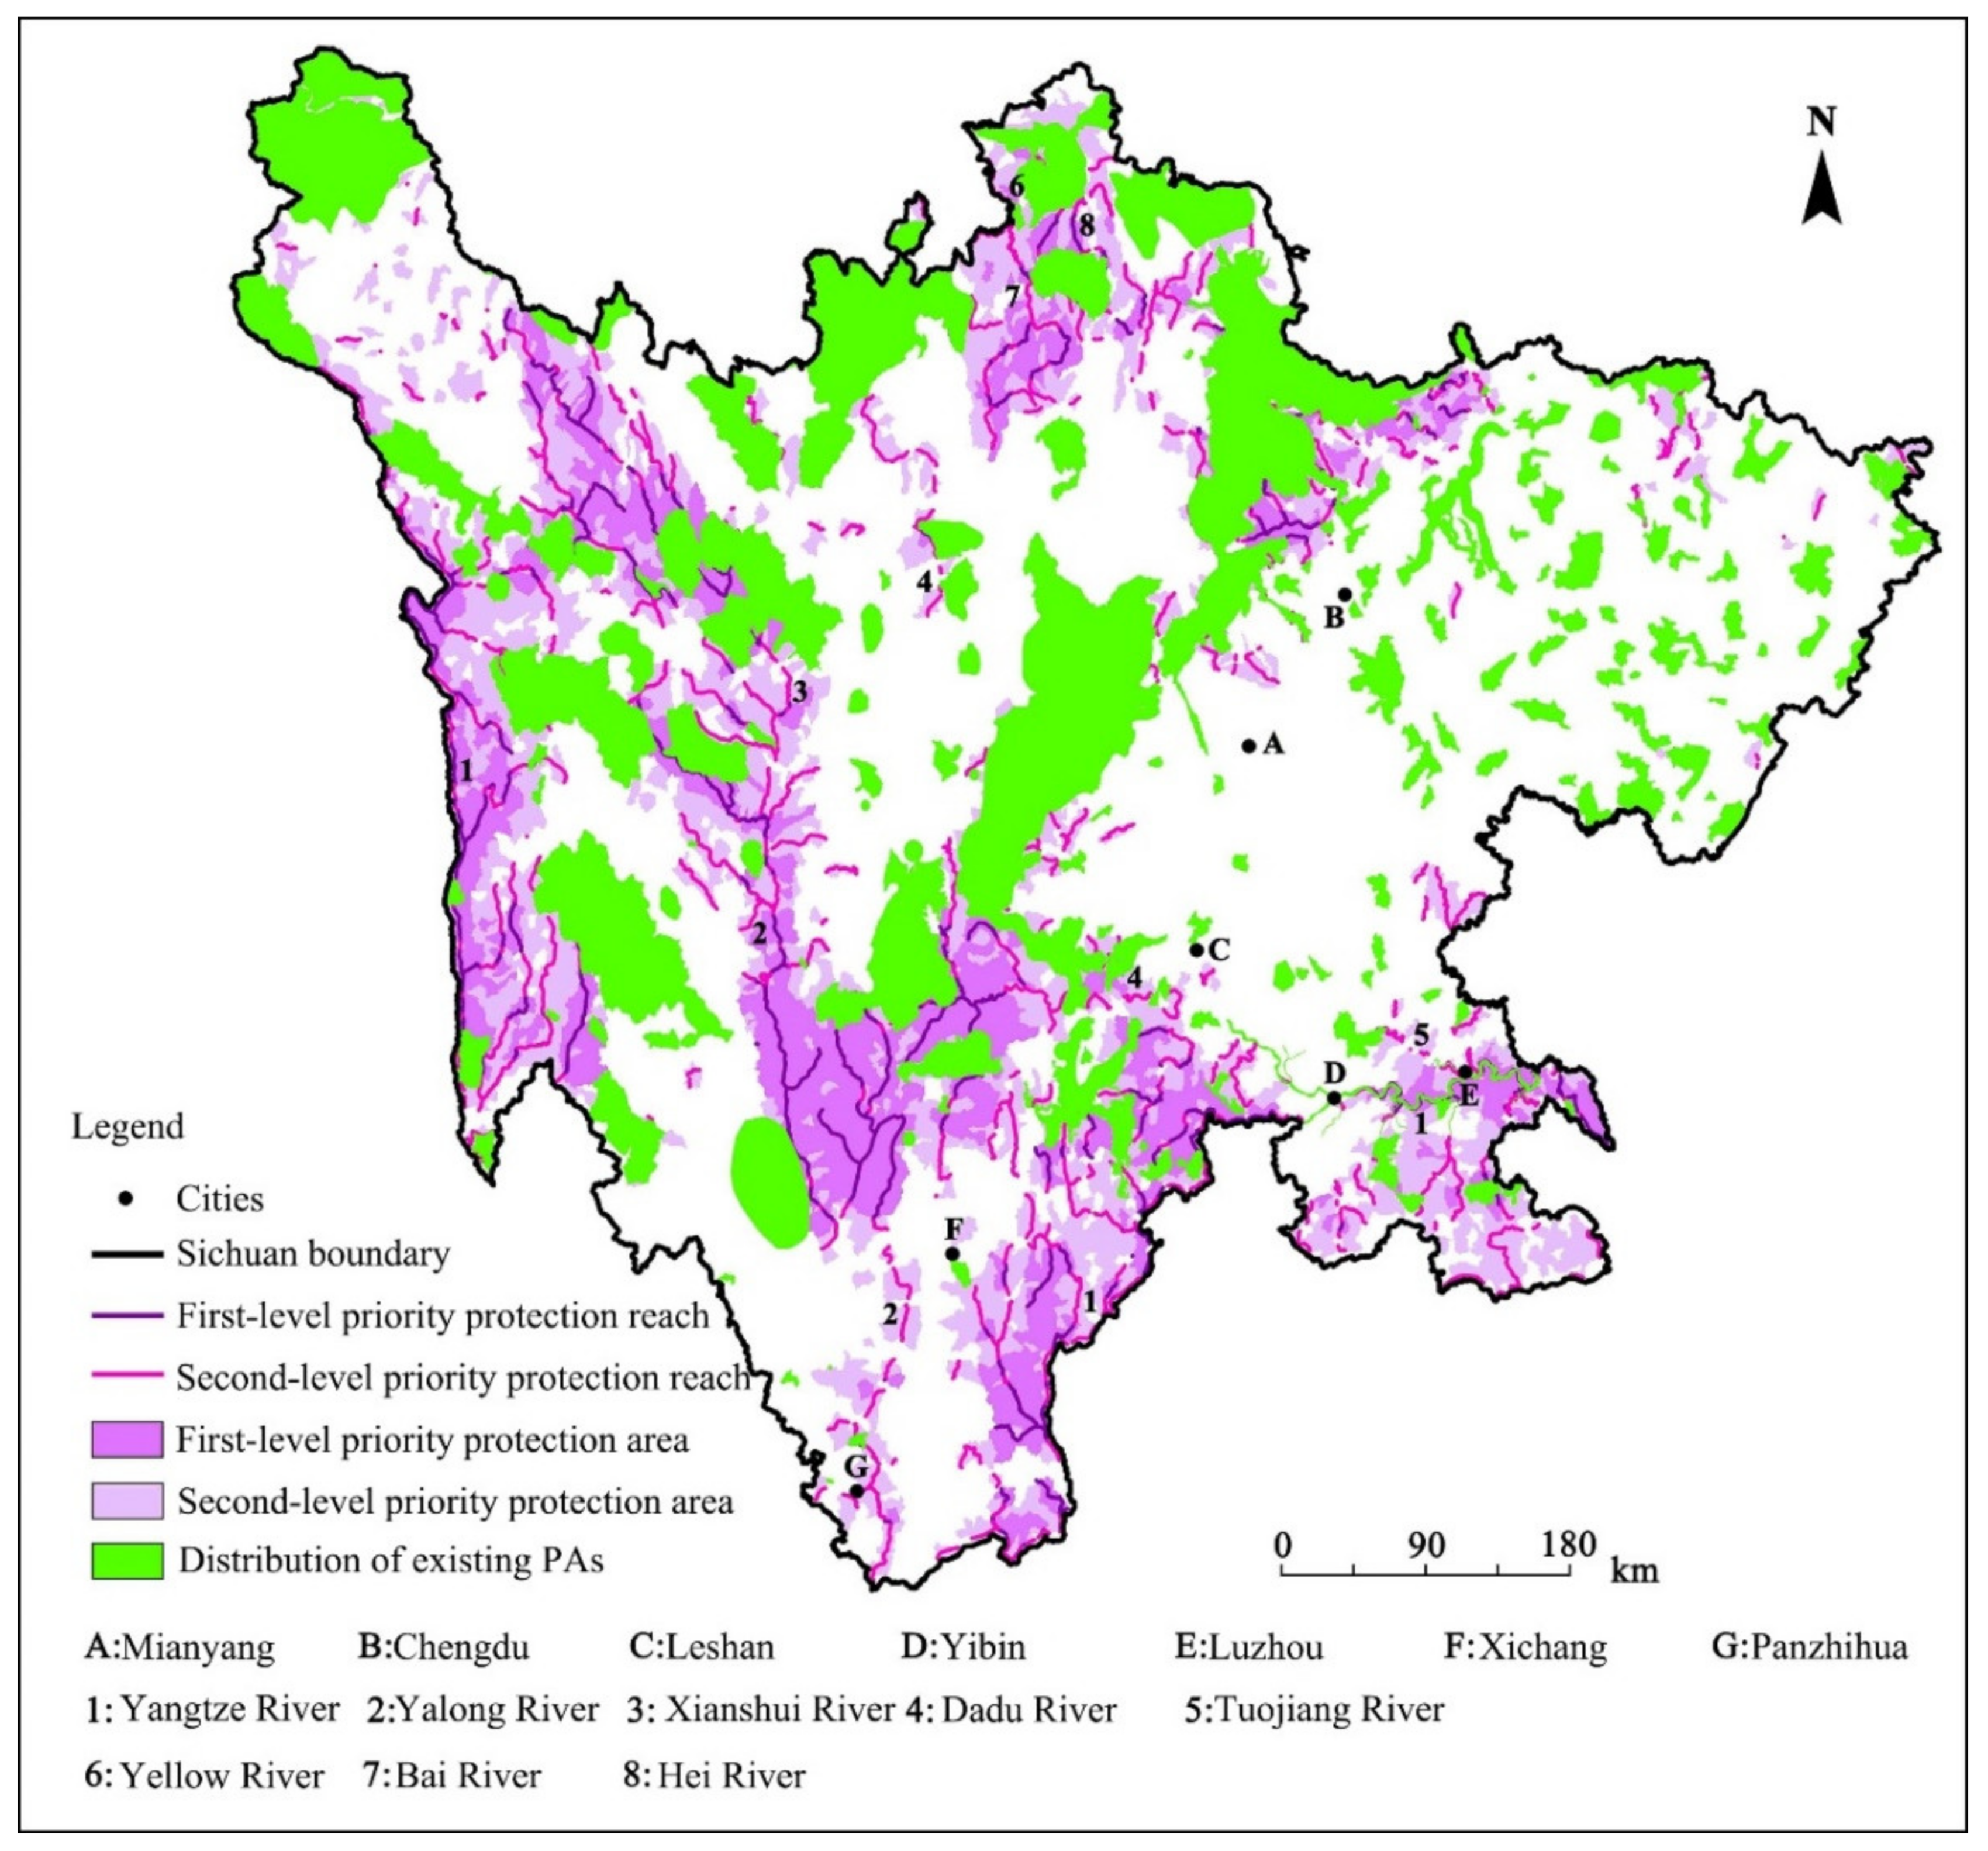
The spatial distribution map of comprehensive protection value and the spatial distribution map of PAs in Sichuan were overlaid in ArcGIS simultaneously, and the PCAs for rivers were identified (Figure 6).
According to statistical data, the total area of the PCAs is 131,162 km2, which is more than one-fifth of the provincial area of Sichuan, accounting for about 26.99% of the province’s area. Within this, the areas of the first-level PCA and the second-level PCA are 48,430 km2 and 82,732 km2, respectively, accounting for about 9.97% and 17.02% of the province’s area (Table 3). The existing PAs are widely distributed throughout the province except for the few PAs in southern Sichuan. PAs and giant panda national parks are concentrated in western, northern, and central Sichuan, while other PAs are distributed in the northeast of Sichuan. The distribution of existing PAs directly affects the spatial pattern of PCAs. Although the existing PAs have a good foundation for construction, it can be seen from the research results that they only protect 43,906 km2 of high-value protection areas, and the remaining 74.92% of these areas are yet to be protected. Most of the PCAs are concentrated in the Yangtze River Basin in the west and south of Sichuan, and a few are in the Yellow River Basin in the north. This result reflects the relatively backward status of China’s river protection and construction, which is consistent with the overall situation in the world [70].
3.2.2. Spatial Differentiation Characteristics
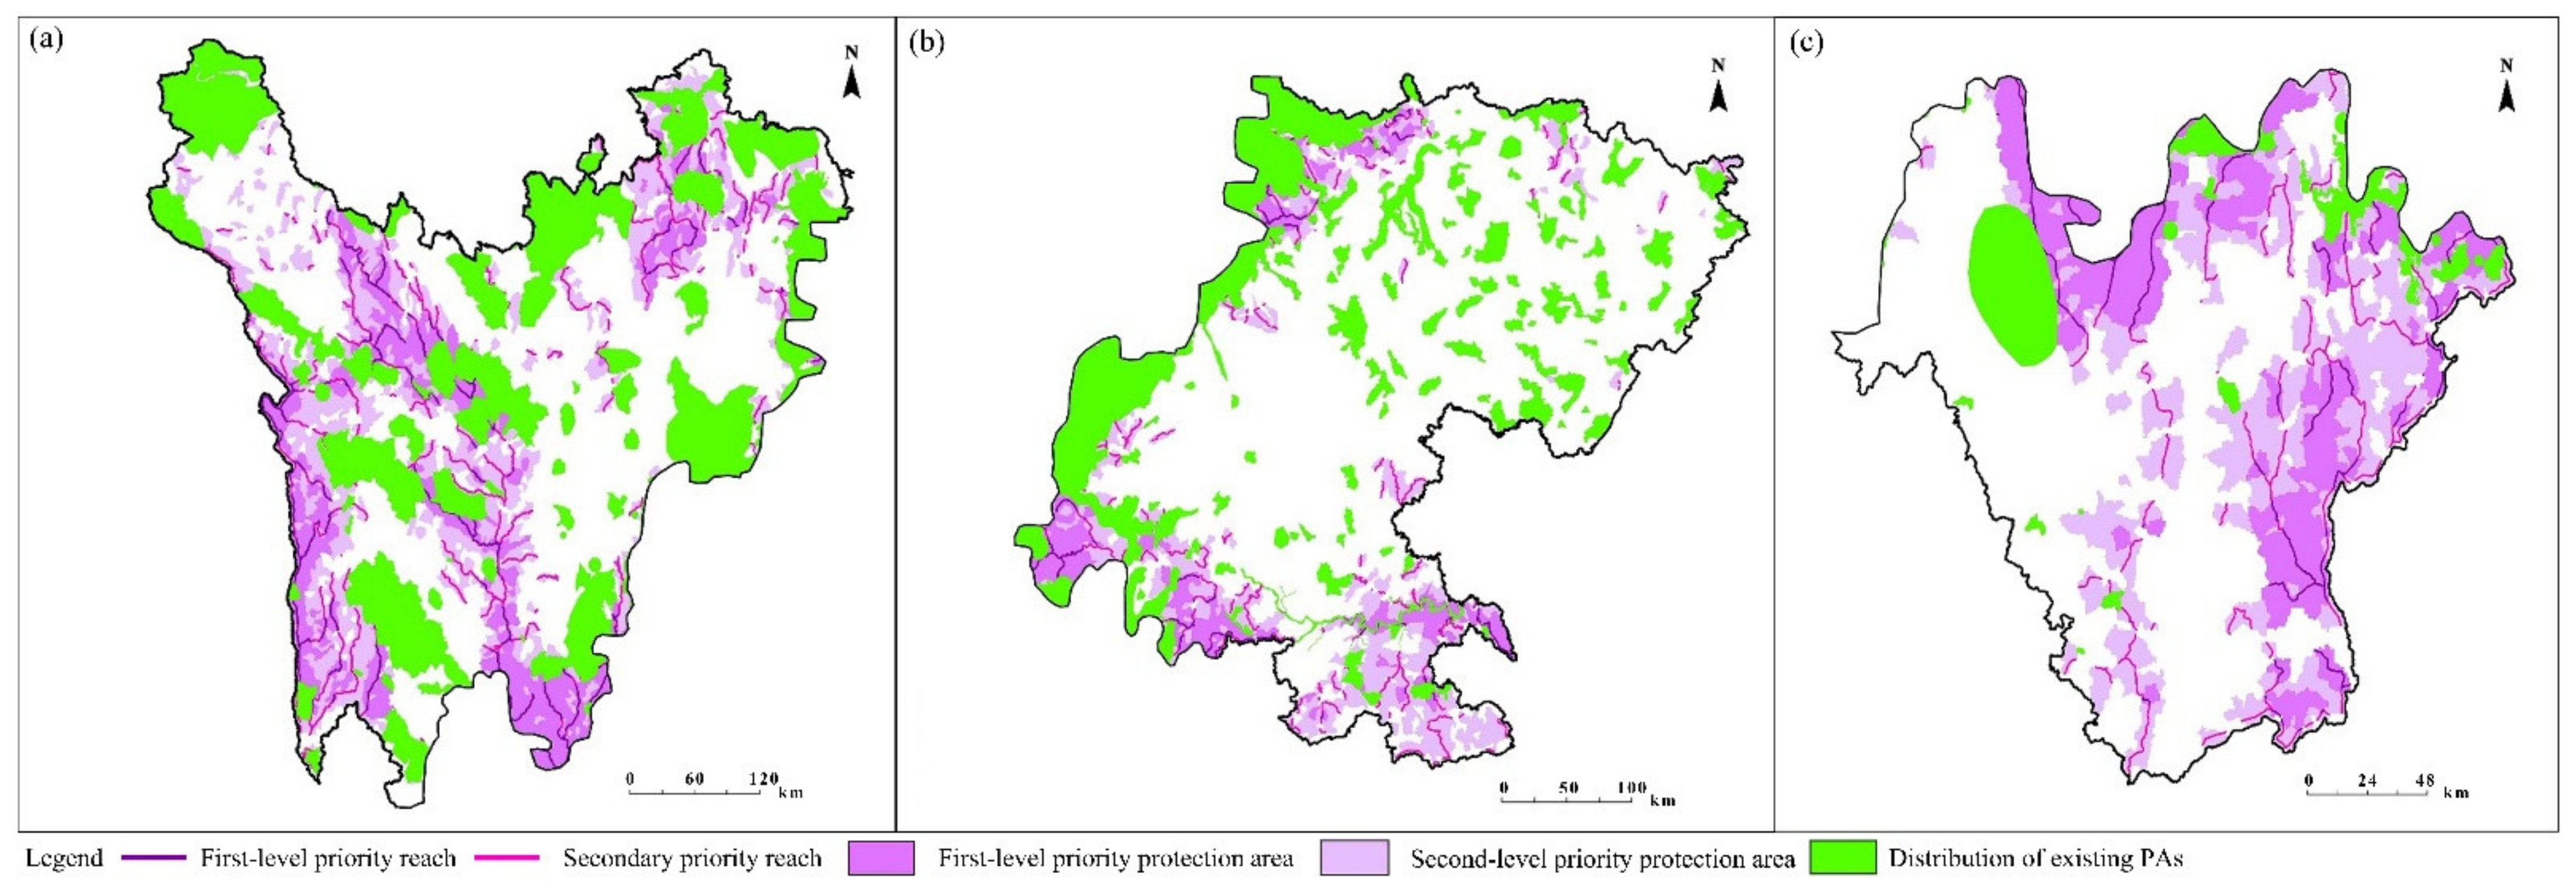
Sichuan can be divided into three typical landforms (Figure 1b): the alpine plateau region in northwest Sichuan, the Sichuan basin region, and the southwestern Sichuan mountain region [71]. The average altitude of the alpine plateau region in northwestern Sichuan is about 3000–5000 m. The average altitude of the mountainous region in southwestern Sichuan is about 1000–3000 m, and the average altitude of the Sichuan Basin region is about 400–800 m. Therefore, based on the DEM data, Sichuan is divided into three different terrain regions. Subsequently, based on Figure 6, the priority area distribution map in the three different terrain regions is obtained (Figure 7).
The existing PAs in the alpine plateau of the northwest have the largest distribution area, and the distribution area of PCAs is also the largest. Among them, the area of PCAs is 71,309 km2, accounting for about 54.37% of the total area of PCAs in the province. The areas of first-level PCAs and second-level PCAs account for about 37.57% and 62.43% of the total area of PCAs in the region, respectively. The priority area of the RPAs in this area presents the characteristics of “low species diversity–low ecosystem integrity–high ecosystem authenticity”.
The existing PAs in the mountains of southwestern Sichuan have the smallest distribution area and the fewest types of PAs. The number of the priority area distribution of RPAs is also the least in the geographical divisions within this region. The distribution area of PCAs is 28,518 km2, which only accounts for 21.74% of the total area of PCAs. The ratio of the area of the first-level PCAs to the second-level PCAs is about 7:10. The PCAs of the RPAs in this area present the characteristics of “high species diversity–high ecosystem integrity–medium ecosystem authenticity”.
The Sichuan Basin has the most types of PAs. The area of PCAs (excluding those that have been built) is about 31,128 km2, accounting for 23.73% of the total area of PCAs. This area includes 30.92% of the first-level and 69.08% of the second-level. The PCAs of RPAs in this zone present the characteristics of “medium species diversity–medium ecosystem integrity–low ecosystem authenticity” and has a priority area pattern of “more in the south and less in the north, clustered along the edge of the basin”.
3.3. Priority Conservation Reach of RPAs
3.3.1. Overall Spatial Characteristics
The results show that the distribution pattern of the priority conservation reaches (PCRs) is largely affected by the distribution characteristics of the PCAs. According to statistics, its total length is about 9190.72 km, accounting for about 26.84% of the total length of the candidate rivers. The lengths of the first- and second-level PCRs are, respectively, about 3394.43 km and 5796.29 km, accounting for about 9.91% and 16.93% of the total length of the candidate rivers, respectively (Table 3). Most of the PCRs belong to the Yangtze River basin and a few in the Yellow River system. The PCRs belonging to the Yellow River system include mainly those of the Jinsha River system in western and southern Sichuan, the Yalong River system, the first-level tributaries of the Yangtze River in southern Sichuan, parts of the Yangtze River system in northern Sichuan, and the Yellow River system itself. The two levels of PCRs are mixed and staggered, but, in general, their distribution has good continuity and integrity.
3.3.2. Spatial Differentiation Characteristics
Similar to the PCAs of RPAs, the spatial differentiation characteristics of PCRs are also analyzed from the high mountain and plateau region of the northwest, the mountain region of the southwest, and the Sichuan basin region. It was found that the high mountain and plateau region in the northwest has the longest distribution of PCRs, reaching 5256.75 km, accounting for about 57.20% of the province’s total length of PCRs. Among them, the first- and second-level PCRs account for about 43.08% and 56.92% of the length of the PCRs in the region, respectively. They are mainly distributed in the mainstream and tributaries of the Jinsha and Yalong Rivers. On the other hand, the length of the PCRs in the mountain region of southwest Sichuan is about 2334.30 km. The length of these PCRs is the shortest, accounting for only 25.40% of the total length of the PCRs. From the perspective of protection level, the length of the first and second PCRs is the same, and the ratio of the two lengths is about 4:5. From the spatial position, they are mainly distributed in the main branches and tributaries of the Dadu and Anning Rivers.
The length of the PCRs in the Sichuan Basin is about 2781.44 km, accounting for about 30.26% of the total length of the province’s PCRs. From the perspective of protection level, the first-level PCR in this area is relatively short, accounting for only 30.69% of the length of the PCRs in this area. On the other hand, the secondary PCR is relatively long, accounting for about 69.31% of the length of the PCRs in this area. Most of them are distributed in the main and tributary streams of the Minjiang and Tuojiang Rivers. To sum up, the PCRs of Sichuan’s RPAs have obvious characteristics of agglomeration and distribution, which are distributed in the Yangtze and Yellow River basins. The PCRs are also concentrated in the western and southern Jinsha River basin, the Yalong River basin, the upper and lower reaches of the Dadu River, the Sichuan River basin in the southeast, the upper reaches of the Minjiang River in the north, the Bailong River basin in the north, and the Yellow River basin in the north.
4. Discussion
4.1. Theoretical Rationality
Compared to the traditional method of identifying the priority areas that is based only on the species distribution, the EI, WI, and DCI indices of this method are overlaid based on IR. After the overlay calculation, the area of high protection value increases. The superposition results reflect the main principles of identifying RPAs, expand the identification dimension of RPAs, and are conducive to realizing rivers’ “multi-value” protection.
The plan identified in this study has a high protection efficiency for river protected areas. According to relevant studies, Margules [72] and other scholars pointed out that protecting 5–20% of the species habitat area could achieve more than 50% of species protection, based on a multiple PAs case. At the same time, scholars such as Soulé [73] have also proved that the protection goals of only 10% or 12% is far from enough.
This study calculated the protection efficiency of the priority areas by judging whether the range of amphibian (with the county as a unit) or the fish activity range (reaches) is located in the priority areas. The species is said to be protected if priority areas exist within the range of amphibian/fish activities. According to this hypothesis and through further calculation and analysis, it is found that the PCAs (accounting for 26.99% of the province’s land area) can protect more than 85% of the amphibian species of this study, and the PCRs can protect more than 75% of fish. An average PA of 20% can effectively achieve more than 50% of species protection in combination with the above results and the existing practice of PAs [74]. In the case considered in this study, the priority areas are slightly larger than the 20% standard, which may be associated with the unique topography of Sichuan. In summary, the overlay calculation results are reasonable in theory.
The PCAs in the present case are 26.99% of the total area, which may be related to Sichuan’s unique topography and ecological location. Ganzi, Aba, and Liangshan Prefectures, which are rich in biodiversity and fragile in ecological environment, account for 60.29% of the area of Sichuan. We also note that China’s ecological red line area accounts for about 18% of the land area [75]. On the other hand, the ecological red line of Sichuan accounts for 30.45% of the total province’s land area [76], which is also far higher than the national average standard. Moreover, it can effectively supplement the existing PAs in Sichuan, fill in the protection gaps, and form a multi-level and comprehensive provincial RPA system by identifying the classified PCA level. In addition, for a long time, the construction of protected areas in Sichuan Province has mainly focused on protection objects such as forest ecosystems and wild animals, whereas less attention has been paid to protected objects such as fish and amphibians, and, hence, the construction of RPAs has been relatively lagging.
4.2. Realistic Reasonableness
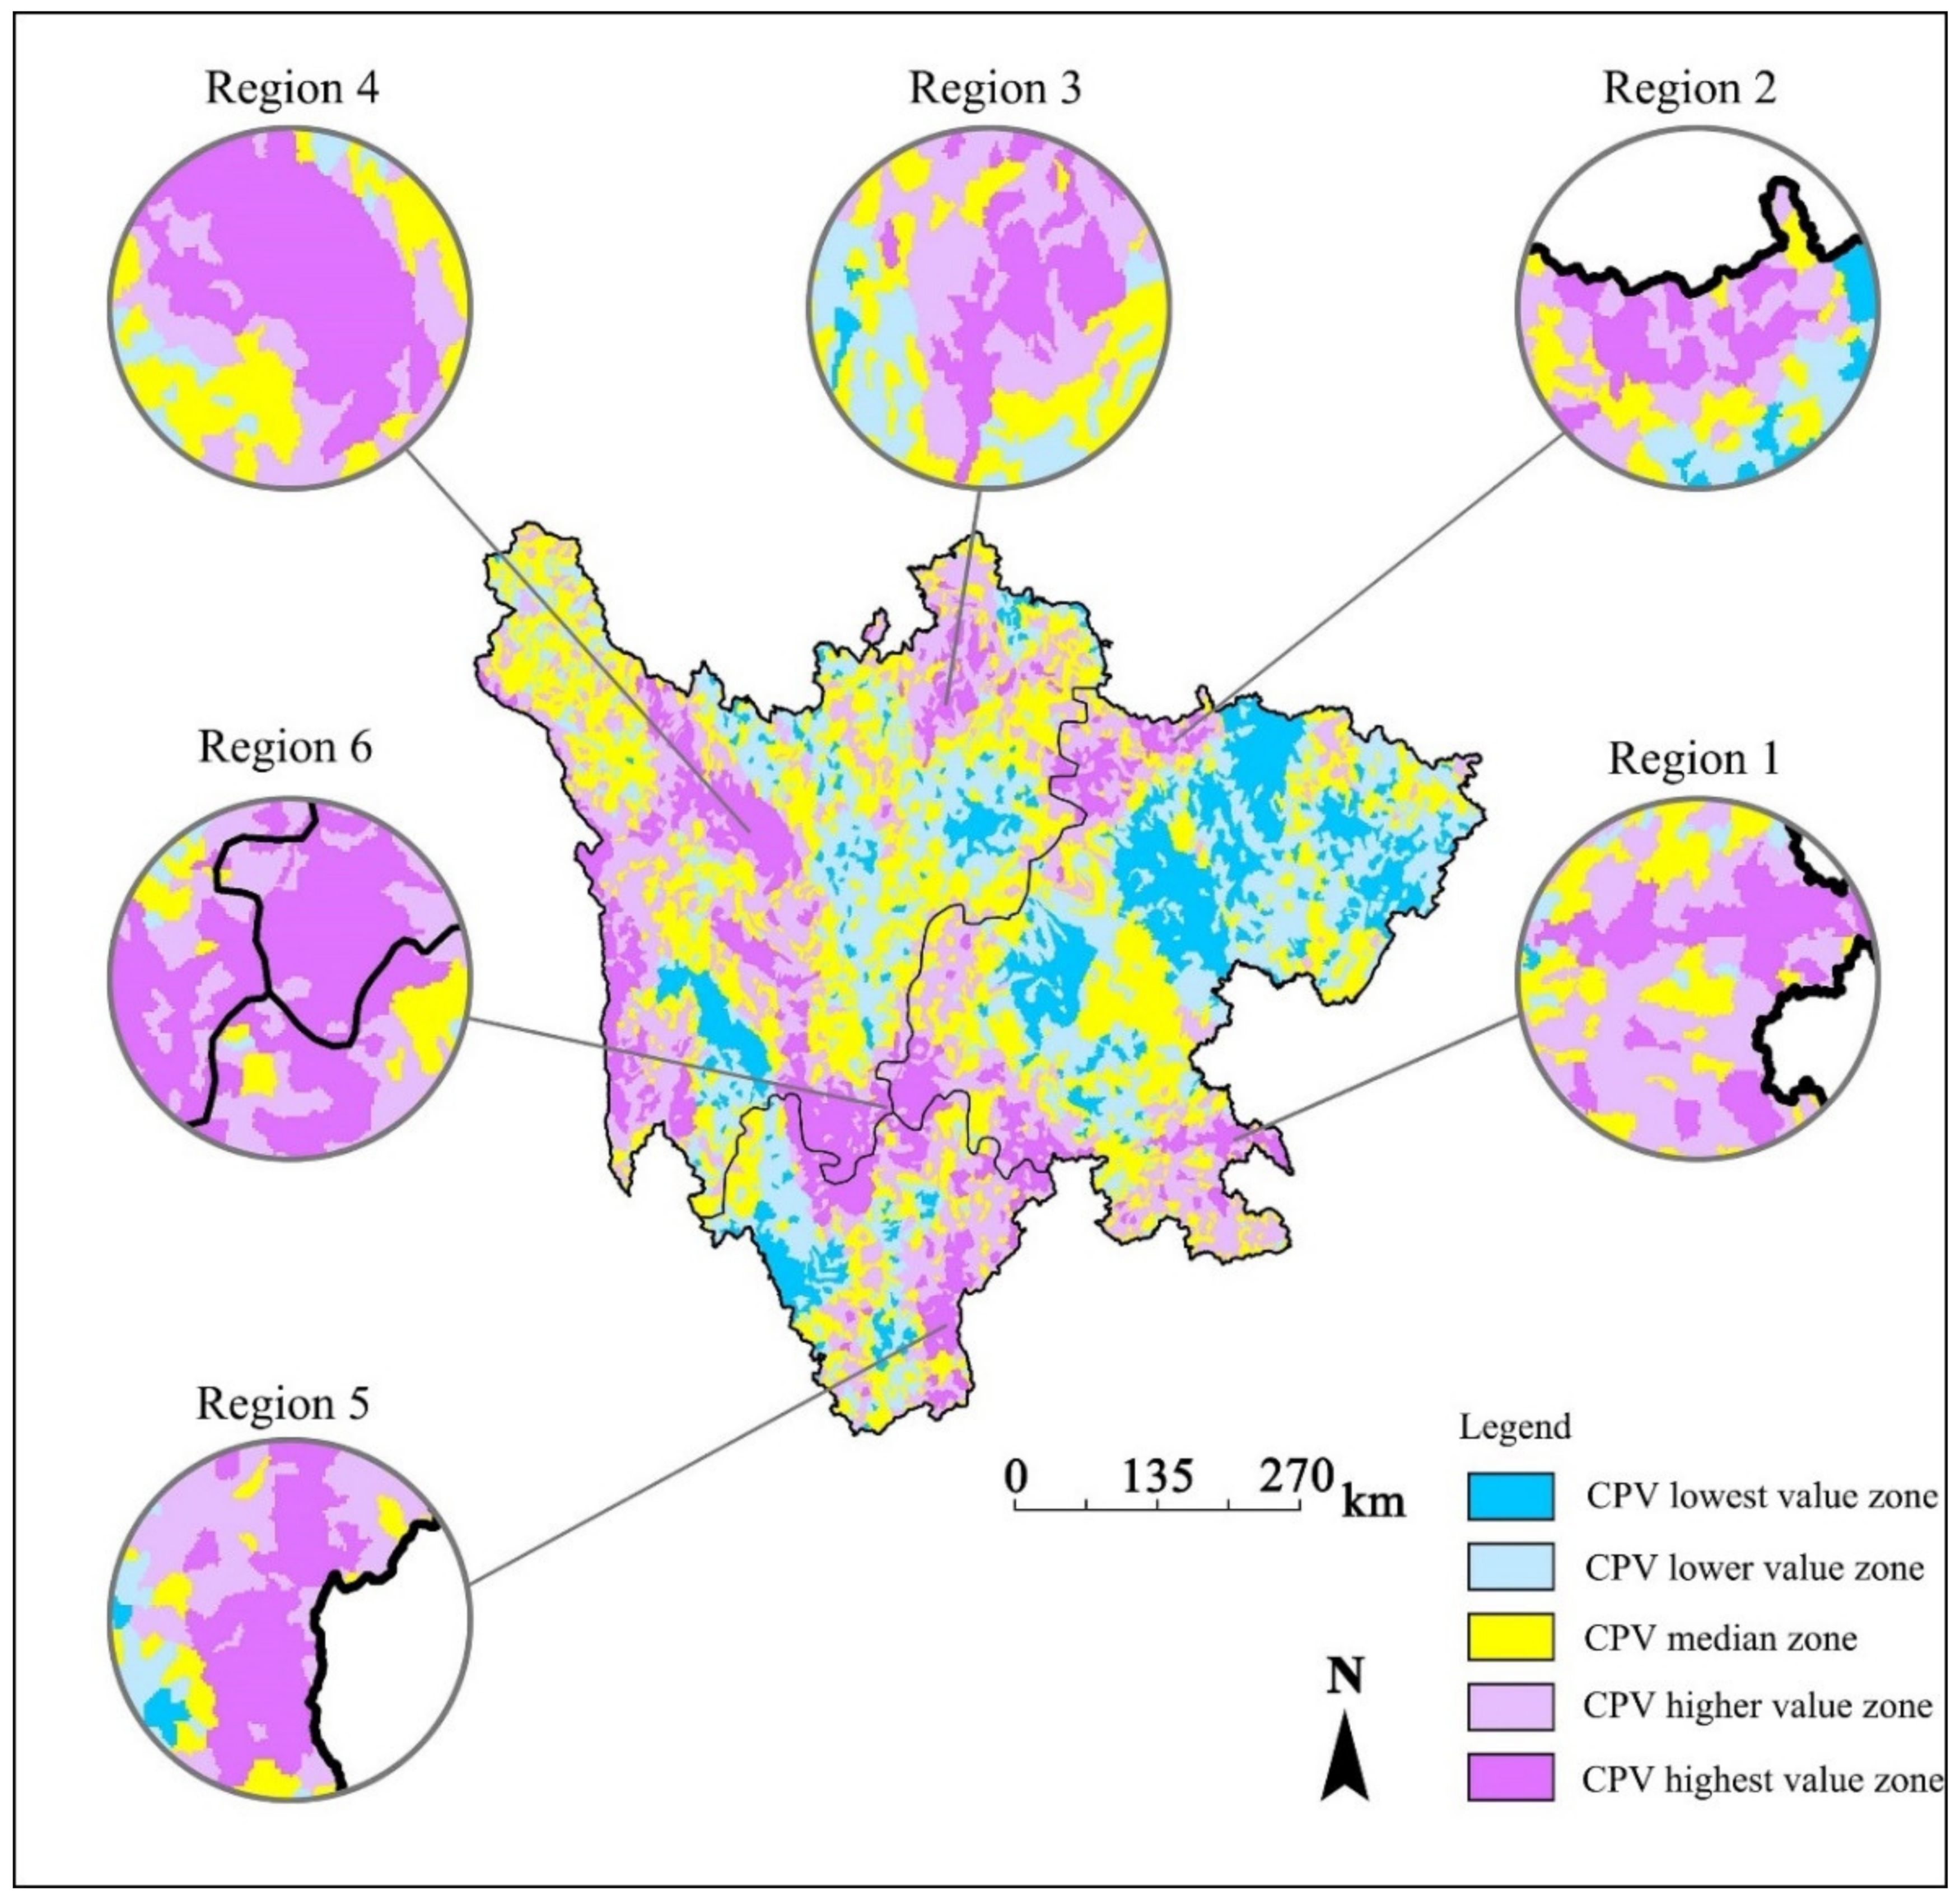
Six high-value gathering regions are selected from the map of SCPV, and the actual conditions of these regions are analyzed to verify whether the calculation results are consistent with them. To ensure the representativeness and comprehensiveness in selecting the high-value regions of CPV, they were selected from different parts of Sichuan. Two were selected from the alpine plateau in northwest Sichuan. One was selected from the southwestern Sichuan mountain region. Another two were selected from the Sichuan basin region. Finally, the remaining one was selected at the junction of the three major terrain regions for verification. This information on the selection of high-value regions of CPV is shown in Figure 8.
Among the six selected regions, region 1 is located in the mainstream of the Yangtze River, and region 2 is located in the Qingzhu River Basin, the third-level tributary of the Yangtze River. Region 3 is located in the Baihe River Basin, the first-level tributary of the Yellow River. Region 4 is located in the Xianshui River Basin, the first-level tributary of the Yalong River. Region 5 is located in the main river basin of the Jinsha River, and region 6 is located at the junction of the three major terrain divisions. The most prominent common characteristics of these six regions are that they are located in less populated areas, far away from Chengdu, Mianyang, Yibin, Leshan, and other major cities. They also have low impacts from human activities, a high wilderness index, and good authenticity of terrestrial ecosystems. In addition, with the small number of dams, the original self-flow state of the river is well preserved, and the river ecosystem has a high authenticity. Low interference of human activities in these areas is conducive to river ecological protection and the construction of future RPAs.
In addition, regions 1, 2, 4, and 6 are rich in fish and amphibian species. Region 5 is located in Ningnan and Butuo counties with prominent biodiversity value, which had been incorporated into the national key ecological function areas in 2016. Regions 1, 5, and 6 are characterized by rich vegetation types, high vegetation coverage, good forest growth, and high stability of resistance and resilience of landscape ecosystems.
The six regions are rich in freshwater species and have good ecosystem integrity and authenticity leading to high protection value. Therefore, the CPV calculated by overlay is consistent with the actual situation.
There are 21 land use types in the PCAs of Sichuan according to statistics, of which woodland (i.e., woodland, shrubland, and sparse woodland) and grassland (i.e., low coverage grassland, medium coverage grassland, and high coverage grassland) are the most. The areas of these two land use types are 53,158 km2 and 50,387 km2, respectively, accounting for about 40.53% and 38.42% of the whole area of PCAs, respectively. On the other hand, the area of cultivated land (i.e., paddy fields and dry land) and construction land (i.e., towns, rural settlements, and other construction lands) is only 19,809 km2 and 501 km2, respectively, accounting for only 15.10% and 0.38% of the entire PCAs, respectively.
The land use types in Sichuan suggest that the two types that may conflict with the construction of RPAs are the land for construction and cultivated land. These land types are concentrated in the basin area. In particular, most of the urban construction land is located in Chengdu and its surrounding areas with almost no priority areas distribution. It further shows that there is almost no spatial overlap among the future RPAs’ construction, urban construction, and agricultural development areas. In addition, the priority area concentrated distribution areas are mostly grassland, woodland, bare rock texture, swamp (concentrated in the Yellow River Basin), and other land types, which are extremely suitable for the construction of RPAs.
In summary, the priority area obtained by the study is compatible with the actual construction of future RPAs and has good feasibility.
5. Conclusions
This study is based on the relevant theory of river ecosystems, starts from the characteristics of RPAs, and combines ecosystem integrity, authenticity, and connectivity based on species value. This paper chooses to select the “linear” dendritic connectivity index (DCI) combined with the “planar” species irreplaceability index (IR), ecological index (EI), and wilderness Index (WI) as an indicator system. Superimposition calculations are performed to identify the priority areas of RPAs in Sichuan Province after unifying the data types. On this basis, the PCRs are determined through aligning by planar.
The total area of high-value areas is about 175,068 km2, accounting for 36.02% of the province, concentrated in the high mountain plateau in the northwest and the southwest mountain regions. The existing PAs is 131,687 km2, covering only 25.08% of the high-value areas of CPV. The remaining 74.92% of the high-value areas still have not been effectively protected, with a huge potential for constructing RPAs in these areas. Moreover, this study considers the natural and socio-economic factors of RPAs, especially the distribution of hydropower stations having a significant influence on the river ecosystem. The degree of aggregation of overall distribution in the high-value zone of CPV is high, indicating that the connectivity between the areas is good. Meanwhile, the high-value zone corresponding to the continuity of the river reach with a high protection value is also good, and scattered distributions of “fragmentation” reaches are few. The good continuity also makes the overall priority area distribution pattern have a good aggregation, which is conducive to the establishment of future PA systems and species protection according to the system protection planning theory. Therefore, the study dimensions of traditional spatial determination of PAs are expanded to research species protection in the past and involve a certain degree of innovation.
The study also has the following shortcomings. First, the types and number of representative species are relatively small, and the accuracy of the species distribution range is not high. The limitation in obtaining data, especially of fish and amphibians, that are from earlier years, may bring in errors to some calculation results and results of the identification of priority areas. Second, the distribution data of existing PAs are incomplete, and the data processing method of “replace points with areas and lines with areas” may affect the accuracy of priority areas distribution. In addition, the weight of each indicator is directly determined by using related methods in the overlay calculation, so there is no multi-scheme comparison. Finally, connectivity barely included river longitudinal connectivity. On the other hand, many places have problems such as bank hardening, and, hence, lateral connectivity cannot easily be ignored.
Further study can appropriately increase the types and number of representative species considered. For example, some water birds, mammals, reptiles, and other species that are closely related to rivers may be included in the calculation model as protection objects. Meanwhile, more accurate determination of the species distribution range and species distribution map can be obtained through other methods, such as field sampling, interviews, MAXENT models, etc. Several different weight combination schemes can also be set to compare and analyze the calculation results of different schemes in the overlay calculation. The different weight combination schemes can also determine the plan that meets the actual situation of PAs more suitably.
Author Contributions
Conceptualization, M.Z. and C.L.; methodology, C.L. and Y.Z.; software, Y.Z.; validation, M.Z., C.L. and P.L.; formal analysis, C.L. and Y.Z.; investigation, Y.H.; resources, C.L. and Y.Z.; data curation, M.Z.; writing—original draft preparation, C.L. and Y.Z.; writing—review and editing, M.Z. and D.M.P.; visualization, P.L.; supervision, M.Z.; project administration, P.L.; funding acquisition, P.L. All authors have read and agreed to the published version of the manuscript.
Funding
This research was funded by National Natural Science Foundation of China (grant number 41761111) and Fulbright Program (FSP-P000287).
Institutional Review Board Statement
Not applicable.
Informed Consent Statement
Not applicable.
Data Availability Statement
The data presented in this study are available on request from the corresponding author.
Acknowledgments
We sincerely thank the Sichuan Provincial Department of Water Resources for its help in data acquisition and material collection. We especially thank Zhou Wei (Ichthyologist at Southwest Forestry University) and Lu Weikun (Yunnan Meteorological Bureau) for their worthwhile suggestions on this paper.
Conflicts of Interest
The authors declare no conflict of interest.
References
- Carrizo, S.F.; Lengyel, S.; Kapusi, F.; Szabolcs, M.; Kasperidus, H.D.; Scholz, M.; Markovic, D.; Freyhof, J.; Cid, N.; Cardoso, A.C.; et al. Critical Catchments for Freshwater Biodiversity Conservation in Europe: Identification, Prioritisation and Gap Analysis. J. Appl. Ecol. 2017, 54, 1209–1218. [Google Scholar] [CrossRef] [Green Version]
- Craig, L.S.; Olden, J.D.; Arthington, A.H.; Entrekin, S.; Hawkins, C.P.; Kelly, J.J.; Kennedy, T.A.; Maitland, B.M.; Rosi, E.J.; Roy, A.H.; et al. Meeting the Challenge of Interacting Threats in Freshwater Ecosystems: A Call to Scientists and Managers. Elementa-Sci. Anthrop. 2017, 5, 72. [Google Scholar] [CrossRef]
- Dudley, N.; Shadie, P.; Stolton, S. Guidelines for Applying Protected Area Management Categories; IUCN: Gland, Switzerland, 2013. [Google Scholar]
- Nel, J.L.; Roux, D.J.; Maree, G.; Kleynhans, C.J.; Moolman, J.; Reyers, B.; Rouget, M.; Cowling, R.M. Rivers in Peril inside and Outside Protected Areas: A Systematic Approach to Conservation Assessment of River Ecosystems. Divers. Distrib. 2007, 13, 341–352. [Google Scholar] [CrossRef]
- Grill, G.; Lehner, B.; Thieme, M.; Geenen, B.; Tickner, D.; Antonelli, F.; Babu, S.; Borrelli, P.; Cheng, L.; Crochetiere, H.; et al. Mapping the World’s Free-Flowing Rivers. Nature 2019, 569, 215–221. [Google Scholar] [CrossRef]
- Yousefi, M.; Jouladeh-Roudbar, A.; Kafash, A. Using Endemic Freshwater Fishes as Proxies of Their Ecosystems to Identify High Priority Rivers for Conservation under Climate Change. Ecol. Indic. 2020, 112, 106–137. [Google Scholar] [CrossRef]
- Dolezsai, A.; Sály, P.; Takács, P.; Hermoso, V.; Erős, T. Restricted by Borders: Trade-Offs in Transboundary Conservation Planning for Large River Systems. Biodivers. Conserv. 2015, 24, 1403–1421. [Google Scholar] [CrossRef] [Green Version]
- Pickens, B.A.; Mordecai, R.S.; Drew, C.A.; Alexander-Vaughn, L.B.; Keister, A.S.; Morris, H.L.C.; Collazo, J.A. Indicator-Driven Conservation Planning across Terrestrial, Freshwater Aquatic, and Marine Ecosystems of the South Atlantic, USA. J. Fish Wildl. Manag. 2017, 8, 219–233. [Google Scholar] [CrossRef] [Green Version]
- Holland, R.A.; Darwall, W.R.T.; Smith, K.G. Conservation Priorities for Freshwater Biodiversity: The Key Biodiversity Area Approach Refined and Tested for Continental Africa. Biol. Conserv. 2012, 148, 167–179. [Google Scholar] [CrossRef]
- Gonçalves, A.S.; Costa, G.C.; Bond-Buckup, G.; Bartholomei-Santos, M.L.; Santos, S. Priority Areas for Conservation within Four Freshwater Ecoregions in South America: A Scale Perspective Based on Freshwater Crabs (Anomura, Aeglidae). Aquat. Conserv. Mar. Freshw. Ecosyst. 2018, 28, 1077–1088. [Google Scholar] [CrossRef]
- Hermoso, V.; Linke, S.; Prenda, J. Identifying Priority Sites for The Conservation of Freshwater Fish Biodiversity in A Mediterranean Basin with A High Degree of Threatened Endemics. Hydrobiologia 2009, 623, 127–140. [Google Scholar] [CrossRef] [Green Version]
- Raghavan, R.; Das, S.; Nameer, P.O.; Bijukumar, A.; Dahanukar, N. Protected Areas and Imperilled Endemic Freshwater Biodiversity in The Western Ghats Hotspot. Aquat. Conserv. Mar. Freshw. Ecosyst. 2016, 26, 78–90. [Google Scholar] [CrossRef]
- Braun, B.M.; Gonçalves, A.S.; Marques, P.M.; Kotzian, C.B. Potential Distribution of Riffle Beetles (Coleoptera: Elmidae) in Southern Brazil. Austral Entomol. 2018, 58, 646–656. [Google Scholar] [CrossRef]
- Khoury, M.; Higgins, J.; Weitzell, R. A Freshwater Conservation Assessment of The Upper Mississippi River Basin Using a Coarse-and Fine-Filter Approach. Freshw. Biol. 2011, 56, 162–179. [Google Scholar] [CrossRef]
- Koyama, A.; Inui, R.; Kanno, K.; Eguchi, K.; Tanabe, A.; Nakajima, J.; Onikura, N.; Minagawa, T. Differences in Conservation Candidate Tidal Rivers by Cross-taxon Analysis in The Japanese Temperate Zone. Aquat. Conserv. Mar. Freshw. Ecosyst. 2020, 30, 2313–2326. [Google Scholar] [CrossRef]
- Paz-Vinas, I.; Loot, G.; Hermoso, V.; Veyssière, C.; Poulet, N.; Grenouillet, G.; Blanchet, S. Systematic Conservation Planning for Intraspecific Genetic Diversity. Proc. R. Soc. B Biol. Sci. 2018, 285, 2017–2746. [Google Scholar] [CrossRef] [Green Version]
- Smith, A.; Schoeman, M.C.; Keith, M.; Erasmus, B.F.N.; Monadjem, A.; Moilanen, A.; Di Minin, E. Synergistic Effects of Climate and Land-Use Change on Representation of African Bats in Priority Conservation Areas. Ecol. Indic. 2016, 69, 276–283. [Google Scholar] [CrossRef] [Green Version]
- Liang, J.; He, X.Y.; Zeng, G.M.; Zhong, M.Z.; Gao, X.; Li, X.; Li, X.D.; Wu, H.P.; Feng, C.T.; Xing, W.L.; et al. Integrating Priority Areas and Ecological Corridors into National Network for Conservation Planning in China. Sci. Total Environ. 2018, 626, 22–29. [Google Scholar] [CrossRef]
- Linke, S.; Pressey, R.L.; Bailey, R.C.; Norris, R.H. Management Options for River Conservation Planning: Condition and Conservation Re-visited. Freshw. Biol. 2007, 52, 918–938. [Google Scholar] [CrossRef]
- Nel, J.L.; Reyers, B.; Roux, D.J.; Cowling, R.M. Expanding Protected Areas Beyond Their Terrestrial Comfort Zone: Identifying Spatial Options for River Conservation. Biol. Conserv. 2009, 142, 1605–1616. [Google Scholar] [CrossRef]
- Li, P.; Zhang, Y.; Lu, W.; Zhao, M.; Zhu, M. Identification of Priority Conservation Areas for Protected Rivers Based on Ecosystem Integrity and Authenticity: A Case Study of the Qingzhu River, Southwest China. Sustainability 2020, 13, 323. [Google Scholar] [CrossRef]
- Li, L.Z.; Li, Y.Y.; Wang, Z.G.; Hao, X.P.; Liu, X.J. Research on Interconnected River System Network: Conceptual Framework. J. Nat. Resour. 2011, 26, 513–522. [Google Scholar]
- Chen, A.; Miao, W.; Zhou, X.G.; Wen, Z.Z.; Gan, F.M.; Fu, X.W.; Hui, E.Q. A Holistic Method of Riverine Connectivity Assessment. J. Yangtze River Sci. Res. Inst. 2020, 37, 21–27. [Google Scholar] [CrossRef]
- Pinchot, G. The Mississippi: Aymptomatic Treatment or Permanent Cure? J. Foerstry 1928, 26, 220–230. [Google Scholar] [CrossRef]
- Mendoza, A.; Berezowsky, M.; Caballero, C.; Arganis-Juárez, M. Alteration of The Flow Distribution at A River Bifurcation Caused by A System of Upstream Dams: Case of The Grijalva River basin, Mexico. Earth Surf. Proc. Landf. 2022, 47, 509–521. [Google Scholar] [CrossRef]
- Bulti, A.T. The Influence of Dam Construction on The Catchment Hydrologic Behavior and Its Effects on A Discharge Forecast in Hydrological Models. Water Resour. Manag. 2021, 35, 2023–2037. [Google Scholar] [CrossRef]
- Yi, Y.J.; Gao, Y.N.; Zhang, S.H. The Impact of Dams on The River Connectivity of The Two Largest River Basins in China. River Res. Appl. 2022, 38, 185–193. [Google Scholar] [CrossRef]
- David, G.; Céline, C.; Morgane, B.; Franck, C. Ecological Connectivity of The Upper Rhône River: Upstream Fish Passage at Two Successive Large Hydroelectric Dams for Partially Migratory Species. Ecol. Eng. 2022, 178, 106545. [Google Scholar] [CrossRef]
- Mu, B.; Tian, G.H.; Xin, G.Y.; Hu, M.; Yang, P.P.; Wang, Y.W.; Xie, H.; Mayer, A.L.; Zhang, Y.L. Measuring Dynamic Changes in The Spatial Pattern and Connectivity of Surface Waters Based on Landscape and Graph Metrics: A Case Study of Henan Province in Central China. Land 2021, 10, 471. [Google Scholar] [CrossRef]
- Keesstra, S.D.; Davis, J.; Masselink, R.H.; Casalí, J.; Peeters, E.T.; Dijksma, R. Coupling Hysteresis Analysis with Sediment and Hydrological Connectivity in Three Agricultural Catchments in Navarre, Spain. J. Soils Sediments 2019, 19, 1598–1612. [Google Scholar] [CrossRef] [Green Version]
- Richards, D.R.; Moggridge, H.L.; Warren, P.H.; Maltby, L. Impacts of Hydrological Restoration on Lowland River Floodplain Plant Communities. Wetl. Ecol. Manag. 2020, 28, 403–417. [Google Scholar] [CrossRef]
- Ministry of Water Resources of the People’s Republic of China. China Water Statistical Yearbook; China Water and Power Press: Beijing, China, 2020.
- Department of Ecology and Environment of Sichuan Province. Biodiversity Overview. Available online: http://sthjt.sc.gov.cn/sthjt/swdyxbh/2021/5/21/616b01085be540c696d0604f5dfd2f14.shtml (accessed on 20 September 2021).
- Biodiversity Conservation of Yunnan Forestry in China. Available online: https://www.forestry.gov.cn/main/5462/20201009/114824241328759.html (accessed on 22 November 2021).
- Wu, H.P.; Chen, J.; Xu, J.; Zeng, G.M.; Sang, L.H.; Liu, Q.; Yin, Z.J.; Dai, J.; Yin, D.C.; Liang, J.; et al. Effects of Dam Construction on Biodiversity: A Review. J. Clean. Prod. 2019, 221, 480–489. [Google Scholar] [CrossRef]
- Laurich, B.; Drake, C.; Gorman, O.T.; Irvine, C.; Mac Laurin, J.; Chartrand, C.; Hebert, C.E. Ecosystem Change and Population Declines in Gulls: Shifting Baseline Considerations for Assessing Ecological Integrity of Protected Areas. J. Great Lakes Res. 2019, 45, 1215–1227. [Google Scholar] [CrossRef]
- He, S.Y.; Su, Y. Authenticity, Integrity, Connectivity and Coordination-Conceptual Analysis and Practical Significance for the Establishment of the National Park System. Environ. Prot. 2019, 47, 28–34. [Google Scholar]
- Liu, X.N.; Liu, C.L.; Zhang, C.L.; Wei, Y.; Huang, B.R. Ecosystem Integrity and Authenticity Assessment Framework in the Qinghai-Tibet Plateau National Park Cluster. Acta Ecol. Sin. 2021, 41, 833–846. [Google Scholar]
- Primack, R.B. Essentials of Conservation Biology; Sinauer Associates: Sunderland, UK, 2006. [Google Scholar]
- Baturina, N.S. Functional Structure of River Ecosystems: Retrospective of the Development of Contemporary Concepts (Review). Inland Water Biol. 2019, 12, 3–11. [Google Scholar] [CrossRef]
- Azevedo-Santos, V.M.; Frederico, R.G.; Fagundes, C.K.; Pompeu, P.S.; Pelicice, F.M.; Padial, A.A.; Nogueira, M.G.; Fearnside, P.M.; Lima, L.B.; Daga, V.S.; et al. Protected Areas: A Focus on Brazilian Freshwater Biodiversity. Divers. Distrib. 2019, 25, 442–448. [Google Scholar] [CrossRef] [Green Version]
- IUCN. Publishing with IUCN: IUCN Glossary of Definitions. Available online: https://www.iucn.org/resources/publications/publishing-iucn (accessed on 11 January 2021).
- Kietzka, G.J.; Pryke, J.S.; Gaigher, R.; Samways, M.J. Webs of Well-Designed Conservation Corridors Maintain River Ecosystem Integrity and Biodiversity in Plantation Mosaics. Biol. Conserv. 2021, 254, 108965. [Google Scholar] [CrossRef]
- Huang, B.R.; Ouyang, Z.Y.; Zheng, H.; Wang, X.K.; Miao, H. Connotation of Ecological Integrity and Its Assessment Methods: A Review. Ying Yong Sheng Tai Xue Bao 2006, 17, 196–202. [Google Scholar]
- NWSRS. About the WSR Act: Safeguarding the Character of Our Nation’s Unique Rivers. Available online: http://www.rivers.gov/wsr-act.php (accessed on 11 January 2021).
- Clewell, A.F. Restoring for Natural Authenticity. Ecol. Restor. 2000, 18, 216–217. [Google Scholar] [CrossRef] [Green Version]
- Dudley, N. Authenticity in Nature: Making Choices About the Naturalness of Ecosystems; Routledge: London, UK, 2011. [Google Scholar] [CrossRef]
- Roberto, I.J.; Loebmann, D. Composition, Distribution Patterns, and Conservation Priority Areas for the Herpetofauna of the State of Ceara, Northeastern Brazil. Salamandra 2016, 52, 134–152. [Google Scholar]
- Benez-Secanho, F.J.; Dwivedi, P.; Ferreira, S.; Hepinstall-Cymerman, J.; Wenger, S. Trade-offs Between the Value of Ecosystem Services and Connectivity Among Protected Areas in the Upper Chattahoochee Watershed. Environ. Manag. 2022, 1–15. [Google Scholar] [CrossRef]
- Rodeles, A.A.; Galicia, D.; Miranda, R. A New Method to Include Fish Biodiversity in River Connectivity Indices with Applications in Dam Impact Assessments. Ecol. Indic. 2020, 117, 106605. [Google Scholar] [CrossRef]
- Spence, B.C.; Hughes, R.M. An Ecosystem Approach to Salmonid Conservation; ManTech Environmental Research Services, Corporation: Corvallis, OR, USA, 1996. [Google Scholar]
- Xu, D.; Wang, W.; Yuan, X. Hydrologic Analysis and Computation; China Water and Power Press: Beijing, China, 2018. [Google Scholar]
- CBD. The Ecosystem Approach; The Secretariat of the Convention on Biological Diversity: Montreal, QC, Canada, 2004. [Google Scholar]
- Browman, H.; Stergiou, K.I. Marine Protected Areas as a Central Element of Ecosystem-Based Management: Defining Their Location, Size and Number. Mar. Ecol. Prog. Ser. 2004, 274, 271–272. [Google Scholar]
- Shepherd, G. The Ecosystem Approach Five Steps to Implementation; IUCN: Gland, Switzerland; Cambridge, UK, 2004. [Google Scholar]
- Linke, S.; Norris, R.H.; Pressey, R.L. Irreplaceability of River Networks: Towards Catchment-Based Conservation Planning. J. Appl. Ecol. 2008, 45, 1486–1495. [Google Scholar] [CrossRef]
- Dong, Z.R.; Sun, D.Y.; Zhao, J.Y.; Zhang, J. Holistic Conceptual Model for the Structure and Function of River Ecosystems. Adv. Water Sci. Methodol. 2010, 21, 550–559. [Google Scholar]
- Margules, C.R.; Pressey, R.L. Systematic Conservation Planning. Nature 2000, 405, 243–253. [Google Scholar] [CrossRef]
- Rondinini, C.; Wilson, K.A.; Boitani, L.; Grantham, H.; Possingham, H.P. Tradeoffs of Different Types of Species Occurrence Data for Use in Systematic Conservation Planning. Ecol. Lett. 2006, 9, 1136–1145. [Google Scholar] [CrossRef]
- Li, X.; Tian, W. Dynamic Evaluation of Ecological Integrity Based on Landscape Pattern Index. J. Univ. Chin. Acad. Sci. 2012, 29, 780–785. [Google Scholar] [CrossRef]
- Fan, L.; Zhao, J.; Wang, Y.; Ren, Z.; Zhang, H.; Guo, X. Assessment of Night-Time Lighting for Global Terrestrial Protected and Wilderness Areas. Remote Sens. 2019, 11, 2699. [Google Scholar] [CrossRef] [Green Version]
- Mammides, C. A Global Analysis of The Drivers of Human Pressure Within Protected Areas at The National Level. Sustain. Sci. 2020, 15, 1223–1232. [Google Scholar] [CrossRef]
- Gavin, M.C.; McCarter, J.; Berkes, F.; Sterling, E.J.; Turner, N.J. Protected Land: Many Factors Shape Success. Science 2018, 361, 561. [Google Scholar] [CrossRef]
- Wan, J.Z.; Wang, C.J.; Yu, F.H. Human Footprint and Climate Disappearance in Vulnerable Ecoregions of Protected Areas. Glob. Planet. Chang. 2018, 170, 260–268. [Google Scholar] [CrossRef]
- Sanderson, E.W.; Jaiteh, M.; Levy, M.A.; Redford, K.H.; Wannebo, A.V.; Woolmer, G. The human footprint and The Last of The Wild: The Human Footprint is A Global Map of Human Influence on The Land Surface, Which Suggests That Human Beings Are Stewards of Nature, Whether We Like It or Not. BioScience 2002, 52, 891–904. [Google Scholar] [CrossRef]
- Cote, D.; Kehler, D.G.; Bourne, C.; Wiersma, Y.F. A New Measure of Longitudinal Connectivity for Stream Networks. Landsc. Ecol. 2009, 24, 101–113. [Google Scholar] [CrossRef] [Green Version]
- Wang, Q.; Pang, X.; Li, X.M.; Wang, Z.J.; Yuan, X.Z.; Zhang, Y.G. Assessment Method for the Influence of Hydroelectric Dams on the Physical Habitat quality and Longitudinal Connectivity of Rivers: A Case Study of the Wubu and Zaodu Rivers. Acta Ecol. Sin. 2019, 39, 5508–5516. [Google Scholar] [CrossRef]
- Yang, R.; Cao, Y.; Hou, S.; Peng, Q.; Wang, X.; Wang, F.; Tseng, T.H.; Yu, L.; Carver, S.; Convery, I.; et al. Cost-Effective Priorities for the Expansion of Global Terrestrial Protected Areas: Setting Post-2020 Global and National Targets. Sci. Adv. 2020, 6, 1–8. [Google Scholar] [CrossRef]
- Yu, H.; Zhong, L.S.; Zeng, Y.X. Research on Identification of Potential Regions of National Parks in China. J. Nat. Resour. 2018, 33, 1766–1780. [Google Scholar]
- Li, H.X.; Xu, L.; Feng, N.N.; Lu, A.X.; Chen, W.; Wang, Y.P. Occurrence, Risk Assessment, and Source of Heavy Metals in Liaohe River Protected Area from the Watershed of Bohai Sea, China. Mar. Pollut. Bull. 2021, 169, 1–12. [Google Scholar] [CrossRef]
- Chen, J. Sichuan Yearbook; Sichuan Yearbook Editorial Committee: Chengdu, China, 2019. [Google Scholar]
- Margules, C.R.; Sarkar, S. Systematic Conservation Planning; Cambridge University Press: Cambridge, UK, 2007. [Google Scholar]
- Soulé, M.E.; Sanjayan, M.A. Ecology: Conservation Targets: Do They Help? Science 1998, 279, 2060–2061. [Google Scholar] [CrossRef]
- Proctor, S.; McClean, C.J.; Hill, J.K. Protected Areas of Borneo Fail to Protect Forest Landscapes with High Habitat Connectivity. Biodivers. Conserv. 2011, 20, 2693–2704. [Google Scholar] [CrossRef]
- The Central People’s Government of the People’s Republic of China. Biodiversity Conservation in China. Available online: http://www.gov.cn/zhengce/2021-10/08/content_5641289.htm (accessed on 27 October 2021).
- The People’s Government of Sichuan Province. Biodiversity Biodiversity Overview. Available online: http://www.sc.gov.cn/10462/c103044/2018/7/25/2423b65147be466088c0e894284796fd.shtml (accessed on 27 October 2021).
Figure 1.
Geographic information of the study area. (a) Geographical location of Sichuan Province, (b) DEM and terrain division in Sichuan, (c) spatial distribution of rivers in Sichuan.
Figure 1.
Geographic information of the study area. (a) Geographical location of Sichuan Province, (b) DEM and terrain division in Sichuan, (c) spatial distribution of rivers in Sichuan.

Figure 2.
Spatial distribution of nine types of PAs in Sichuan. (a) Raw data of PAs, (b) processed PAs’ data.
Figure 2.
Spatial distribution of nine types of PAs in Sichuan. (a) Raw data of PAs, (b) processed PAs’ data.

Figure 3.
Framework of identifying the priority areas of RPAs.

Figure 4.
Framework of determination of priority conservation reaches.

Figure 5.
Spatial distribution of comprehensive protection value in Sichuan.

Figure 6.
Priority conservation areas’ (PCAs) distribution of RPAs in Sichuan.

Figure 7.
Priority areas distribution map of the three terrain regions in Sichuan. (a) the alpine plateau region in northwest Sichuan, (b) the Sichuan basin region, (c) the southwestern Sichuan mountain region.
Figure 7.
Priority areas distribution map of the three terrain regions in Sichuan. (a) the alpine plateau region in northwest Sichuan, (b) the Sichuan basin region, (c) the southwestern Sichuan mountain region.

Figure 8.
Selection of CPV realistic level rationality verification regions.


Table 1.
Research data and their sources.
| Category | Name | Data Metrics | Data Resource | Year |
|---|---|---|---|---|
| Physical geography | Global land cover dataset | 30 m × 30 m resolution; includes 6 first-class types and 25 s-class types | Tsinghua University, China | 2017 |
| China DEM | 250 m × 250 m resolution | Resource Environmental Science and Data Center, Chinese Academy of Sciences | 2003 | |
| 1 million vegetation types in China | 1 km × 1 km resolution; reflect the distribution of 796 vegetation groups | 2001 | ||
| China NDVI Annual Vegetation Index | 1 km × 1 km resolution | 2018 | ||
| Sichuan Province Land Use Data | 1 km × 1 km resolution; includes 6 first-class types and 25 s-class types | 2018 | ||
| Distribution map of main river systems in Sichuan Province | JPG format; includes the mainstream of the Yangtze and Yellow Rivers and their important tributaries | Sichuan Bureau of Surveying, Mapping and Geographic Information | 2017 | |
| List and distribution information of fish species in Sichuan Province | includes 238 fish species’ geographic distribution information | Sichuan Fish | 1994 | |
| Distribution List of Amphibians and Reptiles in Sichuan Province | includes information on the geographic distribution of 107 amphibian species and 115 reptile species | List of Distribution of Amphibians and Reptiles in Sichuan Province | 2018 | |
| Distribution Information of PAs in Sichuan Province | Polygon vector data of .shp format | WDPA World Protected Area Database; website of relevant departments in Sichuan Province | 2018 | |
| Socio- economic | Global night light data set | 1 km × 1 km resolution; DMSP-OLS nighttime lights time series | National Oceanic and Atmospheric Administration | 2013 |
| Global Reservoir/Dam Data Set | Polygon/Point vector data of .shp format; includes 7320 reservoirs’/dams’ spatial distribution worldwide | Global Dam Watch International Cooperation Organization | 2019 | |
| China’s provincial, prefecture, district, and county administrative boundary data | Polygon vector data of .shp format; includes administrative divisions of provinces, prefectures, and counties in China | Resource Environmental Science and Data Center, Chinese Academy of Sciences | 2015 | |
| Spatial distribution of highways in Sichuan | linear vector data of .shp format; includes road network and highway network from levels one to four | National Geographic Information Resource Directory Service System | 2015 | |
| Spatial distribution of railways in Sichuan | linear vector data of .shp format; includes the spatial distribution of major railways in Sichuan Province | National Geographic Information Resource Directory Service System | 2015 | |
| Sichuan population data | number of permanent residents at for each county at the end of the year | Sichuan Statistical Yearbook 2019 | 2019 | |
| Sichuan GDP data | Sichuan Statistical Yearbook 2019 | 2019 | ||
| List of hydropower stations in Sichuan | includes 152 hydropower stations/reservoir directories and related basic information | National Energy Administration Dam Safety Monitoring Center | 2020 |
Table 2.
Statistics of calculation results of comprehensive protection value.
| Zone | Range | Area (km2) | Ratio (%) | |
|---|---|---|---|---|
| High value | Highest | (44.95–56.21) | 61,915 | 12.74 |
| Higher | (38.34–44.94) | 115,153 | 23.28 | |
| Medium value | Medium | (32.43–38.33) | 136,131 | 28.01 |
| Low value | Lower | (26.17–32.42) | 115,467 | 23.76 |
| Lowest | (10.61–26.16) | 59,322 | 12.21 | |
| Aggregate | (10.61–56.21) | 485,988 | 100.00 | |
Table 3.
Statistics of priority area calculation results.
| Sort | Class | Area (km2)/ Length (km) | Proportion (%) |
|---|---|---|---|
| Priority conservation areas (PCAs) | First | 48,430 | 9.97 |
| Second | 82,732 | 17.02 | |
| Aggregate | 131,162 | 26.99 | |
| Priority conservation reaches (PCRs) | First | 3394.43 | 9.91 |
| Second | 5796.29 | 16.93 | |
| Aggregate | 9191.72 | 26.84 |
Publisher’s Note: MDPI stays neutral with regard to jurisdictional claims in published maps and institutional affiliations. |
© 2022 by the authors. Licensee MDPI, Basel, Switzerland. This article is an open access article distributed under the terms and conditions of the Creative Commons Attribution (CC BY) license (https://creativecommons.org/licenses/by/4.0/).
Share and Cite
MDPI and ACS Style
Zhao, M.; Li, C.; Perry, D.M.; Zhang, Y.; He, Y.; Li, P. Connectivity Index-Based Identification of Priority Area of River Protected Areas in Sichuan Province, Southwest China. Land 2022, 11, 490. https://doi.org/10.3390/land11040490
AMA Style
Zhao M, Li C, Perry DM, Zhang Y, He Y, Li P. Connectivity Index-Based Identification of Priority Area of River Protected Areas in Sichuan Province, Southwest China. Land. 2022; 11(4):490. https://doi.org/10.3390/land11040490
Chicago/Turabian StyleZhao, Min, Chenyang Li, Denielle M. Perry, Yuxiao Zhang, Yuwen He, and Peng Li. 2022. "Connectivity Index-Based Identification of Priority Area of River Protected Areas in Sichuan Province, Southwest China" Land 11, no. 4: 490. https://doi.org/10.3390/land11040490
Note that from the first issue of 2016, this journal uses article numbers instead of page numbers. See further details here.