Article

Impact of Local Grasslands on Wild Grass Pollen Emission in Bavaria, Germany

1
TUM School of Life Sciences, Ecoclimatology, Technical University of Munich, 85354 Freising, Germany
2
Bavarian State Research Center for Agriculture (LfL), Institute for Crop Science and Plant Breeding, 85354 Freising, Germany
3
Department of Botany, Ecology and Plant Physiology, University of Córdoba (UCO), 14071 Cordova, Spain
4
ZAUM-Center of Allergy & Environment, Member of the German Center for Lung Research (DZL), Technical University of Munich/Helmholtz Zentrum Munich, 80802 Munich, Germany
5
Department of Environmental Medicine, Faculty of Medicine, University of Augsburg, 86156 Augsburg, Germany
6
Center for Allergy Research and Education (CK-CARE), 7265 Davos, Switzerland
7
Department of Ecology, School of Biology, Faculty of Sciences, Aristotle University of Thessaloniki, 54124 Thessaloniki, Greece
8
Institute for Advanced Study, Technical University of Munich, 85748 Garching, Germany
*
Author to whom correspondence should be addressed.
Land 2022, 11(2), 306; https://doi.org/10.3390/land11020306
Submission received: 18 January 2022 / Revised: 10 February 2022 / Accepted: 15 February 2022 / Published: 17 February 2022
(This article belongs to the Topic Climate Change and Environmental Sustainability)

Abstract

:
Meteorological conditions and the distribution of pollen sources are the two most decisive factors influencing the concentration of airborne grass pollen. However, knowledge about land-use types, their potential pollen emission, and the importance of local sources remains limited. In this study, wild grass pollen concentrations from 27 stations in Bavaria, Germany, were linked to potential pollen within a 30 km radius. Agricultural grass pollen sources were derived from the InVeKos database, which contains detailed information on agricultural land-use types and their spatial distribution. Non-agricultural grassland was identified by OpenStreetMap. Further source classification was conducted using a cultivation intensity indicator and wind direction. We show that the grassland percentage and pollen concentrations, specified as annual pollen integral and pollen peak vary strongly between pollen stations. Correlation analyses indicated that the impact of the grassland on pollen concentration was greater within 10 km of the pollen traps. At greater distances, the correlation coefficient between the grassland percentage and pollen indicators steadily declined.

1. Introduction

Allergy-inducing pollen is the most common cause of outdoor allergies across Europe [1,2], affecting 14.8% of the population in Germany [3]. Specifically, pollen-related asthma was predicted to increase in the future due to higher sensitization rates toward pollen allergies or progressive interaction between air pollutants and pollen [4,5], although it seems to stabilize at a high level in Germany [6]. Among the pollen species triggering hay fever, those from birch and grass are the most relevant in Europe and specifically in Germany, as more than 90% of patients allergic to pollen are sensitive to these two species [7,8,9]. In Germany, hay fever symptoms associated with grass pollen mainly occur from May to July in parallel with the main grass pollen season. Pollen emission is highest, i.e., most grasses flower, at the beginning of June. The pollen concentration and hay fever symptoms are, to a certain degree, directly connected; thus, an increasing amount of pollen in the air induces more severe hay fever symptoms [10,11].
Around 10% of all plant species are wind-pollinated [12], i.e., their pollen is transported over short to long distances (a few meters to over 100 km) [13]. The literature provides a variety of definitions for short-, mid-, and long-distance pollen transport without differentiating between species. Sofiev and colleagues [14] suggested the following three different scales for pollen transport: micro- and local-scale (meters to kilometers), regional (up to around 100 km), and long-range (>100 km) transport. The transport distance of pollen strongly depends on the release height and the pollen size, weight, and shape. Compared to other wind-pollinated plant species, grass pollen has considerably larger grain sizes (20–55 µm) [15] and its height of release is low; both factors reduce the possibility of long-distance atmospheric transport and instead facilitate transport at local and regional scales (up to 100 km) [16,17,18,19]. This also explains why the grass pollen concentration differs more in the first 10 m above ground than birch pollen [20]. Due to the abundance of widespread vegetation up to 1500 m above sea level (a.s.l.), the pollen concentration remains mostly unchanged and only decreases at higher altitudes [18,21].
Plant phenology and the transport of airborne pollen depend largely on meteorological parameters, such as air temperature, precipitation, air humidity, and wind speed/direction [22]. These parameters, in addition to atmospheric CO2 concentration [23], precipitation in spring [24], and land use/management [25], also have a strong impact on the amount of pollen being released.
Furthermore, the grass pollen concentration and composition are strongly influenced by the spatial source distribution [26,27]. In turn, the source distribution is strongly affected by land use [28,29] and changes in land use [30]. The land area of Germany is predominantly used for agriculture and forestry (87%); built-up areas occupy 9% of the area [31], and there is a small amount of completely unused land (<1%) [31]. The type of land use crucially determines the habitat composition, biodiversity, and processes in the ecosystem [32]. The potential area for grass pollen release is much smaller in urban than rural areas [33,34,35,36,37,38]. For cities, sources for grass pollen are mainly found in parks, private dormitory gardens, and roadside greenery, which can be classified as non-agricultural grassland. Rural areas are predominantly covered by farmland and forest. In forests, potential grass pollen sources occur only at the edges and in recently afforested/reforested areas. Agricultural grasslands, as the main potential source for grass pollen, can be roughly divided into three basic types of grassland as follows: arable land growing cereals, pastures, and meadows. Although cropland accounts for the largest proportion of the land area, most of the cereals grown there do not emit pollen (wheat—Triticum aestivum) or they are too large and heavy to be transported over long distances (maize—Zea mays), so that only a very small proportion of cereal pollen (e.g., rye—Secale cereale, which is rarely grown near the pollen stations) is transported over distances of more than 500 m [39]. In comparison, emitted pollen from pastures and meadows are much smaller and lighter and can thus be transported further.
The frequency and timing of cutting determines whether grasses reach maturity (the flowering stage) and are able to release pollen [25]. On pastures, the potential pollen release is determined by the number of animals per surface unit, animal species, and duration of grazing. Most agricultural grasslands are intensively cultivated throughout the year, resulting in many cuts (up to six times). As a result, the majority of agriculturally cultivated grasses do not flower, and only species with very early flowering dates, such as meadow foxtail (Alopecurus pratensis), emit pollen. In contrast, on uncultivated land or land used at low intensity, the probability of flowering is much higher. It has been assumed that most species do not flower when cut at least twice per year [40].
Agricultural financial funding programs by the state entail a limitation of cuts per year and a strict regulation of the timing of the first cut. In Bavaria, Germany, Bayerisches Kulturlandschaftsprogramm (KULAP) and contractual nature conservation (Bayerisches Vertragsnaturschutzprogramm, VNP) are the most important programs for management in cultural landscapes hosted by the state. These programs outline the conditions under which agricultural holdings receive financial subsidies in return for applying specific measures to their land. This entails, among other conditions, the establishment of grassland on sensitive areas (KULAP), non-utilization of biotope category meadow, and the delay of the first cut (VNP). Considering high cutting frequencies in managed grasslands, attention should be paid to the field margins and fallow areas where the cutting frequency is predicted to be low. Another decisive factor for the pollen concentrations/pollen deposition at a site is its distance from the source and the distribution of sources in the surroundings.
The dispersal of cereal pollen around cultivated fields is strongly influenced by harvesting activities [41]. In another study, pollen release from grasses was found to have declined over the last century due to changes in land use accompanied by higher cultivation intensity [42]. In a study that looked at the impact of green spaces (arboreal species), it was shown that the pollen dispersal is strongly dependent on species and that pollen concentrations are unevenly distributed in urban areas [43]. In contrast to these studies and other well-investigated aspects, little is known about how wild grass pollen concentration is affected by the type of land use and management intensity. The main research aim of our study was to investigate the relationship between the pollen concentrations of wild grasses and potential pollen sources, taking into account distance and management intensity. Grass pollen concentrations were measured in daily resolution at different locations in Bavaria, Germany in 2015. The analysis included plotting the distance-based relationship between pollen concentration and distribution of potential pollen sources outlining spatial differences with land use/management.

2. Materials and Methods
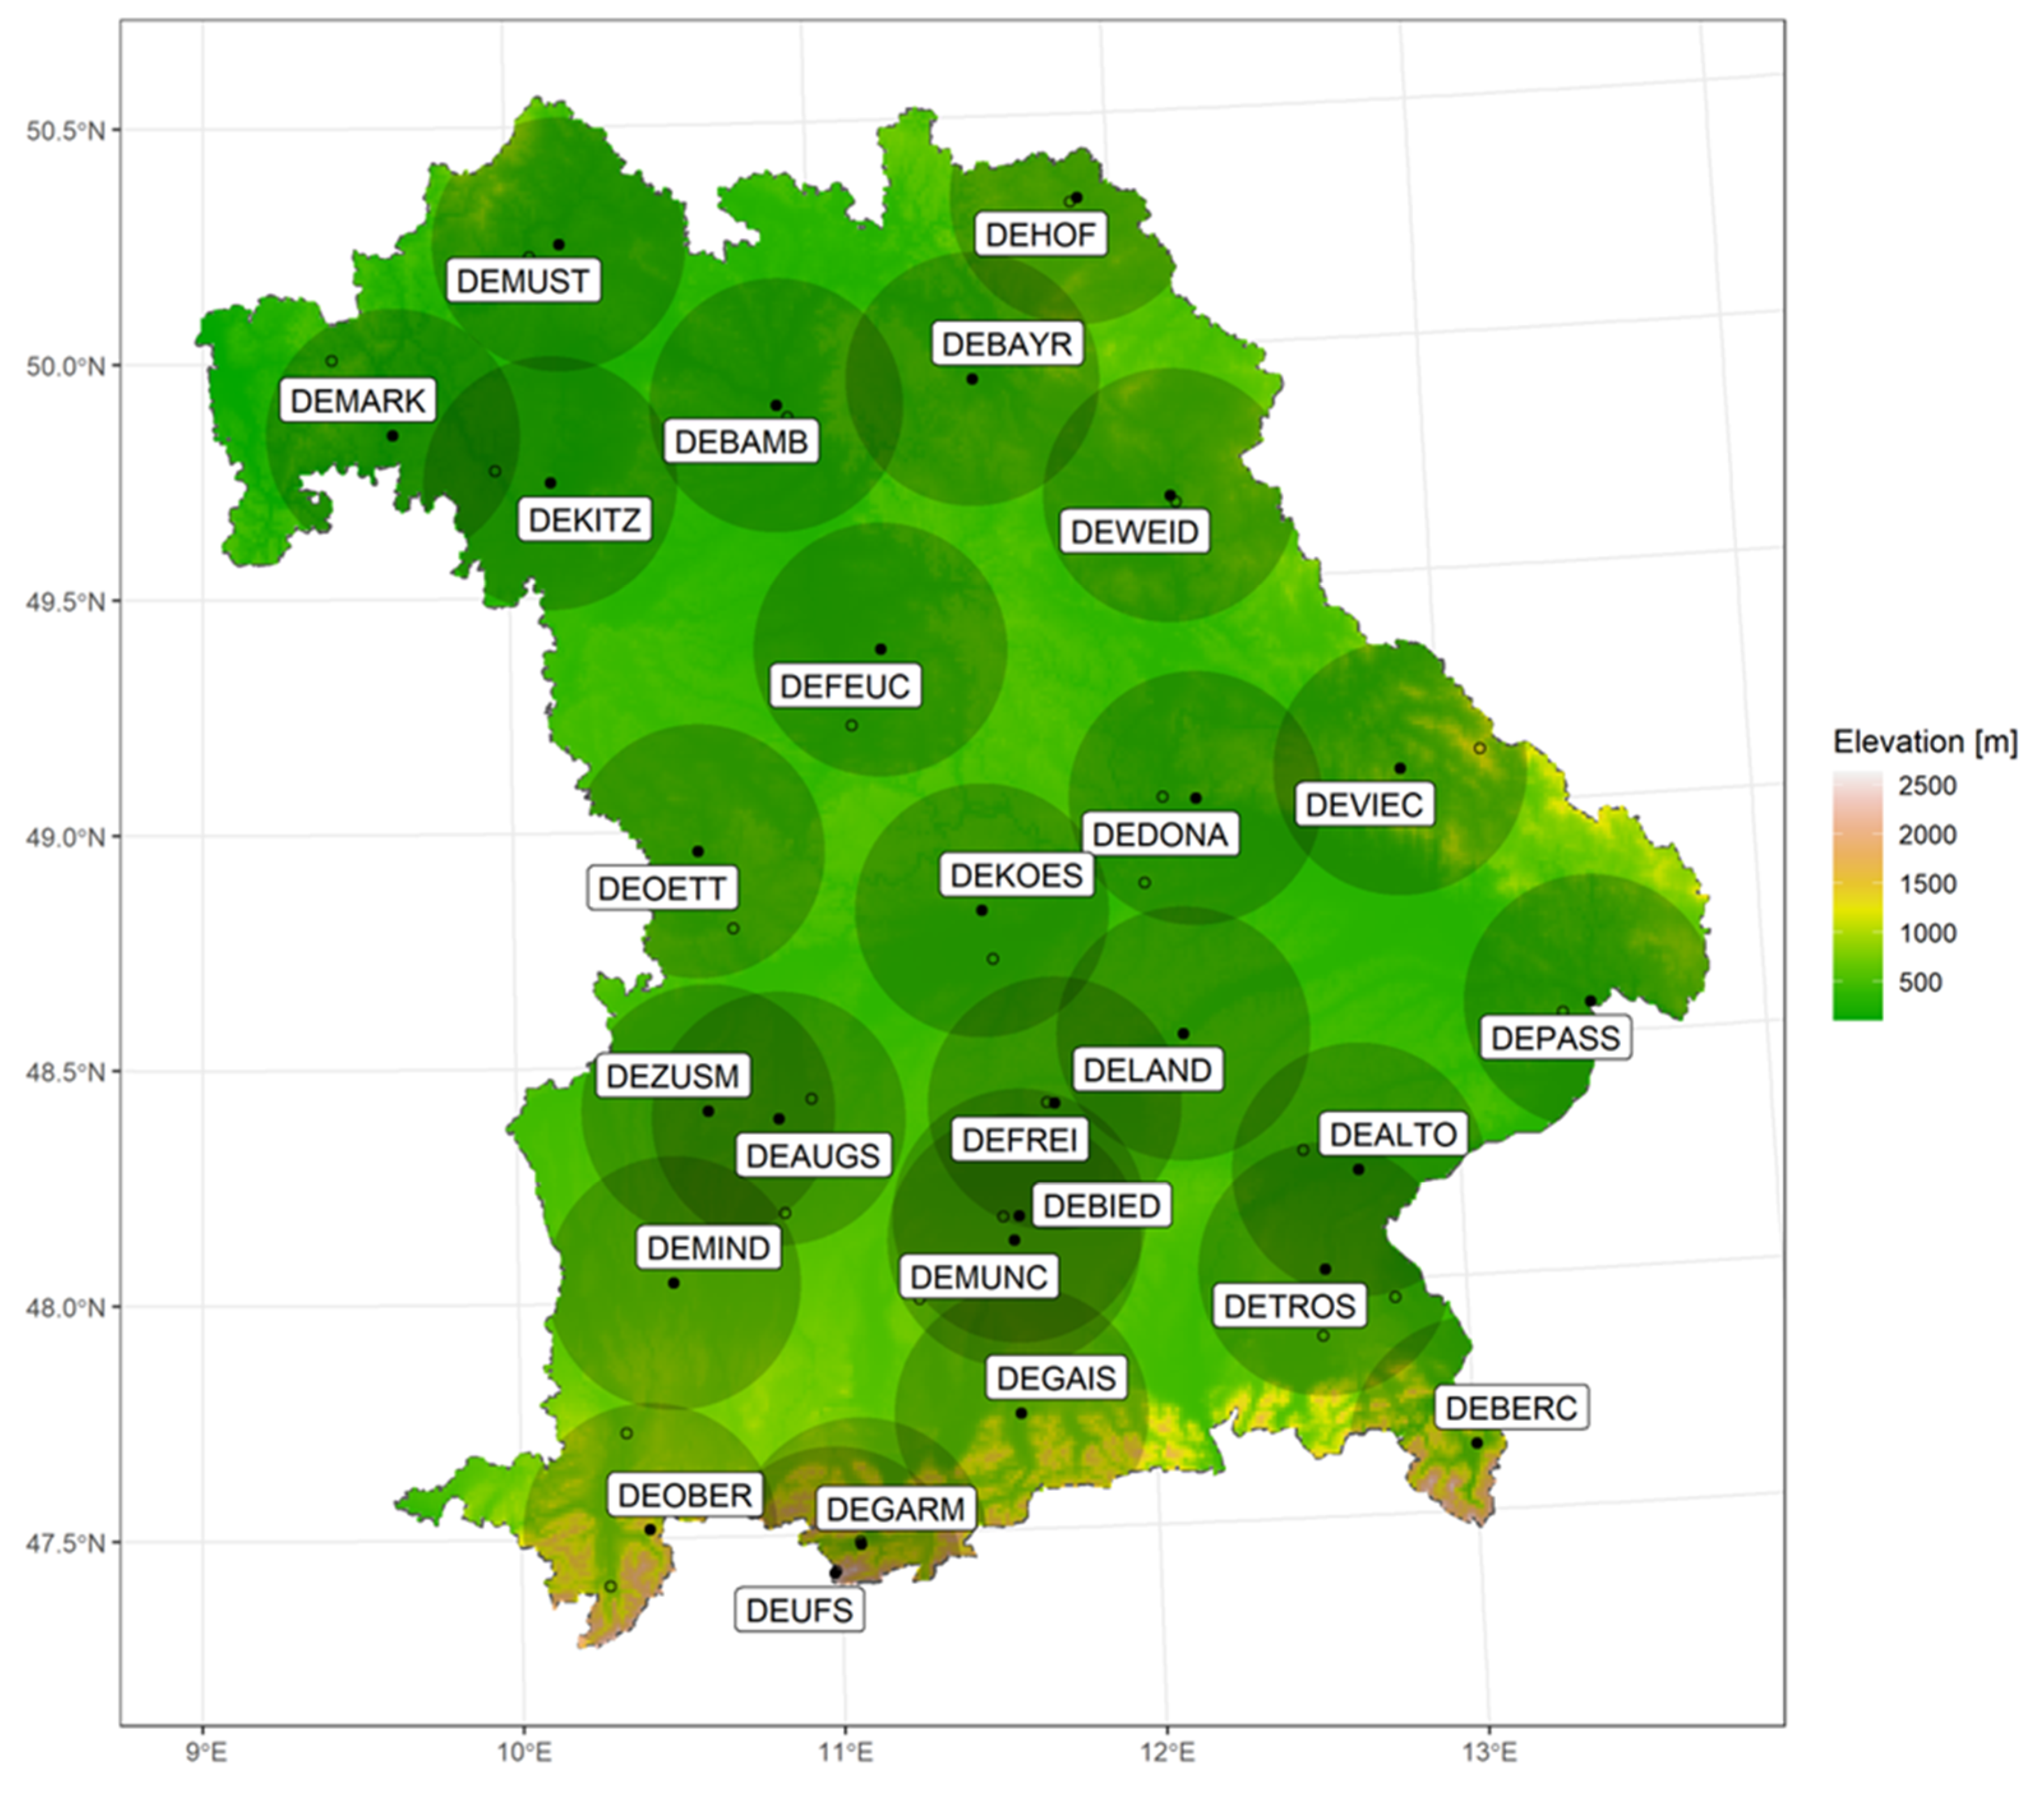
2.1. Pollen Data

In 2015, atmospheric concentrations of pollen from several plant taxa were measured at 25 stations throughout Bavaria, Germany as part of the Elektronisches Polleninformationsnetzwerk (ePIN) project [44]. Respective data from two additional pollen stations were used (see Figure 1 and Table 1), one run by TUM in Freising (DEFREI, 48°40′05″ N, 11°71′81″ E) and one by TUM/UNIKA-T in Augsburg (DEAUGS, 48°32′60″ N, 10°90′30″ E).
The pollen concentrations were recorded by Hirst-type pollen samplers, in which airborne particles were continuously collected on adhesive tape, and pollen counts were then examined manually under the microscope following guidelines of the European Aerobiology Society [45]. The pollen dataset comprised daily pollen concentrations in grains m−3 of 13 selected pollen taxa, but in this study, we focus exclusively on wild grass pollen from the Poaceae family. The grasses studied here only include wild grasses (cultivated and uncultivated), excluding cereals, unless specifically mentioned otherwise. In Bavaria, the most common species on permanent grassland are: perennial ryegrass (Lolium perenne), Italian ryegrass (Lolium multiflorum), cock’s-foot grass (Dactylis glomerata), Kentucky bluegrass (Poa pratensis), rough bluegrass (Poa trivialis), meadow foxtail (Alopecurus pratensis), meadow fescue (Festuca pratensis), timothy (Phleum pretense), yellow oatgrass (Trisetum flavescens), tall oat grass (Arrhenatherum elatius), red fescue (Festuca rubra), dog’s tail grass (Cynosurus cristatus), couch grass (Agropyron repens), bentgrass (Agrostis spp.), velvet grass (Holcus lanatus), soft brome (Bromus hordeaceus/mollis), and tufted hairgrass (Deschampsia caespitosa) [46]. The Hirst-type pollen samplers were placed approximately 10–20 m above ground level (a.g.l.). It has been reported that, due to dispersal dynamics, the grass pollen concentration on the ground can be up to twice the measured values at the pollen trap due to dispersal dynamics, but this also depends on the abundance of vegetation in the vicinity [20,47].
The pollen season was defined by applying the moving average method proposed by Rojo and colleagues [48] on the annual times series of daily pollen concentration. A threshold of 5 pollen grains m−3 was set by default to determine the start and end of pollen season. The Annual Pollen Integral (API) [49] was then calculated by summing the daily concentration over the pollen season. The pollen peak (PP) [50] was defined as the highest daily pollen concentration.

2.2. Grass Pollen Sources

Grasslands included both agricultural grass pollen sources (pastures and meadows) and non-agricultural pollen sources (parks, open green spaces, private gardens, and wild gardens). Pollen sources from arable land have their own specific characteristics compared to wild grass pollen sources. From the wind-pollinated species, the cultivation of maize predominates the arable land in Bavaria. In comparison, rye constitutes a very small total share. Since cereals have low pollen emissions that are nearly impossible to capture in the pollen traps used (due to their large diameters [maize 91–93 μm] [51] and high pollen weight), arable lands with cereals were excluded from this study.

2.2.1. Area of Agricultural Grassland Derived from InVeKos

In Bavaria, 46.6% of the total area is agriculturally cultivated, 89.5% of which is held by family-run businesses [52]. Information on the spatial distribution and type of cultivation within agricultural areas is provided by the InVeKos database (Integriertes Verwaltungs- und Kontrollsystem) which was introduced by the European Commission in 1992 and is valid for all EU member states. InVeKos was set up to regulate and control a uniform agricultural policy within the EU member states. The land-use data derived from InVeKos have a high spatial resolution of 1 m and are at the cadastral unit level. The available InVeKos data are limited to the area of Bavaria. All potential emission sources within the Bavarian borders for wind-pollinated grass pollen were included in the analysis (see Table 2).
InVeKos does not include any further information on the management intensity, e.g., the number of harvests per year, which depends on the respective agricultural holding and is strongly driven by regional differences [53]. Instead, we used the “RGV/ha HFF” variable, established to financially reward agricultural holdings for limiting their cultivation intensity, as an indicator for the management intensity. RGV/ha HFF is defined as the number of cattle per hectare fodder (RGV = fodder-consuming livestock unit equivalent to 500 kg live weight) divided by the sustaining area (HFF = permanent grassland, silage maize, and arable fodder). For simplicity, we call this variable cultivation intensity (CI). Smaller numbers denote to a lower RGV/ha HFF with correspondingly fewer harvests per year, indicating low-intensity land use, whereas larger numbers refer to a higher RGV/ha HFF with correspondingly more harvests per year, indicating intensive use. Specifically, based on the Bayerisches Kulturlandschaftsprogramm (KULAP) and contractual nature conservation (Bayerisches Vertragsnaturschutzprogramm, VNP) (http://www.stmelf.bayern.de/Foerderwegweiser (accessed on 10 January 2022)), 0–0.3 RGV/ha HFF refers to grassland under no/incomplete use, 0.3–1.4 RGV/ha HFF to low-intensity use, and greater than 1.4 RGV/ha HFF to intensive use. Each agricultural holding receives its own CI, which provides detailed insight into the area-specific cultivation intensity. All selected grasslands could be assigned to one of the three CIs (<0.3, 0.3–1.4, and >1.4; see also Table 2).

2.2.2. OpenStreetMap

As the InVeKos data set comprises solely agricultural grassland, non-agricultural grasslands were identified by OpenStreetMap (Data/Maps Copyright 2018 Geofabrik GmbH and OpenStreetMap Contributors). OpenStreetMap is an international project founded in 2004 with the goal of providing a high-resolution, freely accessible map of the world. It comprises both non-agricultural and agricultural grassland; therefore, InVeKos and OpenStreetMap were overlaid in order to identify non-agricultural grassland from OpenStreetMap.
In contrast to the InVeKos data set, there is no RGV/ha HFF for grasslands available in OpenStreetMap. Therefore, the cultivation intensity was assigned by manual inspection for the different land-use types. Parks, small private gardens, and graveyards were considered intensive use, so they were assigned to CI 1.4; meadows, grasslands, and recreation grounds with mostly low-intensity use were assigned to CI 0.3; and unused heath was assigned to CI 0 (Table 2, lower part).
All InVeKos/OpenStreetMap land-use data were processed in ArcGIS (Esri 2019. ArcGis Deskop: Version 10.6.1. Redlands, CA, USA) as vector data in EPSG:32632 projection. The ring buffers were also created in ArcGIS.

2.3. Potential Source Areas for Grassland Pollen Emission

The data on agricultural grasslands from InVeKos were only available to us for Bavaria; thus, the 30 km surroundings of each pollen trap were cut off at the Bavarian border. The grasslands from the neighboring states of Austria, Czech Republic, and other German federal states were not considered. Thus, pollen stations DEBERC, DEHOF, DEGARM, and DEUFS had to be excluded from the final analysis, as large proportions (>50%) of their 30 km surrounding areas were outside the Bavarian state territory.
We applied the concentric ring method (CRM) by Oteros and colleagues [44] to study the correlations between the pollen concentrations and the respective potential emission surfaces for wild grass pollen (Poaceae family).
Potential source area is given by Equation (1):
  P S A = 1 n A g r a s s l a n d ,   i ,   n A r i n g ,   i ,   i = 1 , , 60 ,
where A denotes the covered area size, i denotes the ith concentric ring from the station center till 30 km surroundings per 500 m, and n denotes the nth grassland area inside the concentric ring. Based on the exact geographical coordinates of all selected 23 pollen stations, 60 concentric rings of 500 m width were placed around each station. The maximum radius of 30 km was chosen in order to avoid greater overlap between the stations (see Figure 1).
Potential source area weighted by cultivation intensity is given by Equation (2):
P S A C I = 1 n [ A g r a s s l a n d , i , n / ( C I i , n 3 + 1 ) ] A r i n g , i ,   i = 1 , ,   60 ,
where C I i , n denotes the cultivation intensity CI (RGV/ha HFF) for each grassland area. The CI weighting of the grassland percentage was conducted by summing the RGV/ha HFF weighted grassland areas in each ring, followed by division of the sum by the whole ring area.
Potential source area weighted by cultivation intensity and directional wind frequency is given by Equation (3):
P S A C I + w i n d = i = 1 4 ( ω i * P S A C I + w i n d , i ) i = 1 4 ω i ,
where ω i denotes the wind frequency in each quarterly direction (NE, NW, SE, and SW) based on hourly wind measurements during the specific pollen season period (see Section 2.1) at respective pollen stations. For the combined CI and wind direction weighting, the rings were divided into four quarters. Each quarterly ring was calculated separately by dividing the pollen source area and the corresponding quarter area of the respective ring, resulting in 240 different values for each pollen station. Hourly wind speed and wind direction data for 2015 were taken from the closest DWD weather station (distances vary from hundreds of meters to around 40 km) with the same sampling height of 10 m a.g.l.
Afterwards, Pearson correlations were calculated between API/PP and PSA/PSACI/PSACI+wind for each ring separately, taking into account all 23 selected pollen stations. The correlation coefficients at different distances (0–30 km) were determined in order to observe the concordance between the pollen concentration and potential source area indices.
All the data processing and analyses were performed under R [54]. Pollen-related indices were calculated by the R package AeRobiology [42]. Data visualization was performed using R package ggplot2 [55].

2.4. Sensitivity Analysis

The OpenStreetMap non-agricultural grassland has an average share of 25.6% of the overall CI weighted PSACI. It is therefore considered to have an important impact on the pollen concentration. Due to its low management intensity and generally late cutting, the measured pollen concentrations could be strongly influenced by this non-agricultural grassland. For the following sensitivity analysis, the grassland percentage from OpenStreetMap was weighted based on the registered airborne pollen concentrations instead of the land use-based CI, whereas the weighting of grassland percentages from InVeKos database remained unchanged. More specifically, for this approach, the pollen stations were divided into three groups according to their API levels (highest third, middle third, and lowest third). In the next step, the grass percentages from OpenStreetMap were weighted station-wise and the following CIs were assigned according to API levels: high API = CI 0, middle API = CI 0.3, and low API = CI 1.4. In the next step, the correlation coefficients based on grassland percentages before and after sensitivity CI weighting were subtracted.

3. Results

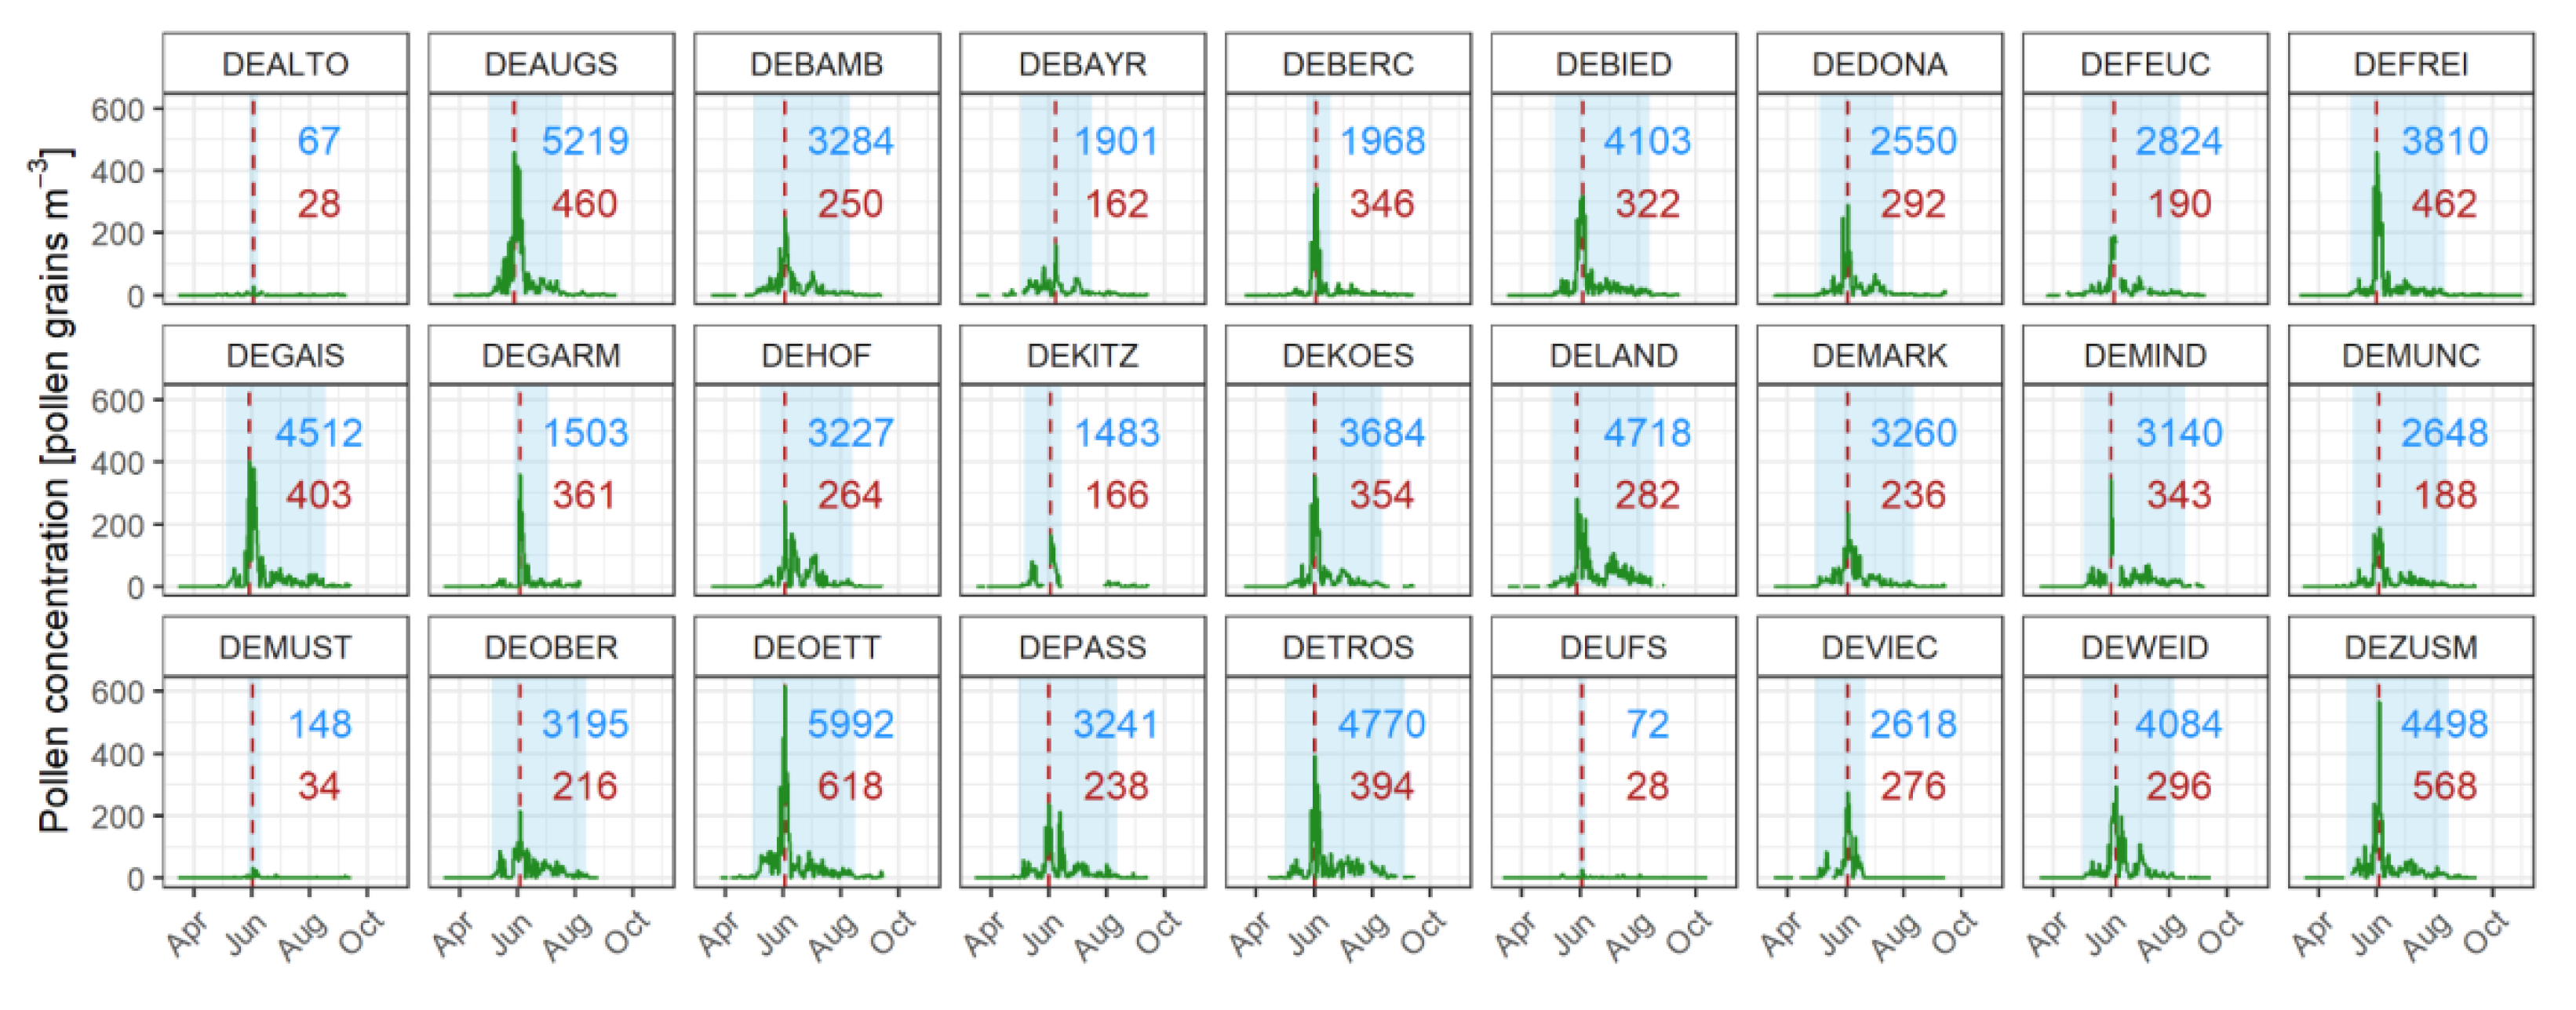
3.1. Grass Pollen Calendar

The grass pollen season in 2015 for all of Bavaria lasted from 30 April (e.g., at stations DEMARK, DEOETT, DEPASS, DEVIEC, and DEZUSM) until 5 September (at station DETROS), with large differences in the lengths of the pollen season and peak values among pollen stations (see Figure 2). The total grass pollen season reached up to 127 days at station DETROS, while station DEUFS exhibited the shortest pollen season of only 10 days. Alpine station DEUFS at 2650 m a.s.l. has no grass vegetation in its surroundings. The pollen measured during its extremely short pollen season is due to transport processes, as has been demonstrated for other pollen species [56]. Compared with the onset (30 April–30 May), there was higher variability in the end of the season (8 June–5 September).
The PP was reached between 29 May (DEAUGS/DEGAIS/DELAND) and 8 June (DEBAYR), with most peak dates on 3 June (12 of 27 stations). The average pollen concentration on the peak day was 288 pollen grains m−3, the lowest peak pollen concentration was 28 pollen grains m−3 (DEUFS and DEALTO), and the highest peak pollen concentration was 618 pollen grains m−3 (DEOETT).
Similarly, those pollen stations with low/high peak values showed a low/high API, as follows: DEALTO (67 pollen grains m−3), DEUFS (72 pollen grains m−3), DEMUST (148 pollen grains m−3), and DEOETT reached the highest annual pollen sum of 5992 pollen grains m−3 (see Figure 2). On average, an API of 3056 pollen grains m−3 was derived for all 27 stations. DEMUST, DEUFS, and DEALTO did not show any days when pollen concentration exceeded 100 pollen grains m−3; in contrast, DEAUGS had 14 such days.

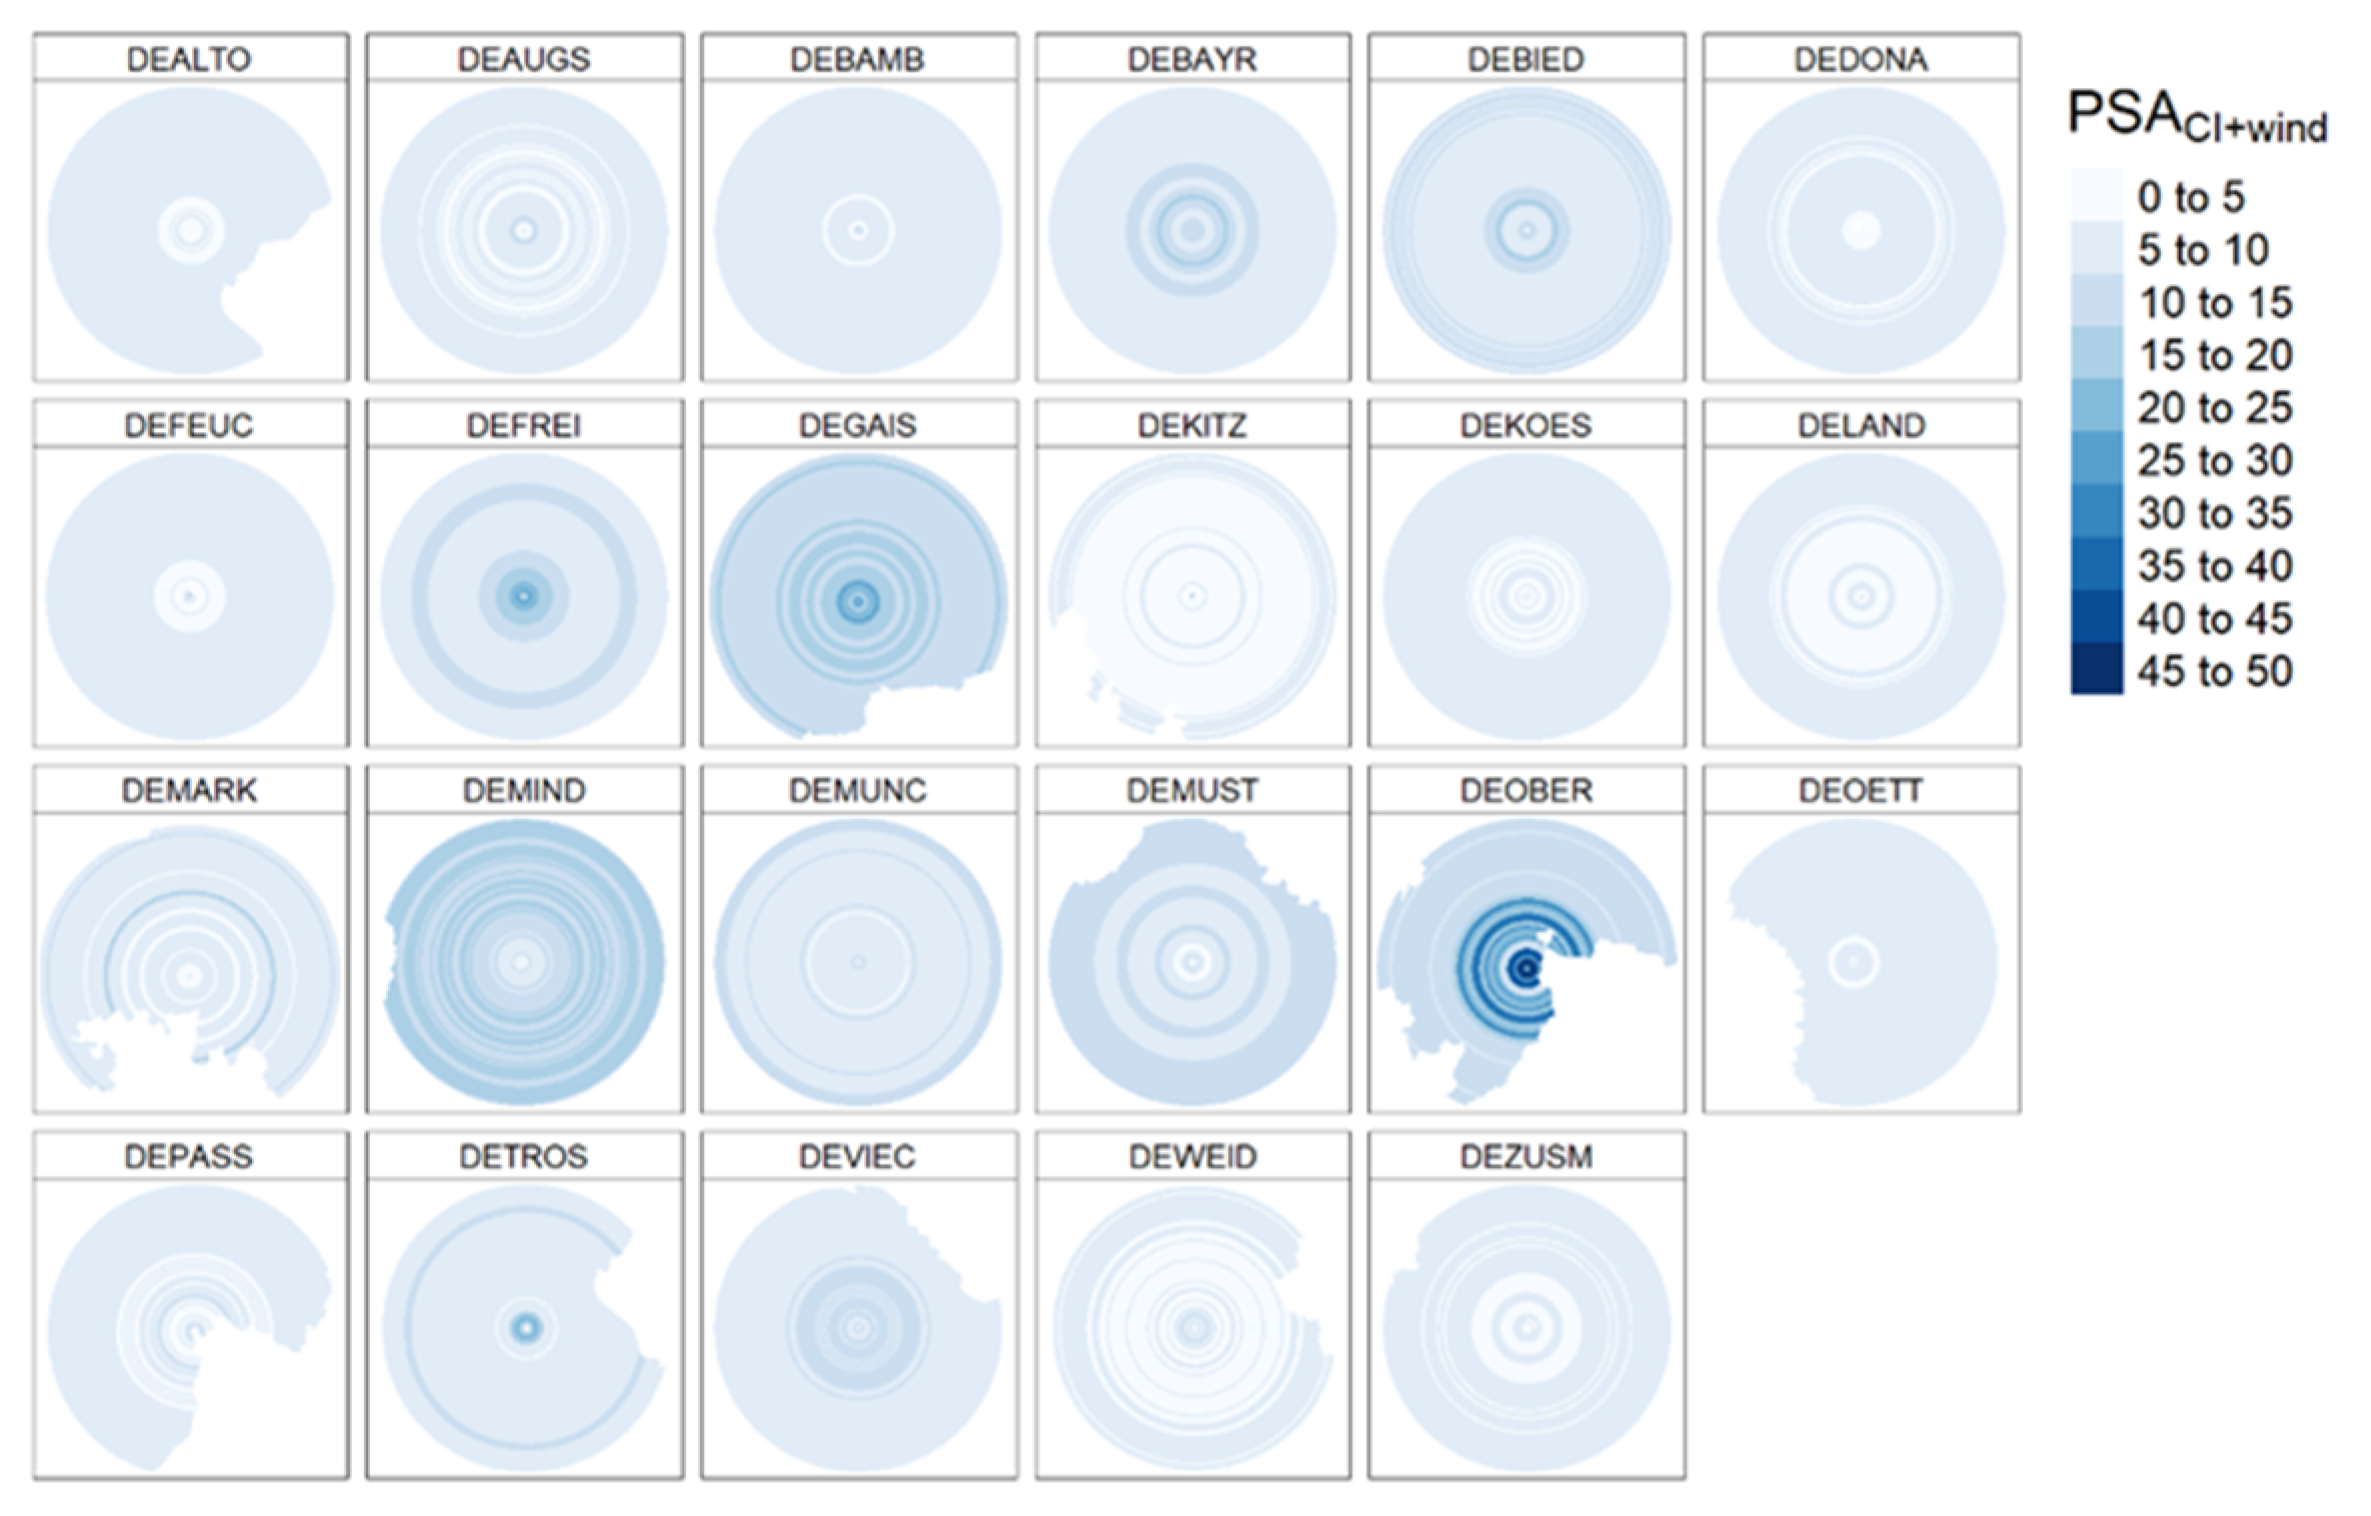
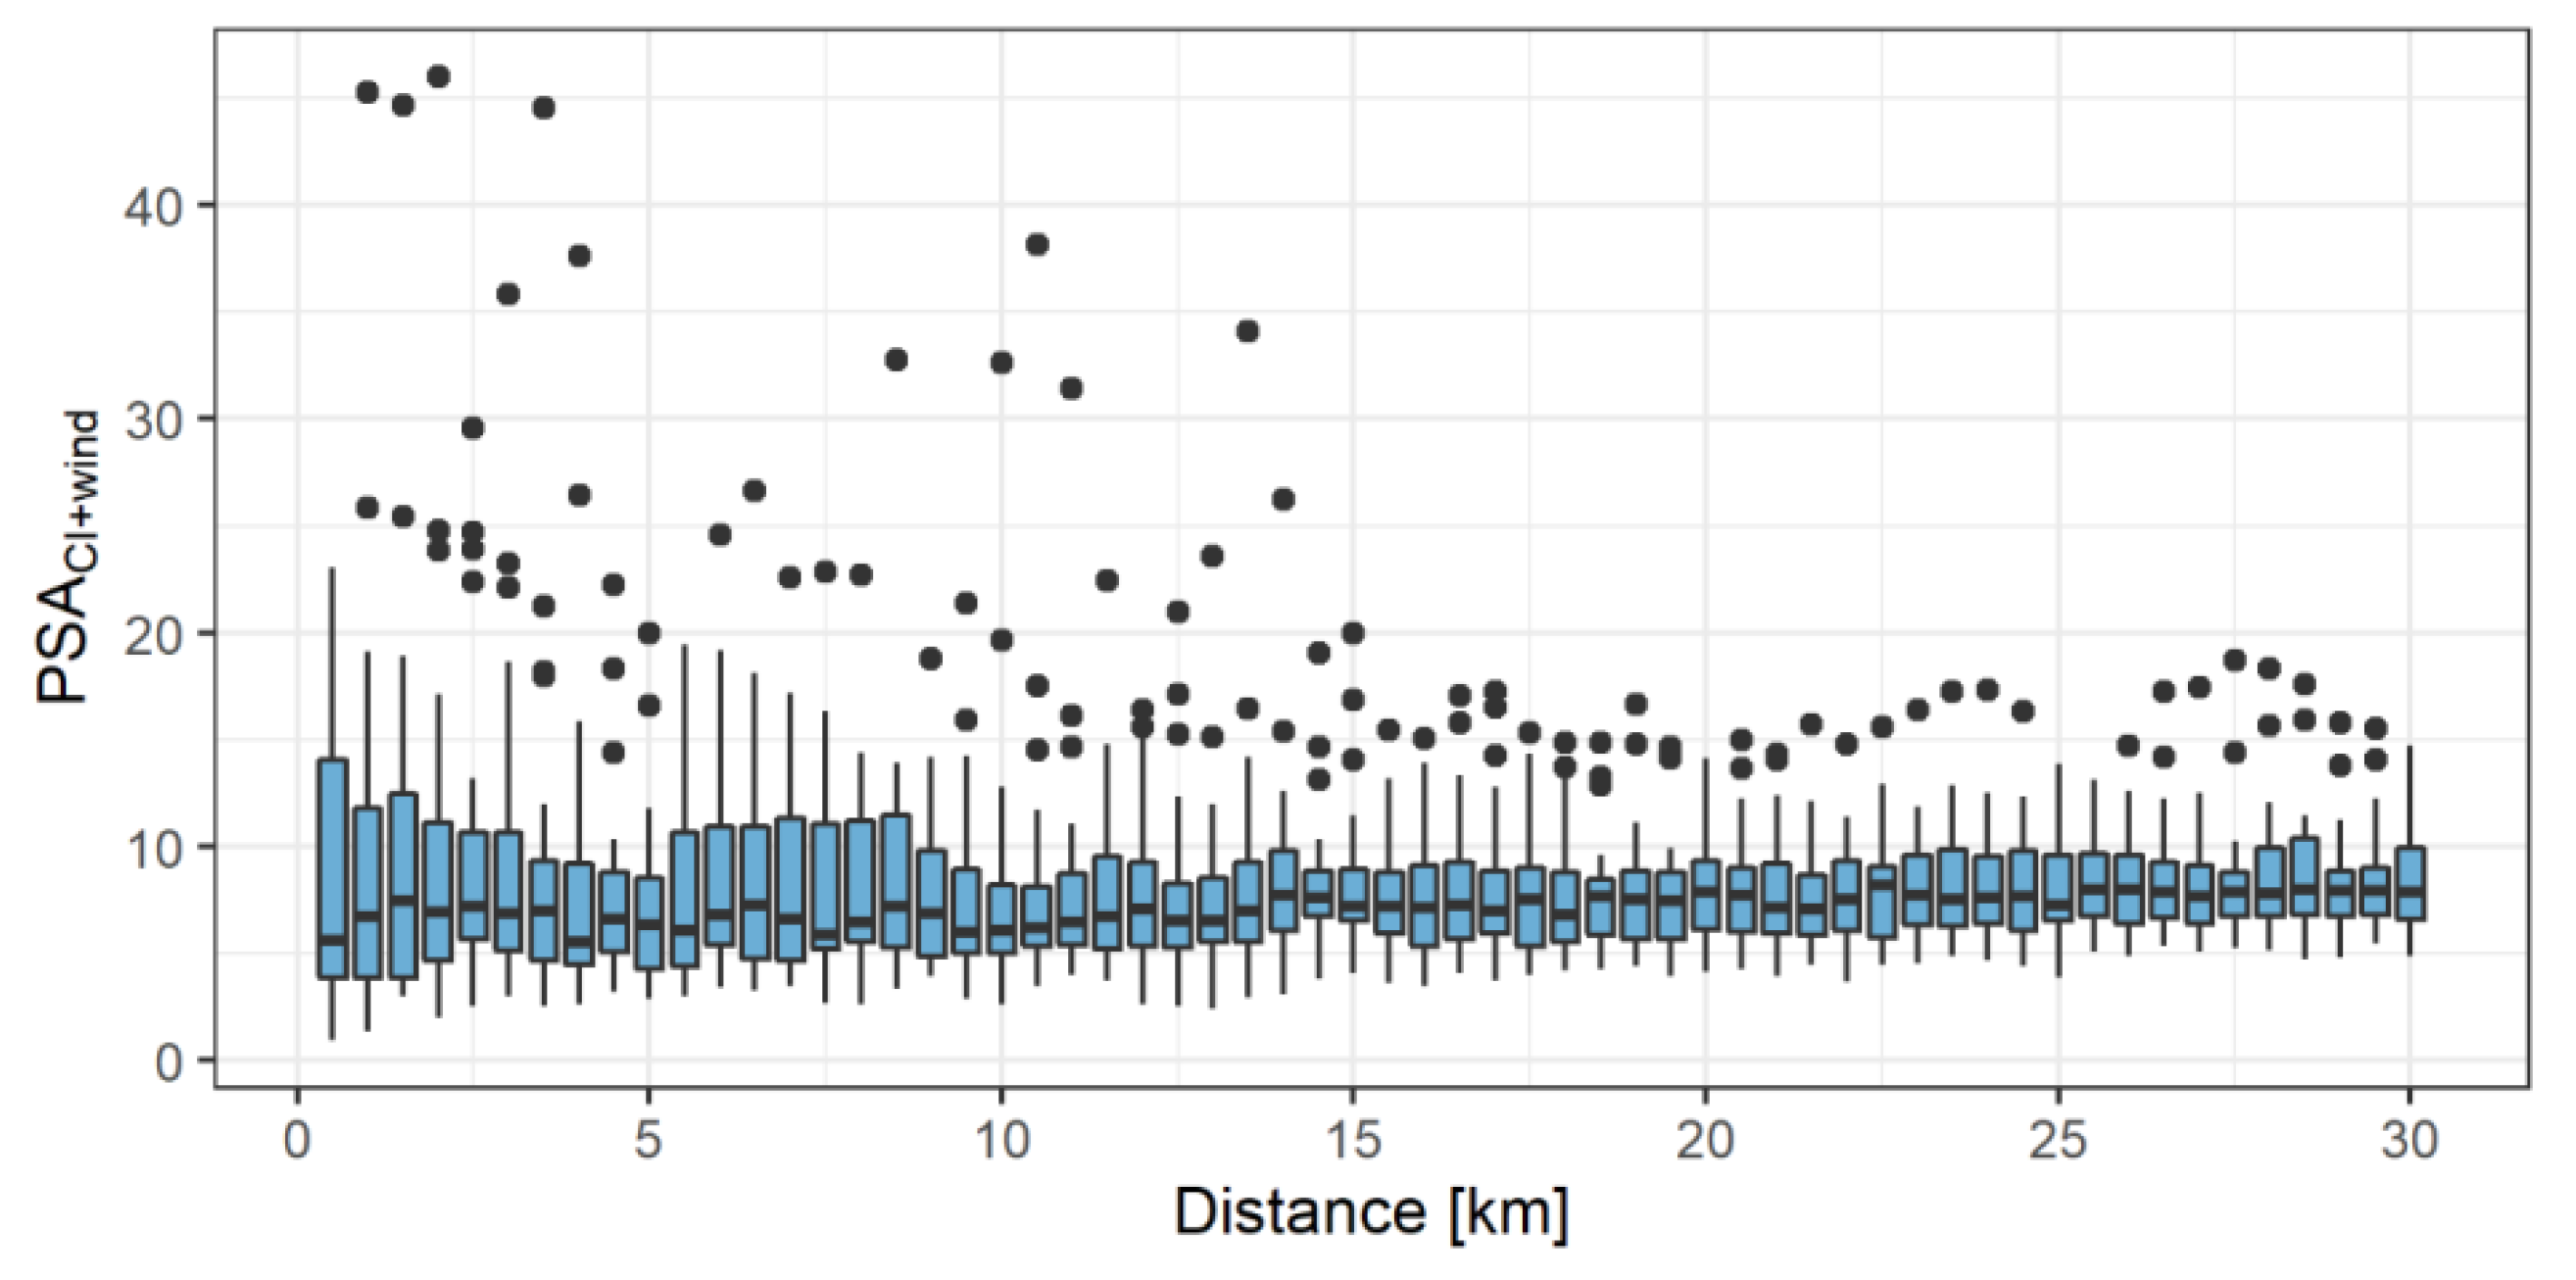
3.2. Potential Pollen Source Areas PSACI+wind

The occurrence of grassland in Bavaria increases in areas with cooler average temperatures, increasing precipitation and with higher altitudes (multiple linear regression, p < 0.0001, adj. R2 66.2%). For all 23 selected pollen stations, an overall mean (weighted) PSACI+wind of 8.4 was calculated. The station/ring PSACI+wind values are shown in Figure 3. The highest potential source areas for grasslands were found at pollen stations DEOBER, ranging from 30 to 45 in the closer ranges (0–15 km), followed by DEGAIS (26.40 at 4 km, 25.85 at 1 km) and DEFREI (around 25 at 1.5–2.5 km). In contrast, the lowest PSACI+wind values were observed at DEMIND (0.97 at 500 m), DEALTO (1.34 at 1 km, 1.64 at 500 m), and DEKOES (1.91 at 500 m).
We further subdivided the 30 km surrounding areas of the pollen stations into the close (0–10 km), intermediate (10–20 km), and long (20–30 km) ranges to better characterize the potential source areas. The grassland-dominated stations that showed similar values for close, intermediate, and long distances were DEOBER (close: 28.60, intermediate: 18.73, long: 11.38), DEGAIS (19.08, 14.68, 12.92), and DEMIND (9.09, 15.07, 15.97), where DEFREI exhibited a higher coverage (16.55) only in the close range. In contrast, the pollen station exhibiting the lowest PSACI+wind was DEKITZ (4.60, 4.34, 4.98).
The potential source area with (PSACI+wind) and without wind weighting (PSACI) are largely similar, with the overall mean PSACI of 8.7. Noticeable discrepancies could only be observed for a few stations, where more integrated potential source areas appeared in the inner rings rather than being evenly distributed (see DEOBER or DEMIND for examples in Supplementary Figure S1).

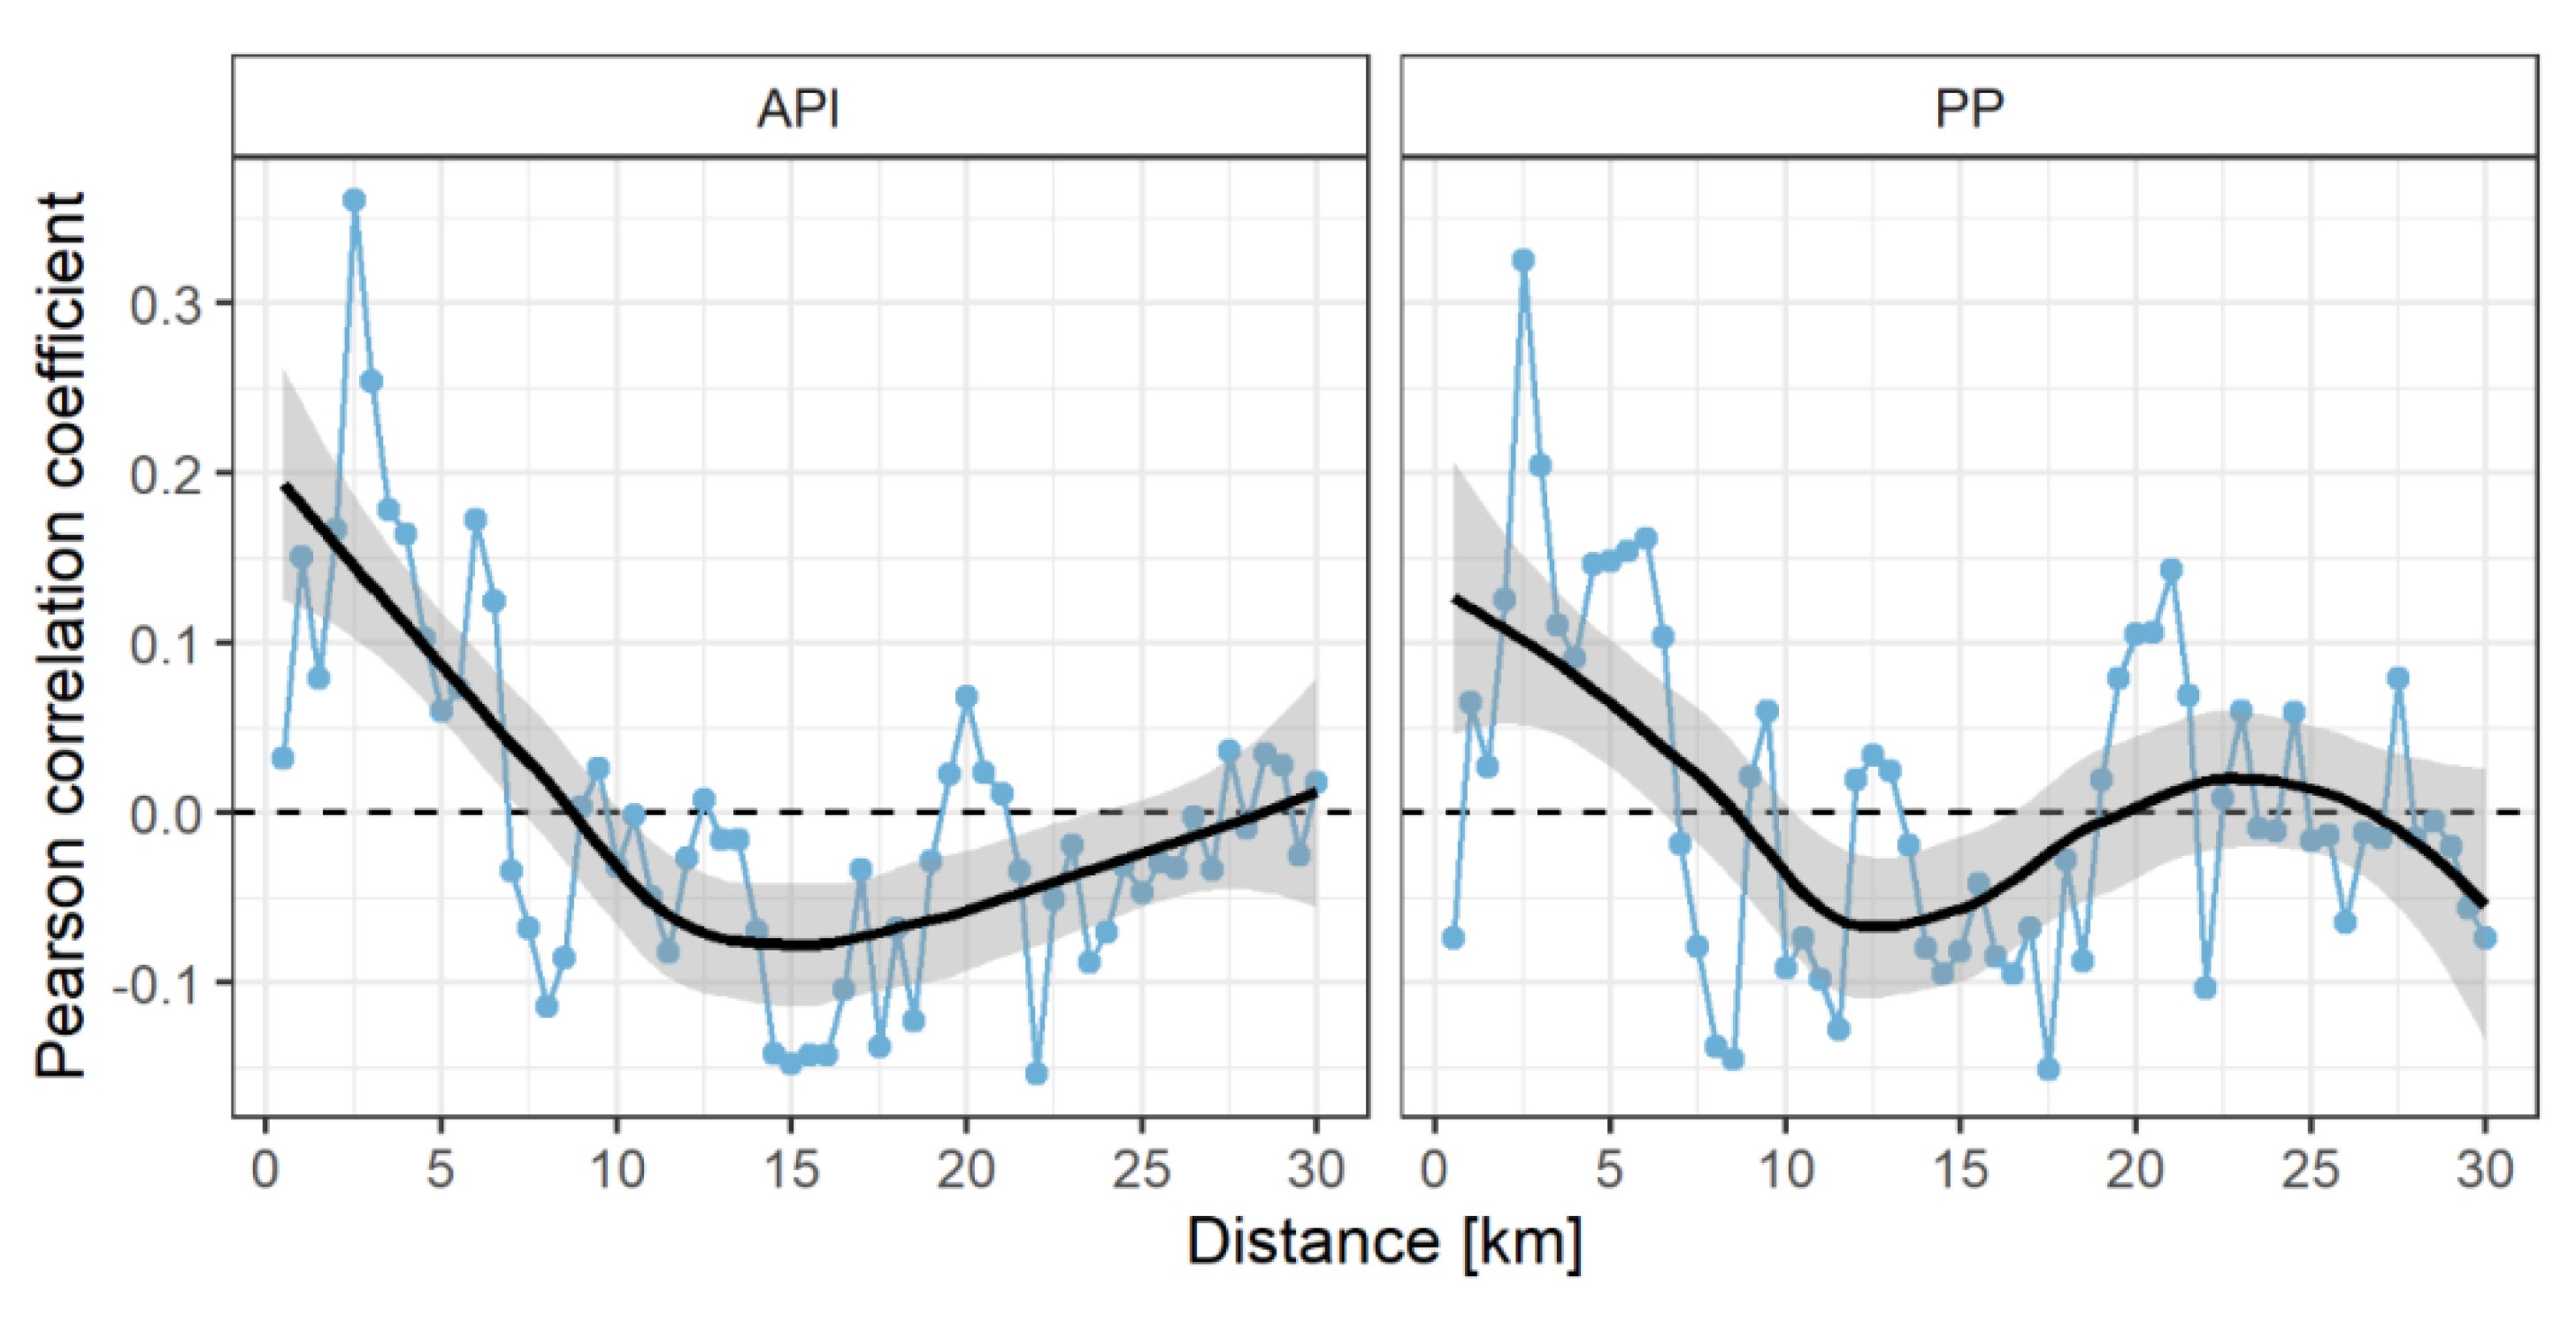
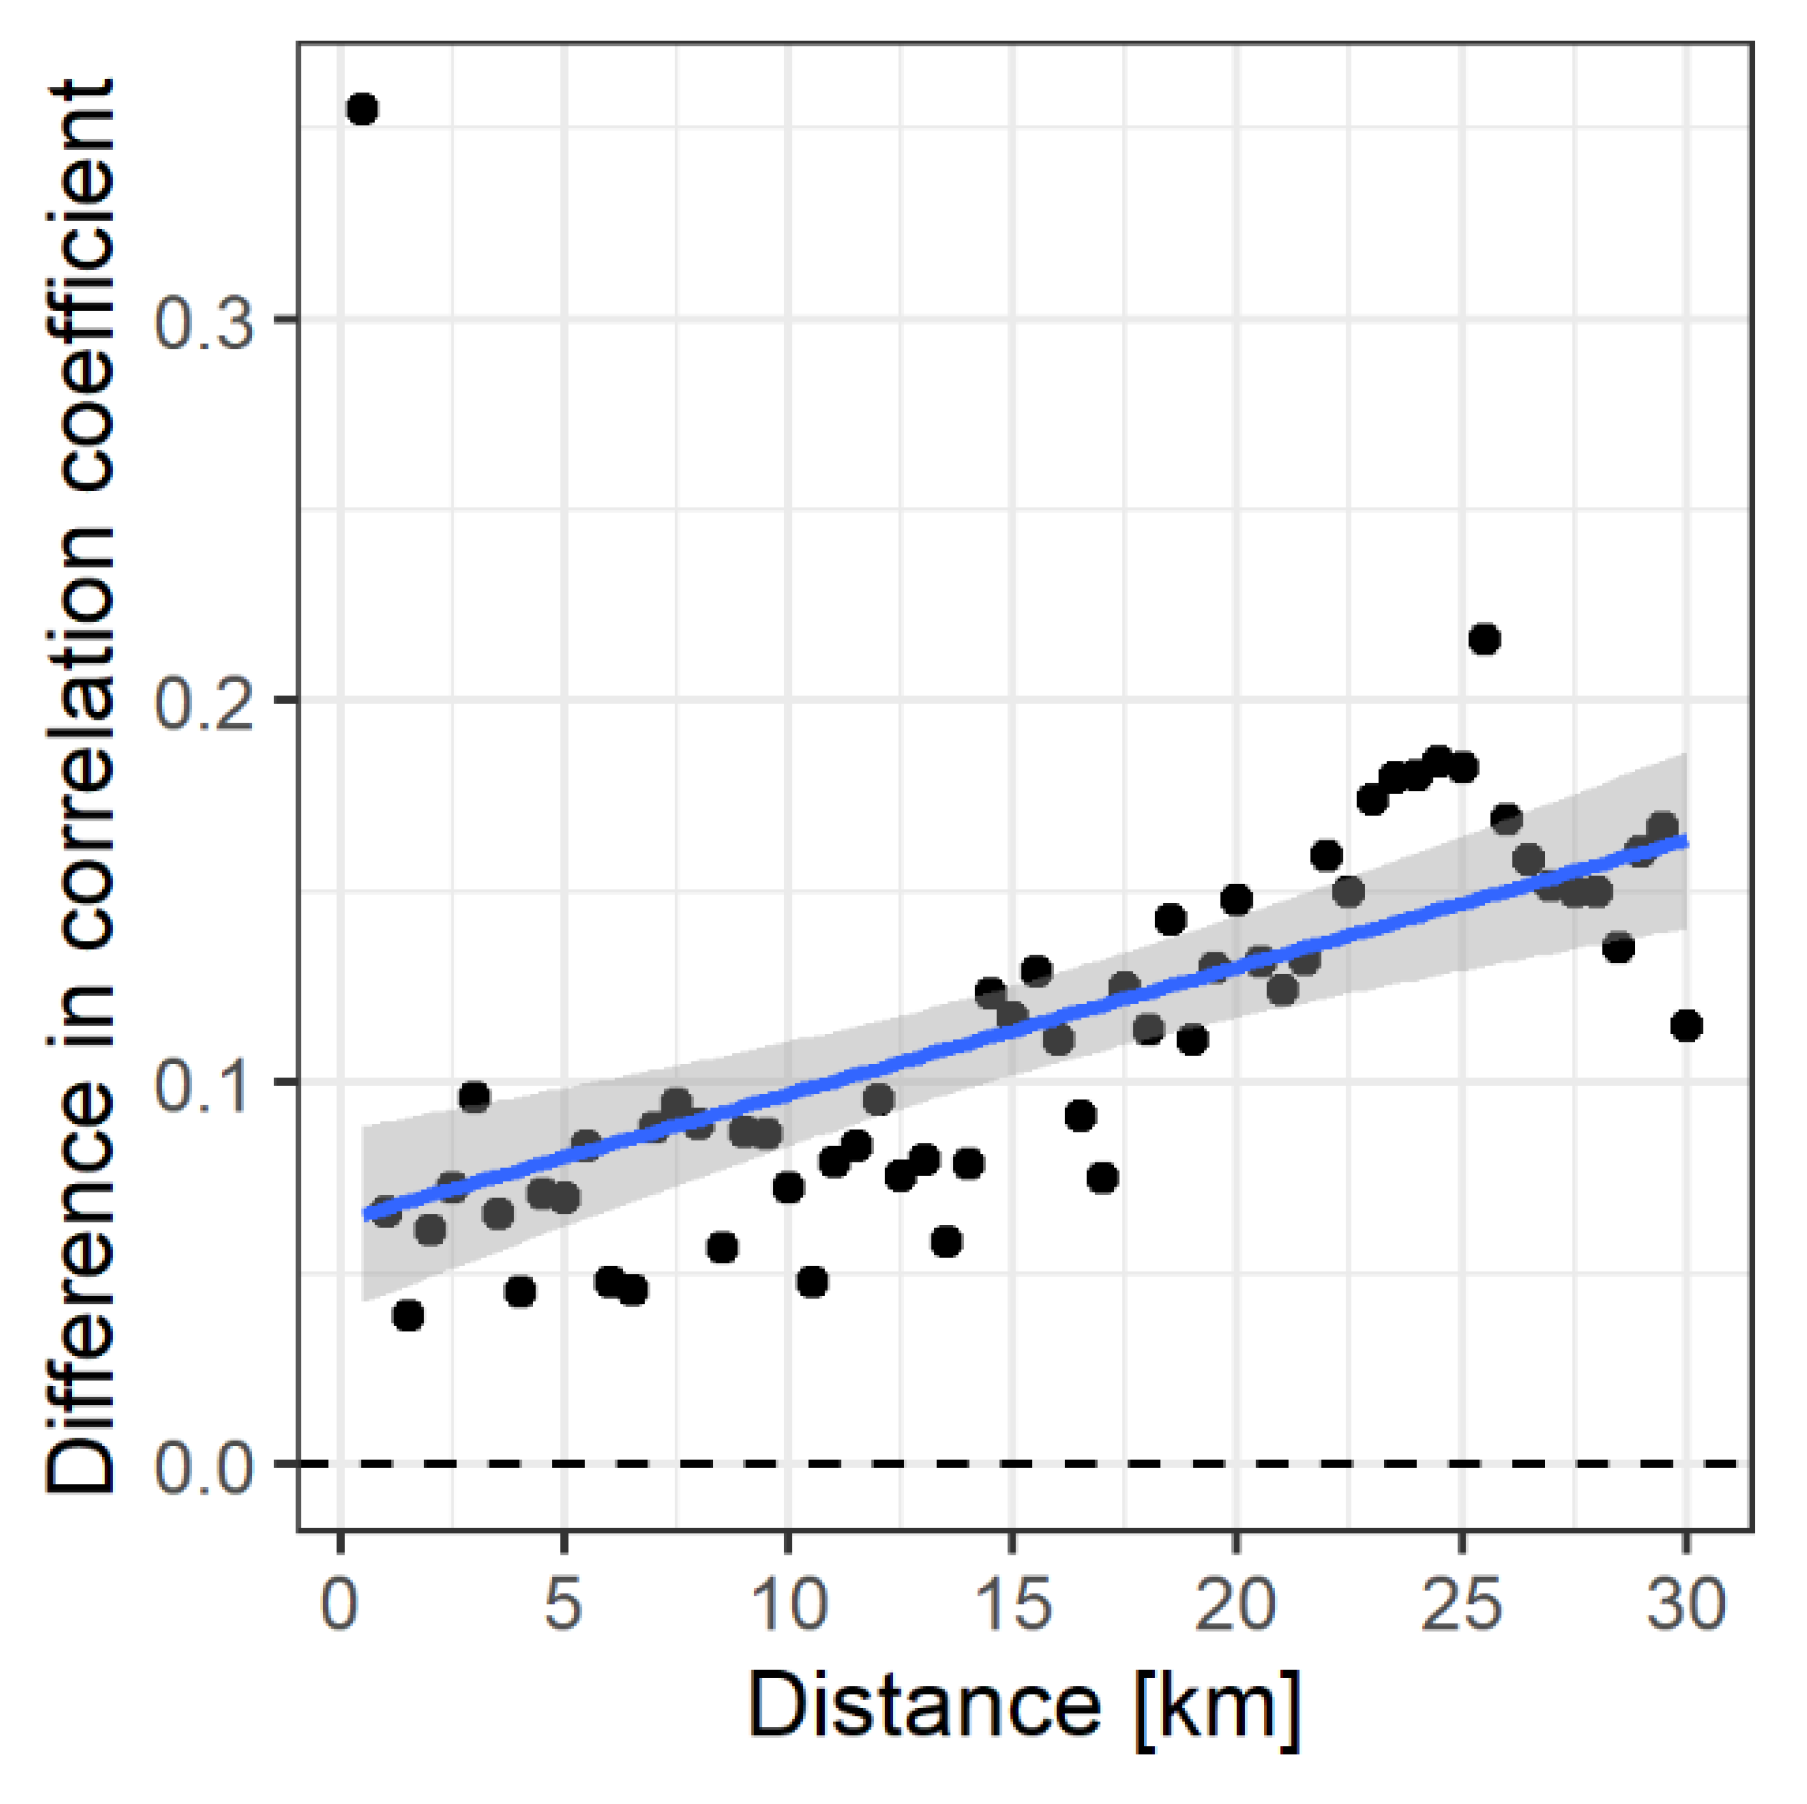
3.3. Concentric Ring Correlations

Pearson correlation coefficients were calculated between the pollen indices (including API and PP) and concentric ring-wise PSACI+wind across all 23 selected pollen stations (see Figure 4). The correlation coefficients of API and PP with PSACI+wind varied with distance from the pollen trap. Based on the smoothed trend lines, positive correlation coefficients were derived for distances of up to 10 km. A slightly higher correlation peak of 0.36 was found for API at 2.5 km, while PP resulted in its highest coefficient of 0.33 at the same distance, indicating the predominant impact of sources at close range on the pollen concentrations. Interestingly, for both pollen indices, the innermost 500 m ring was characterized by very low correlation coefficients (API: 0.03, PP: −0.07), which then improved until their maxima were reached at ~2.5 km. For the intermediate and long distances, both correlation coefficients for API and PP increased beyond 10 km again; however, the absolute levels fluctuated around 0. When the pollen indices were correlated with the potential source areas weighted only by cultivation intensity (PSACI), positive coefficients could be found at the same close distances of less than 10 km (see Supplementary Figure S2). Furthermore, more negative coefficients were found for the outer 30 km. To assess the impact of CI on the results, the CI + 1 and CI2 + 1 options were applied in addition to the CI3 + 1 weighting already presented. It was found that PSA weighted by CI2 + 1 and CI3 + 1 resulted in only a small change in the correlation coefficients (e.g., 0.4 ± 0.03 in peak at 2.5 km) compared with unweighted PSA (CI + 1).

3.4. Impact of Ring Size and Weighting Technique on the Variability in Grassland Percentages

The applied ring method used rings of equal width (500 m) but different areas, and the grassland percentage was calculated for each ring separately. Based on an analysis showing the variability of the grassland percentage combined for all 23 stations (Figure 5), it can be seen that the variability decreases with distance as the area of the ring increases. The CI weighted grassland percentages in the rings from 0 to 5 km exhibit a high variability with a standard deviation of 7.89. Farther away, the data variability decreases and later stabilizes in longer distances (SD = 3.85).
The sensitivity analysis revealed that weighting by API levels instead of by land use-specific CI led to an overall increase in the correlation coefficient by 0.11. Apart from the first 500 m, which are highly biased by variability in grassland cover and sampling height (see Section 4.2), the highest increase was observed at a distance of 25.5 km and the lowest at a distance of 1.5 km (Figure 6).

4. Discussion

Grass pollen loads in terms of annual grass pollen sums (API) and peak values (PP) may be related to the amount of surrounding grassland and management thereof, as well as weather, flowering, emissions and transport, and climate, thus influencing land-use patterns. Based on the values from 27 stations in 2015, API is closely related to the PP (p < 0.0001, adj. R2 82.6%), while only two alpine stations (DEBERC and DEGARM) had lower APIs than suggested by the relationship, probably due to a shorter growing season (27 and 36 days, respectively). Grassland percentages in Bavaria depend strongly on the mesoclimate, which can lead to local and regional differences in grassland distribution. The aim of this study was to evaluate the impact of potential wild grass pollen source areas on the pollen concentration in terms of PP and API, considering the influence of land use and management. One major outcome of our analysis is that grassland is not a single homogeneous land-use type, but may comprise at least 33 agricultural (InVeKos) categories, among which meadows and mowing pastures dominate. Meadows and mowing pastures are known for intensive cutting regimes, naturally lowering their strength as pollen sources. A correlation analysis between pollen concentration indices (API and PP) and potential pollen source areas PSACI+wind showed that pollen counts corresponded more to closer grasslands.

4.1. High Variability in Grass Pollen Concentrations

The Pearson correlation coefficients between annual pollen amounts and potential pollen sources in concentric rings calculated in this study are lower compared to those from a related study on olive pollen [50], which revealed correlation coefficients close to 1 within 50 km. The lower correlation coefficients in the present study can be explained by, in addition to the influencing factors mentioned below, the high number of different grass species contributing to grass pollen load compared to olive. The generally high complexity of grasslands leads to high variability of the measured grass pollen concentrations between pollen stations. Compared to other plant taxa, the Poaceae family consists of a huge number of different species worldwide (~9000) [57], with the timing of flowering and the amount of pollen produced varying widely. It has already been shown that the amount of pollen produced per culm can vary six fold depending on species and variety [58]. The vast majority of grasslands are assigned to agricultural holdings (InVeKos database), whereas non-agricultural grassland areas (OpenStreetMap) without the CI weighting PSACI account for only a small share of ~10%. Among the agriculturally cultivated grasses, arable grasslands with cereals have a special position, although they belong to the Poaceae family. From the cereal species, only rye (Secale cereale) and maize (Zea mays) are anemophilous (wind-pollinating) [39], while all other cereal species are autogamous (self-pollinating). Based on the InVeKos database, rye constitutes a very small total share of ~0.55% (39.000 hectares) in Bavaria, while maize is cultivated with a total share of ~7.80% (550.000 ha). In general, cereal pollen is characterized by heavy weight and large size, and maize pollen additionally has a sticky surface. Those properties make them unlikely to be transported over distances of more than 500 m [39,59]. Related experiments determined that the pollen concentration decreases greatly after 100 m [60], e.g., after 20 m, the concentrations would be less than 0.1% [61]. Therefore, the impact of cereal pollen is highly limited to the immediate surroundings of the emission source.
Differences in the species composition based, e.g., on altitude or soil-climate zone can be seen in grasslands systems [18,19]. The variety of grasses from agricultural use is expanded by a high number of adapted cultivars for Germany [62]. On both agricultural and non-agricultural grasslands, the cultivation intensity covers a wide spectrum from uncut to high cutting frequencies (up to seven times per year), where the most decisive factor is the timing of first cut; this contributes to the complexity of analyzing the grasslands. On the microscale, grasses are abundant on various types of small patches, which are supposed to be mostly unmanaged grassland. From the available data, those small grass patches cannot be fully identified, despite having a considerable impact on the overall pollen concentration. For the present study, we also assume that for most southern stations, which are characterized by a higher grassland percentage, pollen emission and local transport might be hampered by more frequent rainy days.

4.2. Low Influence of Grass Pollen Source Areas

We had expected that the correlation coefficients, regardless of their weighting, would reach their maximum closest to the pollen stations, thus mainly reflect the grassland near the pollen trap. However, as they are strongly affected by the high variability of the potential source areas of grasslands, especially in the first rings and their smaller areas, the respective correlation coefficients are lower than expected. Additionally, the low correlation coefficients in the first rings can probably be explained by the geographical location of the pollen traps in settlements and the height difference between the ground level and the installation height of the pollen trap. According to international standards, pollen traps should be installed 10 to 20 m a.g.l. [63], and suitable installation sites are usually found within cities at public institutions [20].
The installation height of pollen traps is critical for wind-pollinating plant species, as the pollen transport range could differ from meters to hundreds of kilometers. Owing to the large aerodynamic diameters (35 µm aerodynamic and 45 µm geometric) and high pollen weight (~20 ng) of common wild grass pollen [64], grass pollen transport is largely limited to local and regional scales (up to 100 km). Therefore, the installation height of the pollen traps is not specifically suitable for grass pollen. In this context, the complex transportation dynamics from the ground level where pollen is emitted up to 15 m a.g.l. is expected to strongly influence the correlation coefficients in the closest surroundings as well [65].

4.3. Potential Impacts of Ring Size and Weighting Techniques

When applying the CRM, ring sizes continuously increase in area with distance, which means that the variability of potential source areas weighted by cultivation intensity and wind declines with the distance. Since the spatial variability in the API and PP among the 23 pollen trap sites is quite high, this may have affected the correlation coefficient.
In the ring method, the grass pollen sources of the individual rings are correlated with the respective pollen concentrations, whereby a distance weighting is achieved via the largely differing absolute ring size. Thus, the distance of the relevant source regions can be estimated by this method. An alternative, if the decline with increasing distance is known, could be to include distance weighting, as used in paleontological research to study past land cover, where the influence of distance is taken into account from the dispersal models at the beginning and only one value is calculated for the potential pollen sources for each site [66,67]. Weighting the PSA with CI and wind showed little effect on the correlation coefficients. A possible explanation for the small effect of CI could be the different percentages of grassland at each intensity level (see Table 2). The improvement in the correlation coefficients due to wind weighting might be stronger if the wind direction and wind speed were recorded on site at the pollen traps, which would certainly facilitate the detection of potential pollen emission areas. The separation of the concentric rings into four quarters (i.e., wind directions NE, SE, SW, and NW) still might have been too wide, as the variability of the weighted grassland index among the quarters in the outer ring is low.
Agricultural grasslands mainly comprise meadows (InVeKos 451) and mowing pastures (InVeKos 452), which are moderately to intensively cultivated. In this context, the applied weighting is necessary to emphasize the importance of smaller, less intensively managed patches, such as field margins (InVeKos 68) or Natura 2000 conservation areas (InVeKos 958).
The sensitivity analysis (see Figure 6) revealed that the API-based weighting of the non-overlap OpenStreetMap (i.e., non-agricultural sources) enhanced the correlation coefficients, especially in the medium to long range. The enhancement of the correlation coefficients by the ideal case of API weighting in the distances from 0 to 10 km led to a small increase in the correlation coefficients by 0.04 to 0.10, except in the first 500 m. Such patterns indicate that the PSACI+wind results in a high correspondence with the measured pollen indicators for close distances, but does not represent the measured pollen concentration at the medium to long range well.

5. Conclusions

It can be concluded that the applied CI and wind weighting method is suitable, especially for the investigation of local pollen sources and their contribution to the measured wild grass pollen concentration. This is the first study combining high-resolution land-use data weighted by cultivation intensity and wind direction with wild grass pollen concentrations. We demonstrate that the weighted land-use data from InVeKos and OpenStreetMap can explain, to certain extent, the pollen captured in the pollen stations. Still, there is a considerable amount of variability that we cannot attribute to the grassland percentage within the vicinity of the pollen traps. This variability can instead be explained by small-scale conditions in the immediate surroundings and long-distance transport at larger distances. Subsequent studies should focus on mapping the potential pollen sources combined with a probability index of flowering or pollen shedding. This may help improve the situation for those allergic to grass pollen by suggesting specific measures to manage pollen-emitting grasslands.

Supplementary Materials

The following supporting information can be downloaded at: https://www.mdpi.com/article/10.3390/land11020306/s1, Figure S1. Polar plots of potential source areas weighted by cultivation intensity (PSACI) for 500 m rings within 30 km radius circles around 23 selected pollen stations in Bavaria, Germany. Rings were calculated based on available data within the boundary of Bavaria, Germany. See methods for weighting procedure; Figure S2. Correlation coefficients between potential source areas and annual pollen integral (API) and pollen peak (PP), respectively, for 23 selected pollen stations in Bavaria, Germany. The potential source areas have been weighted by cultivation intensity (PSACI) for each of the 60 rings. Stations DEUFS/DEGARM/DEBERC/DEHOF were excluded. Loess smoothing was performed using geom_smooth with a span of 0.7; Figure S3. Boxplots showing the variability of potential source areas weighted by cultivation intensity (PSACI) from 23 selected pollen stations per 500 m distance.

Author Contributions

Conceptualization, S.J., Y.Y. and A.M.; methodology, S.J., Y.Y. and N.E.; validation, J.O., J.B. and A.M.; formal analysis, S.J., Y.Y. and M.S.D.C.; investigation, S.J. and Y.Y.; data acquisition, J.O. and J.B.; data curation, S.J., Y.Y., S.H. and T.P.; writing—original draft preparation, S.J.; writing—review and editing, Y.Y., M.S.D.C., S.H., T.P., N.E., J.O., J.B., C.T.-H., A.D. and A.M.; visualization, S.J. and Y.Y.; supervision, N.E. and A.M.; project administration, N.E. and A.M.; funding acquisition, A.M. All authors have read and agreed to the published version of the manuscript.

Funding

This study was conducted in the project KLIMApollen, funded by the Bavarian State Ministry of the Environment and Consumer Protection and the Bavarian State Ministry of Health and Care (grant number TKP01KPB-73813) as part of the research network “Climate Change and Health”. Data from projects “ePIN-Klima TKP01KPB-73815” and “ePIN-Valid AP-2460-ePIN-V11-U1-D44520/2018” funded by the Bavarian State Ministry of the Environment and Consumer Protection and the Bavarian State Ministry of Health and Care were also included.

Institutional Review Board Statement

Not applicable.

Informed Consent Statement

Not applicable.

Data Availability Statement

All data generated or analyzed during this study are included in this published article and its Supplementary Information files.

Acknowledgments

Thanks to Integrierte Verwaltungs und Kontrollsystem (InVeKoS) for providing land-use data, and to the ePIN project for the pollen data. In this study, land-use data from OpenStreetMap and meteorological data from the German Meteorological Service (DWD) were used.

Conflicts of Interest

The authors declare no conflict of interest.

References

  1. Emberlin, J. Temporal and geographical variations in grass pollen seasons in areas of western Europe: An analysis of season dates at sites of the European pollen information system. Aerobiologia 2000, 16, 373–379. [Google Scholar] [CrossRef]
  2. Burbach, G.J.; Heinzerling, L.M.; Edenharter, G.; Bachert, C.; Bindslev-Jensen, C.; Bonini, S.; Bousquet, J.; Bousquet-Rouanet, L.; Bousquet, P.J.; Bresciani, M.; et al. GA(2)LEN skin test study II: Clinical relevance of inhalant allergen sensitizations in Europe. Allergy 2009, 64, 1507–1515. [Google Scholar] [CrossRef] [PubMed]
  3. Robert Koch Institute. Gesundheit in Deutschland 2015; Robert Koch Institute: Berlin, Germany, 2015. [Google Scholar]
  4. Gilmour, M.I.; Jaakkola, M.S.; London, S.J.; Nel, A.E.; Rogers, C.A. How exposure to environmental tobacco smoke, outdoor air pollutants, and increased pollen burdens influences the incidence of asthma. Environ. Health Perspect. 2006, 114, 627–633. [Google Scholar] [CrossRef] [PubMed] [Green Version]
  5. Cecchi, L.; D’Amato, G.; Ayres, J.G.; Galan, C.; Forastiere, F.; Forsberg, B.; Gerritsen, J.; Nunes, C.; Behrendt, H.; Akdis, C.; et al. Projections of the effects of climate change on allergic asthma: The contribution of aerobiology. Allergy 2010, 65, 1073–1081. [Google Scholar] [CrossRef]
  6. Poethko-Müller, C.; Thamm, M.; Thamm, R. Allergic rhinitis and asthma among children and adolescents in Germany. Results of the cross-sectional KiGGS Wave 2 study and trends. J. Health Monitor. 2018, 3, 52–56. [Google Scholar] [CrossRef]
  7. White, J.F.; Bernstein, D.I. Key pollen allergens in North America. Ann. Allergy Asthma Immunol. 2003, 91, 425–435. [Google Scholar] [CrossRef]
  8. Haftenberger, M.; Laußmann, D.; Ellert, U.; Kalcklösch, M.; Langen, U.; Schlaud, M.; Schmitz, R.; Thamm, M. Prevalence of sensitisation to aeraoallergens and food allergens: Results of the German Health Interview and Examination Survey for Adults (DEGS1). Bundesgesundheitsblatt Gesundh. Gesundh. 2013, 56, 687–697. [Google Scholar] [CrossRef] [Green Version]
  9. D‘Amato, G.; Cecchi, L.; Bonini, S.; Nunes, C.; Annesi-Maesano, I.; Behrendt, H.; Liccardi, G.; Popov, T.; van Cauwenberge, P. Allergenic pollen and pollen allergy in Europe. Allergy 2007, 62, 976–990. [Google Scholar] [CrossRef]
  10. Weger, L.A.; Beerthuizen, T.; Gast-Strookman, J.M.; van der Plas, D.T.; Terreehorst, I.; Hiemstra, P.S.; Sont, J.K. Difference in symptom severity between early and late grass pollen season in patients with seasonal allergic rhinitis. Clin. Transl. Allergy 2011, 1, 18. [Google Scholar] [CrossRef] [Green Version]
  11. Caillaud, D.M.; Martin, S.; Segala, C.; Besancenot, J.P.; Clot, B.; Thibaudon, M.; French Aerobiology Network. Nonlinear short-term effects of airborne Poaceae levels on hay fever symptoms. J. Allergy Clin. Immunol. 2012, 130, 812–814.e1. [Google Scholar] [CrossRef]
  12. Friedman, J.; Barrett, S.C.H. Wind of change: New insights on the ecology and evolution of pollination and mating in wind-pollinated plants. Ann. Bot. 2009, 103, 1515–1527. [Google Scholar] [CrossRef] [PubMed] [Green Version]
  13. Smith, M.; Emberlin, J.; Kress, A. Examining high magnitude grass pollen episodes at Worcester, United Kingdom, using back-trajectory analysis. Aerobiologia 2005, 21, 85–94. [Google Scholar] [CrossRef]
  14. Sofiev, M.; Bergmann, K.-C. (Eds.) Allergenic Pollen: A Review of the Production, Release, Distribution and Health Impacts; Springer: Dordrecht, The Netherlands, 2013; ISBN 978-94-007-4881-1. [Google Scholar]
  15. Andersen, S.T. Identification of wild grass and cereal pollen [fossil pollen, Annulus diameter, surface sculpturing]. In Danmarks Geol. Undersoegelse (Denmark); Aarbog: Copenhagen, Denmark, 1979. [Google Scholar]
  16. Menzel, A.; Ghasemifard, H.; Yuan, Y.; Estrella, N. A first pre-season pollen transport climatology to Bavaria, Germany. Front. Allergy 2021, 2, 1507. [Google Scholar] [CrossRef]
  17. Sofiev, M. On impact of transport conditions on variability of the seasonal pollen index. Aerobiologia 2017, 33, 167–179. [Google Scholar] [CrossRef] [PubMed] [Green Version]
  18. Gehrig, R.; Peeters, A.G. Pollen distribution at elevations above 1000 m inSwitzerland. Aerobiologia 2000, 16, 69–74. [Google Scholar] [CrossRef]
  19. García-Mozo, H.; Oteros, J.A.; Galán, C. Impact of land cover changes and climate on the main airborne pollen types in Southern Spain. Sci. Total Environ. 2016, 548–549, 221–228. [Google Scholar] [CrossRef]
  20. Rojo, J.; Oteros, J.; Pérez-Badia, R.; Cervigón, P.; Ferencova, Z.; Gutiérrez-Bustillo, A.M.; Bergmann, K.-C.; Oliver, G.; Thibaudon, M.; Albertini, R.; et al. Near-ground effect of height on pollen exposure. Environ. Res. 2019, 174, 160–169. [Google Scholar] [CrossRef]
  21. Damialis, A.; Kaimakamis, E.; Konoglou, M.; Akritidis, I.; Traidl-Hoffmann, C.; Gioulekas, D. Estimating the abundance of airborne pollen and fungal spores at variable elevations using an aircraft: How high can they fly? Sci. Rep. 2017, 7, 44535. [Google Scholar] [CrossRef] [Green Version]
  22. Schwartz, M.D. Phenology: An Integrative Environmental Science; Springer: Dordrecht, The Netherlands, 2013; ISBN 978-94-007-6924-3. [Google Scholar]
  23. Ziska, L.H.; Caulfield, F.A. Rising CO2 and pollen production of common ragweed (Ambrosia artemisiifolia L.), a known allergy-inducing species: Implications for public health. Funct. Plant Biol. 2000, 27, 893. [Google Scholar] [CrossRef]
  24. Rojo, J.; Picornell, A.; Oteros, J.; Werchan, M.; Werchan, B.; Bergmann, K.-C.; Smith, M.; Weichenmeier, I.; Schmidt-Weber, C.B.; Buters, J. Consequences of climate change on airborne pollen in Bavaria, Central Europe. Reg. Environ. Chang. 2021, 21, 17. [Google Scholar] [CrossRef]
  25. Menzel, A. The allergen riddle. Nat. Ecol. Evol. 2019, 3, 716–717. [Google Scholar] [CrossRef] [PubMed]
  26. Rojo, J.; Oteros, J.; Picornell, A.; Ruëff, F.; Werchan, B.; Werchan, M.; Bergmann, K.-C.; Schmidt-Weber, C.B.; Buters, J. Land-use and height of pollen sampling affect pollen exposure in Munich, Germany. Atmosphere 2020, 11, 145. [Google Scholar] [CrossRef] [Green Version]
  27. Emberlin, J.; Norris-Hill, J. Spatial variation of pollen deposition in north london. Grana 1991, 30, 190–195. [Google Scholar] [CrossRef]
  28. Hyde, H.A. Atmospheric pollen in relation to land use. Nature 1959, 183, 1694–1695. [Google Scholar] [CrossRef]
  29. Haberle, S.G.; Bowman, D.M.J.S.; Newnham, R.M.; Johnston, F.H.; Beggs, P.J.; Buters, J.; Campbell, B.; Erbas, B.; Godwin, I.; Green, B.J.; et al. The macroecology of airborne pollen in Australian and New Zealand urban areas. PLoS ONE 2014, 9, e97925. [Google Scholar] [CrossRef] [PubMed]
  30. Emberlin, J. The effects of patterns in climate and pollen abundance on allergy. Allergy 1994, 49 (Suppl. S18), 15–20. [Google Scholar] [CrossRef]
  31. European Environment Agency. Land Cover 2012; European Environment Agency: København, Denmark, 2012. [Google Scholar]
  32. Foley, J.A.; Defries, R.; Asner, G.P.; Barford, C.; Bonan, G.; Carpenter, S.R.; Chapin, F.S.; Coe, M.T.; Daily, G.C.; Gibbs, H.K.; et al. Global consequences of land use. Science 2005, 309, 570–574. [Google Scholar] [CrossRef] [Green Version]
  33. Kasprzyk, I. Comparative study of seasonal and intradiurnal variation of airborne herbaceous pollen in urban and rural areas. Aerobiologia 2006, 22, 185–195. [Google Scholar] [CrossRef]
  34. Sikoparija, B.; Radisic, P.; Pejak, T.; Simic, S. Airborne grass and ragweed pollen in the southern Panonnian Valley—consideration of rural and urban environment. Ann. Agric. Environ. Med. 2006, 13, 263–266. [Google Scholar]
  35. Rodríguez-Rajo, F.J.; Fdez-Sevilla, D.; Stach, A.; Jato, V. Assessment between pollen seasons in areas with different urbanization level related to local vegetation sources and differences in allergen exposure. Aerobiologia 2010, 26, 1–14. [Google Scholar] [CrossRef]
  36. Majkowska-Wojciechowska, B.; Pełka, J.; Korzon, L.; Kozłowska, A.; Kaczała, M.; Jarzebska, M.; Gwardys, T.; Kowalski, M.L. Prevalence of allergy, patterns of allergic sensitization and allergy risk factors in rural and urban children. Allergy 2007, 62, 1044–1050. [Google Scholar] [CrossRef]
  37. Bousquet, J.; Khaltaev, N.; Cruz, A.A.; Denburg, J.; Fokkens, W.J.; Togias, A.; Zuberbier, T.; Baena-Cagnani, C.E.; Canonica, G.W.; van Weel, C.; et al. Allergic Rhinitis and its Impact on Asthma (ARIA) 2008 update (in collaboration with the World Health Organization, GA(2)LEN and AllerGen). Allergy 2008, 63 (Suppl. S86), 8–160. [Google Scholar] [CrossRef] [PubMed]
  38. Bosch-Cano, F.; Bernard, N.; Sudre, B.; Gillet, F.; Thibaudon, M.; Richard, H.; Badot, P.M.; Ruffaldi, P. Human exposure to allergenic pollens: A comparison between urban and rural areas. Environ. Res. 2011, 111, 619–625. [Google Scholar] [CrossRef] [PubMed] [Green Version]
  39. Damialis, A.; Konstantinou, G.N. Cereal pollen sensitisation in pollen allergic patients: To treat or not to treat? Eur. Ann. Allergy Clin. Immunol. 2011, 43, 36–44. [Google Scholar] [PubMed]
  40. Skjøth, C.A.; Ørby, P.V.; Becker, T.; Geels, C.; Schlünssen, V.; Sigsgaard, T.; Bønløkke, J.H.; Sommer, J.; Søgaard, P.; Hertel, O. Identifying urban sources as cause of elevated grass pollen concentrations using GIS and remote sensing. Biogeosciences 2013, 10, 541–554. [Google Scholar] [CrossRef] [Green Version]
  41. Vuorela, I. Relative Pollen Rain around Cultivated Fields; Societas pro Fauna et Flora Fennica: Helsinki, Finland, 1973; ISBN 951-661-010-2. [Google Scholar]
  42. Theuerkauf, M.; Dräger, N.; Kienel, U.; Kuparinen, A.; Brauer, A. Effects of changes in land management practices on pollen productivity of open vegetation during the last century derived from varved lake sediments. Holocene 2015, 25, 733–744. [Google Scholar] [CrossRef]
  43. Ciani, F.; Dell’Olmo, L.; Foggi, B.; Mariotti Lippi, M. The effect of urban green areas on pollen concentrations at ground level: A study in the city of Florence (Italy). Urban For. Urban Green. 2021, 60, 127045. [Google Scholar] [CrossRef]
  44. Oteros, J.; Sofiev, M.; Smith, M.; Clot, B.; Damialis, A.; Prank, M.; Werchan, M.; Wachter, R.; Weber, A.; Kutzora, S.; et al. Building an automatic pollen monitoring network (ePIN): Selection of optimal sites by clustering pollen stations. Sci. Total Environ. 2019, 688, 1263–1274. [Google Scholar] [CrossRef]
  45. Galán, C.; Smith, M.; Thibaudon, M.; Frenguelli, G.; Oteros, J.; Gehrig, R.; Berger, U.; Clot, B.; Brandao, R. Pollen monitoring: Minimum requirements and reproducibility of analysis. Aerobiologia 2014, 30, 385–395. [Google Scholar] [CrossRef]
  46. Diepolder, R. Bestimmung der Wichtigsten Gräser des Wirtschaftsgrünlands; LfL Agraökologie: Freising, Germany, 2007. [Google Scholar]
  47. Hart, M.L.; Wentworth, J.E.; Bailey, J.P. The effects of trap height and weather variables on recorded pollen concentration at Leicester. Grana 1994, 33, 100–103. [Google Scholar] [CrossRef] [Green Version]
  48. Rojo, J.; Picornell, A.; Oteros, J.; Price, S. AeRobiology: The computational tool for biological data in the air. Methods Ecol. Evol. 2019, 10, 1371–1376. [Google Scholar] [CrossRef] [Green Version]
  49. Galán, C.; Ariatti, A.; Bonini, M.; Clot, B.; Crouzy, B.; Dahl, A.; Fernandez-González, D.; Frenguelli, G.; Gehrig, R.; Isard, S.; et al. Recommended terminology for aerobiological studies. Aerobiologia 2017, 33, 293–295. [Google Scholar] [CrossRef]
  50. Oteros, J.; García-Mozo, H.; Alcázar, P.; Belmonte, J.; Bermejo, D.; Boi, M.; Cariñanos, P.; Díaz de la Guardia, C.; Fernández-González, D.; González-Minero, F.; et al. A new method for determining the sources of airborne particles. J. Environ. Manag. 2015, 155, 212–218. [Google Scholar] [CrossRef] [PubMed]
  51. Aylor, D.E. Settling speed of corn (Zea mays) pollen. J. Aerosol Sci. 2002, 33, 1601–1607. [Google Scholar] [CrossRef]
  52. Bayerisches Staatsministerium für Ernährung, Landwirtschaft und Forsten. Bayerischer Agrarbericht 2018; Bayarisches Staatsministerium für Ernährung, Landwirtschaft und Forsten: Munich, Germany, 2018. [Google Scholar]
  53. Menzel, A.; Vopelius, J.; Estrella, N.; Schleip, C.; Dose, V. Farmers’ annual activities are not tracking the speed of climate change. Clim. Res. 2006, 32, 201–207. [Google Scholar]
  54. R Core Team. R: A Language and Environment for Statistical Computing; R Foundation for Statistical Computing: Vienna, Austria, 2018; Available online: https://www.R-project.org/ (accessed on 10 January 2022).
  55. Wickham, H. ggplot2: Elegant Graphics for Data Analysis; Springer: New York, NY, USA, 2009; ISBN 978-0-387-98141-3. [Google Scholar]
  56. Ghasemifard, H.; Ghada, W.; Estrella, N.; Lüpke, M.; Oteros, J.; Traidl-Hoffmann, C.; Damialis, A.; Buters, J.; Menzel, A. High post-season Alnus pollen loads successfully identified as long-range transport of an alpine species. Atmos. Environ. 2020, 231, 117453. [Google Scholar] [CrossRef]
  57. Andersson, K.; Lidholm, J. Characteristics and immunobiology of grass pollen allergens. Int. Arch. Allergy Immunol. 2003, 130, 87–107. [Google Scholar] [CrossRef]
  58. Jung, S.; Estrella, N.; Pfaffl, M.W.; Hartmann, S.; Ewald, F.; Menzel, A. Impact of elevated air temperature and drought on pollen characteristics of major agricultural grass species. PLoS ONE 2021, 16, e0248759. [Google Scholar] [CrossRef]
  59. Raynor, G.S.; Ogden, E.C.; Hayes, J.V. Dispersion and deposition of corn pollen from experimental Sources 1. Agron. J. 1972, 64, 420–427. [Google Scholar] [CrossRef]
  60. Hofmann, F.; Otto, M.; Wosniok, W. Maize pollen deposition in relation to distance from the nearest pollen source under common cultivation—Results of 10 years of monitoring (2001 to 2010). Environ. Sci. Eur. 2014, 26, 539. [Google Scholar] [CrossRef] [Green Version]
  61. Eder, J. Bericht zum Erprobungsanbau mit gentechnisch verändertem Mais in Bayern 2005. In Landesanst. Landwirtsch. (LfL); Bayer: Bayerische Landesanstalt für Landwirtschaft (LfL): Freising, Germany, 2006. [Google Scholar]
  62. Bundessortenamt. Beschreibende Sortenliste Futtergräser Beschreibende Sortenliste—Esparsette, Klee, Luzerne; Bundessortenamt: Hannover, Germany, 2013. [Google Scholar]
  63. Hjort, J.; Hugg, T.T.; Antikainen, H.; Rusanen, J.; Sofiev, M.; Kukkonen, J.; Jaakkola, M.S.; Jaakkola, J.J.K. Fine-scale exposure to allergenic pollen in the urban environment: Evaluation of land use regression approach. Environ. Health Perspect. 2016, 124, 619–626. [Google Scholar] [CrossRef] [PubMed] [Green Version]
  64. Jung, S.; Estrella, N.; Pfaffl, M.W.; Hartmann, S.; Handelshauser, E.; Menzel, A. Grass pollen production and group V allergen content of agriculturally relevant species and cultivars. PLoS ONE 2018, 13, e0193958. [Google Scholar] [CrossRef] [PubMed]
  65. Rantio-Lehtimäki, A.; Koivikko, A.; Kupias, R.; Mäkinen, Y.; Pohjola, A. Significance of sampling height of airborne particles for aerobiological information. Allergy 1991, 46, 68–76. [Google Scholar] [CrossRef] [PubMed]
  66. Mazier, F.; Gaillard, M.-J.; Kuneš, P.; Sugita, S.; Trondman, A.-K.; Broström, A. Testing the effect of site selection and parameter setting on REVEALS-model estimates of plant abundance using the Czech Quaternary Palynological Database. Rev. Palaeobot. Palynol. 2012, 187, 38–49. [Google Scholar] [CrossRef]
  67. Li, F.; Gaillard, M.-J.; Sugita, S.; Mazier, F.; Xu, Q.; Zhou, Z.; Zhang, Y.; Li, Y.; Laffly, D. Relative pollen productivity estimates for major plant taxa of cultural landscapes in central eastern China. Veget Hist. Archaeobot. 2017, 26, 587–605. [Google Scholar] [CrossRef] [Green Version]
Figure 1. Locations of the 27 pollen stations in Bavaria, Germany with 30 km surrounding concentric rings (60 concentric rings in 500 m steps up to a 30 km radius (see Section 2.3)). The corresponding weather stations are marked by open circles. The background map is filled with Digital Terrain Model Grid Width 1000 m (DGM1000, GeoBasis-DE/BKG 2020, dl-de/by-2-0, http://www.bkg.bund.de, accessed on 31 December 2021). The full names of the stations and their exact locations are listed in Table 1.
Land 11 00306 g001
Figure 2. The grass pollen calendar of the 27 pollen stations for 2015 in Bavaria, Germany. The time series of daily pollen concentrations are shown with information on the annual pollen integral (API, in blue shades and numbers) and pollen peak (PP, in red dashed vertical lines and numbers) for each station.
Land 11 00306 g002
Figure 3. Polar plots of potential source areas weighted by cultivation intensity and wind (PSACI+wind) for 500 m rings within 30 km radius circles around 23 selected pollen stations in Bavaria, Germany. Rings were calculated based on available data within the boundary of Bavaria, Germany. See methods for weighting procedure.
Land 11 00306 g003
Figure 4. Correlation coefficients between potential source areas and annual pollen integral (API) and pollen peak (PP), respectively, for 23 selected pollen stations in Bavaria, Germany. The potential source areas have been weighted by cultivation intensity and wind (PSACI+wind) for each of the 60 rings. Stations DEUFS/DEGARM/DEBERC/DEHOF were excluded. Loess smoothing was performed using geom_smooth with a span of 0.7.
Land 11 00306 g004
Figure 5. Boxplots showing the variability of potential source areas weighted by cultivation intensity and wind (PSACI+wind) from 23 selected pollen stations per 500 m distance. The corresponding boxplot for PSACI can be found in the Supplement Figure S3.
Land 11 00306 g005
Figure 6. Differences in Pearson correlation coefficients between annual pollen integrals (API) and potential source areas weighted by cultivation intensity and wind (PSACI+wind) before and after manual assignment of API-based CI weightings on non-agricultural areas (OpenStreetMap), where agricultural areas (InVeKos) remained unchanged. Positive values indicate improvements in correlation coefficients after sensitivity weighting.
Land 11 00306 g006
Table 1. Information about the 27 pollen stations and their respective average temperature (T) and total precipitation (P) during grass pollen season from the closest DWD weather stations. The potential source area (PSA) of grass pollen according to Oteros and colleagues [44] as grassland area within 30 km circles [%] is given, weighted by the overall cultivation intensity (CI) and wind direction for 23 selected stations in 2015 (PSACI+wind). DEBERC, DEHOF, DEGARM, and DEUFS are not analyzed as their immediate vicinity to the German border results in a lack of data on CI.
Station IDStation NameAltitudeTPOverall Ring, Averaged PSACI+wind
[m a.s.l.][°C][mm]
DEALTOAltötting39819.737.65.68
DEAUGSAugsburg49716.8164.96.09
DEBAMBBamberg23818.0127.97.48
DEBAYRBayreuth41915.7104.99.72
DEBERCBerchtesgaden57315.9125.5
DEBIEDMünchen-Biederstein51019.4276.08.67
DEDONADonaustauf42517.2147.96.41
DEFEUCFeucht36517.8140.86.80
DEFREIFreising44818.1213.311.13
DEGAISGaissach71717.1458.915.56
DEGARMGarmisch-Partenkirchen82116.0130.2
DEHOFHof53116.5146.0
DEKITZKitzingen24616.115.94.64
DEKOESKösching39118.6120.45.87
DELANDLandshut39718.7212.55.24
DEMARKMarktheidenfeld21618.193.07.01
DEMINDMindelheim61017.3359.613.38
DEMUNCMünchen_Thalkirchen53819.2258.88.20
DEMUSTMünnerstadt34716.08.19.02
DEOBEROberjoch87016.3409.519.57
DEOETTOettingen43117.8178.47.18
DEPASSPassau31818.9276.36.46
DETROSTrostberg48318.2375.19.00
DEUFSSchneefernerhaus26505.943.5
DEVIECViechtach45914.4166.79.41
DEWEIDWeiden40317.4142.25.09
DEZUSMZusmarshausen48317.7292.75.63
Table 2. (A) InVeKos and (B) OpenStreetMap land-use types containing grassland ordered by their respective proportions of the total grassland area within 30 km circles (German boundary) at all 23 selected pollen stations (DEUFS/DEGARM/DEBERC/DEHOF excluded). Within InVeKos land-use types, the proportions of cultivation intensity CI (i.e., <0.3 low intensity, 0.3–1.4 moderate, and ≥1.4 intensive) are based on RGV/HFF. Within OpenStreetMap land-use types, the proportions of cultivation intensity (0 = extensive; 0.3 moderate, and 1.4 intensive) are based on manual inspection of CI values (see Section 2.3). Descriptions are made based on the information available from the two databases.
(A) InVeKos
Land-Use TypeProportionDescription<0.3 CI0.3–1.4
CI
≥1.4
CI
45154.33Meadow (including meadow orchard)16.4723.9759.56
45216.80Mowing pasture2.8051.9845.22
4532.88Pasture6.9764.3128.72
622.52Fallow (ecological compensation conservation areas)64.5012.7722.73
4552.12Alpine pasture41.7756.451.79
4411.86Newly sown grassland44.7124.6930.60
4241.55Agricultural grassland (due to crop rotation)22.0917.8260.09
4601.30Sheep grazing2.8995.881.23
4580.74Litter meadow16.5763.2720.15
5600.66Arable land; set aside (due to agri-environmental schemes)77.6514.208.15
5920.41Permanent grassland; set aside81.8110.307.89
9300.35Fish farming pond area74.1714.1411.70
5910.34Cropland; set aside82.2511.466.28
9410.22Fallow under organic farming (permanent grassland)80.0017.942.06
4540.21Rough pastures3.8890.635.49
8520.12Miscanthus (Silvergrass)70.1015.0714.83
580.11Field margin (ecological compensation conservation areas)59.1810.2930.53
8530.11Tall Wheatgrass Cultivar Szarvasi-1 (Elymus elongatus ssp. ponticus cv. Szarvasi-1)67.2918.8113.90
8030.09Sudangrass (Sorghum × drummondii or Sorghum sudanense)56.1628.6615.18
9120.09Seed production for grasses according to Seed law72.7912.7314.48
9580.09Nature conservation area (without agricultural management)61.9527.5310.51
4280.06Temporary grassland19.6213.7666.62
4290.04Other fodder plant49.0428.5222.44
560.04Buffer strips along cropland (ecological compensation conservation area)60.797.8731.34
8700.03Energy crop in mixed culture55.6636.387.96
9400.03Uncultivated pond area80.596.3913.01
540.01Buffer strips along woodland edges (ecological compensation conservation area)34.4511.8953.66
5460.01Inoperative permanent grassland (FELEG)99.65 0.35
5670.01Inoperative permanent grassland (agri-environmental measures)53.2030.4716.33
57<0.01Buffer stripe (ecological compensation conservation areas, permanent greenspace)40.429.1150.47
835<0.01Other nuts 100
854<0.01Ribbon grass39.39 60.61
920<0.01Home or kitchen garden (without agricultural use)71.5913.8814.53
(B) OpenStreetMap
Land-Use TypeProportionDescription0 CI0.3 CI1.4 CI
Meadow7.94Meadow, possibly used for grazing cattle 100
Grass1.76Areas with grass 100
Park1.61Park 100
Allotments0.56Small private gardens 100
Graveyard0.37Cemetery or graveyard 100
Recreation ground0.34Open green space for general recreation 100
Heath0.30Heath areas100
Publisher’s Note: MDPI stays neutral with regard to jurisdictional claims in published maps and institutional affiliations.

