Article

Spatial Heterogeneity of Driving Factors of Wind Erosion Prevention Services in Northern China by Large-Scale Human Land-Use Management

1
State Key Laboratory of Urban and Regional Ecology, Research Center for Eco-Environmental Sciences, Chinese Academy of Sciences, Shuangqing Road 18, Beijing 100085, China
2
University of Chinese Academy of Sciences, Beijing 100049, China
3
School of Geosciences & Surveying Engineering, China University of Mining & Technology, Beijing 100083, China
*
Author to whom correspondence should be addressed.
Land 2022, 11(1), 111; https://doi.org/10.3390/land11010111
Submission received: 8 December 2021 / Revised: 25 December 2021 / Accepted: 4 January 2022 / Published: 10 January 2022

Abstract

:
Large-scale human land-use management is an effective method for ecosystem restoration and wind erosion prevention service (WEPS) improvement. However, the spatial differences of driving factors and the feedback in subsequent management have received less attention. This study analysed the temporal and spatial changes in the WEPS in northern China from 2000 to 2015, classified the driving modes between the WEPS and environmental factors, distinguished the main driving factors, and proposed suggestions for successive projects. The results showed that, compared with 2000, the amount of WEPSs in 2015 increased by 12.60%, and forest and grassland in the WEPS-increased area was 1.34 times that in the declining area. There were east–west differences in the driving mechanism of WEPS improvement. In addition to climatic and topographic factors, the western division was mainly affected by changes in vegetation quality, whereas the eastern division was affected by the combined influence of vegetation quality and quantity. This study shows the necessity of land-use management and project zoning policies, and provides a reference for policy formulation and management of large-scale ecological projects.

1. Introduction

The world, especially China, has experienced a rapid increase in vegetation coverage in recent decades; the human management of land use is one of the main factors that explains the observed greening trend [1,2]. Although relatively little afforestation has been carried out in northern China or other regions of the same latitude, due to the constraints of climate and geographical factors, and the low economic benefits [3,4,5,6], afforestation affords more important regional ecosystem services [7,8]. Wind erosion prevention, the primary objective of northern afforestation projects [7,9], is one of the crucial ecosystem services. Enhanced wind erosion prevention is of great significance to local ecosystems [10,11,12,13,14,15], but affects regional ecological security through service flows [16,17,18].
Wind erosion is controlled by reducing the wind erosion forces on erodible soil particles and/or by creating aggregates or soil surfaces that are more resistant to wind erosion forces [19]. Existing control methods focus mostly on biological and physical processes, including reducing field width, maintaining vegetation residues on the soil surface, utilizing stable soil aggregates or clods, roughing of the land surface, and levelling of the land [19,20]. Although various factors could affect wind erosion prevention [21,22], the process is highly sensitive to climate change, which influences wind erosivity and patterns of land use and management affected by humans, which influence vegetation cover and soil erodibility [21]. The consequences of climate change are usually large spatio-temporal scales, far-reaching and irreversible [23,24], whereas the results caused by human land management have a relatively small impact, but are sensitive to time and space differences [10,11,12,13,14,15].
Most land management practices, e.g., broad-scale ecological restoration, are aimed at restoring vegetation [25,26]; this method has been considered an effective solution for improving wind erosion prevention [19,20,21]. In fact, it has achieved good protection in many regions [4,5,6,7,8], particularly in China. Due to land use/cover changes, the wind erosion modulus in China decreased by half from 1990 to 2015 [10]. In particular, wind erosion decreased at an average rate of 6.11 million t·a-1 in northern China, of which more than one-third benefited from ecological restoration [12]. In order to give full play to the role of human land management in wind erosion prevention, many studies have been carried out around effect evaluation and the identification of influencing factors [9,10,11,12,13,14,15]. Previous studies have analysed only the spatial pattern and quantity of wind erosion prevention [9,10,11,12,13,14,15,27,28] with less consideration for quantifying differences in the driving forces. However, spatial heterogeneity in climate and vegetation leads to differences in wind erosion prevention effects [29], which are critical to feedback and inspire human land-use management.
The aim of this study was to quantify the spatial heterogeneity of driving factors in wind erosion prevention services (WEPSs) in northern China to guide large-scale ecological restoration or land management. To achieve this, we used the revised wind erosion equation (RWEQ) to assess the wind erosion modulus across northern China at the km scale from 2000 to 2015. According to the relationships between the WEPS and influencing factors, the study area was classified into subregions for the identification of factors driving differences. The results can provide feedback to guide the zonal design and management of large-scale ecological restoration.

2. Materials and Methods
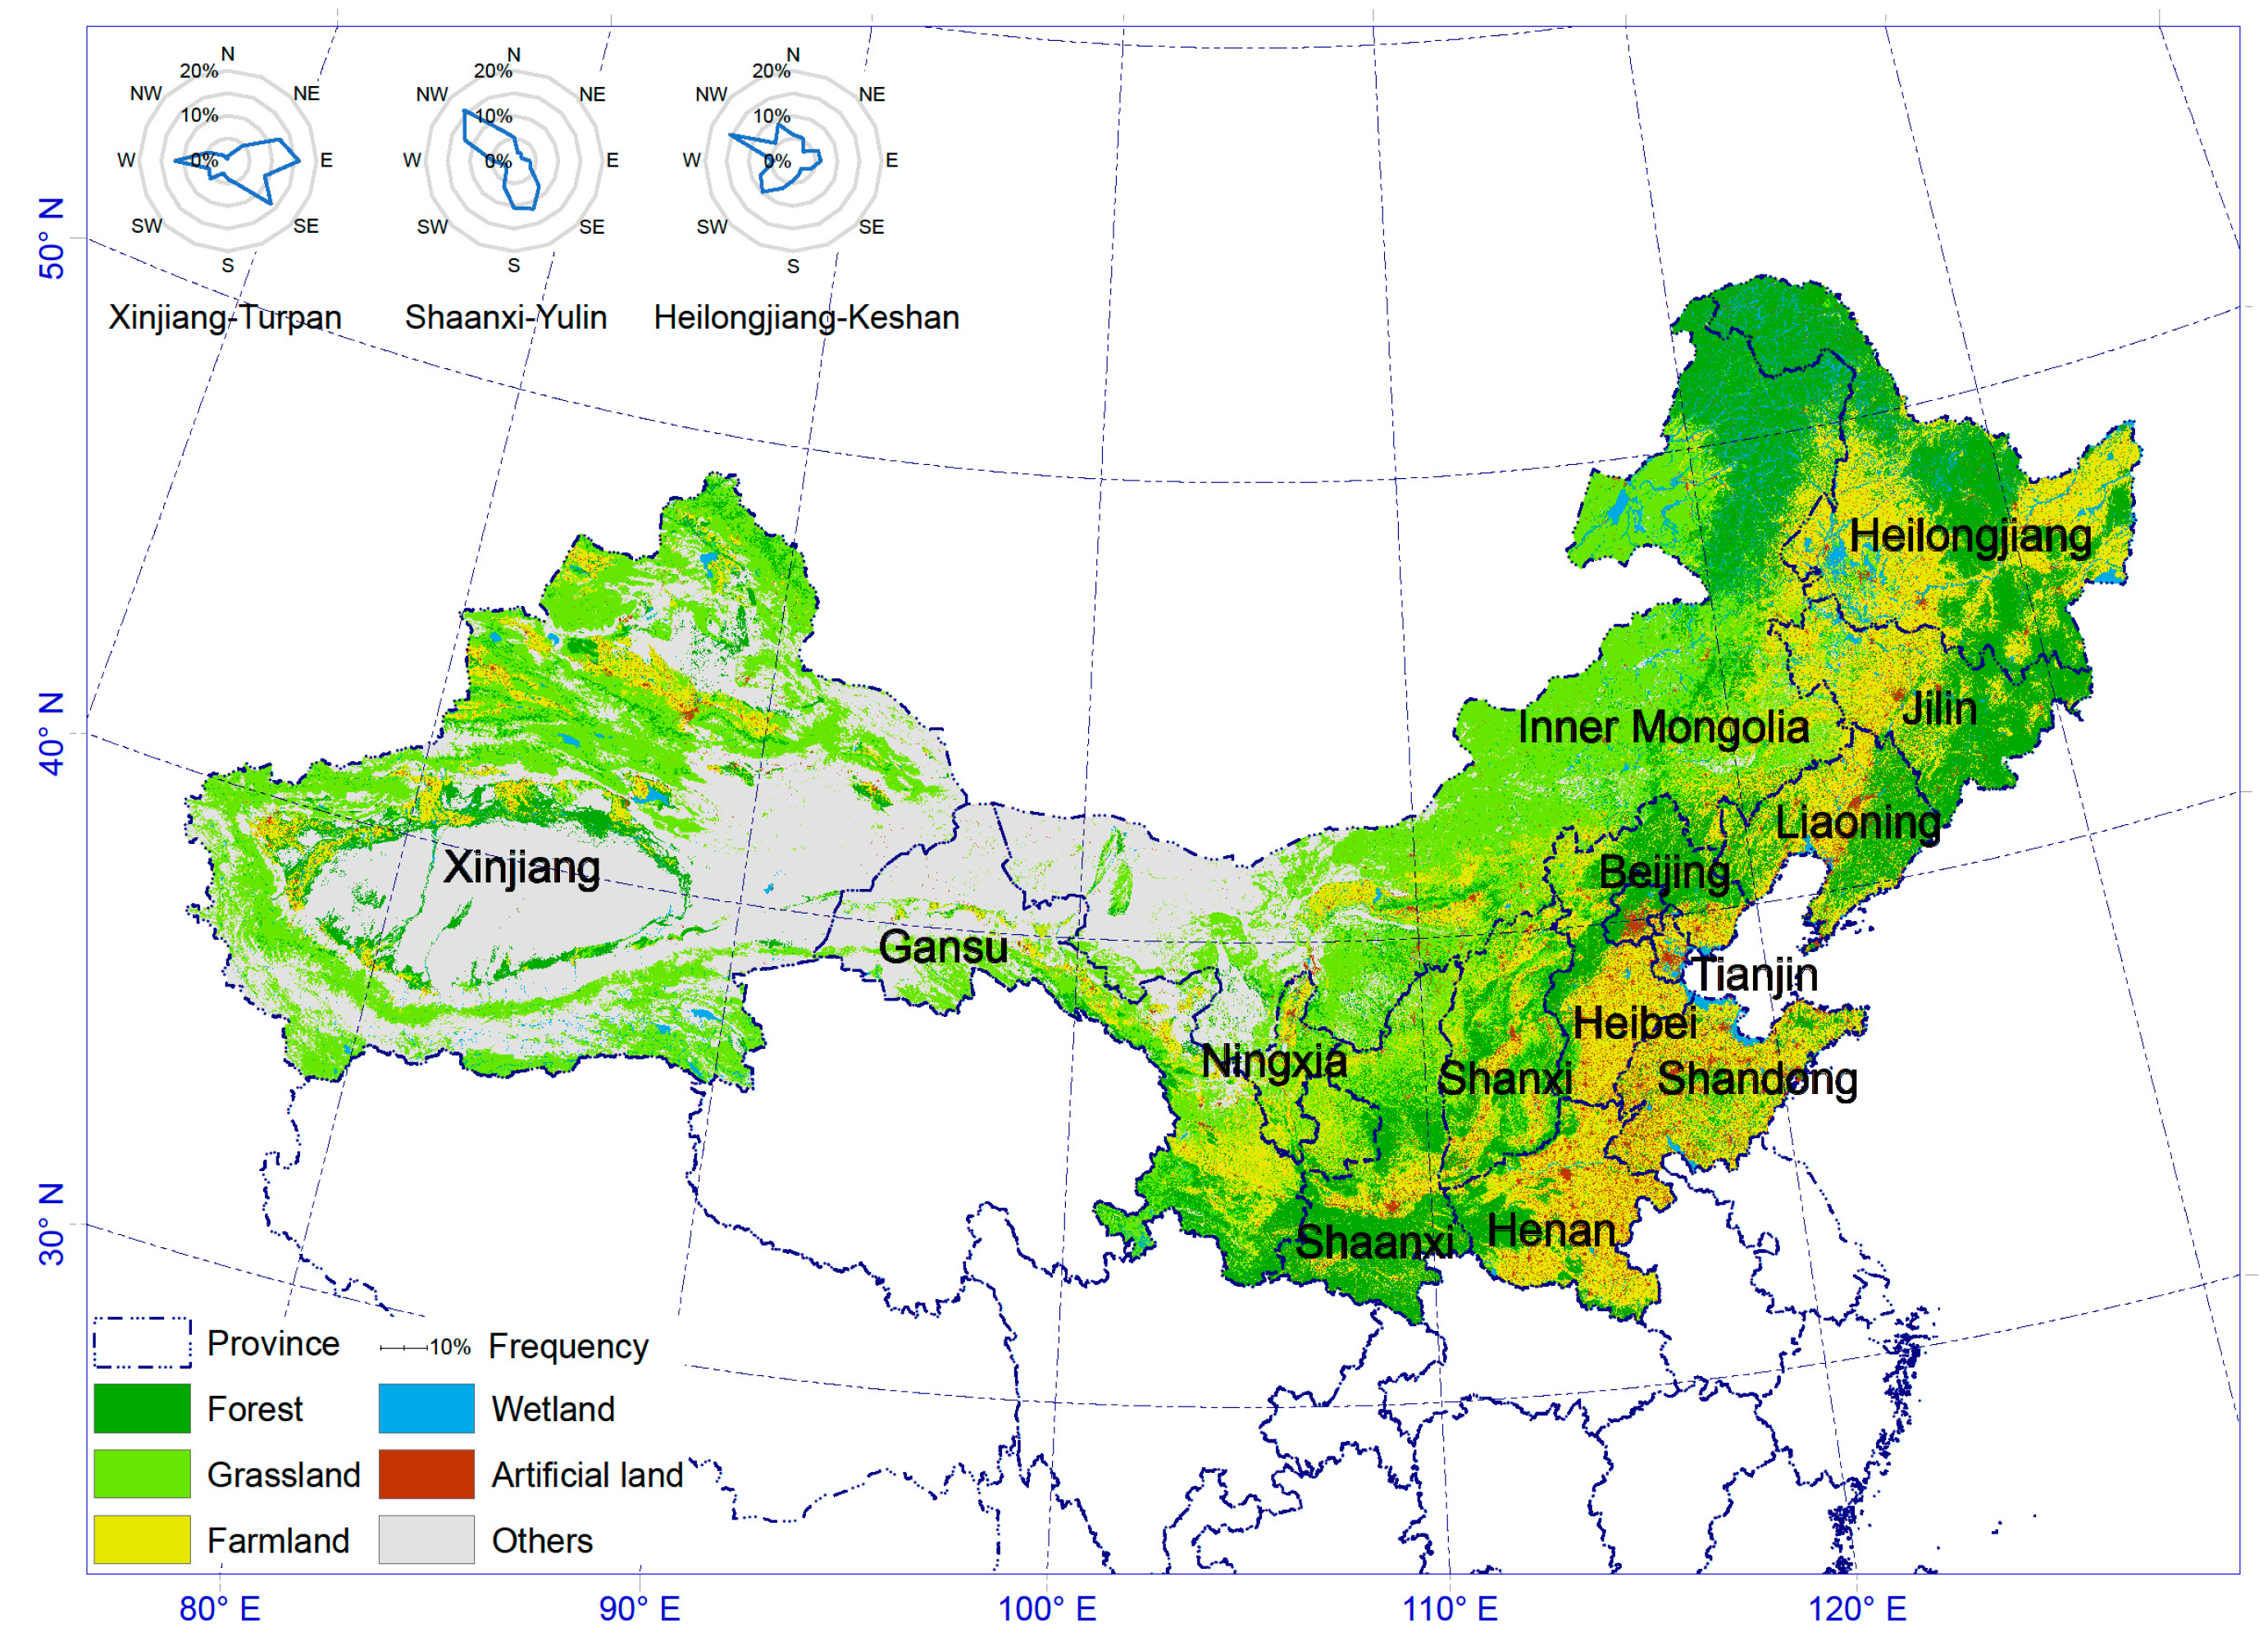
2.1. Study Area

The study area consisted of 14 provincial districts with an area of 4.94 × 10⁶ km2, which cover the north-western and northern areas of China’s geographical regions (Figure 1). The climate changes from the arid zone−cold steppe/desert (arid or semi-arid) in the west, to a cold zone−dry winter−hot/warm/cold summer (semi humid or humid) in the east, according to the Köppen−Geiger Climate Classification in northern China [30,31,32,33]. Affected by the temperate of the continental monsoon climate [33], northerly and southerly winds prevail in winter and summer, respectively, and the annual average wind speed varies from about 1.2 m/s to 5.5 m/s [34]. The study area crossed the first and second topographical steps of China, and the elevation dropped from about 2000 m in the west to 0 m in the east [35]. In view of pedogenic process, the soil type changed from desert soil/regosol in the west, to steppe soil in the middle, and then to aquatic soil/forest soil in the east [36]. Grassland ecosystems and other ecosystems composed of desert and bare rock dominated the study area, accounting for 26.80% and 26.59%, respectively. Farmland and forest were next, with area proportions of 20.50% and 19.87%, respectively. Wetland and artificial land had the least area, both with values slightly above 3.00% (Figure 1). Since the 1980s, large-scale ecological restorations have been implemented across the area, including the Three-North Shelter Forest Program, Beijing–Tianjin sandstorm source control, and Grain for Green projects. The main objectives of these projects are sand prevention and control, dust reduction, and soil and water conservation [7,8,9].

2.2. Data Collection

Meteorological data, including temperature, wind, radiation and precipitation, were sourced from 1155 national meteorological stations and interpolated by the spline function based on the ArcMap 10.1 platform. To eliminate the random effects of meteorological conditions, we used annual averages from 2000 to 2015 for a wind erosion service assessment. The normalized difference vegetation index (NDVI) data were obtained from https://ecocast.arc.nasa.gov/data/pub/gimms/3g.v1/ (accessed on 22 March 2018). Land use was provided by the Data Center for Resources and Environmental Sciences, Chinese Academy of Sciences (RESDC) (http://www.resdc.cn (accessed on 22 March 2018)). Soil data and a soil map-based Harmonized World Soil Database (v1.2) were obtained from the National Tibetan Plateau Data Center. The spatial accuracy of all raster data was finally unified to 1 km.

2.3. Wind Erosion Prevention Service

Wind erosion, one of the soil erosion pathways, is a key cause of land degradation in northern China. Wind erosion models are categorized in different groups—empirical and physical-based models—and range from simple to complex [37]. Considering the accuracy and historical comparability of the results, the availability of data, and the wide range of applications, we used the RWEQ to quantify wind erosion services [38]. The RWEQ is derived from the US Department of Agriculture and combines empirical and process modelling; it has been extensively tested under broad field conditions [37,38,39,40]. The model integrates elements such as soil, weather, vegetation, topography, roughness, etc., and estimates monthly or annual wind erosion. Daily changes in weather and management activities, such as freezing/thawing and soil roughness in the RWEQ model, are not supported [37], which could be ignored in the interannual scale of this study. The formulae are as follows:
Q max = 109.8 [ W F E F S C F K C ]
S = 150.7 [ W F E F S C F K C ] 0.3711
S L = 2 z S 2 Q max e ( z / s ) 2
Q max _ p = 109.8 [ W F E F S C F K ]
S p = 150.7 [ W F E F S C F K ] 0.3711
S L p = 2 z S 2 Q max _ p e ( z / s ) 2
S R = S L p S L
where Qmax is the maximum transport capacity, kg m−1; S is the critical field length, m; Z is the distance from the upwind edge of the field, m; SL is the soil loss caused by wind erosion, kg m−2; SR is the fixed wind erosion, kg m−1a−1; subscript p is the potential pattern; WF is the weather factor; EF is the soil erodibility factor; SCF is the soil crust factor; K’ is the surface roughness factor; and C is the vegetation cover.
The main parameters were calculated as follows:
W F = W f × ρ g × S W × S D
W f = u ( u U ) 2 × N w f
S W = E T p ( R + I ) ( N R / N ) E T p
S D = 1 N s d / N
E F = 29.09 + 0.31 S a + 0.17 S i + 0.33 ( S a / C l ) 2.59 O M 0.95 C a C O 3 100
S C F = 1 / ( 1 + 0.0066 C l 2 + 0.021 O M 2 )
K = e ( 1.86 K r 2.41 K r 0.934 0.1227 C r r )
C = e 0.0438 S C
where Wf is the wind factor, m3/s3; ρ is the air density, kg/m3; g is the acceleration of gravity, m/s2; SW is the soil moisture factor; SD is the snow cover factor; u is the wind speed, m/s; U is the wind speed of sand moving, m/s; Nwf is the number of days when u is larger than U; ETp is the potential evapotranspiration, mm; R is the precipitation, mm; I is the irrigation, mm; NR is the number of days with rainfall and irrigation; N is the total number of days; Nsd is the number of days with snow cover greater than 25.4 mm; Sa is the percentage of sand, %; Si is the percentage of silt, %; Cl is the percentage of clay, %; OM is the percentage of organic matter, %; CaCO3 is the percentage of calcium carbonate, %; Kr is the terrain roughness factor, cm; Crr is the random roughness factor, cm; and SC is the vegetation coverage.

2.4. Classification and Driving Force Identification

The K-clustering method was used for the classification of WEPSs and environmental factors at the municipal scale, in which partitioning around medoids (PAM) was adopted to compensate for being overly sensitive to outliers [41]. To identify the driving factors affecting the WEPSs, four types of factors were initialized, including meteorology (precipitation, temperature, potential evapotranspiration), topography (elevation and slope), vegetation (fractional vegetation coverage change of study area, forest, grassland and farmland) and land-use (area change of forest, grassland and farmland), according to the wind erosion process [27,42,43]. The Spearman correlation was used for correlation analysis and the selection of factors. Redundancy analysis (RDA) was used to qualify the contribution of driving factors.

3. Results

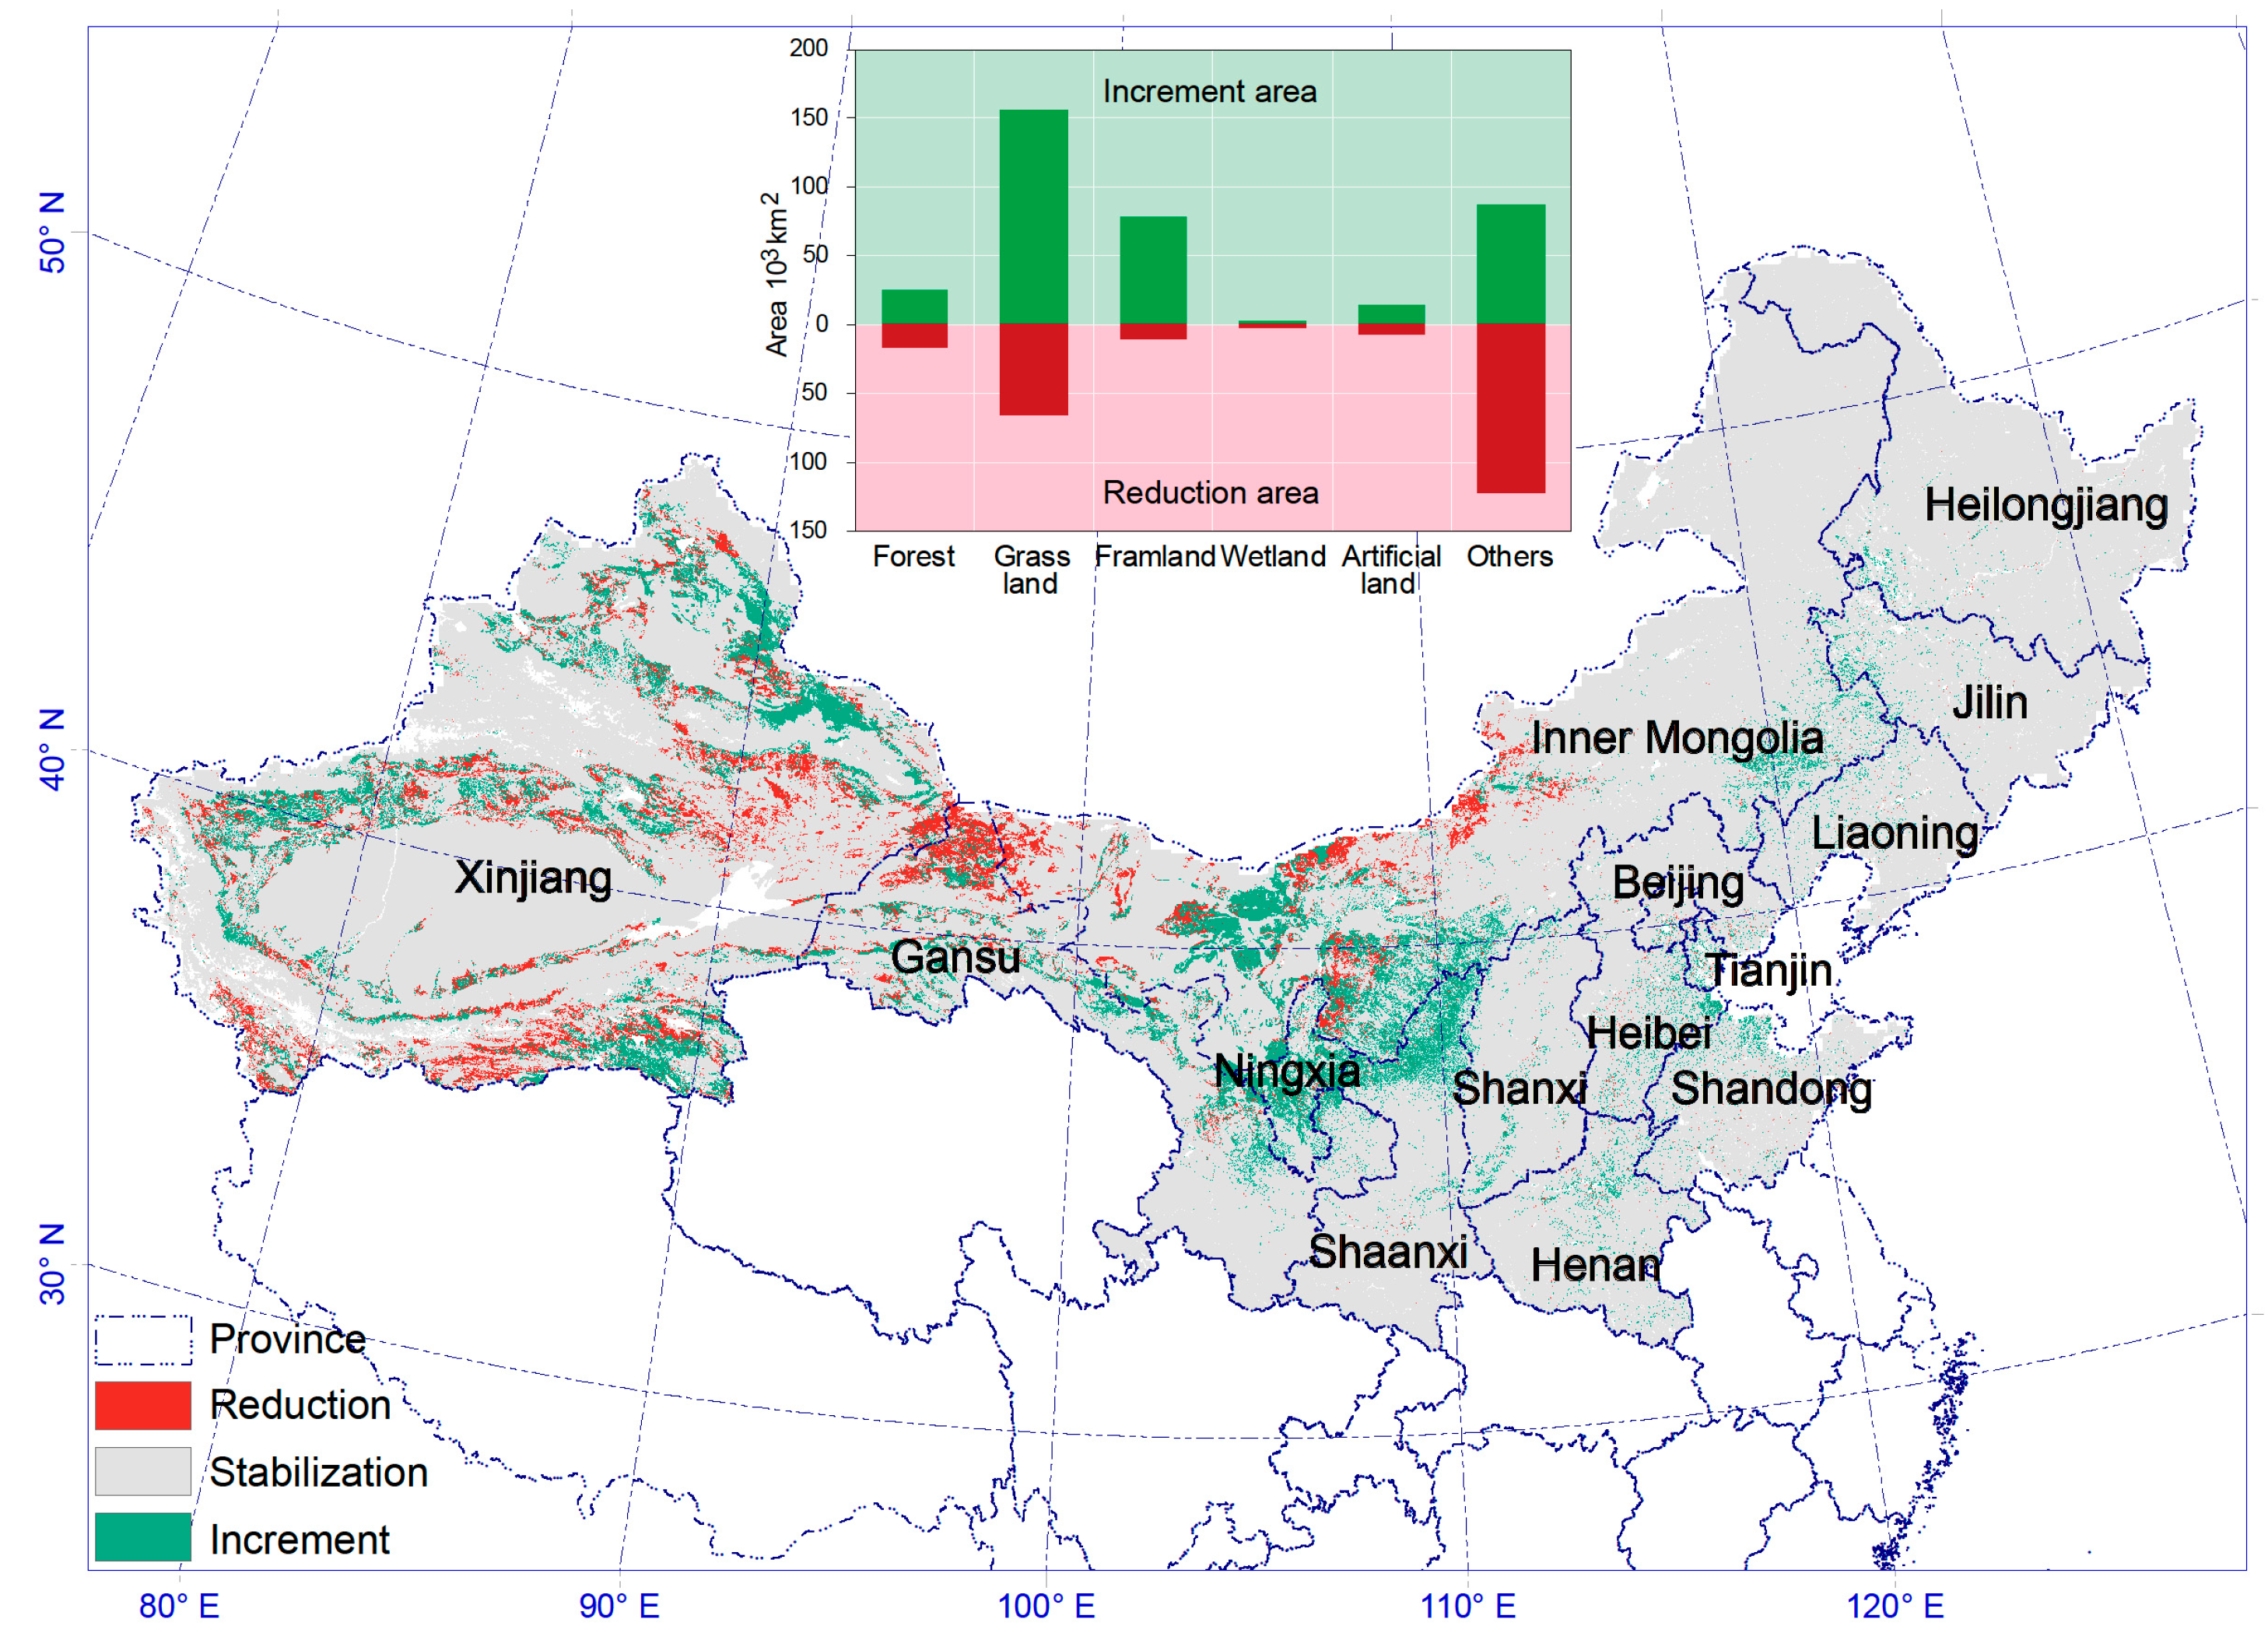
3.1. Temporal and Spatial Changes in Sandstorm Prevention Services

Wind erosion prevention services were generally enhanced by 1.87 × 10⁷ t from 2000 to 2015 (Figure 2). Spatially, most areas were relatively stable, with fluctuations of less than 1.00 t/km2. The areas of dramatic change were in the central part of the study area, where the greatest increase was located at the junction of Ningxia, Shaanxi and Inner Mongolia (around the Kubuqi Desert and Mu Us Sand land). In contrast, the area with an obvious decrease was in northern Jiuquan of Gansu Province. The transformation of land-use type in areas with wind erosion service changes was complicated, but vegetation cover increased more in areas with increases than in areas with decreases (Figure 2).

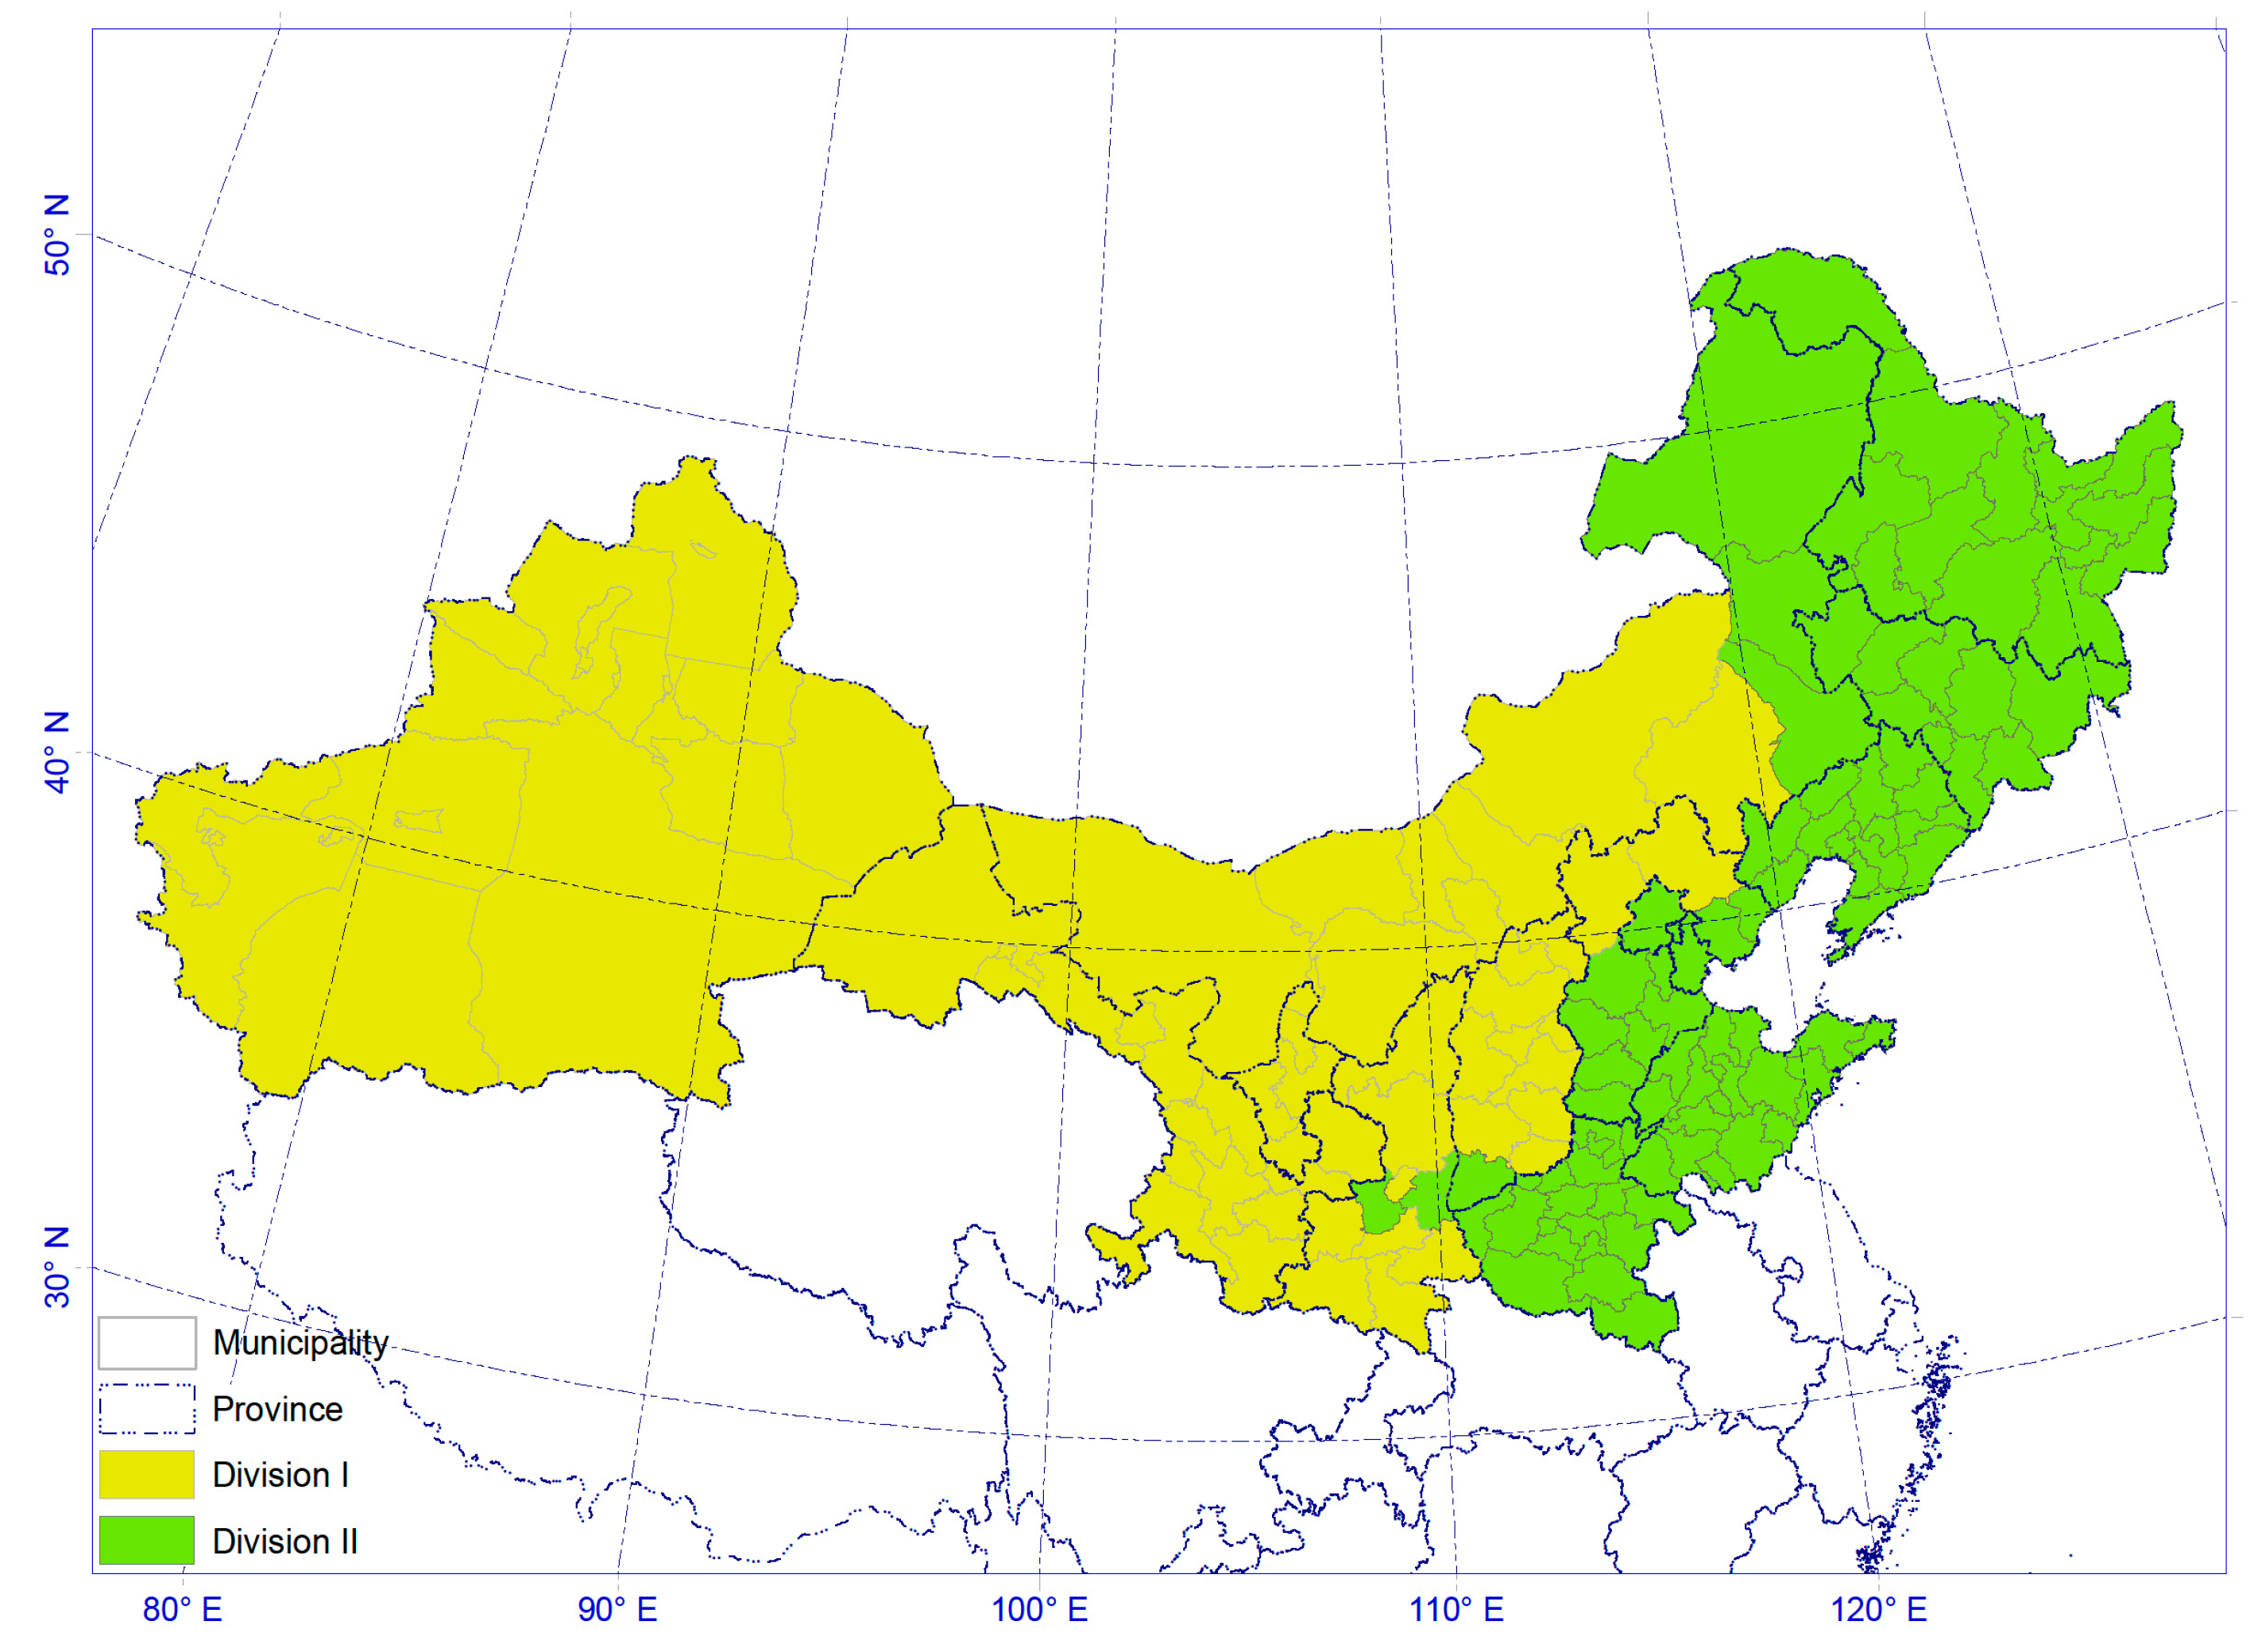
3.2. Classification of the Relationship of Wind Erosion Services and Environmental Factors

The study area was divided into two divisions according to the relationship between wind erosion services and environmental factors (Figure 3). Division I covered the mid-west with three-fifths of the total area, including 63 municipal units in 7 provinces. This division experienced an obvious increase in wind erosion services (13.2%), large terrain slopes, and low vegetation coverage, with a ratio of actual evapotranspiration (ETa) to potential evapotranspiration (ETp) of 25.5%. The annual average wind speed was between 1.28 and 5.29 m/s. Division II was located in the north-eastern part of the study area, including 88 municipal units in 9 provinces, and had a small increase in wind erosion services (3.7%); in this region, the terrain is flat, the vegetation coverage is rich, ETa/ETp is 49.9%, and 1.47–4.58 m/s in wind speed. Table 1 lists the zonal average of environmental factors.

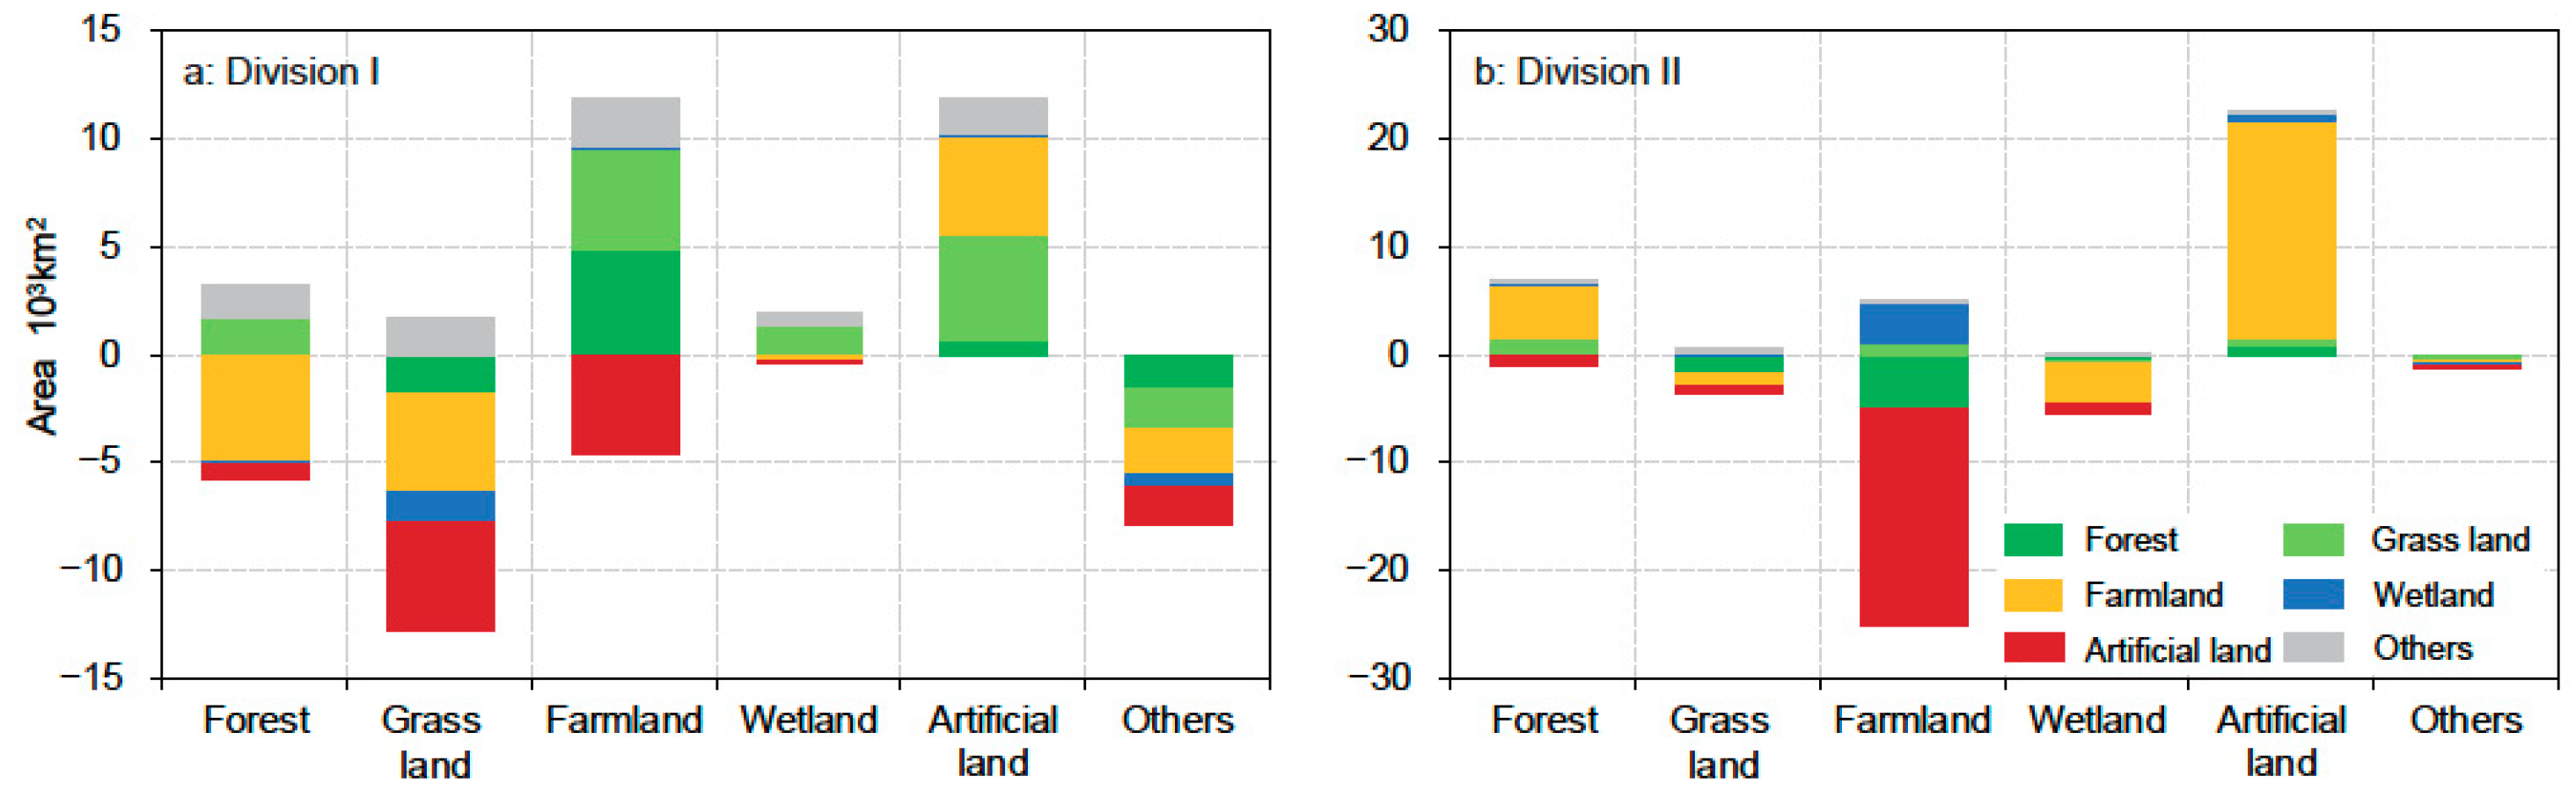
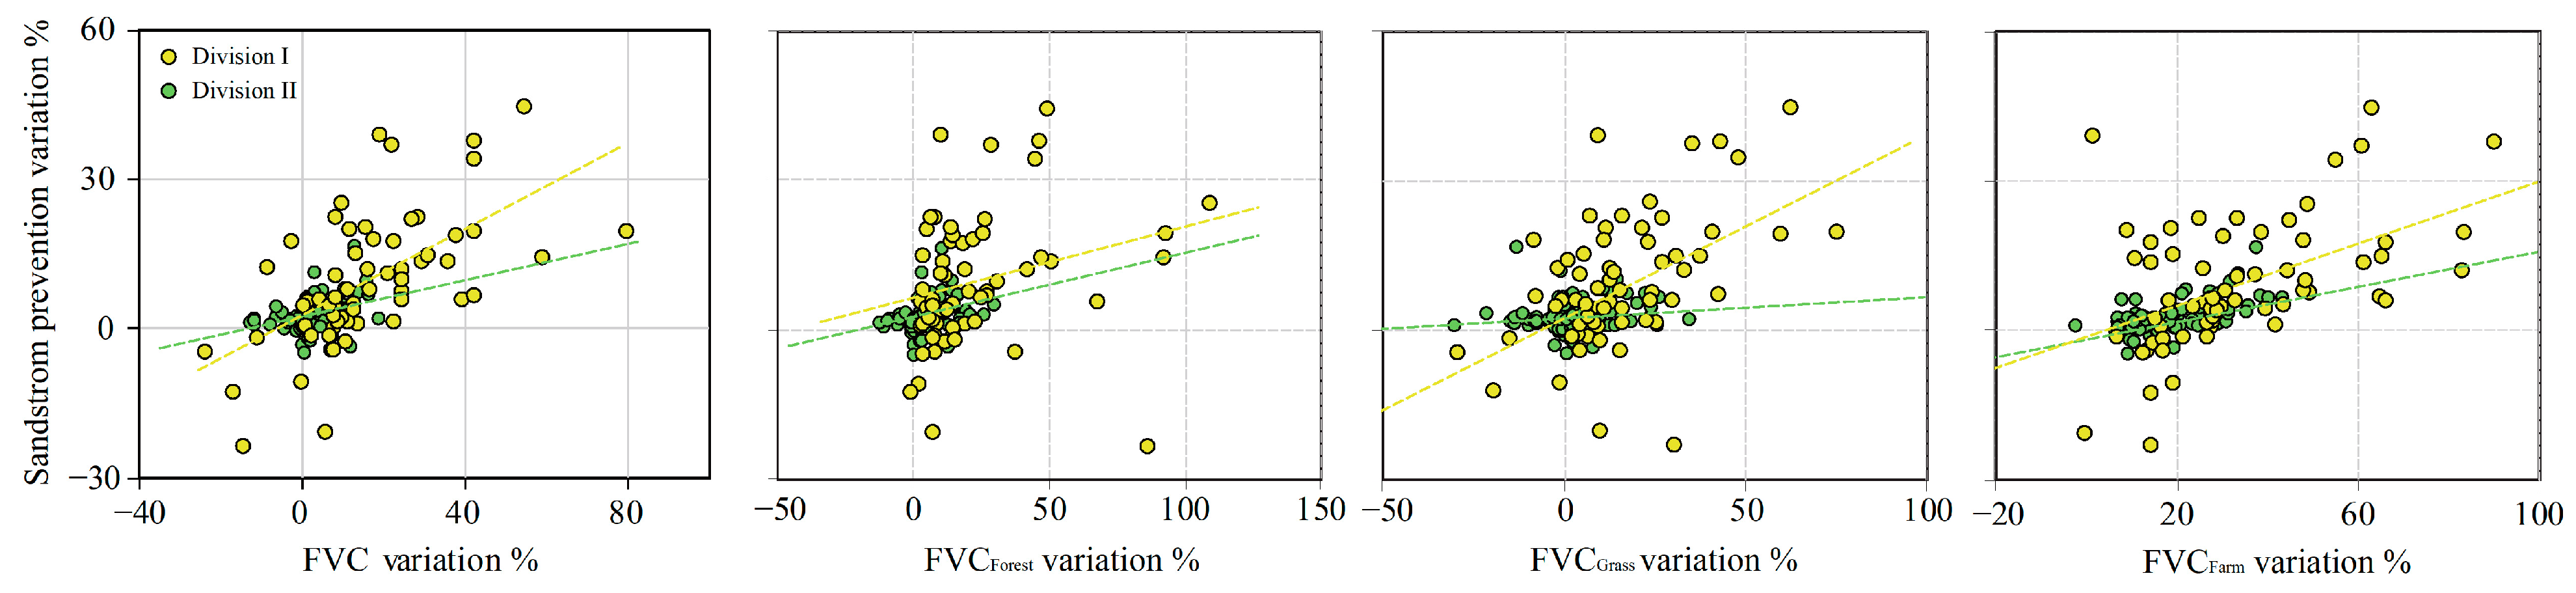
3.3. Land-Use Change and Vegetation Variation in Different Divisions

In general, artificial land and forest showed an increasing trend from 2000 to 2015, while the remaining land-use types declined (Figure 4). Artificial land increased by nearly 30%, with two-thirds of it distributed in division II and mainly converted from farmland. Forests and wetlands showed opposite trends in the two divisions, and both changed most to farmland and grassland. Grassland and others declined significantly in division I, and most changed to farmland and artificial land.
Due to the frequent changes in vegetation area, Figure 5 shows the change rate relationship between vegetation coverage and wind erosion services. Vegetation changes in the different divisions had a positive effect on WEPS improvement, with the trend in division I being sharper than that in division II. For the different types of vegetation in division I, the increase in grassland contributed the most to wind erosion prevention, followed by increases in farmland and forest; in contrast, forest and farmland were the main influencing factors in division II.

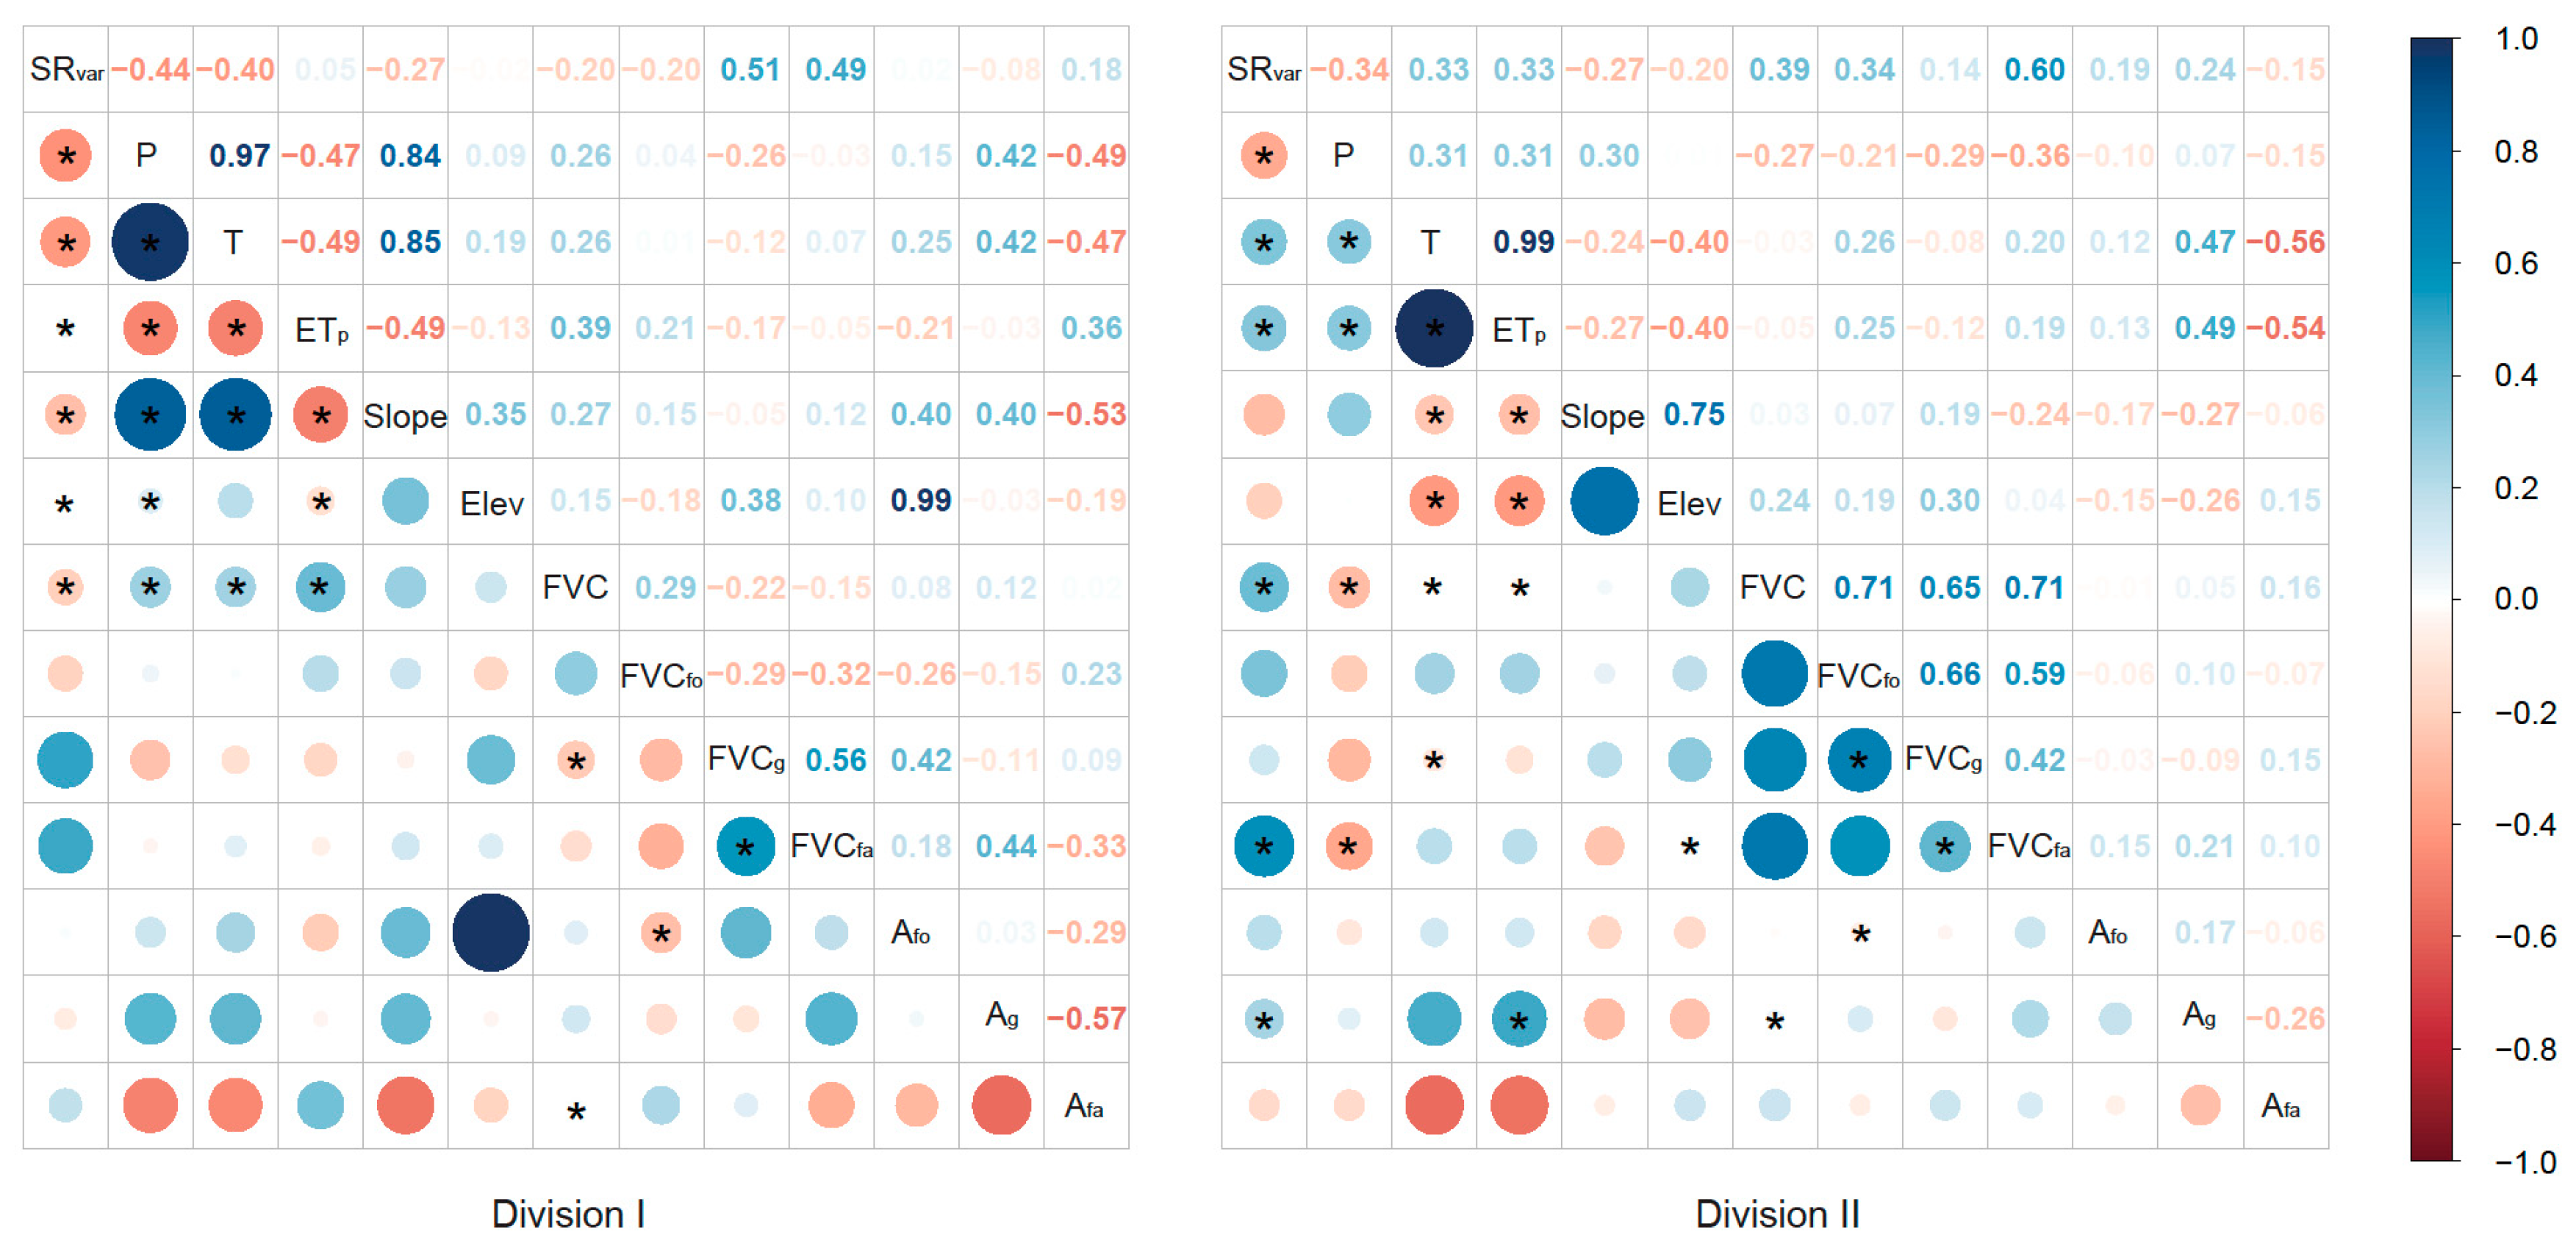
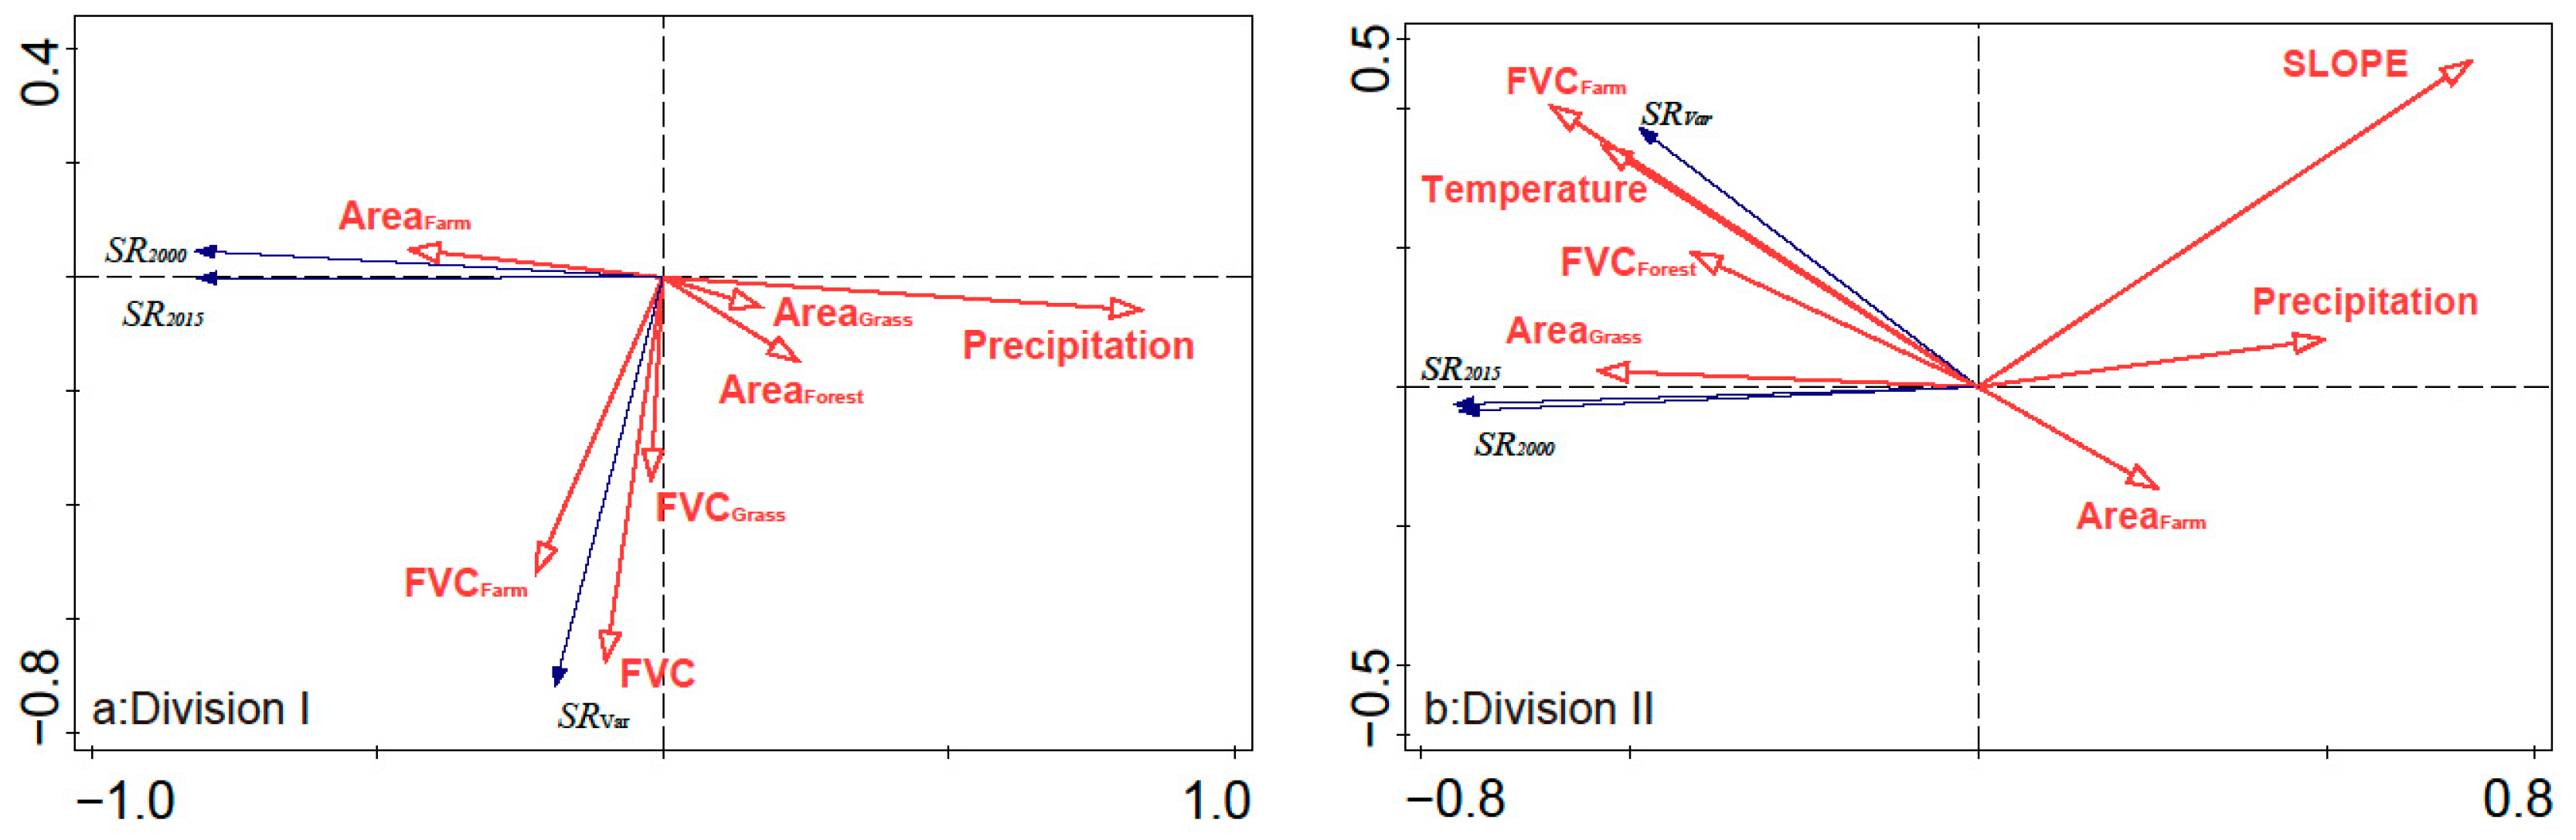
3.4. Correlation Analysis and Driving Force Identification

Figure 6 illustrates the correlations between the change in WEPSs and the environmental factors. The relationships in different divisions varied greatly. Meteorology and topography were both significantly correlated with wind erosion service variation in division I, whereas only topographic factors were obvious in division II. In addition, the quantity and quality of vegetation were both correlated with wind erosion services in division II, and only vegetation quantity was important in division I.
According to the RDA of the wind erosion service and the variation from 2000 to 2015 (Figure 7), the most relevant factors were the meteorology and topography factors, which contributed more than 60% to both regions (65.3% in division I, and 61.9% in division II). In division I, the quantity and quality of farmland was the second most important contributor (12.2%), followed by grassland improvement (11.1%) and forest expansion (7.8%). Similarly, the increase in farmland quantity and quality (31.6%) and grassland area (3.5%) were the secondary influencing factors on wind erosion services in division II.

4. Discussion

4.1. Human Land Management Led to the Improvement of WEPSs

Wind erosion prevention is the most important ecosystem service in northern China [27], and its capacity has been improving by the reclamation of land use, especially in arid and semi-arid areas in China [10,28]. The RWEQ has many applications in China [2,10,12,28], allowing us to prove the accuracy of the result from the changes in time and space of WEPSs. Taking Inner Mongolia as an example where wind erosion prevention is important, our results are consistent with previous research in spatial patterns and orders of sand prevention magnitude [44,45,46]. Compared with the change in wind erosion in China from 2000 to 2010 [47], the overall spatial pattern was almost identical. The region with increased WEPS was distributed in the Junggar Basin, the north-western margin of the Tarim Basin, Altay Mountains, Horqin grassland, and the Ordos Plateau, which were mostly grassland and farmland in arid/semi-arid regions. In contrast, the areas of decline were relatively small, located mostly in the eastern margin of the Tarim Basin, Turpan Basin, and Subei of Gansu Province in the Tianshan Mountains, where vegetation showed degradation or was located on the edge of an oasis. Unlike a previous study, we found that the north piedmont of Yinshan Mountain, which increased until 2010, declined by 2015; the increase was no longer significant in the southern part of the Northeast Plain, and the WEPSs on the North China Plain increased, which were both dominated by farmland. The WEPSs increase was largely attributed to vegetation expansion and greening, which were directly caused by human land-use management [28,47,48]. Except for the Three-North Shelter Forest Program implemented in the 1980s, the Natural Forest Protection Project and the Beijing–Tianjin Sandstorm Control Project, which focus on the conservation and restoration of natural ecosystems, have been carried out since 2000 [9]. Large-scale ecological restoration not only increases forest area, but also improves quality [49]; in addition, the widespread farmland infrastructure construction in recent decades has ensured an increase in crop biomass and coverage [50]. All of the above human management practices play an active role in improving WEPSs, as well as other ESs in northern China, and significantly promote positive succession to regional ecosystems [2,51,52].

4.2. Spatial Heterogeneity of Driving Factors to the Improvement of WEPSs

According to the results of the correlation analysis and RDA (Figure 6 and Figure 7), the primary environmental factors that drive the WEPS and its changes had spatial heterogeneity. Division I (Figure 7a) consisted mostly of arid and semi-arid regions, where the temporal variation in rainfall was small; therefore, rainfall had a great impact on the spatial pattern of WEPSs, but was limited to the changes over time. The other significant driving factors were all related to vegetation. Due to the increases in area and crop production, quantity and quality of farmland was the first important contributor among vegetation factors. However, the contribution to the change in WEPSs was mostly due to the improvement of farmland quality, which indicated that the expansion of the area did little to improve WEPSs in this region. Division II (Figure 7b) included the Northeast and North China Plains, and the uneven spatial distribution of rainfall, temperature and slope altered both the temporal and spatial patterns of the WEPSs. Similar to division I, the contribution of the quantity and quality of farmland were closely followed by the meteorological and topographic factors, and the increase in farmland coverage had a positive effect on the spatiotemporal change in WEPSs. Unlike in division I, grass area and replaced grassland quality significantly affected the changes of WEPSs; however, forest change had no significant effect in this region.
Generally, natural factors, especially meteorology, continue to be dominant drivers of the changes in ESs [53,54]. For the WEPSs in northern China, farmland (quantity and quality) was the most important human disturbance factor, which was consistent with the main direct driver of Chinese greening [50]. Since the 1980s, afforestation due to restoration projects in northern China has significantly reduced wind erosion by increasing and improving the amount and quality of vegetation [28,55,56]; compared with before, afforestation played an important role only in division I from 2000 to 2015. The diminishing importance of the forest was partly due to the limited suitable area for planting; moreover, fixed sand erosion tended to be saturated by the forest reaching maturity [57].

4.3. Regional Difference of Drivers to Human Land-Use Management

To repair the fragile ecosystem in northern China and enhance the ecosystem functions and services, several major restoration projects focusing on afforestation and vegetation restoration have been implemented since the 1980s [7,9]. The implementation of these projects has indeed brought about the improvement of the ecosystem and the enhancement of functions, but undifferentiated management and area-increased greening models make the regional ecosystem unable to maintain a positive circle, and the long-term benefits of ecological projects will decline. Therefore, to stimulate the long-term improvement of ecosystems, policies and measurements focusing on regional differences are bound to be embedded in large-scale land-use planning. Moreover, in the face of climate change, the importance of nature is bound to continue. For the arid northwest in Division I, warming faster than precipitation would make it the most threatened region for net primary productivity (NPP) in northern China [58,59]. How to project land management to offset the impacts of climate change is a challenge to be faced in the future.
In view of our results, although the total WEPSs had an increasing trend from 2000 to 2015, the vegetation coverage area declined. In the northwest (Division I), the increased farmland has offset the sand-fixation effect of forests and grassland in general, but it still cannot replace the effect of forest and grass ecosystems on wind erosion prevention in winter. Moreover, compared with the area expansion of afforestation after 2000, the improvement of vegetation quality was dominant. Considering the water constraint in the northwest, large-scale afforestation should no longer be suitable for the local area. A feasible solution is to focus on the conservation of existing grass and farmland quality and replace overmature forest. In division II, the large-scale change in land-use type leads to a non-obvious variation in total WEPSs. Although the expansion of artificial land encroaches on vegetation, resulting in a decrease in WEPSs, the improved quality of farmland and forest offsets the loss. Under the background of the rapid urbanization in this region, land-use management should ensure the existing vegetation area, at the same time as avoiding the occupation of artificial land. Moreover, it is necessary to balance the proportion of forest, grassland and farmland to maximize the benefits of WEPSs.

5. Conclusions

This study was based on the RWEQ model and mapped the spatial distribution and changes in wind erosion prevention in northern China from 2000 to 2015; additionally, it explored the differences in driving factors based on the relation between WEPSs and environmental factors, which provides evidence for zoning management. Our results indicated that the WEPS was enhanced by 1.87 × 10⁷ t during the study period in northern China, and could be classified into two divisions according to the relational pattern of the WEPSs and environmental factors. Although land use varied in different divisions, vegetation coverage had a positive effect on WEPS improvement. Despite meteorology and topography, the increase in the quantity and quality of farmland were the dominant factors improving WEPSs. The difference was that vegetation quality improvement was more important in the northwest, while vegetation area expansion was crucial in the northeast. Based on the results, we suggest that future restoration projects should focus on (1) the conservation of existing vegetation, (2) the replacement of overmature forest in northwest, and (3) properly planning artificial land to avoid encroachment on vegetation areas in the northeast.

Author Contributions

The contributions to the manuscript were as follows: Conceptualization, J.M., R.L. and H.Z.; methodology, J.M., R.L. and Y.Y.; investigation, data, J.M., R.L., Y.Y., Y.H. and T.H.; writing—original draft preparation, J.M. and R.L.; and writing—review and editing, all authors. All authors have read and agreed to the published version of the manuscript.

Funding

This work was supported by the National Natural Science Foundation of China (41871218 and 42171099).

Institutional Review Board Statement

Not applicable.

Informed Consent Statement

Not applicable.

Data Availability Statement

Data will be available up on request. Images employed for the study will be available online for readers.

Conflicts of Interest

The authors declare no conflict of interest.

References

  1. Li, Y.; Piao, S.; Li, L.Z.X.; Chen, A.; Wang, X.; Ciais, P.; Huang, L.; Lian, X.; Peng, S.; Zeng, Z.; et al. Divergent hydrological response to large-scale afforestation and vegetation greening in China. Sci. Adv. 2018, 4, eaar4182. [Google Scholar] [CrossRef] [Green Version]
  2. Li, R.; Zheng, H.; O’Connor, P.; Xu, H.; Li, Y.; Lu, F.; Robinson, B.E.; Ouyang, Z.; Hai, Y.; Daily, G.C. Time and space catch up with restoration programs that ignore ecosystem service trade-offs. Sci. Adv. 2021, 7, eabf8650. [Google Scholar] [CrossRef]
  3. NFGA, National Forestry and Grassland Administration. China Forest Resources Report; China Forestry Press: Beijing, China, 2019. [Google Scholar]
  4. White, T.M.; Kurz, W.A. Afforestation on private land in Canada from 1990 to 2002 estimated from historical records. For. Chron. 2005, 81, 491–497. [Google Scholar] [CrossRef] [Green Version]
  5. Mykleby, P.M.; Snyder, P.K.; Twine, T.E. Quantifying the trade-off between carbon sequestration and albedo in midlatitude and high-latitude North American forests. Geophys. Res. Lett. 2017, 44, 2493–2501. [Google Scholar] [CrossRef]
  6. Dutilly-Diane, C.; McCarthy, N.; Turkelboom, F.; Bruggeman, A.; Tiedemann, J.; Street, K.; Serra, G. Could Payments for Environmental Services Improve Rangeland Management in Central Asia, West Asia and North Africa? Capri Working Paper, 42p, 2007. Available online: https://ageconsearch.umn.edu/record/47222/ (accessed on 7 December 2021). [CrossRef] [Green Version]
  7. Hu, J.J.; Zheng, X.; Yan, Q.L. Assessment of Impacts of the Three-North Protective Forest Program on Ecological Environments by Remote Sensing Technology Launched after 30 Years (1978–2008); Science Press: Beijing, China, 2016. [Google Scholar]
  8. Gálos, B.; Hagemann, S.; Hänsler, A.; Kindermann, G.; Rechid, D.; Sieck, K.; Teichmann, C.; Jacob, D. Case study for the assessment of the biogeophysical effects of a potential afforestation in Europe. Carbon Balance Manag. 2013, 8, 3. [Google Scholar] [CrossRef] [PubMed] [Green Version]
  9. Gao, S.Y.; Zhang, C.L.; Zou, X.Y.; Wu, Y.Q.; Shi, S.; Li, H.D. Benefits of Beijing-Tianjin Sand Source Control Engineering; Sicence Press: Beijing, China, 2008. [Google Scholar]
  10. Chi, W.; Zhao, Y.; Kuang, W.; He, H. Impacts of anthropogenic land use/cover changes on soil wind erosion in China. Sci. Total Environ. 2019, 668, 204–215. [Google Scholar] [CrossRef] [PubMed]
  11. Zhao, Y.; Wu, J.; He, C.; Ding, G. Linking wind erosion to ecosystem services in drylands: A landscape ecological approach. Landsc. Ecol. 2017, 32, 2399–2417. [Google Scholar] [CrossRef]
  12. Xu, D.; Li, D. Variation of wind erosion and its response to ecological programs in northern China in the period 1981–2015. Land Use Policy 2020, 99, 104871. [Google Scholar] [CrossRef]
  13. Riksen, M.; Brouwer, F.; de Graaff, J. Soil conservation policy measures to control wind erosion in northwestern Europe. Catena 2003, 52, 309–326. [Google Scholar] [CrossRef]
  14. Celebi, M.; Sağlam, C.; Duran, A. The potential contribution of land consolidation to prevent wind erosion in Turkey. Fresenius Environ. Bull. 2015, 24, 429–437. [Google Scholar]
  15. Chendev, Y.G.; Sauer, T.J.; Ramirez, G.H.; Burras, C.L. History of East European Chernozem Soil Degradation; Protection and Restoration by Tree Windbreaks in the Russian Steppe. Sustainability 2015, 7, 705–724. [Google Scholar] [CrossRef] [Green Version]
  16. Xiao, Y.; Xie, G.; Zhen, L.; Lu, C.; Xu, J. Identifying the Areas Benefitting from the Prevention of Wind Erosion by the Key Ecological Function Area for the Protection of Desertification in Hunshandake, China. Sustainability 2017, 9, 1820. [Google Scholar] [CrossRef] [Green Version]
  17. Xu, J.; Xiao, Y.; Xie, G.; Zhen, L.; Wang, Y.; Jiang, Y. The Spatio-Temporal Disparities of Areas Benefitting from the Wind Erosion Prevention Service. Int. J. Environ. Res. Public Health 2018, 15, 1510. [Google Scholar] [CrossRef] [Green Version]
  18. Goldenberg, R.; Kalantari, Z.; Cvetkovic, V.; Mörtberg, U.; Deal, B.; Destouni, G. Distinction, quantification and mapping of potential and realized supply-demand of flow-dependent ecosystem services. Sci. Total Environ. 2017, 593–594, 599–609. [Google Scholar] [CrossRef] [PubMed]
  19. Tibke, G. Basic Principles of Wind Erosion Control. Wind. Technol. 1988, 22, 103–122. [Google Scholar] [CrossRef]
  20. Skidmore, E.L.; Hagen, L.J. Reducing Wind Erosion with Barriers. Trans. ASAE 1977, 20, 0911–0915. [Google Scholar] [CrossRef] [Green Version]
  21. Webb, N.P.; Van Zee, J.W.; Karl, J.W.; Herrick, J.E.; Courtright, E.M.; Billings, B.J.; Boyd, R.; Chappell, A.; Duniway, M.C.; Derner, J.D.; et al. Enhancing wind erosion monitoring and assessment for US rangelands. Rangelands 2017, 39, 85–96. [Google Scholar] [CrossRef]
  22. Chepil, W.S. Dynamics of wind erosion: II. Initiation of soil movement. Soil Sci. 1945, 60, 397. [Google Scholar] [CrossRef]
  23. Munson, S.M.; Belnap, J.; Okin, G.S. Responses of wind erosion to climate-induced vegetation changes on the Colorado Plateau. Proc. Natl. Acad. Sci.USA 2011, 108, 3854–3859. [Google Scholar] [CrossRef] [Green Version]
  24. Chappell, A.; Webb, N.; Leys, J.F.; Waters, C.; Orgill, S.; Eyres, M.J. Minimising soil organic carbon erosion by wind is critical for land degradation neutrality. Environ. Sci. Policy 2019, 93, 43–52. [Google Scholar] [CrossRef]
  25. Cao, S. Why large-scale afforestation efforts in China have failed to solve the desertification problem. Environ. Sci. Technol. 2008, 42, 1826–1831. [Google Scholar] [CrossRef] [Green Version]
  26. Duniway, M.C.; Pfennigwerth, A.A.; Fick, S.E.; Nauman, T.W.; Belnap, J.; Barger, N.N. Wind erosion and dust from US drylands: A review of causes, consequences, and solutions in a changing world. Ecosphere 2019, 10, 02650. [Google Scholar] [CrossRef] [Green Version]
  27. Shi, P.; Yan, P.; Yuan, Y.; Nearing, M.A. Wind erosion research in China: Past, present and future. Prog. Phys. Geogr. Earth Environ. 2004, 28, 366–386. [Google Scholar] [CrossRef]
  28. Ouyang, Z.; Zheng, H.; Xiao, Y.; Polasky, S.; Liu, J.; Xu, W.; Wang, Q.; Zhang, L.; Xiao, Y.; Rao, E.; et al. Improvements in ecosystem services from investments in natural capital. Science 2016, 352, 1455–1459. [Google Scholar] [CrossRef]
  29. Zhang, J.; Yu, X.; Jia, G.; Liu, Z. Determination of optimum vegetation type and layout for soil wind erosion control in desertified land in North China. Ecol. Eng. 2021, 171, 106383. [Google Scholar] [CrossRef]
  30. Köppen, W. Das geographische System der Klimate. In Handbuch der Klimatologie; Köppen, W., Geiger, R., Eds.; Gebrüder Borntraeger: Berlin, Germany, 1936; Volume I. [Google Scholar]
  31. Kottek, M.; Grieser, J.; Beck, C.; Rudolf, B.; Rubel, F. World Map of the Köppen-Geiger climate classification updated. Meteorol. Z. 2006, 15, 259–263. [Google Scholar] [CrossRef]
  32. Trewartha, G.T.; Horn, L.H. An Introduction to Climate, 5th ed.; McGraw Hill: New York, NY, USA, 1980. [Google Scholar]
  33. Li, X.; Lu, H.; Yu, L.; Yang, K. Comparison of the Spatial Characteristics of Four Remotely Sensed Leaf Area Index Products over China: Direct Validation and Relative Uncertainties. Remote Sens. 2018, 10, 148. [Google Scholar] [CrossRef] [Green Version]
  34. Guo, H.; Xu, M.; Hu, Q. Changes in near-surface wind speed in China: 1969-2005. Int. J. Clim. 2011, 31, 349–358. [Google Scholar] [CrossRef]
  35. Liu, M. Atlas of Physical Geography of China, 3rd ed.; SinoMaps Press: Beijing, China, 2010. [Google Scholar]
  36. Wang, J.; Zuo, W. Geographic Atlas of China, 4th ed.; SinoMaps Press: Beijing, China, 2010. [Google Scholar]
  37. Jarrah, M.; Mayel, S.; Tatarko, J.; Funk, R.; Kuka, K. A review of wind erosion models: Data requirements, processes, and validity. Catena 2020, 187, 104388. [Google Scholar] [CrossRef]
  38. Fryrear, D.W.; Bilbro, J.D.; Saleh, A.; Schomberg, H.; Stout, J.E.; Zobeck, T.M. RWEQ: Improved wind erosion technology. J. Soil Water Conserv. 2000, 55, 183–189. [Google Scholar]
  39. Guo, Z.; Zhang, K.; Zobeck, T.M. Validation the wind generator of revised Wind Erosion Equation (RWEQ) using measured wind data of China. In Proceedings of the World Automation Congress 2012, Puerto Vallarta, Mexico, 24–28 June 2012. [Google Scholar]
  40. Yang, G.; Sun, R.; Jing, Y.; Xiong, M.; Li, J.; Chen, L. Global assessment of wind erosion based on a spatially distributed RWEQ model. Prog. Phys. Geogr. Earth Environ. 2021. [Google Scholar] [CrossRef]
  41. Saket, S.; Pandya, S. An overview of partitioning algorithms in clustering techniques. Int. J. Adv. Res. Comput. Eng. Technol. 2016, 5, 1943–1946. [Google Scholar]
  42. Skidmore, E.L. Wind erosion control. Clim. Chang. 1986, 9, 209–218. [Google Scholar] [CrossRef]
  43. Skidmore, E.L. Wind erosion climatic erosivity. Clim. Chang. 1986, 9, 195–208. [Google Scholar] [CrossRef]
  44. Li-min, L.; Ting-ting, W.; Xiufen, L.; Zun-bo, X.; Jin-zhou, W.; Li-ning, S.; Agronomy College of Shenyang Agricultural University; Institute of Meteorological Sciences of Henan Province; Key Laboratory of Forest Ecology and Management, Institute of Applied Ecology, Chinese Academy of Sciences; Qingyuan Forest CERN, Chinese Academy of Sciences; et al. Spatiotemporal variations of wind prevention and sand fixation function in the sand-prevention belt in Inner Mongolia in recent 15 years. Chin. J. Ecol. 2021, 40, 3436–3447. [Google Scholar]
  45. Zhang, H.; Fan, J.; Cao, W.; Harris, W.; Li, Y.; Chi, W.; Wang, S. Response of wind erosion dynamics to climate change and human activity in Inner Mongolia, China during 1990 to 2015. Sci. Total Environ. 2018, 639, 1038–1050. [Google Scholar] [CrossRef]
  46. Zhu, C.C.; Gong, J.R.; Yang, B.; Zhang, Z.H.; Wang, B.; Shi, J.Y.; Yue, K.X.; Zhang, W.Y. Changes of windbreak and sand fixation services and the driving factors in the desert steppe, Inner Mongolia. Acta Ecol. Sin. 2021, 41, 4606–4617. [Google Scholar]
  47. Jiang, L. Temporal and Saptial Patterns of Sand Retention Service in China. Doctoral Dissertation, Chinese Academy of Sciences, Beijing, China, 2015. [Google Scholar]
  48. Chen, C.; Park, T.; Wang, X.; Piao, S.; Xu, B.; Chaturvedi, R.K.; Fuchs, R.; Brovkin, V.; Ciais, P.; Fensholt, R.; et al. China and India lead in greening of the world through land-use management. Nat. Sustain. 2019, 2, 122–129. [Google Scholar] [CrossRef]
  49. Zhang, G.; Dong, J.; Xiao, X.; Hu, Z.; Sheldon, S. Effectiveness of ecological restoration projects in Horqin Sandy Land, China based on SPOT-VGT NDVI data. Ecol. Eng. 2012, 38, 20–29. [Google Scholar] [CrossRef]
  50. Lichtenberg, E.; Ding, C. Assessing farmland protection policy in China. Land Use Policy 2008, 25, 59–68. [Google Scholar] [CrossRef]
  51. Xu, D.; Ding, X. Assessing the impact of desertification dynamics on regional ecosystem service value in North China from 1981 to 2010. Ecosyst. Serv. 2018, 30, 172–180. [Google Scholar] [CrossRef]
  52. Song, W.; Deng, X. Land-use/land-cover change and ecosystem service provision in China. Sci. Total Environ. 2017, 576, 705–719. [Google Scholar] [CrossRef] [PubMed]
  53. Schroeter, D.; Cramer, W.; Leemans, R.; Prentice, I.C.; Araújo, M.B.; Arnell, N.W.; Bondeau, A.; Bugmann, H.; Carter, T.R.; Gracia, C.A.; et al. Ecosystem Service Supply and Vulnerability to Global Change in Europe. Science 2005, 310, 1333–1337. [Google Scholar] [CrossRef] [PubMed] [Green Version]
  54. Runting, R.K.; Bryan, B.; Dee, L.E.; Maseyk, F.J.F.; Mandle, L.; Hamel, P.; Wilson, K.A.; Yetka, K.; Possingham, H.; Rhodes, J.R. Incorporating climate change into ecosystem service assessments and decisions: A review. Glob. Chang. Biol. 2017, 23, 28–41. [Google Scholar] [CrossRef] [PubMed] [Green Version]
  55. Wang, X.; Zhao, X.; Zhang, Z.; Yi, L.; Zuo, L.; Wen, Q.; Liu, F.; Xu, J.; Hu, S.; Liu, B. Assessment of soil erosion change and its relationships with land use/cover change in China from the end of the 1980s to 2010. Catena 2016, 137, 256–268. [Google Scholar] [CrossRef]
  56. Jiang, C.; Zhang, H.; Zhang, Z.; Wang, D. Model-based assessment soil loss by wind and water erosion in China’s Loess Plateau: Dynamic change, conservation effectiveness, and strategies for sustainable restoration. Glob. Planet. Chang. 2019, 172, 396–413. [Google Scholar] [CrossRef]
  57. Ryan, M.G.; Binkley, D.; Fownes, J.H. Age-Related Decline in Forest Productivity: Pattern and Process. Adv. Ecol. Res. 1997, 27, 213–262. [Google Scholar] [CrossRef]
  58. Wu, S.; Yin, Y.; Zhao, D.; Huang, M.; Shao, X.; Dai, E. Impact of future climate change on terrestrial ecosystems in China. Int. J. Clim. 2010, 30, 866–873. [Google Scholar] [CrossRef]
  59. Xuejie, G.; Zongci, Z.; Yihui, D.; Ronghui, H.; Giorgi, F. Climate change due to greenhouse effects in China as simulated by a regional climate model. Adv. Atmos. Sci. 2001, 18, 1224–1230. [Google Scholar] [CrossRef]
Figure 1. Land use diagram of the study area (GCS: WGS84). The subgraphs illustrate the wind rose (direction frequency, %) in typical western (Xinjiang–Turpan), middle (Shaanxi–Yulin) and eastern (Heilongjiang–Keshan) stations, respectively.
Land 11 00111 g001
Figure 2. Changes in wind erosion prevention services from 2000 to 2015 in northern China (GCS: WGS84). Red shows areas where services have decreased, and green shows areas where services have increased. The subgraph illustrates the land use in the areas with reductions and increases.
Land 11 00111 g002
Figure 3. Classification of the relationship between WEPSs and environmental factors (GCS: WGS84).
Land 11 00111 g003
Figure 4. Land-use changes from 2000 to 2015 in Division I (a) and Division II (b).
Land 11 00111 g004
Figure 5. The correlation between the variation in wind erosion prevention services (WEPSs) and variation in various FVCs at the municipal scale. FVC: Fractional vegetation coverage; FVCForest: Fractional vegetation coverage of forest; FVCGrass: Fractional vegetation coverage of grassland; FVCFarm: Fractional vegetation coverage of farmland.
Land 11 00111 g005
Figure 6. Correlation between the WEPSs and environmental factors in two divisions. SRvar: Variation in WEPSs from 2000 to 2015; P: Precipitation; T: Temperature; ETp: Potential evapotranspiration; Slope: Slope; Elev: Elevation; FVC: Fractional vegetation coverage variation; FVCfo: FVC variation in forest; FVCg: FVC variation in grassland; FVCfa: FVC variation in farmland; Afo: Area variation in forest; Ag: Area variation in grassland; Afa: Area variation in farmland. * represents p < 0.05.
Land 11 00111 g006
Figure 7. RDA of WEPSs and significant environmental factors in Divisions I (a) and Division II (b) (explained rate: 63.1% in division I; 58.1% in division II). SRvar: Variation in WEPSs from 2000 to 2015; SR2000,2015: WEPS in 2000 or 2015; FVC: Fractional vegetation coverage.
Land 11 00111 g007
Table 1. Characteristics of environmental factors in different divisions.
CategoryItemDivision IDivision II
MeteorologyPrecipitation (mm)289.48591.11
Temperature (°C)6.285.93
Potential evapotranspiration (mm)932.39936.66
TopographyElevation (m)1691.50357.25
Slope (°)6.984.55
VegetationFractional vegetation coverage (FVC)0.280.77
FVC of forest0.690.94
FVC of grassland0.390.70
FVC of farmland0.580.73
Land useProportion of forest (%)11.5834.70
Proportion of grassland (%)34.968.54
Proportion of farmland (%)10.1041.15
Publisher’s Note: MDPI stays neutral with regard to jurisdictional claims in published maps and institutional affiliations.

