
Spatial Differentiation of the Socio-Economic Development of Poland–“Invisible” Historical Heritage


Faculty of Human Geography and Planning, Department of Regional and Local Studies, Adam Mickiewicz University, 61-680 Poznań, Poland
*
Author to whom correspondence should be addressed.
Land 2021, 10(11), 1247; https://doi.org/10.3390/land10111247
Submission received: 25 October 2021
/
Revised: 11 November 2021
/
Accepted: 12 November 2021
/
Published: 14 November 2021
(This article belongs to the Section Urban Contexts and Urban-Rural Interactions)
Abstract
:The analysis aims to identify spatial variations of socio-economic development in Poland at the local level and to determine their correlation with conditions resulting from the historical political divisions of today’s areas of the country. The research procedure helps to verify the hypothesis that spatial differentiation of socio-economic development in Poland is permanent and does not show significant changes during periods of economic growth and crisis. We can emphasize at the same time the persisting differences between cities and their functional areas on the one hand and rural areas on the other. The study applied an innovative procedure of determining the synthetic index. The procedure of classifying local units presented in the text was based on the original random forest method. The outcomes confirm that contemporary spatial diversification at the level of socio-economic development in Poland is still strongly conditioned by history, especially by the socio-economic consequences of the partition of Poland between the three superpowers (Russia, Prussia and Austria). This is evident in the synthetic presentation of the level of socio-economic development. However, in the case of certain socio-economic phenomena, the values of indicators describing them no longer directly relate in their diversity to historical borders, particularly the former partition borders.
1. Introduction
Geographical differences of social and economic development at regional and local levels are not decreasing, are not decreasing, but rather intensifying. This happens mainly amidst growing globalization and increasingly frequent and more severe economic crises [1]. Developmental convergence therefore remains the overarching objective of public intervention under the cohesion policy. Unfortunately, while its effects at the national level can be assessed as satisfactory, at regional and local levels, it is often difficult to see them in the same way [2]. These regularities are particularly noticeable in Poland. First, this is because Poland remains the main beneficiary of the European cohesion policy and is thus a unique laboratory for verifying the effectiveness of public development intervention instruments. In the perspective of the last three decades, the spectacular convergence of economic growth at the national level (doubling GDP per capita) is an unquestionable success of Polish transformational changes and positive effects of integration with the European Union. However, persisting and even progressing inter- and intra-regional divergence constitutes a growing threat that is present especially in cities and their functional and rural areas [3]. Importantly, the observed changes resulting from contemporary socio-economic conditions show, in the case of Poland, a deeply rooted dependence on historical factors. The historical background is one of the main reasons for the differences among individual territories regarding the current development situation. Former political divisions and their consequences connected with functioning in different political, economic and social conditions, in line with the principle of path dependence, become deep-seated determinants of developmental processes, stressing the fact that “history matters” [4,5]. This study is in line with the still current research trend in the literature on the subject regarding the relict boundaries and their significance in the spatial differentiation of socio-economic phenomena [6,7,8,9].
The spatially diverse process of socio-economic development involves a broad spectrum of variations. It should be noted that the literature on the subject consistently differentiates between the concepts of economic growth and economic development. Development, in the simplest terms, is understood as a process of positive changes comprising both quantitative growth and qualitative progress, where the quantitative aspect encompasses the concept of economic growth and the qualitative aspect regards transformation of socio-economic structures, which acquire new characteristics as a result. The analysis of changes in socio-economic development can be holistic or partial. In the holistic approach, developmental changes are described by the common, if widely criticized, e.g., [10,11] GDP per capita indicator or by synthetic indicators. In the case of GDP, socio-economic development is in fact limited to economic growth and focuses on quantitative changes. It should also be noted that the availability of data on GDP levels is limited in time (two-year lag) and in space (unavailable at the local level). On the other hand, the use of a synthetic indicator leads to generalizations and loss of part of the information, which may prevent a correct identification of the causes of developmental differences occurring in space [12,13,14]. In a partial approach, developmental changes are described via indicators that characterize mainly their economic dimensions, which are gradually and asymmetrically extrapolated onto other aspects [15]. They include, for example: demographic determinants [16], environmental determinants [17], settlement determinants [18], and land use determinants [19]. Choice of indicators can always be criticized for the lack of comprehensiveness of the findings. Therefore, it becomes reasonable to study the changes in socio-economic development and its spatial differentiation both in holistic and partial terms, especially when the results demonstrate noticeable differences, which is precisely the case of Poland.
The analysis aims to identify spatial variations of socio-economic development in Poland at the local level and to determine their correlation with conditions resulting from the historical political divisions of today’s areas of the country and the lingering differentiation of growth in terms of cities and their functional versus rural areas. The main objective is pursued via verifications of the following three hypotheses:
- Spatial variations of socio-economic development in Poland continue to be significantly determined by the “historical legacy” that harks back to the time of Poland’s partitions by Prussia, Russia and Austria in the late 18th c.
- The impact of historical conditions on spatial variations of socio-economic development in Poland is more evident from a holistic rather than a partial approach to socio-economic development.
- Determinants of spatial differentiation of socio-economic development in Poland are permanent and show no significant variations at the time of economic growth and crisis, perpetuating the lingering differences between cities and their functional versus rural areas.
The research procedure consists of three stages. The first stage includes a spatial and historical profile of the structure of social and economic development disparities in Poland and presents the current orientation of the cohesion policy, drawing attention to its limited effectiveness. The second stage includes a presentation of the results that identifies changes in the level of socio-economic development in Poland, at the local level, and in holistic and partial terms. In the third stage of the research procedure, the outcomes help verify the preliminary hypotheses; additionally, a discussion is carried out using the findings of selected literature on the subject, which leads to the formulation of final conclusions. The timeline of the analysis includes a series of data from 2004–2018. The analysis is conducted at the level of LAU-2 units (communes, pol. gminas), enabling a detailed identification of intra-regional variations at the local level. This study is carried out as part of the FORSED research project (www.forsed.amu.edu.pl accessed on 11 November 2021) funded by the National Science Center (No. 2015/19/B/HS5/00012): New challenges of regional policy in shaping socio-economic development factors of less developed regions.
2. Development Polarization–Historically Determined Spatial and Functional Structures and the Impact of the European Development Policy
In general, the polarized configuration of Poland’s territory has been shaped by the geopolitical situation of the Polish lands since as early as the Middle Ages. The Vistula River was the border between the western and eastern parts of the country. According to Jałowiecki [20], there were many more towns in western Poland than in eastern Poland in the 13th century. The same was true for the location of monasteries of Christian orders, which at that time were the main promoters of science and innovation. Therefore, even at this time, the proximity of Western Europe was unquestionably an element that accounted for the differences between eastern and western Poland. It was in the Western Europe that, among others, patterns of city foundation originated in the Middle Ages, and symptoms of a capitalist system emerged in the 16th century. As Hryniewicz [21] notes, capitalist economic models were not, after all, a spontaneous Polish creation, but were cultural imports from Western Europe; hence, the western lands, due to their favorable location, have always shown a higher level of development than those located in the eastern part of the country. In the 15th through 17th century, a model of a manor farm was formed in the western part of Poland (Wielkopolska, Western Pomerania, Silesia) that was different than in the rest of the country. Its yield was mainly geared to the internal market and served the developing towns. This testifies to a quite clear subordination of economic processes to the class of craftsmen and merchants, which is equivalent to economic relations typical of capitalism [22] (p. 43). Apart from the emerging capitalism (as a result of the development of industry), the regional differentiation of the implementation of technical progress in agriculture had a significant impact on the subsequent efficiency of the agricultural economy. Wielkopolska and Silesia, located on the routes connecting Western Europe with Warsaw and Lithuania, took outstanding advantage of their location, quickly adapting the incoming innovations and, above all, developing industry (establishing the first manufactories) and the technique of land cultivation (higher efficiency and commodity). However, the geopolitical situation in the second half of the 18th century in Poland (then the Polish-Lithuanian Commonwealth) consolidated the slowly developing differences of the period for many decades to come.
In late 18th century, Poland was one of the largest countries in Europe, but was economically and politically weak and backward. In late 1795, a treaty between the emperors of Russia, Prussia and Austria finally divided the country between the three partitioning powers. In 1815, after the Congress of Vienna, the Kingdom of Poland, dependent on Russia, was established and the final borders between the partitioning powers were set (Figure 1). In November 1918, after the end of the First World War and the collapse of the three monarchies, Poland gained independence. After 123 years of operating under different political, cultural and, above all, socio-economic systems, the country began the process of fusing the partitioned lands into a single state. The Second Polish Republic survived only until September 1939, when, after the invasion of Nazi Germany and Soviet Russia, another war began. In May 1945, with the capitulation of the Third German Reich, the period of Poland’s rebirth began. Unfortunately, the decisions made by the Big Three at Yalta and Potsdam were not favorable for Poland (nor were they for the other countries of Central and Eastern Europe). Poland lost a considerable part of its territories in the east to the USSR (losing, e.g., Vilnius, Lvov and Brest) and gained much smaller areas but with more favorable development conditions in the west (Silesia, Western Pomerania, the Free City of Danzig and the so-called East Prussia around Olsztyn). In addition, Poland was included in the Soviet sphere of influence and, inevitably, a socialist order was established in socio-economic, political and cultural terms.
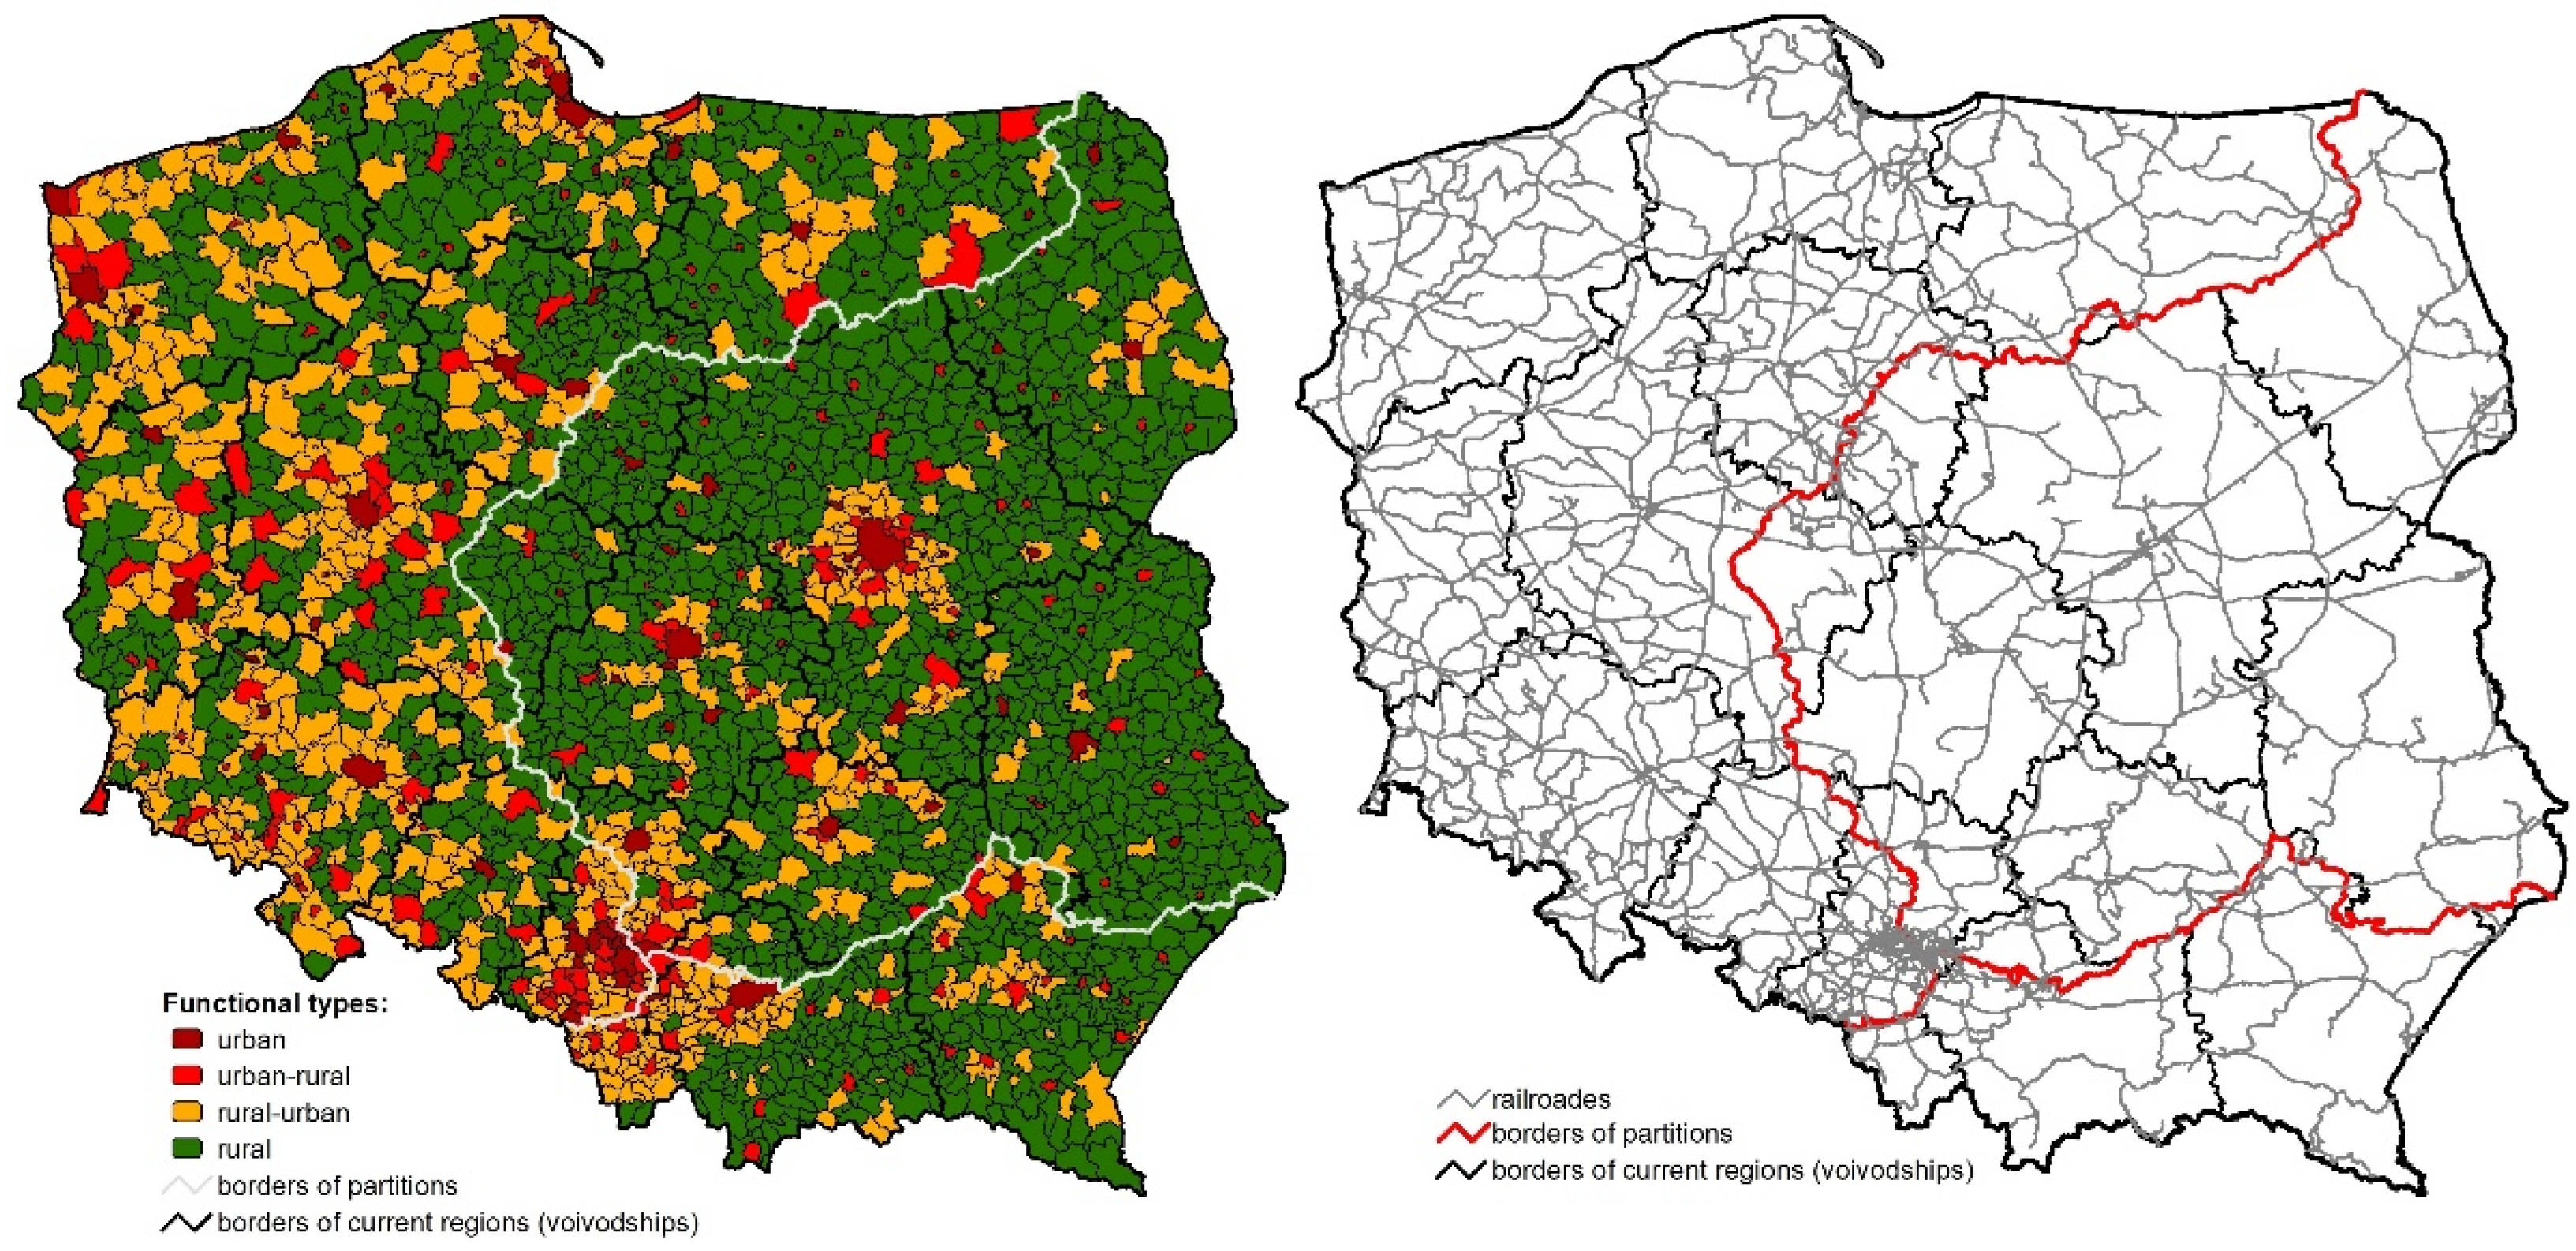
If we add the political and socio-economic conditions to the brief historical outline, we will notice certain regularities. The lands under Prussian and German rule (in comparison to other lands of the partitioning states) had a relatively good agriculture, were strongly industrialized and were very well connected via the public transport system. In the Prussian partition of 1910, 35% of the population lived in towns, and the density of railway lines in 1914 was 11.2 km/100 km2 [23,24]. At the same time in the Austrian partition, only 20% of the people lived in cities and the density of railway lines was 5.6 km/100 km2. In the Russian partition, the figures were 22% and only 3.6 km/100 km2, respectively. The above situation was connected, among other things, with the policy of the partitioning states. For example, almost all towns in the Prussian partition had a railway line, which facilitated the transport of manufactured (agricultural and industrial) goods, and the strong agricultural culture was, among other things, a response of the Polish population to the Germanisation policy (economic competition with Prussian settlers). In addition, the inhabitants of Wielkopolska, Silesia and Pomerania adopted a German bourgeois and capitalist mentality from the Prussians through the process of acculturation. The situation was slightly different in Galicia and Lodomeria, i.e., in the Austrian partition. These lands enjoyed greater autonomy and, although they were relatively well connected, they had less developed agriculture and were economically backward due to Austro-Hungarian policy and less favorable physical and geographic conditions. In turn, the Russian authorities held the Polish lands in complete disregard. A very limited transport network (especially railways) bypassed many urban centers. In a few centers, mainly textile industry and small agricultural processing developed. After World War II, almost all Germans were expelled from the former German territories and replaced by people displaced from the eastern territories lost by Poland. Former farms and estates were turned into so-called State Agricultural Farms (PGR), which were socialist entities modelled on the Soviet kolkhozes. This had a significant impact on the contemporary pattern of socio-economic differentiation in Poland, as reflected, for example, in the layout and density of the railway network and functional types of local units in the 21st century (Figure 2). For example, in the former Prussian partition, urban communes (local units) account for 4.5% and urban-rural ones for 12.5% (a total of 17%), while the density of railway lines is around 11 km/100 km2. On the other hand, in the former Austria-annexed territories, it is 1%, 9% and 8 km/100 km2, respectively, and in the former Russian partition, it is 3%, 10% and 7 km/100 km2. Furthermore, the percentage of rural communes is 47% in the former Prussian partition, 58% in the Austrian partition and 74% in the Russian partition.
The process of political and economic transformation in Poland began in the early 1990s. The country departed from the socialist command economy to adopt the capitalist, free market model. The process of modernization, post-modernization and globalization began, and by the second half of the 1990s, integration processes also started to have an impact [27]. The transformation in Poland, although it followed a relatively moderate (bloodless) course politically, resulted in huge economic and consequently social changes. As a result of the implementation of the so-called Balcerowicz Plan (modelled on Jeffrey Sachs’ ideas) by the Tadeusz Mazowiecki government, the Polish economy experienced so-called shock therapy. Its aim was to reduce inflation and the budget deficit and to eliminate market shortages. The plan resulted in the privatization of some state assets, which allowed the government to attract foreign capital. However, a much more serious effect was the impoverishment of a significant part of society, mainly as a result of the increase in unemployment resulting from the liquidation of loss-making, technologically backward and uncompetitive state enterprises. It seems that cities, particularly those with a diversified economic base, experienced the transformation period more smoothly (also due to historical conditions) than rural areas, especially those on the periphery that were technically backward and had low social capital.
The historical conditions of Poland’s socio-economic diversification outlined above left a strong mark on the contemporary image of these disparities. The regularities of the socio-economic development process observed in the Polish territory confirm the tendency of the continued and even intensifying polarization of development between economically strong and weak areas, the distribution of which refers to the pattern of cities and their functional and rural areas. The former benefit of spatial heterogeneity is strengthened by agglomeration effects based on relatively better resources of broadly defined territorial capital, while the latter is practically the opposite [28]. Economically robust areas tap into the impact of agglomeration economies in their broad sense as defined by [29,30,31,32,33] and reinforce them through mechanisms described by [34] as “sharing, matching and learning”. These effects are seen as natural, positive and productivity-enhancing processes through which these areas systematically increase their potential by distancing themselves from backward and problematic areas [35]. The very existence of these regularities, in accordance with the assumptions of the concept of polarized development, should be considered a natural and constant feature of the process of socio-economic transition [36]. However, the current pace and scale of polarization of socio-economic development should be considered exceptional and highly varied [37,38]. This leads to the conclusion that a present-day full identification of the causes and consequences of the polarization of regional development requires two assumptions. First, the specificity of a given area, including the historical determinants that in many cases determine the sustainability of development processes [4,5], should be taken into account each time. Second, theoretical approaches that go beyond mainstream economics and heterodox economics should be sought, as exemplified by the concept of “place-sensitive distributed development policy” that draws attention to the need to adapt intervention instruments to the sensitivity of their impact and not only to the specificity of particular places, which is part of the trend of place-oriented approaches [39]. In addition, the scale of the challenges posed by persistent or progressive regional and local divergence is reinforced by the effects of globalization, especially following the so-called economic crisis of 2008 [40]. The crisis highlighted disparities between territories in terms of their resilience to external development shocks [41]. This is particularly evident in Europe, whose regional variation in resilience to the crisis has laid bare the inadequacies of the simple compensatory paradigm of community cohesion policy. Despite the significant financial efforts concentrated in the Mediterranean regions, it has not been possible to build resilience in those territories that have experienced a sustained recession, resulting in the marginalization and the pauperization of their populations. This results in an increase in the scale of developmental divergence within the national systems of the southern European member states and forces a search for new systemic cohesion policy solutions within the European Union after 2020 [42].
The low effectiveness of the cohesion policy to date and the occurrence of obstacles in achieving socially acceptable differentiation of living standards and conditions is confirmed by the Polish experience. Poland, despite consistently being a leader in the absorption of European public funds assigned for implementing the cohesion policy, demonstrates lingering and even increasing development disparities both across and within regions. Attempts to overcome those tendencies by means of special operational programs dedicated to the regions of Eastern Poland, which are among the weakest not only in Poland but in the entire European Union, or by means of instruments of territorialization of measures applied by the regions, unfortunately more in concept than in reality, do not bring the intended results. Still the leaders at the regional level, i.e., Mazowsze (whose situation is shaped by the Warsaw agglomeration), Wielkopolskie and Dolnośląskie, increase their developmental distance in relation to the eastern regions such as Lubelskie, Świętokrzyskie or Podlaskie, which have a much lower developmental pace. Importantly, however, the internal situation of these regions is also marked by a high degree of differentiation, with the main cities and their functional areas remaining the engines of development [3,43] and the areas lagging in development, strongly marking their presence in the inner periphery, mostly overlapping with rural areas [44].
3. Materials and Methods
An analysis of spatial diversification on the level of socio-economic development at the local level in Poland, due to the lack of such indicators as GDP or HDI, was carried out on the basis of an innovative procedure of determining a synthetic index. The classification procedure for communes is a three-stage algorithm.
In the first stage (1), partial indicators describing selected aspects of the socio-economic development were selected and their number reduced. For this purpose, statistical data published in the Local Data Bank of Statistics Poland (GUS) for the years 2004–2018 were used. Such a selection of the time range of the analysis helped to assess the level of local development in Poland at the moment of the EU enlargement. The main criterion for the selection of indicators was the availability of data concerning the entire period under study for all units. A complete data range for 2478 municipalities in Poland was available for 38 indicators. Using the Pearson correlation coefficient (taking into account the substantive interpretation of the linear relationship between the indicators, rather than the pure statistical relationship), the number of indicators was reduced to 22 (Table 1).
At the second stage (2), a synthetic indicator of the level of socio-economic development was determined on the basis of the values of 22 indicators for each commune. The procedure of determining the synthetic index was preceded by testing the normality of the distribution of the variables. In most cases, the indicators were not normally distributed (which was confirmed by the Lilliefors and Shapiro-Wilk normality of distribution tests). Thus, in order to normalize the indicators, we used the method of zeroed unitization (min-max normalization, rescaling). Stimulant variables were normalized using formula (1), while destimulant variables were normalized using formula (2).
Such normalized indicators have values in the range [0, 1]. Then, a synthetic indicator of the level of socio-economic development was constructed on their basis. For this purpose, the Bray-Curtis dissimilarity measure [45] was used, which was transformed into a measure of similarity to the benchmark, i.e., a hypothetical unit taking the maximum value (of 1) for all indicators (3).
where: zij = normalized value of indicator j for commune i (i = 1, 2, …, 2478), k = benchmark commune, j = 1, 2, …, and m = indicator number (m = 22).
Synthetic indices took values in the range [0, 1], and the higher their value, the higher the level of socio-economic development.
In the third stage (3), a classification of the studied spatial units on the basis of the value of the synthetic index of the level of socio-economic development was carried out using data mining and machine-learning methods. The first step of this stage used an iterative non-hierarchical clustering method, i.e., a cluster analysis according to the algorithm of k-means clustering, and in the second step, a random forest method was used to verify the classification obtained.
Cluster analysis by the k-means algorithm belongs to the group of methods referred to as model-free classifications or unsupervised classifications. This method does not require a normal variables distribution, and due to the fact that each time was conducted on the basis of values of one synthetic indicator, it meets the condition of absence of collinearity. In simple terms, we can assume that the aim of this method is to create k non-empty, disjoint and relatively homogeneous classes (so-called clusters) in such a way that some objects are moved between clusters in each iteration in order to maximize inter-group variance and minimize intra-group variance [46,47]. The study assumed that k = 3 to isolate an odd number of classes (e.g., high, average and low level of development) and to ensure the appropriate size of individual classes (e.g., for k = 5, one of the classes consisted of only a few communes). Since the classification was carried out on the basis of the value of the synthetic index, it was possible to arrange the surveyed units linearly and to describe separated clusters as classes of high, average and low levels of development. In order to improve the quality of the classifications, the random forest method, which is an example of benchmark classification or supervised learning [48], was used as verification. In the most general terms, the purpose of this type of methods based on statistics and the Bayesian theorem is to find a classification rule; in other words, to build a formal model known as a classifier on the basis of observations from the learning/training set (the set containing classified observations, as in those for which the value of the dependent variable, i.e., the class, is known), and then to test it on the remaining observations with the constructed classifier and to assign them to the appropriate classes indicated by the “learned” classifier (the stage of verifying the accuracy and the quality of the classifier based on the test set of data). The decision to assign observations to a class is based on the distribution of variables in the classes and the values of a priori probabilities. Thus, it can be assumed that the explanatory variable in these procedures is the class of the level of socio-economic development (nominal variable), and the explanatory variables are 22 sub-indices (quotient variables) (Table 1). For a detailed description of the random forest method, see [49,50,51].
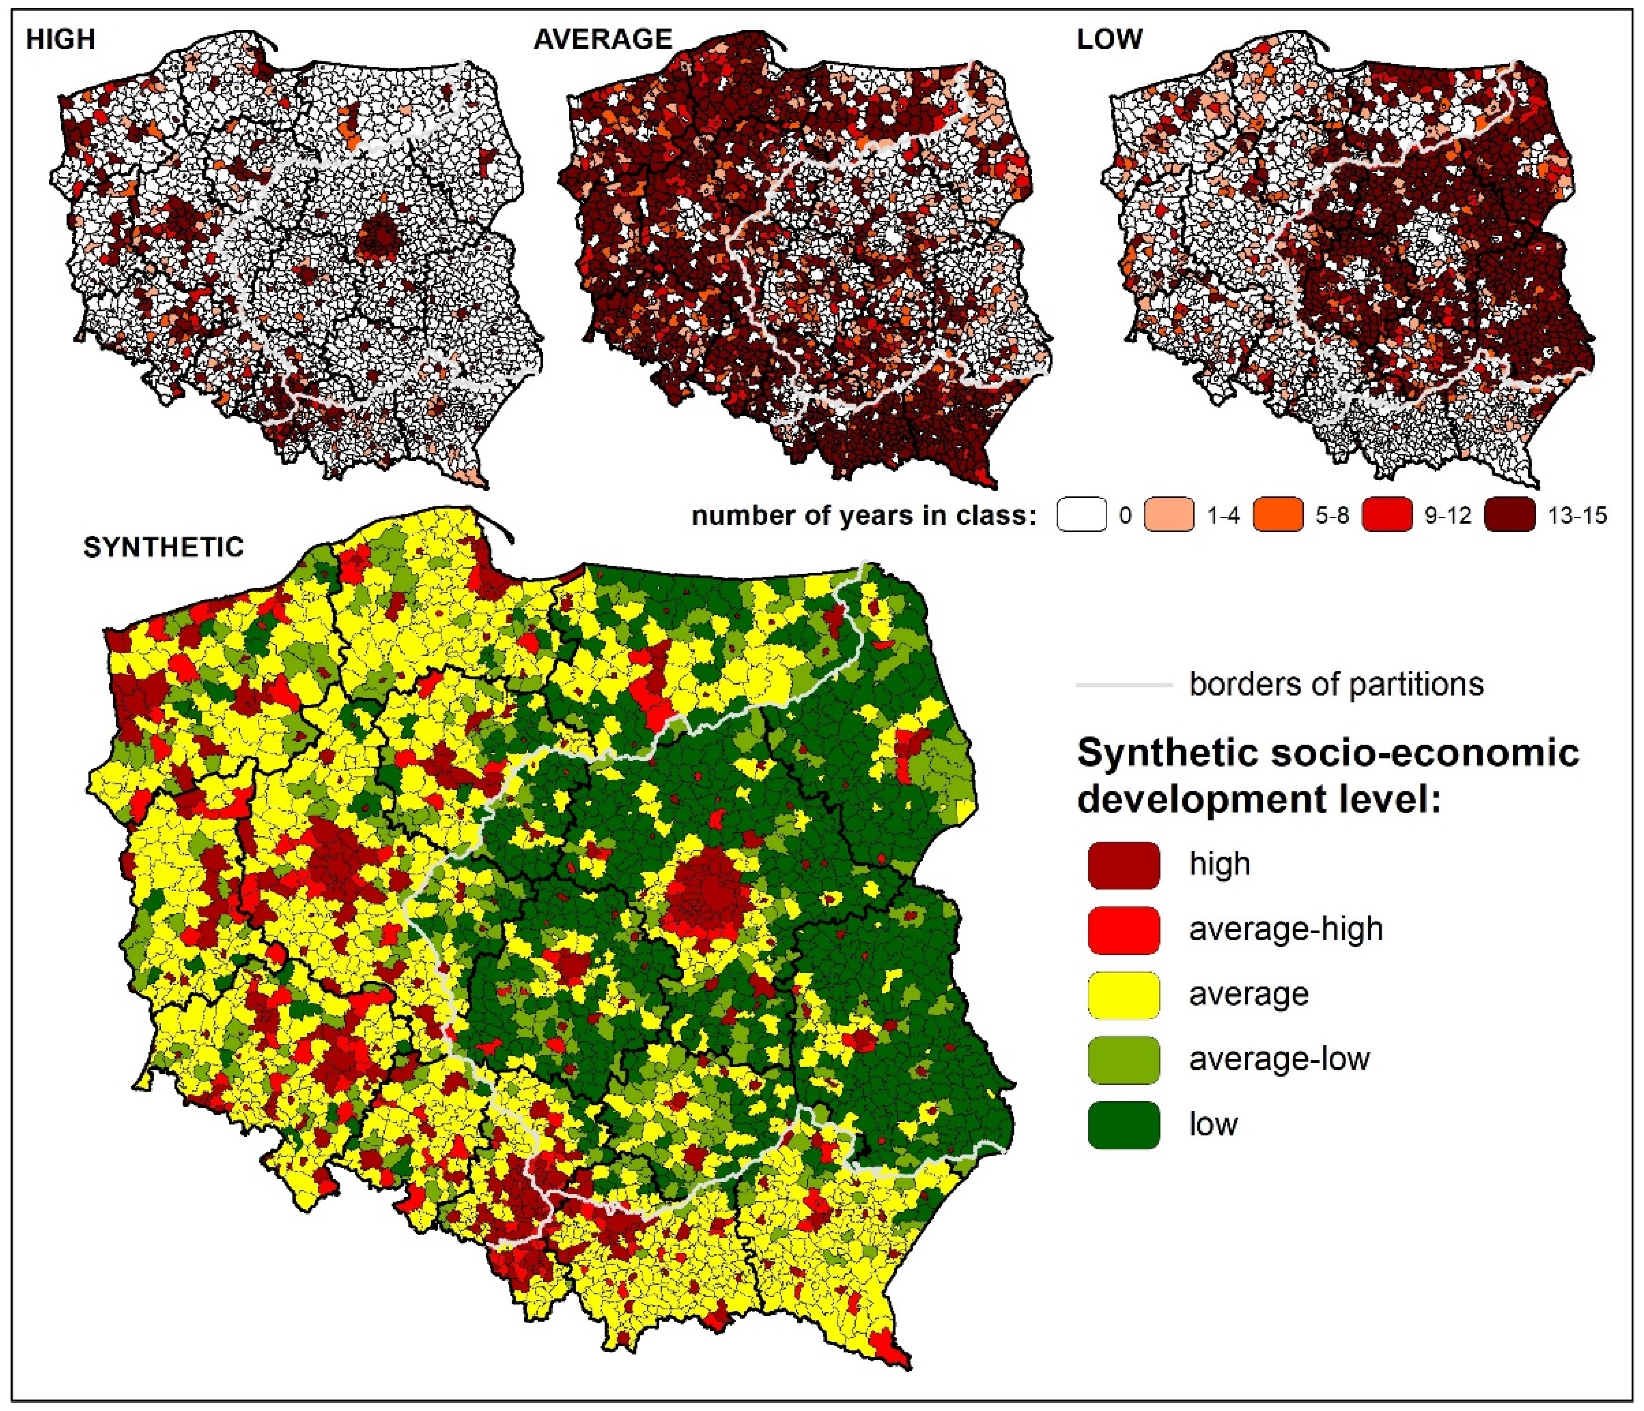
As a result of the classification procedure outlined above, three classes of communes with high, average and low levels of socio-economic development were distinguished. The final step of the procedure was to create a synthetic classification, i.e., one that includes partial classifications from the entire period under study. The synthetic classification is based on the number of people who belonged to one of the distinguished development classes during the entire period in question. It was assumed that assignment to a given development class (in synthetic terms) would be based on the presence of a spatial unit for a minimum of 10 years in a given development class (approximately 70% of the surveyed period). However, some communes did not show this high stability of belonging to one of the three distinguished development classes. Therefore, five classes were finally adopted into the synthetic classification. In addition to the three permanent classes (high, average and low development), average-high and average-low development classes were also distinguished. These classes included those communes which, in different years, belonged to different development classes and mostly existed on the border between high and average or average and low development levels, respectively.
To statistically verify the relationship between communes’ level of socio-economic development and their belonging to former partitions and functional types, Pearson’s Chi-square test for tables R × C (amended by Benjamini-Hochberg) was used and when Cochran’s condition (low expected numbers) was not met, the Fisher-Freeman-Halton test was applied. The latter is an extension of the Fisher exact test for tables R × C in which the following hypotheses were tested:
Hypotheses 0. There is no correlation between the class of the level of socio-economic development and the location within the borders of the former three partitions,
Hypotheses 1. There is a correlation between the class of the level of socio-economic development and the location within the borders of the former three partitions,
and
Hypotheses 0. There is no correlation between the class of the level of socio-economic development and the functional type of the commune,
Hypotheses 1. There is a correlation between the class of the level of socio-economic development and the functional type of the commune.
4. Results—Spatial Differentiation of the Level of Development in Holistic and Partial Terms
Taking into account the overall picture of socio-economic development, an analysis of the value of the synthetic indicator leads to a conclusion that the spatial diversification of the level of socio-economic development in Poland’s communes is relatively high, both nationwide and in intra-regional terms. Additionally, we can observe that, in a sense, these variations are relatively constant and do not change significantly over time. On the national scale, the highest level of socio-economic development is identified in the largest cities and their functional areas making up urban agglomerations (Figure 3). This is particularly evident in the case of Warsaw, Poznań, Wrocław, Gdańsk, Szczecin and the Upper Silesian Conurbation. In other cases, communes (usually medium-sized and large cities) with a high or medium-high development level constitute smaller clusters or even isolated units surrounded by communes that show a significantly lower development level.
Communes with a high level of development account for 15% of the total number, and those with an average-high level of development make up 6% of all Polish communes (Table 2). These are primarily urban and urban-rural communes, located mainly in the Śląskie, Dolnośląskie and Zachodniopomorskie voivodships (where more than 30% of communes are characterized by a high or average-high development level) and Pomorskie, Lubuskie, Małopolskie and Wielkopolskie voivodships (where nearly one-fourth of communes demonstrate a high or average-high development level). These are mainly areas of the former Prussian and partly Austrian partition. Importantly, while in the former Prussian and Austrian partition the share of communes of high and average-high development levels was 27.3% and 23.5%, respectively, they made up only 13.8% in the lands of the Russian partition, and it is precisely here that such large agglomerations as Warsaw or Łódź are located. Moreover, these regions have a relatively low percentage of communes with an average and low level of development. In voivodships such as Śląskie and Małopolskie, it is almost 10% of the region’s communes, and in the remaining cases, the share varies from approximately 15% in Dolnośląskie and Lubuskie to approximately 25% in Zachodniopomorskie and Wielkopolskie.
Communes with an average level of development constituted nearly 39% of all Polish communes. They occurred as spatially compact areas mainly in Western and Southern Poland, while they made up buffers surrounding communes of high and average-high development levels in other parts of the country, separating them from communes of average-low and low development levels. The highest and clearly above-average share of communes with an average development level occurred in the Podkarpackie (69%), Małopolskie (67%), and Lubuskie and Opolskie voivodships (approximately 60% each). On the other hand, in the Dolnośląskie, Pomorskie and Wielkopolskie voivodships, their share was close to 50%. In voivodships such as Lubelskie, Łódzkie and Podlaskie, the percentage of communes with an average development level did not exceed 15%. Rural-urban communes (60%) and rural communes (approximately 36%) dominate among those communes with an average development level. In the former Austrian partition, the percentage of such communes was 67%, and 51% in the Prussian partition. Slightly more than 40% of the communes in Poland show an average-low (12.5%) and low (28.1%) level of socio-economic development. A clear spatial concentration of such communes is seen in the voivodships of central and eastern Poland (Lubelskie, Podlaskie and Łódzkie: 79%, 78% and 73%, respectively. On the other hand, this percentage is about 62–65% in the Mazowieckie and Świętokrzyskie voivodships, and about 47–50% in both the Kujawsko-Pomorskie and Warmińsko-Mazurskie voivodships. In other voivodships, this percentage is much lower and does not exceed 20–25%. Rural communes predominate among those with such a development level. As many as 90% of communes with an average low level of development and 98% of those with a low level of development are rural, yet in the former Russian partitioned territories, their share is as high as 67%.
This situation partly confirms the social and economic diversification of Poland that has occurred for decades. In a nutshell, and in very general terms, it can be said that a higher level of socio-economic development occurs in urban and mixed (urban-rural) communes and those located mainly on the lands that belonged to the Prussian partition (Germany) at the end of World War I. The greatest number of communes with the lowest level of development is found among rural ones, mainly those located in the former Russian partition (and in the Austrian one, albeit to a lesser extent) (For a more comprehensive discussion of Poland’s socio-economic differentiation resulting from former political and administrative divisions, see, among others, [52,53,54]).
Pearson’s Chi-square test for R × C tables (with Benjamini-Hochberg correction) was used in the procedure of verifying dependencies between the level of socio-economic development of communes and (1) belonging to the former partitions and (2) functional types because Cochran’s criterion was fulfilled in both cases. The results of the tests performed (Table 3) indicate that the null hypotheses of the absence of the examined relationships should be rejected and it should be assumed that the interdependencies examined are present. This is additionally confirmed by relatively high values of Pearson’s C contingency coefficient and Cramer’s V contingency coefficient. This means that there is a relatively high correlation between the level of socio-economic development and the location within the borders of the former partitions and the functional type of communes (in this case, the correlations seem to be even stronger).
The results of the χ2 test with the Benjamini-Hochberg correction allow us to conclude that communes located in the three partitions are statistically significantly different in terms of the level of socio-economic development (p < 0.000001). As terms of the relationship between the level of socio-economic development and functional type, statistically significant differences occur between the different functional types of communes, with p < 0.000001 for almost all relationships, except for the relationship between urban and urban-rural communes where p < 0.000759 (and Cochran’s condition is not met).
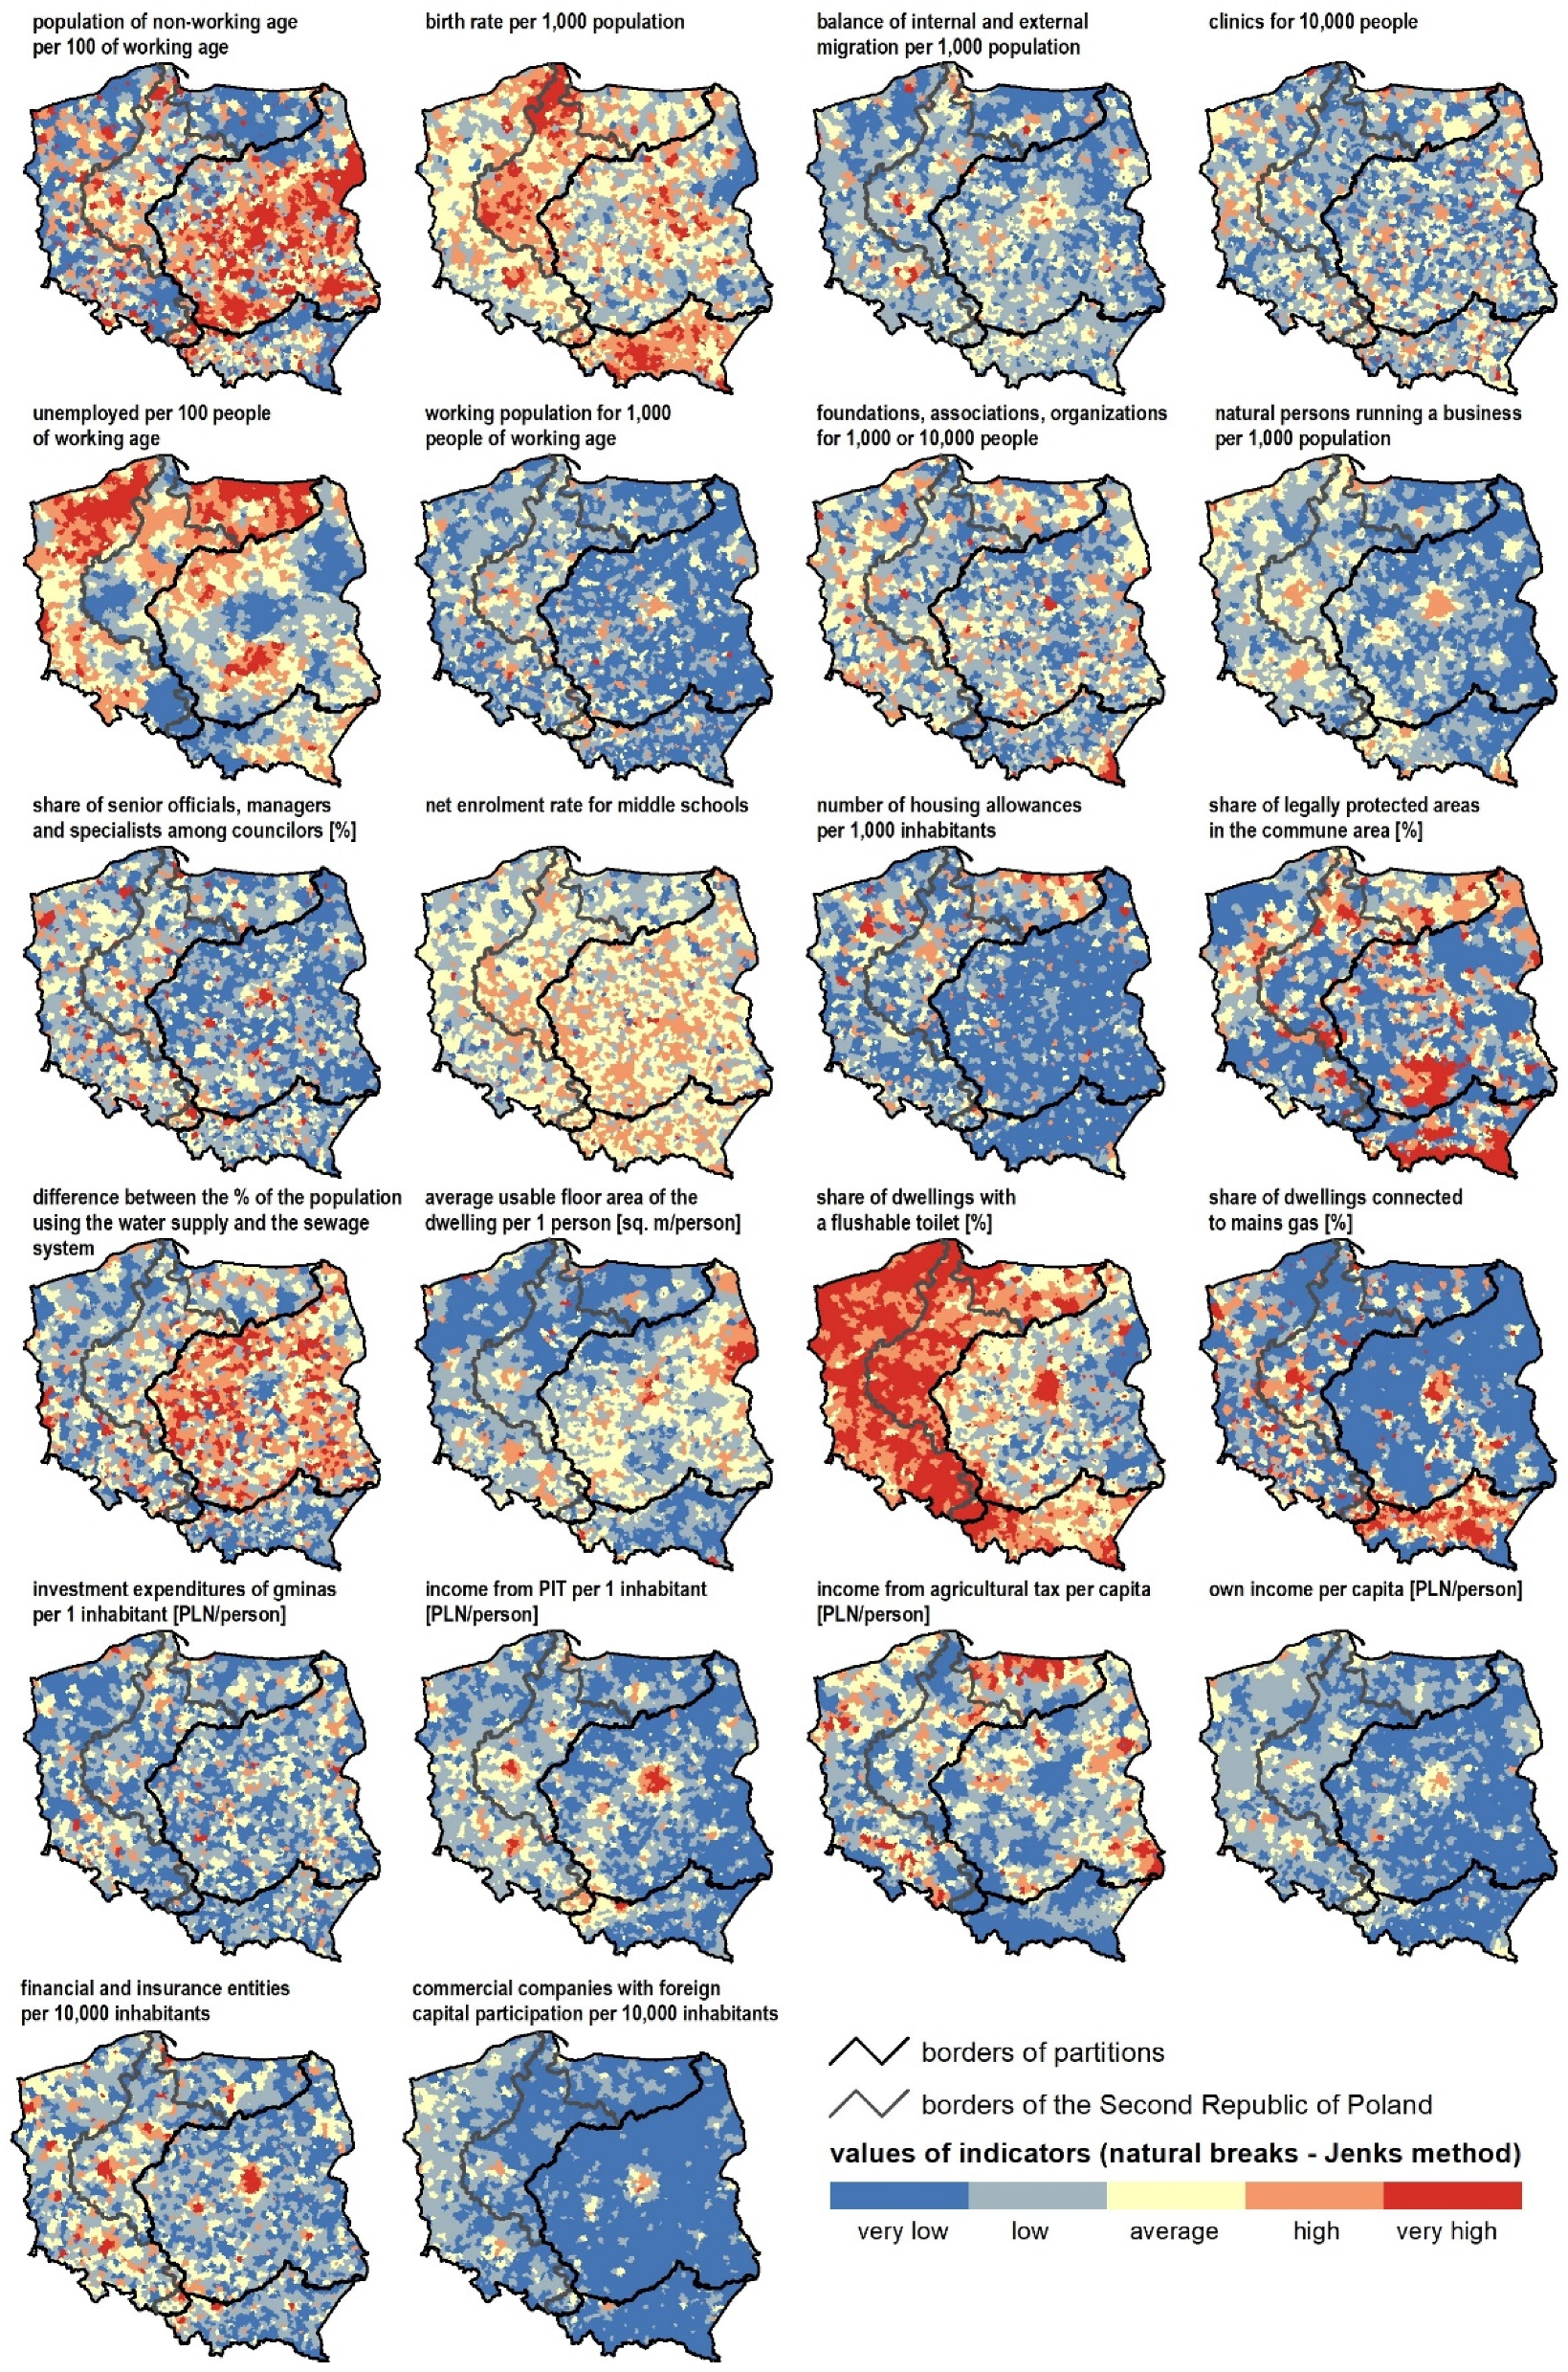
Turning to the partial view of the socio-economic development, it should be noted that in the case of Poland, the spatial distribution of values of particular indicators for communes only partly refers to the spatial distribution of the synthetic indicator (Figure 4). Certain clear correspondences with the borders of the former partitions are visible only in a few cases of partial indicators. These are mainly the number of people of non-working age per 100 people of working age, the values of the net school enrolment ratio, and the share of dwellings equipped with a flush toilet; in this case, the differences resulting from the former partition borders are particularly pronounced. In other cases, other regularities, mainly related to the level of urbanization and functional type of areas, are more pronounced; large cities and their agglomeration especially stand out in relation to the development situation of rural areas.
5. Discussion
The study confirms that the contemporary spatial diversity of the level of socio-economic development in Poland is significantly affected by historical conditions, especially those resulting from the partition of Poland between three powers (Russia, Prussia and Austria). This is particularly evident in the synthesis of the level of socio-economic development. Only in the case of certain socio-economic phenomena do the indicators describing them still clearly correspond in their diversity to the relict borders, especially former partition borders.
The analysis showed a high degree of consistency between the layout of the relict borders and the spatial distribution of values of the synthetic indicator of the socio-economic development level, which seems to be related to the persisting consequences of how different parts of the country have functioned for 123 years under different political, cultural and, above all, socio-economic systems. The systemic policy of Prussia towards the Polish lands under its jurisdiction was aimed at creating conditions for increasing the efficiency of the economy. Substantial attention was attached to improving the productivity of agriculture and creating its support in the form of agri-food processing. Care was also taken to industrialize not only large centers, but also sub-regional and local towns, which resulted in the development and strengthening of the settlement network. The efficiency of the economic system in these areas was strengthened by the construction of a dense communications network connecting all major centers and ensuring the flow of people, goods and capital. As a result, today’s territories of Western and Northern Poland demonstrate better conditions for development, including the formation of agglomeration effects that strengthen the core centers and positively influence their vicinity, i.e., primarily cities serving as regional centers [55]. A completely different policy towards Polish lands was applied by the Russian Empire. Today’s areas of Central and Eastern Poland, corresponding to the lands of the former Russian partition, show worse historical conditions of contemporary socio-economic processes as a consequence of the tsarist policy. A disregard of these areas and their residents by the tsarist regime, resulted in their stagnation and marginalization. This was due to the inadequate development of agriculture and the relatively low level of industrialization, which was limited to few locations. This was exacerbated by a poorly developed transportation network. As a result, today’s areas of Eastern Poland, despite considerable outlays such as the targeted intervention of the cohesion policy, still show infrastructural shortcomings, resulting in economic dysfunctions, including limited conditions for the creation and positive impact of agglomeration effects. Against this background, the situation of the Austrian partition was intermediate, resulting in a different level of socio-economic development in the southern areas of today’s Poland. On the one hand, the Austrians left a great deal of freedom to their inhabitants, which manifested itself, for example, in the autonomy of Galicia. On the other hand, this area, facing great economic challenges resulting from physical and geographic conditions (rough terrain) and without a systemic building of conditions for development, showed moderate changes. Its current economic situation varies, too. In addition to strong regional centers such as Krakow or Rzeszow whose functional areas are developing due to agglomeration effects, thus ensuring a high standard of living for the population, many territories can still be classified as descending peripheries, at risk of permanent marginalization.
In partial terms, a clear correspondence to the borders of the former partitions can only be seen in demographic terms (working age population or population growth level) and in attendant economic factors (micro-entrepreneurs), as well as in infrastructure provision (the share of dwellings equipped with a flush toilet or the share of dwellings with access to mains gas). In the first two cases, this may be partly associated with the socio-cultural characteristics of the inhabitants, and in the third case with the previously mentioned political and historical conditions. As far as the socio-cultural characteristics of the residents are concerned, the interrelations are certainly more complex. Although they refer to the influence of the former partition divisions, which, however, is being overcome by the strong influence of the dichotomy of urban and rural areas on the spatial distribution of socio-economic development. This is confirmed by, among others, Grosfeld and Zhuravskaya [56] and Lessmann and Seidel [38] who point out the importance of human capital and its personal characteristics on economic inequality, as well as the importance raised by Polanyi [57] and Granovetter [58] of the embeddedness of economic activity in networks of social relations and interpersonal ties for their effectiveness. In general, the inhabitants of Western Poland show greater openness, innovativeness and flexibility to change. This is largely due to the inhabitants being partly an immigrant population, and the indigenous populations of Wielkopolska, Pomerania and partially Silesia, as a result of German acculturation, have adopted many features of a bourgeois and capitalist mentality. As a consequence of migration movements (e.g., resettlement from the east), they show no attachment to the land and, after assimilation in these areas, have a less orthodox attitude towards traditional values, including religion. The inhabitants of Eastern and Southern Poland have a completely different socio-cultural profile. They are mainly historically settled conservatives with very high respect for traditional values and religion. They demonstrate a very strong attachment to the land, inherited from generation to generation, and consequently oppose any changes of ownership even if they are economically justified. This is a population that is very religious, relatively more conservative, less innovative and less open to change. In addition, it should be emphasized that the positive impact of socio-cultural characteristics on development processes is enhanced or weakened by specific infrastructure and a higher level of urbanization. As already mentioned, Western Poland, corresponding to the former Prussian partition, has a much denser urban network and a better infrastructure than the eastern and southern areas located within the borders of the former Austrian and Russian partitions. The robust settlement and infrastructural network facilitate the strengthening of agglomeration effects in these areas through patterns described by [34] as “sharing, matching and learning”, which improves the living standards of the population. Therefore, both in terms of the overall (synthetic) and selected partial approaches (such as the level of migration, PIT income and degree of entrepreneurship, i.e., the number of businesses), there is a markedly higher level of development in urban areas (mainly urban agglomerations) than in rural areas (predominant in Eastern Poland, corresponding to the lands of the former Russian partition).
As a result, it can be concluded that all the hypotheses presented in the introduction have been confirmed. Spatial diversification of socio-economic development in Poland is still significantly determined by the “historical legacy” dating back to the period of the partitions of Poland in the late 18th century. On the other hand, the spatial differentiation of socio-economic development in Poland is permanent and does not show significant changes in periods of economic growth and crisis, highlighting the lingering differences in the layout of cities and their functional areas versus rural areas.
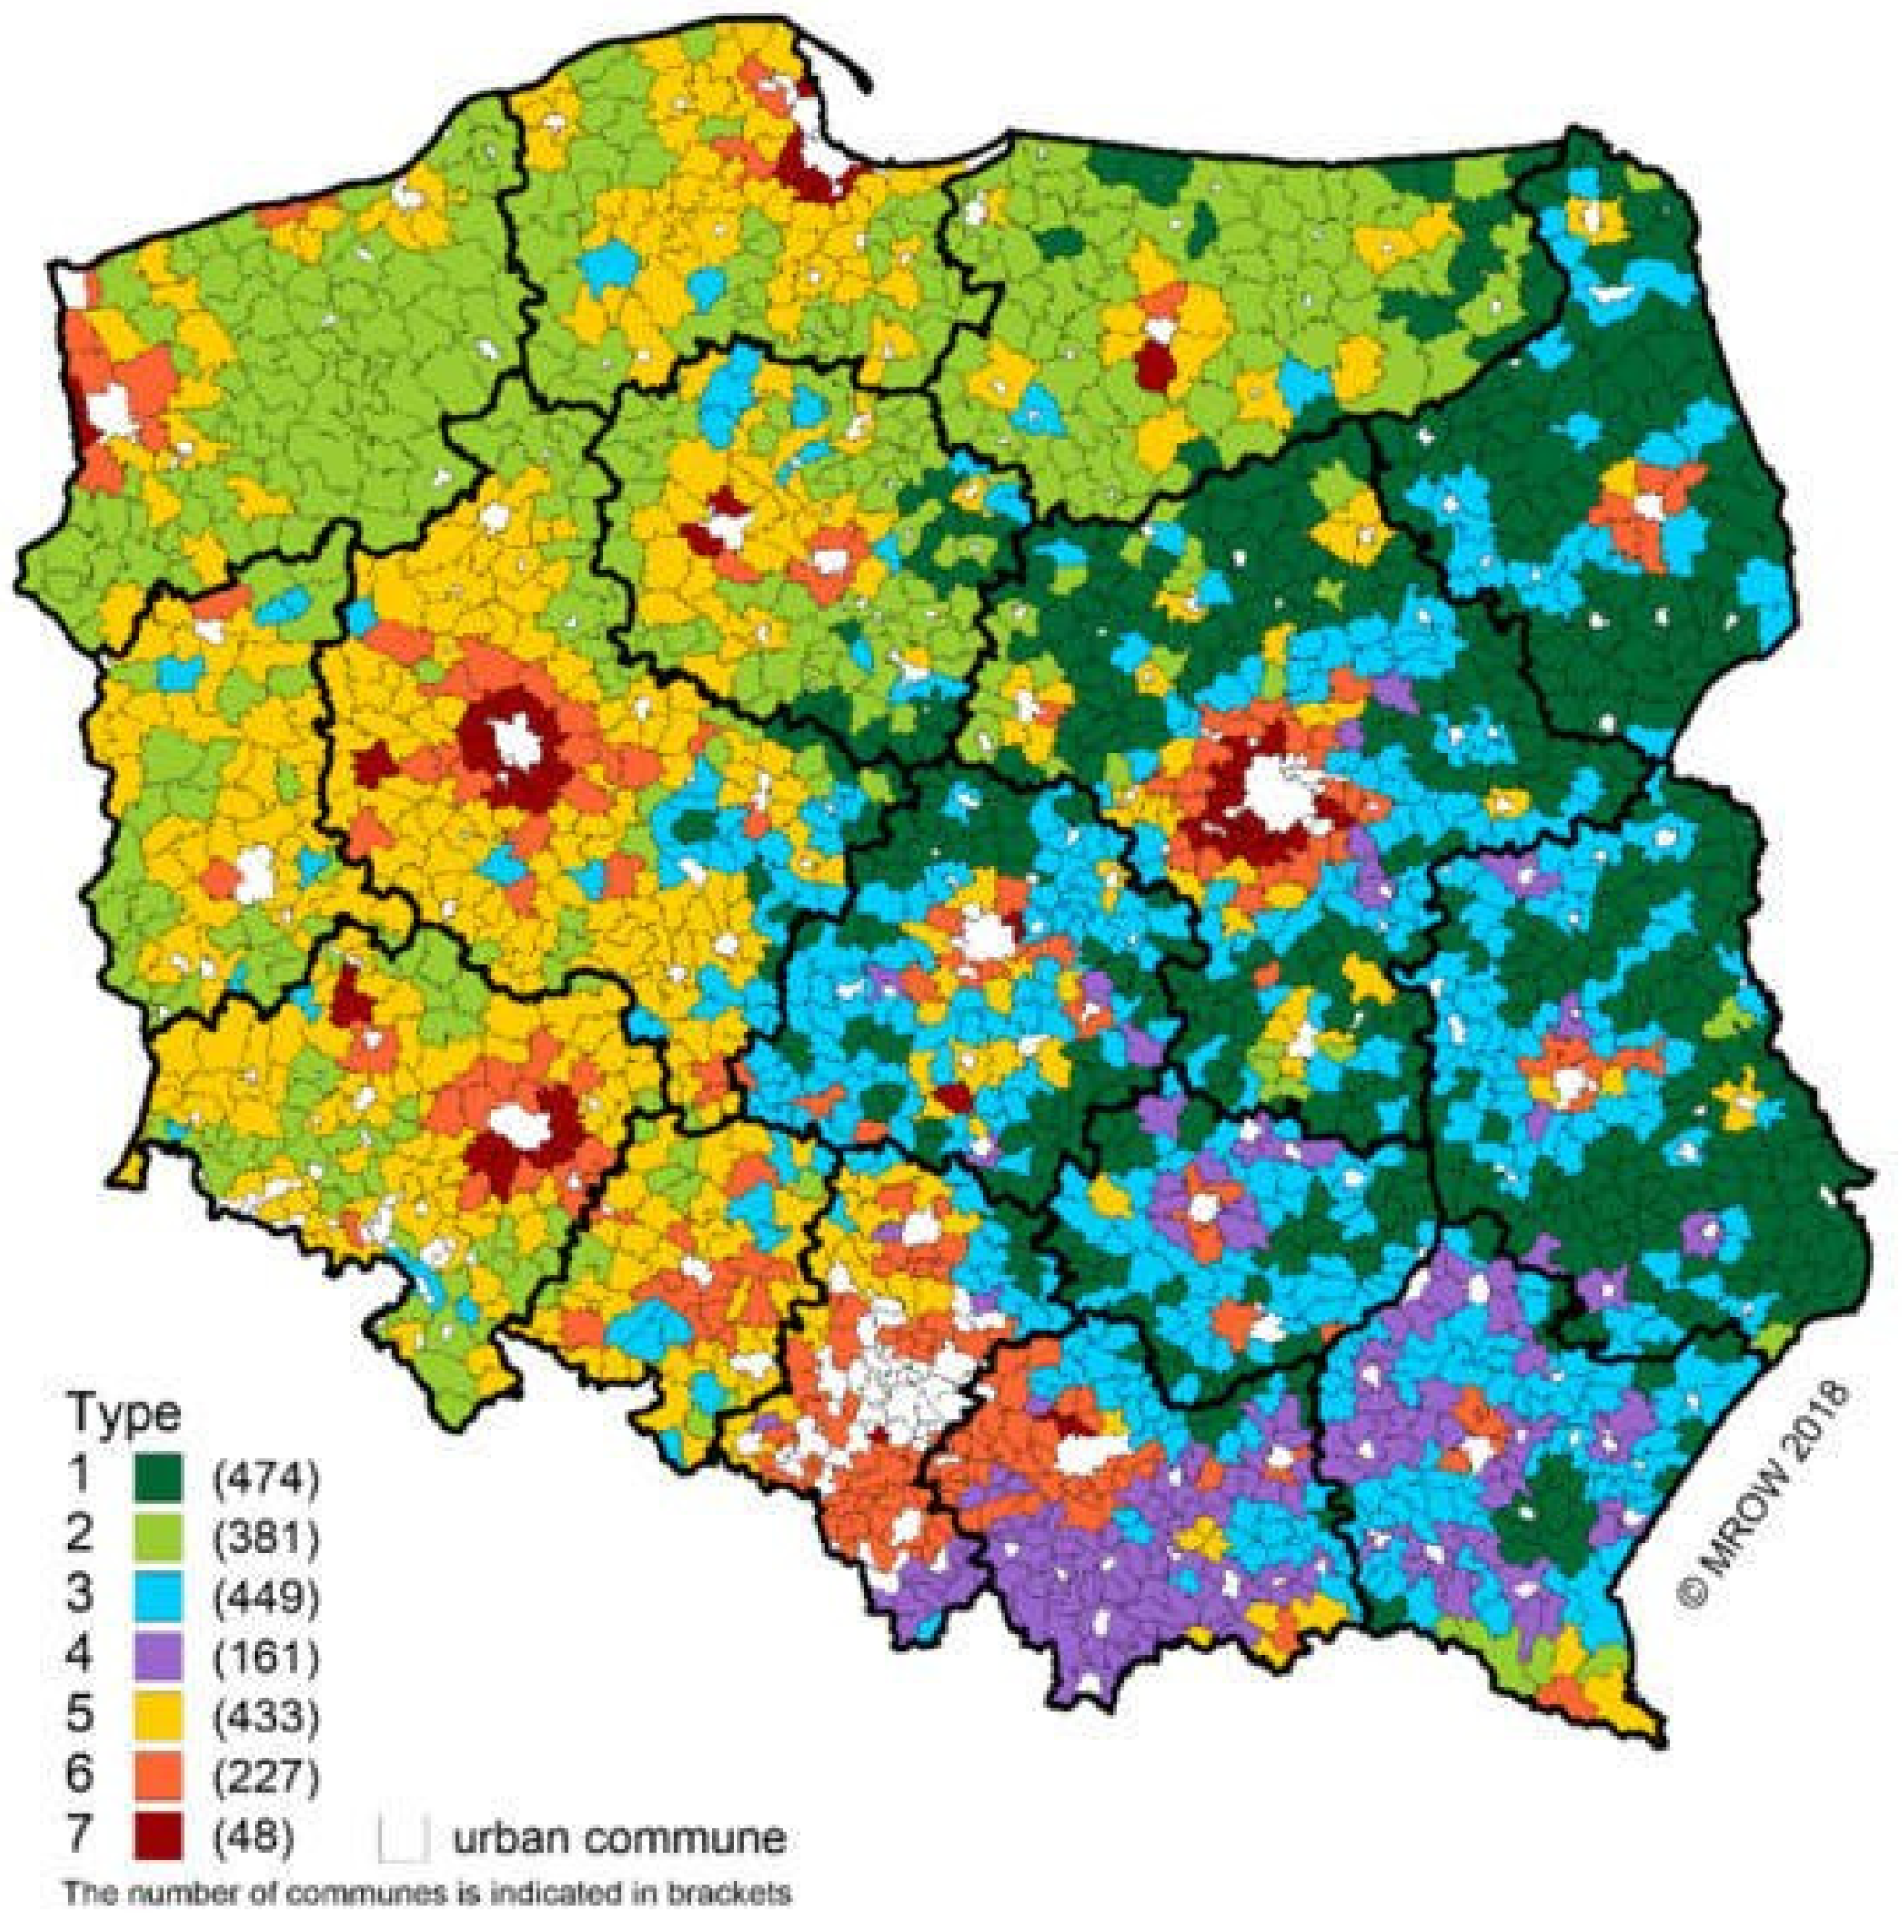
The research outcomes are backed up by several other studies that indicate the “invisible” historical heritage and the influence of the layout of cities and their functional areas versus rural areas on the contemporary spatial differentiation of socio-economic development in Poland. The study by Stanny et al. [59] on the typology of rural areas in Poland (conducted via different methods and on a different set of socio-economic indicators) confirms the clearly divergent character of rural areas within the borders of the former three partitions and indicates the important role of cities (level of urbanization) (Figure 5). Areas located within the borders of the former Russian partition show dominant traditional agriculture, which hinders socio-economic development of rural areas. On the other hand, areas within the former Prussian partition (except for the areas incorporated into Poland after 1945) have a multifunctional character, which significantly improves their socio-economic status.
Similar conclusions were reached by Głębocki et al. [60] and Wiśniewski et al. [61] who came up with a typology of agriculture in Poland. However, in these studies, historical heritage reveals not only the borders of the former partitions but also the borders of Poland from the interwar period (1918–1939). In turn, these studies emphasize the lingering differences in the level of commodity farming, efficiency and mechanization, or the level of agriculture in general. “Invisible” historical heritage also brings indirect effects as diagnosed by Bański et al. [62] who showed that the highest concentration of “disappearing villages” occurs mainly in the lands of the former Russian partition as a consequence of unfavorable tendencies of social and economic processes. The main reasons for this process include: the constant population outflow to cities and their functional areas resulting from the permanently low level of economic and social development of peripheral and marginalized rural areas, their much worse infrastructure and poor connectivity. In turn, a study by Fritsch et al. [63] outlined the spatial differentiation of the level of entrepreneurship in Poland, which clearly refers to the historical borders (especially Poland within the borders of 1918–1939 and partly the partitions). According to the authors, this may be partly historically conditioned, consequential of divergent socio-economic, political and cultural systems.
Both our research and all the above studies stress the role of historical determinants, which differently impacted the spatial and functional structure of particular areas of today’s Poland belonging to the three partitioned states. They affected the level of infrastructural equipment of towns and rural areas, of agricultural culture and of socio-cultural characteristics of inhabitants, which emerged over the course of decades through the functioning of different political, social and economic systems. The result is the consolidation of disparities in the level of socio-economic development (or its selected aspects) in the country, which, in terms of overall development and selected aspects of partial development, still clearly correspond to the layout of the former borders, especially those of the partitions and during the period of the Second Polish Republic.
6. Conclusions
The outcomes of the study, based on the application of an original procedure for the determination of the synthetic index and the use of a procedure for the classification of local units based on an innovative random forest method, helped to confirm the research hypotheses put forth at the beginning. The inclusion in the study of a relatively long series of observations both helped to capture the stability of the development situation of many Polish municipalities in terms of the level of socio-economic development and made it possible to observe gradual changes, especially in the comparison of the development situation of cities and their functional areas versus rural areas. The conclusion is that the spatial differentiation of socio-economic development in Poland at the local level is gradually overcoming the “invisible” historical legacy and becoming increasingly influenced by the polarization of development processes in cities and their functional areas, which results in relegating many rural areas to the periphery and contributes to their marginalization.
The identified consolidating developmental differences are increasingly opposed by the society. It should be remembered that the costs and benefits of globalization taking place under conditions of progressive integration are unevenly distributed among areas and among social groups [64,65]. This leads not only to the aforementioned polarization of developmental differences between various areas, but also (and perhaps most importantly) to the polarization of social behavior. The strong association of spatial structure with variations in the level of socio-economic development takes the form described by Andrés Rodríguez-Pose [66] as the “revenge of meaningless territories”. It represents a radical response that stresses disagreement to the consequences of the socio-economic processes taking place and the unsatisfactory effectiveness of the development intervention to date.
The challenges highlight the need for a change in the approach to development policy programming and implementation. The limitation to previously used approaches focused on the implementation of large infrastructure investments and the impact of the development of leisure infrastructure and increasing social assistance seem to be blatantly insufficient, if not harmful. Changing the situation of peripheral and marginalized areas and, consequently, the social inclusion of their inhabitants, requires the use of a place-based approach in development intervention with a focus on strengthening endogenous potentials and overcoming local barriers to development [36]. It is necessary to strive for a coordinated use of the development potential of each area rather than to wait for the spillover effects of development from areas of its polarization [67]. As Rodríguez-Pose [66] indicates, “place-sensitive development policies” should focus on uncovering untapped and dormant potential and strengthening untapped opportunities. This requires the creation of conditions for a complete and objective identification of the networked local resources that make up the territorial capital of each area. This should be carried out through theoretical assumptions of evidence-based development policy programming objectively adjusted to local realities, as well as by the application of principles of people-based and place-based policies. Above all, however, it should seek to empower local stakeholders’ capacities to design the development future of an area, regardless of its current level of development [68]. Importantly, this does not require increasing the scope of interventions, but improving their quality, mostly determined by institutional factors [69,70].
Author Contributions
Conceptualization, R.P. and P.C.; methodology, R.P.; software, R.P.; validation, R.P.; formal analysis, R.P.; investigation, R.P., P.C., B.K.-S. and T.H.; resources, B.K.-S. and T.H.; data curation, R.P., B.K.-S. and T.H.; writing—original draft preparation, P.C., R.P., T.H. and B.K.-S.; writing—review and editing, P.C., R.P., T.H. and B.K.-S.; visualization, R.P.; supervision, P.C. and R.P.; project administration, P.C.; funding acquisition, P.C., R.P., T.H. and B.K.-S. All authors have read and agreed to the published version of the manuscript.
Funding
This study was carried out as part of the FORSED research project (www.forsed.amu.edu.pl, accessed on 11 November 2021) funded by the National Science Center (No. 2015/19/B/HS5/00012): New challenges of regional policy in shaping socio-economic development factors of less developed regions.
Data Availability Statement
Data available on request after its approval by the authors.
Conflicts of Interest
The authors declare no conflict of interest. The funders had no role in the design of the study; in the collection, analyses, or interpretation of data; in the writing of the manuscript, or in the decision to publish the results.
References
- Psycharis, Y.; Kallioras, D.; Pantazis, P. Economic crisis and regional resilience: Detecting the ‘geographical footprint’ of economic crisis in Greece. Reg. Sci. Policy Pract. 2014, 6, 121–142. [Google Scholar] [CrossRef]
- Fiaschi, D.; Lavezzi, A.M.; Parenti, A. Does EU cohesion policy work? Theory and evidence. J. Reg. Sci. 2018, 58, 386–423. [Google Scholar] [CrossRef] [Green Version]
- Churski, P.; Perdał, R. Where do Cohesion Policy funds flow and do they have any impact?—The Polish lesson. Barometr Regionalny. Anal. Progn. 2016, 14, 7–24. [Google Scholar]
- Peters, B.G.; Pierre, J.; King, D.S. The politics of path dependency: Political conflict in historical institutionalism. J. Politics 2005, 67, 1275–1300. [Google Scholar] [CrossRef]
- Boas, T.C. Conceptualizing continuity and change. The composite-standard model of path dependence. J. Theor. Politics 2007, 19, 33–54. [Google Scholar] [CrossRef] [Green Version]
- Hartshorne, R. Geographic and political boundaries in Upper Silesia. Ann. Assoc. Am. Geogr. 1933, 23, 195–228. [Google Scholar] [CrossRef]
- Prescott, J.R.V. The Geography of Frontiers and Boundaries; Routledge: London, UK, 1965. [Google Scholar]
- Kolossov, V. Theorizing borders. Border studies: Changing perspectives and theoretical approaches. Geopolitics 2005, 10, 606–632. [Google Scholar] [CrossRef]
- Prescott, V.; Triggs, G.D. International Frontiers and Boundaries; Martinus Nijhoff Publishers: Leiden, The Netherlands, 2008. [Google Scholar]
- McNeill, J. GDP growth and human wellbeing: A brief look at why we need a better measure of progress. N. Engl. Perspect. 1999, 3, 135–144. [Google Scholar]
- Van den Bergh, J. Abolishing GDP. In Tinbergen Institute Discussion Paper; Tinbergen Institute: Amsterdam, The Netherlands, 2007; p. 19. [Google Scholar]
- Booysen, F. An overview and evaluation of composite indices of development. Soc. Indic. Res. 2002, 59, 115–151. [Google Scholar] [CrossRef]
- Mazziotta, P. Methods for constructing composite indices: One for all or all for one? Riv. Ital. Econ. Demogr. Stat. 2013, 67, 49–54. [Google Scholar]
- Land, K.C. Composite index construction. In Encyclopedia of Quality of Life and Well-Being Research; Michalos, A.C., Ed.; Springer: Dordrecht, The Netherlands, 2014; pp. 1152–1156. [Google Scholar]
- Pike, A.; Rodríguez-Pose, A.; Tomaney, J. What kind of local and regional development and for whom? Reg. Stud. 2007, 41, 1253–1269. [Google Scholar] [CrossRef] [Green Version]
- Florida, R.; Mellander, C.; Stolarick, K. Inside the black box of regional development—Human capital, the creative class and tolerance. J. Econ. Geogr. 2008, 8, 615–649. [Google Scholar] [CrossRef] [Green Version]
- Lu, Y.; Cao, B.; Hua, Y.; Ding, L. Efficiency measurement of green regional development and its influencing factors: An improved data envelopment analysis framework. Sustainability 2020, 12, 4361. [Google Scholar] [CrossRef]
- Sdino, L.; Rosasco, P.; Lombardini, G. The evaluation of urban regeneration processes. In Regeneration of the Built Environment from a Circular Economy Perspective; Torre, S.D., Cattaneo, S., Lenzi, C., Zanelli, A., Eds.; Springer: Amsterdam, The Netherlands, 2020; pp. 47–57. [Google Scholar]
- Chen, C.; He, X.; Liu, Z.; Sun, W.; Dong, H.; Chu, Y. Analysis of regional economic development based on land use and land cover change information derived from Landsat imagery. Sci. Rep. 2020, 10, 12721. [Google Scholar] [CrossRef] [PubMed]
- Jałowiecki, B. (Ed.) Oblicza Polskich Regionów (Dimensions of Polish Regions); Studia Regionalne i Lokalne, 17, Europejski Instytut Rozwoju Regionalnego i Lokalnego, Uniwersytet Warszawski: Warsaw, Poland, 1996. [Google Scholar]
- Hryniewicz, J. Regiony ideologiczne w Polsce i Niemczech. Zarys procesów długiego trwania. (Ideological regions in Poland and Germany. An outline of long duration processes). Studia Reg. Lokalne 2008, 3, 5–20. [Google Scholar]
- Topolski, J. Dzieje Polski 1501–1795, 4th ed.; (History of Poland 1501–1795, 4th ed.); Wydawnictwo Naukowe PWN: Warsaw, Poland, 1993. [Google Scholar]
- Jelonek, A. Ludność Miast i Osiedli Typu Miejskiego na Ziemiach Polskich od 1810 do 1960 r. (Population of Cities and Rural Settlements on Polish Soil Between 1810 and 1960); Dokumentacja Geograficzna, 3/4, Instytut Geografii PAN: Warsaw, Poland, 1967. [Google Scholar]
- Taylor, Z. Rozwój i Regres Sieci Kolejowej w Polsce (Development and Regress of the Railroad Network in Poland); Instytut Geografii i Przestrzennego Zagospodarowania im. St. Leszczyckiego PAN: Warsaw, Poland, 2007. [Google Scholar]
- GUS. Badanie Statystyczne w Zakresie Identyfikacji Obszarów Gmin (Rejonów Statystycznych) o Cechach Miejskich, Miejsko-Wiejskich, Wiejsko-Miejskich i Cechach Wiejskich, w Poszczególnych Województwach oraz Wskaźnika Syntetycznego Różnicującego Gminy na Podstawie Kryterium Funkcjonalnego (Statistical Research Concerning the Identification of Commune Areas ‘Statistical Regions’ with Urban, Urban–Rural, Rural–Urban, and Rural Features in Particular Voivodeships and the Synthetic Indicator Differentiating Communes on the Basis of a Functional Criterion); Statistics Poland: Warsaw, Poland, 2015.
- Baza Danych Obiektów Topograficznych (Database of Topographic Objects). Topographic Map—BDOT10k. Available online: https://geoportal.gov.pl/ (accessed on 16 August 2021).
- Konecka-Szydłowska, B.; Churski, P.; Herodowicz, T.; Perdał, R. Europejski kontekst wpływu współczesnych megatrendów na rozwój społeczno-gospodarczy. Ujęcie syntetyczne (The European context of the impact of contemporary megatrends on socio-economic development. A synthetic approach). Przegląd Geogr. 2019, 91, 39–60. [Google Scholar] [CrossRef]
- Verstraten, P.; Verweij, G.; Zwaneveld, P.J. Complexities in the spatial scope of agglomeration economies. J. Reg. Sci. 2019, 59, 25–55. [Google Scholar] [CrossRef] [Green Version]
- Marshall, A. Principles of Political Economy; Macmillan: New York, NY, USA, 1890. [Google Scholar]
- Arrow, K.J. The economic implications of learning by doing. Rev. Econ. Stud. 1962, 29, 155–173. [Google Scholar] [CrossRef]
- Romer, P. Increasing returns and long-run growth. J. Political Econ. 1986, 94, 1002–1037. [Google Scholar] [CrossRef] [Green Version]
- Porter, M. The Competitive Advantage of Nations; Free Press: New York, NY, USA, 1990. [Google Scholar]
- Jacobs, J. The Economy of Cities; Random House: New York, NY, USA, 1969. [Google Scholar]
- Duranton, G.; Puga, D. Micro-foundations of urban agglomeration economies. In Handbook of Regional and Urban Economics, 4th ed.; Henderson, J.V., Thisse, J.-F., Eds.; Elsevier: Amsterdam, The Netherlands, 2004; pp. 2063–2117. [Google Scholar]
- Glaeser, E.; Gottlieb, J. The Economics of Place-Making Policies; Working Paper 14373; National Bureau of Economic Research: Cambridge, MA, USA, 2008; pp. 155–239. Available online: http://www.nber.org/papers/w14373 (accessed on 15 October 2021).
- Churski, P.; Herodowicz, T.; Konecka-Szydłowska, B.; Perdał, R. European Regional Development. Contemporary Regional and Local Perspectives of Socio-Economic and Socio-Political Changes, Economic Geography Series; Springer: Amsterdam, The Netherlands, 2021. [Google Scholar]
- Ganong, P.; Shoag, D. Why has regional income convergence in the US declined? In Harvard Kennedy School Working Paper; National Bureau of Economic Research: Cambridge, MA, USA, 2015. [Google Scholar]
- Lessmann, C.; Seidel, A. Regional inequality, convergence, and its determinants—A view from outer space. Eur. Econ. Rev. 2017, 92, 110–132. [Google Scholar] [CrossRef] [Green Version]
- Iammarino, S.; Rodríguez-Pose, A.; Storper, M. Regional inequality in Europe: Evidence, theory and policy implication. J. Econ. Geogr. 2018, 19, 273–298. [Google Scholar] [CrossRef]
- Horner, R.; Schindler, S.; Haberly, D.; Aoyama, Y. Globalisation, uneven development and the North-South ‘big switch’. Camb. J. Reg. Econ. Soc. 2018, 11, 17–33. [Google Scholar] [CrossRef]
- Pontarollo, N.; Serpieri, C. A composite policy tool to measure territorial resilience capacity. Socio Econ. Plan. Sci. 2020, 70, 100669. [Google Scholar] [CrossRef] [Green Version]
- Bachtler, J.; Martins, J.O.; Wostner, P.; Żuber, P. Towards Cohesion Policy 4.0: Structural Transformation and Inclusive Growth; Regional Studies Association: Brussels, Belgium, 2017. [Google Scholar]
- Churski, P.; Perdał, R.; Herodowicz, T. Can a biggie get more? The place of regional centres in the process of absorption of European funds in Polish voivodeships. Eur. XXI 2016, 30, 59–76. [Google Scholar] [CrossRef] [Green Version]
- Wójcik, M.; Dmochowska-Dudek, K.; Jeziorska-Biel, P.; Tobiasz-Lis, P. Understanding strategies for overcoming peripherality: A Polish experience of transition. Bull. Geogr. Socio-Econ. Ser. 2018, 40, 173–192. [Google Scholar] [CrossRef] [Green Version]
- Bray, J.R.; Curtis, J.T. An ordination of the upland forest communities of Southern Wisconsin. Ecol. Monogr. 1957, 27, 325–349. [Google Scholar] [CrossRef]
- Hartigan, J. Clustering Algorithms; John Wiley & Sons: New York, NY, USA, 1975. [Google Scholar]
- Kaufman, L.; Rousseeuw, P.J. Finding Groups in Data: An Introduction to Cluster Analysis; Wiley-Interscience: New York, NY, USA, 1990. [Google Scholar]
- Larose, D.T.; Larose, C.D. Data Mining and Predictive Analytics; Wiley: Hoboken, NJ, USA, 2015. [Google Scholar]
- Breiman, L.; Friedman, J.H.; Olshen, R.A.; Stone, C.J. Classification and Regression Trees (CART); Chapman and Hall, CRC Press: Boca Raton, FL, USA, 1998. [Google Scholar]
- Breiman, L. Random forests. Mach. Learn. 2001, 45, 5–32. [Google Scholar] [CrossRef] [Green Version]
- Hastie, T.; Tibshirani, R.; Friedman, J. The Elements of Statistical Learning Data Mining, Inference, and Prediction, 2nd ed.; Springer: New York, NY, USA, 2013. [Google Scholar]
- Zarycki, T. Politics in the periphery: Political cleavages in Poland interpreted in their historical and international context. Eur. Asia Stud. 2000, 52, 851–873. [Google Scholar] [CrossRef]
- Zarycki, T. The electoral geography of Poland: Between stable spatial structures and their changing interpretations. Erdkunde 2015, 69, 107–124. [Google Scholar] [CrossRef] [Green Version]
- Domański, B. Społeczny wymiar rozwoju polskich regionów. In Równość czy Efektywność Rozwoju. Eseje Inspirowane Dorobkiem Naukowym Grzegorza Gorzelaka (Social Dimension of the Development of Polish Regions. In Equality or Development Efficiency. Essays Inspired by the Scientific Achievements of Grzegorz Gorzelak); Olechnicka, A., Herbst, M., Eds.; Wydawnictwo Naukowe Scholar: Warsaw, Poland, 2019; pp. 152–165. [Google Scholar]
- Gorzelak, G.; Smętkowski, M. Rozwój Regionalny i Polityka Regionalna (Regional Development and Regional Policy); Forum Obywatelskiego Rozwoju: Warsaw, Poland, 2019. [Google Scholar]
- Grosfeld, I.; Zhuravskaya, I. Cultural vs. economic legacies of empires: Evidence from the partition of Poland. J. Comp. Econ. 2015, 43, 55–75. [Google Scholar] [CrossRef]
- Polanyi, K. The Great Transformation. The Political and Economic Origins of Our Time, 3rd ed.; Beacon Press: Boston, MA, USA, 2001. [Google Scholar]
- Granovetter, M. Economic action and social structure: The problem of embeddedness. Am. J. Sociol. 1985, 91, 481–510. [Google Scholar] [CrossRef]
- Stanny, M.; Komorowski, Ł.; Rosner, A. The socio-economic heterogeneity of rural areas: Towards a rural typology of Poland. Energies 2021, 14, 5030. [Google Scholar] [CrossRef]
- Głębocki, B.; Kacprzak, E.; Kossowski, T. Multicriterion typology of agriculture: A spatial dependence approach. Quaest. Geogr. 2019, 38, 29–49. [Google Scholar] [CrossRef] [Green Version]
- Wiśniewski, Ł.; Perdał, R.; Rudnicki, R. Proposed method for delimiting spatial structure on the example of agriculture types in Poland. Bull. Geogr. Socio Econ. Ser. 2020, 49, 7–18. [Google Scholar] [CrossRef]
- Bański, J.; Wesołowska, M.; Łoboda, K. Wsie zanikające—Identyfikacja i analiza wybranych cech społeczno-ekonomicznych (Disappearing villages—Identification and analysis of selected socioeconomic features). Przegląd Geogr. 2020, 92, 175–189. [Google Scholar] [CrossRef]
- Fritsch, M.; Pylak, K.; Wyrwich, M. Historical roots of entrepreneurship in different regional contexts—The case of Poland. Small Bus. Econ. 2021, 1–16. [Google Scholar] [CrossRef]
- Kriesi, H.P.; Koopmans, R.; Duyvendak, J.W.; Giugni, M.G. New Social Movements in Western Europe: A Comparative Analysis; University of Minnesota Press: Minneapolis, MN, USA, 1995. [Google Scholar]
- Kriesi, H.P.; Grande, E.; Lachat, R.; Dolezal, A.; Bornschi, S.; Frey, T. Globalization and the transformation of the national political space: Six European countries compared. Eur. J. Political Res. 2006, 45, 921–956. [Google Scholar] [CrossRef] [Green Version]
- Rodríguez-Pose, A. The revenge of the places that don’t matter (and what to do about it). Camb. J. Reg. Econ. Soc. 2017, 11, 189–209. [Google Scholar] [CrossRef]
- McCann, P.; Rodríguez-Pose, A. Why and when development policy should be place-based. In OECD Regional Outlook: Building Resilient Regions for Stronger Economies; OECD, Ed.; OECD: Paris, France, 2011; pp. 203–213. [Google Scholar]
- Iammarino, S.; Rodríguez-Pose, A.; Storper, M. Why regional development matters for Europe’s economic future. In Working Papers of the Directorate-General for Regional and Urban Policy; European Commission: Brussels, Belgium, 2017; p. 7. [Google Scholar]
- Rodríguez-Pose, A. Do institutions matter for regional development? Reg. Stud. 2013, 47, 1034–1047. [Google Scholar] [CrossRef] [Green Version]
- Rodríguez-Pose, A. The Rise of Populism and the Revenge of the Places That Don’t Matter. LSE Public Policy Rev. 2020, 1, 4. [Google Scholar] [CrossRef]
Figure 1.
Layout of former political borders vs. the present territory of Poland. Source: own elaboration.
Figure 1.
Layout of former political borders vs. the present territory of Poland. Source: own elaboration.

Figure 2.
Railway network and types of functional units in Poland. Source: own elaboration, based on [25,26].

Figure 3.
Level of socio-economic development of communes between 2004 and 2018. Source: own elaboration.
Figure 3.
Level of socio-economic development of communes between 2004 and 2018. Source: own elaboration.

Figure 4.
Spatial distribution of sub-indices in 2018. Source: own elaboration on the basis of data from the Local Data Bank of Statistics Poland.
Figure 4.
Spatial distribution of sub-indices in 2018. Source: own elaboration on the basis of data from the Local Data Bank of Statistics Poland.

Figure 5.
Spatial distribution of the types of rural areas according to Stanny et al. [59].
Figure 5.
Spatial distribution of the types of rural areas according to Stanny et al. [59].


Table 1.
Variables used to construct a synthetic index of socio-economic development. Source: own elaboration.
Table 1.
Variables used to construct a synthetic index of socio-economic development. Source: own elaboration.
| Variables | Type 1 |
|---|---|
| non-working age population per 100 people of working age | D |
| population growth per 1000 people | S |
| balance of internal and foreign migration per 1000 people | S |
| clinics per 10,000 people | S |
| unemployed persons per 100 people of working age | D |
| employed persons per 1000 people of working age | S |
| foundations, associations and organizations per 10,000 people | S |
| sole proprietors per 1000 people | S |
| share of senior officials, managers and specialists in the total number of councillors (%) | S |
| net enrolment rate of grammar schools | S |
| number of housing allowances per 1000 residents | D |
| share of legally protected areas in the commune area (%) | S |
| difference between the percentage of population using the water supply system and the sewage system | D |
| average usable floor space of an apartment per 1 person (m2/person) | S |
| share of dwellings equipped with a flush toilet (%) | S |
| share of dwellings connected to a gas supply system (%) | S |
| investment expenditure of communes per 1 inhabitant (PLN/person) | S |
| PIT revenue per 1 inhabitant (PLN/person) | S |
| revenue from the agricultural tax per 1 inhabitant (PLN/person) | S |
| own income per capita (PLN/person) | S |
| financial and insurance entities per 10,000 people | S |
| commercial companies with foreign capital participation per 10,000 people | S |
1 S—stimulant, D—destimulant.
Table 2.
Commune structure in terms of the level of socio-economic development in synthetic terms: (a) by region; (b) by functional type; (c) by borders of former partitions. Source: own elaboration.
Table 2.
Commune structure in terms of the level of socio-economic development in synthetic terms: (a) by region; (b) by functional type; (c) by borders of former partitions. Source: own elaboration.
| Region | High | Average-High | Average | Average-Low | Low | Total | |||||
|---|---|---|---|---|---|---|---|---|---|---|---|
| no. | % | no. | % | no. | % | no. | % | no. | % | ||
| (a) by region | |||||||||||
| Dolnośląskie | 36 | 21.3 | 18 | 10.7 | 89 | 52.7 | 19 | 11.2 | 7 | 4.1 | 169 |
| Kujawsko-pomorskie | 14 | 9.7 | 8 | 5.6 | 54 | 37.5 | 19 | 13.2 | 49 | 34.0 | 144 |
| Lubelskie | 12 | 5.6 | 5 | 2.3 | 27 | 12.7 | 17 | 8.0 | 152 | 71.4 | 213 |
| Lubuskie | 13 | 15.9 | 7 | 8.5 | 49 | 59.8 | 8 | 9.8 | 5 | 6.1 | 82 |
| Łódzkie | 14 | 7.9 | 8 | 4.5 | 25 | 14.1 | 26 | 14.7 | 104 | 58.8 | 177 |
| Małopolskie | 28 | 15.4 | 14 | 7.7 | 122 | 67.0 | 11 | 6.0 | 7 | 3.8 | 182 |
| Mazowieckie | 55 | 17.5 | 13 | 4.1 | 51 | 16.2 | 31 | 9.9 | 164 | 52.2 | 314 |
| Opolskie | 7 | 9.9 | 7 | 9.9 | 43 | 60.6 | 11 | 15.5 | 3 | 4.2 | 71 |
| Podkarpackie | 15 | 9.4 | 8 | 5.0 | 110 | 68.8 | 16 | 10.0 | 11 | 6.9 | 160 |
| Podlaskie | 5 | 4.2 | 4 | 3.4 | 17 | 14.4 | 18 | 15.3 | 74 | 62.7 | 118 |
| Pomorskie | 23 | 18.7 | 8 | 6.5 | 67 | 54.5 | 20 | 16.3 | 5 | 4.1 | 123 |
| Śląskie | 55 | 32.9 | 22 | 13.2 | 73 | 43.7 | 10 | 6.0 | 7 | 4.2 | 167 |
| Świętokrzyskie | 6 | 5.9 | 1 | 1.0 | 29 | 28.4 | 32 | 31.4 | 34 | 33.3 | 102 |
| Warmińsko-mazurskie | 15 | 12.9 | 4 | 3.4 | 39 | 33.6 | 16 | 13.8 | 42 | 36.2 | 116 |
| Wielkopolskie | 41 | 18.1 | 10 | 4.4 | 118 | 52.2 | 32 | 14.2 | 25 | 11.1 | 226 |
| Zachodniopomorskie | 25 | 21.9 | 11 | 9.6 | 48 | 42.1 | 23 | 20.2 | 7 | 6.1 | 114 |
| total | 364 | 14.7 | 148 | 6.0 | 961 | 38.8 | 309 | 12.5 | 696 | 28.1 | 2478 |
| (b) by functional type | |||||||||||
| urban | 75 | 20.6 | 2 | 1.4 | 0.0 | 0.0 | 0.0 | 77 | |||
| % line | 97.4 | 2.6 | 0.0 | 0.0 | 0.0 | ||||||
| urban-rural | 185 | 50.8 | 31 | 20.9 | 31 | 3.2 | 0.0 | 0.0 | 247 | ||
| % line | 74.9 | 12.6 | 12.6 | 0.0 | 0.0 | ||||||
| rural-urban | 104 | 28.6 | 105 | 70.9 | 392 | 40.8 | 33 | 10.7 | 16 | 2.3 | 650 |
| % line | 16.0 | 16.2 | 60.3 | 5.1 | 2.5 | ||||||
| rural | 0.0 | 10 | 6.8 | 538 | 56.0 | 276 | 89.3 | 680 | 97.7 | 1504 | |
| % line | 0.0 | 0.7 | 35.8 | 18.4 | 45.2 | ||||||
| total | 364 | 148 | 961 | 309 | 696 | 2478 | |||||
| % line | 14.7 | 6.0 | 38.8 | 12.5 | 28.1 | ||||||
| (c) by borders of former partitions | |||||||||||
| Austrian | 54 | 14.8 | 29 | 19.6 | 235 | 24.5 | 22 | 7.1 | 13 | 1.9 | 353 |
| % line | 15.3 | 8.2 | 66.6 | 6.2 | 3.7 | ||||||
| Prussian | 198 | 54.4 | 77 | 52.0 | 511 | 53.2 | 133 | 43.0 | 87 | 12.5 | 1006 |
| % line | 19.7 | 7.7 | 50.8 | 13.2 | 8.6 | ||||||
| Russian | 112 | 30.8 | 42 | 28.4 | 215 | 22.4 | 154 | 49.8 | 596 | 85.6 | 1119 |
| % line | 10.0 | 3.8 | 19.2 | 13.8 | 53.3 | ||||||
| total | 364 | 148 | 961 | 309 | 696 | 2478 | |||||
| % line | 14.7 | 6.0 | 38.8 | 12.5 | 28.1 | ||||||
Table 3.
Test results of the relationship between the level of socio-economic development and the location within the borders of the former partitions and the functional type. Source: own elaboration.
Table 3.
Test results of the relationship between the level of socio-economic development and the location within the borders of the former partitions and the functional type. Source: own elaboration.
| Statistics | Level of Socio-Economic Development vs. | |
|---|---|---|
| Location in Partitions | Functional Type | |
| alfa | 0.001 | 0.001 |
| χ2 Pearson | 744.69 | 2058.49 |
| df | 8 | 12 |
| p-value | <0.000001 | <0.000001 |
| Pearson’s C contingency coefficient | 0.4807 | 0.6736 |
| Pearson’s C contingency coefficient (max) | 0.8165 | 0.8660 |
| Pearson’s C contingency coefficient (adj) | 0.5887 | 0.7778 |
| Cramer’s V contingency coefficient | 0.3876 | 0.5262 |
Publisher’s Note: MDPI stays neutral with regard to jurisdictional claims in published maps and institutional affiliations. |
© 2021 by the authors. Licensee MDPI, Basel, Switzerland. This article is an open access article distributed under the terms and conditions of the Creative Commons Attribution (CC BY) license (https://creativecommons.org/licenses/by/4.0/).
Share and Cite
MDPI and ACS Style
Churski, P.; Herodowicz, T.; Konecka-Szydłowska, B.; Perdał, R. Spatial Differentiation of the Socio-Economic Development of Poland–“Invisible” Historical Heritage. Land 2021, 10, 1247. https://doi.org/10.3390/land10111247
AMA Style
Churski P, Herodowicz T, Konecka-Szydłowska B, Perdał R. Spatial Differentiation of the Socio-Economic Development of Poland–“Invisible” Historical Heritage. Land. 2021; 10(11):1247. https://doi.org/10.3390/land10111247
Chicago/Turabian StyleChurski, Paweł, Tomasz Herodowicz, Barbara Konecka-Szydłowska, and Robert Perdał. 2021. "Spatial Differentiation of the Socio-Economic Development of Poland–“Invisible” Historical Heritage" Land 10, no. 11: 1247. https://doi.org/10.3390/land10111247
Note that from the first issue of 2016, this journal uses article numbers instead of page numbers. See further details here.