
Grain Size Characteristics of Sediments Found in Typical Landscapes in the Playa of Ebinur Lake, Arid Central Asia


1
State Key Laboratory of Desert and Oasis Ecology, Xinjiang Institute of Ecology and Geography, Chinese Academy of Sciences, Urumqi 830011, China
2
CAS Research Center for Ecology and Environment of Central Asia, Urumqi 830011, China
3
College of Resources and Environment, University of Chinese Academy of Sciences, Beijing 100049, China
*
Author to whom correspondence should be addressed.
Land 2021, 10(11), 1132; https://doi.org/10.3390/land10111132
Submission received: 7 September 2021
/
Revised: 21 October 2021
/
Accepted: 22 October 2021
/
Published: 25 October 2021
(This article belongs to the Section Soil-Sediment-Water Systems)
Abstract
:A playa usually refers to a salt desert landscape mainly composed of loose and fine lacustrine sediments. Severe wind erosion on a playa causes the playa to become a source of dust and salt dust and poses a threat to vast areas downwind. Currently, little is known about the impact of wind erosion on the particle size distribution of sediments in different landscapes in the playa. In the present study, six dominant different landscapes in a natural state with the same sedimentary environment in the playa of Ebinur Lake were selected to provide insights into the different characteristics of particle size distribution under the effect of long-term wind erosion. The results reveal that the grain-size composition clearly differed among different landscapes. All samples had a common dominant size group consisting of very fine sand and sand. The very fine sand and sand content of Haloxylon ammodendron desert zone (LS5) was the lowest, while the clay and silt content was the highest at both depths among the six landscapes. The lowest clay and silt fraction and highest sand fraction appeared in the herbal desert zone (LS3) at both depths. Almost all of the sediment samples were of a bimodal distribution mode, with significant differences. The cumulative curve showed a similar S-shape, while the probability cumulative curve showed an inverted S-shape with three subpopulations of granularity characteristics. The smallest mean particle diameter appeared in LS5. The majority of the sediments were moderately to poorly sorted. The mean particle size of the sediments from the six landscapes was significantly different (p < 0.05), while no significant difference was observed among the other three parameters. Generally, it can be inferred that LS5 can reduce wind speed effectively, probably due to the smaller leaves and dense branches of Haloxylon ammodendron, which results in a high level of coverage. The results of the present study will have some implications for the grain size characteristics for changes in intensity in regional wind erosion environment and will also have some basis for wind erosion prevention and control in the playa of Ebinur Lake.
1. Introduction
A playa usually refers to a discharging intracontinental basin with a negative water balance, remaining dry for 75% of the year, and is often associated with evaporites in arid and semi-arid land [1,2]. Specifically, playas are a salt desert landscape that came into being after the existing water balance was broken by climate change and human activity; they are mainly composed of loose and fine lacustrine sediments with a high salt content which accumulate due to the evaporation of highly mineralized groundwater in tail-end lake basins. Playas are mainly located in arid central Asia, the western United States, North Africa, Australia, and other arid and semi-arid places around the world [3,4,5].
Arid regions receive a lot of attention, since they compose 41% of the world’s surface area and are occupied by 2 billion people [6]. Most arid land, especially the arid central Asia, is characterized by the typical mountain-oasis-desert ecosystem, in which terminal lakes play a critical role [7]. However, anthropogenic activities related to water resource consumption and land resource excess reclamation have caused a great negative impact on the water balance within tail-end lake basins in the past few decades, leading to the rapid shrinking or drying up of tail-end lakes, such as Ebinur Lake in the western lowest part of the Junggar basin [8], Lop Nor in the Tarim Basin [9], the Aral Sea and Balkhash Lake in central Asia [10,11,12,13], Hamoun Lake [14] and Urmia Lake [15,16,17] in Iran, the Owen Lake and the Salton Sea in USA [18], and Chad Lake in North Africa [19,20]. Salts, heavy metals and other substances that sank to the bottom the lake in the past move to the playa’s surface because of the strong evaporation and the capillary effect within the shrinking lake area, forming a salt desert landscape, a unique and distinct landscape in arid central Asia [21,22]. Strong wind erosion on salt desert landscapes leads to the frequent occurrence of dust storms (dust, sand, salt-alkali dust and salt-alkaline mixed dust storms) from playas, which have imposed and will continue to impose negative effects on the growth of animals and plants, pollute the air and water quality, endanger human health, and even lead to the deterioration of regional ecosystems and the natural environment after long-distance transmission by means of natural airflow [20,23,24,25,26].
Standard grain size analysis is one of the most important means to distinguish among sedimentary environments, to identify the water or wind conditions that shaped the deposition environment as well as to determine the transportation and sorting of aeolian particles [27,28]. Therefore, this method and technique is widely used to determine and compare lake, aeolian, and river environments [28]. Wind erosion is a major driver of soil degradation particularly in the world’s drylands, which can generate sorting or differentiation of surface substances on the ground, resulting in soil redistribution and textural changes in topsoil [29,30,31]. Particle size distribution thus can reflect the prevalence of wind erosion in one region. Considerable effort has recently been devoted to understanding the relationship between grain size variation and vegetation cover. Miri, et al. [32] suggested that vegetation morphology and structure must be priority parameters in facilitating aeolian erosion control. Nicholas et al. [33] indicated that canopy gap size distribution and vegetation height are critical indicators of wind erosion and its management implications. Zhang et al. [34] investigated how a vegetation pattern is generated and affected by wind in arid and semi-arid areas. Touré, et al. [35] highlighted the sensitivity of wind erosion to vegetation, showing that even a low cover rate has a strong impact on wind erosion. In Iran, Khusfi et al. [36] and Khusfi et al. [37] observed a significant negative relationship between the Enhanced Vegetation Index (EVI) and Dust Storm Index (DSI) changes in the spring season. Based on observations and wind tunnel tests, Cheng et al. [38] quantitatively established the relationship between the wind erosion rate and its effect on vegetation-covered soil surfaces. Kergoat et al. [39] showed that vegetation anomalies explain 43% of the year-to-year variance in Sahelian mean dry-season aerosol optical depth (AOD). Lee et al. [40] demonstrated the qualitative and quantitative influence that vegetation has on stabilizing desert dunes. The effects of different levels of vegetation coverage, soil moisture and wind speed on wind erosion was explored by Meng et al. [41] inside an enclosed desert steppe in Inner Mongolia, which indicated a significant spatial difference in wind erosion intensities. The effects of different vegetated landscapes with different vegetation covers and structures in slowing down the wind speed through drag partitions are different, so the anti-erosion effect is also quite different for different plants [42,43,44,45]. A grain size study on the variation of particle size distribution of the soil/sediment from different landscapes, to a certain extent, will help us to understand the anti-erosion effect of different landscapes and change the trend of particle size distribution. Therefore, further studies are required to fill the gaps in the knowledge regarding the relationships between different vegetation types and particle size variation. The findings of this kind of study are of great significance for calibrating wind erosion prediction models, evaluating wind erosion control mechanisms, and can also provide a solid foundation for developing effective biological and engineering control measures of a vegetation-covered surface.
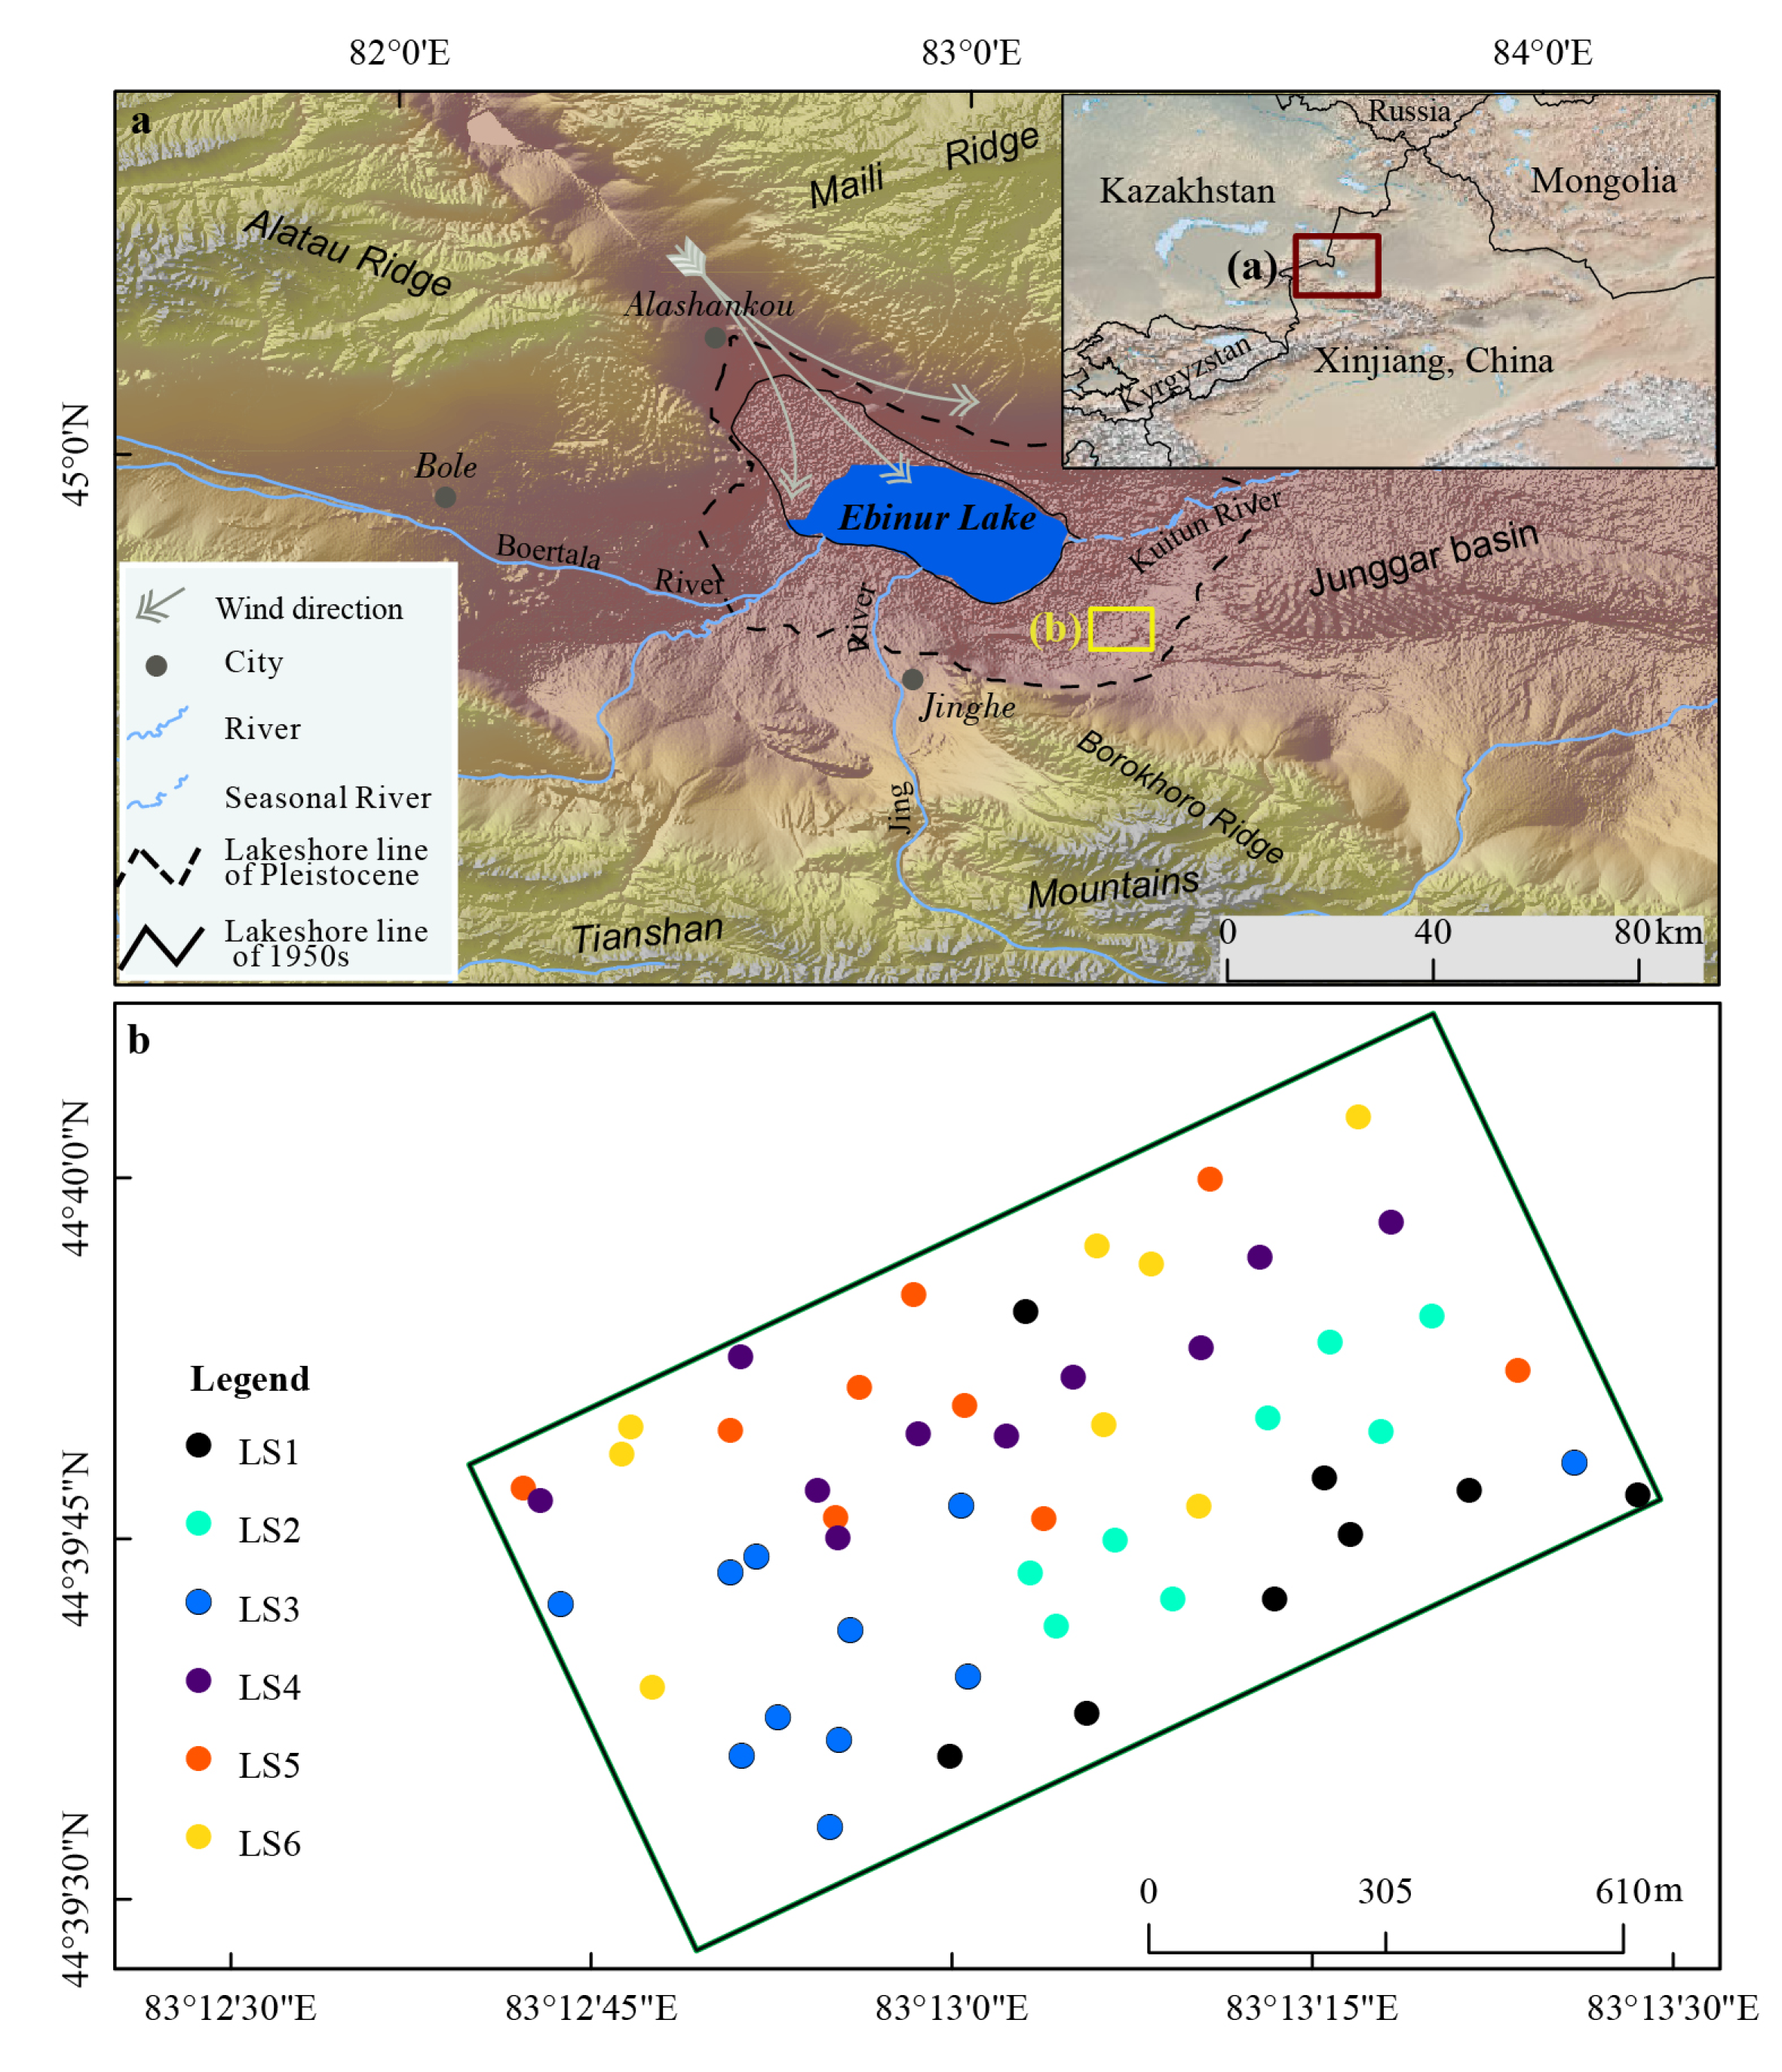
Ebinur Lake is located in the western part of Junggar basin, northwest China (Figure 1a(a)). A large area of the salt desert landscape formed in the dry lake bed under the influence of climate change and human activities. Strong airflows from the Alashankou (gate of Junggar Basin) determines the development of wind erosion in this region [46], and dust (salt) storms caused by wind erosion can increase soil salinization in downwind areas, accelerate snow and ice melt in mountain areas, and affect vegetation growth by affecting normal photosynthesis [47,48] around the region. Currently, little is known about the impact of wind erosion on the particle size distribution of sediments in different landscapes within the playa of Ebinur Lake in arid central Asia. In the present study, six dominant different landscapes in a natural state with the same sedimentary environment were selected to provide insights into the different characteristics of the particle size distribution under the effect of wind erosion at a small regional scale, and the results will explain the difference and changes in particle size composition in different landscapes, provide a basis for understanding the quantitative relationship between vegetation and aeolian processes, and provide a basis for the selection of biological and physical measures to control wind erosion in the playa in arid zones around the world.
2. Materials and Methods
2.1. Regional Setting and Wind Erosion
Ebinur Lake basin is surrounded by mountains in the south, west and north (Figure 1a), and lies in the southwest border region of the Junggar basin in arid central Asia with an area of 50,321 km2 [8,49]. Ebinur Lake is the lowest water collection point of the basin (82°35′–83°10′ E, 44°54′–45°09′ N) and is the tail-end lake of the Boertala River and Jing River, at present. This region has a typical temperate continental climate characterized by rare precipitation, strong evaporation and perennial winds. The number of days per year with wind speeds greater than 8 m/s is up to 164 days, and the maximum instantaneous wind speed can peak at 55 m/s [50].
Since the second half of the 20th century, Ebinur Lake has undergone a rapid decline in area due to the coupled impact of regional climate fluctuations and human activities, leading to the formation of an area of about 1000 km2 of modern salt desert landscape (Figure 1a). Severe wind erosion on the surface sediments rich in sulphates and chlorides occur in spring and autumn, causing the playa of Ebinur Lake to be a source of dust and salt dust and thus posing a threat to farming and animal husbandry in vast areas downwind, as well as a serious threat to the ecological security of oases along the north-facing slope of the Tianshan Mountains.
2.2. Samples and Analytical Methods
The present study selected a flat terrain zone with different vegetation types and the same hydrodynamic conditions to ensure no significant differences in sedimentary environments. Sediments of 0–30 cm and 30–60 cm from six typical different vegetation types (Table 1) were sampled using the Eijkelkamp stainless steel soil sampler in the historical playa within the southeastern region of Ebinur Lake (Figure 1b, about 1500 m length, 1000 m width). In total, one hundred and eight samples weighing 500 g each were collected from the chosen zone. The geographical position, status of vegetation and characteristics of sediments around the sample sites were also recorded (Table 1). Wind erosion in Ebinur Lake playa mainly occurs from April to July every year, and therefore the sampling time was selected to be in June, after severe wind erosion.
Sediment samples were air dried, crushed and passed through a 2 mm mesh, and the plant roots, sand and other gravel-sized materials were removed by hand. Before each measurement, chemical pretreatment was performed to remove the organic matter and to provide discrete particles for further processing. The particle size distribution of samples was analyzed by using the Malvern Mastersizer laser grain size analyzer 2000, with a measurement range from 0.02 μm to 2000 μm, and this resulted in a better than 2% accuracy and a better than 2% variation in terms of reproducibility. The salt content was also measured after pretreatment by means of the residue-drying method. Firstly, 1:5 soil:water suspensions were prepared by weighing 50 g of soil in a 500 mL triangular flask, adding 250 mL of deionized water, and shaking for 3 min on an end-over-end shaker. The soil:water extracts were used for further analysis after suction filtration. Then, we took a certain amount of soil:water extract and placed it in a 100 mL porcelain evaporating dish, evaporated the water from the soil:water extracts in a water bath, oxidized the organic matter with hydrogen peroxide, dried it in an oven at 105–110 °C and weighed it to obtain the qualities of the dried residue, namely the salt content.
Particle size analysis is mainly used to study the structural characteristics of sediments (particle size and particle size distribution). In this paper, the values of particle size distribution were converted to the Φ (phi) unit, and the Folk and Ward [51] formula was used to obtain particle-size parameters of sediments from different landscapes. Duncan’s multiple testing methods were used for multiple comparisons of size parameters from different landscapes, for which p < 0.05 indicated that the difference was significant.
3. Results
3.1. Grain Size Composition of Sediments from Six Different Landscapes
The classification of the grain size composition intuitively expresses the fraction of different grain size groups. According to the grain size classification criteria for sediment of Friedman and Sanders [52], the grain size composition of the sediments from six different landscapes is divided into 11 levels (Table 2). The grain size composition clearly differed among different landscapes. All samples had a common dominant size group that consisted of very fine sand and sand, accounting for around seventy percent, with a size mainly ranging from 63 μm to 500 μm. The grain size composition of the top layer (0–30 cm) of sediment from the six landscapes had distinct and significant differences, except for the very fine sand, coarse sand and very coarse sand; however, that of the lower depth (30–60 cm) showed no significant differences, except for medium sand. Generally speaking, the very fine sand, medium sand and sand content of LS5 was the lowest at both depths (55.57% and 57.97%), while the clay and silt content was the highest at both depths (43.92% and 41.15%) among the six landscapes, indicating that wind erosion presumably imposed a lighter impact on LS5 because of the vegetation coverage and morphological characteristics of vegetation. LS1 and LS6 demonstrated little difference in the sand and clay content in the top layer, but the difference in the lower layer was obvious. The lowest clay and silt content appeared in LS3 in both depths, which was not very different from LS2 and LS4. This trend also applied to sand of LS3, LS2 and LS4 with intermodulation. It must be mentioned that the clay and silt proportion from LS6 was significantly lower than that of LS5 at both depths; this is what we must and will pay more attention to in the Discussion section.
The frequency, cumulative and log-probability cumulative curves of the grain size distribution sediments from different landscapes present a lot of useful information on particle size components and their transport patterns. Creep, saltation and suspension subpopulation can be observed from the curves concretely and easily [53].
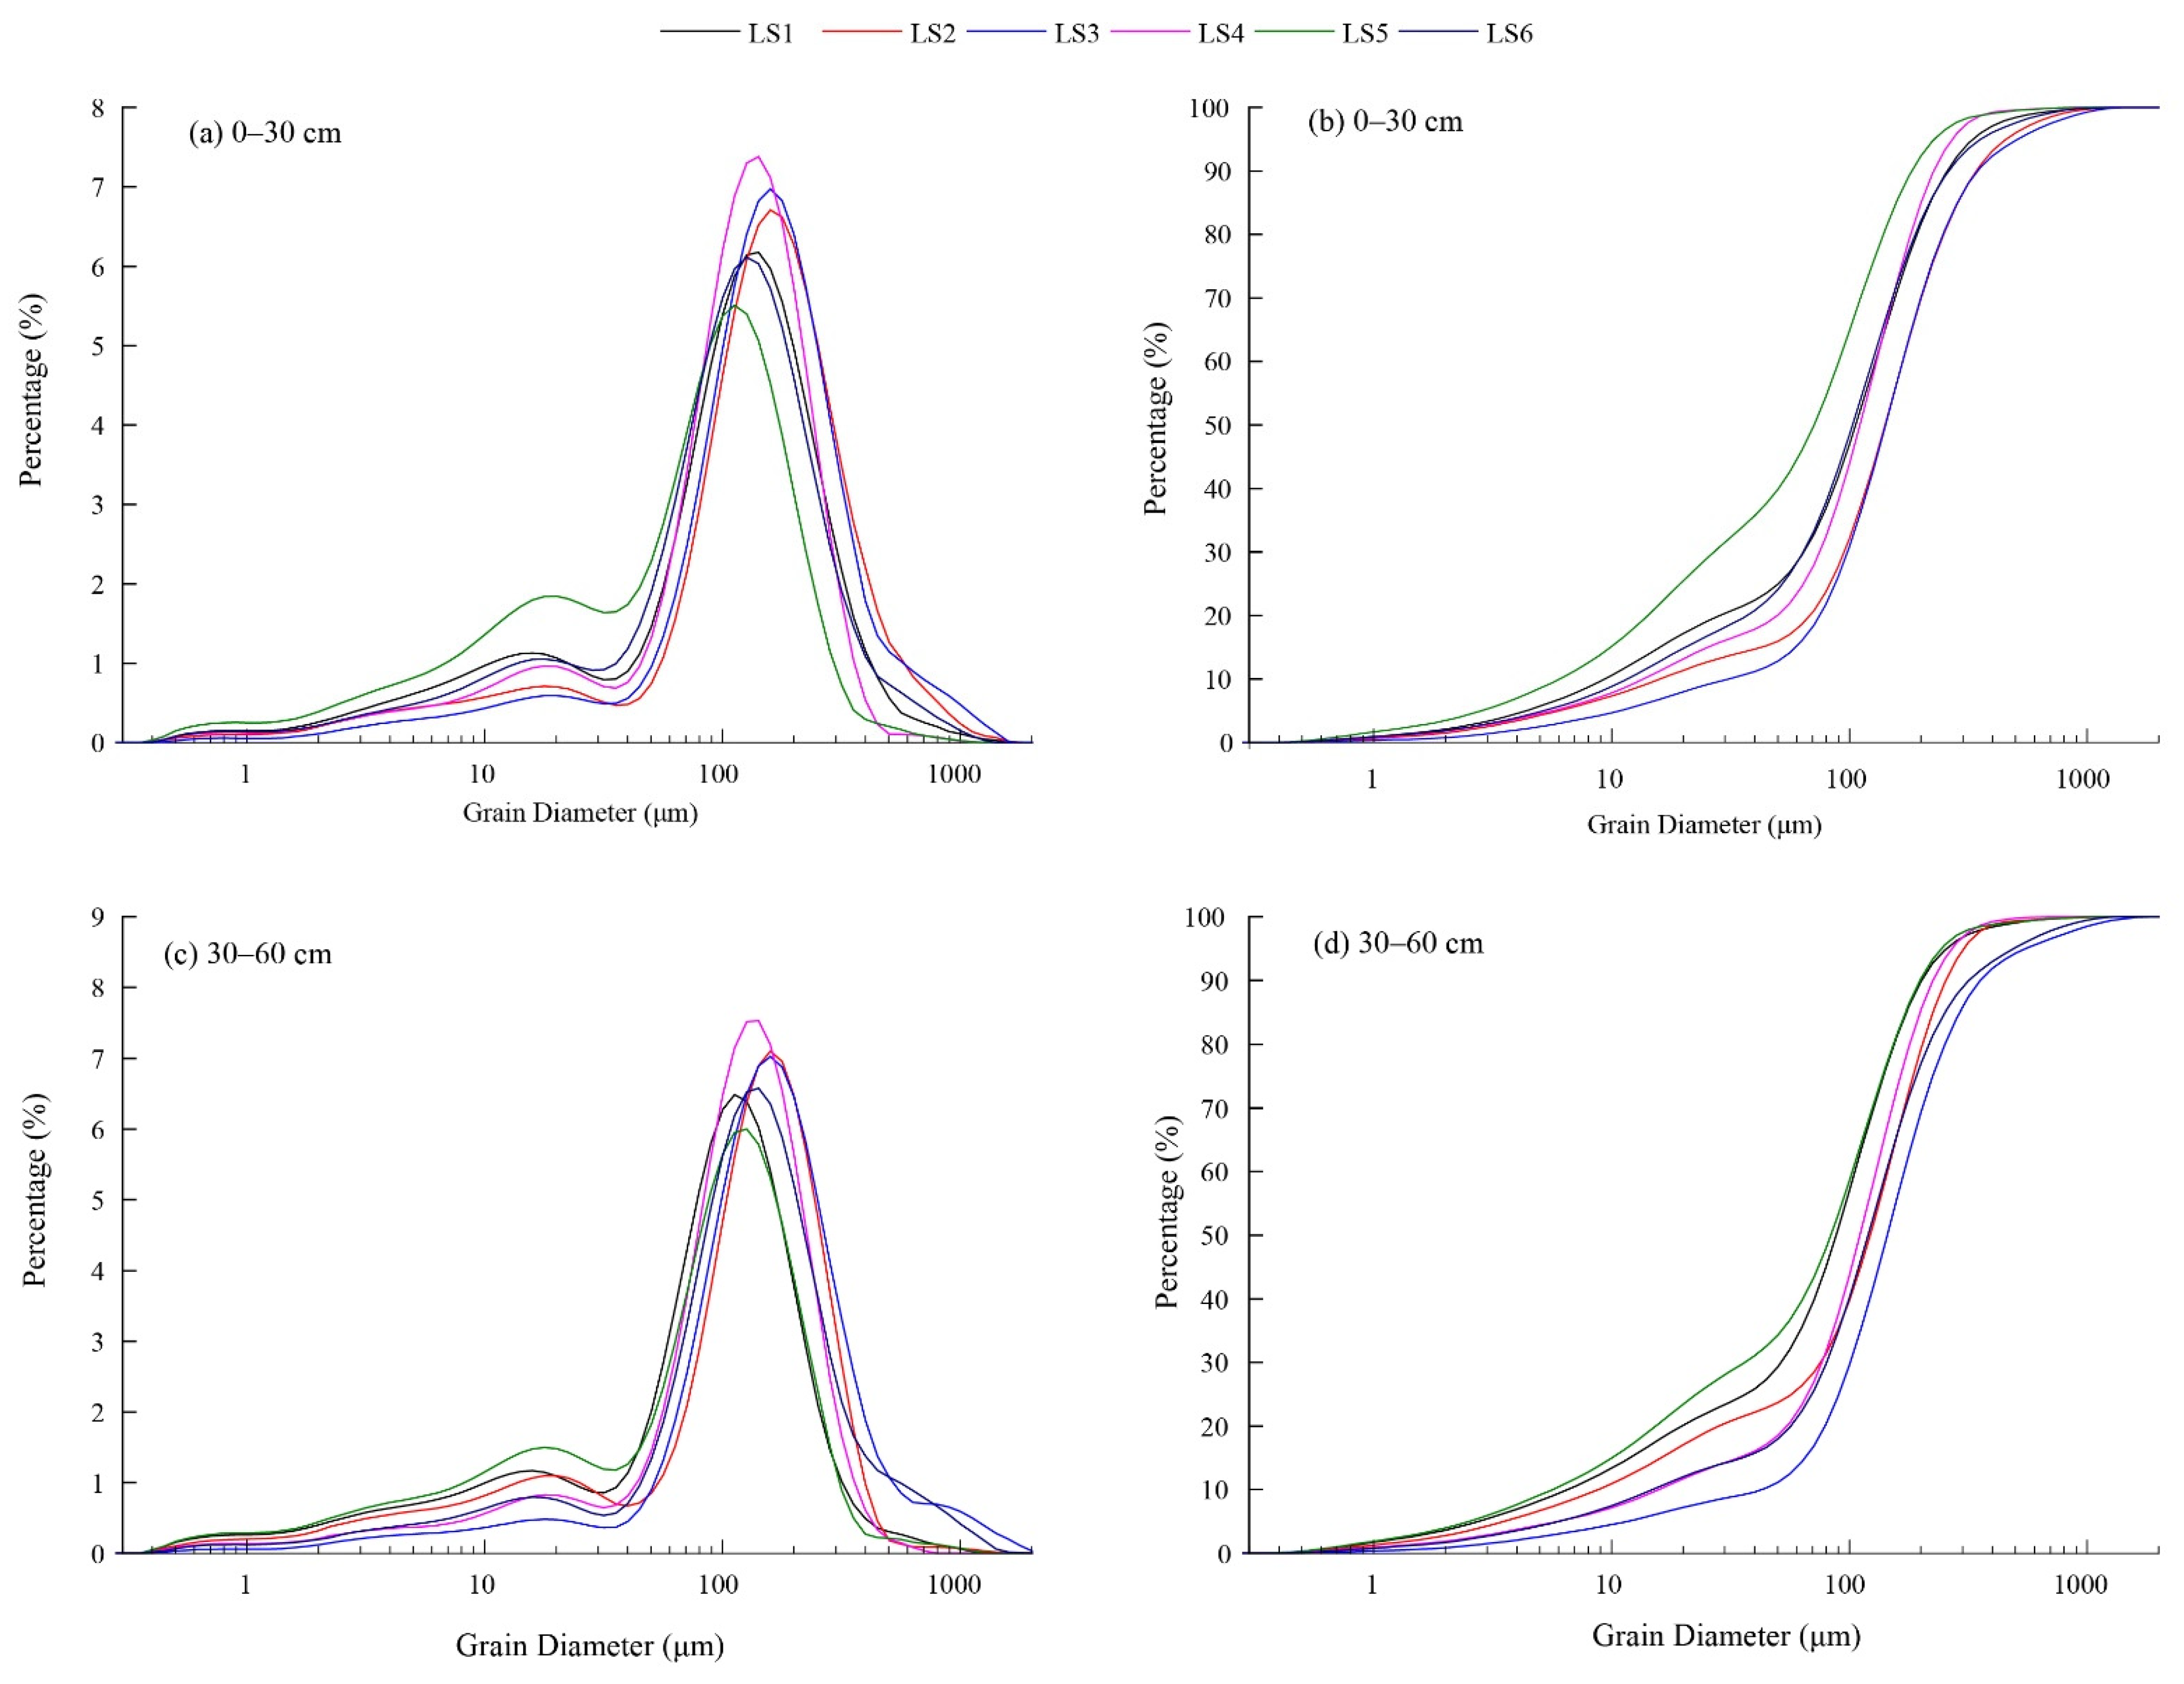
Almost all of the sediment samples were of a bimodal distribution mode with significant differences (Figure 2). From LS1 to LS6 (Figure 2a), the first crest particle size was around 20 μm, with this crest being highest in LS5; the second crest particle sizes ranged from 100 μm to 170 μm, and the percentage of grain size composition ranged from 5% to 7%, with the lowest in LS5 being around 100 μm, and the highest in LS4 being around 150 μm in grain diameter. The crest particle sizes at lower depths ranged from 110 μm to 190 μm, and the percentage of grain size composition ranged from 6% to 7.5%, with the same trend in the upper layer (Figure 2c). LS1 and LS6 showed the same trend in both depths, as did LS2 and LS3. The percentage of grain size composition in LS6 showed no significant differences compared to the other landscapes. These observations indicated the strengthening of wind activity among different landscapes. This characteristic is also in accordance with the observations of grain size composition mentioned previously.
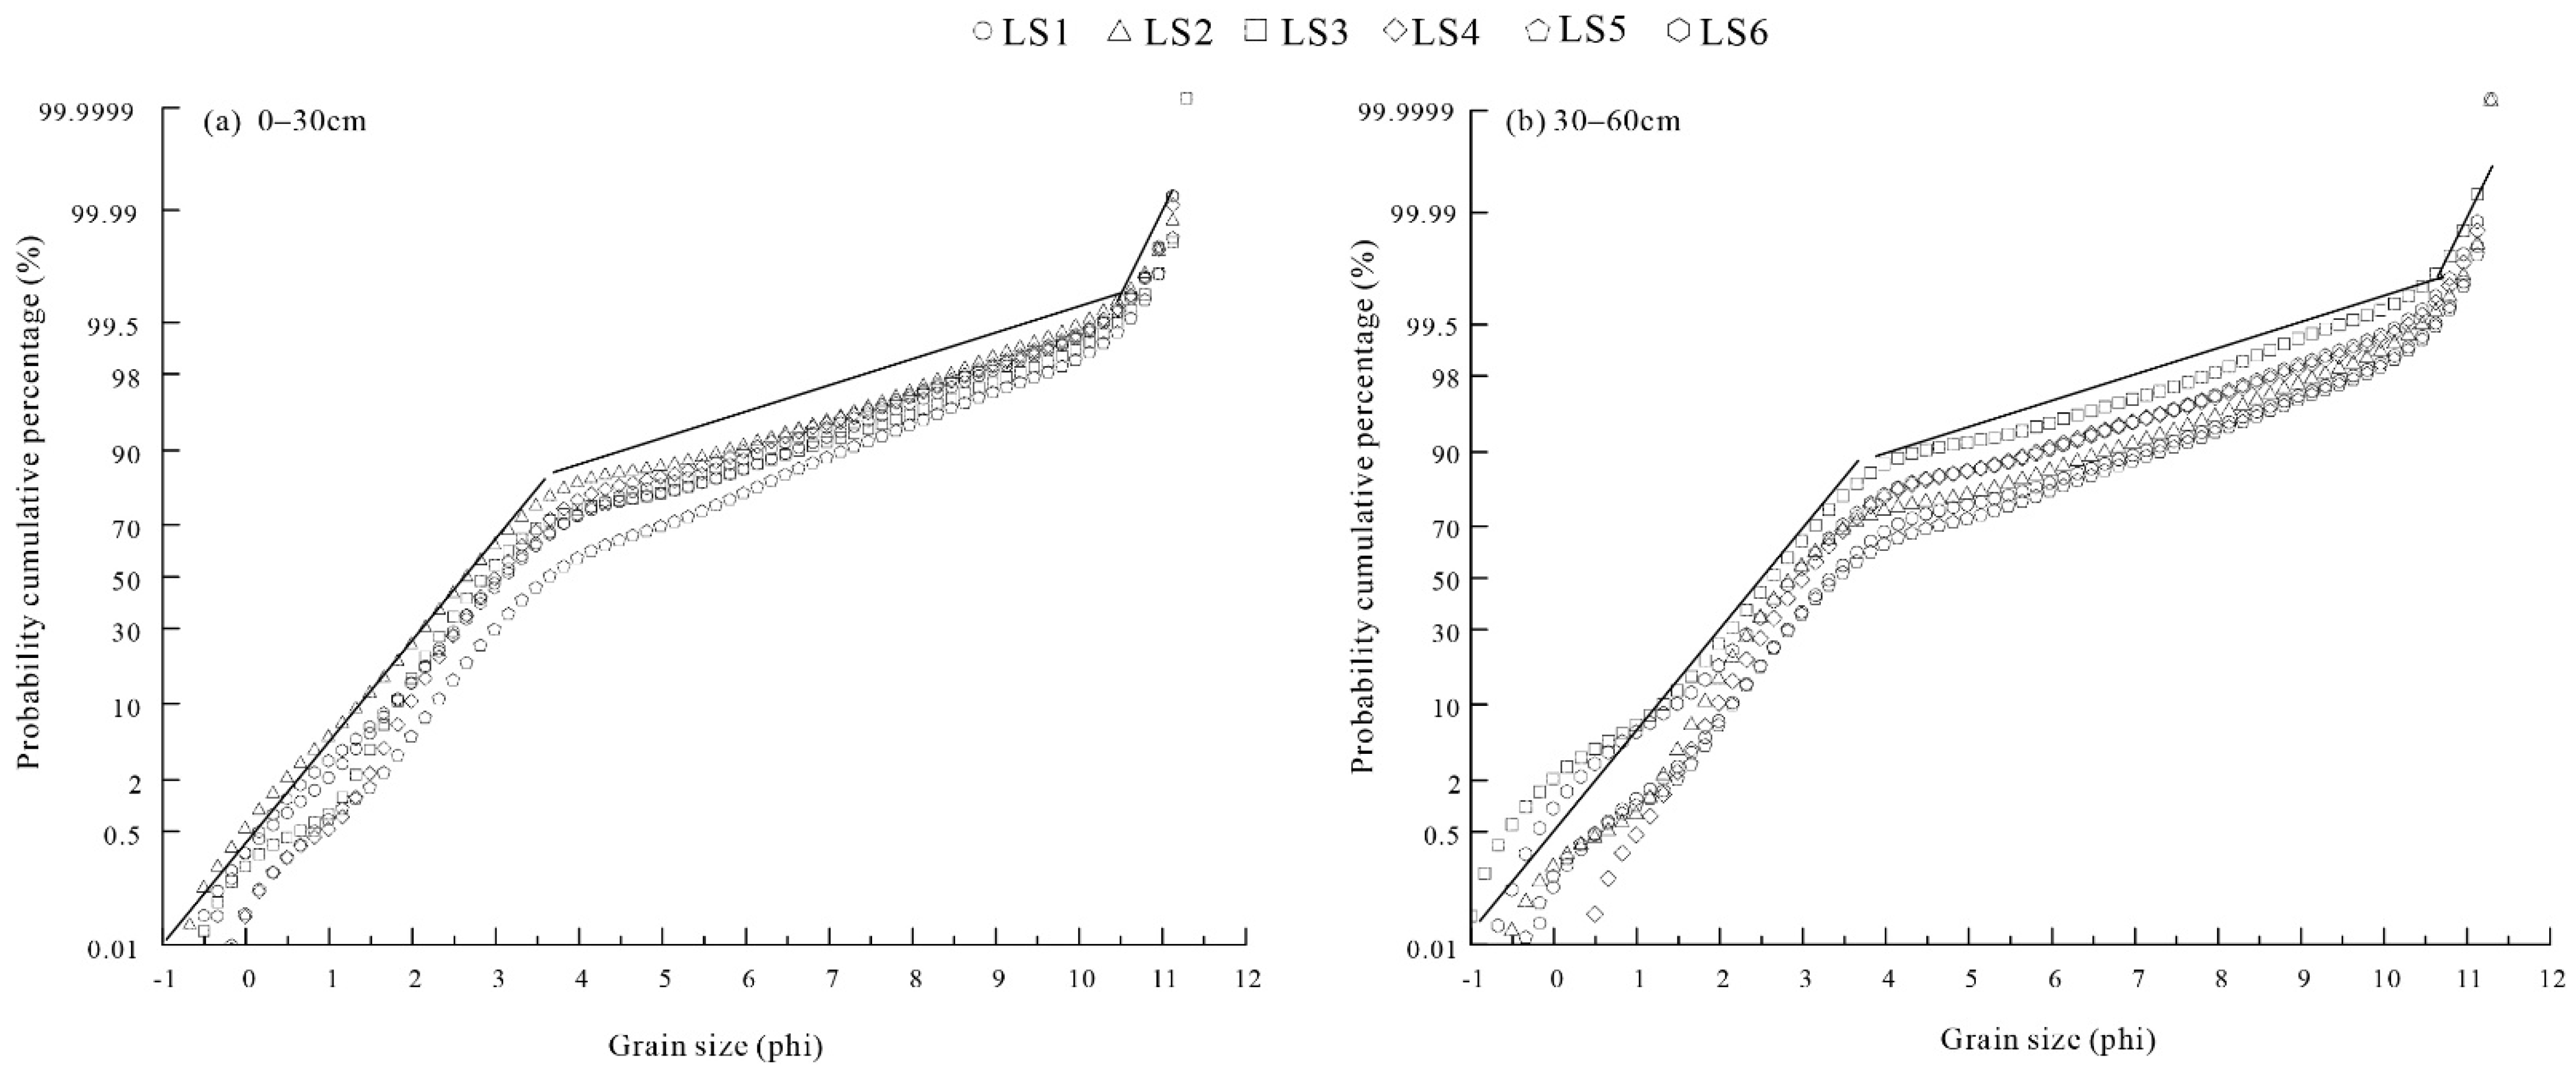
The cumulative curve of all samples showed a similar S-shape (Figure 2). The cumulative curve of LS5 almost transformed into a linear shape because of the similar contents of the different size groups in the top layer (Figure 2b), which showed a significant difference from other landscapes. All the sediments from different landscapes at the lower depths have a similar shaped cumulative curve that shared the same gradient with a small creep population (Figure 2d). These different characteristics of sediment subpopulations from different landscapes at different depths can be clearly seen from the log-probability cumulative curves (Figure 3). For all the samples, there were three subpopulations, namely creep, saltation and suspension, which were truncated at almost the same point, about 3.50 Φ (creep group) or 10.60 Φ (suspension group). The creep and saltation subpopulation accounted for the majority, while the suspension subpopulation only occupies a small proportion. This indicated that sediments were transported by the same saltation processes with different sorting parameters. It can be seen more clearly that the saltation subpopulation (3.50–10.60 Φ) in LS5 was the highest and those in LS2 and LS3 were the lowest among the six landscapes, while the creep (2.00–3.50 Φ) and suspension (10.60–11.50 Φ) subpopulations, which are not as susceptible to wind erosion, were the lowest for both depths at present, which was the same as in the previous analysis. There were no significant differences in the content of the three subpopulations of sediments among the other five landscapes, especially LS6.
3.2. Grain Size Parameters of Sediments from Six Different Landscapes
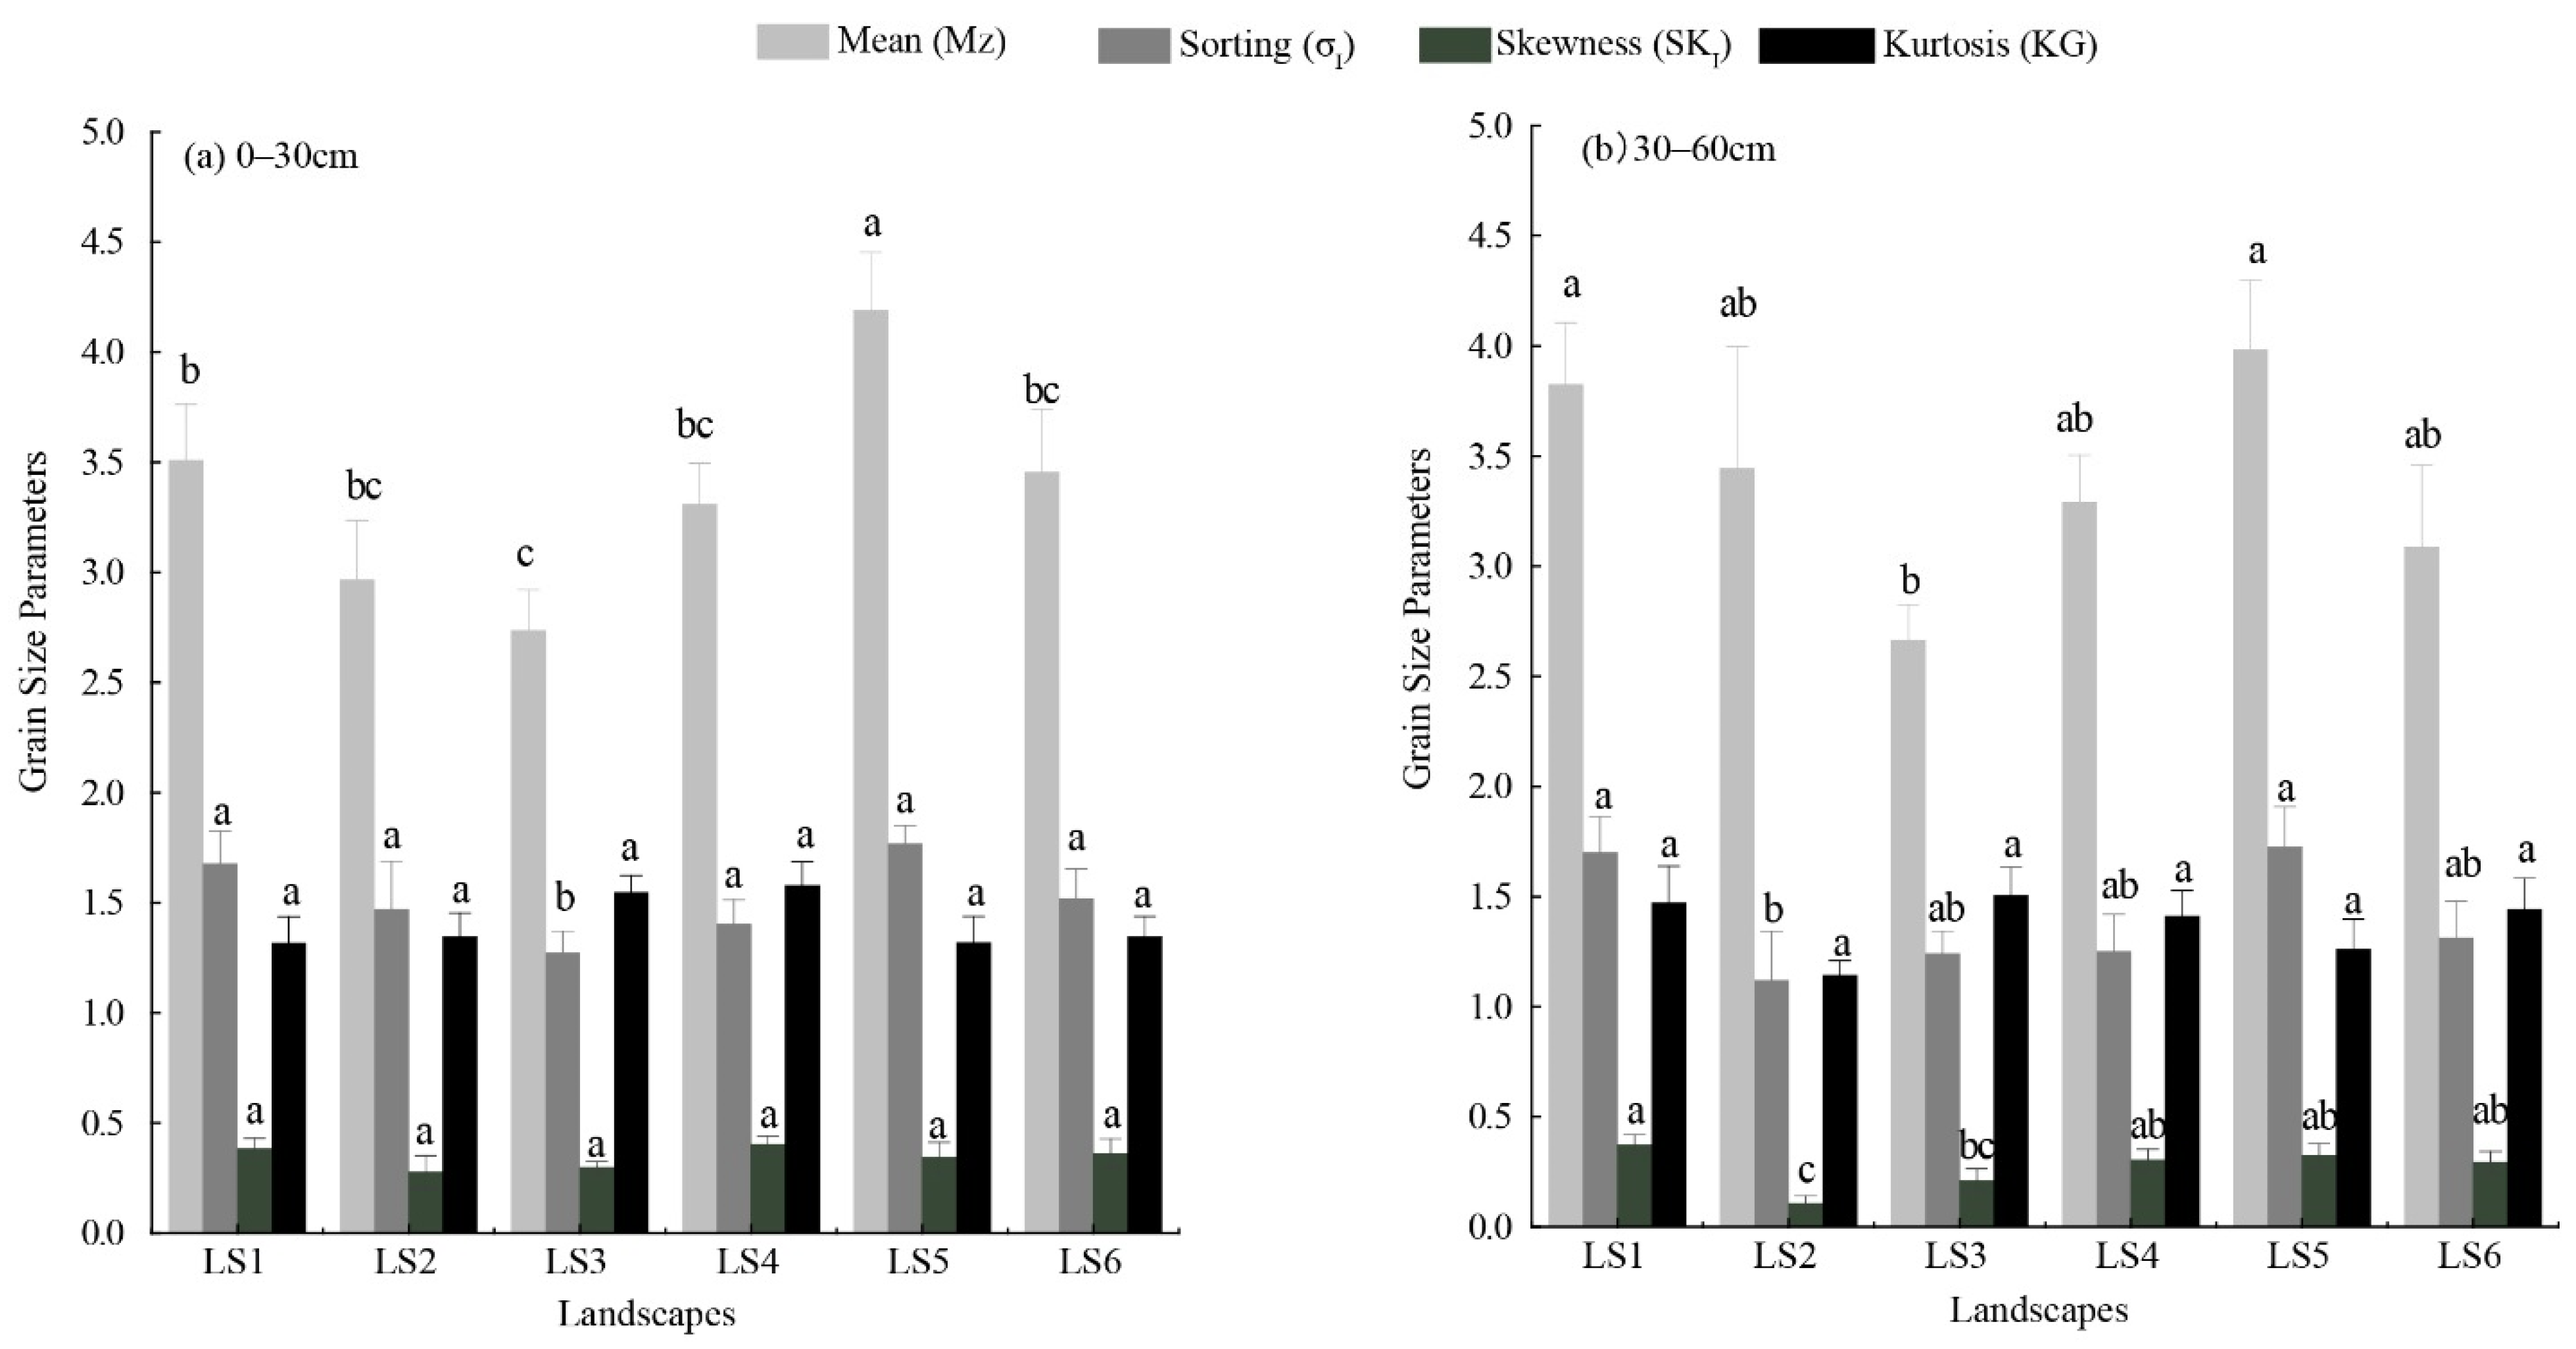
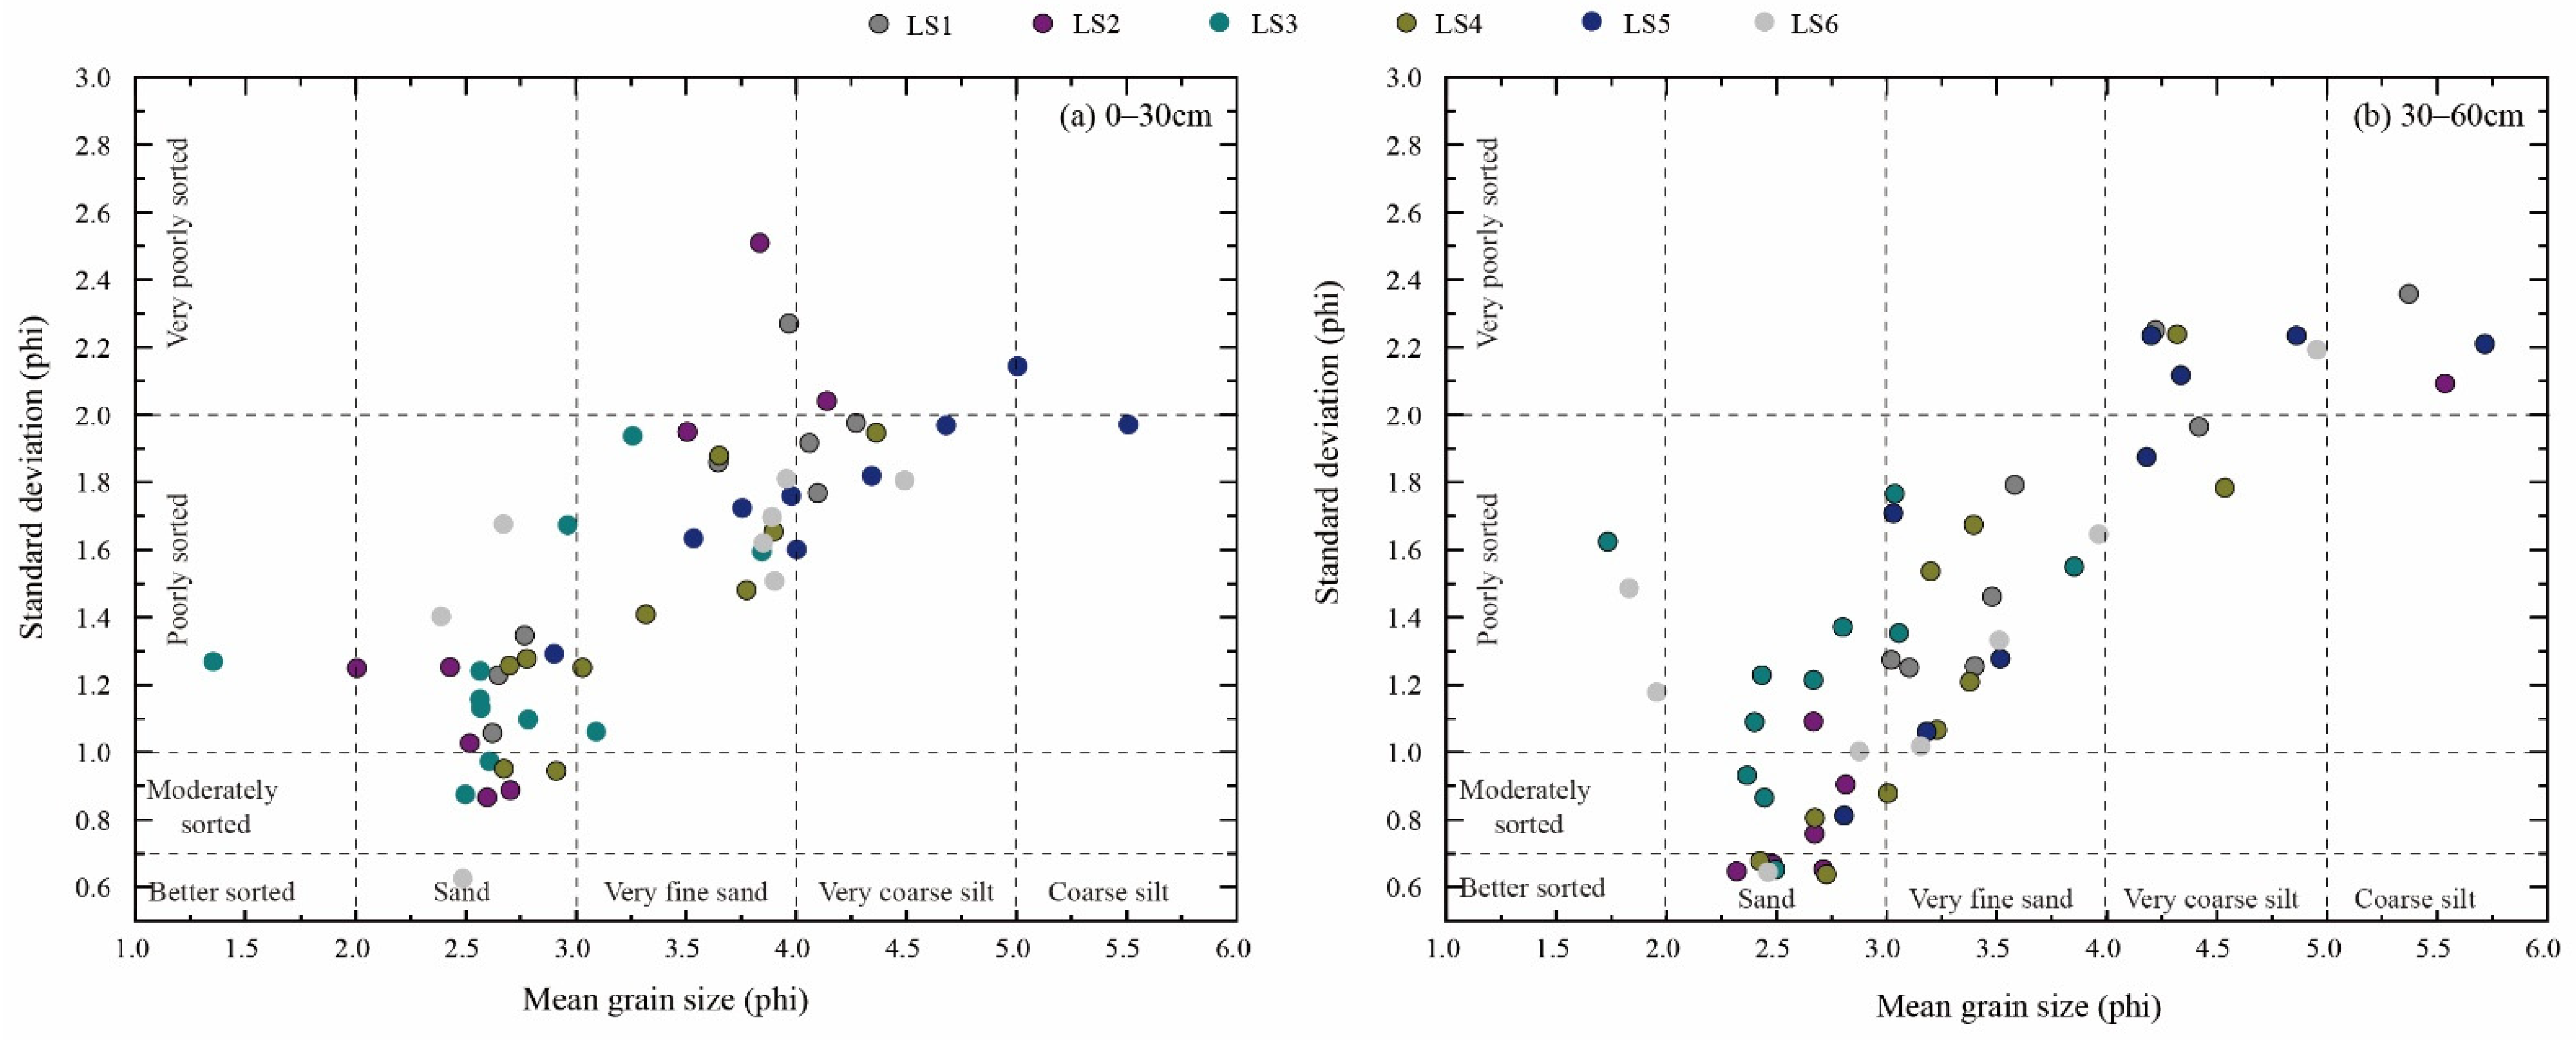
The mean particle size of the sediments from six landscapes showed significant differences (p < 0.05), while no significant differences were observed among the other parameters (standard deviation, skewness and kurtosis) (Figure 4). The largest mean particle diameter (4.36 Φ) appeared in LS5 at both depths, indicating that the particle size distribution mainly consisted of very coarse silt and clay (31–63 μm); compared with other landscapes, this makes this area very susceptible to wind erosion, and the same results were shown in the previous section. LS3 demonstrated the smallest mean particle size in both layers, with a significant difference from LS5 (2.90 Φ and 2.83 Φ for top and lower layers, respectively). The mean particle size, standard deviation, skewness and kurtosis of LS6 show no significant differences with sediments from other landscapes. In general, the range of the mean particle size of the surface layer is larger than that of the lower layer. The mean particle sizes in the surface layer in LS1 and LS2 are larger than those in the lower layers at a depth of 30–60 cm, and those of the surface layer in LS3, LS4, LS5, LS6 are smaller than those in the layer at a depth of 30–60 cm. This indicates that LS1 and LS2 contain more clay and silt than the lower layer, while the clay and silt content in LS3, LS4 and LS5 have reduced, probably due in part to the more serious wind erosion.
The spatial distribution of the standard deviation (σI) of the sediments collected from six landscapes showed that the majority of the sediments were moderately to poorly sorted, with a value between 0.8 and 2.4 (Figure 5). The variation of the standard deviation (σI) of the sediments showed that sorting generally decreased from LS1 to LS6. This sorting was generally due to the decrease in the grain size of top sediments. Sands collected from the upper depth are moderately to poorly sorted; however, sands of the lower depth were better to moderately sorted. Very fine sand and very coarse silt were mostly poorly to very poorly sorted at both depths. Overall, LS2 and LS3 were moderately sorted, and LS5 was mostly in the poorly sorted category. This correlation showed that finer sediments are characterized by poor sorting.
The distribution of the skewness of the superficial sediments showed that LS5 and LS6 were generally dominated by very positively skewed very fine sand and very coarse silt (0.35 < SKI < 0.55), with the exception of LS3, which was dominated by positively skewed sand and very fine sand at the depth of 0–30 cm. This same pattern was observed at the lower depth. The variation of the skewness of sediments showed no obvious trends from LS1 to LS6. The correlation between the mean grain size and the skewness showed that the majority of sands were positive and very positively skewed. However, very fine sand and very coarse silt were very positively skewed (Figure 6).
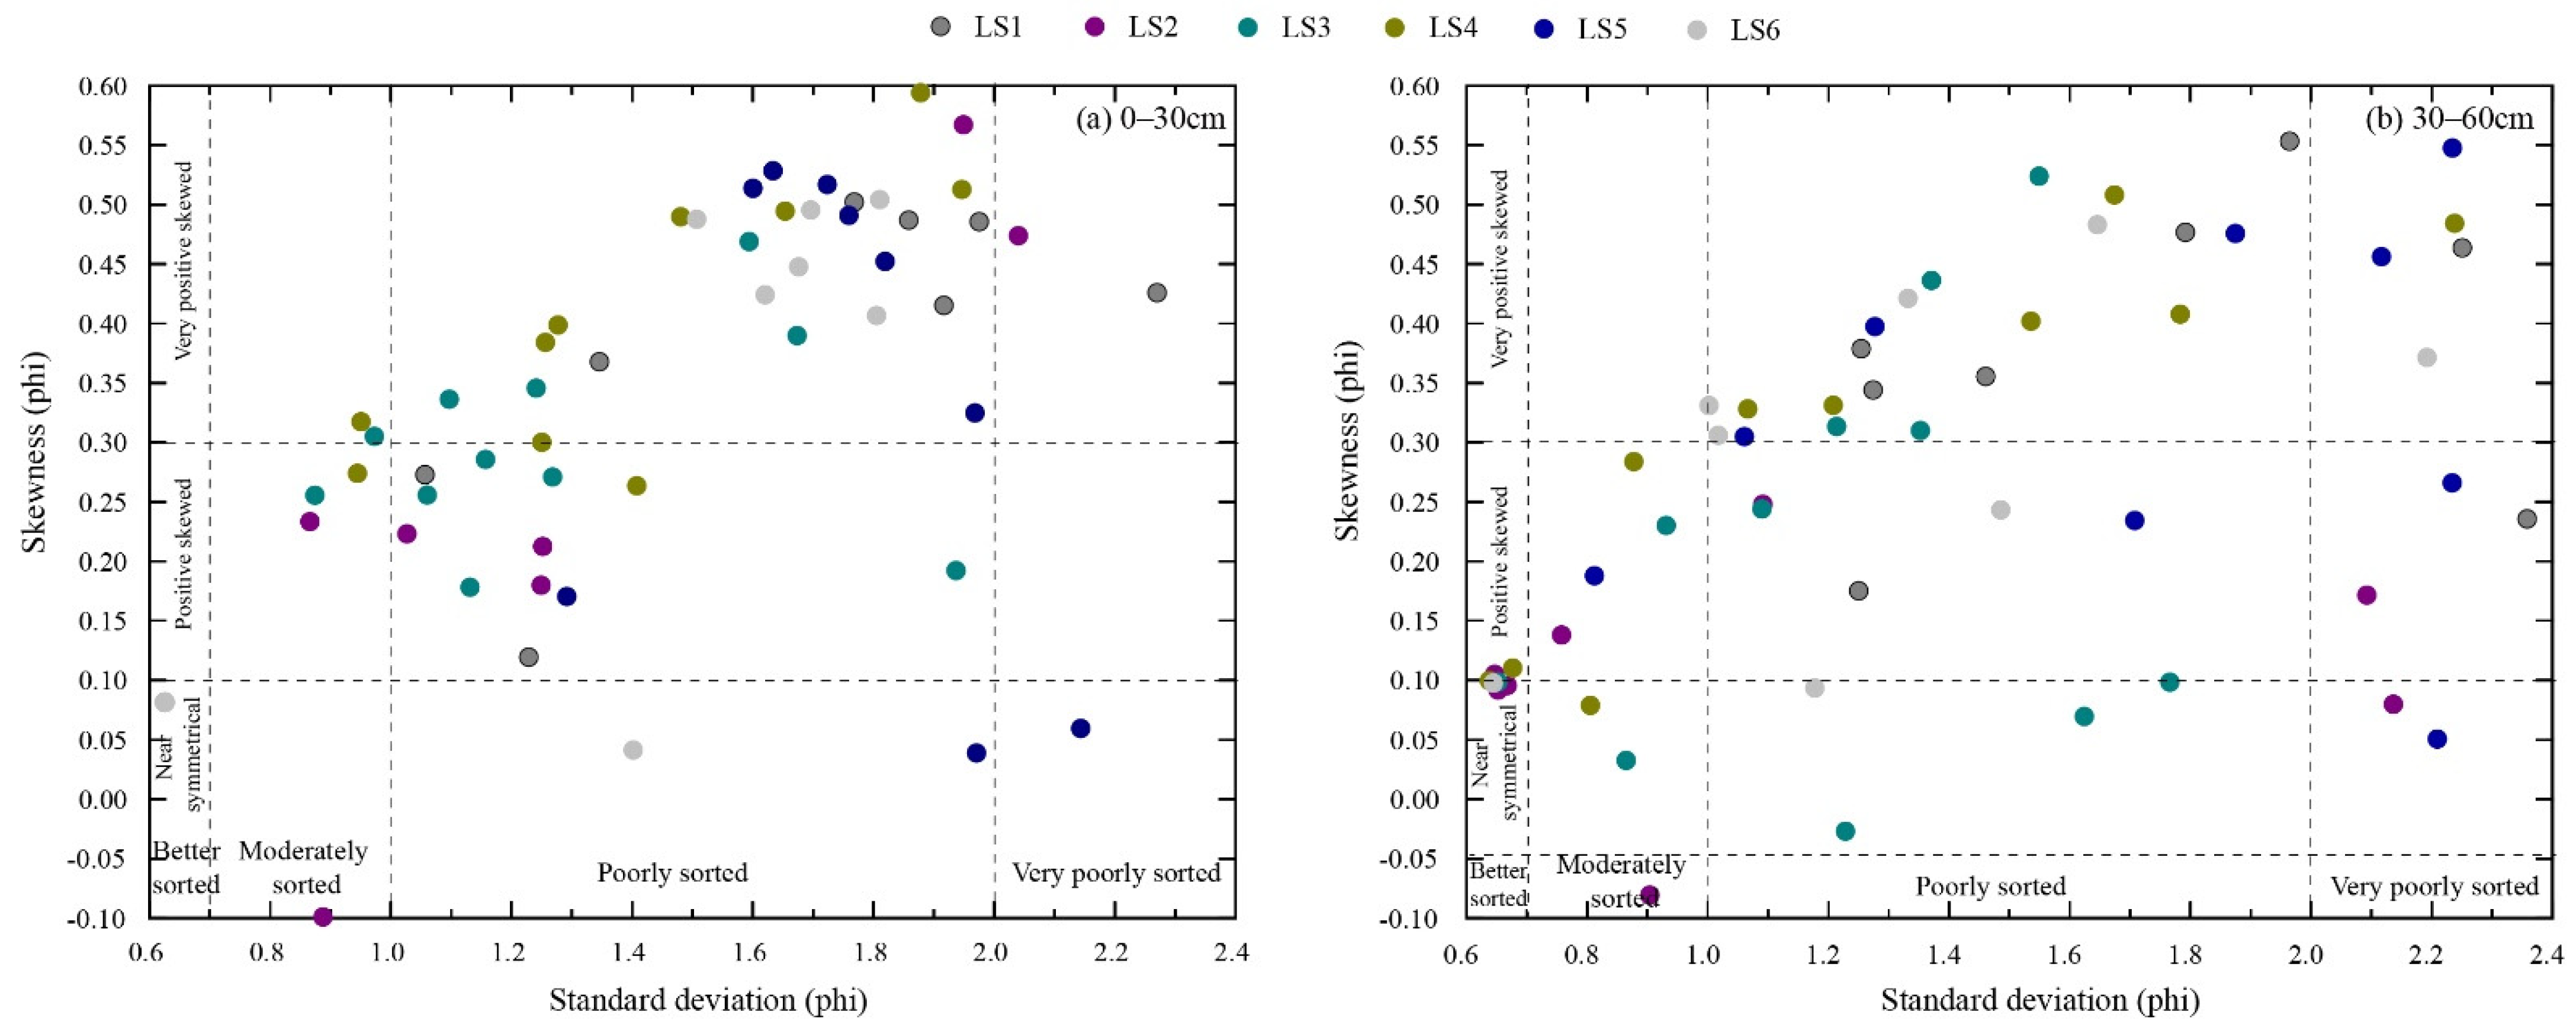
Correlations between the standard deviation (σI) and the skewness (SKI) of the sediments collected from the different landscapes are shown in Figure 7. Sediments from different landscapes were, in the majority, moderately to poorly sorted and positively and very positively skewed (Figure 7). This is the case for sands for most sediments from different landscapes in the playa of Ebinur Lake.
4. Discussion on the Grain Size Characteristics of Sediments Found in Typical Landscapes and Its Implications
Grain size distribution is a very important issue for aeolian research [54]. Examining grain size characteristics is one basic method used to determine the development of the aeolian landforms, as well as the transportation and sorting of aeolian particles [55]. The grain size composition includes creep, saltation, and suspension in aeolian environment formation and development. The grain size study of different landscapes at a small scale, usually found in arid and semi-arid land, has been carried out rarely worldwide. For a set of given conditions, in order to ensure the consistency of the sediment deposition environment, in this paper, we selected a flat terrain zone with different vegetation types and the same hydrodynamic conditions as an example to illustrate the regional long-term wind erosion environment and the response of different landscapes to the wind erosion environment using the calculated grain size characteristics.
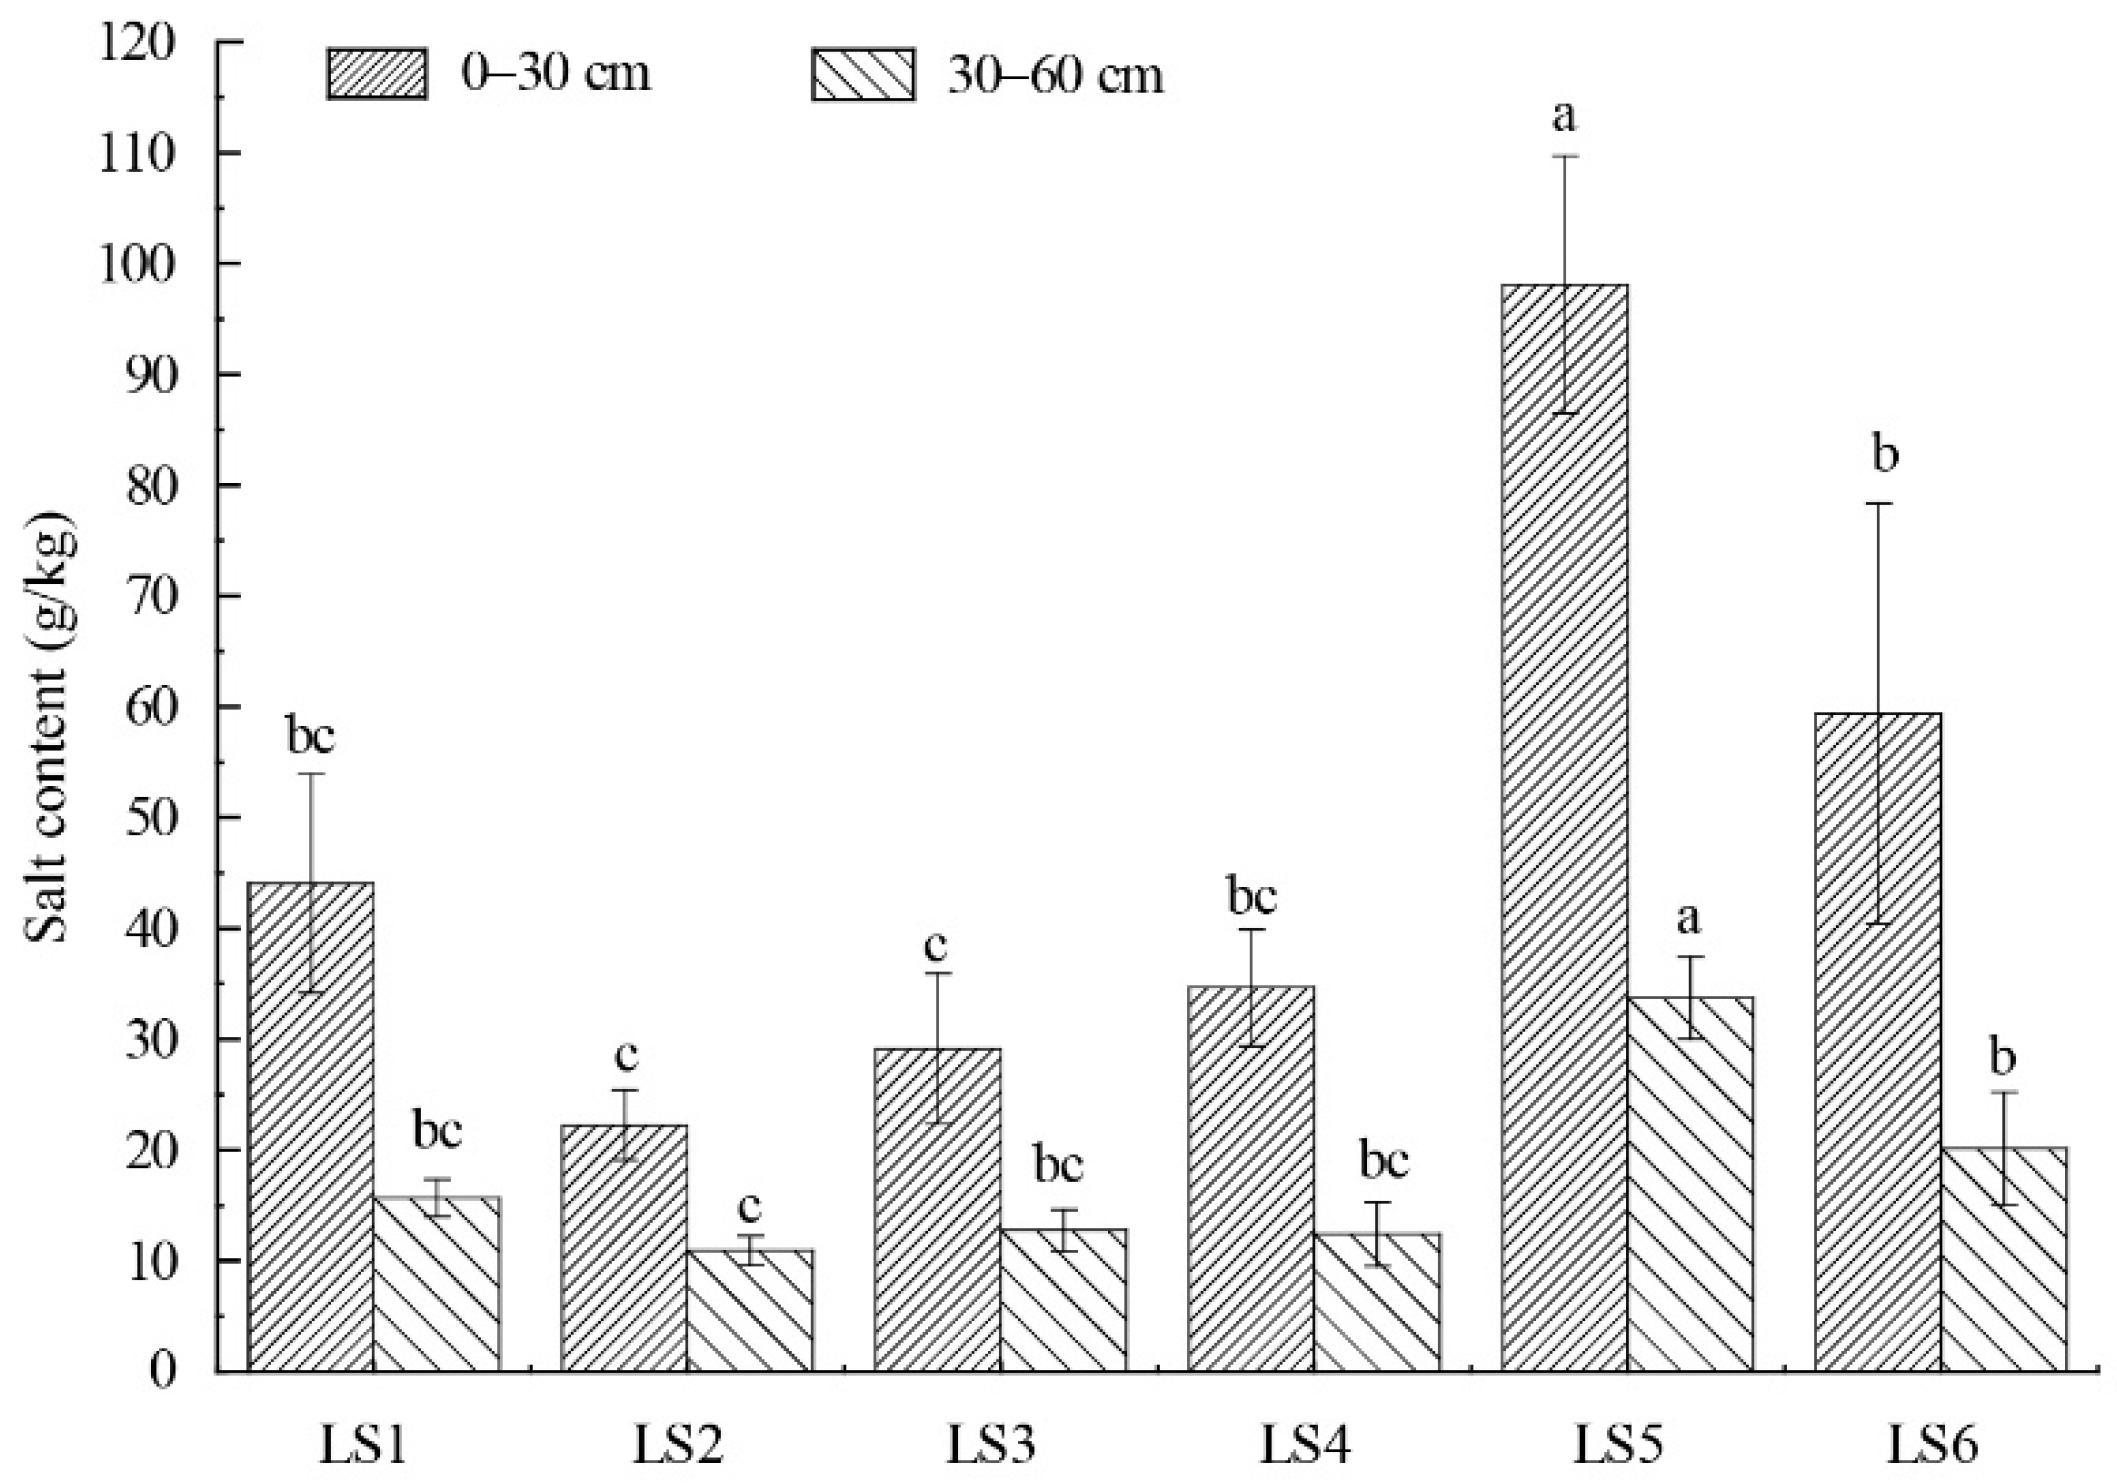
Plant morphology, spatial structures, and vegetation density are all key factors controlling the interaction between the surface and vegetation, which affects sediment transport and which will then impact the grain size distribution [56,57]. The study area we selected is located on the historical playa of the Ebinur Lake, and the hydrodynamic environment within the area is considered the same within such a small regional scale. Thus, the prominent factors that will impose impacts on the grain size composition will be the vegetation types and the intensity of evaporation affected by vegetation types. The different coverage caused by the individual morphological characteristics of plants will protect the sediments in different landscapes from wind erosion by reducing the wind speed, and so the grain size composition and mean particle size of sediments clearly differed among different landscapes, especially for the upper layer, for which all grain size grading shows a significant difference (Table 2 and Figure 4). Overall, the Haloxylon ammodendron desert zone (LS5), a typical desert shrub, has the highest clay and silt content and the lowest content of very fine sand and sand at both depths among the six landscapes, consistent with the results found by Sharifi et al. [58] in the playa of Urmia Lake in Western Asia as well as with the results found by King et al. [59] at the Salton Sea in the USA; this can probably be attributed to the longer leaves and dense branches of Haloxylon ammodendron, which can reduce wind speed effectively. Thus, LS5 has the smallest mean particle diameter (4.36 Φ) and the highest salt content, with significant differences (p < 0.01) compared to the other five landscapes in the top layer (Table 2 and Figure 8). The frequency, cumulative and log-probability cumulative curves of the grain size distribution of the sediments from different landscapes also highlighted the difference of LS5 from other landscapes.
The shrubs desert zone (LS2) and the herbal desert zone (LS3) are the highest at both depths regarding the sand fraction and the lowest at both depths regarding the clay and silt fraction; this may be because, in reality, the low vegetation coverage of LS2 and LS3 (about <6%) and the relatively low level of evaporation lead to the formation of loose surface sediments, with a small amount of salt accumulating near to the surface (Figure 8). Wind erosion is more serious in the clay and silt fraction, which is prone to erosion, which causes corresponding content reduction and leads sediment surfaces to become much rougher over a long period of wind erosion [60].
However, bare land (LS6) will accumulate a large amount of salt close to the surface because of the strong evaporation in this region (Figure 8). When evaporation is strong and the groundwater level drops, the salt will condense and bond with clay and silt, forming a hard salt–silt–clay combination with bacteria, namely a biological soil crust, and the critical threshold wind speed becomes higher, which improves the resistance to wind erosion [61,62,63]. This can be confirmed by the fact that the salt content of the sediment has a significant positive correlation with the mean particle size (Table 3). Biological soil crusts in dry lake beds can be used to stabilize dust and sand from dried-up lake beds when faced with wind erosion [61,64]. During the period of freezing and thawing, the salt crust only had a certain degree of wind erosion, which caused the content of fine fraction and salt content to be lower than that seen in LS5. The grain size composition, mean grain size, standard deviation, skewness, and kurtosis of the Phragmites australis desert zone (LS4) show no significant difference compared to LS1 because of similar morphological characteristics which can protect the sediments from these landscapes from being significantly transported in any form (creep, saltation, suspension).
The results of the present paper will provide some implications regarding the grain size characteristics for the change in the regional wind erosion intensity environment and a basis for wind erosion prevention and control in the playas of arid land. During strong wind erosion periods in arid land, landscapes without vegetation in the playa may have stronger resistance to wind erosion because of the emergence of a salt crust, rather than landscapes with low vegetation coverage and relatively small evaporation. It can be seen that the control of wind erosion within the playa in arid areas cannot be solved only through an increase in vegetation coverage due to the fact that different vegetation types have different protective effects on sediments; selecting more appropriate plant types according to the suitable soil/sediment conditions is also necessary. An optimal vegetation density and planting pattern is also an important factor that needs to be considered.
In the present study, we presented a grain size study on the variation of the particle size distribution of the soil/sediment from different landscapes, which will help us to understand the anti-erosion effect of different landscapes and the change trend of particle size distribution. The quantitative interactions between the vegetation (plant height, porosity, canopy width, leaf area, etc.) and aeolian transport (dust emission) in drylands, especially in the playas in arid lands, still requires further research to make up the knowledge gap through the coupling of models and field monitoring.
5. Conclusions
In the present study, six dominant different landscapes in a natural state with the same sedimentary environment in the playa of Ebinur Lake in arid central Asia were selected to provide insights into the different characteristics of the particle size distribution of sediments from different landscapes in the playa under the effects of wind erosion. The results and conclusions can be summarized as follows.
The different coverage caused by the individual morphological characteristics of plants protected the sediments in different landscapes from wind erosion by reducing the wind speed, and so the grain size composition clearly differed among different landscapes. All samples had a common dominant size group consisting of very fine sand and sand, accounting for approximately seventy percent of the sample, with sizes mainly range from 63 μm to 500 μm. The sand fraction of LS5 was the lowest at both depths, while the clay and silt content was the highest at both depths among the six landscapes. The lowest clay and silt content appeared in LS3 at both depths due to wind erosion causing the surface to become much rougher.
Almost all of the samples were of a bimodal distribution with significant differences. The percentage of grain size composition ranged from 5% to 7%, with the lowest value, in LS5, being around 100 μm in grain diameter. The cumulative curve showed a similar S-shape, while the probability cumulative curve shows an inverted S-shape with three subpopulations according to granularity characteristics. The saltation subpopulation in LS5 was the highest among the six landscapes, while those in LS2 and LS3 were the lowest among the six landscapes after long-term wind erosion.
The mean particle size of the sediments from the six landscapes showed significant differences (p < 0.05), while no significant differences were observed among the other three parameters. The smallest mean particle diameter appeared in LS5 with a value of 4.36Φ. The standard deviation (σI) of the majority of the sediments was moderately to poorly sorted, with a value between 0.8 and 2.4 among the six landscapes. LS2 and LS3 were moderately sorted, and LS5 was in the poorly sorted category, which showed that finer sediments are characterized by poor sorting. LS5 and LS6 were generally dominated by very positively skewed very fine sand and very coarse silt of the superficial sediments.
The Haloxylon ammodendron desert zone (LS5) had the strongest resistance to wind erosion, which can be attributed to the longer leaves and dense branches of this type of vegetation, which can reduce wind speed effectively. The shrubs desert zone (LS2) and the herbal desert zone (LS3) showed the weakest resistance to wind erosion due to the low vegetation coverage and relatively low level of evaporation. However, the wind erosion resistance of bare land (LS6) was stronger than expected because of the emergence of a salt crust. The present results provide an insight into the anti-erosion effects of different landscapes. It must be pointed out that the interaction between the vegetation and aeolian transport in drylands, especially in playas in arid lands, still requires further research to make up the knowledge gap through models and field monitoring.
Author Contributions
Conceptualization, N.W. and Y.G.; methodology, Y.G. and J.A.; software, N.W. and Y.G.; investigation, Y.G. and N.W.; writing—original draft preparation, N.W.; writing—review and editing, N.W. and Y.G.; visualization, N.W.; supervision, Y.G. and J.A.; project administration, Y.G. and J.A.; funding acquisition, Y.G. and J.A. All authors have read and agreed to the published version of the manuscript.
Funding
This research was funded by the National Natural Science Foundation of China (42171014, 41501115), CAS “Light of West China” Program (2017-XBQNXZ-B-012) and the Training Program for Youth Innovative Talents in Science and Technology in Xinjiang (QN2016BS0052).
Data Availability Statement
Not applicable.
Conflicts of Interest
The authors declare no conflict of interest.
References
- Barth, H.J. Comment on “Playa, playa lake, sabkha: Proposed definitions for old terms”. J. Arid Environ. 2001, 47, 513–514. [Google Scholar] [CrossRef]
- Briere, P.R. Playa, playa lake, sabkha: Proposed definitions for old terms. J. Arid Environ. 2000, 45, 1–7. [Google Scholar] [CrossRef]
- Gill, T.E. Eolian sediments generated by anthropogenic disturbance of playas: Human impacts on the geomorphic system and geomorphic impacts on the human system. Geomorphology 1996, 17, 207–228. [Google Scholar] [CrossRef]
- Goudie, A.; Wells, G. The nature, distribution and formation of pans in arid zones. Earth Sci. Rev. 1995, 38, 1–69. [Google Scholar] [CrossRef]
- Wurtsbaugh, W.A.; Miller, C.; Null, S.E.; DeRose, R.J.; Wilcock, P.; Hahnenberger, M.; Howe, F.; Moore, J. Decline of the world’s saline lakes. Nat. Geosci. 2017, 10, 816–821. [Google Scholar] [CrossRef]
- D’Odorico, P.; Bhattachan, A.; Davis, K.F.; Ravi, S.; Runyan, C.W. Global desertification: Drivers and feedbacks. Adv. Water Res. 2013, 51, 326–344. [Google Scholar] [CrossRef]
- Abuduwaili, J.; Issanova, G.; Saparov, G. Hydrology and Limnology of Central Asia; Springer Nature: Singapore, 2021. [Google Scholar]
- Abuduwaili, J.; Mu, G. Eolian factor in the process of modern salt accumulation in western Dzungaria, China. Eurasian Soil Sci. 2006, 39, 367–376. [Google Scholar]
- Li, B.; Ma, L.; Jiang, P.; Duan, Z.; Sun, D.; Qiu, H.; Zhong, J.; Wu, H. High precision topographic data on Lop Nor basin’s Lake “Great Ear” and the timing of its becoming a dry salt lake. Chin. Sci. Bull. 2008, 53, 905–914. [Google Scholar] [CrossRef] [Green Version]
- Bai, J.; Chen, X.; Li, J.; Yang, L.; Fang, H. Changes in the area of inland lakes in arid regions of central Asia during the past 30 years. Environ. Monit. Assess. 2011, 178, 247–256. [Google Scholar] [CrossRef]
- Breckle, S.; Wucherer, W. The Aralkum, a man-made desert on the desiccated floor of the Aral Sea (Central Asia): Final conclusions and comments. In Aralkum-a Man-Made Desert; Springer: Berlin/Heidelberg, Germany, 2012; pp. 459–464. [Google Scholar]
- Indoitu, R.; Kozhoridze, G.; Batyrbaeva, M.; Vitkovskaya, I.; Orlovsky, N.; Blumberg, D.; Orlovsky, L. Dust emission and environmental changes in the dried bottom of the Aral Sea. Aeolian Res. 2015, 17, 101–115. [Google Scholar] [CrossRef]
- Micklin, P. The future Aral Sea: Hope and despair. Environ. Earth Sci. 2016, 75, 844. [Google Scholar] [CrossRef]
- Rashki, A.; Kaskaoutis, D.G.; Goudie, A.S.; Kahn, R.A. Dryness of ephemeral lakes and consequences for dust activity: The case of the Hamoun drainage basin, southeastern Iran. Sci. Total Environ. 2013, 463–464, 552–564. [Google Scholar] [CrossRef] [PubMed]
- AghaKouchak, A.; Norouzi, H.; Madani, K.; Mirchi, A.; Azarderakhsh, M.; Nazemi, A.; Nasrollahi, N.; Farahmand, A.; Mehran, A.; Hasanzadeh, E. Aral Sea syndrome desiccates Lake Urmia: Call for action. J. Great Lakes Res. 2015, 41, 307–311. [Google Scholar] [CrossRef]
- Ahmadi, J.; Kahforoushan, D.; Fatehifar, E.; Zoroufchi Benis, K.; Nadjafi, M. Drying of Urmia Lake: Modeling of level fluctuations. Environ. Health Eng. Manag. 2016, 3, 23–28. [Google Scholar]
- Mardi, A.H.; Khaghani, A.; MacDonald, A.B.; Nguyen, P.; Karimi, N.; Heidary, P.; Karimi, N.; Saemian, P.; Sehatkashani, S.; Tajrishy, M. The Lake Urmia environmental disaster in Iran: A look at aerosol pollution. Sci. Total Environ. 2018, 633, 42–49. [Google Scholar] [CrossRef]
- Jones, B.A.; Fleck, J. Shrinking lakes, air pollution, and human health: Evidence from California’s Salton Sea. Sci. Total Environ. 2020, 712, 136490. [Google Scholar] [CrossRef] [PubMed]
- Ge, Y.; Abuduwaili, J.; Ma, L. Lakes in arid land and saline dust storms. E3S Web Conf. 2019, 99, 01007. [Google Scholar] [CrossRef]
- Goudie, A. Dust storms and ephemeral lakes. Desert 2018, 23, 153–164. [Google Scholar]
- Abuduwaili, J. Lakes of Arid Land and Salt-Dust Storms; China Environment Press: Beijing, China, 2012; pp. 189–191. [Google Scholar]
- Abuduwaili, J.; Ma, L. Overview of Central Asian Environments; China Meteorological Press: Beijing, China, 2015; pp. 38–39. [Google Scholar]
- Ge, Y.; Abuduwaili, J.; Ma, L.; Liu, D. Temporal Variability and Potential Diffusion Characteristics of Dust Aerosol Originating from the Aral Sea Basin, Central Asia. Water Air Soil Pollut. 2016, 227, 63. [Google Scholar] [CrossRef]
- Ge, Y.; Abuduwaili, J.; Ma, L.; Wu, N.; Liu, D. Potential transport pathways of dust emanating from the playa of Ebinur Lake, Xinjiang, in arid northwest China. Atmos. Res. 2016, 178, 196–206. [Google Scholar] [CrossRef]
- Goudie, A.S. Desert dust and human health disorders. Environ. Int. 2014, 63, 101–113. [Google Scholar] [CrossRef]
- Goudie, A.S.; Middleton, N.J. Desert Dust in the Global System; Springer Science & Business Media: Berlin/Heidelberg, Germany, 2006. [Google Scholar]
- Palchan, D.; Stein, M.; Almogi-Labin, A.; Erel, Y.; Goldstein, S.L. Dust transport and synoptic conditions over the Sahara–Arabia deserts during the MIS6/5 and 2/1 transitions from grain-size, chemical and isotopic properties of Red Sea cores. Earth Planet. Sci. Lett. 2013, 382, 125–139. [Google Scholar] [CrossRef]
- Zhang, C.; Shen, Y.; Li, Q.; Jia, W.; Li, J.; Wang, X. Sediment grain–size characteristics and relevant correlations to the aeolian environment in China’s eastern desert region. Sci. Total Environ. 2018, 627, 586–599. [Google Scholar] [CrossRef] [PubMed]
- Colazo, J.C.; Buschiazzo, D. The impact of agriculture on soil texture due to wind erosion. Land Degrad. Dev. 2015, 26, 62–70. [Google Scholar] [CrossRef]
- Kong, K.; Nandintsetseg, B.; Shinoda, M. How plant production in the Mongolian grasslands is affected by wind-eroded coarse-textured topsoil. J. Arid Environ. 2021, 189, 104443. [Google Scholar] [CrossRef]
- Lackóová, L.; Pokrývková, J.; Kozlovsky Dufková, J.; Policht-Latawiec, A.; Michałowska, K.; Dąbrowska, J. Long-Term Impact of Wind Erosion on the Particle Size Distribution of Soils in the Eastern Part of the European Union. Entropy 2021, 23, 935. [Google Scholar] [CrossRef]
- Miri, A.; Dragovich, D.; Dong, Z. Vegetation morphologic and aerodynamic characteristics reduce aeolian erosion. Sci. Rep. 2017, 7, 1–9. [Google Scholar] [CrossRef] [PubMed]
- Webb, N.P.; McCord, S.E.; Edwards, B.L.; Herrick, J.E.; Kachergis, E.; Okin, G.S.; Van Zee, J.W. Vegetation Canopy Gap Size and Height: Critical Indicators for Wind Erosion Monitoring and Management. Rangel. Ecol. Manag. 2021, 76, 78–83. [Google Scholar] [CrossRef]
- Zhang, F.; Zhang, H.; Evans, M.R.; Huang, T. Vegetation patterns generated by a wind driven sand-vegetation system in arid and semi-arid areas. Ecol. Complex. 2017, 31, 21–33. [Google Scholar] [CrossRef]
- Touré, A.A.; Tidjani, A.; Rajot, J.-L.; Marticorena, B.; Bergametti, G.; Bouet, C.; Ambouta, K.; Garba, Z. Dynamics of wind erosion and impact of vegetation cover and land use in the Sahel: A case study on sandy dunes in southeastern Niger. Catena 2019, 177, 272–285. [Google Scholar] [CrossRef]
- Khusfi, Z.E.; Khosroshahi, M.; Roustaei, F.; Mirakbari, M. Spatial and seasonal variations of sand-dust events and their relation to atmospheric conditions and vegetation cover in semi-arid regions of central Iran. Geoderma 2020, 365, 114225. [Google Scholar] [CrossRef]
- Khusfi, Z.E.; Roustaei, F.; Ebrahimi Khusfi, M.; Naghavi, S. Investigation of the relationship between dust storm index, climatic parameters, and normalized difference vegetation index using the ridge regression method in arid regions of Central Iran. Arid Land Res. Manag. 2020, 34, 239–263. [Google Scholar] [CrossRef]
- Cheng, H.; Liu, C.; Xueyong, Z.; Li, H.; Kang, L.; Liu, B.; Jifeng, L. Wind erosion rate for vegetated soil cover: A prediction model based on surface shear strength. Catena 2020, 187, 104398. [Google Scholar]
- Kergoat, L.; Guichard, F.; Pierre, C.; Vassal, C. Influence of dry-season vegetation variability on Sahelian dust during 2002–2015. Geophys. Res. Lett. 2017, 44, 5231–5239. [Google Scholar] [CrossRef]
- Lee, D.B.; Ferdowsi, B.; Jerolmack, D.J. The imprint of vegetation on desert dune dynamics. Geophys. Res. Lett. 2019, 46, 12041–12048. [Google Scholar] [CrossRef] [Green Version]
- Meng, Z.; Dang, X.; Gao, Y.; Ren, X.; Ding, Y.; Wang, M. Interactive effects of wind speed, vegetation coverage and soil moisture in controlling wind erosion in a temperate desert steppe, Inner Mongolia of China. J. Arid Land 2018, 10, 534–547. [Google Scholar] [CrossRef] [Green Version]
- Mayaud, J.R.; Webb, N.P. Vegetation in Drylands: Effects on Wind Flow and Aeolian Sediment Transport. Land 2017, 6, 64. [Google Scholar] [CrossRef] [Green Version]
- Torshizi, M.R.; Miri, A.; Shahriari, A.; Dong, Z.; Davidson-Arnott, R. The effectiveness of a multi-row Tamarix windbreak in reducing aeolian erosion and sediment flux, Niatak area, Iran. J. Environ. Manag. 2020, 265, 110486. [Google Scholar] [CrossRef] [PubMed]
- Webb, N.P.; Okin, G.S.; Brown, S. The effect of roughness elements on wind erosion: The importance of surface shear stress distribution. J. Geophys. Res.-Atmos. 2014, 119, 6066–6084. [Google Scholar] [CrossRef] [Green Version]
- Zhang, J. A new ecological-wind erosion model to simulate the impacts of aeolian transport on dryland vegetation patterns. Acta Ecol. Sin. 2021, 41, 304–317. [Google Scholar] [CrossRef]
- Abuduwaili, J.; Gabchenko, M.; Xu, J.R. Eolian transport of salts—A case study in the area of Lake Ebinur (Xinjiang, Northwest China). J. Arid Environ. 2008, 72, 1843–1852. [Google Scholar] [CrossRef]
- Abuduwaili, J.; Liu, D.W.; Wu, G.Y. Saline dust storms and their ecological impacts in arid regions. J. Arid Land 2010, 2, 144–150. [Google Scholar] [CrossRef] [Green Version]
- Abuduwaili, J.; Zhang, Z.Y.; Jiang, F.Q.; Liu, D.W. The Disastrous Effects of Salt Dust Deposition on Cotton Leaf Photosynthesis and the Cell Physiological Properties in the Ebinur Basin in Northwest China. PLoS ONE 2015, 10, e0124546. [Google Scholar] [CrossRef]
- Ma, L.; Wu, J.L.; Liu, W.; Abuduwaili, J. Distinguishing between anthropogenic and climatic impacts on lake size: A modeling approach using data from Ebinur Lake in arid northwest China. J. Limnol. 2014, 73, 350–357. [Google Scholar] [CrossRef] [Green Version]
- Mu, G.; Yan, S.; Jilil, A.; He, Q.; Xai, X. Wind erosion at the dry-up bottom of Aiby Lake. Sci. China Ser. D Earth Sci. 2002, 45, 157–164. [Google Scholar] [CrossRef]
- Folk, R.L.; Ward, W.C. Brazos River bar [Texas]; A study in the significance of grain size parameters. J. Sediment. Res. 1957, 27, 3–26. [Google Scholar] [CrossRef]
- Friedman, G.M.; Sanders, J.E. Principles of Sedimentology; Wiley: New York, NY, USA, 1978. [Google Scholar]
- Visher, G.S. Grain size distributions and depositional processes. J. Sediment. Res. 1969, 39, 1074–1106. [Google Scholar]
- Zhang, Z.; Dong, Z.; Li, J. Grain-size characteristics of dune networks in China’s tengger desert. Geogr. Ann. Ser. A Phys. Geogr. 2015, 97, 681–693. [Google Scholar] [CrossRef]
- Liu, B.; Qu, J.; Ning, D.; Gao, Y.; Zu, R.; An, Z. Grain-size study of aeolian sediments found east of Kumtagh Desert. Aeolian Res. 2014, 13, 1–6. [Google Scholar] [CrossRef]
- Fu, G.; Xu, X.; Qiu, X.; Xu, G.; Shang, W.; Yang, X.; Zhao, P.; Chai, C.; Hu, X.; Zhang, Y.; et al. Wind tunnel study of the effect of planting Haloxylon ammodendron on aeolian sediment transport. Biosyst. Eng. 2021, 208, 234–245. [Google Scholar] [CrossRef]
- McLaren, P.; Bowles, D. The effects of sediment transport on grain-size distributions. J. Sediment. Res. 1985, 55, 457–470. [Google Scholar]
- Sharifi, A.; Shah-Hosseini, M.; Pourmand, A.; Esfahaninejad, M.; Haeri-Ardakani, O. The Vanishing of Urmia Lake: A Geolimnological Perspective on the Hydrological Imbalance of the World’s Second Largest Hypersaline Lake; Springer: Berlin/Heidelberg, Germany; pp. 1–38.
- King, J.; Etyemezian, V.; Sweeney, M.; Buck, B.J.; Nikolich, G. Dust emission variability at the Salton Sea, California, USA. Aeolian Res. 2011, 3, 67–79. [Google Scholar] [CrossRef]
- Lin, J.; Guan, Q.; Pan, N.; Zhao, R.; Yang, L.; Xu, C. Spatiotemporal variations and driving factors of the potential wind erosion rate in the Hexi region, PR China. Land Degrad. Dev. 2021, 32, 139–157. [Google Scholar] [CrossRef]
- Kheirfam, H.; Asadzadeh, F. Stabilizing sand from dried-up lakebeds against wind erosion by accelerating biological soil crust development. Eur. J. Soil Biol. 2020, 98, 103189. [Google Scholar] [CrossRef]
- Li, S.; Li, C.; Fu, X. Characteristics of soil salt crust formed by mixing calcium chloride with sodium sulfate and the possibility of inhibiting wind-sand flow. Sci. Rep. 2021, 11, 9746. [Google Scholar] [CrossRef]
- Buck, B.J.; King, J.; Etyemezian, V. Effects of salt mineralogy on dust emissions, Salton Sea, California. Soil Sci. Soc. Am. J. 2011, 75, 1971–1985. [Google Scholar] [CrossRef] [Green Version]
- Kheirfam, H.; Roohi, M. Accelerating the formation of biological soil crusts in the newly dried-up lakebeds using the inoculation-based technique. Sci. Total Environ. 2020, 706, 136036. [Google Scholar] [CrossRef] [PubMed]
Figure 1.
Geographical location of the Ebinur Lake and sample sites.

Figure 2.
Frequency curves and cumulative curve of grain size composition of sediments collected from different landscapes.
Figure 2.
Frequency curves and cumulative curve of grain size composition of sediments collected from different landscapes.

Figure 3.
Log-probability cumulative curve of grain size composition of sediments collected from different landscapes.
Figure 3.
Log-probability cumulative curve of grain size composition of sediments collected from different landscapes.

Figure 4.
Change characteristics of grain size parameters of sediments collected from different landscapes (different letters above the bars indicate significant differences between parameters (p < 0.05). Mz denotes mean grain size, σI denotes standard deviation, SKI denotes skewness, KG denotes kurtosis.).

Figure 5.
Correlations between mean grain size (Mz) and sorting (σI) of the sediments collected from different landscapes.
Figure 5.
Correlations between mean grain size (Mz) and sorting (σI) of the sediments collected from different landscapes.

Figure 6.
Correlations between mean grain size (Mz) and skewness (SKI) of the sediments collected from different landscapes.
Figure 6.
Correlations between mean grain size (Mz) and skewness (SKI) of the sediments collected from different landscapes.

Figure 7.
Correlations between the standard deviation (σI) and the skewness (SKI) of the sediments collected from different landscapes.
Figure 7.
Correlations between the standard deviation (σI) and the skewness (SKI) of the sediments collected from different landscapes.

Figure 8.
Salt content of the sediments collected from the different landscapes (different letters indicate significant differences between parameters (p < 0.05)).
Figure 8.
Salt content of the sediments collected from the different landscapes (different letters indicate significant differences between parameters (p < 0.05)).


Table 1.
Landscape types and number of samples.
| Label | Landscapes | Dominant Plant Types | Number of Samples | Vegetation Coverage |
|---|---|---|---|---|
| LS1 | Populus euphratica desert zone | Populous euphratica | 8 | <10% |
| LS2 | Shrubs desert zone | Apocynum Venetum, Populous euphratica, Tamarix, Reaumuria soongorica | 8 | <10% |
| LS3 | Herbal desert zone | Apocynum venetum, Nitraria schoberi, Kalidium foliatum, Reaumuria soongorica | 11 | <10% |
| LS4 | Phragmites australis desert zone | Phragmites australis | 10 | <10% |
| LS5 | Haloxylon ammodendron desert zone | Haloxylon ammodendron, Halocnemum strobilaceum | 9 | <10% |
| LS6 | Bare land | none | 8 | 0 |
Table 2.
Grain size composition of sediments collected from six landscapes (%, different letters in the same column indicate significant differences in percentage of grain size composition between different landscapes (* p < 0.05, ** p < 0.01); the significance decreases in the order of a > b > c.).
| Depth | Clay | Silt | Sand | |||||||||
|---|---|---|---|---|---|---|---|---|---|---|---|---|
| Grain Size Grading | Clay | Very Fine Silt | Fine Silt | Medium Silt | Coarse Silt | Very Coarse Silt | Very Fine Sand | Sand | Medium Sand | Coarse Sand | Very Coarse Sand | |
| Particle Size (μm) | <2 | 2–4 | 4–8 | 8–16 | 16–31 | 31–63 | 63–125 | 125–250 | 250–500 | 500–1000 | 1000–2000 | |
| 0–30 cm | LS1 | 2.09 ab | 2.47 ab | 4.19 ab | 6.28 ab | 5.51 b | 8.84 bc | 29.04 a | 30.76 ab | 9.27 abc | 1.40 a | 0.15 a |
| LS2 | 1.50 b | 1.94 b | 2.81 bc | 3.75 b | 3.64 b | 4.90 c | 24.54 a | 37.06 a | 15.84 a | 3.72 a | 0.31 a | |
| LS3 | 0.79 b | 1.19 b | 1.92 c | 2.94 b | 3.18 b | 5.91 bc | 26.51 a | 37.97 a | 14.36 ab | 4.49 a | 0.73 a | |
| LS4 | 1.50 b | 1.67 b | 2.37 bc | 4.00 b | 4.28 | 6.56 bc | 32.92 a | 39.24 a | 7.26 bc | 0.19 a | 0.01 a | |
| LS5 | 3.32 a | 3.30 a | 5.18 a | 8.57 a | 9.30 a | 14.25 a | 31.17 a | 21.48 b | 2.92 c | 0.49 a | 0.01 a | |
| LS6 | 1.89 ab | 2.04 ab | 3.35 abc | 5.52 ab | 5.60 b | 11.09 ab | 30.53 a | 28.92 ab | 8.64 bc | 2.30 a | 0.12 a | |
| Sig. | 0.01 * | 0.01 * | 0.01 * | 0.00 ** | 0.01 * | 0.00 ** | 0.30 * | 0.01 * | 0.00 ** | 0.35 | 0.52 | |
| 30–60 cm | LS1 | 3.62 ab | 3.32 ab | 4.54 ab | 6.46 ab | 5.67 ab | 11.76 a | 34.01 a | 25.26 a | 4.42 b | 0.93 a | 0.02 a |
| LS2 | 2.76 ab | 2.81 ab | 3.81 ab | 5.52 ab | 5.73 ab | 5.63 b | 24.91 a | 38.16 a | 10.02 ab | 0.54 a | 0.10 a | |
| LS3 | 0.87 b | 1.21 b | 1.72 b | 2.46 b | 2.49 b | 5.51 b | 27.13 a | 38.30 a | 14.58 a | 4.23 a | 1.51 a | |
| LS4 | 2.24 ab | 2.18 ab | 3.01 ab | 4.91 ab | 5.31 ab | 9.95 ab | 33.71 a | 32.25 a | 5.98 b | 0.46 a | 0.00 a | |
| LS5 | 4.05 a | 3.80 a | 5.36 a | 8.23 a | 8.40 a | 11.31 ab | 29.77 a | 24.52 a | 3.68 b | 0.84 a | 0.05 a | |
| LS6 | 1.71 ab | 1.83 ab | 2.73 ab | 4.24 ab | 3.83 ab | 7.90 ab | 30.11 a | 32.41 a | 10.39 ab | 4.30 a | 0.56 a | |
| Sig. | 0.17 * | 0.16 * | 0.15 * | 0.10 * | 0.11 * | 0.06 * | 0.31 * | 0.18 * | 0.00 * | 0.30 | 0.27 | |
Table 3.
Correlation analysis between grain size parameters and salt content of sediments from different landscapes.
Table 3.
Correlation analysis between grain size parameters and salt content of sediments from different landscapes.
| Depth | 0–30 cm | 30–60 cm | ||||||||
|---|---|---|---|---|---|---|---|---|---|---|
| Mean Size (Mz) | Sorting (σI) | Skewness (SKI) | Kurtosis (KG) | Salt Content | Mean Size (Mz) | Sorting (σI) | Skewness (SKI) | Kurtosis (KG) | Salt Content | |
| Mean size (Mz) | 1 | 1 | ||||||||
| Sorting (σI) | 0.768 ** | 1 | 0.792 ** | 1 | ||||||
| Skewness (SKI) | 0.386 ** | 0.499 ** | 1 | 0.349 ** | 0.486 ** | 1 | ||||
| Kurtosis (KG) | −0.483 ** | −0.531 ** | −0.040 | 1 | −0.292 * | −0.260 | 0.247 | 1 | ||
| Salt content | 0.707 ** | 0.459 ** | 0.263 | −0.299 * | 1 | 0.334 * | 0.275 * | 0.358 ** | 0.092 | 1 |
**: correlation is significant at the 0.01 level (2-tailed). *: correlation is significant at the 0.05 level (2-tailed).
Publisher’s Note: MDPI stays neutral with regard to jurisdictional claims in published maps and institutional affiliations. |
© 2021 by the authors. Licensee MDPI, Basel, Switzerland. This article is an open access article distributed under the terms and conditions of the Creative Commons Attribution (CC BY) license (https://creativecommons.org/licenses/by/4.0/).
Share and Cite
MDPI and ACS Style
Wu, N.; Ge, Y.; Abuduwaili, J. Grain Size Characteristics of Sediments Found in Typical Landscapes in the Playa of Ebinur Lake, Arid Central Asia. Land 2021, 10, 1132. https://doi.org/10.3390/land10111132
AMA Style
Wu N, Ge Y, Abuduwaili J. Grain Size Characteristics of Sediments Found in Typical Landscapes in the Playa of Ebinur Lake, Arid Central Asia. Land. 2021; 10(11):1132. https://doi.org/10.3390/land10111132
Chicago/Turabian StyleWu, Na, Yongxiao Ge, and Jilili Abuduwaili. 2021. "Grain Size Characteristics of Sediments Found in Typical Landscapes in the Playa of Ebinur Lake, Arid Central Asia" Land 10, no. 11: 1132. https://doi.org/10.3390/land10111132
Note that from the first issue of 2016, this journal uses article numbers instead of page numbers. See further details here.