
An Assessment of Forest Cover Change and Its Driving Forces in the Syrian Coastal Region during a Period of Conflict, 2010 to 2020


Department of Geography, Humboldt University of Berlin, 10099 Berlin, Germany
Land 2021, 10(2), 191; https://doi.org/10.3390/land10020191
Submission received: 26 December 2020
/
Revised: 6 February 2021
/
Accepted: 10 February 2021
/
Published: 13 February 2021
Abstract
:In Syria, 76% of the forests are located in the Syrian coast region. This region is witnessing a rapid depletion of forest cover during the conflict that broke out in mid-2011. To date, there have been no studies providing accurate, reliable, and comprehensive data on the qualitative and quantitative aspects of forest change dynamics and the underlying drivers behind this change. In this study, changes in the dynamics of forest cover and its density between 2010 and 2020 were detected and analyzed using multi-temporal Landsat images. This study also analyzed the relationship between changes in forest cover and selected physical and socio-demographic variables associated with the drivers of change. The results revealed that the study area witnessed a significant decrease in the total forest area (31,116.0 ha, 24.3%) accompanied by a considerable decrease in density, as the area of dense forests decreased by 11,778.0 ha (9.2%) between 2010 and 2020. The change in forest cover was driven by a variety of different factors related to the conflict. The main drivers were changes in economic and social activities, extensive exploitation of forest resources, frequent forest fires, and weakness of state institutions in managing natural resources and environmental development. Forest loss was also linked to the expansion of cultivated area, increase in population and urban area. Fluctuating climatic conditions are not a major driver of forest cover dynamics in the study area. This decrease in forest area and density reflects sharp shifts in the natural environment during the study period. In the foreseeable future, it is not possible to determine whether the changes in forest cover and its density will be permanent or temporary. Monitoring changes in forest cover and understanding the driving forces behind this change provides quantitative and qualitative information to improve planning and decision-making. The results of this study may draw the attention of decision-makers to take immediate actions and identify areas of initial intervention to protect current the forests of the Syrian coast region from loss and degradation, as well as develop policies for the sustainable management of forest resources in the long term.
1. Introduction
Forests represent a main natural resource and provide many ecological, economic, and societal benefits, including conservation of biological and genetic diversity, contributions to nutrient cycling, soil erosion mitigation, air filtration, climate regulation, and the provisioning of food, fiber, and fuel [1,2,3,4,5,6]. Deforestation in the world due to influence of human activity goes back many centuries, but the severe and rapid depletion of forests and their degradation in recent decades and the resulting significant environmental, social and economic consequences have led to an increase in global interest in monitoring and estimating areas covered by forests in different parts of the world [4,7,8,9]. It is estimated that between 1990 and 2015, global forest cover decreased by 3.1% (129 million hectares) [3,10]. This significant loss of forest cover, estimated at 10 million hectares per year, continues to occur at an alarming rate [11]. Therefore, international conventions have been developed to monitor forests over time and evaluate strategies for sustainable management of forest resources [3].
In recent decades, there has been a decline in forest cover in arid and semi-arid regions at a faster rate than in tropical forests [3,12]. This can be attributed to increased human pressures on forests such as overexploitation, urbanization, agricultural expansion, overgrazing, as well as variability in climate and escalating social unrest [3,9,13]. Thus, deforestation in arid and semi-arid regions poses a serious threat to the ecosystem and biodiversity [3,8,14]. Moreover, this has various consequences such as changes in the local and regional climate and negative impacts on the livelihood of the population in these areas inhabited by more than one billion people [8,15].
On this basis, the information that can be obtained from the analysis of forest cover dynamics in different landscapes at the local and regional levels will facilitate a better understanding of the drivers that cause changes in forest patterns and their spatial extent over time [8]. This, in turn, will help in developing and evaluating strategies for managing forest resources at the national level, as well as implementing relevant directives stipulated in international agreements such as those concerned with combating desertification (United Nations Convention to Combat Desertification of 1994 (UNCCD)), deforestation (Intergovernmental Panel for Forests, 1996 Intergovernmental Forum for Forests, 2000 (IPF IFF)) and protection of rare and endangered plant and animal species and their habitats (Convention on International Trade in Endangered Species of Wild Fauna and Flora, 1975 (CITES)) [3].
At present, accurate and continuously updated information covering changes in the spatial extent of forest cover is of great importance for the sustainable management of forest ecosystems [9,16]. These data can be obtained from field studies, however, they document changes in forests at the local level, in addition to being very expensive and time consuming [1,3]. A remote sensing approach has been widely shown to be the appropriate method for documenting changes in forest cover and directly detecting biodiversity due to the ability to quickly and efficiently monitor forest dynamics at regional and global scales and at regular time intervals [1,15]. Consequently, the detection, identification and mapping of temporal and spatial changes of forests based on the processing and analysis of remote sensing data is one of the most important applications of remote sensing technology [15,17].
Since the launch of the first Earth resource technology satellite (ERTS-1 or Land-use Satellite (Landsat 1)) in 1972, dense time-series of remote sensing data have become available for frequent monitoring of spatio-temporal dynamics of land use/land cover in different parts of the world [1,9,18] such as data provided by Landsat, Thermal Emission and Reflection Radiometer (ASTER), Moderate Resolution Imaging Spectroradiometer (MODIS), and Sentinel-2 [1,3,9,18]. The use of these data with a selectable temporal resolution enables near real-time monitoring of changes in forest cover, and provides crucial information for forest resource management at the local and regional levels [18,19]. In recent years, many studies have been conducted using multitemporal satellite images to monitor and map changes in forest cover around the world. These studies used developed methodologies for this purpose, such as pixel-based classification analyses [1,3,8,13,15,20,21,22,23,24,25,26,27], vegetation indices analysis [6,20,28,29], and object-based or object-oriented classification analyses [7,9,18,20,21,30,31,32,33,34]. Meanwhile, many studies based on remotely sensed data and GIS techniques have been conducted to study forest degradation in different regions around the world, such as those studies that used Landsat images and different vegetation indices to estimate the impact of selective logging, forest fires and the intense production of coal on the loss of forest cover as well as to map degraded forests [35,36,37,38,39,40,41]. Other studies have used time-series MODIS images to monitor near real-time land/forest cover changes and forest degradation [42,43,44].
Forests are among the most seriously threatened natural land uses in Syria due to human-induced deforestation activities, particularly those associated with the ongoing conflict since mid-2011. These activities are often represented by frequent forest fires occurring on a large scale as well as the illegal production of wood and firewood, which have transformed from individual encroachments by the population into collective encroachments that have destroyed thousands of hectares of forests [45]. Thus, it is expected that forests in the Syrian coast region, which represent more than 75% of the total area of Syria’s forests, have undergone remarkable changes during the conflict, and it is also expected that these forests have suffered from continuous depletion. To date, due to the ongoing conflict and the political situation in Syria, there are no studies that provide accurate, reliable, and comprehensive data on the temporal and spatial dynamics of forest change in this region and analyze the driving forces behind this change. Therefore, this study aims (1) to monitor LULC changes in the Syrian coast region using multi-temporal Landsat images during the period between 2010 and 2020, (2) to analyze the spatial and temporal dynamics of forest cover in order to determine the patterns of change in this cover, (3) to evaluate the density and distribution of forest cover, and (4) to identify the potential proximate drivers behind the dynamics of change in forest cover with a focus on direct and indirect drivers associated with the conflict situation in the country. By understanding the effects of the driving forces on changes in forest cover in the study area, this study can help in identifying the areas of initial intervention to protect the forests in the Syrian coast region from loss and degradation. In addition, this study can contribute to effective strategic planning for sustainable development of forest resources in Syria.
2. Study Area
The study area covers the Syrian coast basin or Syrian coast region, which is located in the western part of Syria (Figure 1). The coast region extends from Kel Dağı mountain (arabic, Ǧabal al-Aqraʿ) in the north to the depression of the Akkar Plain and the Baqi’a in the south, and from the drainage divide (water divide) between the Orontes River Basin and the coast Basin in the east and to the coastal strip in the west. The region is bounded by 34°31′ N to 35° 37′ N latitude and 35° 43′ E to 36° 26′ E longitude covering a geographical area of about 5388 km2.
The surface elevation varies between 0 to 1550 m above sea level, with an average of 775 m (Figure 2). Depending on the values of the elevation and the slope (Figure 2), the region can be divided into three basic geomorphological units, namely, the coastal strip or the coastal area that is characterized by its narrow plains (elevation, 0–121 m, slope, 0-2%), plateaus (elevation, 121–589 m, slope, 2.1–10%), and mountains (elevation, 590–1550 m, slope, 10.1–29%) [46,47,48]. The disturbances caused by the tectonic movements that extended from the early Pleistocene to the Upper Holocene, which were represented by the rise and fall of the sea level notably during the Tyrrhenian period, in addition, many geomorphological processes which were mainly controlled by climatic factors, had a clear impact on the formation and development of the bedrock in the region [48,49]. The bedrock is mostly composed of clayey lime-stone, sandstone, and composition of the limestone and marl deposits on which different types of soils have developed [48,49]. The main types of these soils are Entisols, Incepti-sols, Mollisols, and Vertisols [48,50].
The Mediterranean climate is the prevailing climate in the region [51,52]. This climate is characterized by hot and dry summers, while winters are wet and relatively cold [48,51]. Rainfall is concentrated mainly in the winter season (between November and March) [48]. The quantity of precipitation gradually increases with the above sea level altitude from the sea towards the inland regions, with an annual average ranging from 900 mm in the coastal strip to 1500 mm in the coastal mountains (Figure 2) [48,53,54]. The average annual temperature is about 20 °C in the coastal strip and about 15 °C in the coastal mountains [48,54].
The population of the study area reached about 2 million in 2009, with a population density of 405 inhabitants/km² in Lattakia governorate and 370 inhabitants/km² in Tartous governorate [52]. The population of the region is currently around 3 million [48,55]. The region economy is mainly based on traditional agriculture, where fertile plains are cultivated with citrus fruits, olives, and field crops such as wheat. Vegetable cultivation and greenhouse cultivation are also widespread in the southern region (Akkar plain) [47,48,52]. The coast region witnessed a remarkable increase in population between 2011 and 2020 as a result of the large-scale displacement of civilian population from the internal areas to the Lattakia and Tartous governorates, which remained relatively untouched by the fighting during the conflict (Figure 3) [56]. This rapid increase in population combined with rural-to-urban migration has resulted in extensive urbanization and strong economic pressures on the region [48,52]. Statistics indicate that the population density in the narrow coastal strip was nearly 20 times the national average and 6 times the average population density in other areas of the study area [51,52,55].
Forests in the Syrian coast region are Mediterranean forests, and their spread is often linked to climate and landforms [57,58]. These forests contain trees of various ages and sizes, the most important of which are broad-leaf trees such as oaks (Quercus) of all kinds, conifers such as Aleppo pine (Pinus halepensis), and turpentine trees (Pistacia palaestina), which cover 57%, 29% and 9% of the forest area, respectively, in addition to the juniper (Juniperus excelsa), cilician fir (Abies cilicica), and cedar (Cedrus libani) trees that form high-altitude forests in the region [57,58]. Figure 4 shows the approximate distribution of main natural forests in the study area for the year 2010, which include evergreen forests (coniferous Forests) and moist deciduous forests (broad-leaved Forests). The natural non-forest vegetation consists of scrubs that include small areas of sparse vegetation and low shrubs [57,58,59,60]. Table 1 also shows the area of these forests in the study area.
3. Materials and Methods
3.1. Data Source
Landsat satellite images were used to detect temporal and spatial changes of forest cover as well as to map the distribution and density of this cover in the study area between 2010 and 2020. For this purpose, Landsat-5 thematic mapper (TM) and Landsat-8 Operational Land Imager (OLI) images for the three target years 2010, 2015, and 2020 were obtained from the official website of the US Geological Survey (USGS) [61]. Landsat images, which have a spatial resolution of 30 m, have spectral properties suitable for detecting changes in LULC [22,27,47,62,63]. Details of the Landsat images used in this study are shown in Table 2. To improve detection of changes in forest cover during the classification, Landsat images captured in the dry season were chosen because the increase in vegetative surface cover in the growing season may lead to spectral confusion, which creates a complication in distinguishing among the various land use categories on the classified images [7,15], especially since the study area contains several tree crops (olives and fruit tree plantations) that are planted on the terraced hillsides [51]. The selected Landsat images were also completely free of clouds to reduce the effect of atmospheric attenuation and water vapor content on land use classification [7,51]. The selection of Landsat images during this period of the year also took into account the forest fires that broke out at the beginning of the dry season in the forests of the Syrian coast, especially the frequent fires that occurred on a large scale in the late summer of 2020 [64]. ASTER DEM from NASA Earth data [46], which closely matches Landsat images in terms of georeferencing and spatial resolution, was used to derive both parameters (elevation and slope) in the study area. Elevation (in meters above sea level) was obtained directly from the ASTER-DEM. Slope (percent rise) was calculated from all eight neighbor of pixels of the ASTER-DEM using the custom functions in ArcGIS. Population data for all districts within the five governorates of the study area were obtained from official statistical records as well as from demographic and health surveys conducted by international organizations [55,65,66,67]. These demographic and topographic data were used to produce variables for the spatial regression model to analyze the factors associated with the spatial extent dynamics of the forest cover in the study area. Due to the ongoing conflict in Syria, it was not possible to conduct field observations in the study area to collect ground truth data relevant to ascertain the accuracy of the classification and the accuracy of the forest cover maps that were created for the study area. Therefore, the supplementary data was used as external inputs in the post-classification phase, which was sufficient to determine the characteristics of the natural environment and land use in the study area [51]. These data included high resolution Google-Earth archive data and topographic maps in scales ranging from 1:25,000 to 1:1,50,000. In order to identify the types of forests and their distribution in the study area, data of previous studies on vegetation cover in the Syrian coast region were used [57,58,59,60]. These studies dealt with the distribution of the main tree species of the studied forests at different levels according to the elevation within the different landscapes.
3.2. Image Processing, Classification, and Change Detection
Although Landsat images are geometrically and radiometrically corrected by USGS [61], changes in the spectral characteristics of surface features due to different atmospheric conditions in a humid climate can cause difficulties in applying the pixel-based classification [15,51,68,69]. Therefore, pre-processing of the Landsat images was performed, which included geometric correction, atmospheric correction and radiometric processing [70,71]. Landsat images were pre-processed individually using ENVI 5.3 software, where these correction procedures have corresponding operation modules in the toolbox. The study area was then clipped from Landsat images for each study year using ArcGIS 10.5 The color combinations of Landsat imagery bands were also chosen, which take into account the contrast and distinction between different land uses, especially vegetation formations (band 5-4-3 as RGB for Landsat 5 TM and band 6-5-4 as RGB for Landsat 8 OLI) [3].
A supervised classification method using the maximum likelihood classifier (MLC) algorithm was applied using ArcGIS 10.5 for Landsat images classification purpose in the study area. This classification method is known for its strong theoretical basis and its ability to accommodate changing spectral signatures of different land uses [27]. This classification algorithm also achieved the best results for the purposes of classifying land uses in sub-humid and humid areas as comparable environments using similar data [3,13,15,20,47,72]. Training samples for the classifier were obtained using visual interpretation from high resolution Google Earth data and Normalized Difference Vegetation Index (NDVI) images to compare with the color combination chosen for the Landsat image bands. These samples were selected independently for each image in accordance with the size and location of the land use classes within the study area [47,68]. This ensures, as far as possible, to obtain different spectral signatures that represent all categories of land use. These categories and their description are given in Table 3. After classification, the Majority Filter (3 × 3 pixels) tool was applied in ArcGIS to smooth and remove noise in the classification categories known as the “salt and pepper” effect [15,73]. Then, based on the number of pixels, the area of each LULC class was extracted.
Accuracy assessment is an important step during the classification because it reflects the real difference between the results of the Landsat image classification and the reference data (ground truth points) [3,13,27,73]. Accordingly, a confusion matrix was applied to the classified images to calculate and compare the user’s accuracy (UA), producer’s accuracy (PA) and the overall accuracy [27,74,75]. For this purpose, a stratified random sampling approach was taken by allocating sample points in each category of LULC [9,51]. Therefore, for each classified image, 500 random validation points outside the training areas were selected based on the minimum sample size for each stratum, which is 20 points [9,51,76]. Thus, the number of points identified in each category matches the relative size of the corresponding land use category. The exception was the number of water body samples due to the unique and identifiable spectral signature. The ground truth status of these validation points was examined and evaluated by comparing the land use classification results with high-resolution Google Earth images, which correspond to the date (±10 days) of the Landsat image, the accuracy was then calculated for each category of LULC. LULC classification results can contain uncertainties that can mainly result from classification errors, homogeneity, and autocorrelations within the classifier training samples and classification accuracy assessment samples chosen during the manual preparation induced by the interpreter [77,78,79]. Therefore, in order to improve the interpretation of classification results and the error matrix, error-adjusted area estimates and confidence intervals at the 95% level as well as adjusted accuracy values were calculated according to the statistical approach recommended by Olofsson et al. (2013, 2014) [79,80]. Based on the adjusted area estimates, the change in LULC categories was detected by comparing the classification results for the three target years.
To map the forest cover in the study area, the categories of land use were reclassified using ArcGIS on all classified Landsat images, where the category of forest cover was assigned to values of “1”, and all other land use categories were integrated into one category “non-forest”, which was assigned to “0” values [3,15]. The Normalized Difference Vegetation Index (NDVI) is the most widely used for vegetation detection, particularly to distinguish vegetation from non-vegetation areas [81,82,83]. This index is also used to determine the density of forest/vegetation cover in relation to the reflectance values of the visible (RED) and near infrared bands (NIR) [20,33,81]. Landsat images of the study area for the years 2010, 2015 and 2020 were reclassified based on measured NDVI threshold values to extract three categories of forest cover density: NDVI < 0.1: dispersed forest and shrubs, 0.2 < NDVI < 0.4: open forest, 0.4 < NDVI < 0.74: dense forest. This NDVI-based classification corresponds to the supervised classification of forest cover based on Landsat imagery. The visual interpretation based on high resolution Google Earth images and the available data on the forest cover of the study area was used to determine the main forest cover types that correspond to the density classes [57,58,59,60].
3.3. Variables Acquisition Related to Drivers of Change in Forest Cover
In order to implement proximate drivers of forest cover change in the study area and to determine their relationship to the observed changes obtained from classified Landsat images, the physical and socio-spatial model was used as proposed by Wilson et al. (2013) [84]. In this model, the spatial regression was applied using the ordinary least squares (OLS) in ArcGIS for the preparation of non-stationary variables at the level of small administrative units (districts) within the five governorates of the study area as a first step. The second step was to apply geographically weighted regression (GWR), a local form of linear regression. This model allows for a spatial analysis of the independent/explanatory variables (physical and socio-demographic variables) and the identification of spatially varying local relationships between these variables and the spatial extent of forest cover. The following equation shows the construction of the GWR technique used in linear form, which allows the inclusion of specific explanatory variables as parameters related to specific coordinates of their dispersion in spatial extents of land uses [84]. This technique is fully described by Krivoruchko (2001) [85].
where Y(g,r) is the dependent variable (class of forest cover) at specific coordinates g and r (location of districts within each governorate). This variable describes the linear relationship between forest cover extent and explanatory variables. β0, β1, β2 and βn are the parameters to be derived at coordinates (g,r) for every location. X1, X2, and Xn represent the explanatory covariates and ε is the random error term.
Y(g,r) = β0 (g,r) + β1(g,r)X1 + β2(g,r)X2 + … + βn(g,r)Xn + ε
A total of eight socio-demographic variables influenced by the availability of relevant data for the study area under the conflict were analyzed as drivers of change in forest cover (Table 4). Information on socio-demographic variables can provide indicators of changes in forest cover resulting from specific human activities such as shifting cultivation (slope cultivation), logging and burning of native forests, and urban expansion [22,84], especially since Syria is witnessing an intense conflict, as the risks of forest exploitation increase due to weak state management and protection of forest resources. Topographic parameters such as elevation and slope can provide indicators of people’s access to forests or conversion of forest lands into other uses as farming (plantations) and acquisition for construction [22]. Slope is also a controlling factor in land surface processes because it affects soil properties and water content in addition to the potential for erosion of forest lands located on steep slopes or high altitudes [22,86].
The dataset on these independent variables were examined statistically to reveal whether the data is skewed and if there are unusual observations (outliers) that cause unstable estimates and inaccurate variations in the linear relationship between these variables [22,86]. No outliers were found, thus these variables can be analyzed spatially within the applied spatial model.
Given the state of conflict and the fluctuating politico-military situation in Syria, it was not possible to obtain statistical data on the number of combatants to the parties to the conflict. As a result, the data of these actors were not statistically included in forest cover changes in the applied model. However, by tracking the course of the field situation of the conflict and the changes in the areas of control between the warring parties and estimating the numbers and movements of these fighters, it was possible to gain an understanding of their impact on forest cover in the study area.
Another important variable that has a major influence on the change of forest cover in the study area is forest fires. The rate of forest cover loss appeared to have risen sharply after 2011 due to an increase in the number of forest fires [64]. To monitor and map the burned areas during the study period, the spectral signature of burned forest areas was determined on Landsat images. Using the re-classify tool available in ArcGIS 10.5, the burned areas were assigned to the values of “1”, while the pixels of all other LULC categories were merged into one category and assigned to the values of “0” [3,15,27]. Manual interpretation with the help of high-resolution Google Earth imagery and the NDVI values was used to improve the accuracy of the resulting maps.
4. Results
4.1. Classification Accuracy Assessment
Accuracy assessment was systematically performed for each classified Landsat image (Table 5). The adjusted overall accuracy was in the final classification maps of LULC about 89% in 2010, 90% in 2015, and 86% in 2020. A standard overall accuracy for LULC classification is known to be between 75% [3,87] and 90% [88]. Nevertheless, the results of the classification accuracy assessment indicate that it is impossible to separate all types of LULC in the study area. This could be caused by confusion represented by an increase in errors of omission and commissions in cultivated lands, especially those planted with tree crops (fruit tree plantations), which in some cases have been confused with the forest class of lower elevations (dispersed forest and shrubs). In addition, low spectral separation of bare areas can lead to mixed-pixel problems on Landsat images and thus to errors in the classification results. This is reflected in the PA of bare areas classification.
The water bodies category obtained the highest PA results (100%) for all target years due to its distinctive spectral signature on Landsat images. In general, urban areas showed the lowest PA (85%) on average for the study years. PA for forest category was above 88% in all years of study. Due to the somewhat limited resolution of Landsat imagery, open structures for human activities, such as quarries and military sites, were mostly misclassified as bare areas.
4.2. Change in LULC between 2010 and 2020
The LULC classification results for the study area are represented in Figure 5 as well as the corresponding LULC data in Table 6. Table 7 also shows the amount of conversion of LULC classes from one class to another. The analysis of land use changes in the study area between 2010 and 2020 is based on the results of the adjusted area estimates calculated for the spatial extent of the LULC categories, also taking into account the 95% confidence intervals. Analysis of LULC change shows great variation in the size and direction of land use over the study period. The most notable changes were the continuous increase in cultivated areas, bare areas, and urban areas, while there was a continuous decrease in the forest cover. Statistical analysis indicates that the cultivated area was the dominant form of land use in 2010, which represented 48.3% of the study area (260,370.1 ± 10,624 ha), followed by forest cover (128,303.7 ± 7648.0 ha, 23.8% of the study area), bare areas (121,833.8 ± 7284 ha, 22.6% of the study area), and urban areas (25,920.4 ± 4163.0 ha, 4.8% of the study area). By the year 2015, the spatial extent of cultivated lands, bare areas and urban areas increased to 268,627.0 ± 12,772.0 ha (49.9% of the study area), 122,495.0 ± 10,164.0 ha (22.7% of the study area), and 26,653.0 ± 9741.5 ha (4.9% of the study area), respectively, while forest cover decreased to 119,167.0 ± 10,644.0 ha (22.1% of the study area). Water bodies did not change considerably in comparison to other LULC types. In 2010, the water bodies amounted to 2427.6 ± 365.0 ha (0.5% of the study area). The area covered by rivers, ponds, and lakes decreased to 1914.0 ± 376.0 ha by 2015, but subsequently increased to 2431.2 ± 353 ha by 2020.
4.3. Spatial Patterns of Forest Cover Change (2010–2020)
The results of the analysis of forest cover changes indicate that forest cover decreased by 1830.0 ha per year between 2010 and 2015, and its spatial extent continued to decrease by 4400.0 ha per year between 2015 and 2020 (Figure 6 and Table 4). In general, over the past ten years, the forest cover in the study area showed a declining trend by 3112.0 ha/year. This decrease in forest cover was at the expense of the expansion of agricultural land and the increase of bare areas (Table 7).
Table 8, Table 9, and Figure 7 show the spatial and temporal dynamics of forest cover density for 2010, 2015, and 2020. The spatial distribution map of forest cover density for 2010 indicates that dense forest areas (30,117.8 ha) are mainly located in the north and east of the study area in the Lattakia Governorate, where coniferous forests and mixed deciduous forests predominate, while open forests (32,600.3 ha) are located in the east of the study area in the governorates of Latakia and Hama (Figure 7, Figure 4). The dispersed forests and shrubs (65,585.6 ha) are distributed in the center, central east and southeast of the study area in the governorates of Hama and Tartous, which consist of riverside forests, Pinus bruita forests, and Abies cilicica forests.
Analysis of change in forest cover density revealed that between 2010 and 2020, a total of 11778.3 ha (9.2% of the forest cover) of dense forests degraded into open forests at a rate of 1177.8 ha/year (Table 8 and Table 9). These dense forests can only be found in remote areas such as isolated mountain peaks or on infertile soil substrates in the mountains between Hama and Lattakia governorates. The results of the detection of changes also indicate that there was an increase in open forests during the study period. Open forests increased by about 1463.0 ha/year between 2010 and 2020. This increase in open forests, which reached 14,633.4 hectares (11.4%) by 2020, was at the expense of degradation of dense forests. The results of the forest cover density classification also showed that dispersed forests recorded a significant decrease between 2010 and 2015, reaching 43,707.7 ha in 2015 (36.7% of the forest cover). The decline of dispersed forests continued between 2015 and 2020, covering about 31,615.5 ha (32.5% of the forest cover) in 2020 (Table 8 and Table 9). Although there was an increase in the total open forests due to thinning of dense forests in the study area, at the same time an area of about 2855.0 hectares (2.2%) of scattered forests and shrubs that were changed into open forests was found during the study period. The degradation of dispersed forests increased with the increase in bare areas and cultivated lands.
4.4. Variables Analysis Associated with Forest Cover Changes
Figure 8 shows the results of the spatial regression analysis between the extent of forest cover and the physical and socio-demographic variables during the study period. The spatial regression model for 2010 show a moderate correlation between forest cover and all socio-demographic variables (R2 = 0.67) as well as elevation (R2 = 52), while the regression equation indicated a strong correlation with slope (R2 = 76). Spatial regression analysis revealed a stronger determination coefficient between the spatial extent of forest cover and slope for the year 2020 (R2 = 73) which is represented by a strong relationship compared to the year 2015 (R2 = 69) which showed a moderate relationship, while the value of the coefficient of determination of the relationship between the spatial extent of forest cover and elevation for 2015 (R2 = 55) is almost identical to the value recorded in the 2020 model that represents a moderate relationship (R2 = 52). It is evident from this that both elevation and slope were significantly related to the possibility of a decrease in the forest cover in the study area.
By comparing the results of this correlation with the dynamics of forest change for the study area (Figure 5), it is evident that the forest cover was subject to decline in areas with elevations from 121–589 m and slopes less than 2.1%, which in turn are associated with the effect of local people who use forest resources and the conversion of forest lands to agricultural areas in these areas. It was also found that the decline in forest cover was negatively related to all socio-demographic variables during the study period. An exception is the group of unemployed for the base year 2010. This means that there are activities at the local and regional levels related to the population, their economic situation and their educational level that have led to disturbances in forest cover, especially after the year 2015, and this is evidenced by the decrease in the spatial extent of forest cover and the increasing correlation between this extent and the socio-demographic variables, especially between 2015 and 2020 (Table 9, Figure 8).
The results of the detection of burned forest areas indicate that the burned area expanded significantly from 12,177.0 ha (9.5% of the forest area) in 2015 to 26,161.0 ha (20.0%) in 2020, while the burned area did not exceed 500 ha in 2010. The burned areas are mainly concentrated in the forests located in the north of the study area, which since 2011 have been subject to mutual control between the opposition forces in Idleb Governorate and the Syrian regime forces that control Lattakia Governorate (Figure 9).
5. Discussion
Based on the consistency of the classification evaluation used in this study and the findings of the change detection analysis, it was found that the forest cover in the Syrian coast region underwent rapid spatial and temporal changes between 2010 and 2020. In what follows, based on the own analysis of the physical and socio-demographic variables associated with forest cover changes, and by the reporting and interpretation of evidence from various other relevant studies, we discuss possible direct and indirect drivers that may have led to these changes in forest cover during the study period. Thus, the focus will be mainly on the potential impacts of the conflict, but also on the potential impacts of prevailing climate conditions.
5.1. Forest Cover Change and Conflict Conditions
The results of the study indicate that the declining trends in forest cover were associated with human activities that occurred as a result of socio-economic factors linked to the conflict. These activities were represented by agricultural expansion, forest fires, illegal logging, charcoal production, and increased built land and population.
In the wake of the armed conflict, hundreds of thousands of residents have migrated to the coastal governorates after 2012 in search of safety and protection [89]. New migrants in these provinces increased the demand for food and other agricultural products. This creates an incentive for farmers to increase their agricultural production by expanding agricultural land in forested hills and low areas to meet the growing needs of the population and achieve economic gains, especially in the absence of preserving forest areas and natural vegetation cover as a result of weak state institutions control [64,90]. For this reason, factors such as population increase, high unemployment rate, gender, and an increase in the number of uneducated people can lead to an increase in commercial crops cultivation at the forest edge which in turn lead to a significant reduction in open forests and threaten the inland parts of the forests where there are dense natural forests. This is illustrated by the spatial analysis of forest cover and the change in cultivated areas during the study period, where the area under cultivation in the coastal governorates of Lattakia and Tartous increased between 2010 and 2020 by 4.7% and 1.3%, respectively. This is an indication of the increasing reliance of the local community in the coast region on agriculture as the main source of livelihood in light of the ongoing conflict since mid-2011. This interpretation is consistent with other studies around the world that have dealt with deforestation in different regions of the world over different time periods, as these studies reported that the change in social and economic factors was the main reason for the decline or deterioration of forest cover [22,27,30,32]. This finding is also in agreement with studies on the changing environment during armed conflicts in other regions around the world, which identified livelihood activities by local and displaced people and unsupervised settlements as the main causes of forest loss [47,91,92,93].
The results of the explanatory variables analysis also indicated that areas of forest cover loss were also associated with higher elevation areas in the study area. Shifting agriculture, which is mostly located in high mountain areas, contributes to the acceleration of the decline in forest cover. In light of the deteriorating economic situation and the high level of poverty among the local population, feeling about the benefits of environmental services that come from forest cover are non-existent or limited [47,90,94]. Therefore, forest lands are grabbed and cleared despite their ownership by the state, in an attempt by these populations to own small scale farms (plantations) for subsistence and for agricultural production. Similar scenarios have occurred in other regions around the world [7,13,22,27,32].
Economic crises at the local and national levels during the armed conflict in Syria may increase pressure on forest cover for several years. This is mostly represented by heavy logging as a result of the increasing demand by the local population or the surrounding urban area for firewood and charcoal to support their livelihood, especially given the high price of fuel and severe cold during the winter months [64]. In an advanced stage of the conflict, especially after 2015, logging was directly linked to an increase in population and an increase in the demand for wood for construction and energy, which led to an increase in wood production within the study area and its sale in other parts of the country [95]. Fuelwood and charcoal are produced within the study area in a weak institutional environment. In addition, as a result of the increasing demand on forest resources, in the form of firewood and charcoal inside and outside the study area, armed opposition groups and armed militias affiliated with the Syrian regime have exploited forest resources of high economic values to achieve immediate economic gains [64]. Previous studies and reports suggest that the collection of fuelwood and charcoal production in the coastal mountains controlled by the government and opposition is one of the main reasons for the decline in forest cover in Syria [64,90,94].
Another major factor that has contributed to the decline in forest cover in high mountain areas within the study area is forest fires. According to a study by the Food and Agriculture Organization of the United Nations (FAO), fires do more damage to forests and wooded areas than any other natural factors such as bacterial diseases, insects, tornadoes, frost, etc. [96]. The number and spatial extent of forest fires has increased dramatically during the conflict in Syria. The largest fires recorded between December 2019 and December 2020 [97]. One of the main causes of these fires is the mutual bombardment between the conflict parties holed up in dense forests, especially those located in the northeast of the study area in the governorates of Idleb and Lattakia [45,47,64]. Opposition forces also used dense forests as a protection shield to avoid being detected from by drones and aircraft [56,98], which increased the number of fires that occur as a result of fighting between the warring parties. In addition, fires occur on the lower land of forests as a result of uncontrolled human activity, such as the uncontrolled burning for coal production as well as campfires and negligence or accidents [96]. These results are consistent with a number of previous studies and reports, which indicate a decrease in forest area in some coastal areas and in the northwest of Idleb governorate for reasons related to the ongoing conflict, such as heavy logging for production of fuelwood and charcoal, as well as forest fires a result of fighting between the warring parties [47,90,94].
Another reason that contributes to the shrinking of forests in low elevation areas is the appropriation of land within forests for construction. Forests are first converted to agricultural land or bare lands, then are converted into urban areas through the illegal acquisition of land [47]. During the study years, the increase in urban and peri-urban (built-up area) at the expense of forests was also associated with the attempts of some local residents and real estate dealers to benefit from the sheltering of the displaced population who were forced to leave their homes during the conflict, which led to the growth of urban agriculture and construction work in forest areas.
5.2. Forest Cover Change and Climate Conditions
Climate conditions can be linked to civil wars as well as ongoing violent conflicts and resulting poor management practices of forest resources and unsustainable environmental policies [99,100,101,102,103]. This could increase the rate of forest loss and amplify environmental implications. Thus, climate change is referred to as a threat multiplier [104]. Although most of the forest fires in the Syrian coast region occur during the dry season, especially in the months of August, September, October and November, however, the rate of loss of forest cover and increase in its frequency after the outbreak of the conflict in mid-2011 cannot be explained by lower rainfall rates and impact of drought years [64]. Examination of the annual temporal and spatial distribution of precipitation and temperature fluctuations showed that there was no significant trend towards less/more drought prone conditions in the study period. In all years after 2011, the Syrian coast region witnessed higher than average rainfall (Figure 2) [64]. Comparing the amount of rainfall for the three targeted study years 2010, 2015 and 2020 with the area of forest cover recorded in these years indicates that rainfall is not associated with forest loss. Statistical data indicates that the rate of forest loss in 2020 was almost 18.5% higher than in 2015 and 24.3% higher than in 2010 (before the conflict), although the amount of rainfall recorded in 2020 (951 mm) and 2015 (1288 mm) was higher than in 2010 (934 mm).
In general, climatic conditions should be taken into account when studying the changes in forest cover in the environments in which the Mediterranean climate prevails, which is characterized by the high amount of rain within a short period of time and a long hot dry period that may reach nine months. However, it is concluded that climate impacts regarding fluctuation of rainfall and temperature were not the main driver for forest cover changes during the study period.
6. Conclusions
In this study, the spatial and temporal changes in the forest cover in the Syrian coast region between 2010 and 2020 were monitored and analyzed using multi-temporal Landsat data. Changes in forest cover density were also quantified and analyzed for the same time period. In addition, this study analyzed the relationship between physical and socio-demographic variables in terms of loss of forest cover. The results of the study revealed that the study area witnessed a significant decrease in the total forest area during the study period, where the loss of forest cover, the decrease in the area of dense forests and the increase of dispersed forest are indications of the pressure on natural forests as well as the fragmentation and degradation of these forests. In the foreseeable future, it is not possible to determine whether these specific changes in forest cover and its density will be permanent or temporary. The change in forest cover was driven by a variety of different factors related to the conflict. This study identified these drivers by linking them to relevant published literature. The main drivers were demographic shifts, changes in economic and social activities, extensive exploitation of forest resources, expansion of the cultivated lands, frequent forest fires, weakness of state institutions in managing natural resources and environmental development, and a change in the balance of power between the warring parties. Fluctuating climatic conditions are not a major driver of forest cover dynamics in the study area.
The degradation or destruction of forests will disturb the habitats of wild plants and animals, thus threatening the biodiversity and forest environment in the Syrian coast region. The continuous decrease in forest area and denudation is likely to cause a rapid and continued increase in soil erosion, leading to silting of dam reservoirs and shortening their service life span, as well as increasing the likelihood of adverse effects of floods and landslides. This, in turn, leads to serious economic, social and environmental impacts on land systems and their administration. In addition, the expansion of cultivated area at the expense of natural forests in light of the conflict and the absence of state institution could lead to conflicts over the ownership of forest lands and exploitation rights, consequently hindering future development of forest cover and reforestation. In the face of this precarious situation, immediate measures are required. A targeted policy should be implemented by responsible decision-makers and administrative authorities in order to conserve forests and control further degradation as well as restore forest cover areas that have been lost. In addition, long-term strategies for forest conservation and the integration of local communities in the sustainable management of forest resources should be developed and specified.
The results of the study showed that the approach to detect changes in forest cover and its density based on Landsat images is accurate and effective in measuring forest loss and degradation in an active war zone. Therefore, remote sensing technology is recommended for major studies related to different land use changes at the national level in Syria, such as monitoring and managing natural forest resources, potential forest loss, reforestation, and agricultural soil erosion and degradation. This proposed procedure to monitor land/forest cover changes is straightforward to apply and allows monitoring future developments of forest cover also by using the freely available Landsat images in other seasons and under different spatial conditions, especially since field studies cannot be carried out due to the conflict situation in Syria, in addition to, the lack of proper funding for such studies. The study can reach a higher resolution for detection of spatial and temporal changes in forest cover when high-resolution satellite data and multi-year ground truth data are available for the study area.
This study provides quantitative and qualitative information about the dynamics of land/forest cover changes, and aims to establish a basis for understanding the drivers behind them during a period of conflict in Syria. Therefore, this study can contribute to developing strategies for sustainable management of lands and their uses as well as reducing adverse environmental impacts by monitoring human activities and promotion of rural areas in order to reduce pressure on forest resources and improve biodiversity conservation. The results of this study may draw the attention of decision-makers to take immediate actions and identify areas of initial intervention to protect the current forests of the Syrian coast region from loss and degradation. It is hoped that Syria will regain its stability in the near future and that there will be effective strategic planning for land use, and that priority will be given through it to preserve and increase the forest cover at the local and regional level, which is a crucial factor for sustainable development of the country.
Funding
This research received no external funding.
Data Availability Statement
Not applicable.
Acknowledgments
I thank the anonymous reviewers. Thanks to the German Research Foundation (DFG) and the Open Access Publication Fund of Humboldt-Universität zu Berlin for funding the article processing charge.
Conflicts of Interest
The author declares no conflict of interest.
References
- Kumar, D. Monitoring Forest Cover Changes Using Remote Sensing and GIS: A Global Prospective. Res. J. Environ. Sci. 2011, 5, 105–123. [Google Scholar] [CrossRef] [Green Version]
- Rao, K.S.; Pant, R. Land use dynamics and landscape change pattern in a typical micro watershed in the mid elevation zone of central Himalaya, India. Agric. Ecosyst. Environ. 2001, 86, 113–124. [Google Scholar] [CrossRef]
- Barakat, A.; Khellouk, R.; El Jazouli, A.; Touhami, F.; Nadem, S. Monitoring of forest cover dynamics in eastern area of Béni-Mellal Province using ASTER and Sentinel-2A. Geol. Ecol. Landsc. 2018, 86, 203–215. [Google Scholar] [CrossRef] [Green Version]
- Global Forest Resources Assessment 2015—How Are the World’s Forests Changing? Available online: http://www.fao.org/resources/infographics/infographics-details/en/c/325836/ (accessed on 21 October 2020).
- Gamfeldt, L.; Snäll, T.; Bagchi, R.; Jonsson, M.; Gustafsson, L.; Kjellander, P.; Ruiz-Jaen, M.C.; Fröberg, M.; Stendahl, J.; Philipson, C.D.; et al. Higher levels of multiple ecosystem services are found in forests with more tree species. Nat. Commun. 2013, 4, 1340. [Google Scholar] [CrossRef] [PubMed]
- Moyra, S.K.; Harza, S. Monitoring of Forest Cover Dynamics by Geospatial Technique—A Study in Nayagram Block of West Medinipur District, West Bengal, India. Mod. Environ. Sci. Eng. 2016, 2, 257–261. [Google Scholar] [CrossRef]
- Fokeng, R.M.; Forje, W.G.; Meli, V.M.; Bodzemo, B.N. Multi-temporal forest cover change detection in the Metchie-Ngoum Protection Forest Reserve, West Region of Cameroon. Egypt. J. Remote Sens. Space Sci. 2020, 113, 124. [Google Scholar] [CrossRef]
- Reddy, C.S.; Jha, C.S.; Dadhwal, V. Assessment and monitoring of long-term forest cover changes in Odisha, India using remote sensing and GIS. Environ. Monit. Assess. 2012, 185, 4399–4415. [Google Scholar] [CrossRef]
- Panigrahy, R.K.; Kale, M.P.; Dutta, U.; Mishra, A.; Banerjee, B.; Singh, S. Forest cover change detection of Western Ghats of Maharashtra using satellite remote sensing based visual interpretation technique. Curr. Sci. 2010, 98, 657–664. Available online: https://www.jstor.org/stable/24111818?seq=1#metadata_info_tab_contents (accessed on 22 October 2010).
- State of the World’s Forests 2016. Available online: http://www.fao.org/publications/sofo/2016/en/ (accessed on 22 October 2020).
- The State of the World’s Forests 2020. Available online: http://www.fao.org/documents/card/en/c/ca8642en (accessed on 22 October 2020).
- Seabrook, L.; McAlpine, C.; Fensham, R. Cattle, crops and clearing: Regional drivers of landscape change in the Brigalow Belt, Queensland, Australia, 1840–2004. Landsc. Urban Plan. 2006, 78, 373–385. [Google Scholar] [CrossRef]
- Negassa, M.D.; Mallie, D.T.; Gemeda, D.O. Forest cover change detection using Geographic Information Systems and remote sensing techniques: A spatio-temporal study on Komto Protected forest priority area, East Wollega Zone, Ethiopia. Environ. Syst. Res. 2020, 9. [Google Scholar] [CrossRef]
- Safriel, U.; Adeel, Z.; Niemeijer, D.; Puigdefabregas, J.; White, R.; Lal, R.; Winslow, M.; Ziedler, J.; Prince, S.; Archer, E.; et al. Dryland systems. In Ecosystems and Human Well-Being: Current State and Trends; Hassan, R., Scholes, R., Ash, N., Eds.; Island Press: Washington, DC, USA, 2005; Volume 1, pp. 623–662. Available online: http://www.millenniumassessment.org/documents/document.291.aspx.pdf (accessed on 18 October 2020).
- Kayiranga, A.; Kurban, A.; Ndayisaba, F.; Nahayo, L.; Karamage, F.; Ablekim, A.; Li, H.W.; Ilniyaz, O. Monitoring Forest Cover Change and Fragmentation Using Remote Sensing and Landscape Metrics in Nyungwe-Kibira Park. J. Geosci. Environ. Prot. 2016, 4, 13–33. [Google Scholar] [CrossRef] [Green Version]
- Mohajane, M.; Essahlaoui, A.; Oudija, F.; El Hafyani, M.; Teodoro, A.C. Mapping Forest Species in the Central Middle Atlas of Morocco (Azrou Forest) through Remote Sensing Techniques. ISPRS Int. J. Geo Inf. 2017, 6, 275. [Google Scholar] [CrossRef] [Green Version]
- Gonzalez-Redin, J.; Luque, S.; Poggio, L.; Smith, R.; Gimona, A. Spatial Bayesian Belief Networks as a Planning Decision Tool for Mapping Ecosystem Services Trade-Offs on Forested Landscapes. Environ. Res. 2016, 144, 15–26. [Google Scholar] [CrossRef]
- Shimizu, K.; Ota, T.; Mizoue, N. Detecting Forest Changes Using Dense Landsat 8 and Sentinel-1 Time Series Data in Tropical Seasonal Forests. Remote Sens. 2019, 11, 1899. [Google Scholar] [CrossRef] [Green Version]
- Finer, M.; Novoa, S.; Weisse, J.; Petersen, R.; Souto, T.; Stearns, F.; Martinez, R.G. Combating deforestation: From satellite to intervention. Science 2018, 360, 1303–1305. [Google Scholar] [CrossRef]
- Forkuo, E.K.; Frimpong, A. Analysis of Forest Cover Change Detection. Int. J. Remote Sens. Appl. 2012, 2, 82–91. Available online: https://www.researchgate.net/publication/269222395_Analysis_of_Forest_Cover_Change_Detection (accessed on 27 December 2020).
- Anees, A.; Aryal, J.; O’Reilly, M.M.; Gale, T.J.; Wardlaw, T. A robust multi-Kernel change detection framework for detecting leaf beetle defoliation using Landsat 7 ETM+ data. ISPRS J. Photogramm. Remote Sens. 2016, 122, 167–178. [Google Scholar] [CrossRef]
- Phompila, C.; Lewis, M.; Ostendorf, B.; Clarke, K. Forest Cover Changes in Lao Tropical Forests: Physical and Socio-Economic Factors are the Most Important Drivers. Land 2017, 6, 23. [Google Scholar] [CrossRef]
- Solomon, N.; Hishe, H.; Annang, T.; Pabi, O.; Asante, I.K.; Birhane, E. Forest Cover Change, Key Drivers and Community Perception in Wujig Mahgo Waren Forest of Northern Ethiopia. Land 2018, 7, 32. [Google Scholar] [CrossRef] [Green Version]
- Baral, P.; Wen, Y.; Urriola, N.N. Forest Cover Changes and Trajectories in a Typical Middle Mountain Watershed of Western Nepal. Land 2018, 7, 72. [Google Scholar] [CrossRef] [Green Version]
- Ngwira, S.; Watanabe, T. An Analysis of the Causes of Deforestation in Malawi: A Case of Mwazisi. Land 2019, 8, 48. [Google Scholar] [CrossRef] [Green Version]
- Ango, T.G.; Hylander, K.; Börjeson, L. Processes of Forest Cover Change since 1958 in the Coffee-Producing Areas of Southwest Ethiopia. Land 2020, 9, 278. [Google Scholar] [CrossRef]
- Doaemo, W.; Mohan, M.; Adrah, E.; Srinivasan, S.; Corte, A.P.D. Exploring Forest Change Spatial Patterns in Papua New Guinea: A Pilot Study in the Bumbu River Basin. Land 2020, 9, 282. [Google Scholar] [CrossRef]
- Mancino, G.; Nolè, A.; Ripullone, F.; Ferrara, A. Landsat TM imagery and NDVI differencing to detect vegetation change: Assessing natural forest expansion in Basilicata, southern Italy. Iforest Biogeosci. For. 2014, 7, 75. [Google Scholar] [CrossRef] [Green Version]
- Czerwinski, C.J.; King, D.J.; Mitchell, S.W. Mapping forest growth and decline in a temperate mixed forest using temporal trend analysis of Landsat imagery, 1987–2010. Remote Sens. Environ. 2014, 141, 188–200. [Google Scholar] [CrossRef]
- Reusing, M. Change detection of natural high forests in Ethiopia using remote sensing and GIS techniques. Int. Arch. Photogramm. Remote Sens. 2000, 33, 1253–1258. Available online: https://www.isprs.org/proceedings/XXXIII/congress/part7/1253_XXXIII-part7.pdf (accessed on 13 October 2020).
- Sexton, J.O.; Urban, D.L.; Donohue, M.J.; Song, C. Long-term land cover dynamics by multi-temporal classification across the Landsat-5 record. Remote Sens. Environ. 2013, 128, 246–258. [Google Scholar] [CrossRef]
- Molinario, G.; Hansen, M.C.; Potapov, P.V. Forest cover dynamics of shifting cultivation in the Democratic Republic of Congo: A remote sensing-based assessment for 2000–2010. Environ. Res. Lett. 2017, 12, 1–15. [Google Scholar] [CrossRef]
- Melville, B.; Lucieer, A.; Aryal, J. Object-based random forest classification of Landsat ETM+ and WorldView-2 satellite imagery for mapping lowland native grassland communities in Tasmania, Australia. Int. J. Appl. Earth Obs. Geoinf. 2018, 66, 46–55. [Google Scholar] [CrossRef]
- Harrison, D.; Rivard, B.; Sánchez-Azofeifa, A. Classification of tree species based on longwave hyperspectral data from leaves, a case study for a tropical dry forest. Int. J. Appl. Earth Obs. Geoinf. 2018, 66, 93–105. [Google Scholar] [CrossRef]
- Matricardi, E.A.T.; Skole, D.L.; Cochrane, M.A.; Qi, J.; Chomentowski, W. Monitoring selective logging in tropical evergreen forests using landsat: Multitemporal regional analyses in Mato Grosso, Brazil. Earth Interact. 2005, 9, 1–24. [Google Scholar] [CrossRef]
- Matricardi, E.A.T.; Skole, D.L.; Cochrane, M.A.; Pedlowski, M.; Chomentowski, W. Multi-temporal assessment of selective logging in the Brazilian Amazon using Landsat data. Int. J. Remote Sens. 2007, 28, 63–82. [Google Scholar] [CrossRef]
- Matricardi, E.A.T.; Skole, D.L.; Pedlowski, M.A.; Chomentowski, W.; Fernandes, L.C. Assessment of tropical forest degradation by selective logging and fire using Landsat imagery. Remote Sens. Environ. 2010, 114, 1117–1129. [Google Scholar] [CrossRef]
- Asner, G.P.; Knapp, D.E.; Broadbent, E.N.; Oliveira, P.J.C.; Keller, M.; Silva, J.N. Selective logging in the Brazilian Amazon. Science 2005, 5747, 480–482. [Google Scholar] [CrossRef] [PubMed]
- Souza, C.M., Jr.; Roberts, D.A.; Cochrane, M.A. Combining spectral and spatial information to map canopy damages from selective logging and forest fires. Remote Sens. Environ. 2005, 98, 329–343. [Google Scholar] [CrossRef]
- Margono, B.A.; Turubanova, S.; Zhuravleva, I.; Potapov, P.; Tyukavina, T.; Baccini, A.; Goetz, S.; Hansen, M.C. Mapping and monitoring deforestation and forest degradation in Sumatra (Indonesia) using Landsat time series data sets from 1990 to 2010. Environ. Res. Lett. 2012, 7, 034010. [Google Scholar] [CrossRef]
- Sedano, F.; Lisboa, S.N.; Duncanson, L.; Ribeiro, N.; Sitoe, A.; Sahajpal, R.; Hurtt, G.; Tucker, C.J. Monitoring forest degradation from charcoal production with historical Landsat imagery. A case study in southern Mozambique. Environ. Res. Lett. 2020, 15, 015001. Available online: https://iopscience.iop.org/article/10.1088/1748-9326/ab3186 (accessed on 2 January 2021). [CrossRef]
- Anees, A.; Aryal, J. A Statistical Framework for Near-Real Time Detection of Beetle Infestation in Pine Forests Using MODIS Data. IEEE Geosci. Remote Sens. Lett. 2014, 11, 1717–1721. [Google Scholar] [CrossRef]
- Anees, A.; Aryal, J. Near-real time detection of beetle infestation in pine forests using MODIS data. IEEE J. Sel. Top. Appl. Earth Obs. Remote Sens. 2014, 7, 3713–3723. [Google Scholar] [CrossRef]
- Anees, A.; Aryal, J.; O’Reilly, M.M.; Gale, T.J. A Relative Density Ratio-Based Framework for Detection of Land Cover Changes in MODIS NDVI Time Series. IEEE J. Sel. Top. Appl. Earth Obs. Remote Sens. 2016, 9, 359–3371. [Google Scholar] [CrossRef]
- Food Security & Conflict in Syria. Available online: https://www.scpr-syria.org/launch-of-food-security-conflict-in-syria-report/ (accessed on 26 October 2020).
- ASTER Global Digital Elevation. Available online: https://search.earthdata.nasa.gov/search/ (accessed on 28 October 2020).
- Hammad, M.; Mucsi, L.; van Leeuwen, V.B. Land cover change investigation in the southern Syrian coastal basins during the past 30-years using Landsat remote sensing data. J. Environ. Geogr. 2018, 11, 45–51. [Google Scholar] [CrossRef] [Green Version]
- Mohammed, S.; Abdo, H.G.; Szabo, S.; Pham, Q.B.; Holb, I.J.; Linh, N.T.T.; Anh, D.T.; Alsafadi, K.; Mokhtar, A.; Kbibo, I.; et al. Estimating Human Impacts on Soil Erosion Considering Different Hillslope Inclinations and Land Uses in the Coastal Region of Syria. Water 2020, 12, 2786. [Google Scholar] [CrossRef]
- Sanlaville, P.; Dalongeville, R.; Bernier, P.; Evin, J. The Syrian Coast: A Model of Holocene Coastal Evolution. J. Coast. Res. 1997, 13, 385–396. Available online: https://journals.flvc.org/jcr/article/view/80154 (accessed on 27 January 2020).
- Ghanem, S.; Rukia, A.A.; Sulieman, M.M.; Brevik, E.C.; Mohammed, S. Dataset on the Mediterranean soils from the coastal region of the Lattakia governorate, Syria. Data Brief 2020, 29, 105254. [Google Scholar] [CrossRef]
- Mohamed, M.A.; Anders, J.; Schneider, C. Monitoring of Changes in Land Use/Land Cover in Syria from 2010 to 2018 Using Multitemporal Landsat Imagery and GIS. Land 2020, 9, 226. [Google Scholar] [CrossRef]
- Syria’s Coastal Zone and its Desired Integrated Management. Proposed Vision and Policy. Available online: https://www.pap-thecoastcentre.org/pdfs/Syria%20coastal%20zone%20and%20its%20integrated%20management%20-%20proposed%20vision%20and%20policy.pdf (accessed on 28 October 2020).
- Syrian Center for Weather and Climate, Amount of Rainfall in Syria. Available online: https://sccwf.com/ (accessed on 28 October 2020).
- Climate-Change Atlas of Syria. Available online: https://www.researchgate.net/publication/311666757_Climate-Change_Atlas_of_Syria (accessed on 28 October 2020).
- Statistical Abstracts of Central Bureau of Statistics (CBS). Statistical Abstract for Years: 2010, 2017, 2018, and 2019. Available online: http://cbssyr.sy/index.htm (accessed on 28 June 2020).
- Armed Conflict in Syria: Overview and U.S. Response, Updated 27 July 2020. Available online: https://crsreports.congress.gov/product/pdf/download/RL/RL33487/RL33487.pdf/ (accessed on 10 November 2020).
- Forest Conditions in Syria and Lebanon. Available online: http://www.fao.org/3/x5343e/x5343e06.htm (accessed on 26 October 2020).
- Forests in Syria. Available online: http://www.forest-monitor.com/en/forests-syria/ (accessed on 26 October 2020).
- Vegetation the Mediterranean Forests of Coastal Mountains. Available online: https://www.researchgate.net/publication/280988107 (accessed on 26 October 2020).
- State of Mediterranean Forests 2018. Available online: http://www.fao.org/3/CA2081EN/ca2081en.PDF (accessed on 30 October 2020).
- USGS. Landsat Data Sets. Available online: https://earthexplorer.usgs.gov (accessed on 20 October 2020).
- Irons, J.R.; Dwyer, J.L.; Barsi, J.A. The next Landsat satellite: The Landsat data continuity mission. Remote Sens. Environ. 2012, 122, 11–21. [Google Scholar] [CrossRef] [Green Version]
- Wulder, M.A.; Masek, J.G.; Cohen, W.B.; Loveland, T.R.; Woodcock, C.E. Opening the archive: How free data has enabled the science and monitoring promise of Landsat. Remote Sens. Environ. 2012, 122, 2–10. [Google Scholar] [CrossRef]
- Looting, Burning, Cutting: How a Decade of War Has Shrunk Syria’s Forests. Available online: https://syriadirect.org/news/looting-burning-cutting-how-a-decade-of-war-has-shrunk-syria%E2%80%99s-forests/ (accessed on 11 December 2020).
- FAO: Counting the Cost Agriculture in Syria after Six Years of Crisis. 2017. Available online: http://www.fao.org/3/b-i7081e.pdf (accessed on 22 October 2020).
- Government of the Syrian Arab Republic and UN Office for the Coordination of Humanitarian Affairs, Report: Syrian Arab Republic Humanitarian Assistance Response Plan (SHARP). 2018. Available online: https://reliefweb.int/report/syrian-arab-republic/2018-syrian-arab-republic-humanitarian-response-plan-january-december (accessed on 24 October 2020).
- Norwegian Refugee Council and und High Commissioner for Refugees, Protection Cluster, Report: Whole of Syria 2018 Protection Needs Overview v2. 2017. Available online: https://reliefweb.int/report/syrian-arab-republic/syrian-arab-republic-whole-syria-protection-sector-2018-protection-needs (accessed on 11 October 2020).
- Al-Fares, W. Historical Land Use/Land Cover Classification Using Remote Sensing—A Case Study of the Euphrates River Basin in Syria; Springer: Berlin, Germany, 2012; Available online: https://link.springer.com/book/10.1007%2F978-3-319-00624-6 (accessed on 26 November 2020).
- Wu, C.; Du, B.; Cui, X.; Zhang, L. A post—Classification change detection method based on iterative slow feature analysis and Bayesian soft fusion. Remote Sens. Environ. 2017, 199, 241–255. [Google Scholar] [CrossRef]
- Mather, P.M.; Koch, M. Computer Processing of Remotely-Sensed Images: An Introduction, 4th ed.; John Wiley and Sons: Chichester, UK, 2011; pp. 325–375. Available online: https://onlinelibrary.wiley.com/doi/pdf/10.1002/9780470666517 (accessed on 12 October 2020).
- Liu, J.G.; Mason, P.J. Essential Image Processing and GIS for Remote Sensing, 1st ed.; John Wiley & Sons Ltd.: Chichester, UK, 2009; pp. 105–119. Available online: https://www.wiley.com/en-us/Essential+Image+Processing+and+GIS+for+Remote+Sensing-p-9780470510315 (accessed on 12 October 2020).
- Chutia, D.; Bhattacharyya, D.K.; Sarma, J.; Raju, P.N.L. An effective ensemble classification framework using random forests and a correlation based feature selection technique. Trans. GIS 2017, 21, 1165–1178. [Google Scholar] [CrossRef]
- Lillesand, M.T.; Kiefer, R.W.; Chipman, J.W. Remote Sensing and Image Interpretation, 7th ed.; Wiley Global Education: Hoboken, NJ, USA, 2015; pp. 517–555. Available online: https://www.wiley.com/en-us/Remote+Sensing+and+Image+Interpretation%2C+7th+Edition-p-9781118343289 (accessed on 9 November 2020).
- Congalton, R.G. A review of assessing the accuracy of classifications of remotely sensed data. Remote Sens. Environ. 1991, 37, 35–46. [Google Scholar] [CrossRef]
- Congalton, R.G.; Green, K. Assessing the Accuracy of Remotely Sensed Data: Principles and Practices, 2nd ed.; CRC Press Taylor & Francis Group: Boca Raton, FL, USA, 2009; pp. 121–140. Available online: https://www.taylorfrancis.com/books/assessing-accuracy-remotely-sensed-data-russell-congalton-kass-green/10.1201/9781420055139 (accessed on 7 October 2020).
- FAO. Map Accuracy Assessment and Area Estimation: A Practical Guide; FAO: Rome, Italy, 2016; pp. 31–34. Available online: http://www.fao.org/3/a-i5601e.pdf (accessed on 1 November 2020).
- Köhl, M.; Magnussen, S.S.; Marchetti, M. Sampling Methods, Remote Sensing and GIS Multiresource Forest Inventory, 3rd ed.; Springer: Berlin/Heidelberg, Germany, 2006; pp. 71–195. Available online: https://www.springer.com/de/book/9783540325710 (accessed on 19 October 2020).
- Eklund, L.; Persson, A.; Petter Pilesjo, P. Cropland changes in times of conflict, reconstruction, and economic development in Iraqi Kurdistan. Ambio 2016, 45, 78–88. [Google Scholar] [CrossRef] [Green Version]
- Olofsson, P.; Foody, G.M.; Herold, M.; Stehman, S.V.; Woodcock, C.E.; Wulder, M.A. Good practices for estimating area and assessing accuracy of land change. Remote Sens. Environ. 2014, 148, 42–57. [Google Scholar] [CrossRef]
- Olofsson, P.; Foody, G.M.; Foody, G.M.; Stehman, S.V.; Woodcock, C.E.; Wulder, M.A. Making better use of accuracy data in land change studies: Estimating accuracy and area and quantifying uncertainty using stratified estimation. Remote Sens. Environ. 2013, 129, 122–131. [Google Scholar] [CrossRef]
- Slimani, M.A.; Aboudi, A.E.; Rahimi, A.; Khalil, Z. Use of GIS and Satellite Imagery in the Study of the Spatial linsn of Vegetation in the Entifa Forest (High Atlas Central, Morocco). In Recent Advances in Environmental Science from the Euro-Mediterranean and Surrounding Regions; Kallel, A., Ksibi, M., Ben Dhia, H., Khélifi, N., Eds.; Springer International Publishing AG: Berlin/Heidelberg, Germany, 2018; pp. 1749–11751. [Google Scholar] [CrossRef]
- Chen, Y.; Du, M.; Dong, R. Correlation between urban heat island effect and the thermal inertia using aster data in Beijing, China. Remote Sens. Spat. Inf. Sci. 2008, XXXVII Pt B7, 1723–1728. Available online: http://citeseerx.ist.psu.edu/viewdoc/download?doi=10.1.1.183.7026&rep=rep1&type=pdf (accessed on 12 December 2020).
- Manandhar, R.; Odeh, I.O.A.; Ancev, T. Improving the Accuracy of Land Use and Land Cover Classification of Landsat Data using Post-classification Enhancement. Remote Sens. 2009, 1, 330–344. [Google Scholar] [CrossRef] [Green Version]
- Wilson, S.A.; Wilson, C.O. Modeling the impacts of civil war on land use and land cover change within Kono District, Sierra Leone: A socio-geospatial approach. Geocarto Int. 2013, 28, 476–501. [Google Scholar] [CrossRef]
- Krivoruchko, K. Spatial Statistical Data Analysis for GIS Users, 1st ed.; ERSI Press: Redlands, CA, USA, 2011; pp. 107–147. Available online: http://downloads.esri.com/esripress/pdfs/spatial-statistical-data-analysis-for-gis-users.pdf (accessed on 12 December 2020).
- Mohamed, M.A. Classification of Landforms for Digital Soil Mapping in Urban Areas Using LiDAR Data Derived Terrain Attributes: A Case Study from Berlin, Germany. Land 2020, 9, 319. [Google Scholar] [CrossRef]
- Anderson, J.R.; Hardy, E.E.; Roach, J.T.; Witmer, R.E. A Land Use and Land Cover Classification System for Use with Remote Sensor Data. Geological Survey Professional: Paper 964; United States Government Printing Office: Washington, DC, USA, 1976. [Google Scholar] [CrossRef] [Green Version]
- Lins, K.S.; Kleckner, R.L. LC Mapping: An Overview and History of the Concepts. In Gap Analysis: A Landscape Approach to Biodiversity Planning; Scott, J.M., Tear, T.H., Davis, W.F., Eds.; American Society for Photogrammetry and Remote Sensing: Bethesda, MD, USA, 1996; pp. 57–65. [Google Scholar]
- Sectarianism in Syria’s Civil War A Geopolitical Study. Available online: https://www.washingtoninstitute.org/policy-analysis/view/sectarianism-in-syrias-civil-war (accessed on 27 October 2020).
- War on The Forests of The Syrian Coast. Available online: https://syriauntold.com/2019/06/06/war-on-the-forests-of-the-syrian-coast/ (accessed on 27 October 2020).
- Gbanie, S.B.; Griffin, A.L.; Thornton, A. Impacts on the Urban Environment: Land Cover Change Trajectories and Landscape Fragmentation in Post-War Western Area, Sierra Leone. Remote Sens. 2018, 10, 129. [Google Scholar] [CrossRef] [Green Version]
- Dudley, J.P.; Ginsberg, J.R.; Plumptre, A.J.; Hart, J.A.; Campos, L.C. Effects of War and Civil Strife on Wildlife and Wildlife Habitats Efectos de la Guerra y Conflictos Civiles Sobre la Vida Silvestre y Sus Hábitats. Conserv. Biol. 2015, 16, 319–329. [Google Scholar] [CrossRef] [Green Version]
- Nackoney, J.; Molinario, G.; Peter Potapov, P.; Turubanova, S.; Hansen, M.C.; Furuichi, T. Impacts of civil conflict on primary forest habitat in northern Democratic Republic of the Congo, 1990–2010. Biol. Conserv. 2015, 170, 321–328. [Google Scholar] [CrossRef]
- The Impact of the Conflict on Population Displacement, Water and Agriculture in the Orontes River Basin, February 2014. Available online: https://reliefweb.int/report/syrian-arab-republic/syria-impact-conflict-population-displacement-water-and-agriculture (accessed on 11 December 2020).
- Negligence and Corruption Have Set Syria’s Forests Ablaze. Available online: https://english.enabbaladi.net/archives/2020/09/negligence-and-corruption-have-set-syrias-forests-ablaze/#ixzz6gLBoehpe (accessed on 11 December 2020).
- Forest Fires in the Mediterranean Area. Available online: http://www.fao.org/3/x1880e/x1880e07.htm (accessed on 11 December 2020).
- Tree Cover Loss in Syria. Available online: https://www.globalforestwatch.org/ (accessed on 11 December 2020).
- Distribution of Zones of Influence in Syria. Available online: http://norsforstudies.org/category/mapsinfographic/maps/ (accessed on 6 October 2020).
- Voski, A. The Role of Climate Change in Armed Conflicts across the Developing World and in the Ongoing Syrian War. Carlet. Rev. Int. Aff. 2016, 3, 120–141. [Google Scholar] [CrossRef]
- Abela, J.G.; Brottragerb, M.; Cuaresmac, J.C.; Muttarakd, R. Climate, conflict and forced migration. Glob. Environ. Chang. 2019, 54, 239–249. [Google Scholar] [CrossRef]
- Abela, J.G.; Brottragerb, M.; Cuaresmac, J.C.; Muttarakd, R. On climate variability and civil war in Asia. Clim. Chang. 2014, 122, 709–721. [Google Scholar] [CrossRef] [Green Version]
- Is Climate Change Fueling Civil War? Available online: https://www.colorado.edu/today/2019/06/13/climate-change-fueling-civil-war (accessed on 12 December 2020).
- Climate Change Hastened Syria’s Civil War. Available online: https://www.scientificamerican.com/article/climate-change-hastened-the-syrian-war/ (accessed on 12 December 2020).
- CNA’s Military Advisory Board Reports: The Role of Water Stress in Instability and Conflict. Available online: https://www.cna.org/mab/reports (accessed on 12 December 2020).
Figure 1.
Location of the study area, the 14-governorates administrative divisions (right), and false colors composite of Landsat 5 Thematic mapper (TM) image of 2010 (band 6-5-4 as red, green, and blue (RGB) color) (left).
Figure 1.
Location of the study area, the 14-governorates administrative divisions (right), and false colors composite of Landsat 5 Thematic mapper (TM) image of 2010 (band 6-5-4 as red, green, and blue (RGB) color) (left).

Figure 2.
Slope (in %) derived from Advanced Spaceborne Thermal Emission and Reflection Radiometer (ASTER)-digital elevation model (DEM) [46] (a), topographical elevation above sea level in meter [46] (b), spatial pattern of average yearly rainfall adapted from [53,54] (c), and average annual rainfall between 2008 and 2020 adapted from [53] (d).

Figure 3.
Distribution of zones of influence in the Syrian coast region between the warring parties at the end of 2010 (a), 2015 (b), and 2020 (c) adapted from [56].
Figure 3.
Distribution of zones of influence in the Syrian coast region between the warring parties at the end of 2010 (a), 2015 (b), and 2020 (c) adapted from [56].


Figure 5.
LULC in the Syrian coast region for 2010 (a), 2015 (b), and 2020 (c). The area (in %) of LULC categories after computing adjusted area estimates is given in (d).
Figure 5.
LULC in the Syrian coast region for 2010 (a), 2015 (b), and 2020 (c). The area (in %) of LULC categories after computing adjusted area estimates is given in (d).

Figure 6.
Distribution of changes in forest cover in the Syrian coast region from 2010–2015 (a), 2015–2020 (b), and 2010–2020 (c).
Figure 6.
Distribution of changes in forest cover in the Syrian coast region from 2010–2015 (a), 2015–2020 (b), and 2010–2020 (c).

Figure 7.
Changes in forest cover density in the study area for 2010 (a), 2015 (b), and 2020 (c).

Figure 8.
The relationship between forest cover extent and physical variables (a) and socio-demographic variables (b) between 2010 and 2020 in the Syrian coast region. Where Pop-T is total population, Gen-M is males, Gen-F is females, Un-EMP is unemployed, Pe-PE is primary education, and Pe-SE is secondary education.

Figure 9.
Burned forest areas in the Syrian coast region for 2015 (a), 2020 (b), and fires of oaks (Quercus) and Aleppo pine (Pinus halepensis) forests adapted from [64] (c).
Figure 9.
Burned forest areas in the Syrian coast region for 2015 (a), 2020 (b), and fires of oaks (Quercus) and Aleppo pine (Pinus halepensis) forests adapted from [64] (c).


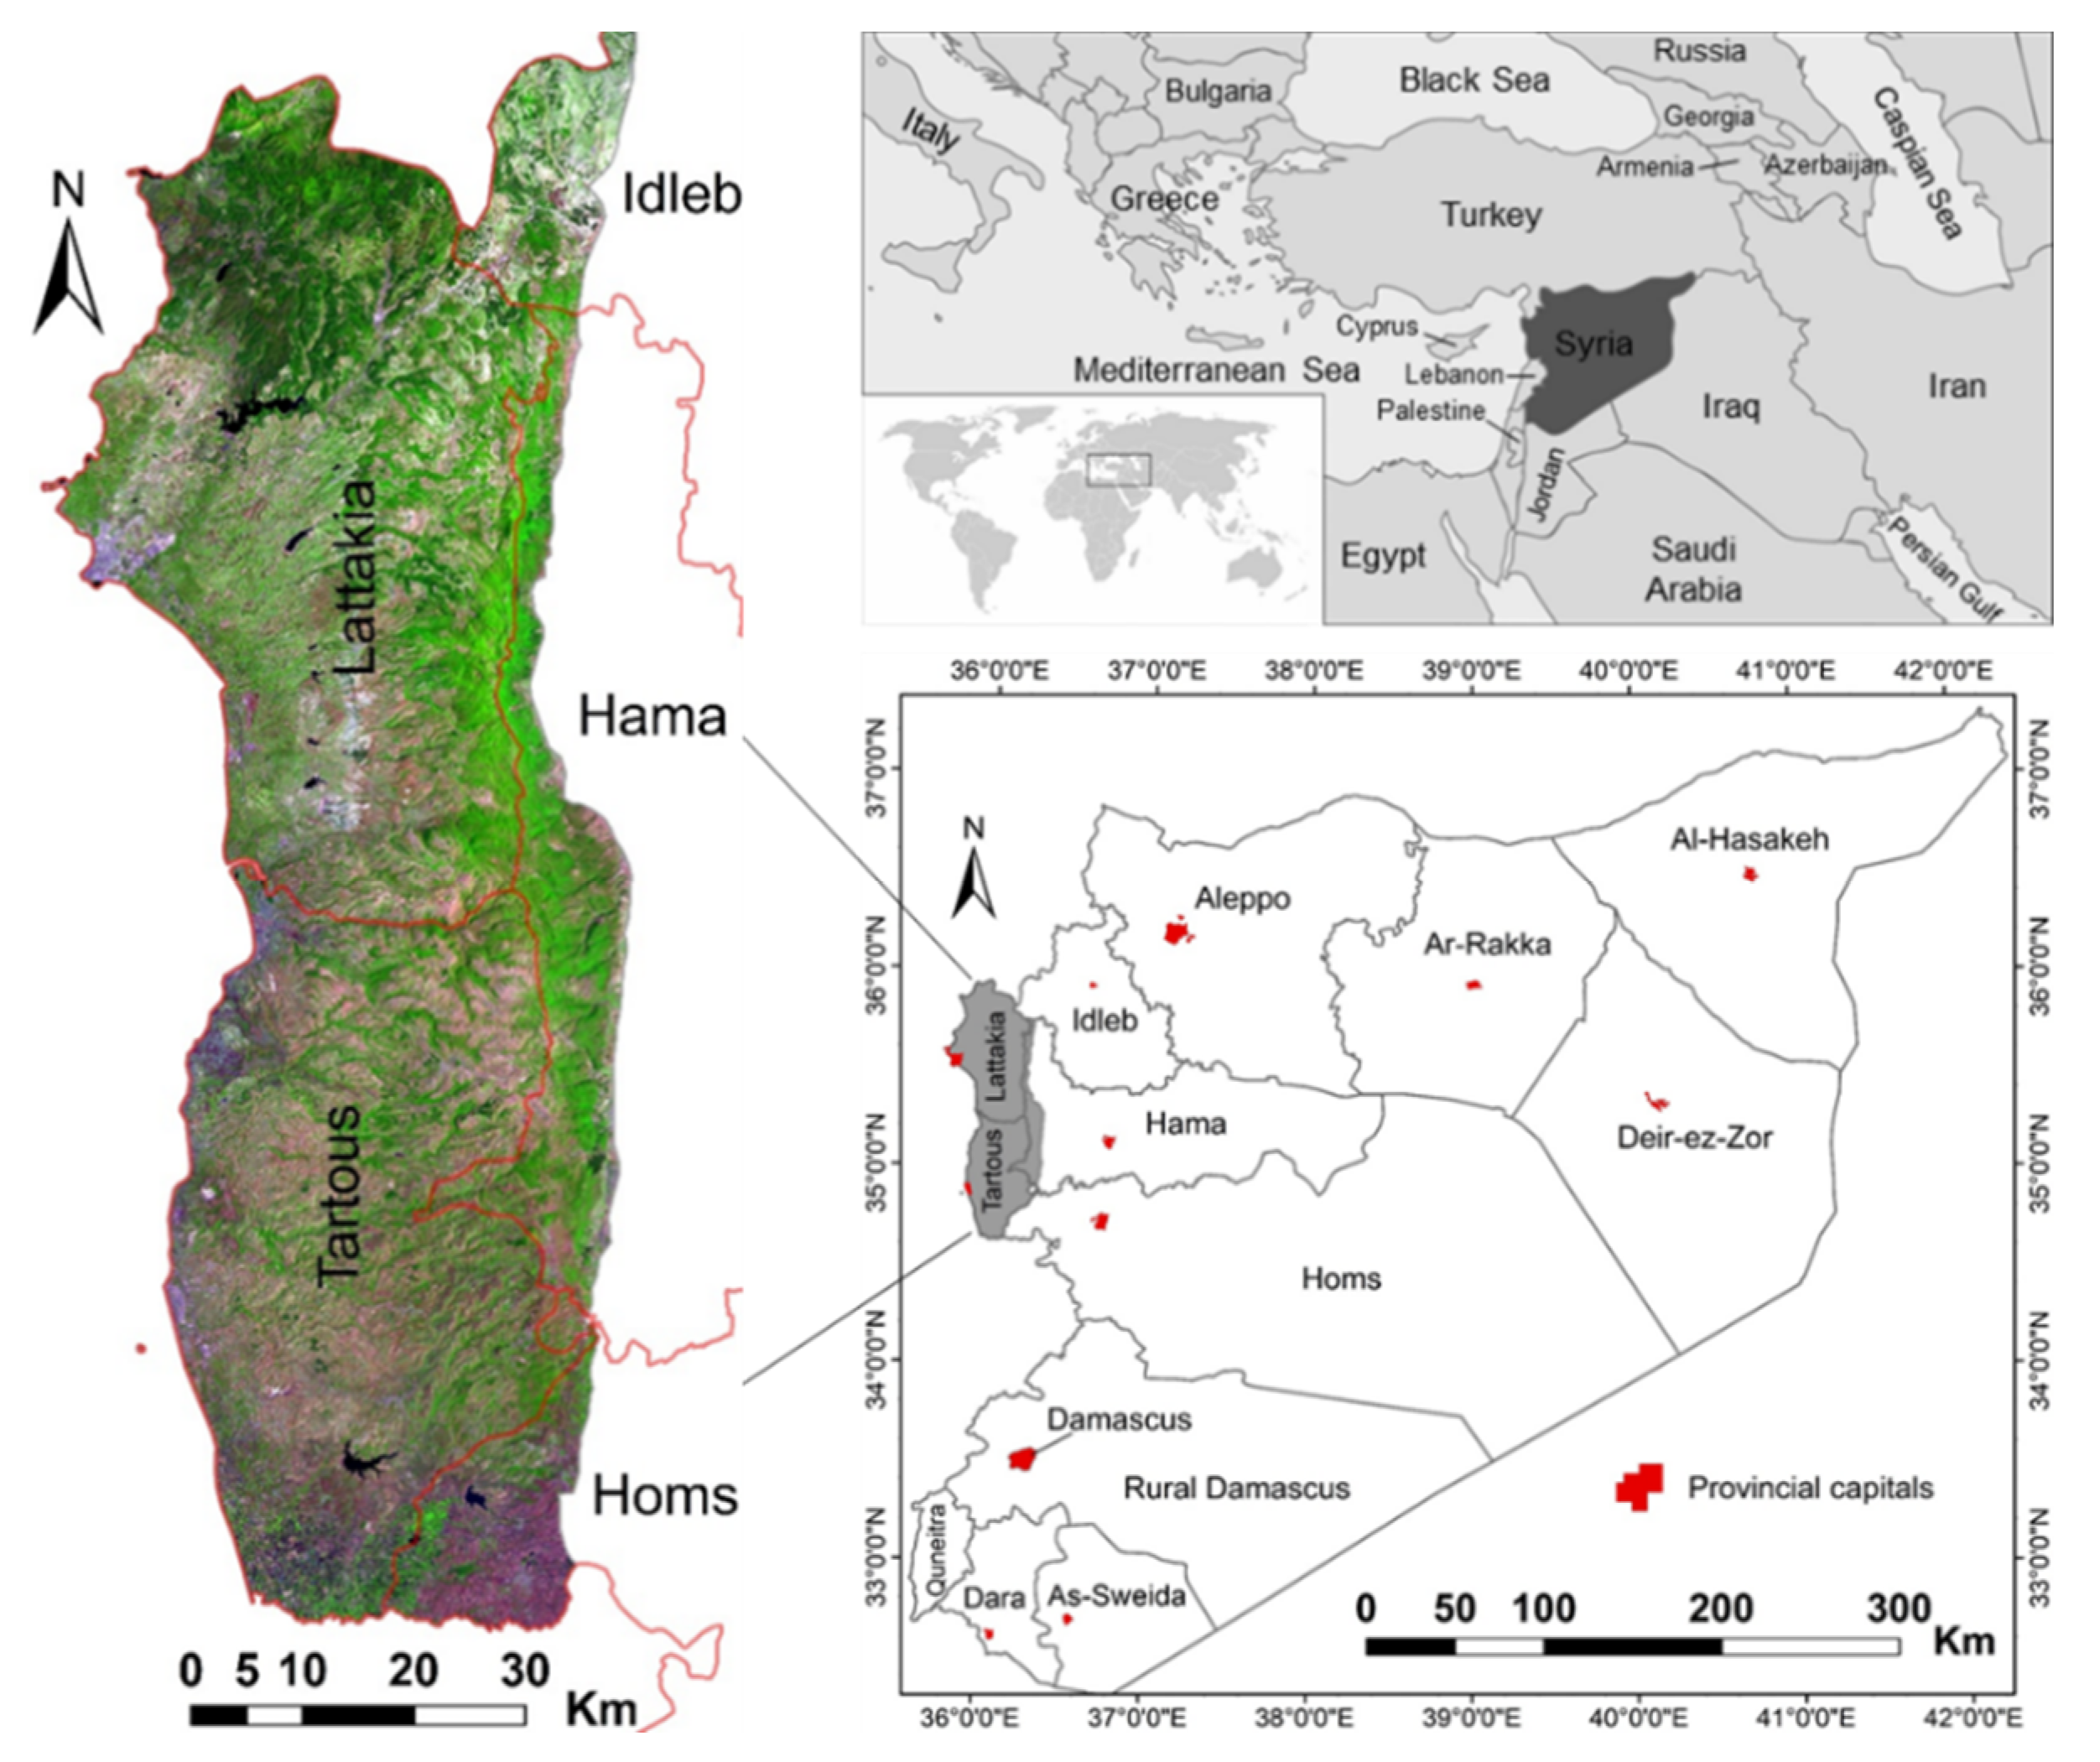
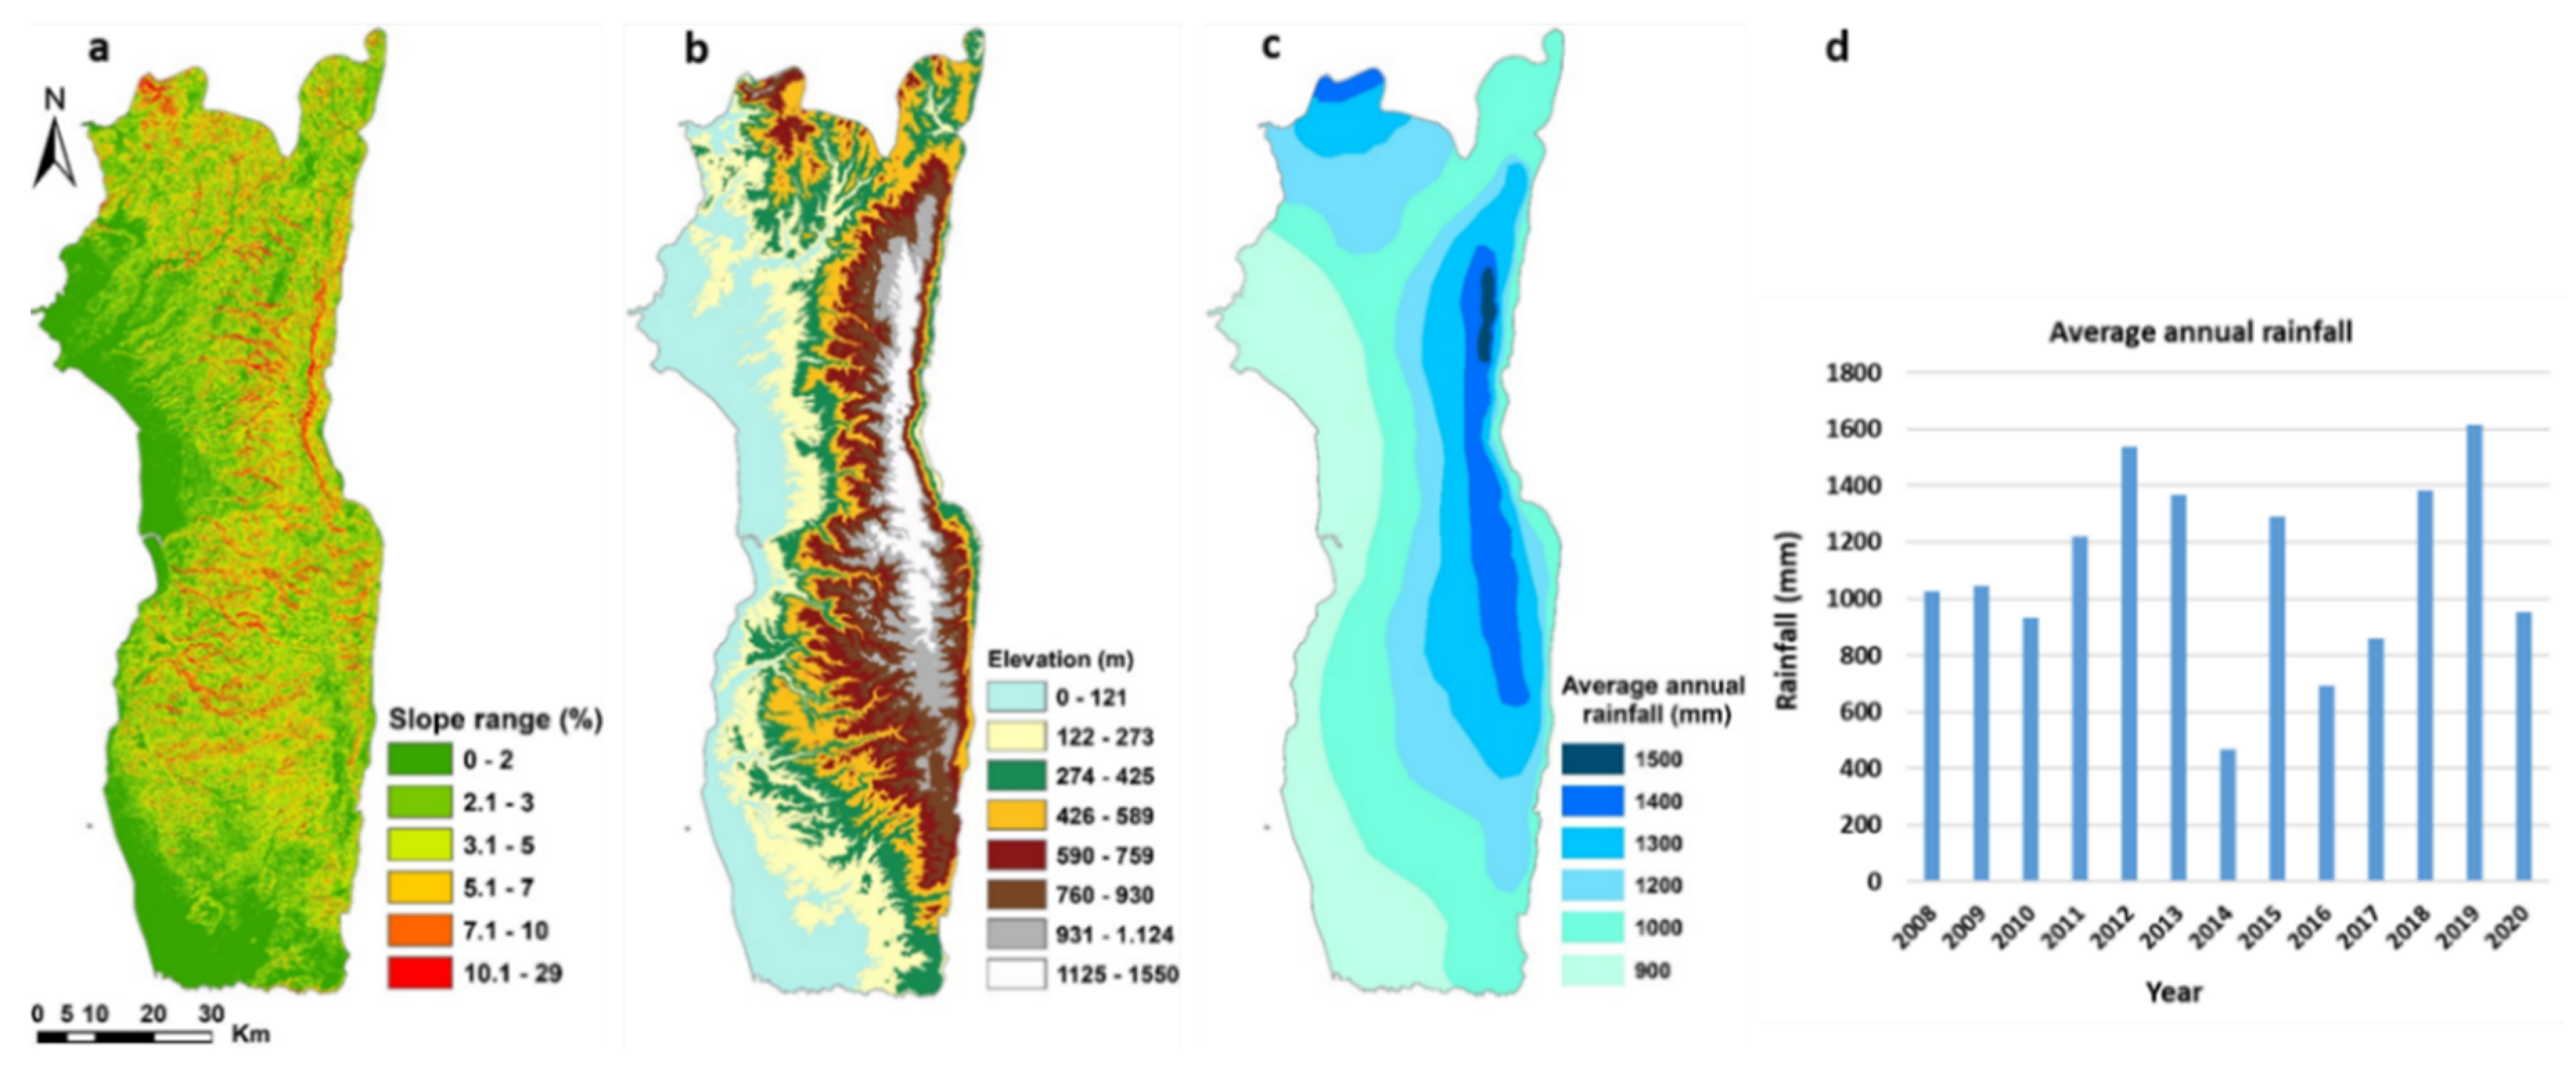
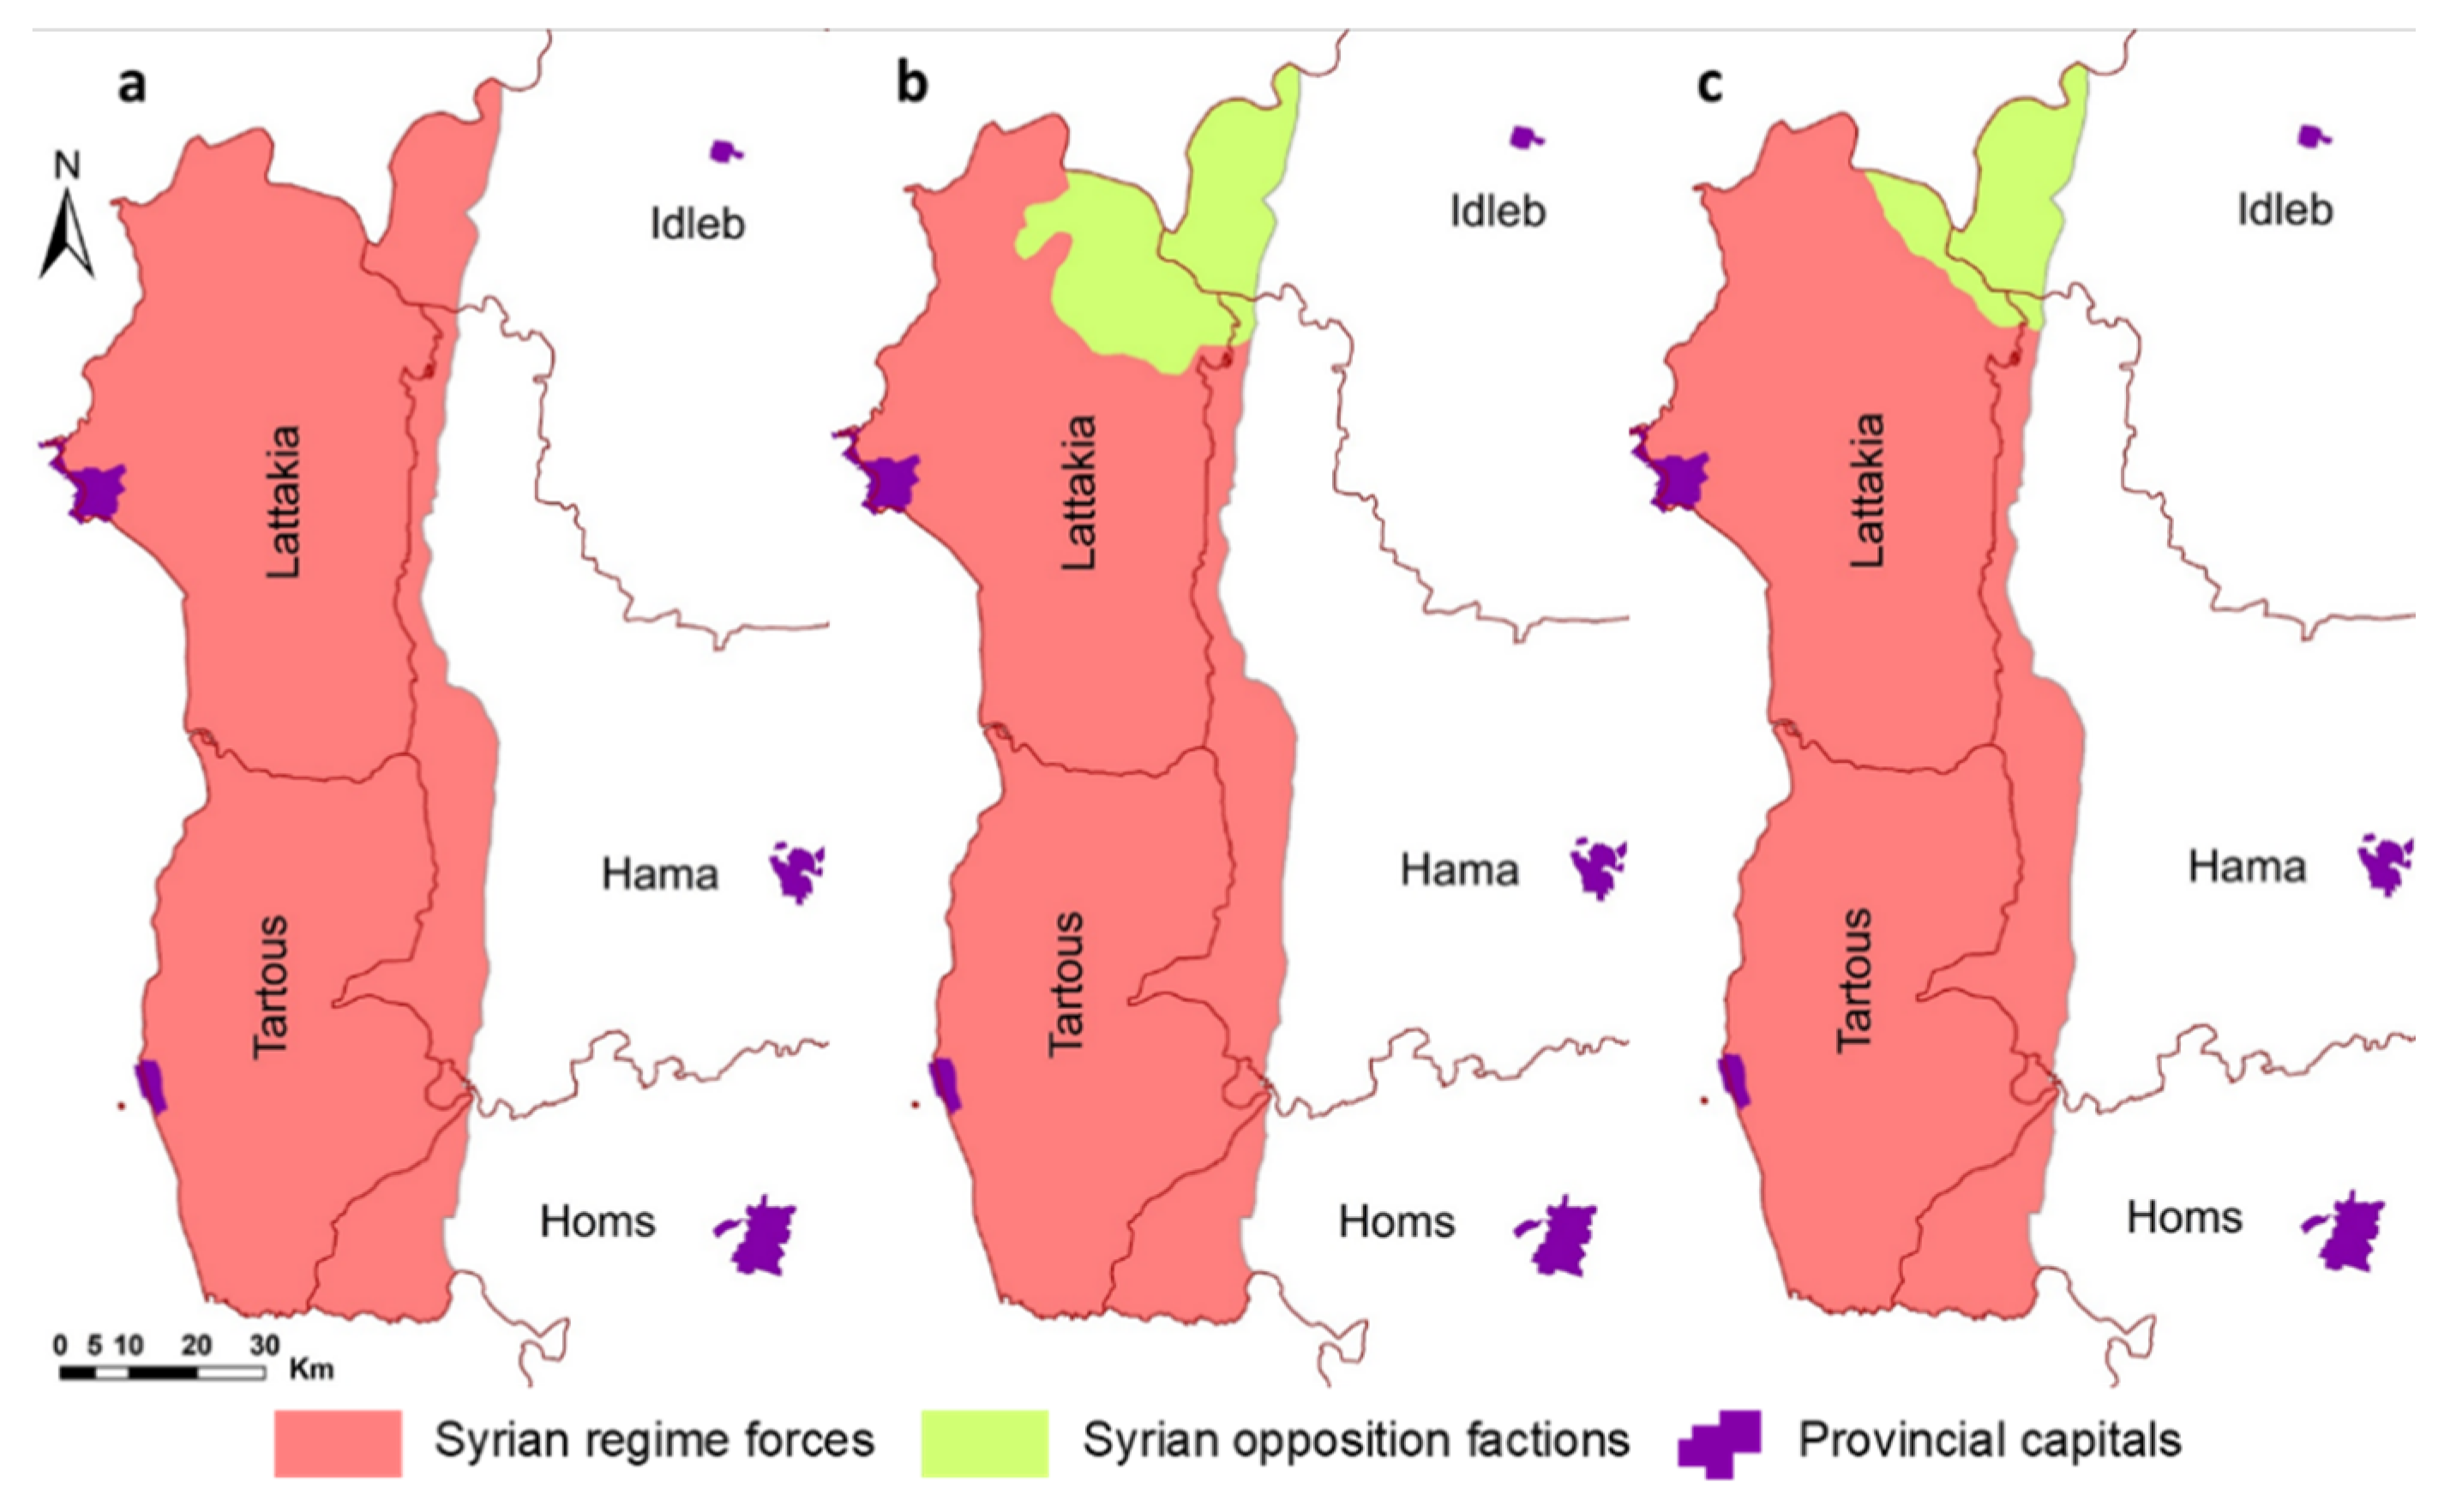
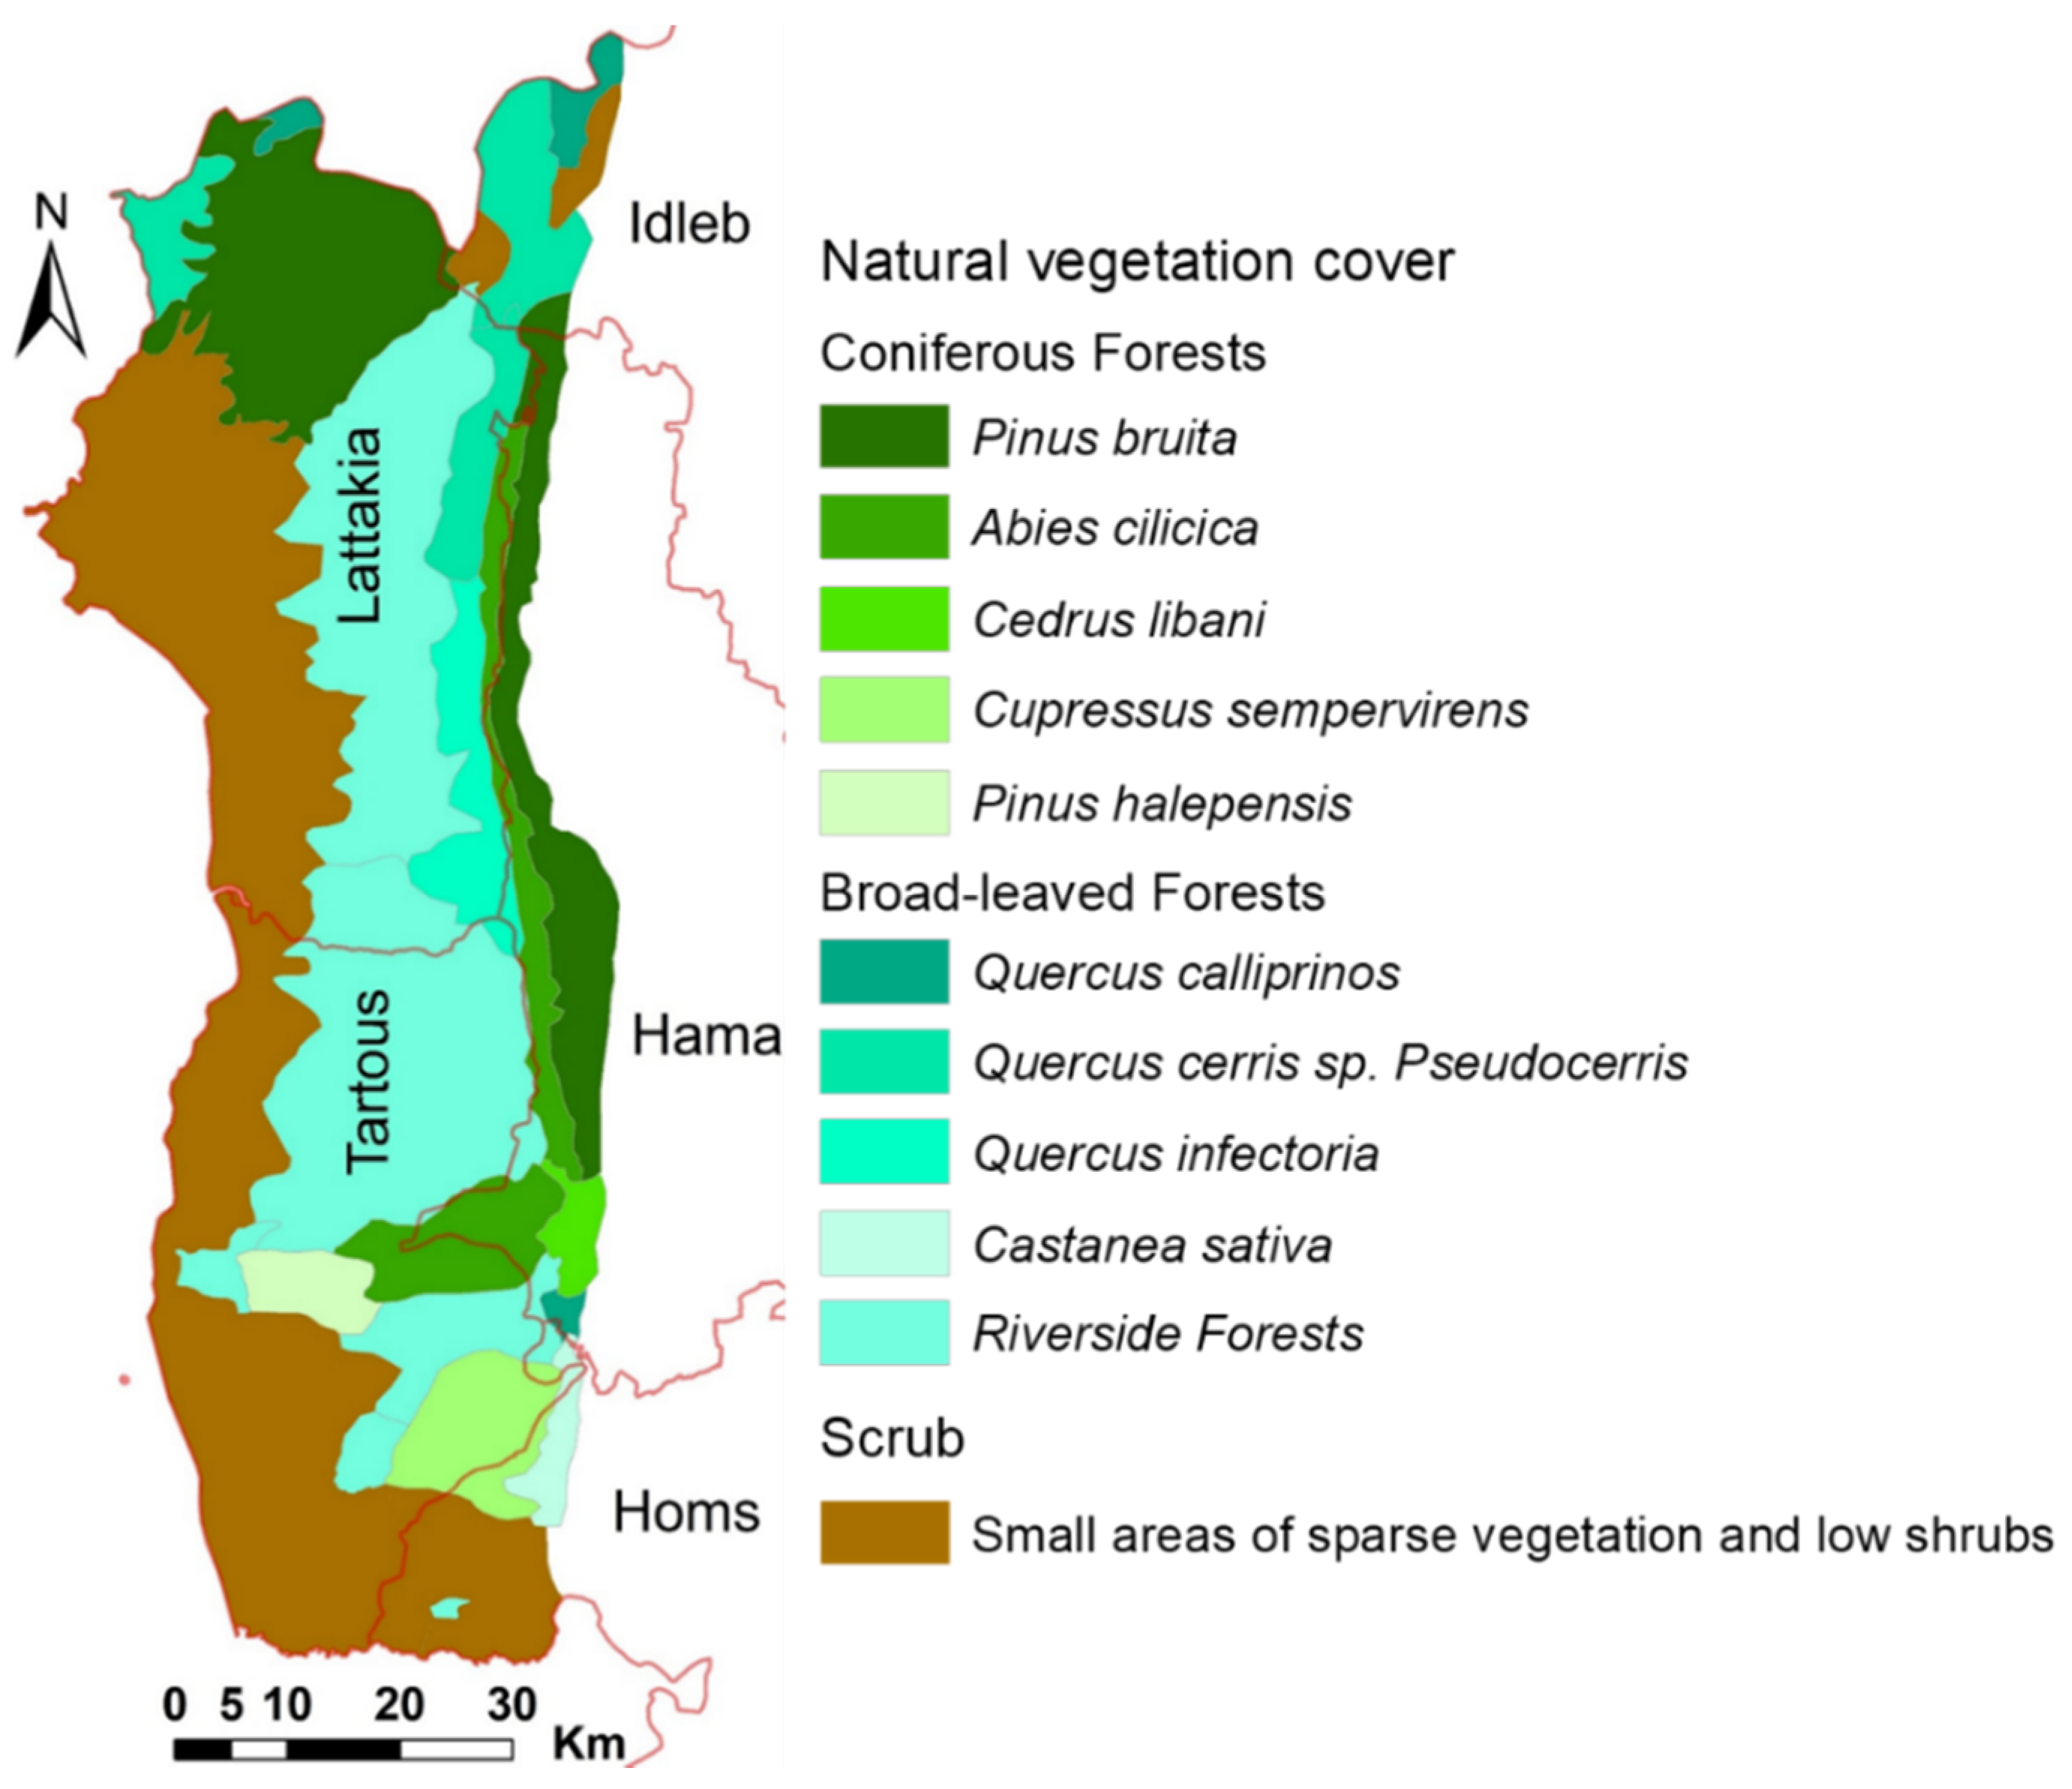
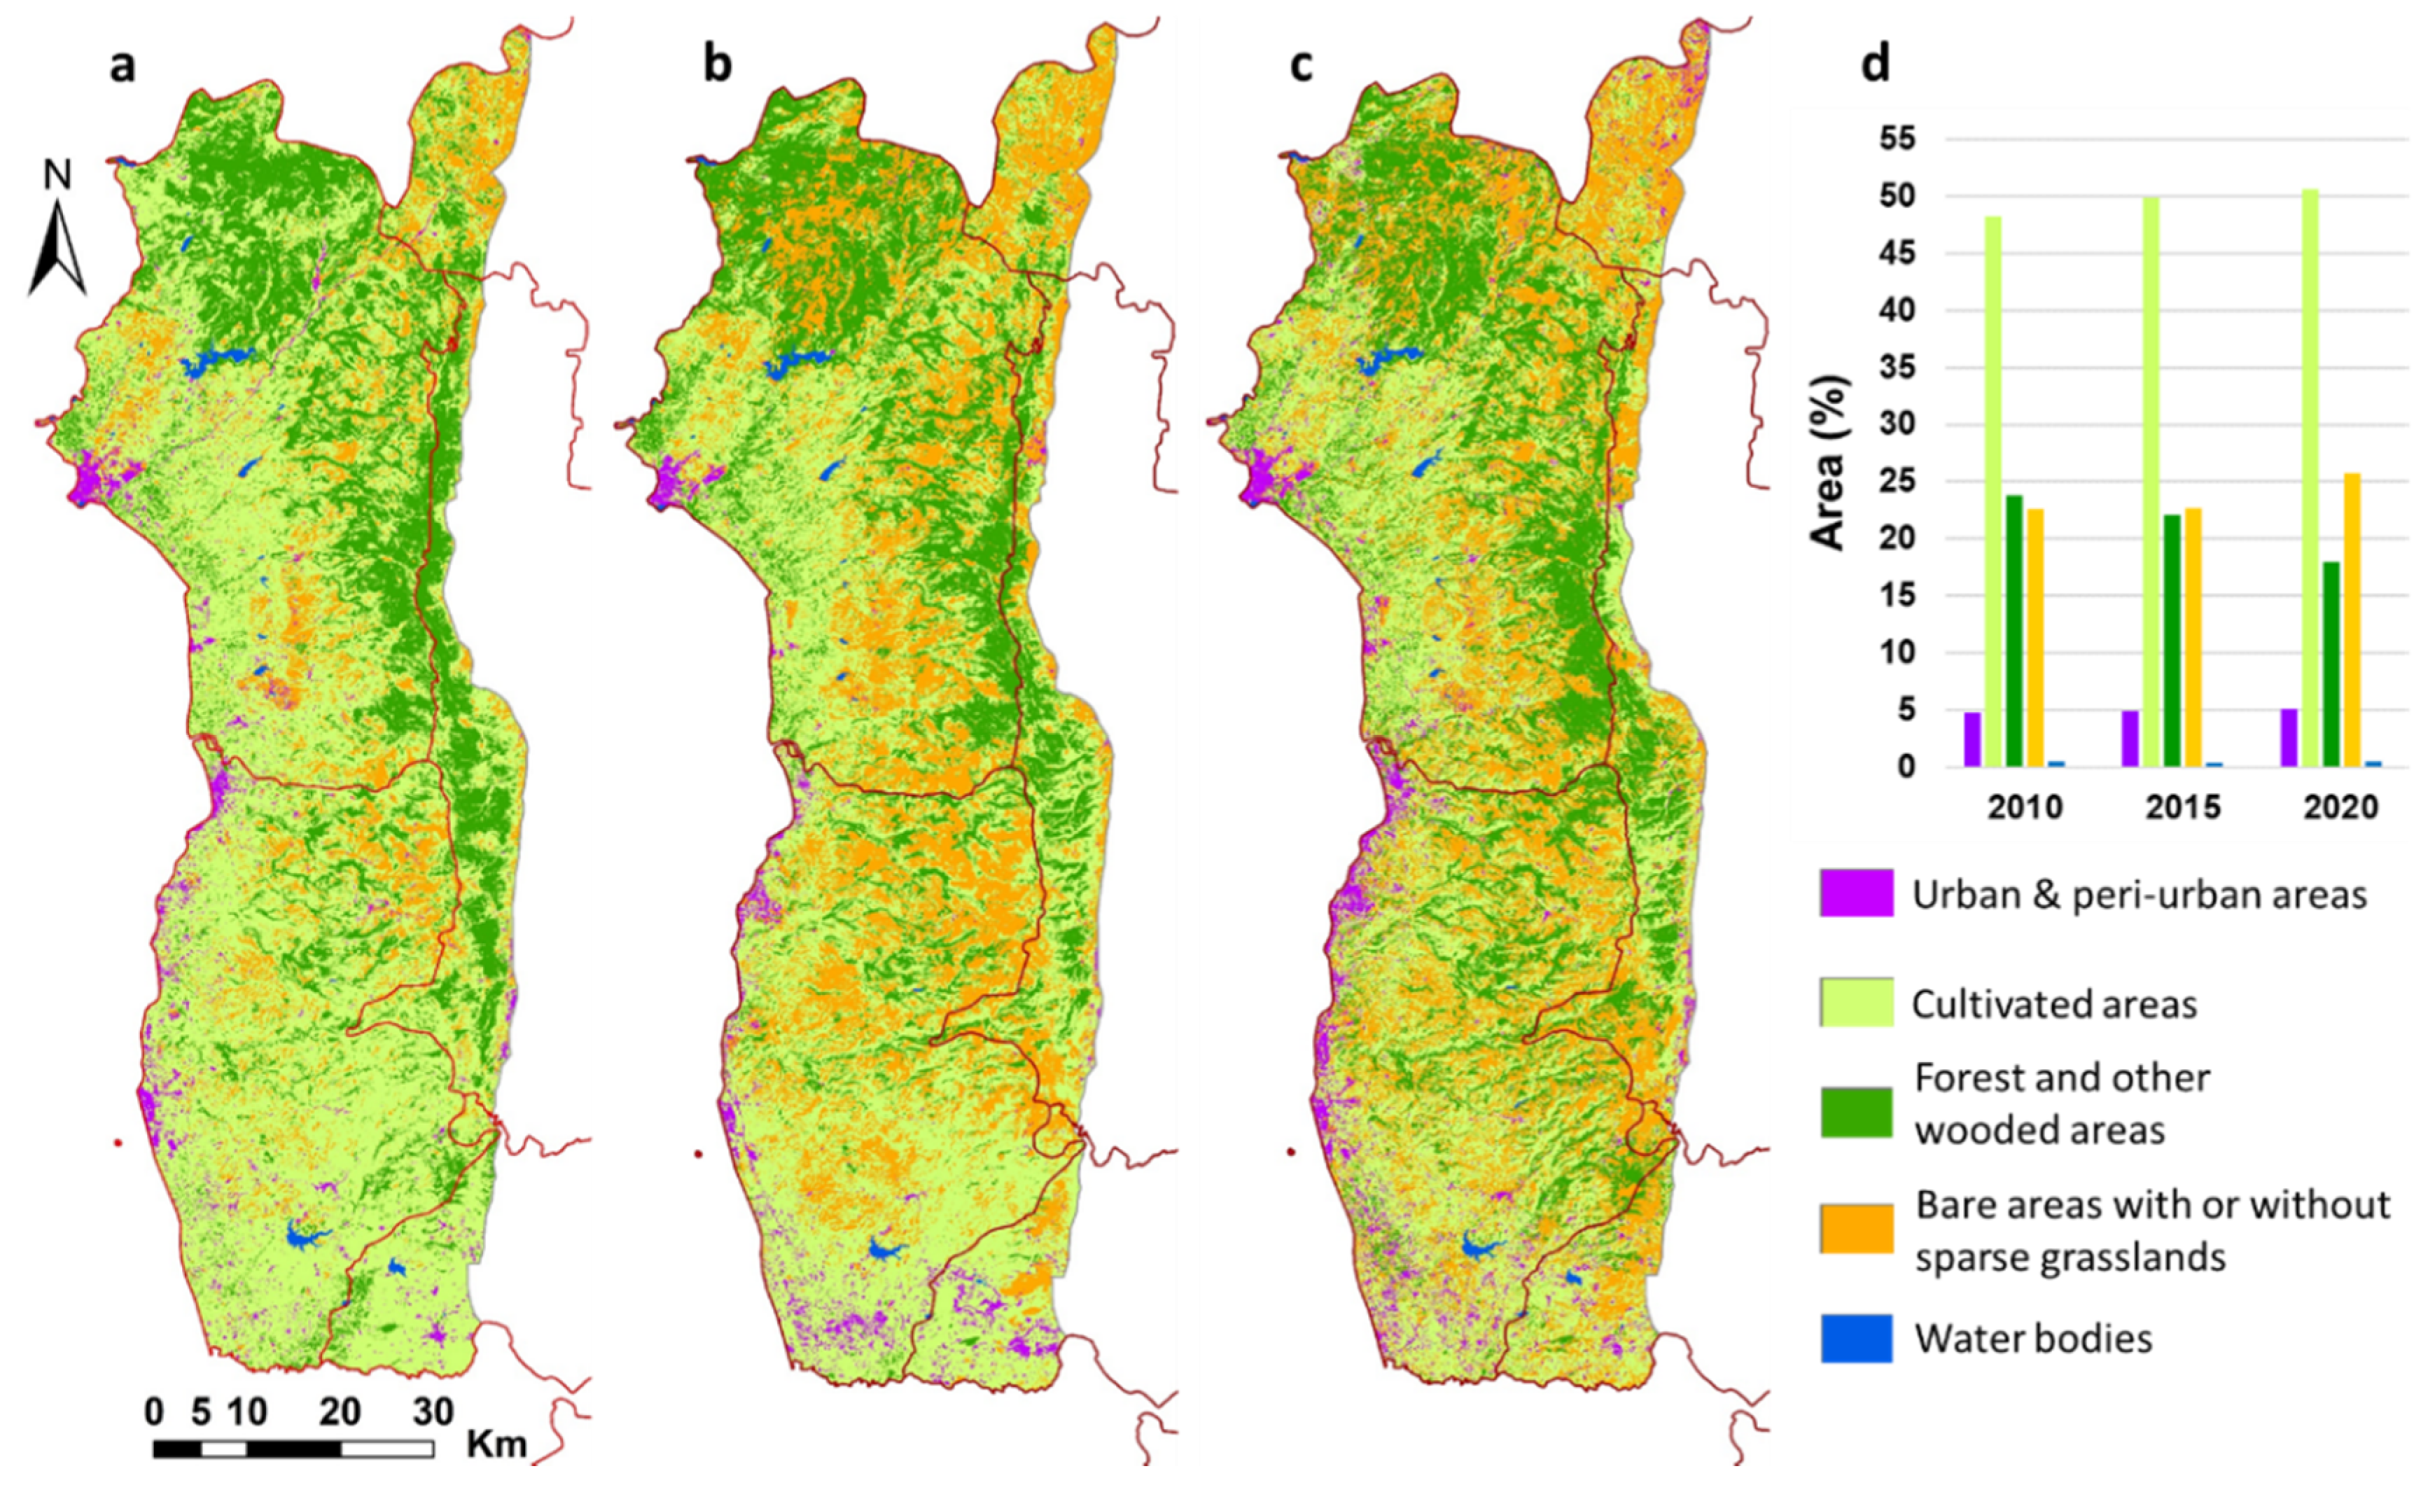
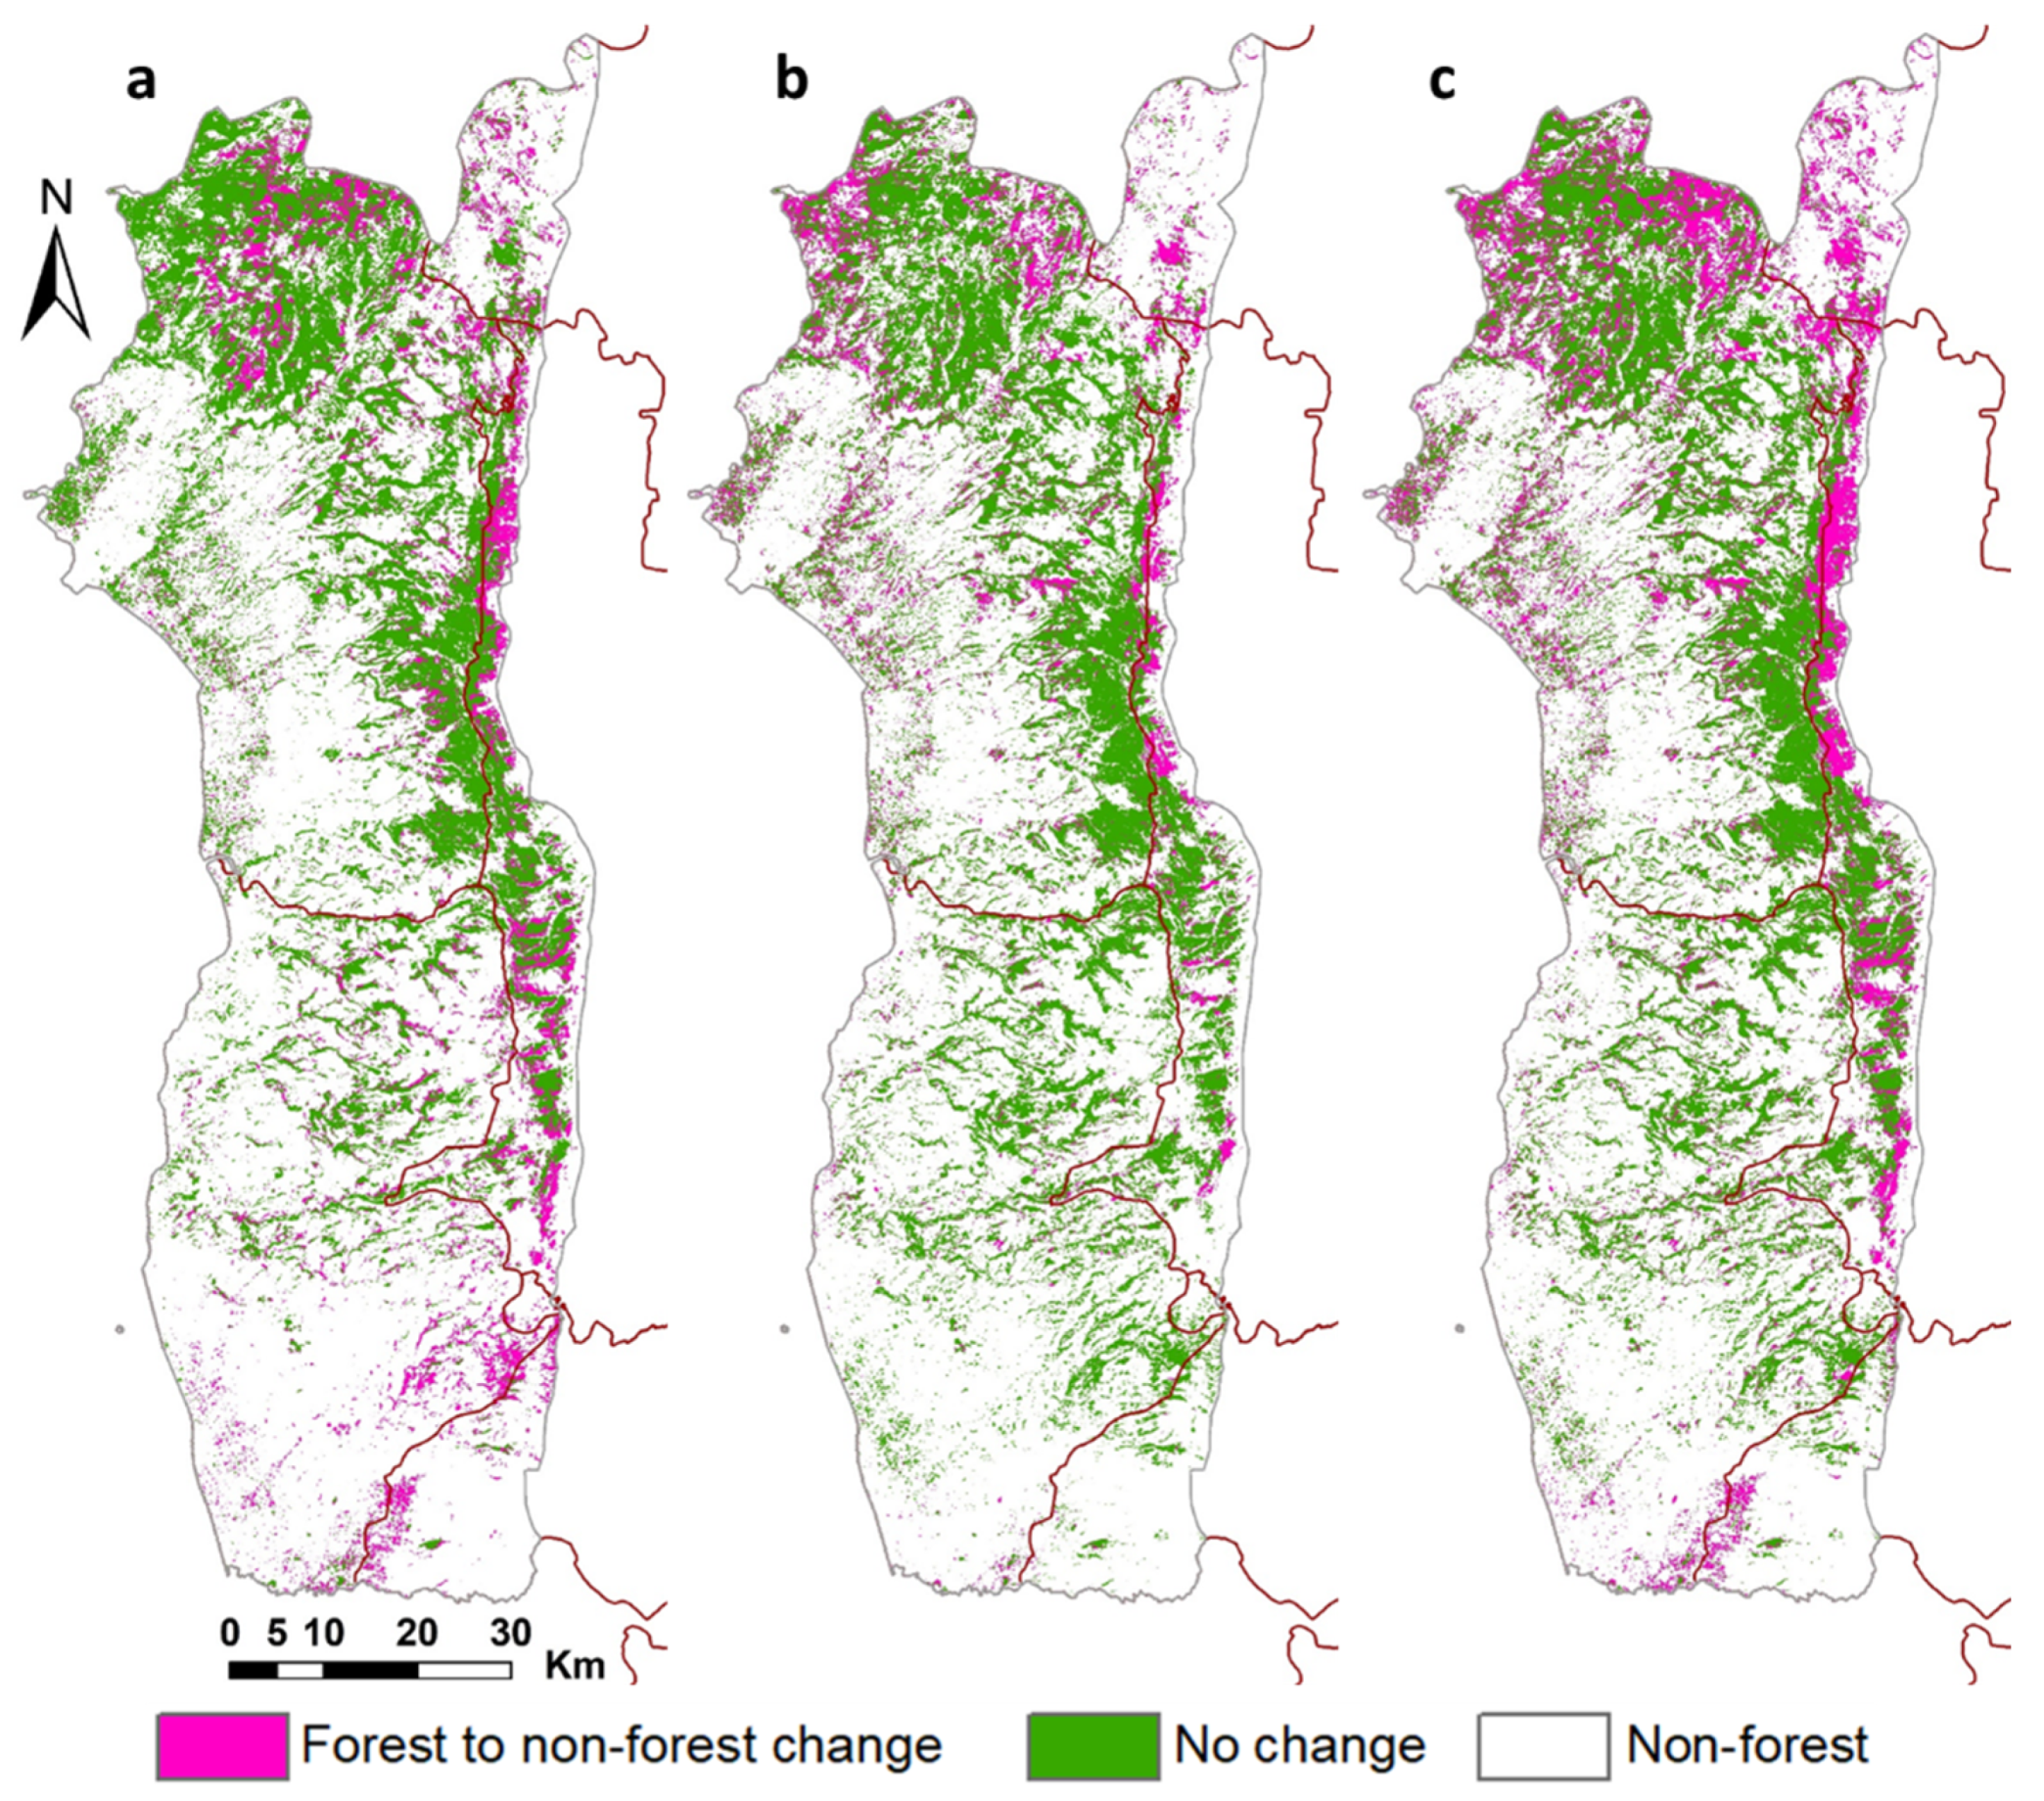
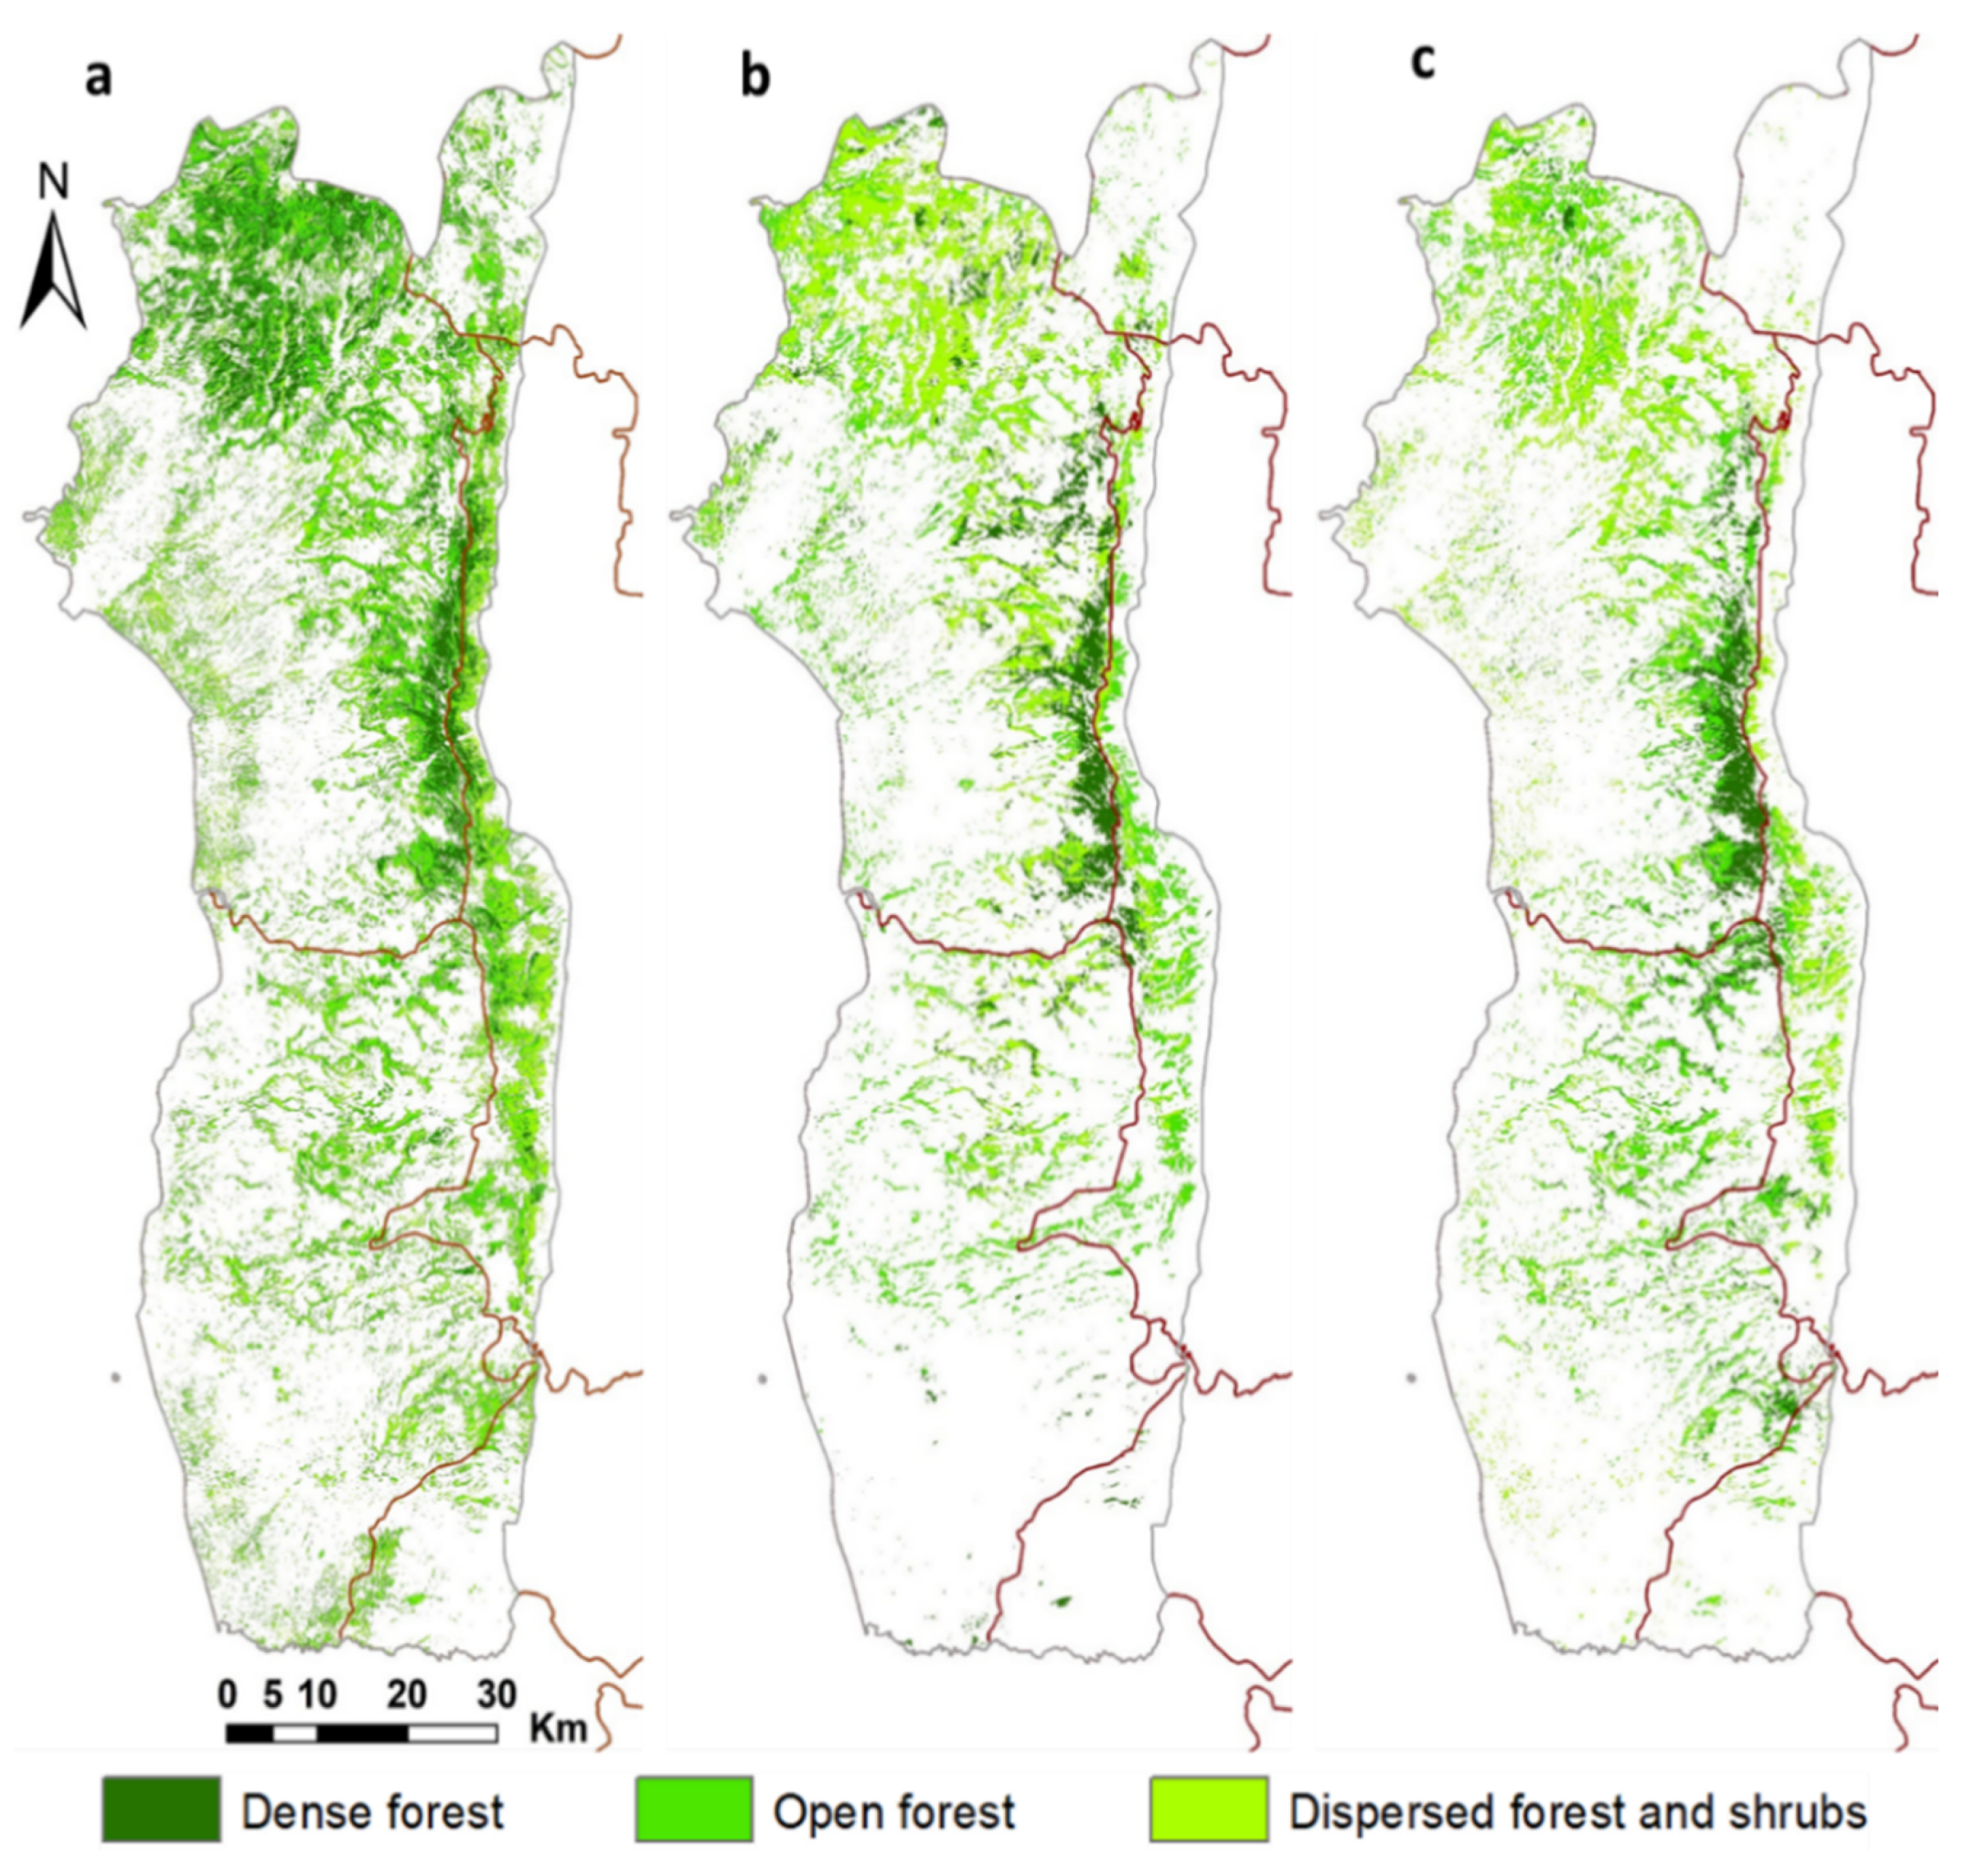
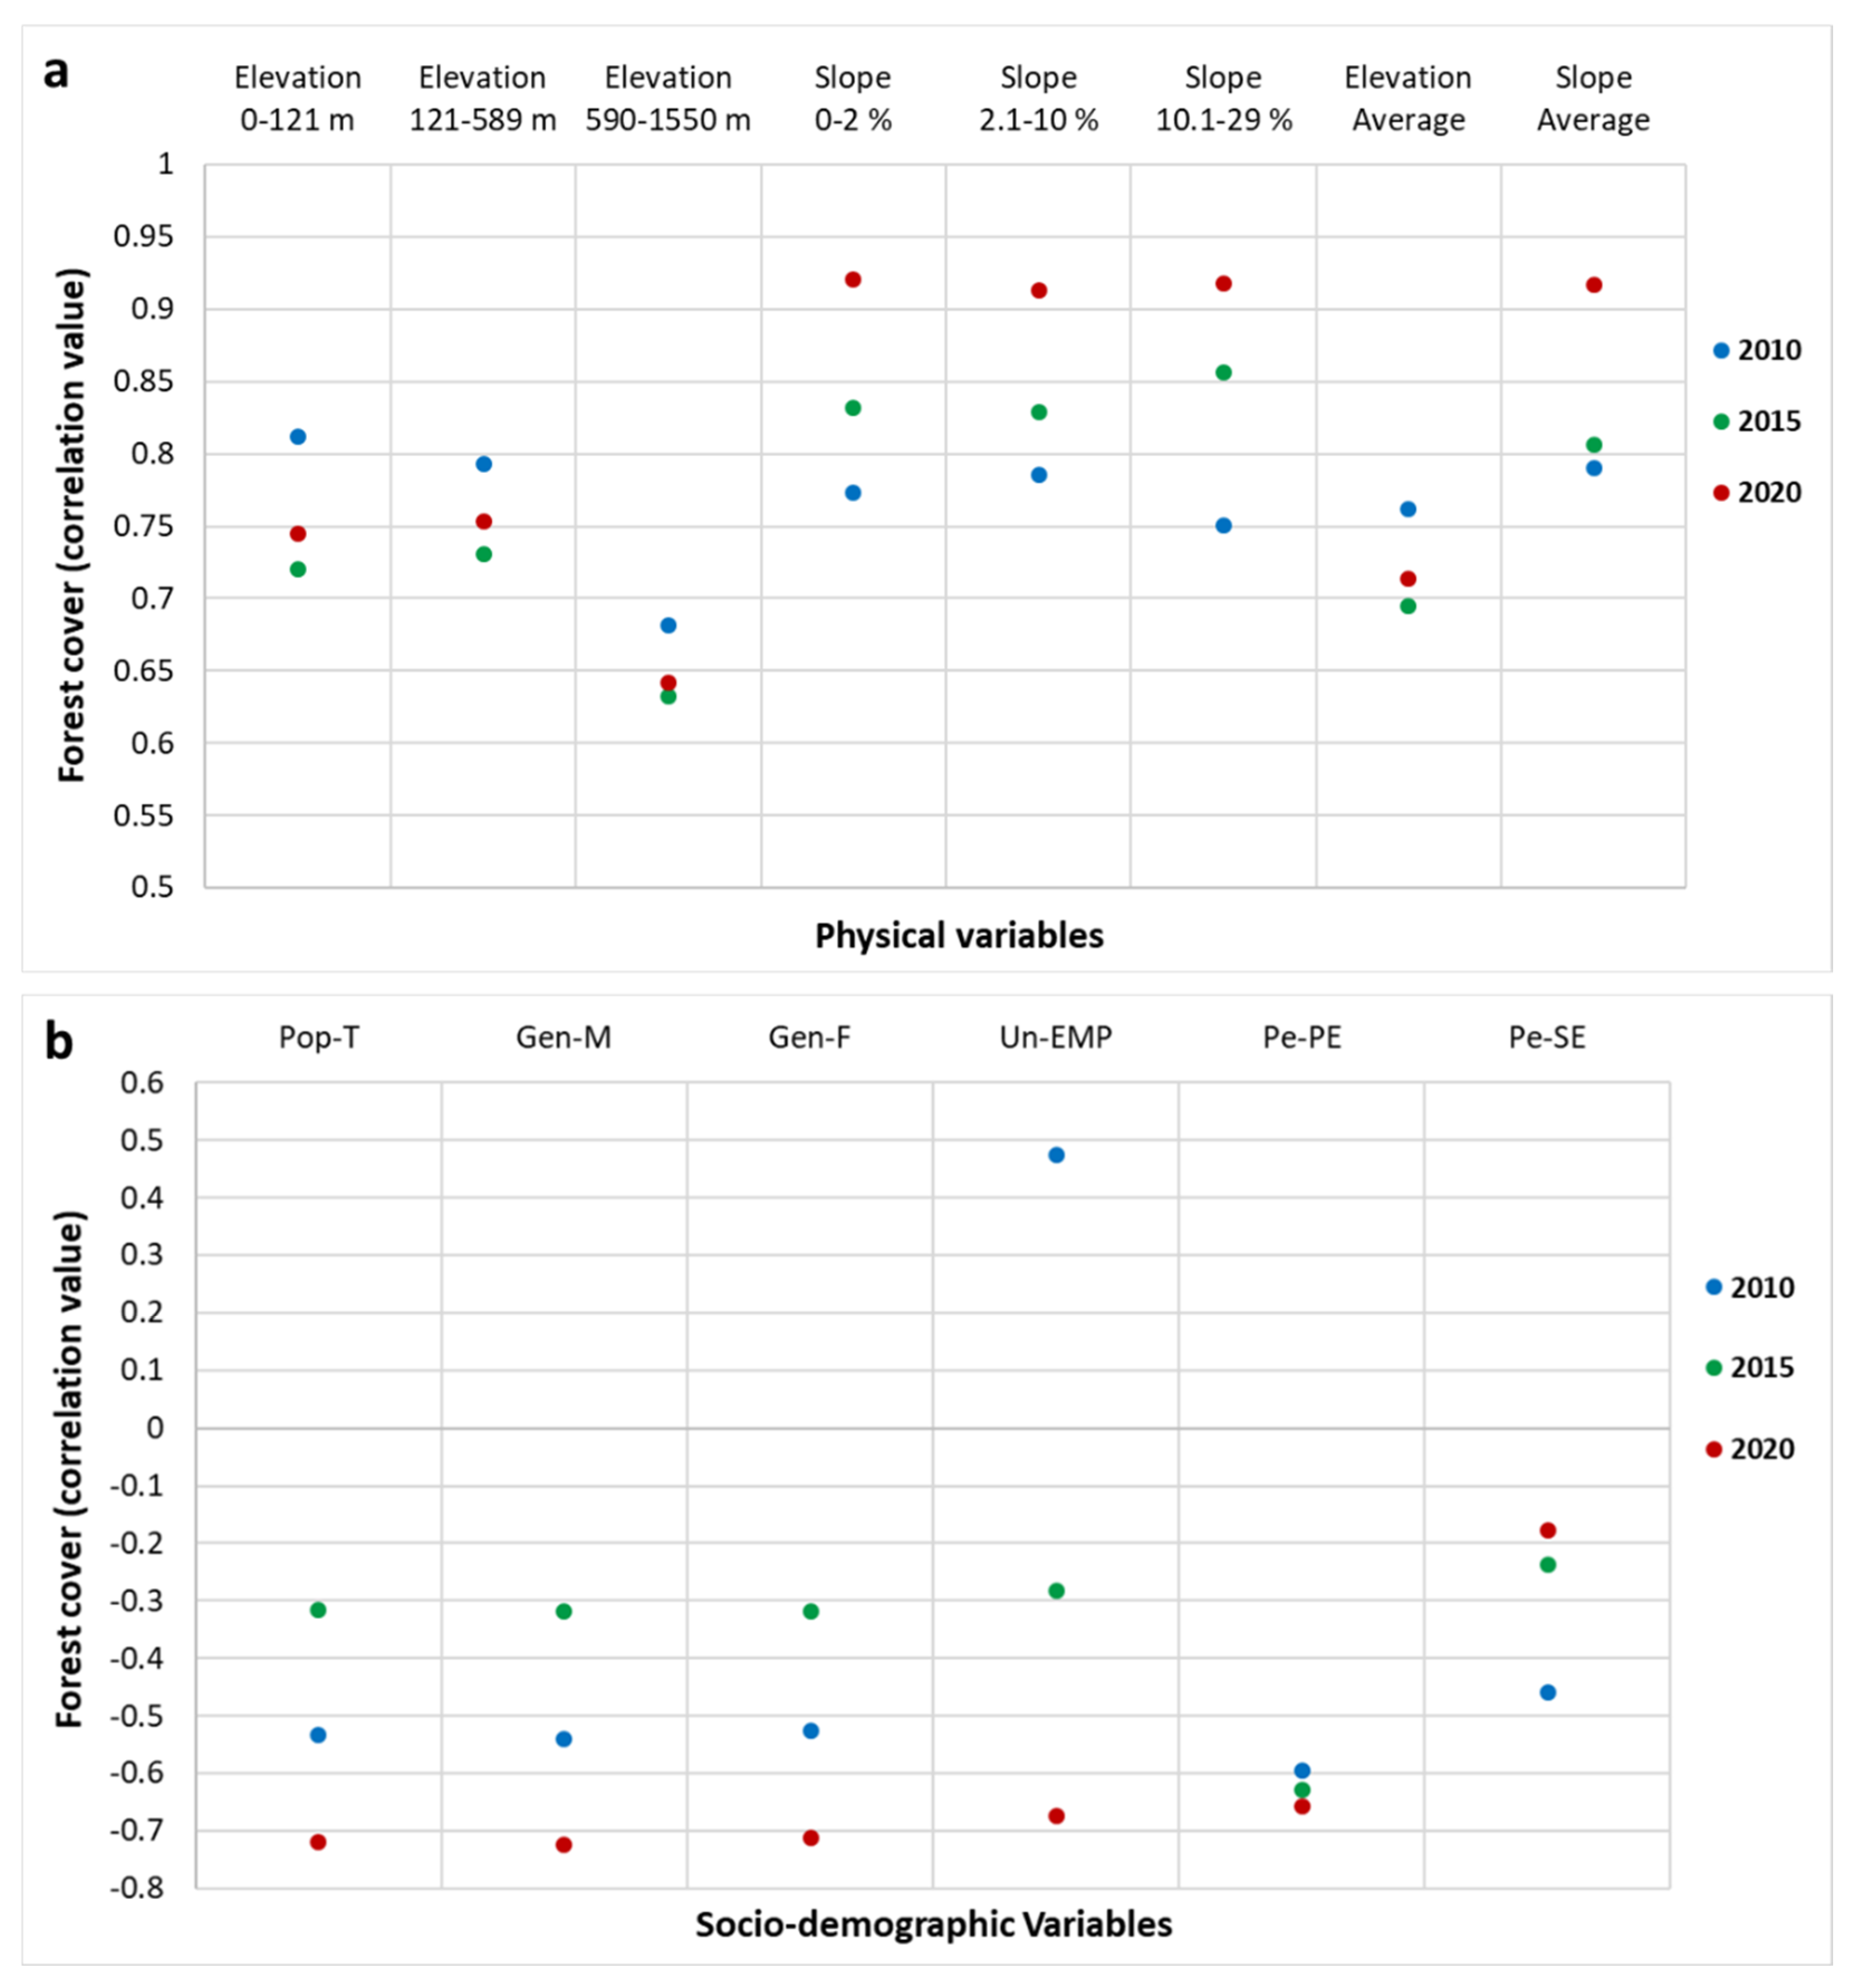
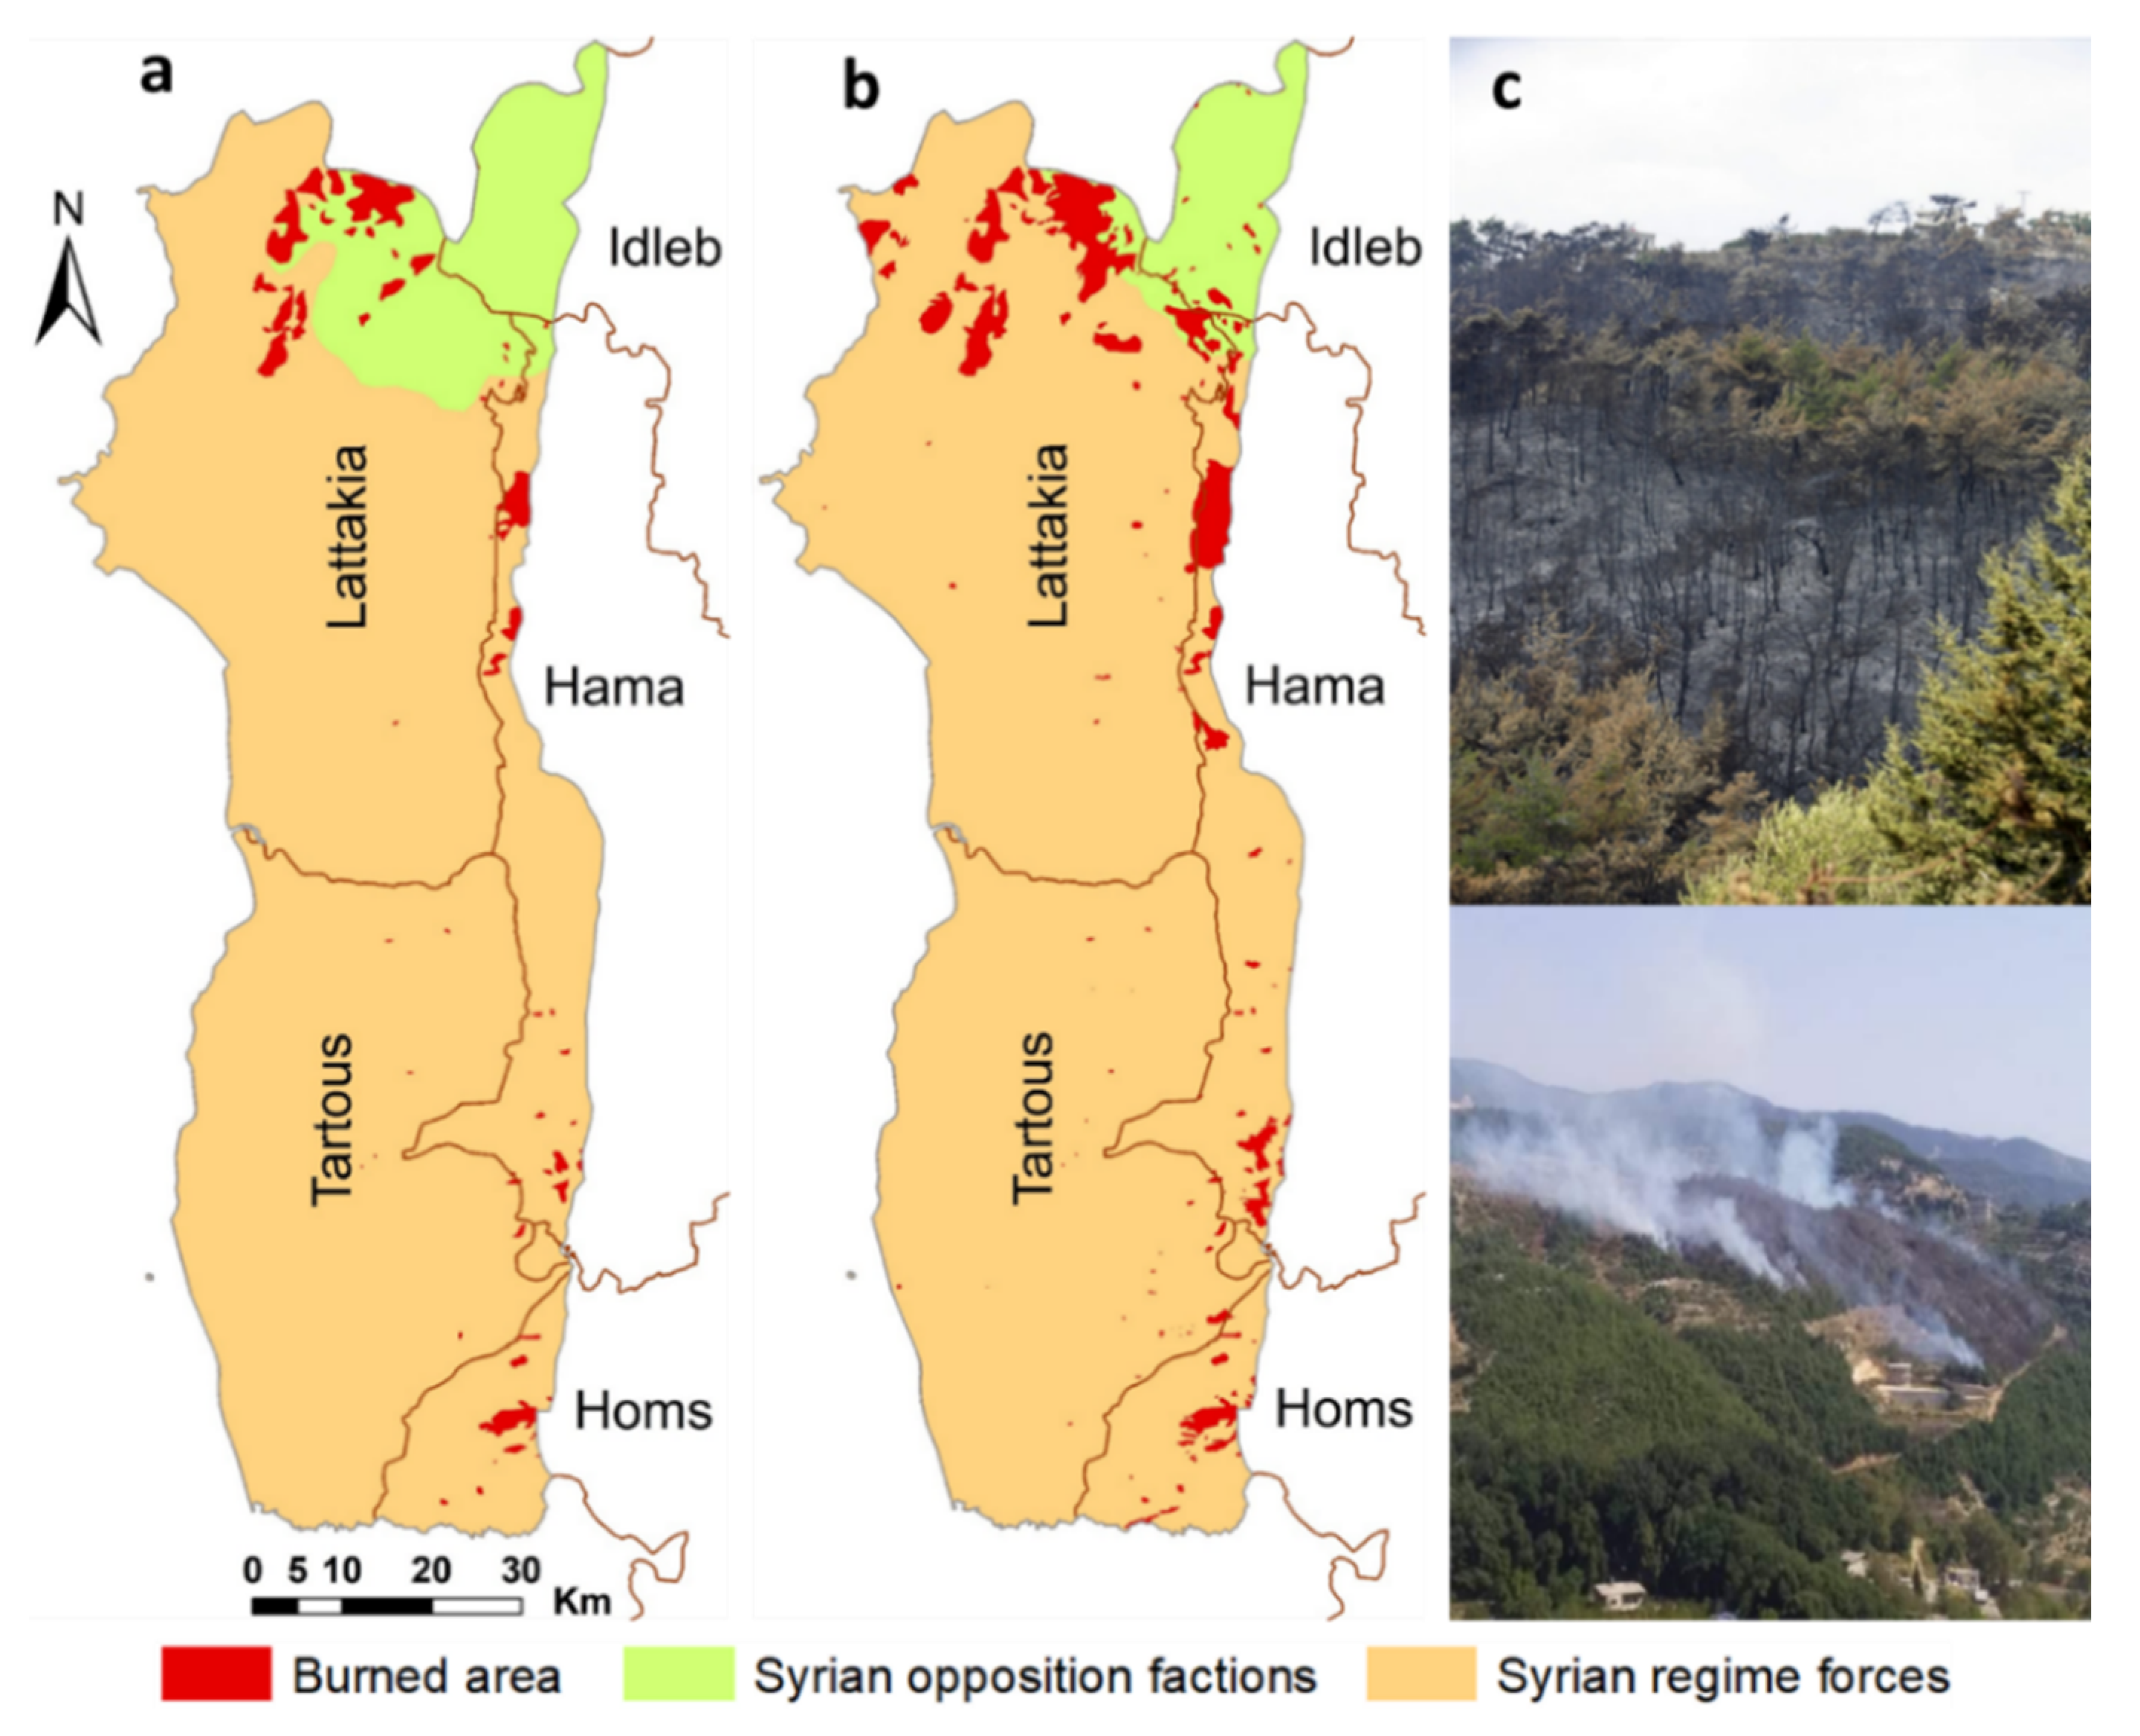
Table 1.
Area of main natural forests in hectares (ha) and percentage share (%) in 2010.
| Natural Vegetation Cover | (ha) | (%) | |
|---|---|---|---|
| Coniferous Forests | Pinus bruita | 80,833.5 | 15.0 |
| Abies cilicica | 30,705.3 | 5.7 | |
| Cedrus libani | 4703.6 | 0.9 | |
| Cupressus sempervirens | 16,604.0 | 3.1 | |
| Pinus halepensis | 7590.0 | 1.4 | |
| Broad-leaved Forests | Quercus calliprinos | 7023.5 | 1.3 |
| Quercus cerris sp. Pseudocerris | 32,114.0 | 6.0 | |
| Quercus infectoria | 16,247.0 | 3.0 | |
| Castanea sativa | 5267.4 | 1.0 | |
| Riverside Forests | 149,403.7 | 27.6 | |
| Scrub | Small areas of sparse vegetation and low shrubs | 188,364.5 | 35.0 |
Table 2.
Details of the Landsat images and bands used in the classification and analysis [61].
Table 2.
Details of the Landsat images and bands used in the classification and analysis [61].
| Landsat Sensor | Scene Path-Row | Date of Acquisition (yyyy/mm/dd) | Spatial Resolution | Standard False Color Composite Bands | Bands for Visual Interpretation | Spectral Bands (μm) |
|---|---|---|---|---|---|---|
| TM 2010 | 174/35 174/36 | 2010/08/29 2010/08/29 | 30 × 30 m | 5-4-3 | 4-5-3 | Band 3 = Red (0.63–0.69), Band 4 = NIR (0.76–0.9), Band 5 = SWIR (1.55–1.75) |
| OLI 2015 | 174/35 174/36 | 2015/09/12 2015/09/12 | 30 × 30 m | 6-5-4 | 5-6-4 | Band 4 = Red (0.630–0.680), Band 5 = NIR (0.845–0.885), Band 6 = SWIR 1 (1.560–1.660) |
| OLI 2020 | 174/35 174/36 | 2020/09/09 2020/09/09 | 30 × 30 m | 6-5-4 | 5-6-4 |
Table 3.
Detailed description of land use/cover types in the Syrian coast region [51].
Table 3.
Detailed description of land use/cover types in the Syrian coast region [51].
| LULC Type | Description |
|---|---|
| Urban and peri-urban areas | Built-up areas and settlements (cities, villages), non-built-up areas (open structures related to human activities, such as quarries and permanent and temporary military zones) |
| Cultivated areas | Areas cultivated with crops: horticultural crops (fruit-tree plantations, field and vegetable crops grown on small plots receiving intensive inputs), tree crops (olive grove areas), non-irrigated crops (mostly rainfed winter/spring field crops). |
| Forest and other wooded areas | Undifferentiated coniferous and broadleaf, deciduous and evergreen, forest areas, scrubland, and degraded forest, often interspersed with tree crops |
| Bare areas with or without sparse grasslands | Unvegetated land, exposed rocks and burnt out areas |
| Water bodies | Freshwater lakes and reservoirs, rivers |
Table 4.
A summary of the physical and socio-demographic variables as explanatory variables used in geographically weighted regression for changes tracking in forest cover in the Syrian coast region.
Table 4.
A summary of the physical and socio-demographic variables as explanatory variables used in geographically weighted regression for changes tracking in forest cover in the Syrian coast region.
| Dependent Variables | Explanation |
|---|---|
| Forest cover change | Spatial and temporal dynamics (2010–2020) |
| Independent Variables | |
| Elevation | Altitude (above sea level) in meters |
| Slope | Surface’s gradient, describing the magnitude of the steepest gradient (in%) |
| Pop-T | Total population |
| Gen-M | Number of males |
| Gen-F | Number of females |
| Un-EMP | Number of unemployed |
| Pe-PE | Number of people with primary education |
| Pe-SE | Number of people with secondary education (scientific, literary and professional education) |
Table 5.
Confusion matrices containing the accuracy assessment of the classified LULC categories using a stratified sample for the years 2010, 2015, and 2020. Here, producer’s accuracy is PA and user’s accuracy is UA.
Table 5.
Confusion matrices containing the accuracy assessment of the classified LULC categories using a stratified sample for the years 2010, 2015, and 2020. Here, producer’s accuracy is PA and user’s accuracy is UA.
| (a) Confusion Matrix for 2010 LULC Map | |||||||
| 1 | 2 | 3 | 4 | 5 | Total | UA (%) | |
| 1. Urban and peri-urban areas | 18 | 1 | 1 | 0 | 0 | 20 | 90.0 |
| 2. Cultivated areas | 1 | 176 | 8 | 8 | 0 | 193 | 91.2 |
| 3. Forest and other wooded areas | 1 | 13 | 132 | 4 | 0 | 150 | 88.0 |
| 4. Bare areas | 2 | 12 | 2 | 101 | 0 | 117 | 86.3 |
| 5. Water bodies | 0 | 0 | 0 | 0 | 11 | 11 | 100.0 |
| Total | 22 | 202 | 143 | 113 | 11 | 491 | |
| PA (%) | 81.8 | 87.1 | 92.3 | 89.4 | 100.0 | ||
| PA adjusted (%) | 83.3 | 90.3 | 89.1 | 88.4 | 100.0 | ||
| Overall accuracy (%) | 89.2 | ||||||
| Overall adjusted accuracy (%) | 89.3 | ||||||
| (b) Confusion Matrix for 2015 LULC Map | |||||||
| 1 | 2 | 3 | 4 | 5 | Total | UA (%) | |
| 1. Urban and peri-urban areas | 21 | 4 | 1 | 4 | 0 | 30 | 70.0 |
| 2. Cultivated areas | 1 | 167 | 5 | 2 | 0 | 175 | 95.4 |
| 3. Forest and other wooded areas | 0 | 19 | 138 | 1 | 0 | 158 | 87.3 |
| 4. Bare areas | 2 | 9 | 5 | 101 | 0 | 117 | 86.3 |
| 5. Water bodies | 0 | 0 | 0 | 0 | 11 | 11 | 100.0 |
| Total | 24 | 199 | 149 | 108 | 11 | 491 | |
| PA (%) | 87.5 | 83.9 | 92.6 | 93.5 | 100.0 | ||
| PA adjusted (%) | 86.1 | 89.3 | 88.1 | 93.5 | 100.0 | ||
| Overall accuracy (%) | 89.2 | ||||||
| Overall adjusted accuracy (%) | 89.9 | ||||||
| (c) Confusion Matrix for 2020 LULC Map | |||||||
| 1 | 2 | 3 | 4 | 5 | Total | UA (%) | |
| 1. Urban and peri-urban areas | 16 | 8 | 0 | 2 | 0 | 26 | 61.5 |
| 2. Cultivated areas | 2 | 167 | 3 | 6 | 0 | 178 | 93.8 |
| 3. Forest and other wooded areas | 0 | 21 | 121 | 2 | 0 | 144 | 84.0 |
| 4. Bare areas | 1 | 18 | 6 | 107 | 0 | 132 | 81.1 |
| 5. Water bodies | 0 | 0 | 0 | 0 | 11 | 11 | 100.0 |
| Total | 19 | 214 | 130 | 117 | 11 | 491 | |
| PA (%) | 84.2 | 78.0 | 93.1 | 91.5 | 100.0 | ||
| PA adjusted (%) | 85.8 | 82.4 | 88.3 | 91.2 | 100.0 | ||
| Overall accuracy (%) | 85.9 | ||||||
| Overall adjusted accuracy (%) | 86.0 | ||||||
Table 6.
Area estimates in hectares (ha) and percentage share (%) of each LULC category between 2010 and 2020 (after computing adjusted area estimate).
Table 6.
Area estimates in hectares (ha) and percentage share (%) of each LULC category between 2010 and 2020 (after computing adjusted area estimate).
| (a) Area Estimate for 2010 | ||||
| LULC Category | Area Calculated Based on Pixels | Adjusted Area Estimate | Adjusted Area of Total Area | Confidence Interval (±) |
| 1. Urban and peri-urban areas | 23,984.8 | 25,920.4 | 4.8% | 4163.0 |
| 2. Cultivated areas | 257,832.1 | 260,370.1 | 48.3% | 10,624.0 |
| 3. Forest and other wooded areas | 129,869.0 | 128,303.7 | 23.8% | 7648.0 |
| 4. Bare areas | 124,742.0 | 121,833.8 | 22.6% | 7284.0 |
| 5. Water bodies | 2427.6 | 2427.6 | 0.5% | 365.0 |
| (b) Area Estimate for 2015 | ||||
| LULC Category | Classified Map Area | Adjusted Area Estimate | Adjusted Area of Total Area | Confidence Interval (±) |
| 1. Urban and peri-urban areas | 32,773.1 | 26,653.0 | 4.9% | 9741.5 |
| 2. Cultivated areas | 252,772.2 | 268,627.0 | 49.9% | 12,772.0 |
| 3. Forest and other wooded areas | 118,775.5 | 119,167.0 | 22.1% | 10,644.0 |
| 4. Bare areas | 132,620.5 | 122,495.0 | 22.7% | 10,164.0 |
| 5. Water bodies | 1914.2 | 1914.0 | 0.4% | 376.0 |
| (c) Area Estimate for 2020 | ||||
| LULC category | Classified Map Area | Adjusted Area Estimate | Adjusted Area of Total Area | Confidence Interval (±) |
| 1. Urban and peri-urban areas | 38,138.5 | 27,359.4 | 5.1% | 8500.0 |
| 2. Cultivated areas | 239,787.4 | 272,907.5 | 50.6% | 15,488.0 |
| 3. Forest and other wooded areas | 100,714.5 | 97,188.6 | 18.0% | 9781.0 |
| 4. Bare areas | 157,783.9 | 138,968.8 | 25.8% | 12,875.0 |
| 5. Water bodies | 2431.2 | 2431.2 | 0.5% | 353.0 |
Table 7.
Net LULC transitions (in ha) between 2010 and 2020.
| LULC Category | 2010 to 2015 (ha) | 2015 to 2020 (ha) | 2010 to 2020 (ha) |
| Urban and peri-urban areas to cultivated areas | 67.3 | 83.5 | 165.4 |
| Urban and peri-urban areas to forest | 0.0 | 0.0 | 0.0 |
| Urban and peri-urban areas to bare areas | 34.8 | 71.0 | 105.8 |
| Urban and peri-urban areas to water bodies | 0.0 | 0.0 | 0.0 |
| Cultivated areas to urban and peri-urban areas | 175.6 | 202.0 | 233.4 |
| Cultivated areas to forest | 0.0 | 0.0 | 0.0 |
| Cultivated areas to bare areas | 44.8 | 70.0 | 130.8 |
| Cultivated areas to water bodies | 0.0 | 0.0 | 0.0 |
| Forest to urban and peri-urban areas | 423.6 | 447.5 | 860.0 |
| Forest to cultivated areas | 6327.6 | 3482.0 | 8823.0 |
| Forest to bare areas | 2385.5 | 18,048.9 | 21,432.1 |
| Forest to water bodies | 0.0 | 0.0 | 0.0 |
| Bare areas to urban and peri-urban areas | 133.4 | 56.9 | 345.6 |
| Bare areas to cultivated areas | 1860.0 | 715.0 | 3547.5 |
| Bare areas to forest | 0.0 | 0.0 | 0.0 |
| Bare areas to water bodies | 0.0 | 0.0 | 0.0 |
| Water bodies to urban and peri-urban areas | 0.0 | 0.0 | 0.0 |
| Water bodies to cultivated areas | 2.0 | 0.0 | 2.0 |
| Water bodies to forest | 0.0 | 0.0 | 0.0 |
| Water bodies to bare areas | 511.6 | 517.2 | 3.6 |
Table 8.
Area (ha) and proportion (%) of forest cover classified by density in the study area from 2010 to 2020 region (after computing adjusted area estimates).
Table 8.
Area (ha) and proportion (%) of forest cover classified by density in the study area from 2010 to 2020 region (after computing adjusted area estimates).
| Forest Class | Stand 2010 | Stand 2015 | Stand 2020 | |||
|---|---|---|---|---|---|---|
| Area (ha) | % | Area (ha) | % | Area (ha) | % | |
| Dense forest | 30,117.8 | 23.5 | 27,180.4 | 22.8 | 18,339.5 | 18.9 |
| Open forest | 32,600.3 | 25.4 | 48,278.1 | 40.5 | 47,233.7 | 48.6 |
| Dispersed forest and shrubs | 65,585.6 | 51.1 | 43,707.7 | 36.7 | 31,615.5 | 32.5 |
| Total | 128,303.7 | 100.0 | 119,167.0 | 100.0 | 97,188.6 | 100.0 |
Table 9.
Change trend of forest cover by density and the gain–loss rate in the Syrian coast region from 2010 to 2020 (after computing adjusted area estimate).
Table 9.
Change trend of forest cover by density and the gain–loss rate in the Syrian coast region from 2010 to 2020 (after computing adjusted area estimate).
| Forest Class | 2010–2015 | 2015–2020 | Total (2010–2020) | ||||||
|---|---|---|---|---|---|---|---|---|---|
| Area (ha) | Area (%) | Rate (ha2 year1) | Area (ha) | Area (%) | Rate (ha2 year1) | Area (ha) | Area (%) | Rate (ha2 year1) | |
| Dense forest | −2937.4 | −2.3 | −587.5 | −8840.9 | −7.4 | −1768.2 | −11,778.3 | −9.2 | −1177.8 |
| Open forest | 15,677.8 | 12.2 | 3135.6 | −1044.4 | −0.9 | −208.9 | 14,633.4 | 11.4 | 1463.3 |
| Dispersed forest and shrubs | −21,877.9 | −17.1 | −4375.6 | −12,092.2 | −10.1 | −2418.4 | −33,970.1 | −26.5 | −3397.0 |
| Total | −9136.7 | −7.2 | −1827.3 | −21,978.4 | −18.4 | −4395.7 | −31,115.1 | −24.3 | −3111.5 |
Publisher’s Note: MDPI stays neutral with regard to jurisdictional claims in published maps and institutional affiliations. |
© 2021 by the author. Licensee MDPI, Basel, Switzerland. This article is an open access article distributed under the terms and conditions of the Creative Commons Attribution (CC BY) license (http://creativecommons.org/licenses/by/4.0/).
Share and Cite
MDPI and ACS Style
Mohamed, M.A. An Assessment of Forest Cover Change and Its Driving Forces in the Syrian Coastal Region during a Period of Conflict, 2010 to 2020. Land 2021, 10, 191. https://doi.org/10.3390/land10020191
AMA Style
Mohamed MA. An Assessment of Forest Cover Change and Its Driving Forces in the Syrian Coastal Region during a Period of Conflict, 2010 to 2020. Land. 2021; 10(2):191. https://doi.org/10.3390/land10020191
Chicago/Turabian StyleMohamed, Mohamed Ali. 2021. "An Assessment of Forest Cover Change and Its Driving Forces in the Syrian Coastal Region during a Period of Conflict, 2010 to 2020" Land 10, no. 2: 191. https://doi.org/10.3390/land10020191
Note that from the first issue of 2016, this journal uses article numbers instead of page numbers. See further details here.