Article

Short-Chain Fatty Acids Suppress mTOR Signaling in Colon Cancer Cells via Long Non-Coding RNA RMST

Department of Medical Microbiology, Immunobiology and Cell Biology, Southern Illinois University School of Medicine and Simmons Cancer Institute, Springfield, IL 62702, USA
*
Author to whom correspondence should be addressed.
Kinases Phosphatases 2024, 2(2), 136-150; https://doi.org/10.3390/kinasesphosphatases2020008
Submission received: 31 January 2024 / Revised: 19 March 2024 / Accepted: 26 March 2024 / Published: 1 April 2024

Abstract

:
Short-chain fatty acids (SCFAs), derived from fermentation of dietary fibers and resistant starch by the microbiota in the colon, exert multiple effects on colonic functions, including tumor suppressing activities. Our previous studies found that SCFAs induced autophagy in colon cancer cells via downregulating mTOR signaling, but the mechanism involved in mTOR suppression still needs to be defined. In this study, we identified rhabdomyosarcoma 2 associated transcript (RMST), a long non-coding RNA, as a key mediator for SCFAs to suppress mTOR activation in colon cancer cells. RMST could be significantly induced by SCFAs in a time- and dose-dependent manner. RMST, by itself, was sufficient to suppress mTOR signaling and augment autophagosome formation. Depletion of RMST, through siRNA or CRISPR knockdown, reduced the abilities of SCFAs to suppress mTOR activation or to induce autophagic responses. RMST increased the expression level of TSC2, a negative regulator of the mTOR signaling pathway. Our data delineate a novel RMST/TSC2 cellular pathway, enlisted by SCFAs, to modulate mTOR activities in colon cancer cells.

1. Introduction

Short-chain fatty acids (SCFAs) are the by-products of dietary fibers going through bacterial fermentation in the colon. The main SCFAs produced by fiber fermentation in the colon are acetate (C2), propionate (C3) and butyrate (C4) in a molar ratio of about 3:1:1 [1]. Readily absorbed, SCFAs can modulate a variety of colonic functions, including inhibition of carcinogenesis while promoting the growth of normal colon epithelium [2,3,4]. A large body of evidence has demonstrated that SCFAs could modulate cell differentiation, proliferation, apoptosis, motility and invasion [5,6,7]. Previously, we reported that SCFAs suppressed mTOR signaling and increased autophagy in colon cancer cells [8,9], but the exact mechanism is still not well defined.
Mammalian target of rapamycin (mTOR) is a revolutionary conserved serine/threonine protein kinase in the family of the phosphatidylinositol kinase-related kinase (PIKK). There are two distinct mTOR complexes, which are different in the substrate specificity factors: raptor in mTORC1 complex and rictor in mTORC2 complex [10,11]. As an integrator of numerous environmental stimuli including growth factors, nutrients, and stress-activated signals, mTOR regulates cell metabolism, growth, proliferation and survival. Deregulation of the mTOR signaling pathway is related to human diseases such as cancer, obesity, type 2 diabetes and neurodegeneration [12,13]. Moreover, mTOR has been known as a master regulator of autophagy. Inhibition of mTORC1 activity by nutrient deprivation strongly induces autophagy through the regulation of the ULK protein kinase complexes during formation of autophagosomes [14,15].
Long non-coding RNA (lncRNA) is a subset of non-coding transcripts with a minimum length of 200 nucleotides. LncRNAs can regulate multiple biological processes related to development, differentiation and metabolism [16,17,18,19,20]. In the present study, we profiled lncRNAs in response to SCFA treatments and identified rhabdomyosarcoma (RMS) 2 associated transcript (RMST) as one of lncRNAs markedly induced by SCFAs. Further studies suggest that RMST is an important intermediary for SCFAs to suppress mTOR signaling and consequently regulate autophagy.

2. Results

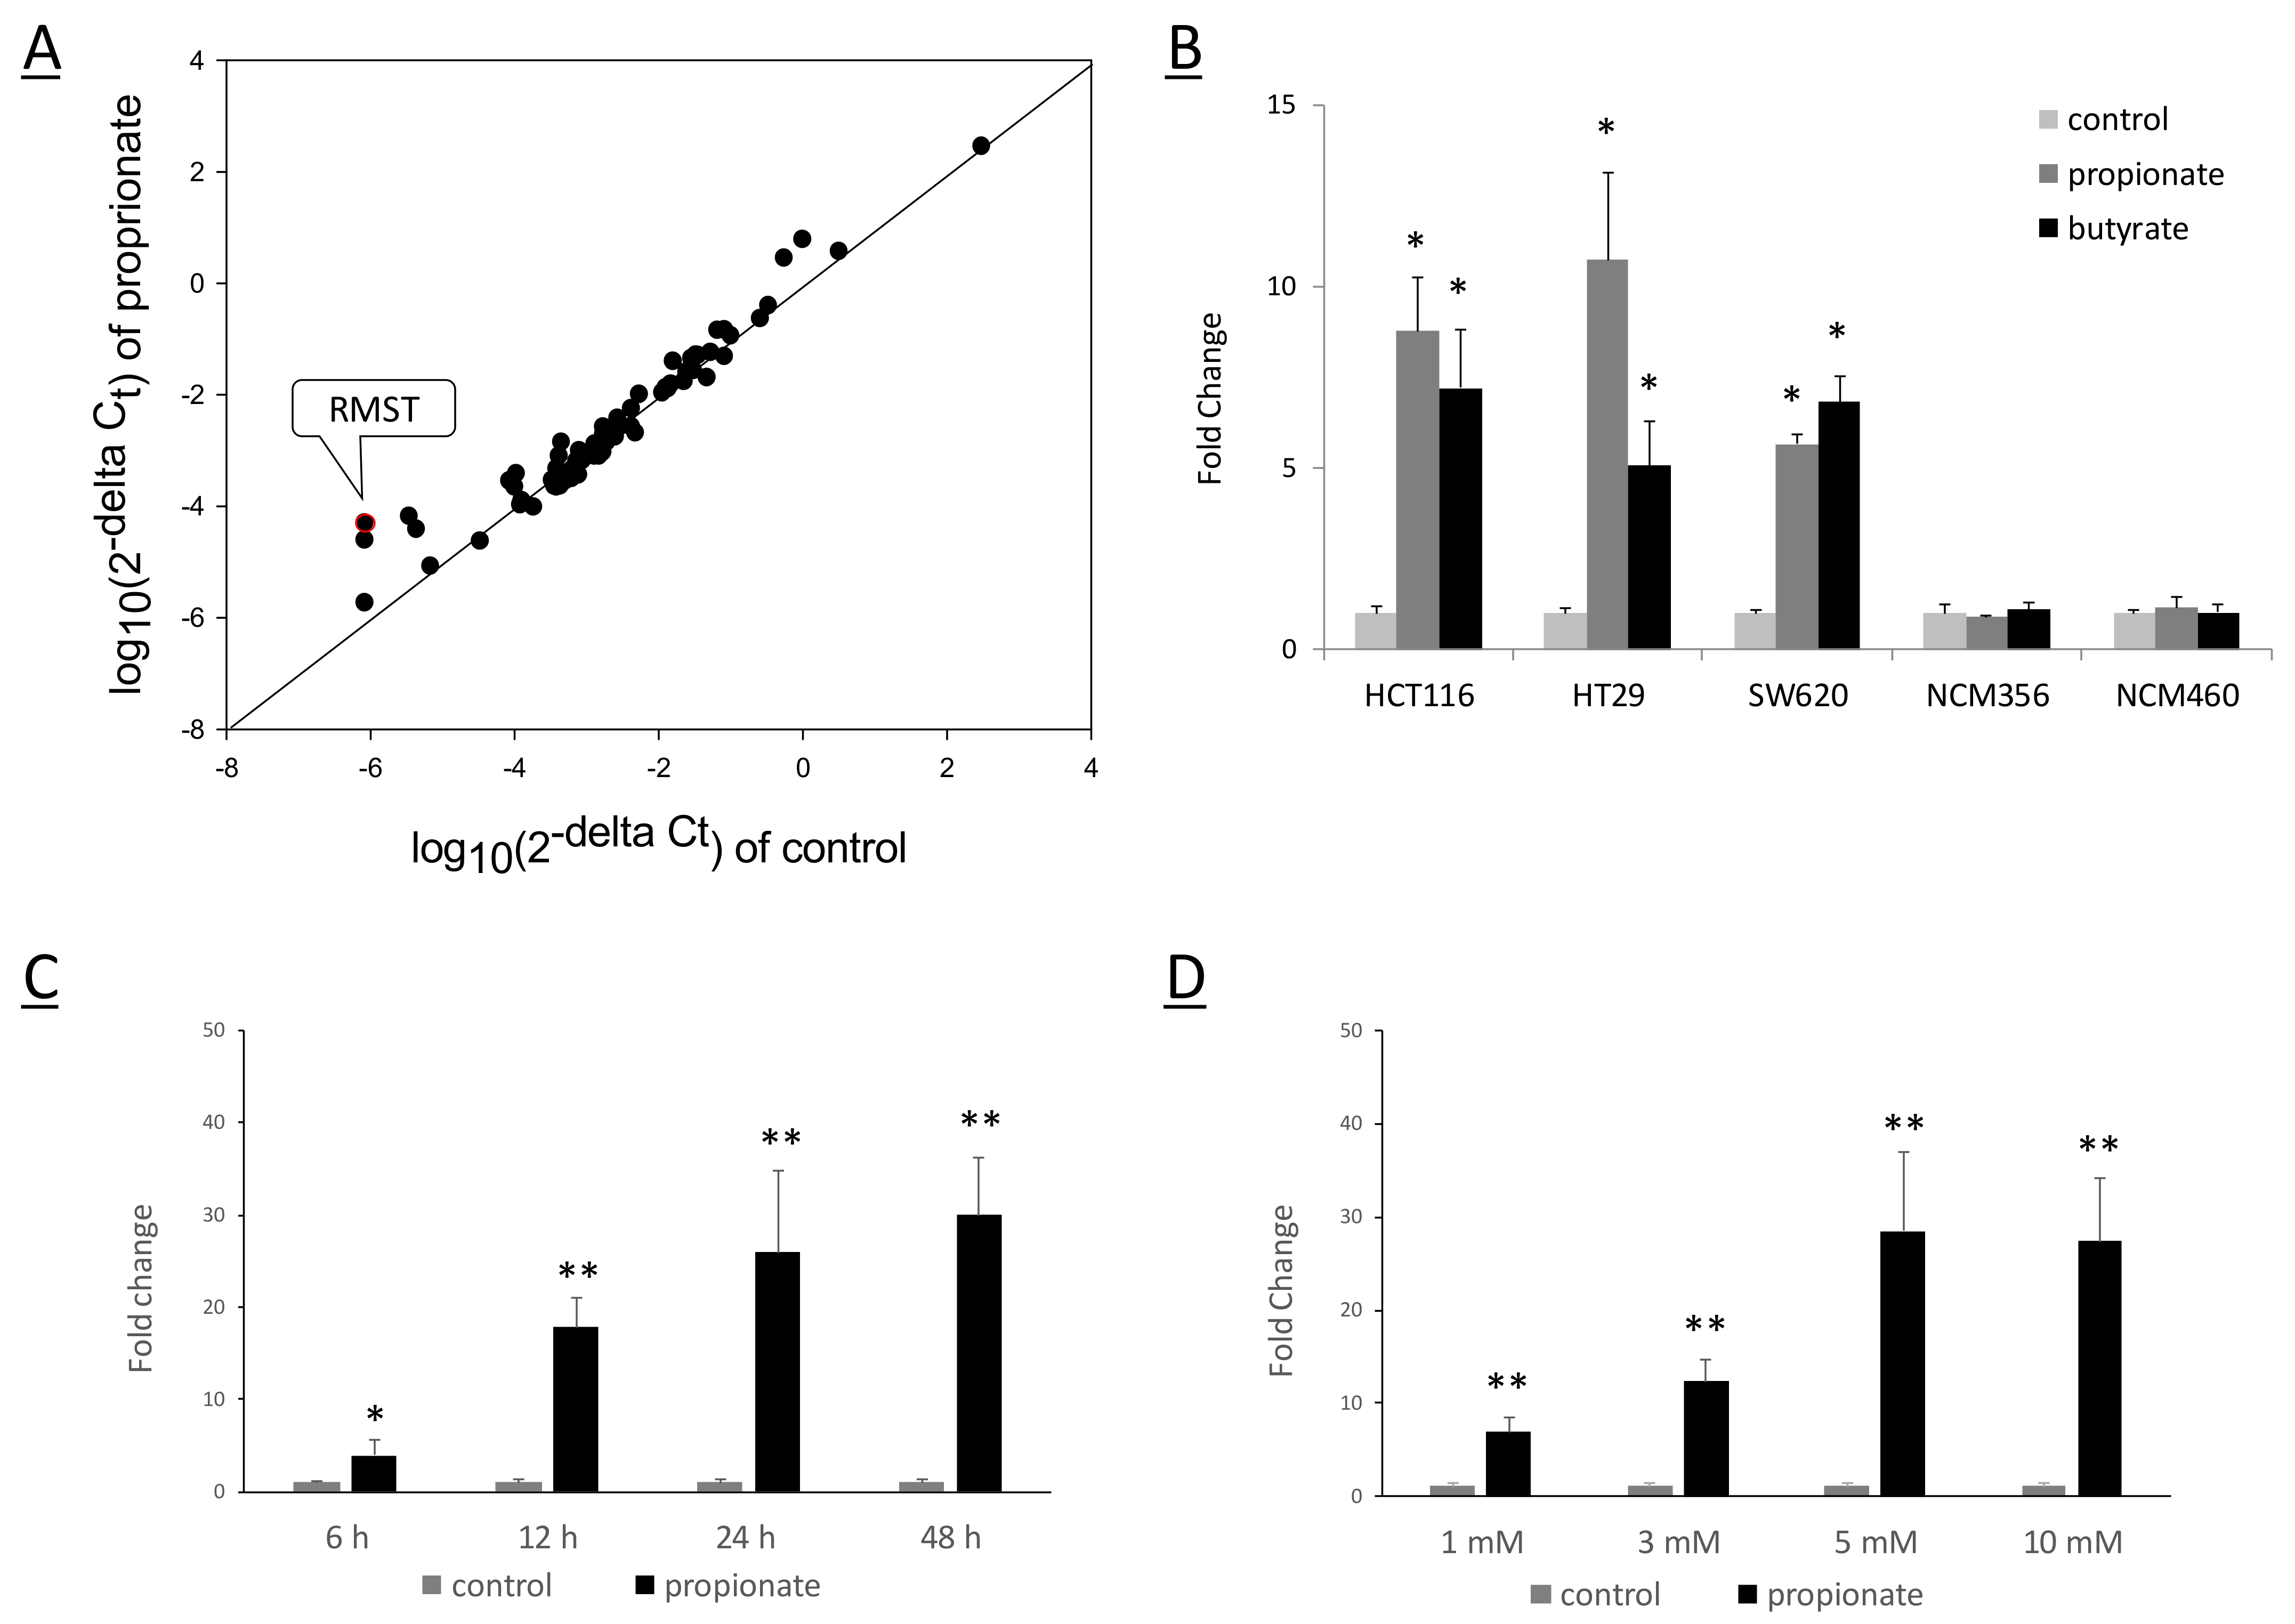
2.1. SCFAs Induced RMST Expression in Colon Cancer Cells

Previously, we reported that SCFAs can induce autophagy and suppress mTOR signaling in colorectal cancer cells [8,9]. To determine the potential involvement of lncRNAs in SCFA suppression of mTOR signaling in colon cancer cells, we profiled the expression of lncRNA in HCT116 cells after SCFA treatment using disease-related lncRNA array. This lncRNA array had 83 disease-related lncRNAs selected from the lncRNA database. As shown in Figure 1A and Supplementary Table S1, the levels of several lncRNAs were altered by propionate treatment, with RMST as the most significantly upregulated lncRNAs (around 62 folds). Butyrate also stimulated RMST expression at a similar extent to propionate.
To confirm the induction of RMST expression, we treated colon cancer cell lines HCT116, HT29 and SW620 with SCFAs and evaluated RMST expression. RMST was markedly induced by propionate and butyrate in all three colon cancer cell lines (Figure 1B). We also examined the level of RMST in non-cancerous colon cells NCM356 and NCM460. The basic RMST level was found to be comparable to that of colon cancer cell lines. However, SCFA treatment did not change the level of RMST in NCM356 and NCM460 (Figure 1B). We further examined the induction of RMST by propionate under different concentrations and durations of treatments. As shown in Figure 1C,D, the induction of RMST in HCT116 was both time- and dose-dependent. Together, the data suggest that SCFA could stimulate the expression of RMST in colon cancer cells, but not in non-cancerous colon cells.

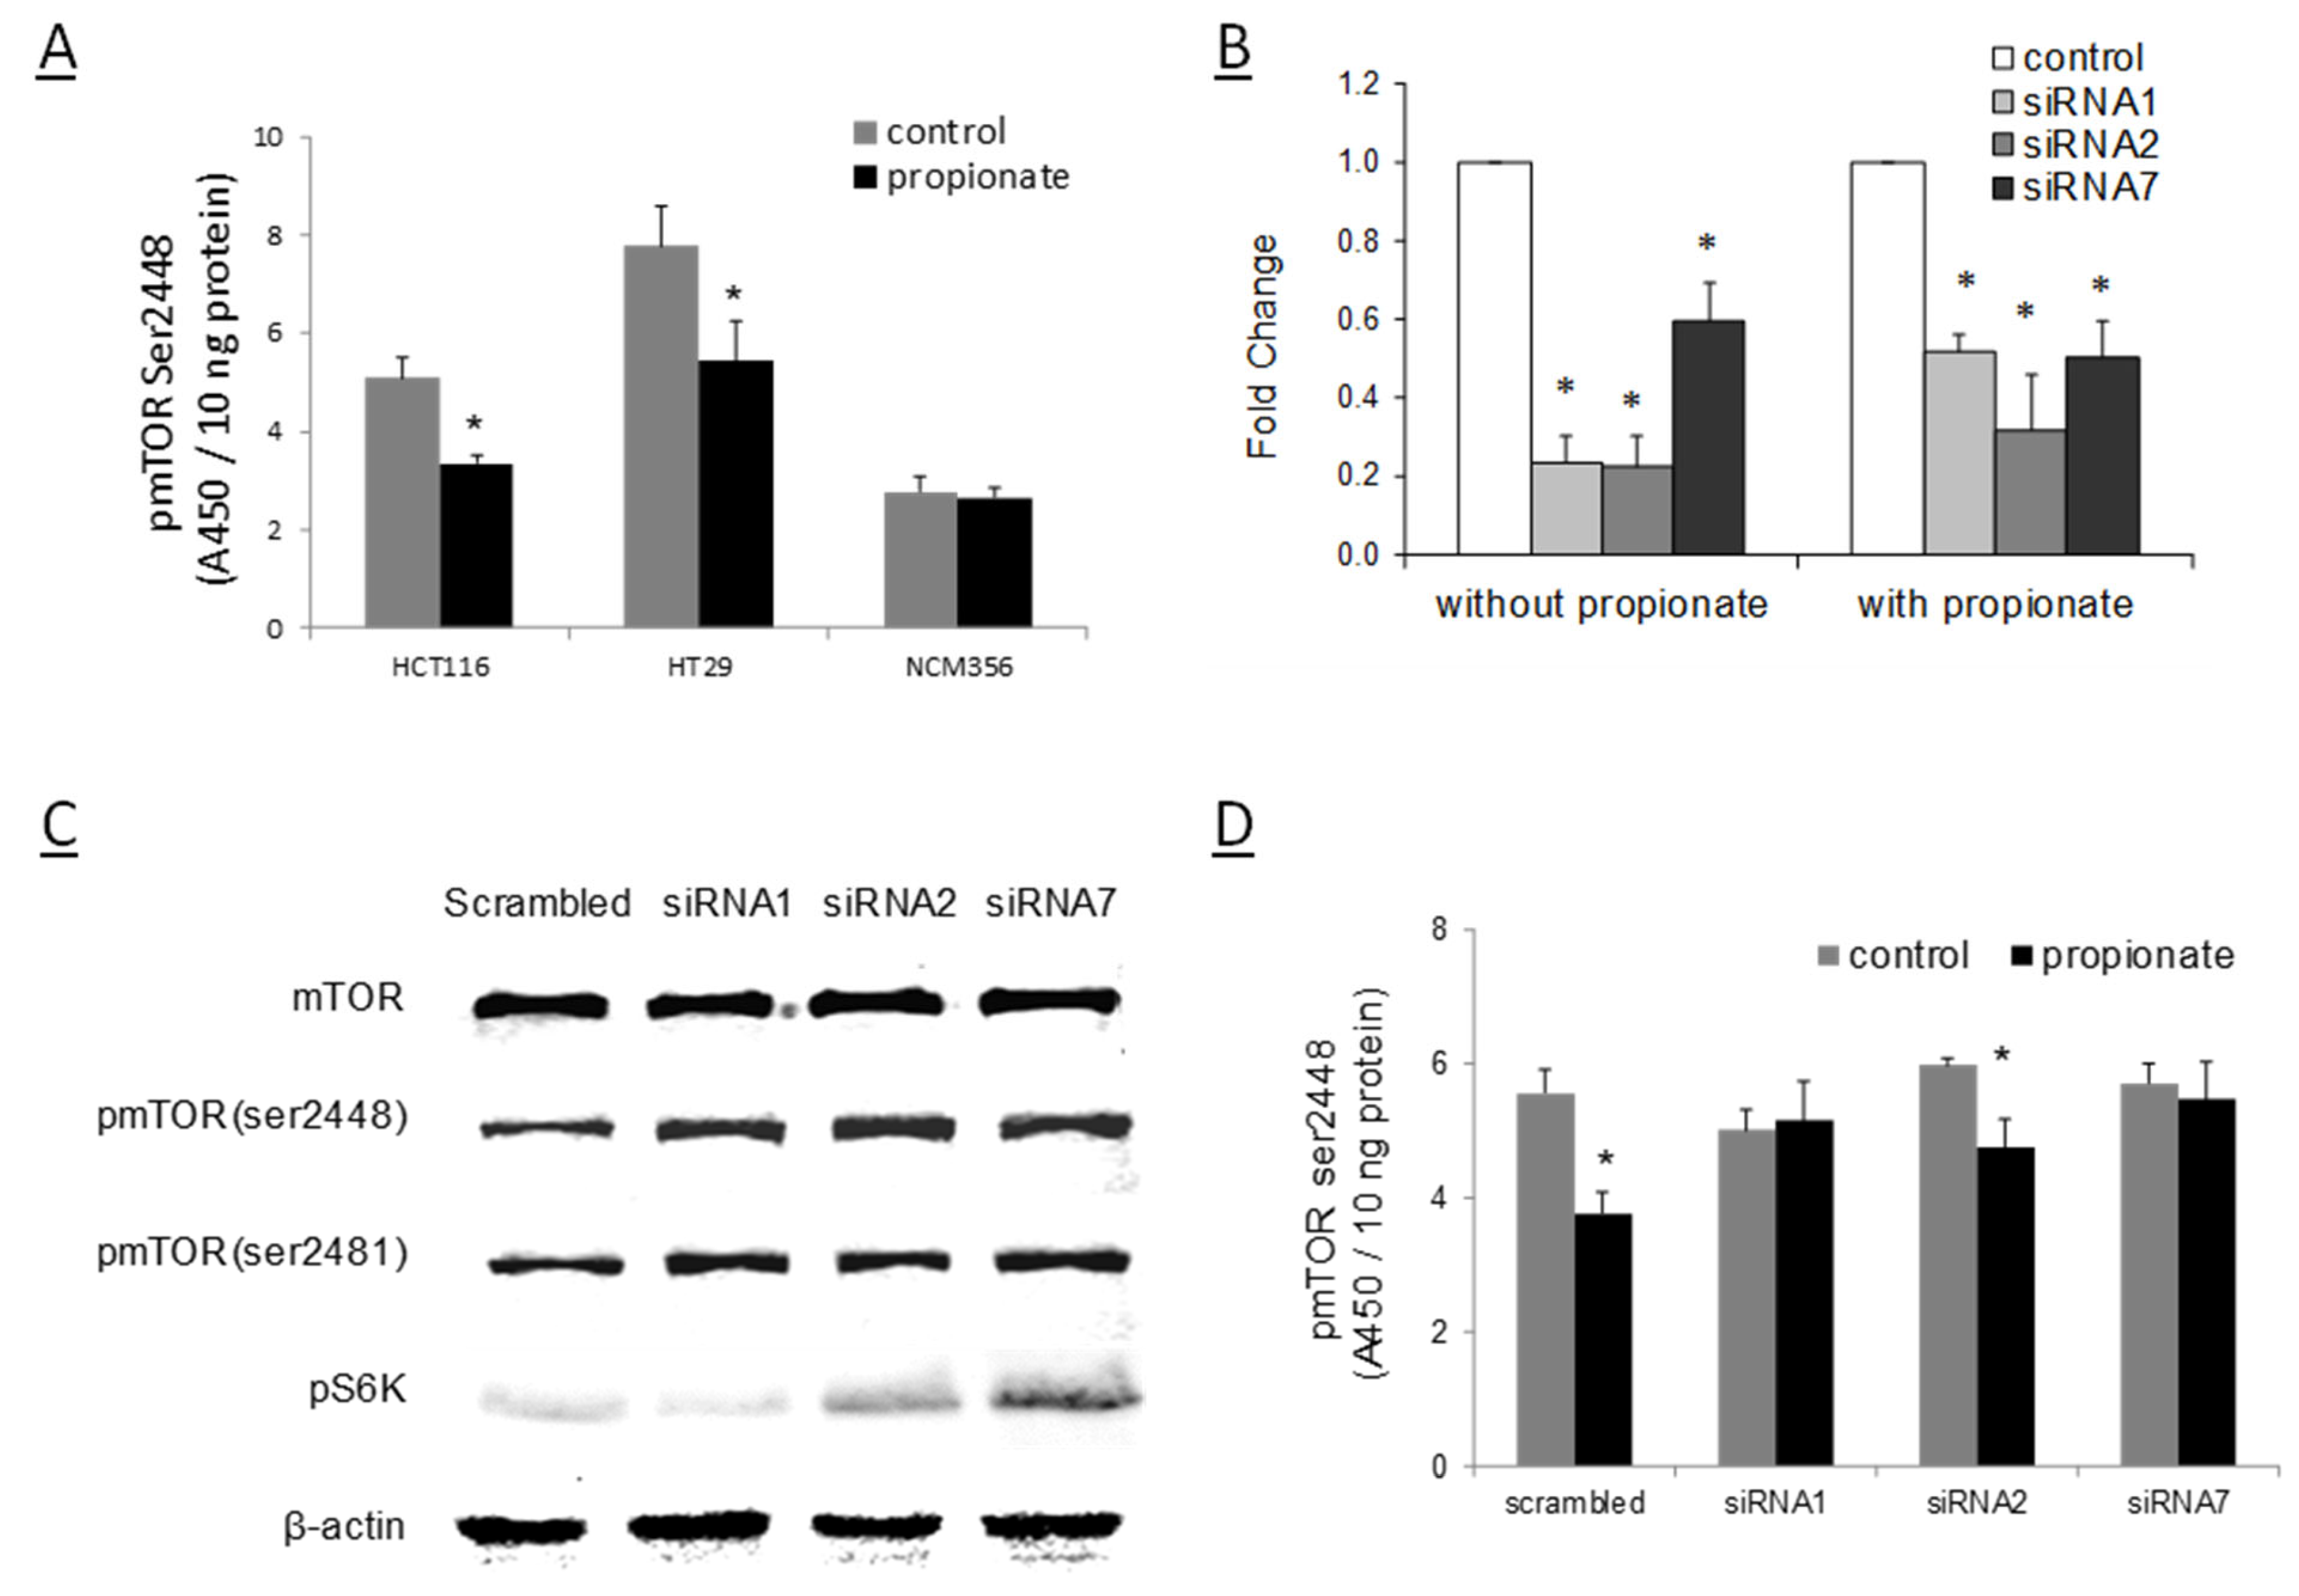
2.2. RMST Is Required for SCFA to Reduce mTOR Activation

Rhabdomyosarcoma (RMS) 2 associated transcript (RMST), also known as non-coding in RMS (NCRMS), was first identified in RMS [21]. Compared with normal muscle and embryonic subtypes, RMST was expressed at a higher level in the more aggressive alveolar subtype, indicating RSMT as a tumor-related lncRNA. Although RMST acts as a transcriptional regulator to regulate gene expression and plays a key role in neuron differentiation and development [22,23], the role of RMST in cellular signaling or cancer biology has not yet been well understood.
Since RMST was markedly induced by SCFAs in colon cancer cells, we next determined whether RMST plays a role in SCFA suppression of mTOR activation. First, we examined the inhibitory effects of SCFA on mTOR activity in colon cancer cells as well as in non-tumorigenic colon epithelial cells. As shown in Figure 2A, the levels of phosphorylated mTOR at ser2448 were notably decreased in HCT116 and HT29 cells 48 h after treatment with propionate, while no difference was observed in NCM356 cells. The data suggest that propionate reduces the levels of active mTOR in colon cancer cells but not in non-tumorigenic colon epithelial NCM356 cells, consistent with the pattern of RMST induction by SCFAs.
To determine whether RMST is responsible for the suppression of mTOR activity by SCFA, we reduced RMST levels with small interfering mRNA (siRNA) in HCT116 cells. The level of RMST in targeted cells was about 30–60% lower than the control with scramble siRNA, with some variations in the knockdown efficiency, even in the presence of propionate treatment (Figure 2B). Cells with siRNA transfection were subjected to propionate treatment to evaluate the effects of RMST knockdown on SCFA downregulation of mTOR. The results of western blot and ELISA assay showed the preponderance of evidence that the inhibitory efficiency of propionate on phosphorylation mTOR and p70S6K were significantly reduced by RMST targeting siRNA, as compared with scrambled transfection cells (Figure 2C,D). Interestingly, siRNA7 was the siRNA with least knockdown on RMST (Figure 2B), but it restored the propionate suppression of mTOR the best, as shown by pS6K (Figure 2C), even though it did not alter phosphorylated mTOR levels significantly in another experiment (Figure 2D). The variations are likely the results of confounding effects on mTOR signaling from various factors such as differences in cell conditions and transfection efficiencies in the three different experiments. The prevalent results obtained suggest that RMST depletion attenuated the ability of SCFAs to suppress mTOR activation.

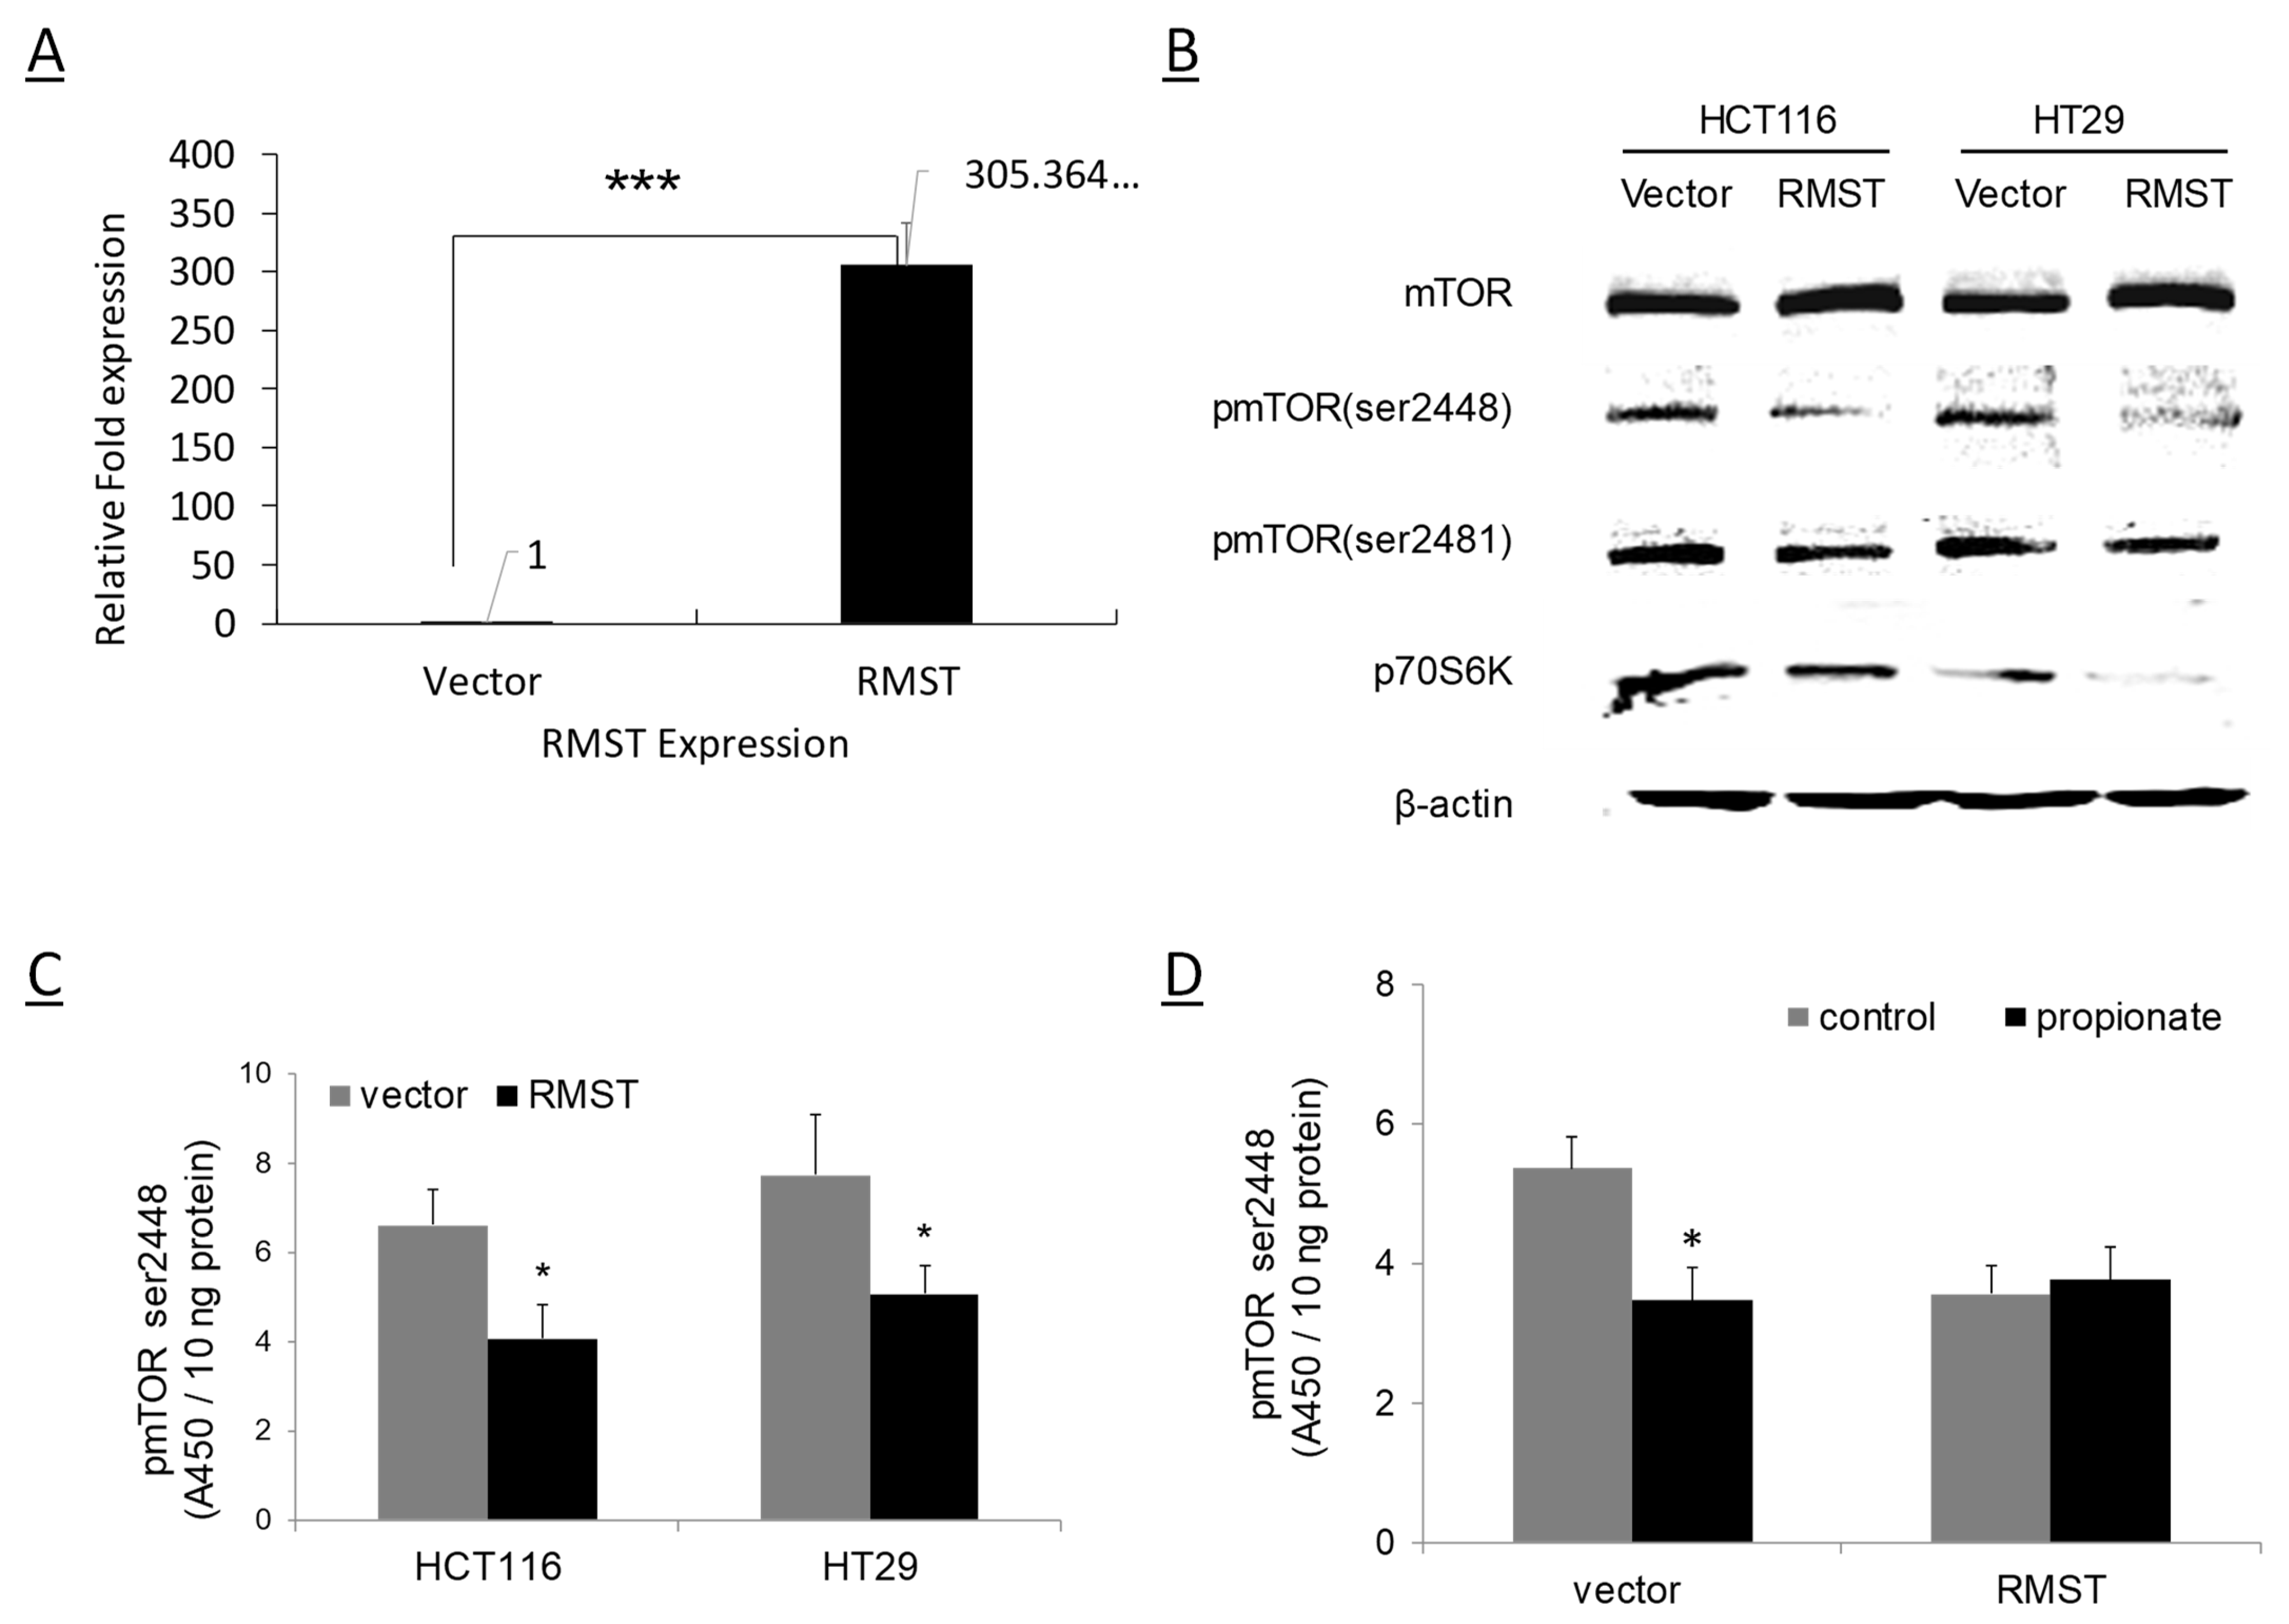
2.3. RMST Suppresses mTOR Activation

To further investigate the role of RMST in inhibition of mTOR signaling, we cloned the full-length RMST transcript into pBabe retroviral vector and increased RMST expression in colon cancer cells via viral transduction, as shown in HCT116 cells (Figure 3A). Increased expression of RMST led to the repression of mTOR activity in both HCT116 and HT29 cells, as evidenced by the decreased level of phosphorylated mTOR and p70S6K (Figure 3B). Quantitative ELISA of active mTOR confirmed that RMST overexpression reduced the activity of mTOR by 40% and 35% in HCT116 and HT29 cells, respectively (Figure 3C). We also determined whether SCFAs can further reduce mTOR activation in cells with pre-existing high expression of RMST. ELISA measurements revealed that the level of phosphor-mTOR in vector control cells was significantly reduced after propionate treatment. However, propionate did not further reduce the level of phosphor-mTOR in RMST-overexpressed cells (Figure 3D). The results confirm the ability of RMST to suppress mTOR signaling, and additional SCFA treatment does not further reduce mTOR activities in cells already with high RMST expression. The data also suggest that RMST, a downstream effector for SCFA, is sufficient by itself to reduce mTOR activities.

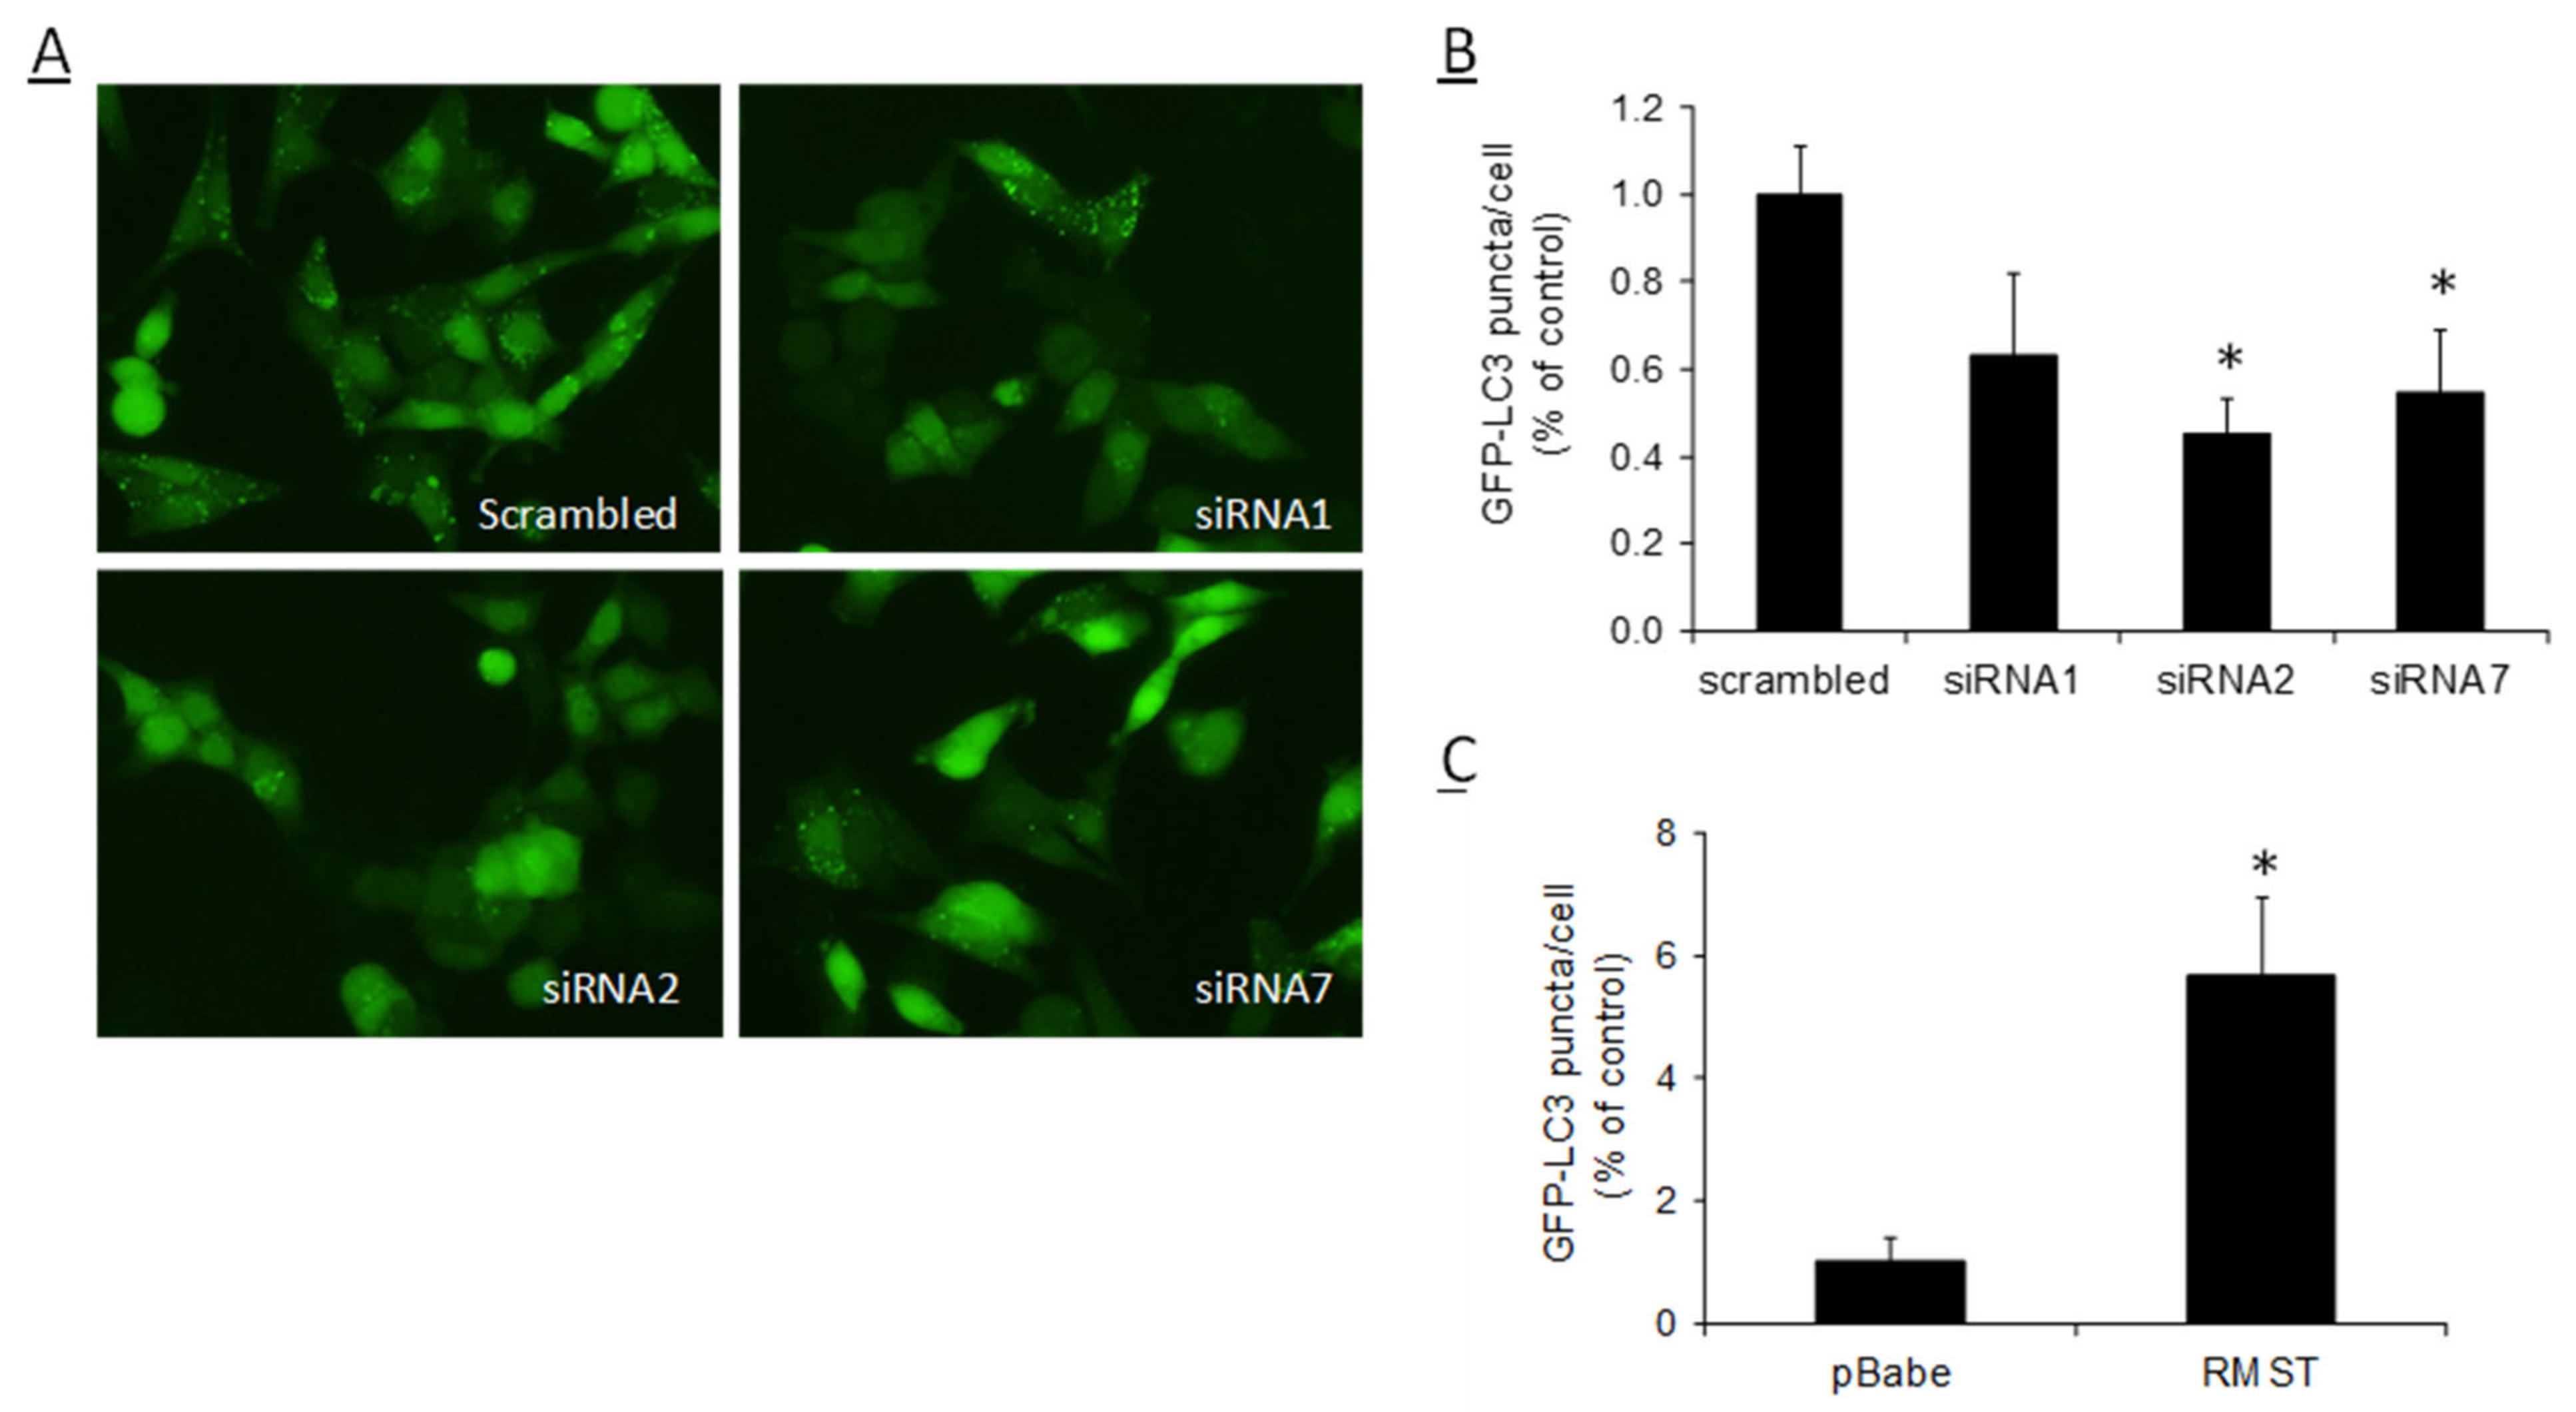
2.4. RMST Modulates SCFAs-Induced Autophagy

Given the critical role of RMST in SCFAs suppression of mTOR activation, we investigated whether RMST is required by SCFAs to induce autophagy. We established HCT116 cell line stably expressed autophagy marker GFP-LC3. In the untreated cells, GFP-LC3 exists in a form of GFP-LC3I and exhibits diffuse distribution within the cytoplasm. When autophagy is induced by SCFA, GFP-LC3I will be processed to GFP-LC3II and recruited to the autophagosome membrane, which can be visualized as cytoplasmic puncta under fluorescent microscopy.
The cells were subjected to siRNA transfection to knock down RMST, followed by propionate treatment. The autophagy was notably induced by propionate, as evidenced by a large number of LC3 puncta formed. Compared to the scramble control, the formation of autophagosomes in cells with RMST knockdown was significantly reduced (Figure 4A). The numbers of LC3 puncta in cells with RMST knockdown was about 65%, 45% and 58% of those in scramble siRNA controls (Figure 4B), suggesting that RMST is required for propionate to induce autophagy.
Since RMST knockdown led to attenuated autophagic response to propionate treatment, next we determined whether RMST, by itself, is sufficient to induce autophagy given its capacity of downregulating mTOR activity in colon cancer cells. We increased the expression of RMST in HCT116-GFP-LC3 cells by viral infection, however, there was no obvious LC3 puncta formation in cells with RMST expression or vehicle control. When acid-dependent degradation of autophagosome contents was blocked by chloroquine, there was marked formation of LC3 puncta, and the number was comparable between cells with RMST expression and vector control. After autophagy was triggered by propionate treatment, we noticed that cells with RMST-forced expression exhibited much stronger autophagic response. The number of LC3 puncta in RMST expression cells was about five-fold higher than that of vehicle control (Figure 4C). The data, collectively, suggest that although RMST by itself did not trigger autophagy in colon cancer cells, it could strengthen the autophagic responses initiated by SCFAs.

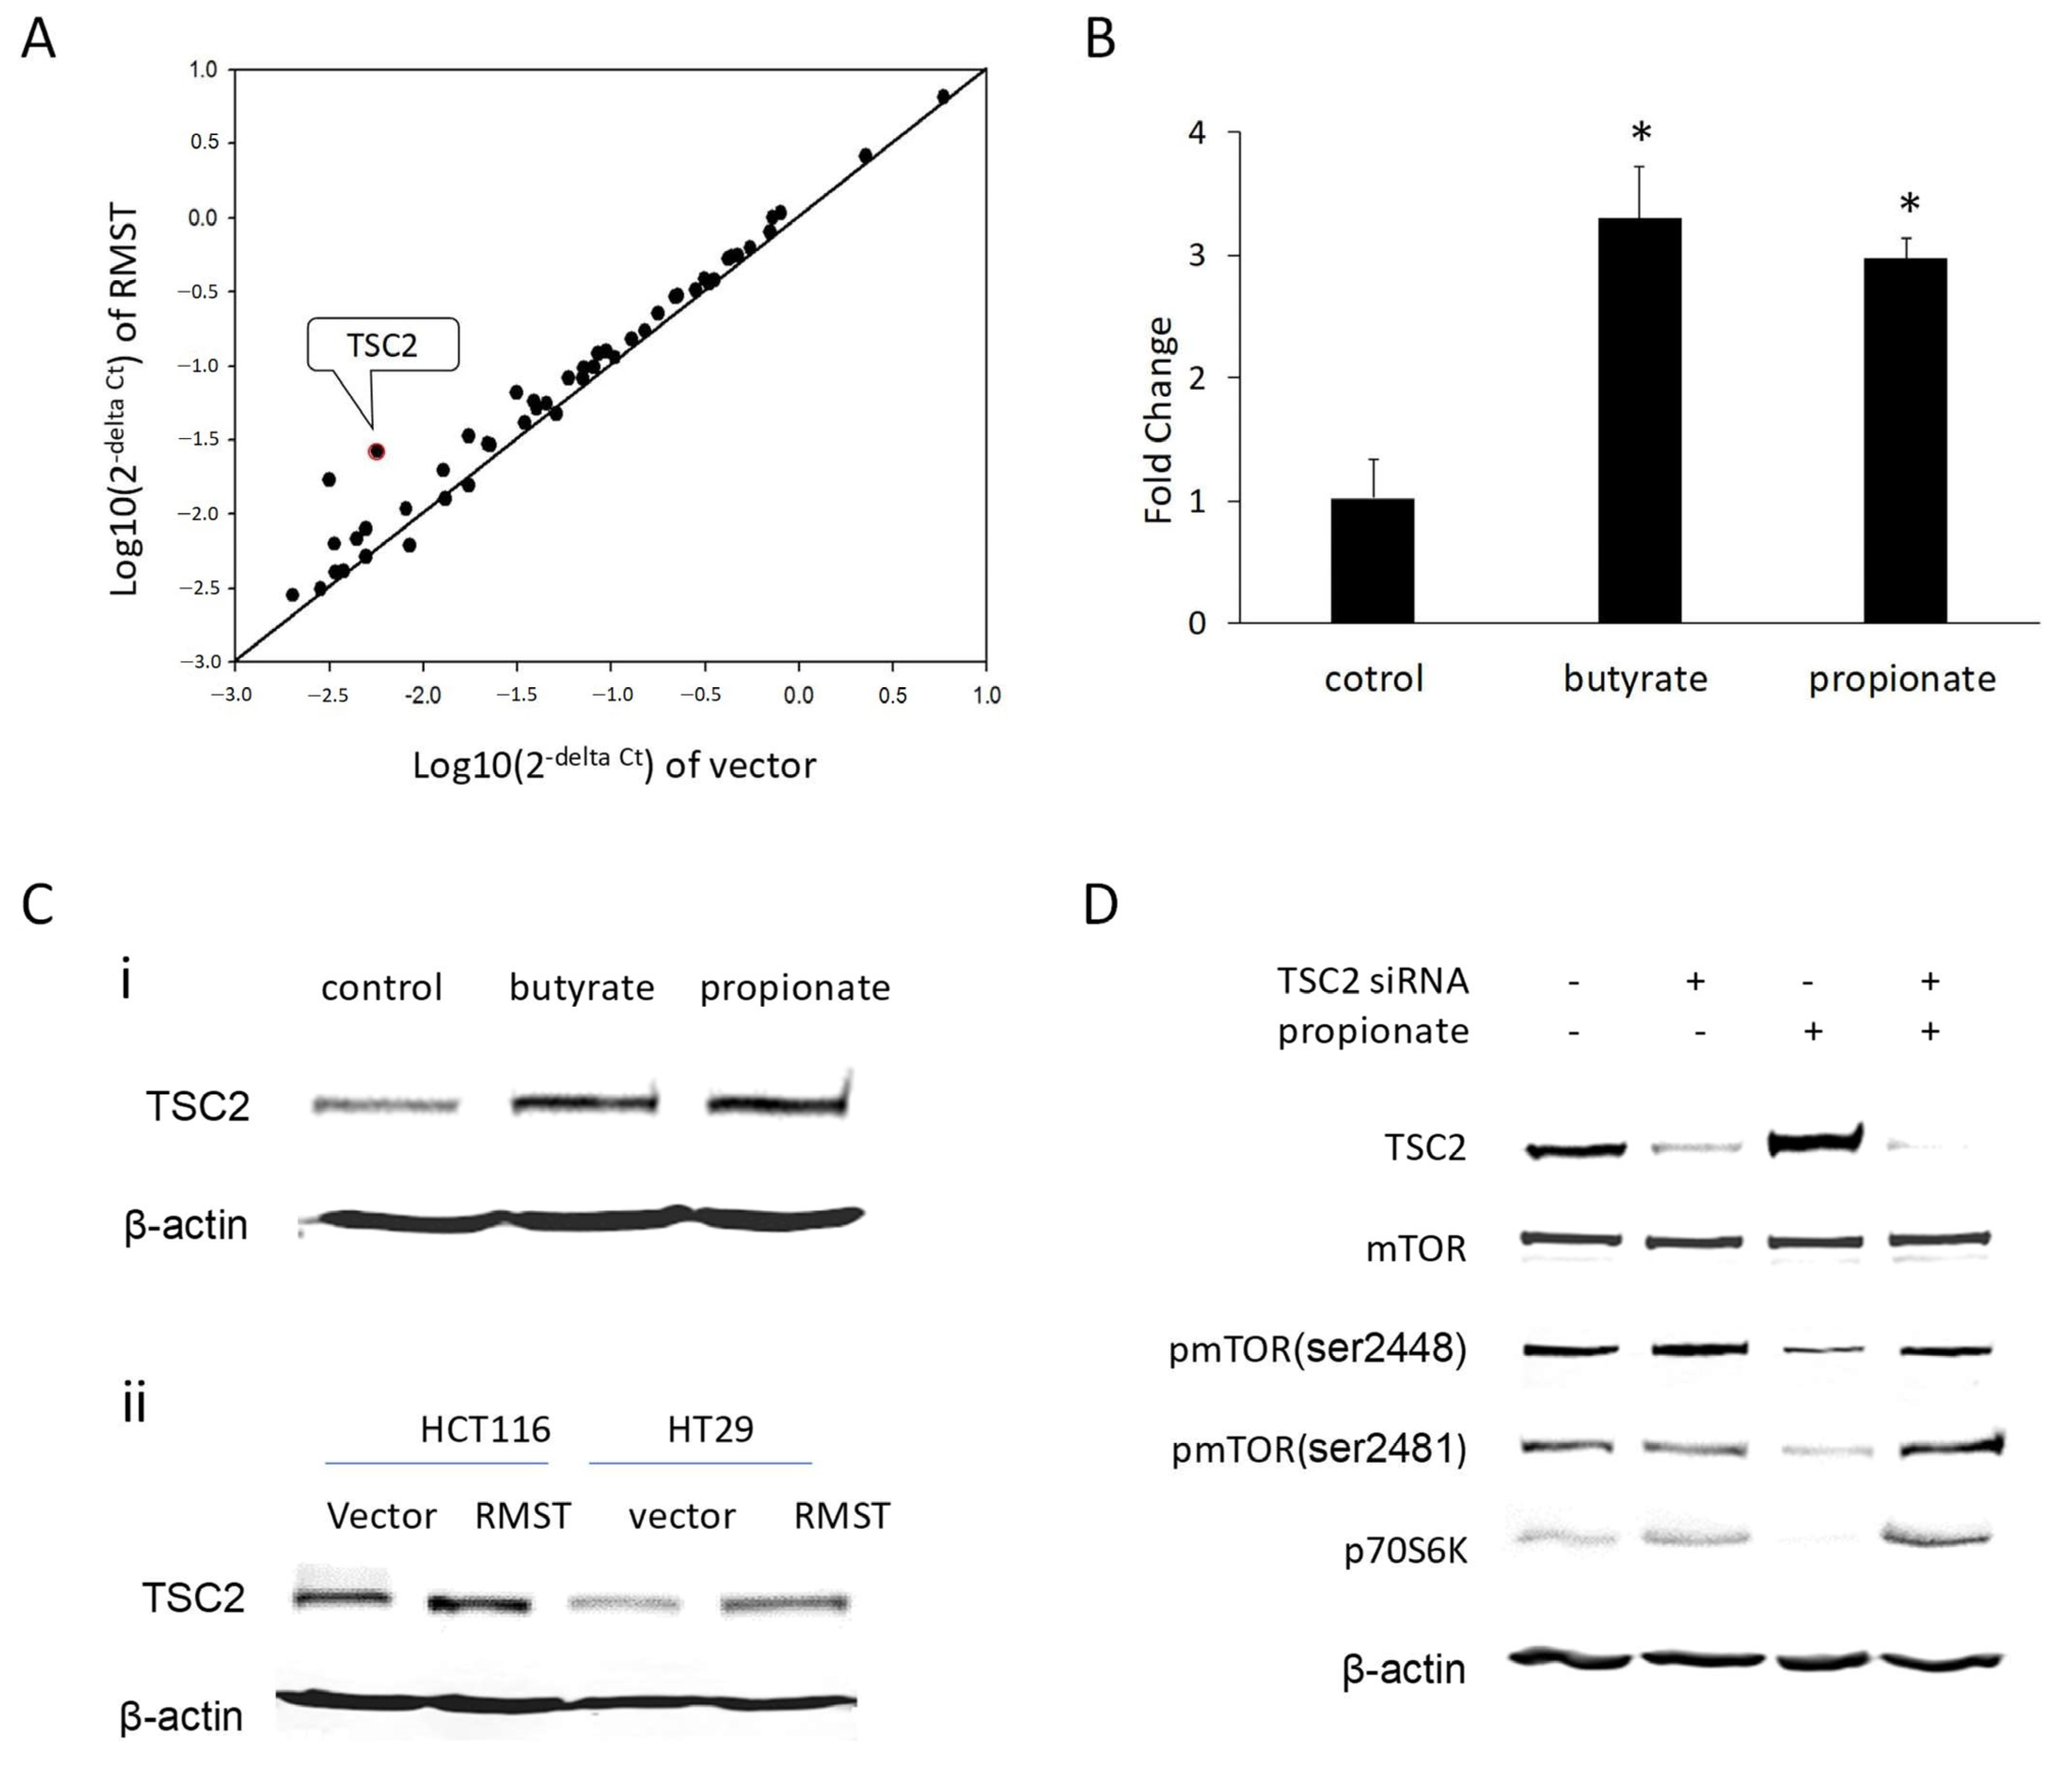
2.5. TSC2 Is Involved in the Suppression of mTOR Signaling by SCFA/RMST

To further understand the mechanism involved in SCFA/RMST suppression of mTOR signaling, we evaluated whether SCFA/RMST could alter the expression of genes involved in regulation of mTOR activities (Supplementary Table S2). Of 53 upstream mTOR regulators, tuberous sclerosis complex 2 (TSC2), one of most important factors involved in regulation of mTOR signaling, was identified to exhibit about a 4.66-fold increase at its mRNA level in HCT116 cells with RMST-forced expression (Figure 5A). Consistently, SCFA treatment in the HCT116 cell also led to a 5–6-fold increase in the levels of TSC2 mRNA (Figure 5B). Western blot analysis revealed that the protein level of TSC2 in HCT116 was significantly increased in HCT116 cells after SCFA treatment or RMST overexpression (Figure 5C).
Tumor suppressor gene TSC2 is a GTPase-activating protein (GAP) of Rheb, a Ras family GTPase that stimulates the phosphorylation of mTOR and plays an essential role in regulation of mTOR signal pathway [24]. To determine whether TSC2 is responsible for SCFA inhibition of mTOR signaling, we knocked down TSC2 in HCT116 cells with siRNA and then determined the subsequent responses toward SCFA treatment. As shown in Figure 5D, siRNA transfection significantly reduced the expression of TSC2, and SCFA could no longer increase the level of TSC2 in cells with siRNA transfection. Although the levels of total mTOR were not changed by TSC2 knockdown, the level of phosphorylated mTOR at serine2448 was increased. Consistently, the phosphorylated p70S6K displayed higher level in cells with siRNA transfection, indicating the ability of TSC2 to negatively regulate the activity of the mTOR signal pathway.
After TSC2 knockdown, the cells were subjected to propionate treatment. Phosphorylated mTOR and p70S6K were significantly reduced by propionate in the cells with scramble transfection, accompanied by increased TSC2. However, propionate did not reduce the level of mTOR, phosphorylated mTOR and p70S6K in cells with TSC2 knocked down (Figure 5D), suggesting that TSC2 knockdown prevents SCFA from suppressing mTOR activation. The data suggest an important role of TSC2 for SCFA to suppress mTOR activation.

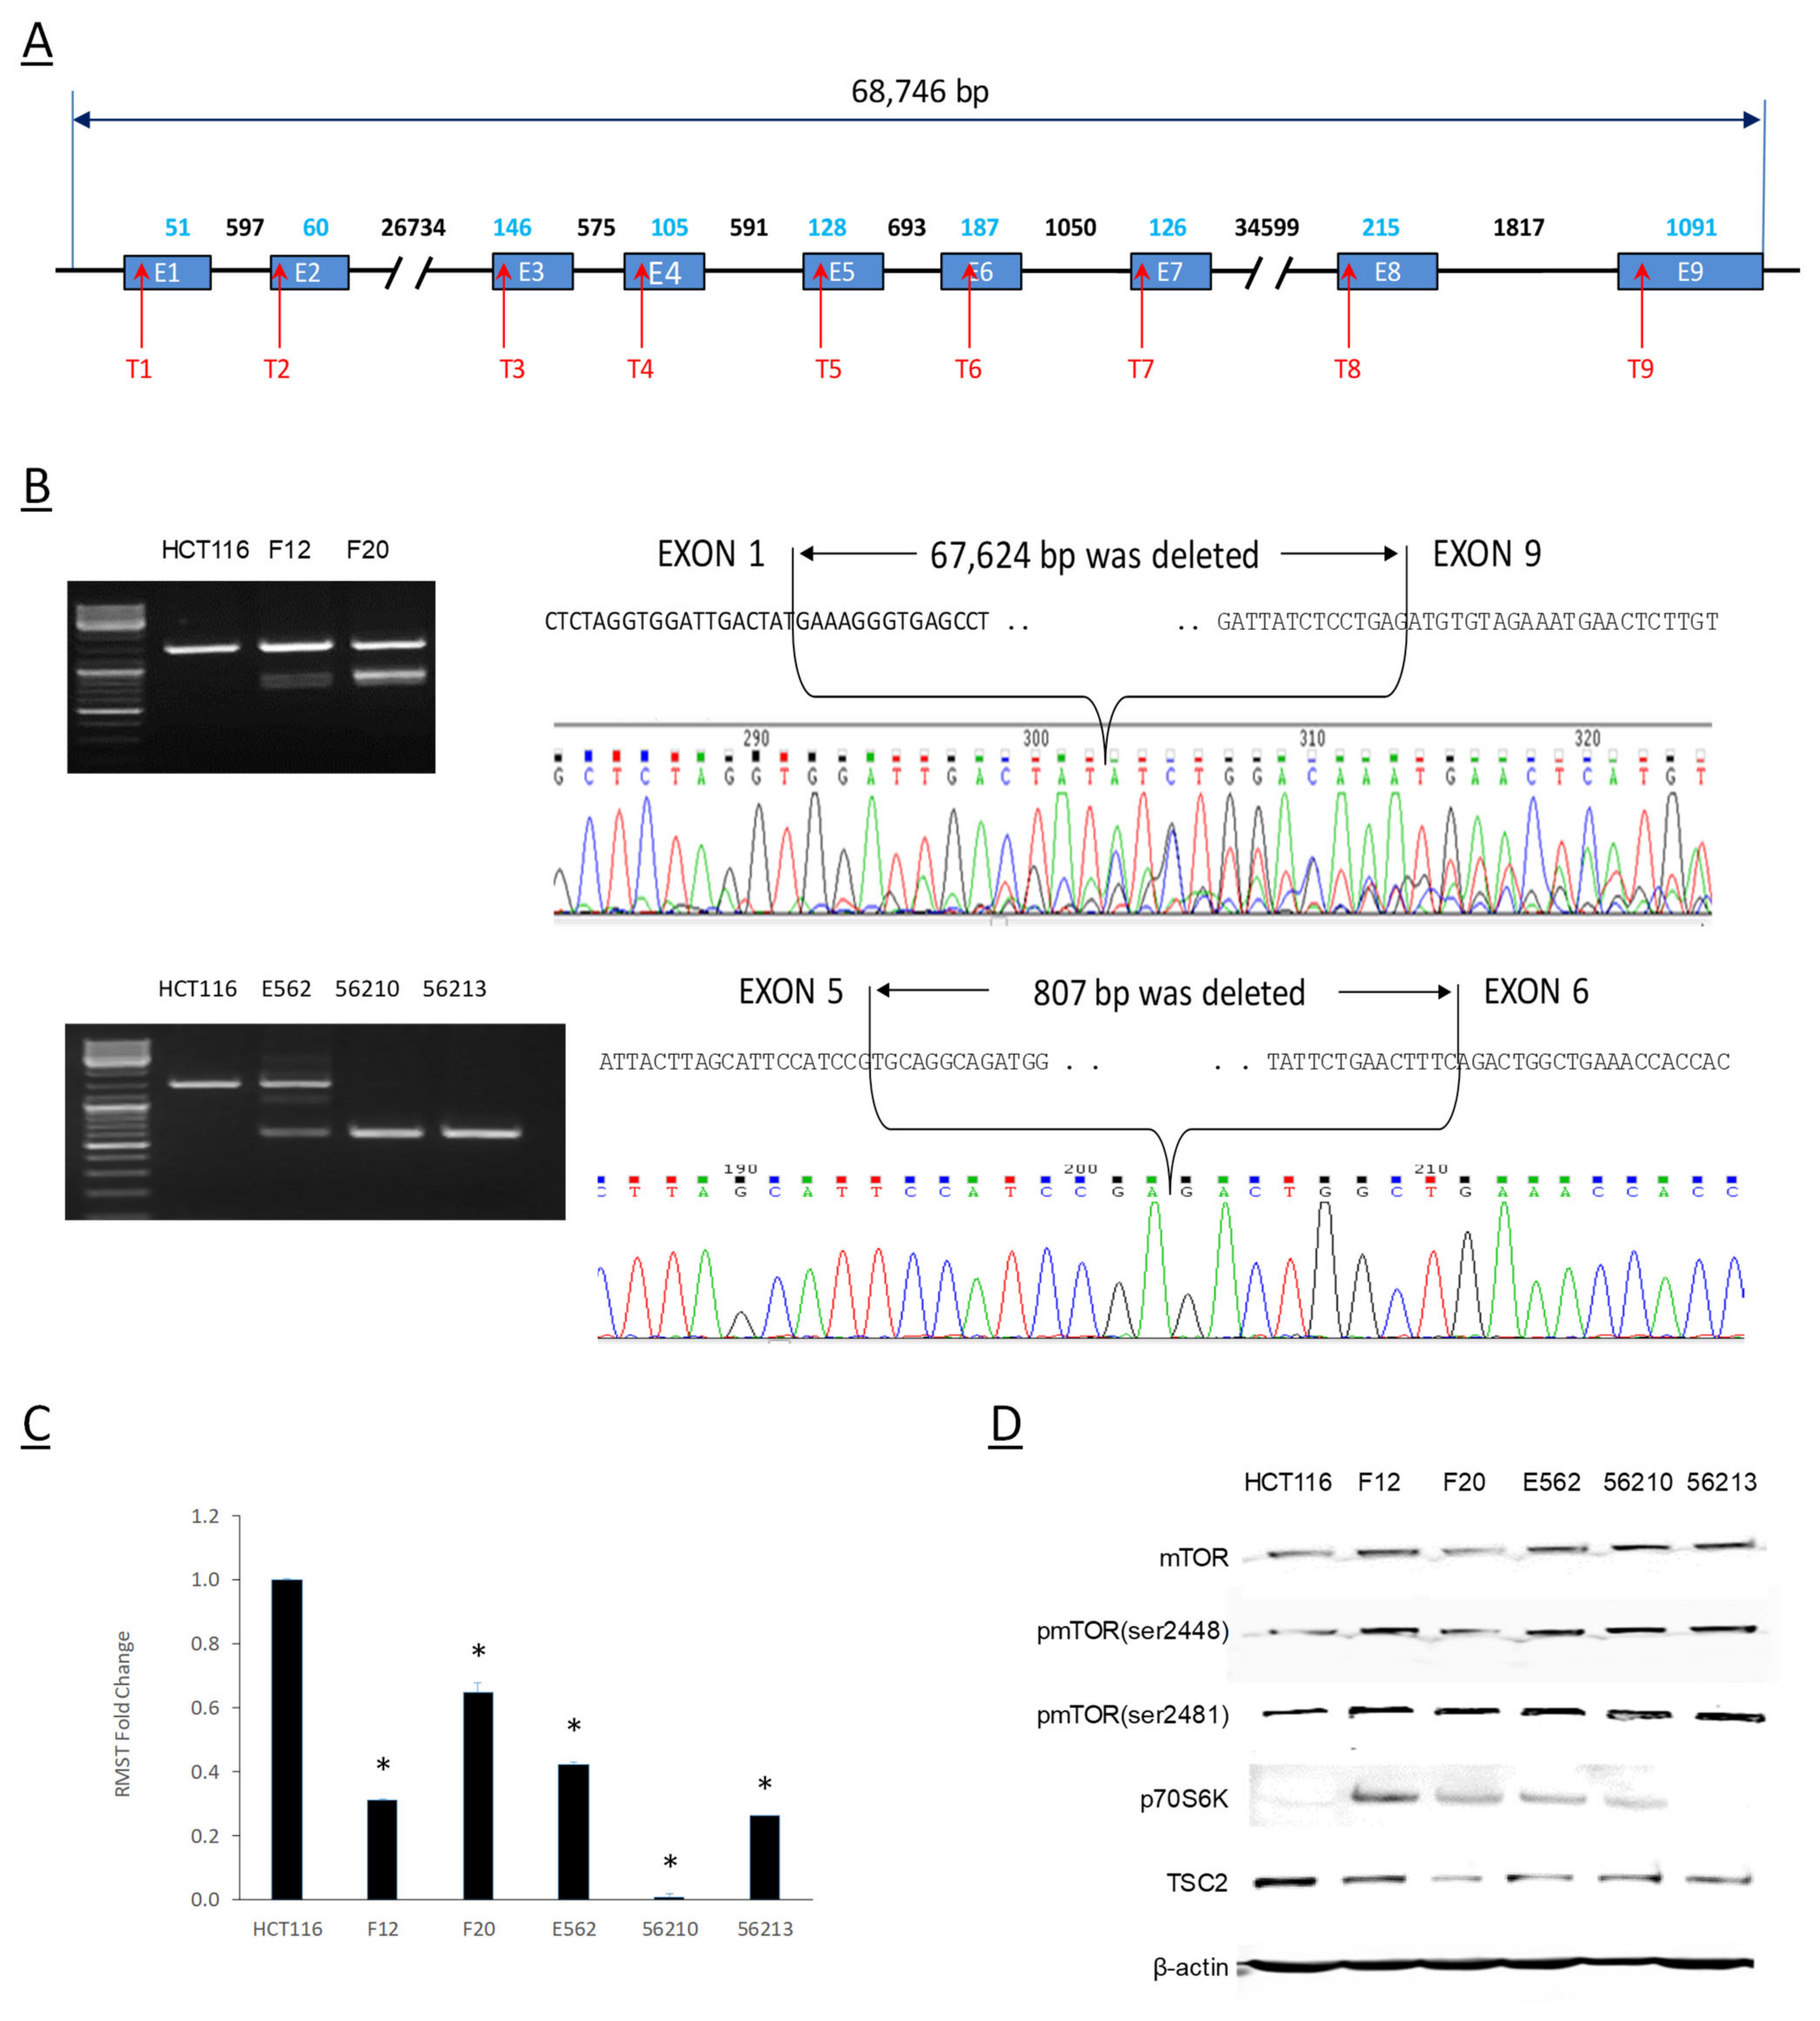
2.6. Genomic Editing of RMST Gene Affects mTOR Activities and TSC2 Expression
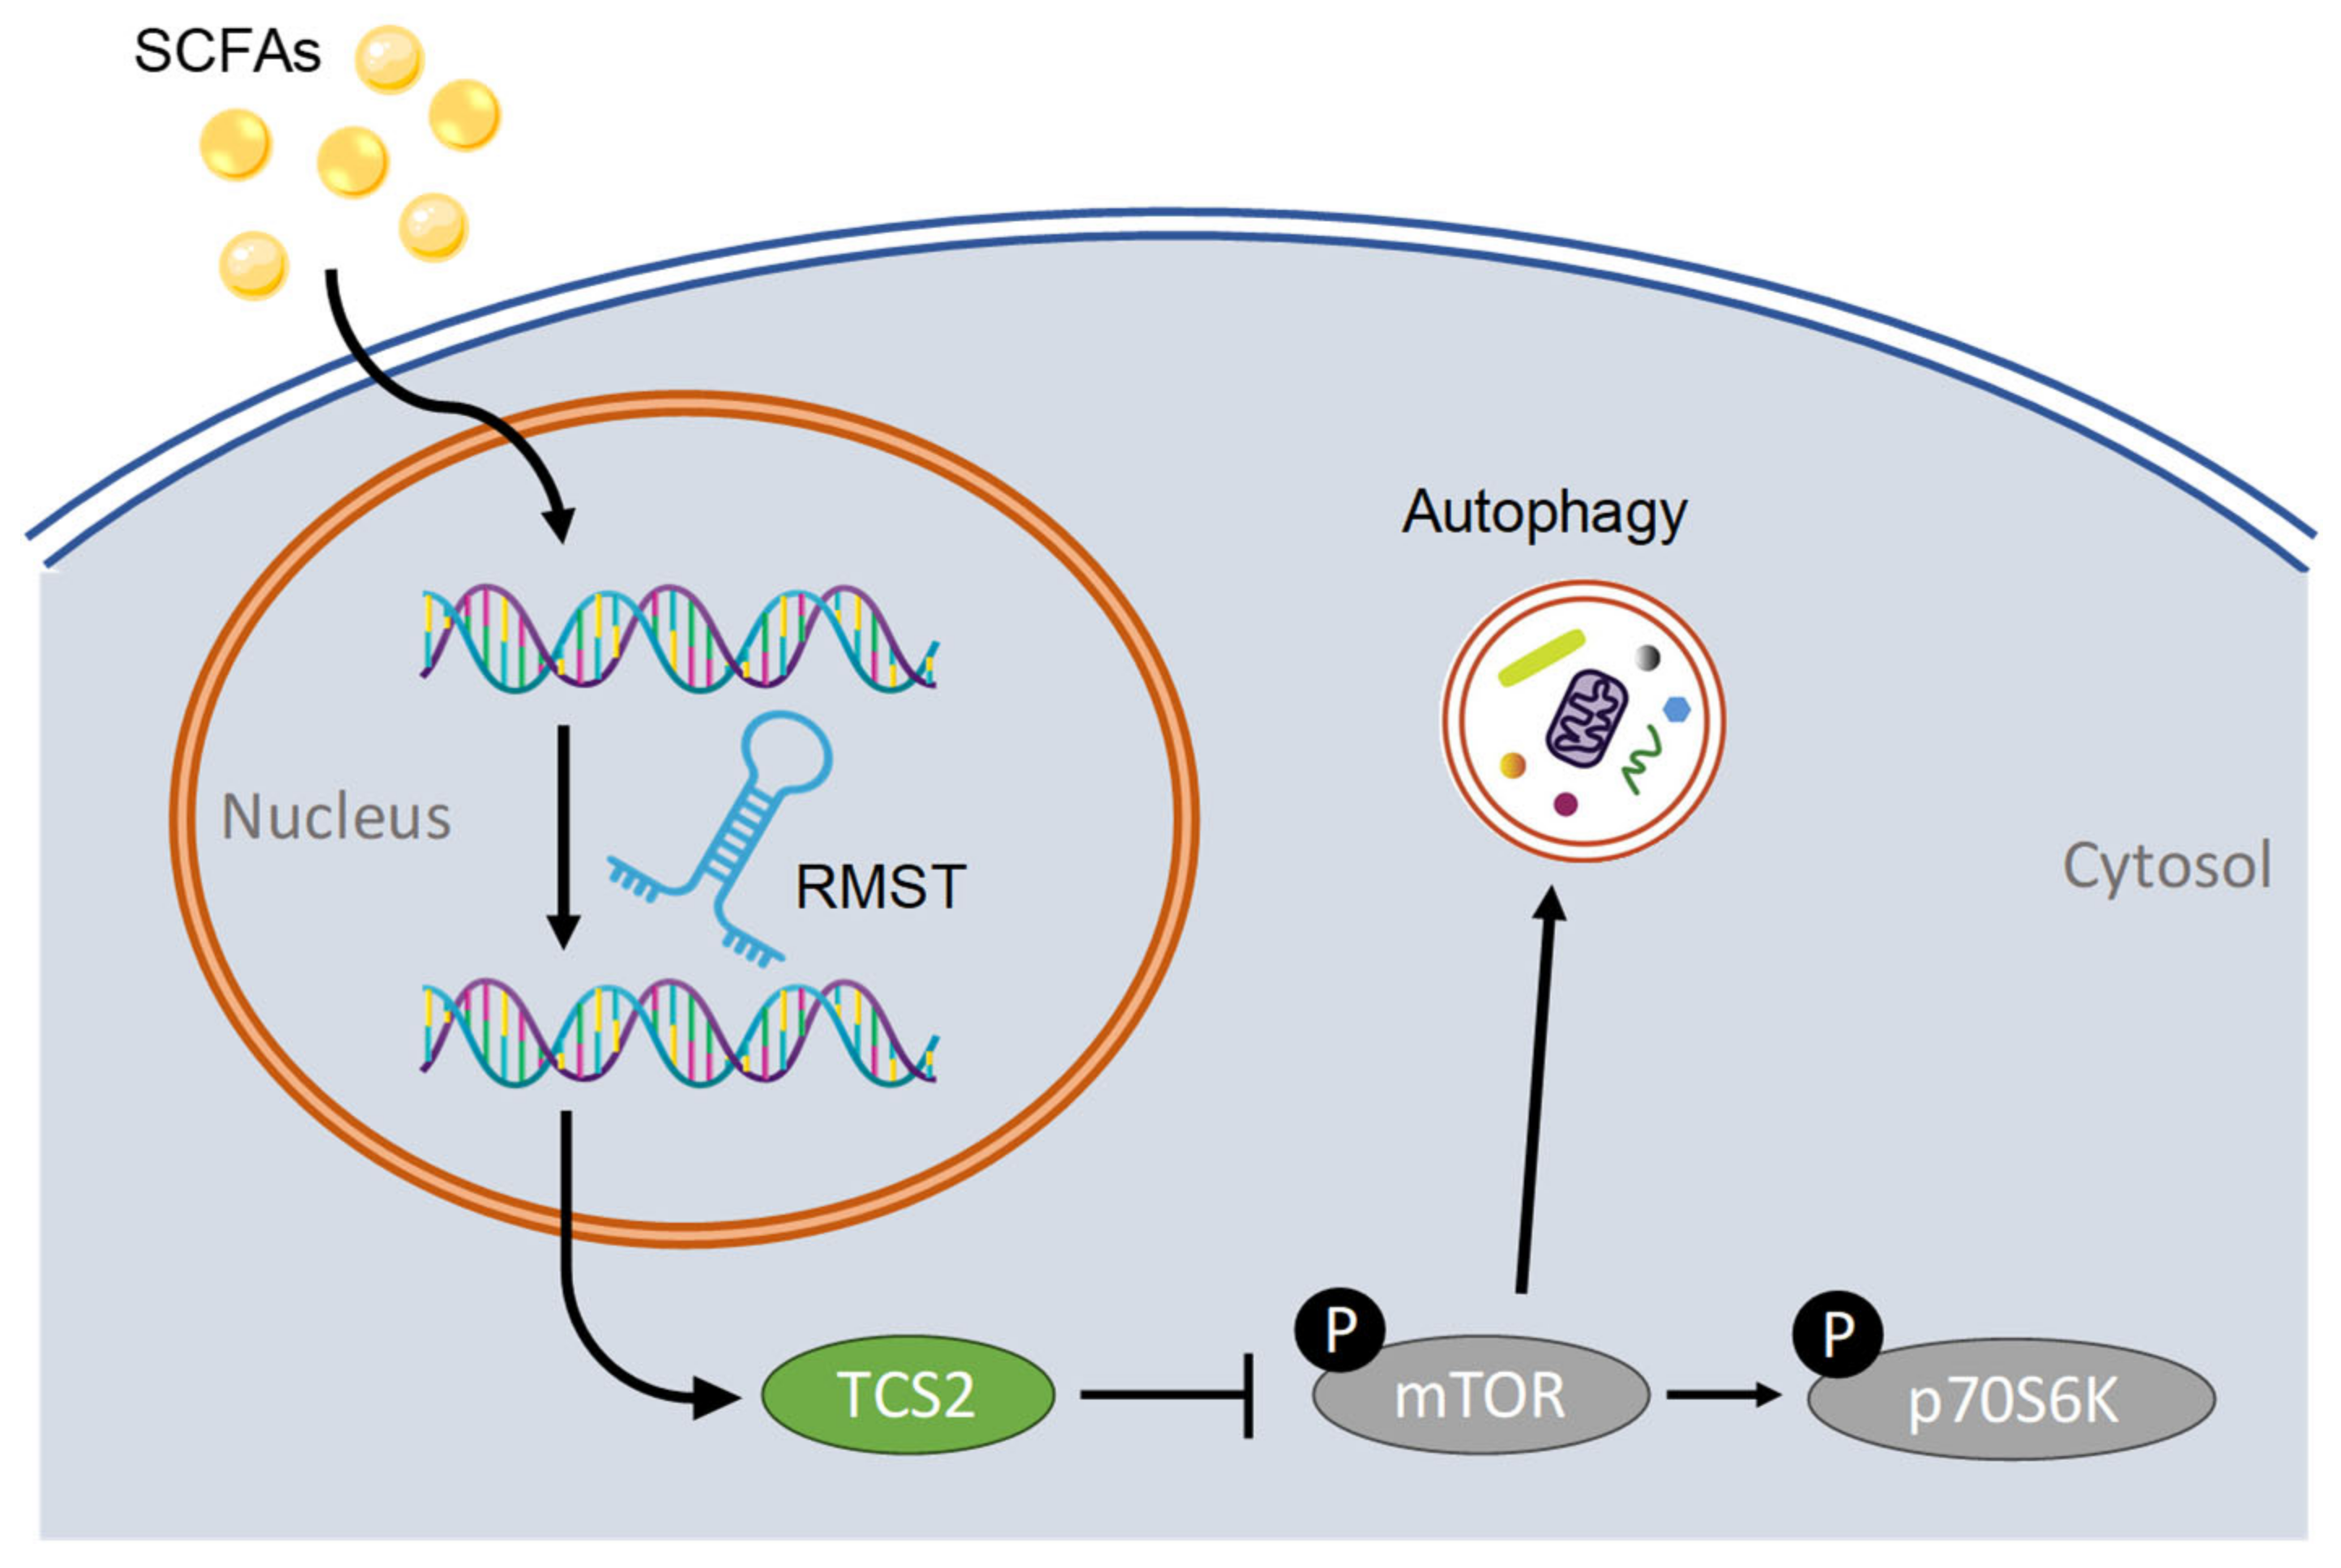
To further confirm the ability of RMST to modulate mTOR signaling, we generated cell lines with RMST genes edited using a clustered regularly interspaced short palindromic repeats (CRISPR)/CRISPR-associated protein-9 nuclease (CAS9) system. With the help of guide RNA (gRNA), endonuclease CAS9 is recruited to the target genomic locus and cut DNA strands. The resultant double-stranded breaks (DSBs) can be repaired by homology directed repair (HDR) or non-homologous end joining (NHEJ), generating deletions/inserts at the DSB site [25]. Specific CRISPR/CAS9 constructs targeted to individual RMST exons were designed, and pairs of constructs targeting two exons were delivered to the HCT116 cell by transient transfection (Figure 6A). Several clones derived with RMST fragments deletion were verified by genotyping PCR and sequencing (Figure 6B). F12 and F20 were heterozygous deletion of the segment from exon 1 to exon 9, with about 66,624 base pairs edited out (Figure 6B, top panel). E562 was the heterozygous, while 56210 and 56213 were the homozygous of deletion from exon 5 to exon 6 with 807 base pairs (Figure 6B, bottom panel). The mRNA level of RMST was significantly reduced in all deletion cell lines generated (Figure 6C).
The levels of active mTOR in HCT116 with genomic deletion of RMST segments were then determined with Western blot. As shown in Figure 6D, the total mTOR levels in all of RMST deletion cells were comparable to that of parental wildtype HCT116. However, the levels of phosphorylated mTOR in F12, F20 and E56, 56210 and 56213 were significantly increased when compared with the parental wildtype HCT116 cells. Also, phosphorylated p70S6K was significantly increased in cells with RMST deletion (Figure 6D), suggesting that genomic deletion of RMST segments enhanced mTOR activity. Furthermore, RMST deleted cells exhibited significantly low levels of TSC2 when compared with wildtype HCT116 (Figure 6D), indicating that genomic deletion of RMST segments by the CRISPR/CAS9 system could modulate the activities of mTOR signaling through reducing the expression of TSC2 in colon cancer cells.

3. Discussion

SCFAs have been shown to induce differentiation, cell cycle arrest, apoptosis, autophagy and necrosis in colorectal cancer cells. Inhibition of histone deacetylases (HDAC) by SCFAs is often attributed as the mechanism involved [26]. We previously reported that GPR43, the receptor for SCFAs, could be involved in SCFA suppression of colon cancer [27]. However, the precise molecular mechanism underlying the anti-cancer activities of SCFAs remains to be defined. Non-coding RNAs, such as small microRNA and lncRNA, play important roles in the development of colorectal cancer and could be used as potential biomarkers for colon cancer diagnosis and prognosis as well as in the prediction of the response to therapy [28]. Emerging evidence demonstrated the ability of SCFA to disturb the expression of microRNA in colon cancer to elicit or mediate the biological effects of SCFA towards colon cancer [29,30]. In the present study, we found that SCFAs have a significant impact on the expression of lncRNA in colon cancer cells. Among 83 disease-related lncRNAs tested in our study, six of them were strongly altered in their expression (by more than 5 times) by propionate treatment (Supplementary Table S1). Considering the pathological role of these lncRNAs in cancer biology, we expect that these lncRNAs can be potentially involved in the biological activities of SCFAs.
In the present study, we conclusively demonstrated that lncRNA RMST expression was stimulated by SCFAs and that RMST was required for SCFAs to suppress mTOR signaling and to induce autophagy. RMST increased the expression of TSC2, leading to the suppression of the mTOR signaling pathway. When RMST was knocked down, SCFAs were no longer able to suppress mTOR signaling. Forced expression of RMST in colon cancer cells suppressed mTOR signaling with a similar mechanism to SCFAs. Taken together, the data suggest an important role for RMST in SCFA modulation of mTOR signaling.
Recently, several cancer-related lncRNAs like MALAT1, UCA1, and MEG3 have been reported to be involved in the regulation of mTOR signaling [31,32,33]. Our studies demonstrate that RMST is another important lncRNA that can regulate mTOR signaling. The suppression of mTOR activity by SCFA could be compromised by the depletion of RMST with siRNA, and forced expression of RMST was sufficient to inhibit mTOR activity. Consistently, the genomic deletion of RMST by CRISPR/CAS9 gene editing led to a significant increase in mTOR activity in colon cancer cells. The data collectively demonstrate a critical role of RMST in SCFA-mediated inhibition of mTOR signaling.
We further demonstrated in our study that RMST modified mTOR activity through increasing the level of TSC2 in colon cancer cells. TSC2 forms heterodimer with TSC1 and servers as critical negative regulator of mTOR signaling. In TSC1/TSC2 complex, TSC2 exhibits a selective GAP activity toward RheB, the small GTPase, which is a positive regulator of the mTOR pathway [24,34]. Therefore, it is likely that RMST can decrease the activities of RheB and mTOR because of the significantly increased TSC2 protein level.
Autophagy is a self-degradative process important for maintaining cellular homeostasis by eliminating superfluous or damaged proteins and organelles as well as providing substrates for energy generation and biosynthesis. Autophagy could be activated by various stresses or stimuli such as starvation, oxidative stress and endoplasmic reticulum stresses. SCFA-triggered autophagy was dependent on downregulation of mTOR activity [9,35,36]. Consistent with its capability to suppress the activity of mTOR signaling, RMST was identified as a key mediator responsible for SCFA-triggered autophagy in the present study. Downregulation of RMST reduced the formation of LC3 puncta, while RMST overexpression resulted in more intense autophagic response to SCFAs. Given the critical role of RMST in SCFA-mediated autophagy, RMST may protect colon cancer cells from apoptosis, especially during metabolic stresses. Further studies are needed to determine the precise roles of RMST in colon cancers.
So far, most well-characterized lncRNAs are engaged in epigenetic regulation of gene expression. LncRNAs may serve as a signal for transcription, a decoy to titrate transcription factors away from chromatin, a guide for recruitment of chromatin-modifying enzymes to target genes and as a scaffold to bring together multiple proteins to form ribonucleoprotein complexes [37]. RMST is a nuclear-localized lncRNA and has been reported to interact with nuclear factors like SOX2 or chromatin to regulate gene expression [22,38]. Here, we demonstrate a new role of RMST in regulating gene expression of TSC2 transcripts in colon cancer cells, and this function could be one underlying mechanism for RMST to augment TSC2 expression and suppress mTOR signaling.
In summary, we have identified lncRNA RMST as a novel regulator of mTOR signaling via elevating TSC2 levels. As shown in Figure 7, elevated RMST and TSC2 levels are required for SCFAs to suppress mTOR signaling and trigger autophagy in colon cancer cells. Our data present a novel pathway by SCFAs to regulate mTOR signaling and provide a new perspective on the potential antitumor effects of SCFAs in colon cancers.

4. Materials and Methods

4.1. Constructs and Gene Cloning

Exons of RMST were amplified from human genomic DNA and subcloned into pBabe retroviral vector at BamHI/EcoRI cloning sites. The individual exons were ligated into a full-length RMST transcript with the cold fusion cloning kit (System Bioscience, Palo Alto, CA, USA) and sequenced for verification. For RMST genomic deletion, we designed CRISPR/CAS9 to target every exon of the RMST gene. Two oligonucleotides (Table 1) for each target were commercially synthesized from IDT Inc. After annealing, the oligonucleotides were cloned into the GeneArt®CRISPR nuclease vector (Life Technologies, Carlsbad, CA, USA, cat# A21178). The inserted sequences were confirmed by sequencing.

4.2. Cell Culture and Stable Transfection

HCT116, HT29, SW620, NCM356 and NCM460 cells were grown in RPMI-1640 medium with 10% FBS and 1% antibiotics in a humidified incubator under an atmosphere containing 5% CO2 at 37 °C; 293T and Phoenix Ampho cells were grown in DMEM medium with 10% FBS and 1% antibiotics. In order to generate retrovirus, 1 × 10⁷ Phoenix Ampho cells were transfected with the viral constructs (pBabe-RMST) using DNAfection liposome transfection reagent. Viral supernatants were harvested 72 h after transfection, diluted 1:1 with fresh medium in the presence of polybrene (4 μg/mL) and added to HCT116 or HT29 cells seeded in 6-well plates at 30% confluence. Twenty-four hours after incubation, the viral supernatant was replaced with fresh media. Positively infected cells were selected with puromycin for 1 week.
For observation of autophagy, HCT116 cells with GFP-LC3II markers were seeded into six-well plates containing cover glass and subjected to different treatments including propionate. The GFP-LC3 cellular localizations and formation of puncta were observed under a BX41 system fluorescent microscope (Olympus, Tokyo, Japan). The number of puncta formed were quantified in a double-blind approach.

4.3. siRNA Transfections

For the siRNA approach to knock down RMST, three duplex siRNAs were designed and synthesized by IDT. The sequences of these duplexes were shown in Table 2. The siRNAs to knock down TSC2 were purchased from Cell Signaling. The transfection of siRNA was performed using Silencer siRNA Transfection II Kit (Ambion, ThermoFisher Scientific, Waltham, MA, USA) according to the manufacturer’s protocol. The negative control siRNA provided by transfection kit is a scrambled sequence that has no significant homology to human genes.

4.4. RNA Isolation and Real-Time RT-PCR

Total RNAs were isolated from cultured cells using the PerfectPure RNA Purification System (5 prime) and directe-zol RNA miniprep (Zymo Reseach, Irvine, CA, USA), respectively. RNA quantity and quality were determined by the 260:280 nm absorbance ratios using a BioSpec-mini DNA/RNA/protein analyzer (Shimadzu Corporation, Kyoto, Japan). Reverse transcription was performed with random hexanucleotide primers and ProtoScript M-MuLVTaq RT-PCR kit (New England Biolab, Ipswich, MA, USA). Resulting cDNA were quantified by real-time PCR using Applied Biosystems 7500 real-time PCR system (Applied Biosystems, Waltham, MA, USA), according to the manufacture’s instruction. Primer sequences are listed in Supplementary Tables S1 and S2. The relative expression was calculated using the ΔΔCt method and normalized to human β-actin expression.

4.5. RMST Genomic Deletion with CRISPR/CAS9 System

HCT116 cells were cultured in RPMI-1640 medium with 10% FBS and 1% penicillin/streptomycin. To delete the target DNA sequence, cells were plated in 6-well plate and transiently transfected with 1 µg GeneArt®CRISPR nuclease vector with DNAfection liposome transfection reagent; 48 h after transfection, cells were subjected to fluorescence-activated cell sorting. The successfully transfected cells with OFP positivity were seeded individually in 96-well plate and incubated under standard culture conditions for 3 to 4 weeks. The single cell colony generated was then expanded. Genomic DNA of each single cell colony was extracted using ArchivePure DNA cell/tissue kit (5 Prime) following the manufacture’s protocol. Specific primers (Table 3) were used for genotyping via PCR analysis. PCR products were run on 1.0% agar gel, and the target bands were verified by DNA sequencing.

4.6. Western Blot

Cells were lysed with 2 × SDS-PAGE electrophoresis sample buffer. The lysate was boiled, sonicated and centrifuged. Supernatants were subjected to separation by 10% SDS-PGAGE gel electrophoresis and transferred to a polyvinylidenedifluoride (PVDF) membrane. The membrane was blocked for 1 h and then incubated with the primary antibody overnight at 4 °C. After washing with TBS-T 3 times on the shaker for 15 min each time, membranes were incubated with a fluorescently labeled secondary antibody for 1 h and washed another 3 times. The immunoblots were visualized by an Odyssey infrared imaging system (LI-COR Biosciences, Lincoln, NE, USA).

4.7. ELISA for mTOR pser2448

The quantitative measurement of phosphor-mTOR levels in culture cells was performed using mTOR (pSer2448) ELISA Kit (Cell Signaling Technologies, Danvers, MA, USA) following the manufacturer’s instructions. Cells were directly lysed by supplemented extraction buffer. After centrifuging at 18,000× g for 20 min at 4 °C, 50 µL aliquot of each sample was added to the well of an mTOR microplate and incubated at room temperature for 2 h. The wells were washed 3 times and incubated with mTOR pSer2448 primary detector antibody, followed by incubation with 1 × HRP labeled secondary detector antibody. Each well was aspirated, washed and incubated with TMB development solution for 30 min. The stop solution was added, and the absorbance at 450 nm was recorded. All experiments were performed on at least two separate occasions.

4.8. Statistics

A two-tailed Student’s t-test was used to analyze differences between two experimental groups. All the results were expressed as mean ± SEM. p-values of less than 0.05 were considered to be significant.

Supplementary Materials

The following supporting information can be downloaded at: https://www.mdpi.com/article/10.3390/kinasesphosphatases2020008/s1. Table S1: The effects of propionate on the expression of 83 lncRNAs array in HCT116 cell. Table S2: Sequence of real-time PCR primers for mTOR regulator, and the effects of increased RMST expression on the expression levels of mTOR regulators.

Author Contributions

Conceptualization, J.W. and D.N; methodology, J.W. and Y.G; validation, J.W., X.F. and Y.Z.; formal analysis, J.W., Y.G and D.N.; investigation, J.W. and Y.G.; data curation, J.W. and Y.G.; writing—original draft preparation, J.W.; writing—review and editing, D.N.; visualization, J.W., X.F. and Y.Z.; supervision, D.N.; project administration, D.N.; funding acquisition, D.N. All authors have read and agreed to the published version of the manuscript.

Funding

Internal funding from Southern Illinois University Simmons Cancer Institute (D.N.).

Institutional Review Board Statement

Not applicable.

Informed Consent Statement

Not applicable since the study did not involve humans.

Data Availability Statement

Data will be made available per request after being published.

Acknowledgments

We acknowledge Yin-Yuan Mo’s suggestions to profile lncRNAs in colon cancer cells after SCFA treatment.

Conflicts of Interest

The authors declare no conflicts of interest. The funders had no role in the design of the study; in the collection, analyses, or interpretation of data; in the writing of the manuscript; or in the decision to publish the results.

References

  1. Topping, D.L.; Clifton, P.M. Short-chain fatty acids and human colonic function: Roles of resistant starch and nonstarch polysaccharides. Physiol. Rev. 2001, 81, 1031–1064. [Google Scholar] [CrossRef]
  2. Hamer, H.M.; Jonkers, D.; Venema, K.; Vanhoutvin, S.; Troost, F.J.; Brummer, R.J. Review article: The role of butyrate on colonic function. Aliment. Pharmacol. Ther. 2008, 27, 104–119. [Google Scholar] [CrossRef] [PubMed]
  3. Wong, J.M.; de Souza, R.; Kendall, C.W.; Emam, A.; Jenkins, D.J. Colonic health: Fermentation and short chain fatty acids. J. Clin. Gastroenterol. 2006, 40, 235–243. [Google Scholar] [CrossRef] [PubMed]
  4. Smith, P.M.; Howitt, M.R.; Panikov, N.; Michaud, M.; Gallini, C.A.; Bohlooly, Y.M.; Glickman, J.N.; Garrett, W.S. The microbial metabolites, short-chain fatty acids, regulate colonic Treg cell homeostasis. Science 2013, 341, 569–573. [Google Scholar] [CrossRef]
  5. Fung, K.Y.; Brierley, G.V.; Henderson, S.; Hoffmann, P.; McColl, S.R.; Lockett, T.; Head, R.; Cosgrove, L. Butyrate-induced apoptosis in HCT116 colorectal cancer cells includes induction of a cell stress response. J. Proteome Res. 2011, 10, 1860–1869. [Google Scholar] [CrossRef]
  6. Clarke, J.M.; Young, G.P.; Topping, D.L.; Bird, A.R.; Cobiac, L.; Scherer, B.L.; Winkler, J.G.; Lockett, T.J. Butyrate delivered by butyrylated starch increases distal colonic epithelial apoptosis in carcinogen-treated rats. Carcinogenesis 2012, 33, 197–202. [Google Scholar] [CrossRef]
  7. Krishnan, M.; Singh, A.B.; Smith, J.J.; Sharma, A.; Chen, X.; Eschrich, S.; Yeatman, T.J.; Beauchamp, R.D.; Dhawan, P. HDAC inhibitors regulate claudin-1 expression in colon cancer cells through modulation of mRNA stability. Oncogene 2010, 29, 305–312. [Google Scholar] [CrossRef] [PubMed]
  8. Tang, Y.; Chen, Y.; Jiang, H.; Nie, D. The role of short-chain fatty acids in orchestrating two types of programmed cell death in colon cancer. Autophagy 2011, 7, 235–237. [Google Scholar] [CrossRef]
  9. Tang, Y.; Chen, Y.; Jiang, H.; Nie, D. Short-chain fatty acids induced autophagy serves as an adaptive strategy for retarding mitochondria-mediated apoptotic cell death. Cell Death Differ. 2011, 18, 602–618. [Google Scholar] [CrossRef]
  10. Hara, K.; Maruki, Y.; Long, X.; Yoshino, K.; Oshiro, N.; Hidayat, S.; Tokunaga, C.; Avruch, J.; Yonezawa, K. Raptor, a binding partner of target of rapamycin (TOR), mediates TOR action. Cell 2002, 110, 177–189. [Google Scholar] [CrossRef]
  11. Sarbassov, D.D.; Guertin, D.A.; Ali, S.M.; Sabatini, D.M. Phosphorylation and regulation of Akt/PKB by the rictor-mTOR complex. Science 2005, 307, 1098–1101. [Google Scholar] [CrossRef]
  12. Zoncu, R.; Efeyan, A.; Sabatini, D.M. mTOR: From growth signal integration to cancer, diabetes and ageing. Nat. Reviews. Mol. Cell Biol. 2011, 12, 21–35. [Google Scholar] [CrossRef] [PubMed]
  13. Laplante, M.; Sabatini, D.M. mTOR signaling in growth control and disease. Cell 2012, 149, 274–293. [Google Scholar] [CrossRef]
  14. Kim, J.; Kundu, M.; Viollet, B.; Guan, K.L. AMPK and mTOR regulate autophagy through direct phosphorylation of Ulk1. Nat. Cell Biol. 2011, 13, 132–141. [Google Scholar] [CrossRef] [PubMed]
  15. Jung, C.H.; Ro, S.H.; Cao, J.; Otto, N.M.; Kim, D.H. mTOR regulation of autophagy. FEBS Lett. 2010, 584, 1287–1295. [Google Scholar] [CrossRef] [PubMed]
  16. Ghosal, S.; Das, S.; Chakrabarti, J. Long noncoding RNAs: New players in the molecular mechanism for maintenance and differentiation of pluripotent stem cells. Stem Cells Dev. 2013, 22, 2240–2253. [Google Scholar] [CrossRef] [PubMed]
  17. Guttman, M.; Donaghey, J.; Carey, B.W.; Garber, M.; Grenier, J.K.; Munson, G.; Young, G.; Lucas, A.B.; Ach, R.; Bruhn, L.; et al. lincRNAs act in the circuitry controlling pluripotency and differentiation. Nature 2011, 477, 295–300. [Google Scholar] [CrossRef] [PubMed]
  18. Ulitsky, I.; Bartel, D.P. lincRNAs: Genomics, evolution, and mechanisms. Cell 2013, 154, 26–46. [Google Scholar] [CrossRef] [PubMed]
  19. Paralkar, V.R.; Weiss, M.J. Long noncoding RNAs in biology and hematopoiesis. Blood 2013, 121, 4842–4846. [Google Scholar] [CrossRef]
  20. Khalil, A.M.; Guttman, M.; Huarte, M.; Garber, M.; Raj, A.; Rivea Morales, D.; Thomas, K.; Presser, A.; Bernstein, B.E.; van Oudenaarden, A.; et al. Many human large intergenic noncoding RNAs associate with chromatin-modifying complexes and affect gene expression. Proc. Natl. Acad. Sci. USA 2009, 106, 11667–11672. [Google Scholar] [CrossRef]
  21. Chan, A.S.; Thorner, P.S.; Squire, J.A.; Zielenska, M. Identification of a novel gene NCRMS on chromosome 12q21 with differential expression between rhabdomyosarcoma subtypes. Oncogene 2002, 21, 3029–3037. [Google Scholar] [CrossRef] [PubMed]
  22. Ng, S.Y.; Bogu, G.K.; Soh, B.S.; Stanton, L.W. The long noncoding RNA RMST interacts with SOX2 to regulate neurogenesis. Mol. Cell 2013, 51, 349–359. [Google Scholar] [CrossRef] [PubMed]
  23. Uhde, C.W.; Vives, J.; Jaeger, I.; Li, M. Rmst is a novel marker for the mouse ventral mesencephalic floor plate and the anterior dorsal midline cells. PLoS ONE 2010, 5, e8641. [Google Scholar] [CrossRef] [PubMed]
  24. Mohan, N.; Shen, Y.; Dokmanovic, M.; Endo, Y.; Hirsch, D.S.; Wu, W.J. VPS34 regulates TSC1/TSC2 heterodimer to mediate RheB and mTORC1/S6K1 activation and cellular transformation. Oncotarget 2016, 7, 52239–52254. [Google Scholar] [CrossRef] [PubMed]
  25. Sander, J.D.; Joung, J.K. CRISPR-Cas systems for editing, regulating and targeting genomes. Nat. Biotechnol. 2014, 32, 347–355. [Google Scholar] [CrossRef] [PubMed]
  26. Lakshmaiah, K.C.; Jacob, L.A.; Aparna, S.; Lokanatha, D.; Saldanha, S.C. Epigenetic therapy of cancer with histone deacetylase inhibitors. J. Cancer Res. Ther. 2014, 10, 469–478. [Google Scholar] [PubMed]
  27. Tang, Y.; Chen, Y.; Jiang, H.; Robbins, G.T.; Nie, D. G-protein-coupled receptor for short-chain fatty acids suppresses colon cancer. Int. J. Cancer 2011, 128, 847–856. [Google Scholar] [CrossRef] [PubMed]
  28. Beermann, J.; Piccoli, M.T.; Viereck, J.; Thum, T. Non-coding RNAs in Development and Disease: Background, Mechanisms, and Therapeutic Approaches. Physiol. Rev. 2016, 96, 1297–1325. [Google Scholar] [CrossRef]
  29. Han, R.; Sun, Q.; Wu, J.; Zheng, P.; Zhao, G. Sodium Butyrate Upregulates miR-203 Expression to Exert Anti-Proliferation Effect on Colorectal Cancer Cells. Cell Physiol Biochem. 2016, 39, 1919–1929. [Google Scholar] [CrossRef]
  30. Hu, S.; Liu, L.; Chang, E.B.; Wang, J.Y.; Raufman, J.P. Butyrate inhibits pro-proliferative miR-92a by diminishing c-Myc-induced miR-17-92a cluster transcription in human colon cancer cells. Mol. Cancer 2015, 14, 180. [Google Scholar] [CrossRef]
  31. Malakar, P.; Shilo, A.; Mogilavsky, A.; Stein, I.; Pikarsky, E.; Nevo, Y.; Benyamini, H.; Elgavish, S.; Zong, X.; Prasanth, K.V.; et al. Long noncoding RNA MALAT1 promotes hepatocellular carcinoma development by SRSF1 up-regulation and mTOR activation. Cancer Res. 2016, 77, 1155–1167. [Google Scholar] [CrossRef] [PubMed]
  32. Pawar, K.; Hanisch, C.; Palma Vera, S.E.; Einspanier, R.; Sharbati, S. Down regulated lncRNA MEG3 eliminates mycobacteria in macrophages via autophagy. Sci. Rep. 2016, 6, 19416. [Google Scholar] [CrossRef] [PubMed]
  33. Wu, C.; Luo, J. Long Non-Coding RNA (lncRNA) Urothelial Carcinoma-Associated 1 (UCA1) Enhances Tamoxifen Resistance in Breast Cancer Cells via Inhibiting mTOR Signaling Pathway. Med. Sci. Monit. 2016, 22, 3860–3867. [Google Scholar] [CrossRef] [PubMed]
  34. Huang, J.; Dibble, C.C.; Matsuzaki, M.; Manning, B.D. The TSC1-TSC2 complex is required for proper activation of mTOR complex 2. Mol. Cell. Biol. 2008, 28, 4104–4115. [Google Scholar] [CrossRef]
  35. Lee, J.S.; Kim, Y.J.; Kim, C.L.; Lee, G.M. Differential induction of autophagy in caspase-3/7 down-regulating and Bcl-2 overexpressing recombinant CHO cells subjected to sodium butyrate treatment. J. Biotechnol. 2012, 161, 34–41. [Google Scholar] [CrossRef] [PubMed]
  36. Tsuda, H.; Ochiai, K.; Suzuki, N.; Otsuka, K. Butyrate, a bacterial metabolite, induces apoptosis and autophagic cell death in gingival epithelial cells. J. Periodontal Res. 2010, 45, 626–634. [Google Scholar] [CrossRef] [PubMed]
  37. Wang, K.C.; Chang, H.Y. Molecular mechanisms of long noncoding RNAs. Mol. Cell 2011, 43, 904–914. [Google Scholar] [CrossRef]
  38. Ng, S.Y.; Johnson, R.; Stanton, L.W. Human long non-coding RNAs promote pluripotency and neuronal differentiation by association with chromatin modifiers and transcription factors. EMBO J. 2012, 31, 522–533. [Google Scholar] [CrossRef]
Figure 1. SCFAs induced the expression of RMST in colon cancer cell lines. (A) LncRNA expression of HCT116 cell was profiled with disease-related lncRNA array (system biosciences) consisting of 83 lncRNAs selected from the lncRNA database. RMST was identified as one of lncRNAs stimulated by propionate treatment. (B) Propionate and butyrate induced the expression of RMST in colon cancer cell lines including HCT116, HT29 and SW620 but not in non-cancerous colon cell lines NCM356 and NCM460. (C) Time-dependent stimulation of RMST expression in HCT116 cells by propionate treatment. (D) Dose-dependent induction of RMST expression in HCT116 cells by propionate treatment. Fold change in RMST RNA levels in y-axis, with the RMST levels in their respective controls set as 1. *, p < 0.05; **, p < 0.01 when compared to their respective controls (N = 3).
Kinasesphosphatases 02 00008 g001
Figure 2. Role of RMST in SCFA suppression of mTOR. (A) Suppression of mTOR by propionate in HCT116 and HT29 colon cancer cells but not in non-cancerous NCM356 cells. The levels of phospho-mTOR at ser2448, 48 h after treatment with propionate, were measured by ELISA. (B) Knockdown of RMST levels by siRNAs in HCT116 cells with or without propionate treatment. The RMST levels were measured by qRT-PCR in HCT116 cells after siRNAs transfections and propionate treatments. Fold change in RMST RNA levels in y-axis, with the RMST levels in their respective controls set as 1. (C) Decrease in propionate-induced suppression of mTOR activation after RMST knockdown. After siRNA transfections, HCT116 cells were treated with propionate for 48 h before being harvested for Western blot analyses. (D) ELISA measurement of phosphor-mTOR after siRNAs transfection and propionate treatments. *, p < 0.05 when compared to their respective controls (N = 3).
Kinasesphosphatases 02 00008 g002
Figure 3. Suppression of mTOR signaling by RMST. (A) Increased RMST expression in HCT116 cells through retroviral transduction with a pBabe-RMST construct. Relative fold change in RMST RNA levels in y-axis, with the RMST level in the vector control set as 1. (B) RMST overexpression reduced the levels of phospho-mTORs in HCT116 and HT29 cells when compared to their vector controls. (C) ELISA measurement of phosphor-mTOR levels in HCT116 and HT29 cells after RMST overexpression. (D) ELISA measurement of phosphor-mTOR levels in HCT116 cells after RMST overexpression and propionate treatment. *, p < 0.05; ***, p < 0.001 when compared to their respective controls (N = 3).
Kinasesphosphatases 02 00008 g003
Figure 4. RMST is required for SCFA-induced autophagy. (A) Effects of RMST knockdown by siRNA on propionate-induced autophagy; 12 h after siRNA transfection, HCT116 cells with stable GFP-LC3 expression were treated with 3 mM propionate for 24 h. Compared with scrambled control, there were less LC3 puncta in cells with RMST knockdown. (B) Quantification of the percentage of GFP-LC3 puncta in cells with siRNA transfection compared to cells with scrambled siRNA. (C) Increased autophagy in HCT116 cells with RMST overexpression. HCT116 cells with RMST and GFP-LC3 stable expression were treated with propionate at low concentrations (0.5 mM) for 24 h. Compared with control (without RMST overexpression), there are much more GFP-LC3 puncta in cells with RMST expression. *, p < 0.05 when compared to their respective controls (N = 5).
Kinasesphosphatases 02 00008 g004
Figure 5. TSC2 is responsible for SCFA/RMST-mediated inhibition of mTOR signaling. (A) Among 52 genes managing the activation of mTOR signaling, the mRNA level of the negative regulator TSC2 was significantly increased by RMST overexpression. (B) Increased TSC2 mRNA levels in HCT116 cells after treatment of 1 mM butyrate or 3 mM propionate for 48 h. Fold change in TSC2 RNA levels in y-axis, with the TSC2 level in solvent control set as 1. *, p < 0.05 compared to control (N = 3). (C) Increased TSC2 protein expression after SCFAs treatment of HCT116 cells (i) or RMST overexpression in HCT116 and HT29 cells (ii). (D) Effects of TSC2 knockdown on propionate suppression of mTOR signaling. TSC2 knockdown did not change total mTOR or phosphorylated mTOR levels with no propionate treatment, but TSC2 knockdown attenuated propionate-induced suppression of mTOR levels or p70S6K level.
Kinasesphosphatases 02 00008 g005
Figure 6. Impacts of mTOR signaling by genomic editing of RMST gene loci by CRISPR/CAS9. (A) Schematic diagram of RMST genomic structure and the site targeted by CRISPR/CAS9 system. RMST is composed with 9 exons spanning over 68 kb. To achieve genomic deletion, constructs were designed to target each of the exons, and a pair of them was delivered to HCT116 cells. (B) Confirmation of RMST gene editing through PCR analyses of genomic DNA and sequencing. F12 and F20 cell lines were generated by CRISPR/CAS9 constructs targeting exon 1 and exon 9 of RMST gene. Both of F12 and F20 were heterozygous deletion cell lines since both had the upper wildtype band and the bottom deletion band in PCR analysis. E562, 56210 and 56213 cells were generated with CRISPR/CAS9 constructs targeting exon 5 and exon 6 of RMST genes. E562 cells were heterozygous in RMST deletion, while cell lines of 56210 and 56213 cells were homozygous deletion. RMST fold change in y-axis, with the RMST level in the parental HCT116 as 1. (C) Reduced RMST expression in HCT116 cells through genomic editing. Fold change in RMST RNA levels in y-axis, with the RMST level in the parental HCT116 cells set as 1, *, p < 0.05 compared to control (N = 3). (D) Genomic editing of RMST gene loci increased the levels of phosphor-mTOR and p70S6K and reduced TSC2 expression.
Kinasesphosphatases 02 00008 g006
Figure 7. Schematic diagram of the mechanism by which SCFAs downregulate mTOR activity in colon cancer cells. SCFAs extensively induce the expression of RMST in colon cancer cells. RMST increased the level of TSC2, which in turn suppresses the level of phosphorylated mTOR.
Kinasesphosphatases 02 00008 g007
Table 1. Sequences targeted to RMST genomic loci by CRISPR/CAS9 system.
Target 1TGAAACTTGGAGCAAAGTGG(AGG)
Target 2GCTGAATATCTTCAGGAAAA(TGG)
Target 3TTTTTATTTTGCAGATTCTC(AGG)
Target 4CTATATTTTGTTAGAAAGGA(AGG)
Target 5ACTTAGCATTCCATCCGTGC(AGG)
Target 6CTTATTCTGAACTTTCAGAC(TGG)
Target 7AACCTCTATTGTATTCCAGT(TGG)
Target 8TGTCTGGCTTTCCTTGCAGT(GGG)
Target 9(CCT)GCTCGATGTTTGCATTTAAA
Table 2. Sequences of siRNA targeted to human RMST.
RMST
siRNA1senseCGGAGACUUGGUAGUGAAAUUCUTC
antisenseGAAGAAUUUCACUACCAAGUCUCCGUG
siRNA2senseGUUUGAUUGACCUUUGUUAGGGUGA
antisenseUCACCCUAACAAAGGUCAAUCAAACUU
siRNA3senseCGAAUUAUUUGCAAUGCCAUUUAAT
antisenseAUUAAAUGGCAUUGCAAAUAAUUCGUU
Table 3. RMST primers for real-time PCR primers and genomic deletion assay.
NameForward PrimerReverse Primer
qPCRCCCAGTGCCACCAACTGGGATCCAGCTGGCGGGTACGATCAG
gRMST1GGG AAA CAG AGG GAG CACGGT ATG GAA CAA GGC AGC
gRMST2ATC AAT GCC CCT ACT CACACG CTG CTC TGC ATT TTC
gRMST3TAG CCC GGC TTT TAG GTCACC CGT CAG TTT CCA AGA
gRMST4AGC TCT GTC GTT CCA CCTGTC ACT CCT CGG AAA GC
gRMST5CAG TAG TGC TTG GGA CTCACA GCT GAT GTC CCG TTT
Disclaimer/Publisher’s Note: The statements, opinions and data contained in all publications are solely those of the individual author(s) and contributor(s) and not of MDPI and/or the editor(s). MDPI and/or the editor(s) disclaim responsibility for any injury to people or property resulting from any ideas, methods, instructions or products referred to in the content.

