
Electric Vehicles Energy Management for Vehicle-to-Grid 6G-Based Smart Grid Networks

1
LyRIDS, ECE Paris, 10 Rue Sextius Michel, 75015 Paris, France
2
LI-PaRAD Lab, University of Paris Saclay, UVSQ, 45 Avenue États-Unis, 78035 Versailles Cedex, France
*
Author to whom correspondence should be addressed.
J. Sens. Actuator Netw. 2023, 12(6), 79; https://doi.org/10.3390/jsan12060079
Submission received: 5 October 2023
/
Revised: 17 November 2023
/
Accepted: 20 November 2023
/
Published: 27 November 2023
(This article belongs to the Special Issue Machine-Environment Interaction, Volume II)
Abstract
:This research proposes a unique platform for energy management optimization in smart grids, based on 6G technologies. The proposed platform, applied on a virtual power plant, includes algorithms that take into account different profiles of loads and fairly schedules energy according to loads priorities and compensates for the intermittent nature of renewable energy sources. Moreover, we develop a bidirectional energy transition mechanism towards a fleet of intelligent vehicles by adopting vehicle-to-grid technology and peak clipping. Performance analysis shows that the proposed energy provides fairness to electrical vehicles, satisfies urgent loads, and optimizes smart grids energy.
1. Introduction
This paper lies in the area of 6G network technologies integration for renewable green sources energy management in the context of electrical vehicles in smart grids. During recent decades, environmental issues have been raised in the electrical power field. Indeed, the electricity field is one of the most polluting energy sectors, being responsible for 36 percent of carbon dioxide footprint [1]. More specifically, fossil resources contribute to local pollution and to the increase in greenhouse gas concentrations in the atmosphere, thus inducing global warming. Beyond the environmental challenges, the electrical system is also facing new constraints, such as the growing energy demand, particularly during peak periods, the aging of network infrastructures. and new electrical uses, i.e., electric vehicles (EVs). Based on these findings, we oriented our efforts towards (1) the deployment of renewable resources, (2) the development of technologies that make electricity demand more flexible, (3) the deployment of vehicle-to-grid (V2G) technology, and (4) the adoption of 6G techniques: software defined technology and network slicing.
Deployment of intermittent renewable energy resources: The management of renewable energy resources, such as solar and wind farms, provides environmental problem solutions by allowing for greener electricity production. Nevertheless, certain drawbacks related to these resources, such as their intermittent nature or the spatial occupation problem, require the development of an effective energy management mechanism.
Flexible electricity demand: In current electrical networks, the energy demand is stochastic; thus energy management is carried out at the supply level. Conversely, in future networks, the intermittency of renewable energies implemented on a large scale will shift the random feature of the electrical demand from consumers to producers; demand must therefore be flexible and controlled via specific management programs, called demand response (DR) programs. These programs act on the electricity load curve shape by shifting loads, clipping peaks, or filling valleys [2].
- Load shifting consists of shifting the demand for an electrical device, i.e., postponing or advancing a demand from one time slot of the day to another.
- The reduction in the peak of electricity demand, or peak clipping, can be performed by reducing or very occasionally cutting off electricity use. This solution reduces the electrical power during peak periods and induces a consumption drop.
- Valley filling makes it possible to increase the load during periods when it is less important.
Vehicle-to-grid technology: The large-scale deployment of electric vehicles could have a considerable effect on the charging curve, particularly during peak periods, in case vehicle charging is not correctly distributed over time [3,4]. Thus, V2G technologies consider the battery of an electric car as an extension of the distribution network, i.e., an energy pool from which the electricity supplier can draw from time to time. Our objective therefore consists of setting up a flexible V2G energy management mechanism, which will make it possible to recharge the batteries during the renewable energy production phases; then the mechanism will make electricity available when the supply offered by solar or wind sources have been interrupted. This concept is interesting; however, it poses certain concerns related to fairness among vehicles. Therefore, our paper strives to provide a balance between deficient power supply and fairness provision.
Software defined networking (SDN) and network slicing: Traditional approaches are not designed to handle energy management in smart grids. This paper introduces a novel architecture of a smart grid, which aims to accomplish power balancing between power generation and demands by taking full advantage of optimization methods 6G technologies, i.e., the software defined networking and virtual power plant technologies. The SDN concept can be widely used as the framework for supporting power grid communications since it separates the control plane from the data plane. Given that the power grid relies heavily on communication networks for control, SDN technique can be used to manage the communication entities in smart grids. Consequently, SDN will be able to provide load balancing, load displacement, dynamic routing path change in response to smart grid control requests [5], quick fault detection [6], security [7], self-healing [8], and tracking and scheduling of critical smart grid traffic flows in electrical networks. In this paper, we implement a centralized SDN-based energy management system with network slicing [9]. Indeed, network slicing enables to logically partition networks into slices for the different use cases. In this way, resources are effectively managed for flexible and strict energy loads.
In this context, the current paper investigates the optimization and fairness tools in the purpose of fair energy scheduling in smart grid networks. We develop some insights into the design of energy mechanisms capable of providing a balance between loads and smart grid energy. More specifically, we bring the focus to the 6G solutions and demonstrate how they may overcome the lack of energy induced by intermittent renewable energy sources and non-flexible loads.
The rest of this paper is organized as follows: Section 2 exhibits a literature survey on V2G technologies. In Section 3, we describe our proposed energy management architecture. Section 4 brings the focus to the V2G algorithm, namely charging and discharging algorithms as well as the optimal energy scheduling mechanism. Section 5 presents the simulation results that validate the performance of the proposed platform. Finally, we conclude the paper in Section 6.
2. Related Work
Energy optimization is of paramount importance in next generation smart grids due to financial savings, efficient planning, and secure power grid operation. Nevertheless, energy optimization is difficult because of the unpredictable and sporadic nature of renewable energy sources (RES), massive usage of electrical vehicles and consumer behavior. Two strategies may overcome the constraints in next generation smart grids: demand response programs and V2G technology.
Implementing DR programs and modeling their role in managing the stochastic behavior of RES in energy optimization have recently been the subject of important research efforts. DR is applied in [10] in order to maintain a balance between smart grid consumption and energy generation. The running cost of the proposed model is optimized using the particle swarm optimization algorithm.
Using the epsilon-constraint as a multi-objective optimization problem, the DR program is evaluated in the operation management of the smart grid including demand wind turbine and solar cells in [11,12]. In [13,14], the DR program and spinning reserve are examined to address the power system’s problem of insufficient wind power. As an alternative, the energy optimization problem is solved in [15] using a mixed-integer linear programming approach. However, the authors neglected the uncertainty brought on by RES and solely concentrated on forecasting. In [16], a plan for energy optimization in smart grids that takes wind generation into account is examined. The authors aimed to increase social welfare as much as possible. Solar energy and incentive-based demand response programs were not, however, taken into account by the authors. In order to reduce operational costs and emissions, a probabilistic model for energy optimization in smart grids with integrated wind and solar is assessed in [17]. They modeled the fluctuation in wind and solar behavior using Rayleigh and beta probability density functions, respectively. A multi-objective particle swarm optimization algorithm is used to solve a comparable multi-objective energy management model that is integrated with RES. The authors’ goal is to minimize operational expenses and pollutant production [18,19]. The planned model performance, however, lacks of scalability.
Using the mesh adaptive direct search method, optimal energy management and modeling of a smart grid integrating RES are assessed in [20,21]. However, the uncertainty brought by RES is not taken into account in this study. For the stochastic behavior modeling of wind energy, authors in [22] propose a stochastic planning strategy based on the Monte-Carlo technique. Also investigated is a DR program that takes wind energy influence into account as a functional storage in the electricity market. The majority of the highlighted papers rely on the usage of reserve and ancillary services to reduce the risks associated with RES. In order to overcome the reserve resources, we propose in this paper to integrate the vehicle-to-grid technology.
Research on V2G operations has been significantly tackled in the literature [23,24,25]. In fact, smart grids will be severely overwhelmed whenever electric vehicle adoption were to become widespread during the following several decades. Electric vehicles are being connected gradually, raising concerns about the reliability of the power grid and energy control. The grid was not intended or suited for this complexity; therefore energy management techniques should be reviewed. Consequently, the development of intelligent systems that can interface the grid with V2G technologies is essential to support the widespread adoption of electric vehicles besides non-flexible institutions that require a constant energy [26].
Several recent scientific studies on unidirectional V2G (V1G), bidirectional V2G, vehicle-to-building (V2B) [27], show that electric vehicles integration enhance the flexibility of energy communities, energy districts and grids. Our research study considers V2G for two main reasons. On the one hand, we were mainly concerned with the lack of energy in a smart grid. In fact, V2G is advantageous to the grids in order to make energy balancing, specifically that intermittent renewable energy sources are considered. Moreover, V2G is cost-effective due to the fact that users may sell excess cars to power the grids. On the other hand, even though vehicle-to-everything (V2X) encompasses bidirectional charging technologies, V2G stands out as it is a direct transfer of power from vehicles to grids and not to utilities.
In order to deal with EVs while supplying energy, researchers have shown that aggregator services are required for frequency regulation and balancing, load leveling, and voltage regulation [28]. The authors of [29] proposed a framework that relies on the electrical vehicle aggregator (EVA) that plays a crucial role in collecting battery vehicles into aggregations and interacting with energy service providers for the provision of energy and capacity services. The proposed framework recognizes the central role of the aggregator in V2G. Moreover, the architecture provides the computing, communication, and control infrastructure to depict the flows between battery vehicles and the energy service providers.
The authors of [30] integrated the unit commitment aggregator within the smart grid. They adopted the particle swarm optimization technique to balance cost and pollution reductions for unit commitment with V2G. The optimality was only sought from the standpoint of effective grid operation, not from the perspective of electrical vehicles.
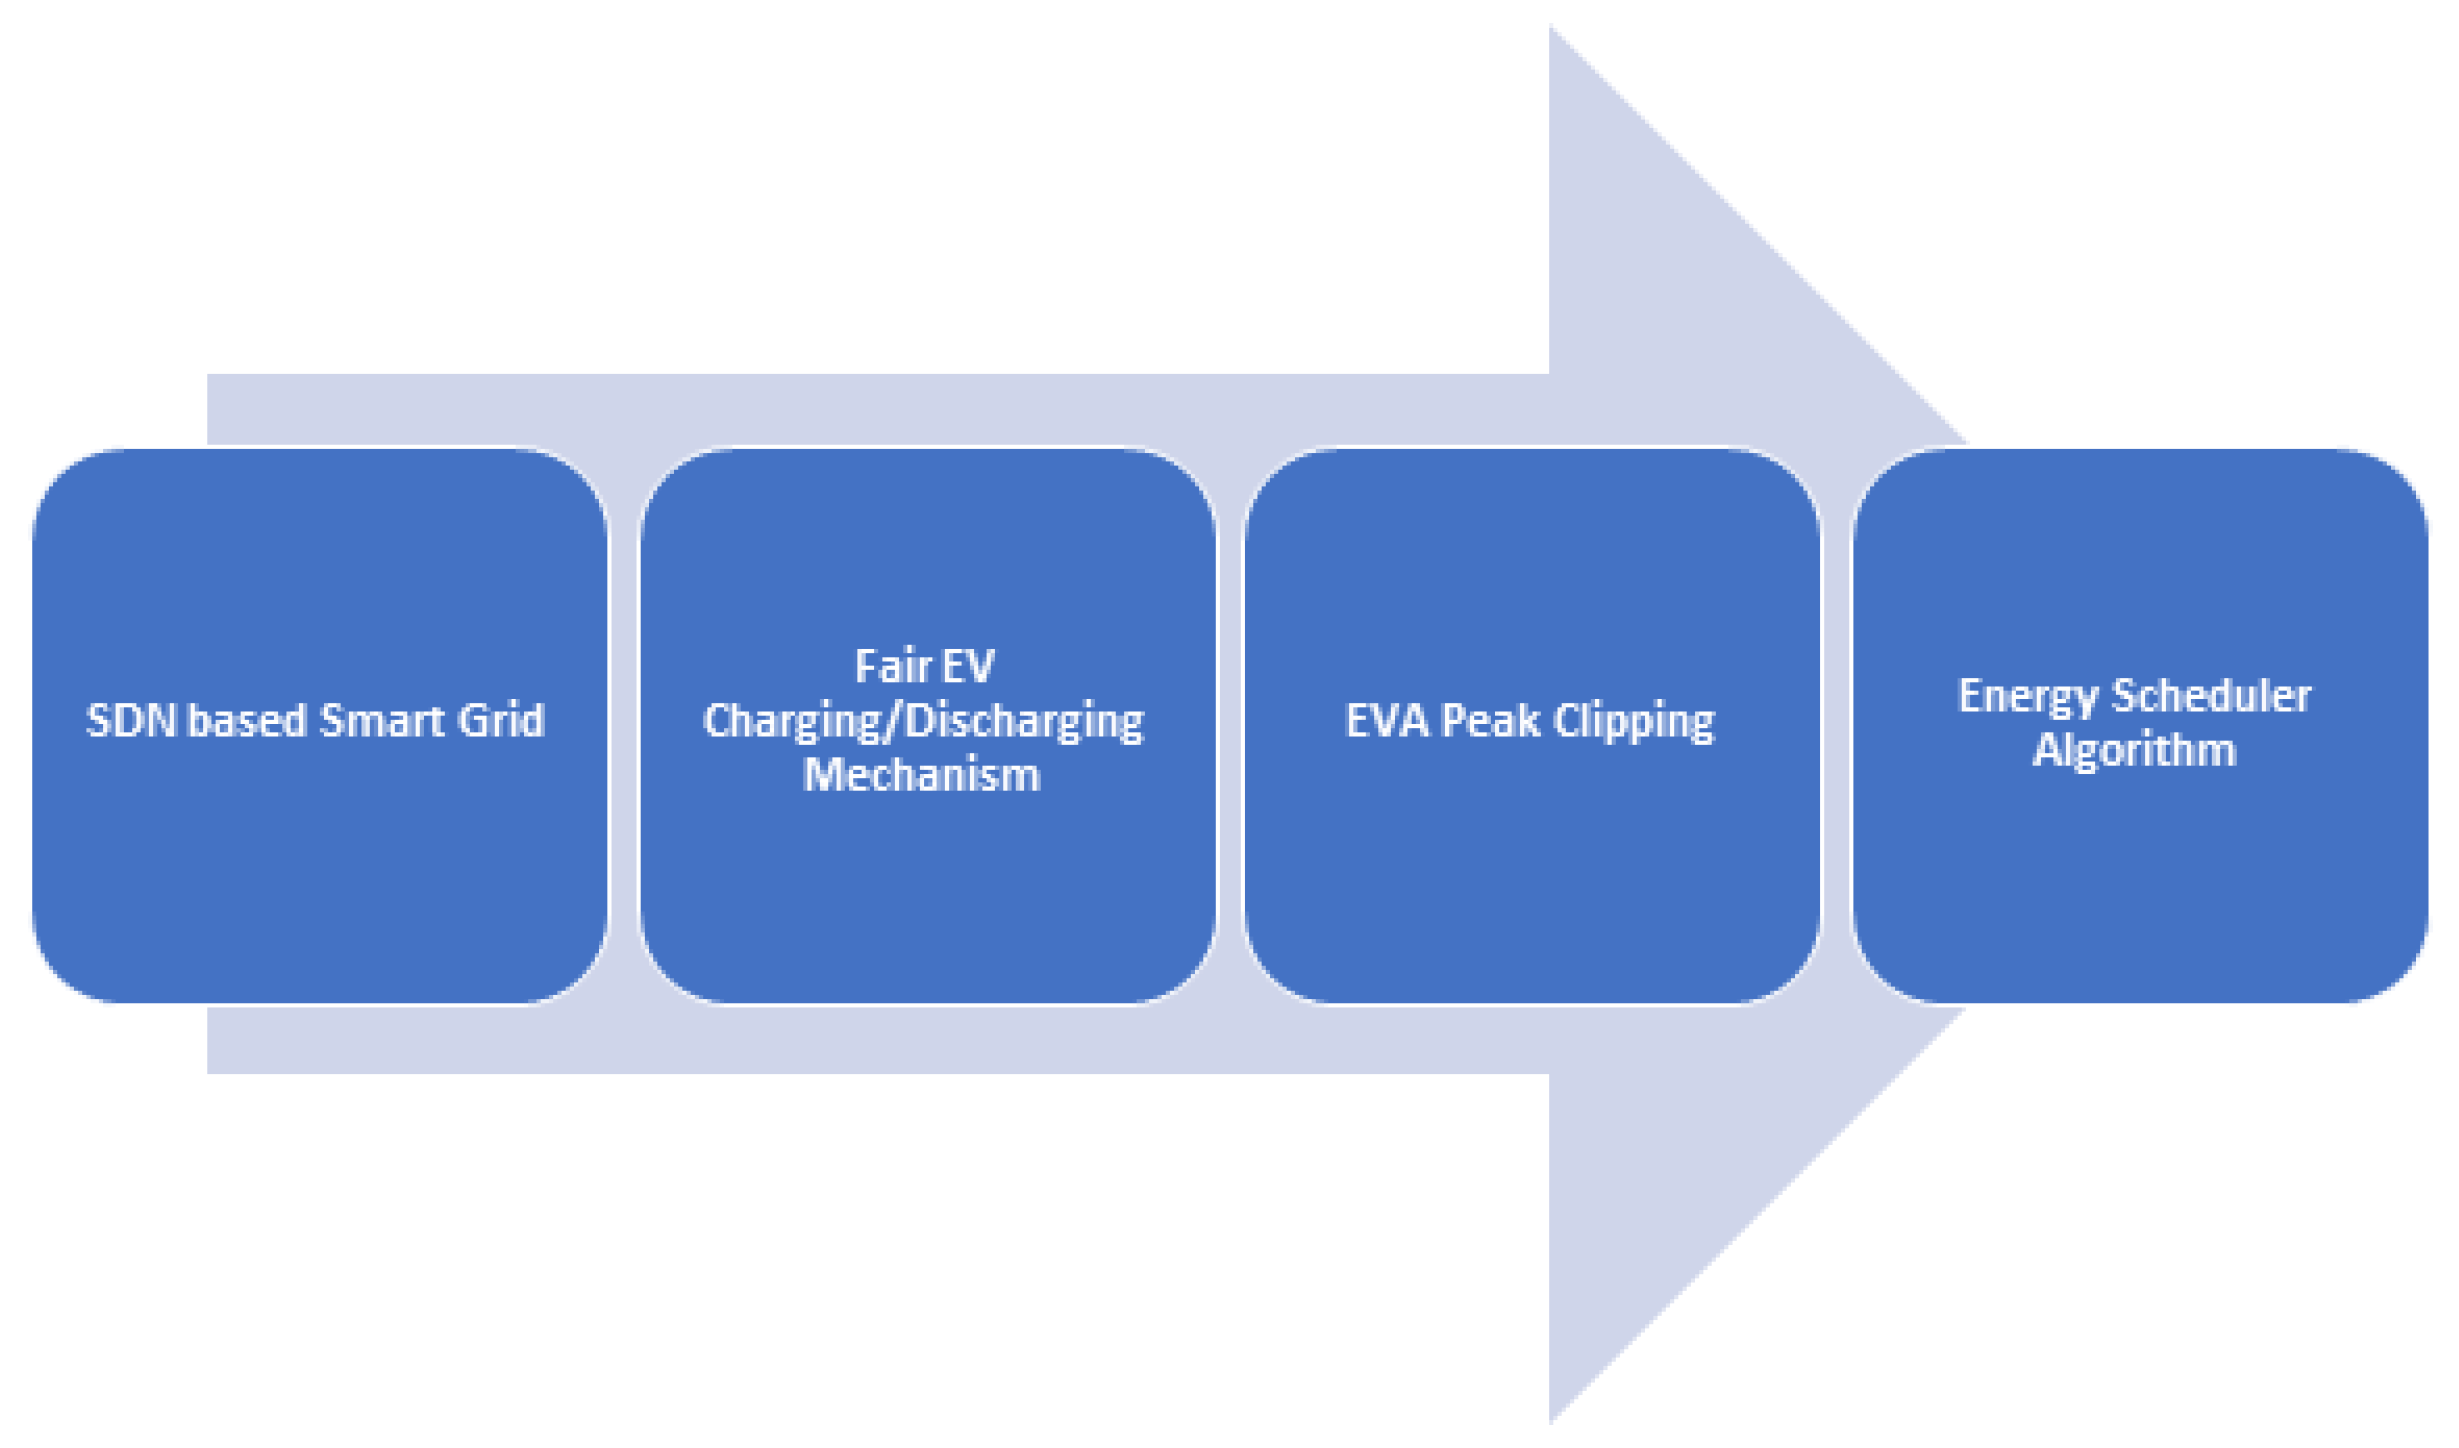
There is still a gap despite the continued study of aggregators for V2G. In fact, the majority of current studies fail to include the combined effects of factors like the fairness in discharging vehicles, loads priority, vehicles urgent needs, and load leveling on grid management. Gaining a thorough insight of the effects of electric vehicles and intelligent V2G control in a massive distribution grid, based on 6G technologies, is the overall goal of this research. Our research study stands out of the literature for the following reasons (Figure 1):
- –
- Energy optimization process is critical and should be controlled efficiently. Therefore, we integrate the software defined network technology that controls timely loads, network slices, the Virtual Power Plant (VPP), and the electric vehicles aggregator. On the other hand, the EVA is responsible for orchestrating the charging or discharging of vehicles connected to the system, taking into account the energy supplied or required by the VPP.
- –
- Research projects dealing with V2G consider one class of vehicles; while these models may function well under typical common circumstances, they may be inefficient in the event of urgent vehicles that pose time constraints. Based on this knowledge, we develop a fair charging mechanism that considers two classes of vehicles and demonstrate how our system fulfills vehicles’ requirements. The charging mechanism relies on the driver satisfaction computed according to the percentage of battery charged during the last charging session and the last time the vehicle needed energy from the grid.
- –
- Vehicle discharging is of paramount importance for the V2G process. Nevertheless, an inefficient unfair discharging mechanism may lead to frustrating drivers. Therefore in light of this understanding, we devised a mechanism based on degradation degree and degradation ratio that protects the vehicles batteries that have been frequently discharged in the past. The suggested module’s performance results demonstrate its advantages and demonstrate that it enhances vehicles fairness and satisfaction.
- –
- We implemented an energy optimization algorithm that dispatches energy between two types of loads: non-flexible loads (medical clinic) and flexible loads (electrical vehicles).The main objective of the proposed energy management model is to establish balancing between power consumption and production, while performing peak clipping and valley filling.
3. The 6G-Based Energy Management Architecture
3.1. Architecture Actors
We propose an innovative architecture for optimal energy scheduling in V2G 6G smart grids networks. This architecture involves the following actors [31].
- –
- Renewable energy sources:The power supply to the smart grid is provided by a set of wind turbines and photovoltaic panels.
- –
- Virtual power plant:The VPP is a cloud-based data control center that aggregates production data from various distributed energy resources. This data center uses various communication technologies and internet of things sensors to gather data, which enables it to monitor and control the production of each plant. Thus, VPP computes regularly the residual energy demand or the surplus energy remaining.
- –
- Electric vehicle aggregator:The EVA aggregates battery vehicles and interacts with the VPP for the provision of energy and capacity services.
- –
- Flexible loads: The considered flexible loads are battery electric vehicles that adhere to specific demand response programs, e.g., peak clipping and valley filling.
- –
- Non-flexible load:The considered non-flexible load is a medical clinic that does not adapt to the smart grids energy. Therefore, they do not apply any demand response program.
- –
- SDN controllers:SDN controllers are either Dedicated SDN Controller (D-SDNC) or Shared SDN Controller (S-SDNC). The D-SDNC is a SDN controller that plays a crucial role in the energy management function, in our architecture. It hosts the virtual power plant and interacts with the shared SDN controller. The S-SDNC applies the control rules disseminated by the D-SDNC.
3.2. Architecture Modules
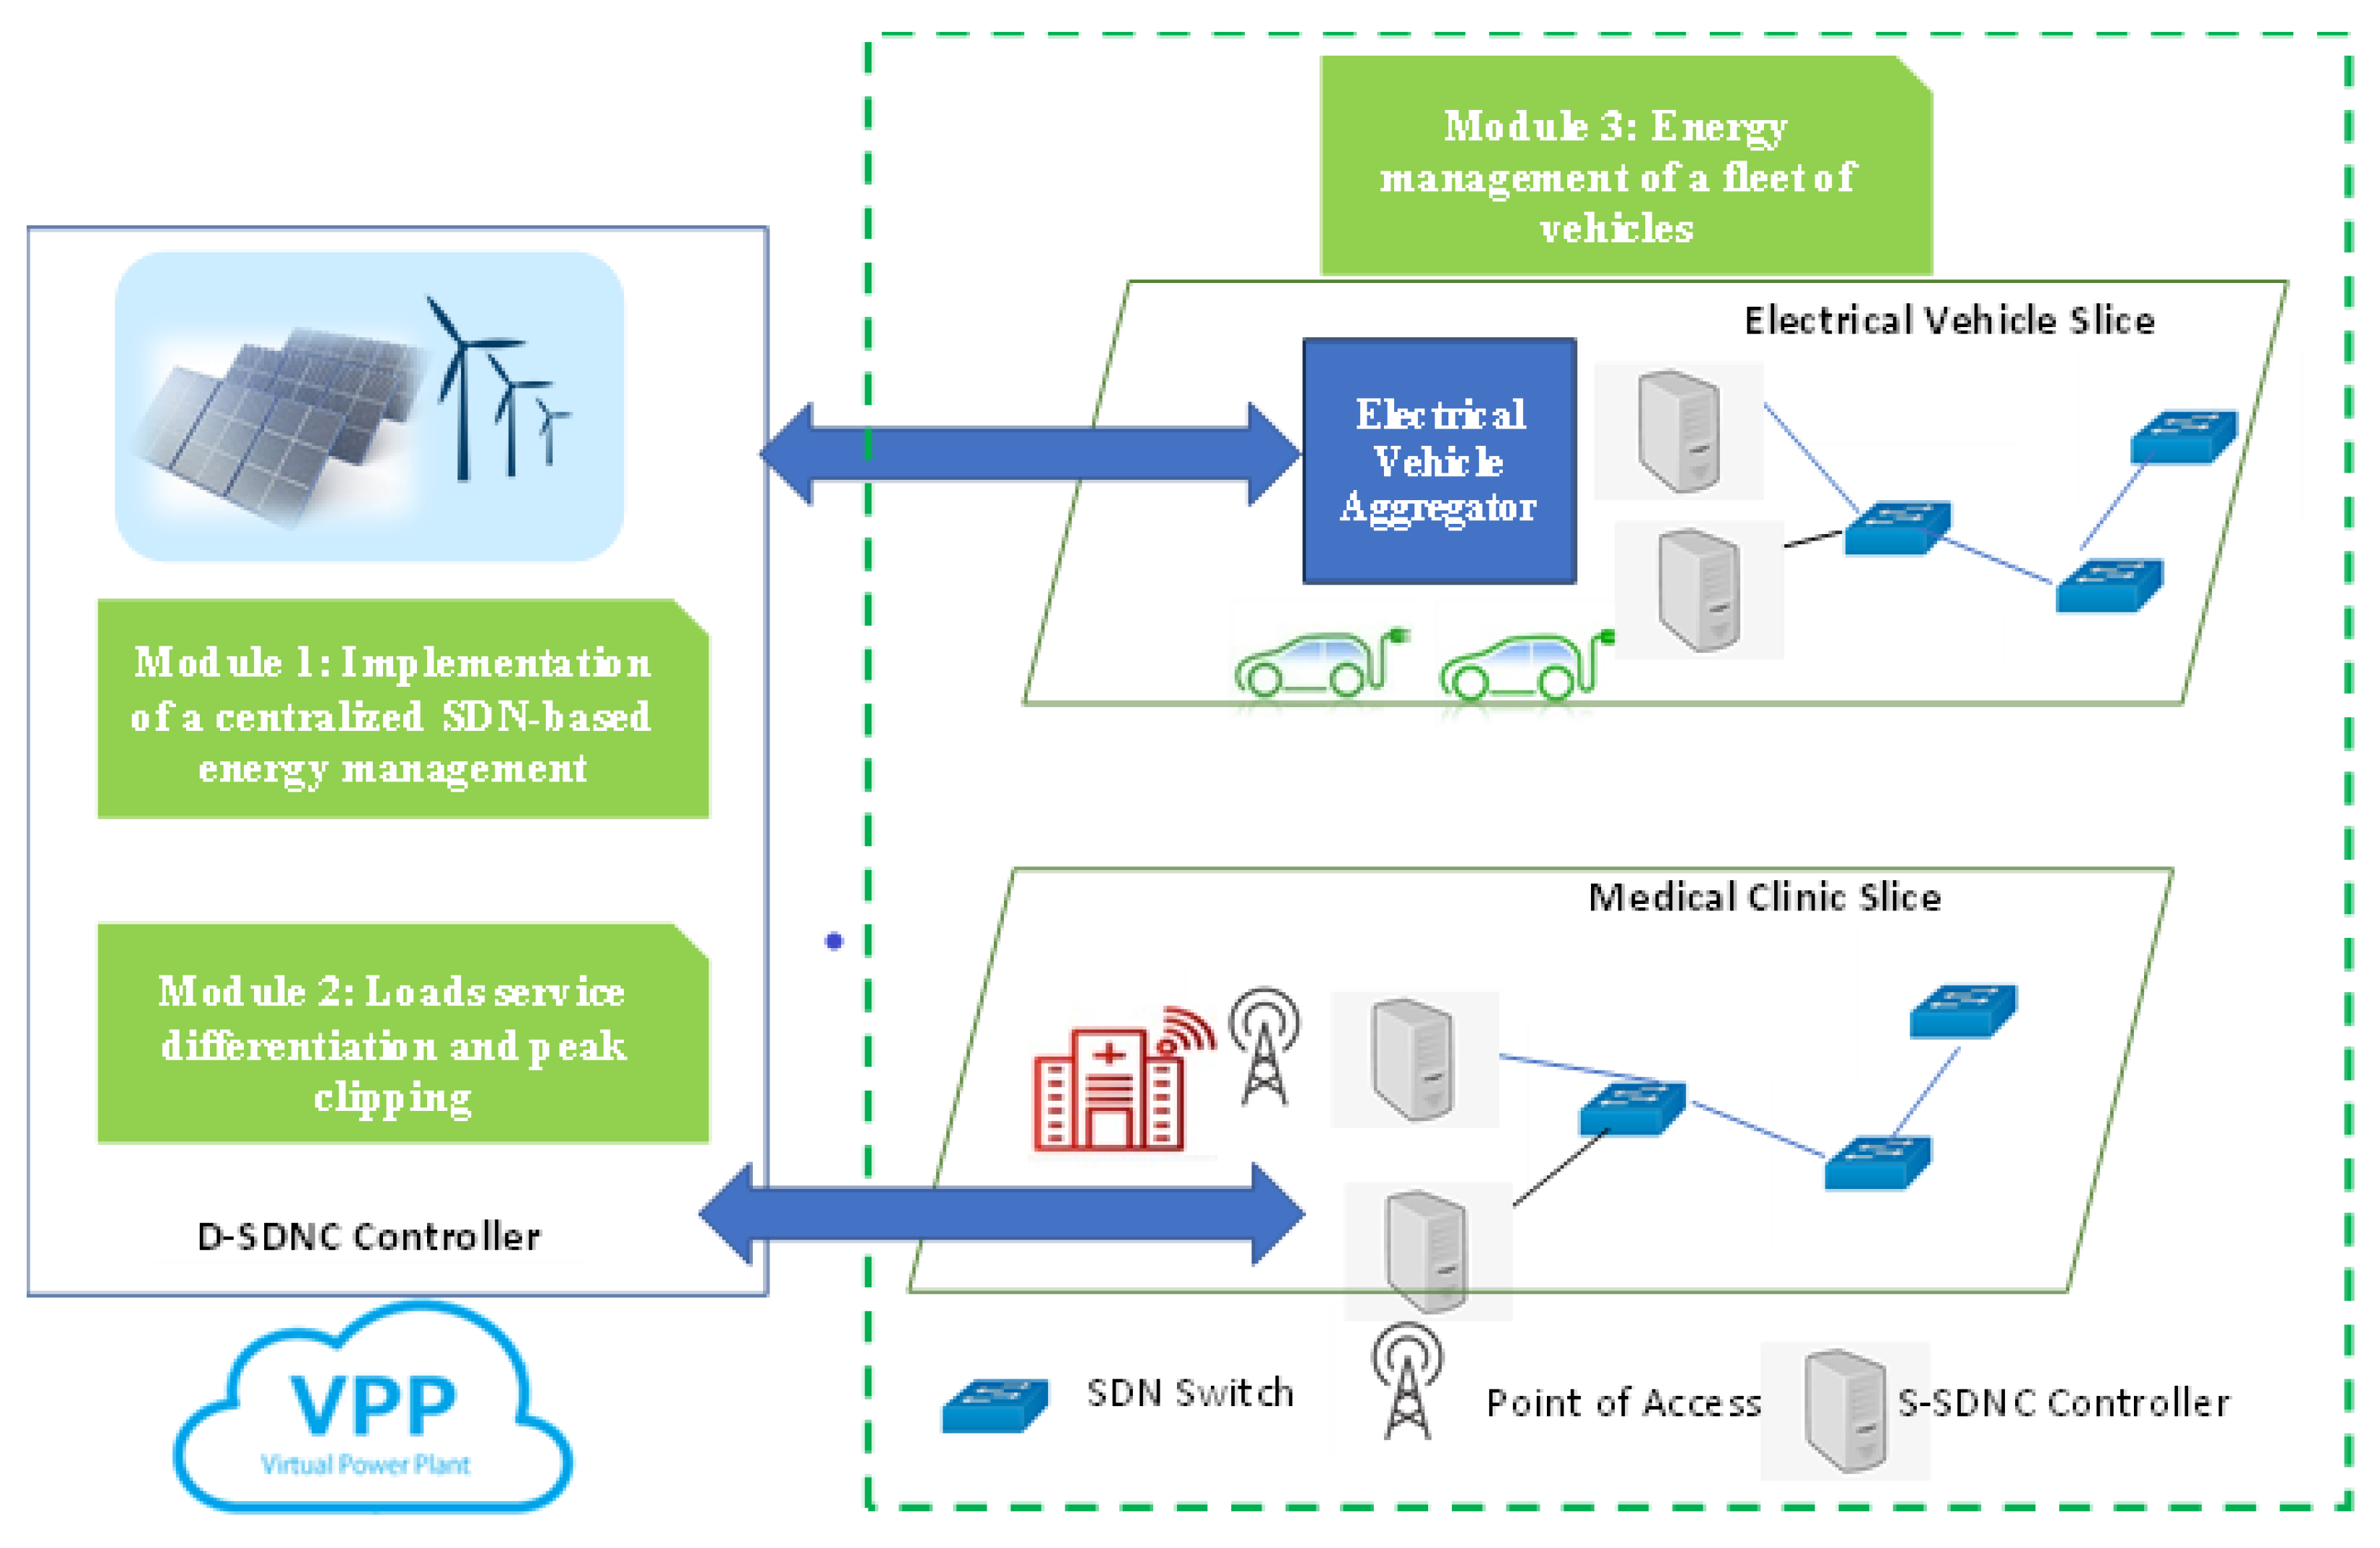
The proposed architecture relies on three modules as illustrated in Figure 2.
Module 1: Implementation of a centralized SDN-based energy management architecture with network splitting
The architecture of next generation smart grid networks along with the functional entities of 5G networks that rely on an SDN controller and SDN switches are defined in this module. For the two use cases—medical clinic and electrical vehicle—we advise using two slices. The development of a fair energy distribution system at the level of a VPP situated within the SDN controller is something we take into consideration in the subsequent phase. This method should maximize energy use while taking into account the limitations of wind and solar energy sources as well as the requirements of users who have two different energy profiles.
Module 2: Loads service differentiation and peak clipping
This module consists of a fair energy distribution algorithm that has been implemented at the VPP. The latter is able to quickly produce load-following power and dispatch efficiently electricity at peak loads. Indeed, a VPP may be regarded as a conventional power plant while providing greater flexibility and efficiency; therefore, this allows the system to respond to load changes more effectively. More specifically, VPP makes use of an optimization algorithm that relies on weather data, including wind speed and solar radiation parameters for wind turbines (WT) and photovoltaic (PV) systems, the load demand profile of medical clinics, and the level of charge of EVs. We balance energy according to two distinct energy profiles: flexible and strict. It is noteworthy that we adopt peak clipping during peak hours since flexible energy profile loads are more adaptable to energy variation.
Module 3: Energy management of a fleet of vehicles
By adopting V2G technology, this module seeks to create a two-way energy transition mechanism for a fleet of intelligent vehicles. This system will be able to manage grid-to-vehicle technology, which views the vehicle as a customer, effectively as well.
In fact, if car charging is not evenly distributed throughout time, the widespread deployment of electric vehicles could significantly change the charging curve, especially during peak times. Therefore, V2G technologies are applied in order to render the vehicle’s battery as a source of power. In order to recharge the batteries during the phases of renewable energy production, this module consists of setting up two sub modules: charging and discharging sub modules.
Once the module is in place, electricity will be made available when the supply provided by solar or wind sources is disrupted. It is noteworthy that the EVA, located in the electrical vehicle slice, is responsible for orchestrating the charging or discharging of vehicles connected to the system, contingent upon the energy supplied or required by the VPP. At 15-min intervals (a timeslot), the EVA re-runs the algorithm to determine the next best charging/discharging decision.
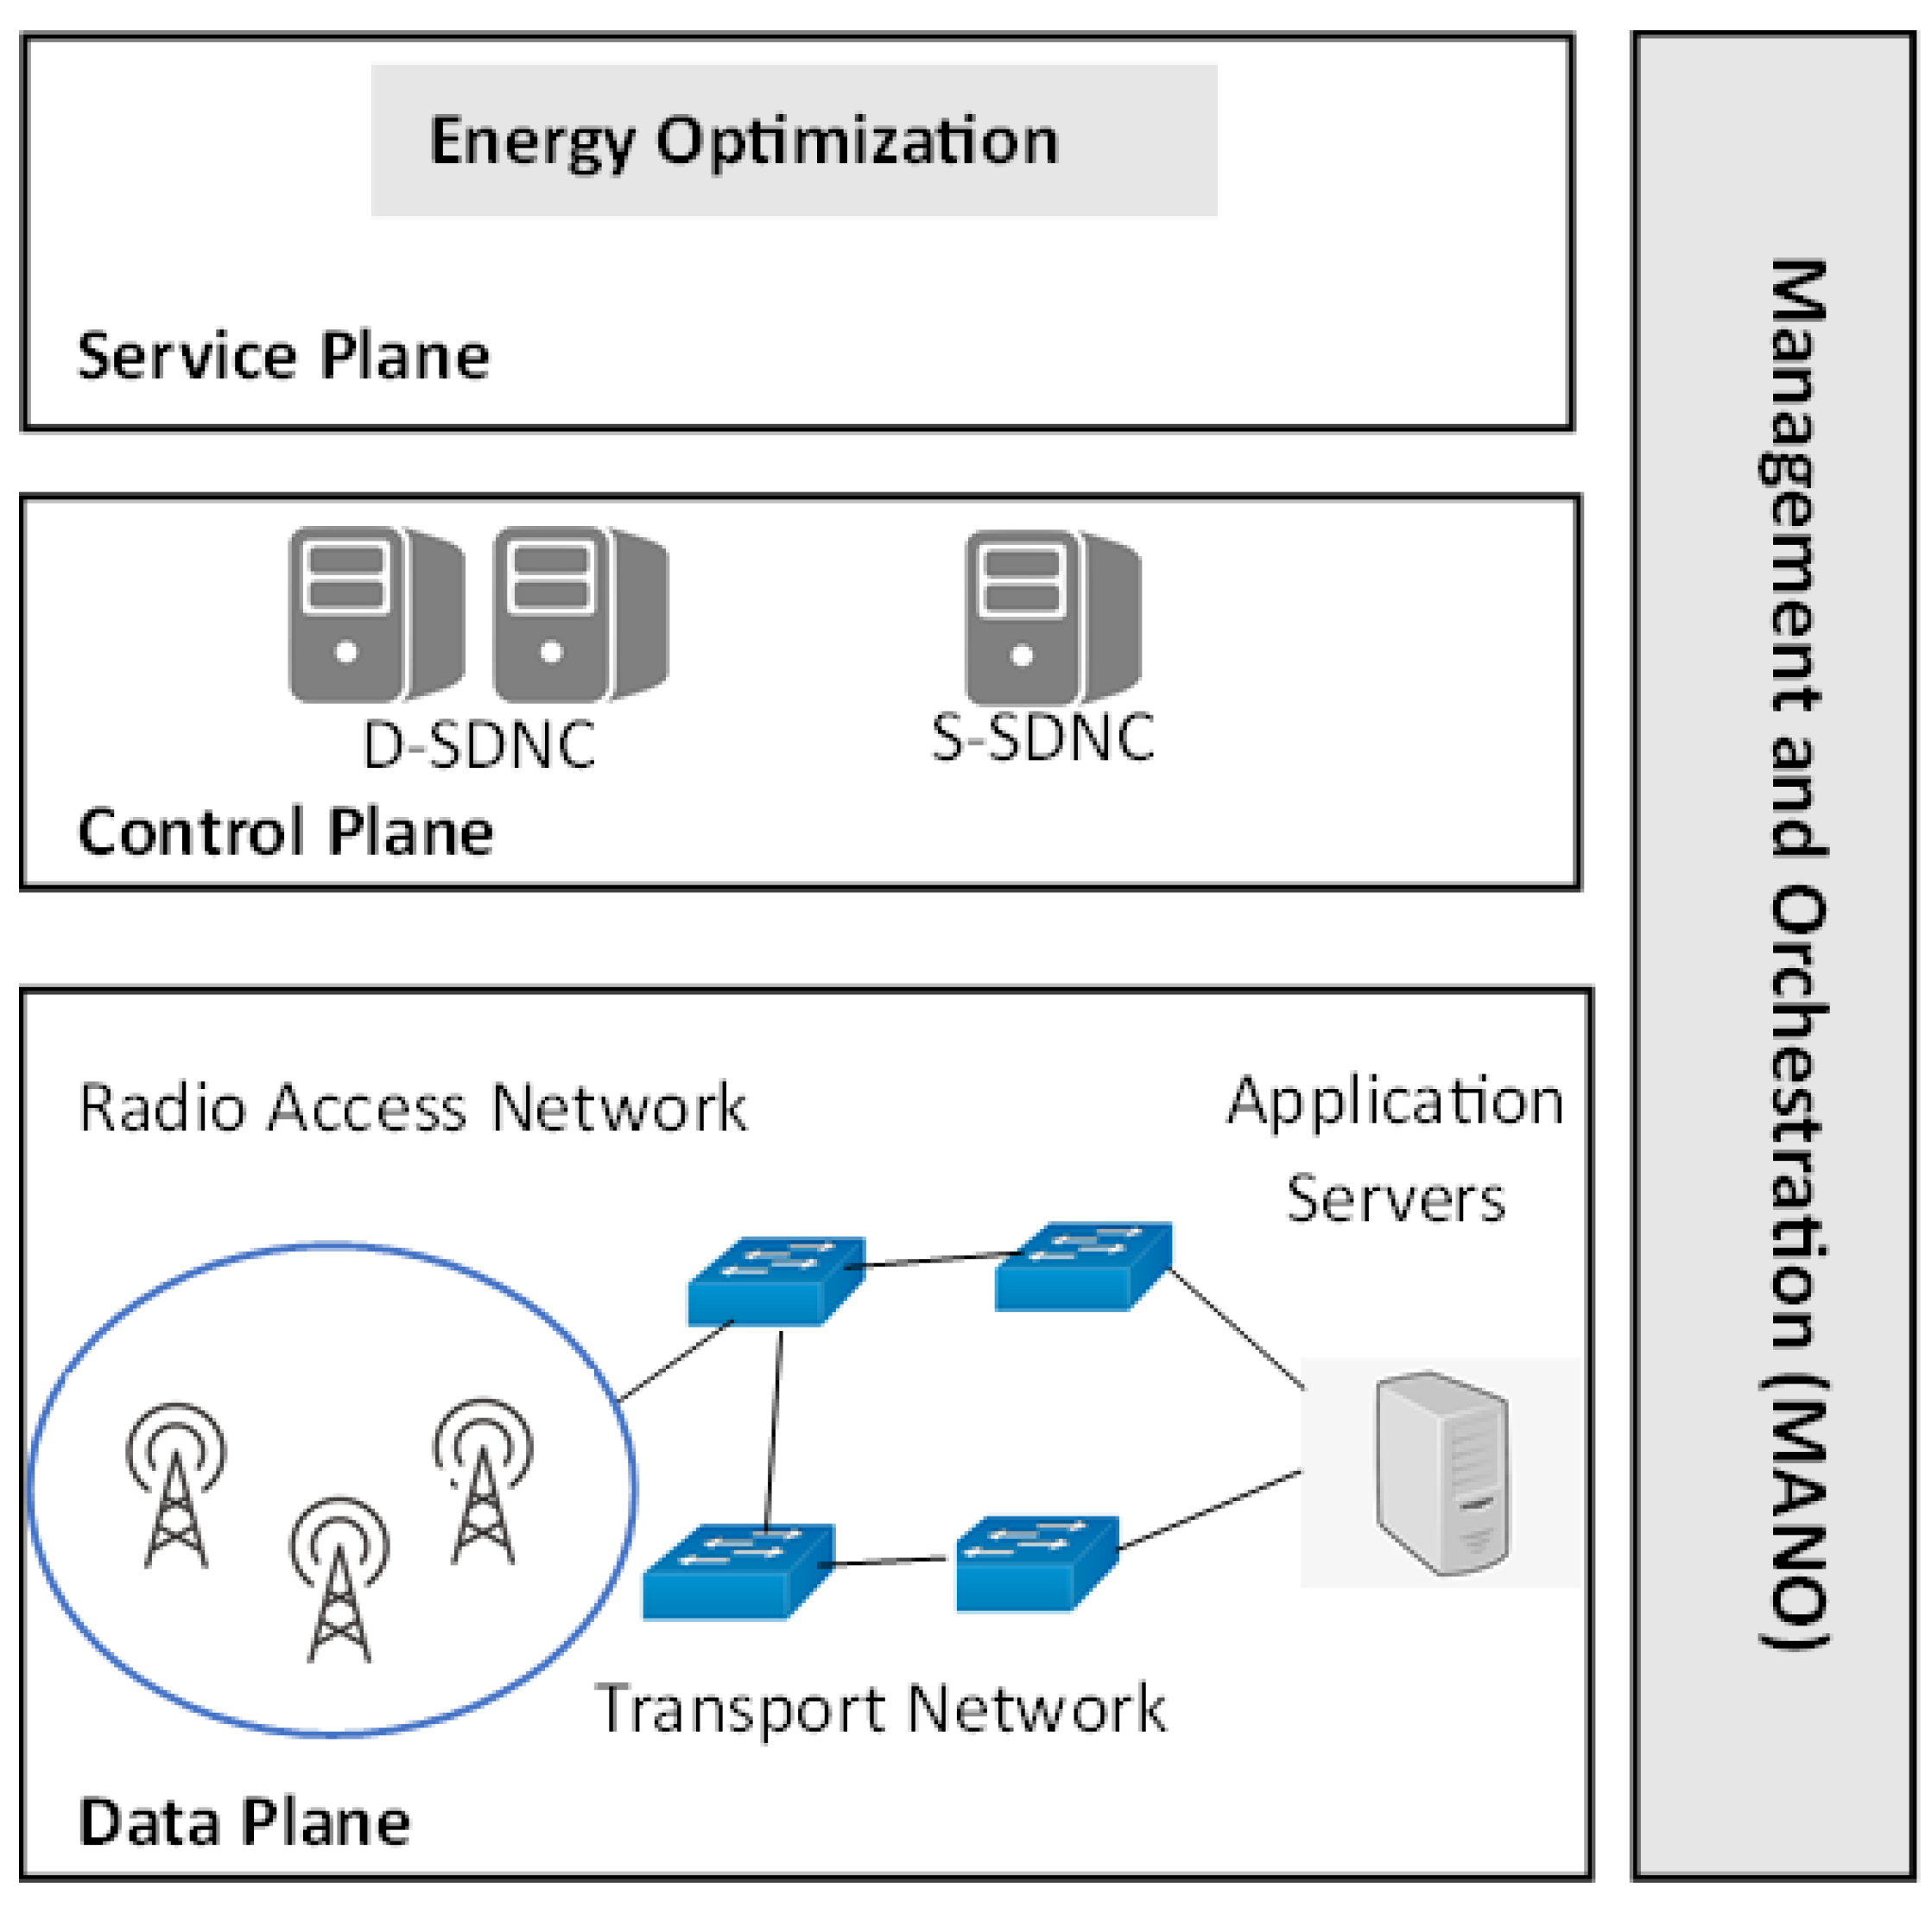
3.3. Network Slicing
According to the slicing concept set forward in the 5G NORMA [32] project and the ETSI logical architecture [33], we implement the slicing architecture exhibited in Figure 3. An infrastructure plane, a control plane, and a service plane make up the latter. We also provide orchestration capabilities for management and orchestration on top of this framework. More information about our recommended architecture planes is provided below:
- Data plane: The infrastructure plane also contains all other physical network infrastructure, including the radio access network and core network. The transport network, storage nodes, computing nodes, and radio access network nodes and devices are all included.
- Control plane: The control plane holds the logical network behaviors that manage a slice. The two main SDN-based control entities that constitute the control plane are D-SDNC and S-SDNC. On top of the S-SDNC, some network functionalities, shared by all accessible slices, are present. Energy management, slice selection, inter-slice mobility management, and load balancing between slices are all considered to be SDN applications. Each slice also has a few unique features that are implemented as D-SDNC programs.The Fifth Generation Public Private Partnership (5G-PPP) [34] identifies three reference slices: enhanced mobile broadband, massive machine type communications, and ultra-reliable low latency communications. Because there are many V2X services, there is no straightforward mapping into the aforementioned reference slices. As a result, new V2X use cases require the creation of dedicated network slices. Slices of the V2X network are shown and developed in articles [35,36]. According to the authors of [37], the adoption of network slicing in V2X can increase the likelihood of producing intelligent and secure traffic. This paper will discuss two use cases: medical care and electrical transportation. It is noteworthy that each slice has particular requirements and quality of service needs.
- Service plane: The services and use cases for each vertical market are represented in the service plane.
- Management and orchestration (MANO) plane: The MANO plane is in charge of slice description, instantiation, and life-cycle management. The MANO plane’s core is an SDN controller called software defined orchestrator. The latter enables resource distribution across the slices of numerous operators.
4. Smart Grid Optimization Energy Scheduling Algorithms
Our proposed smart grid optimization energy scheduling consists of implementing charging and discharging mechanisms at the electrical vehicle aggregator as well as the energy optimization algorithm based on a objective function executed at the VPP. These mechanisms will be detailed in the following subsections.
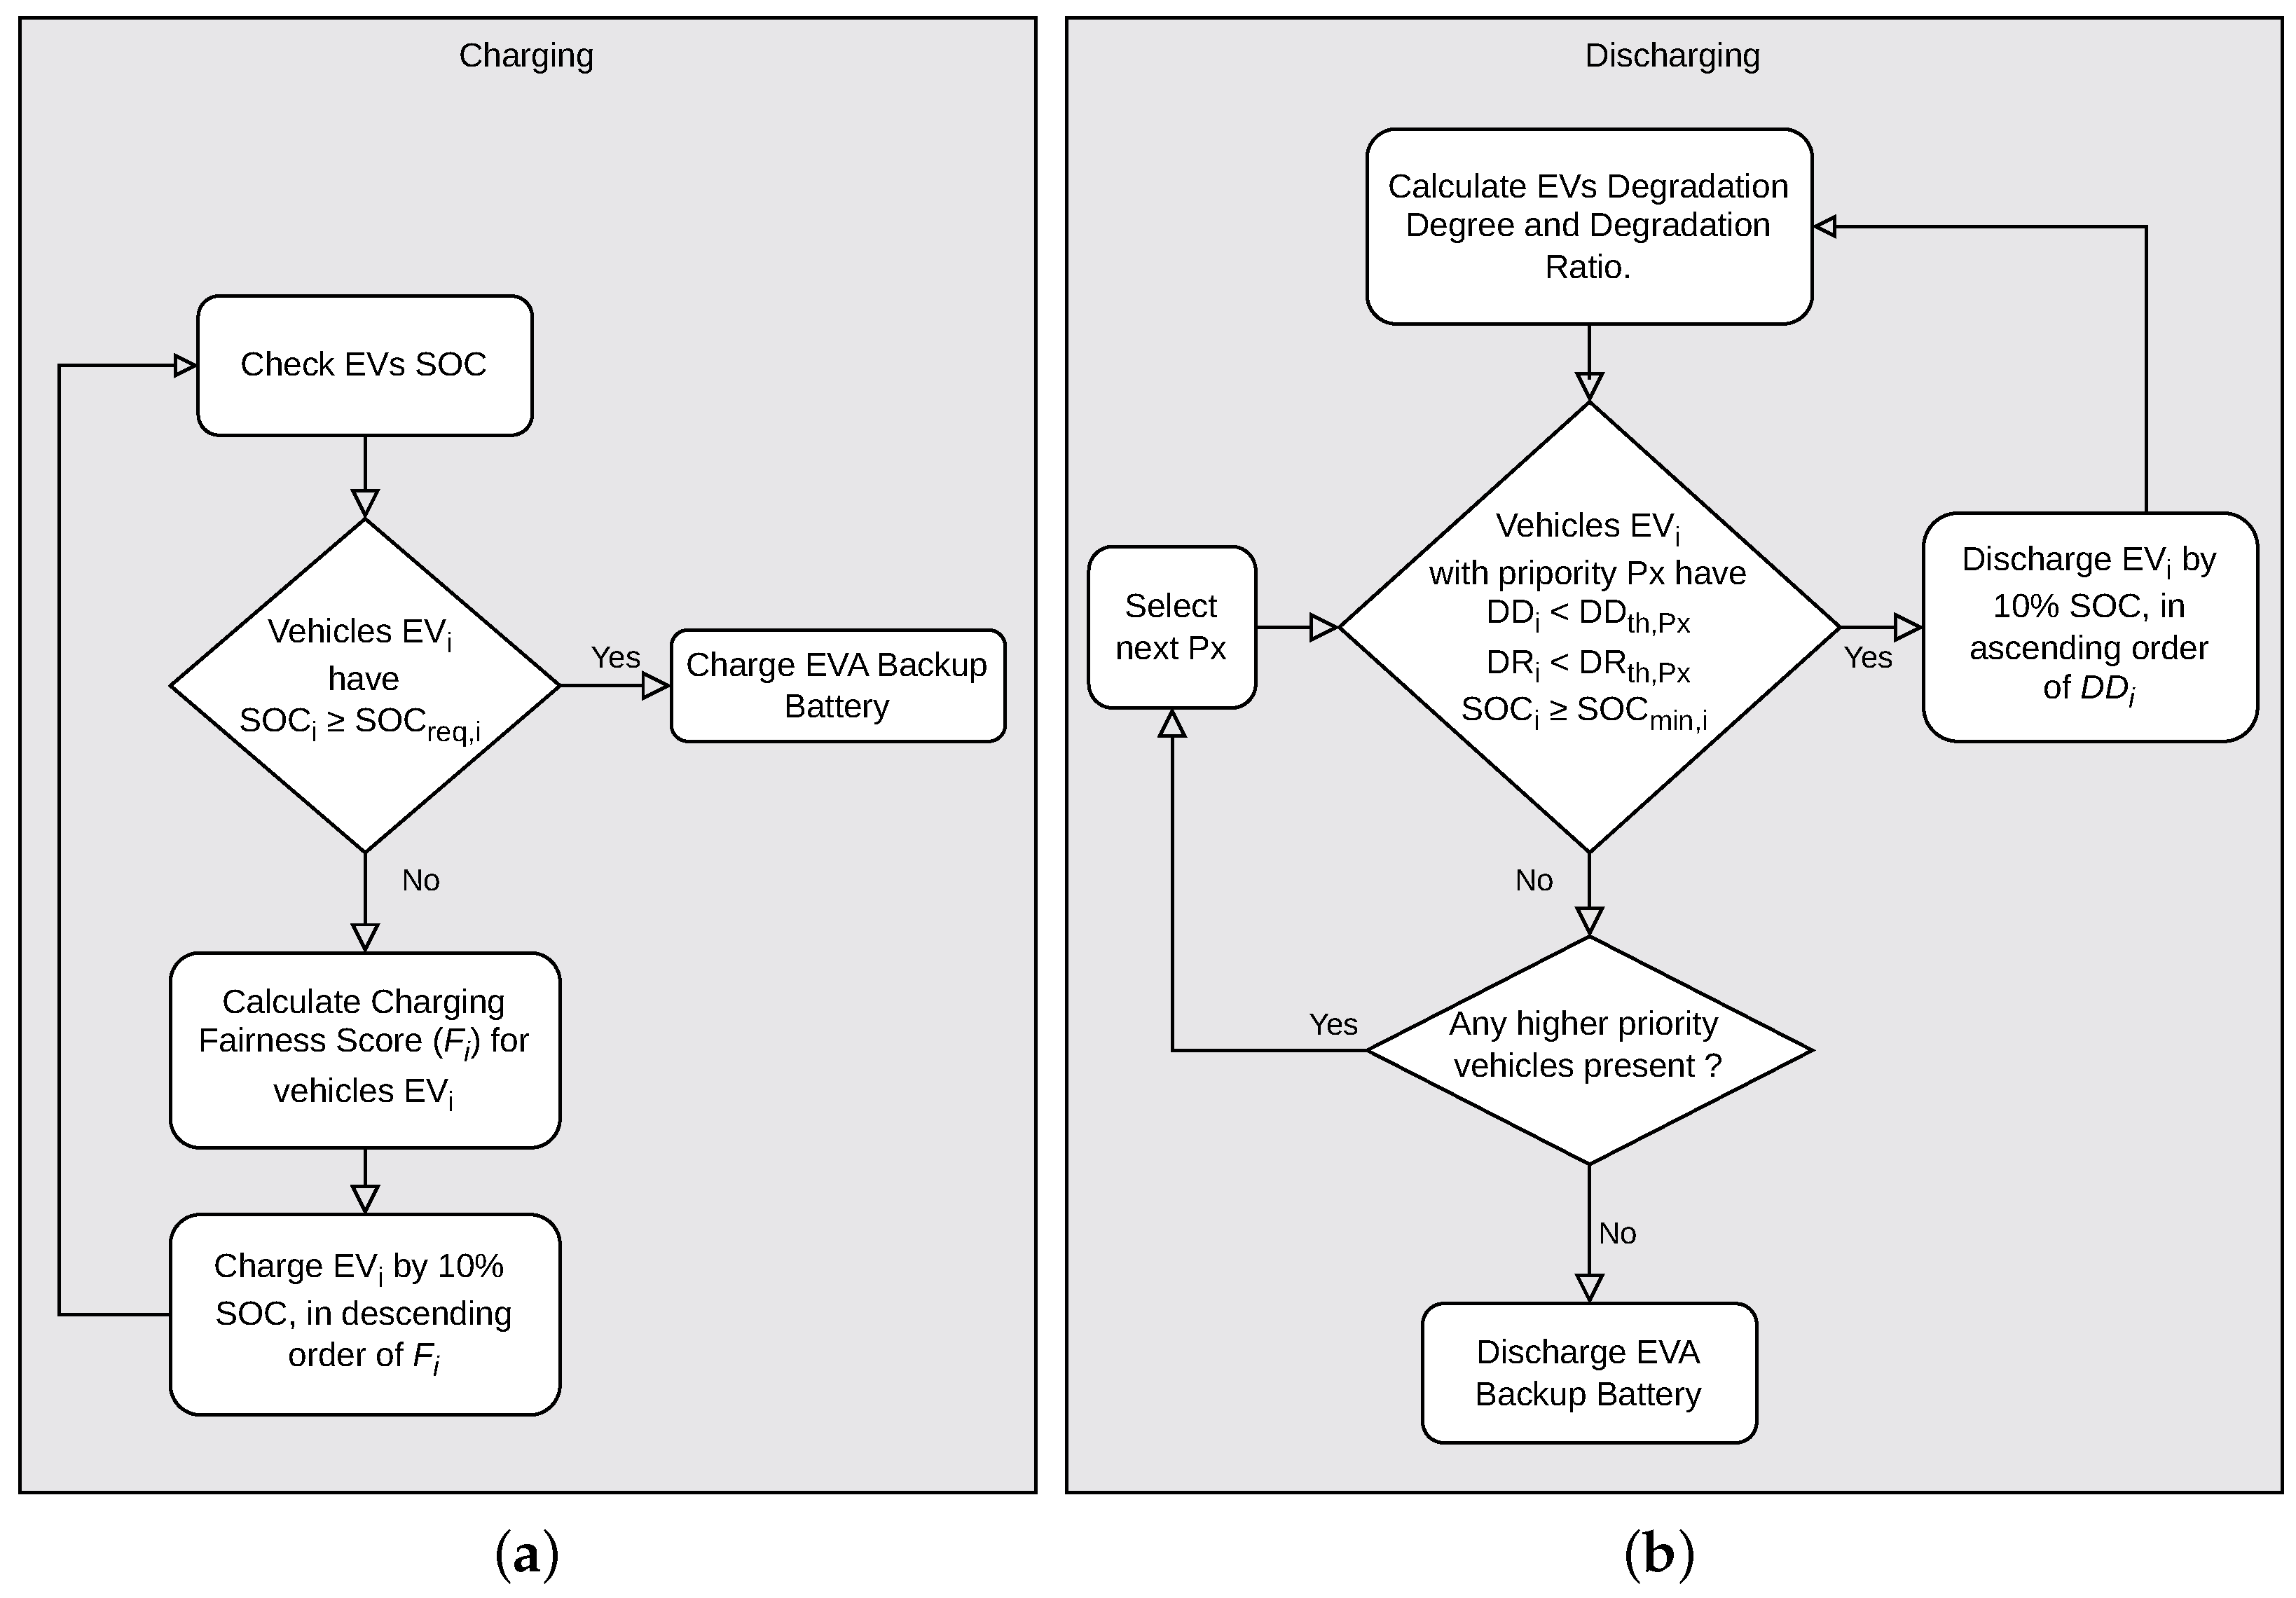
4.1. Electrical Vehicle Charging Algorithm at EVA
Figure 4a shows an overview of the EV charging algorithm. The algorithm starts by evaluating the state of charge (SOC) of each EV’s battery. Only EVs with an SOC below the predefined minimum requirement () are considered eligible for charging. In case all EVs have a SOC greater than , the available power from the smart grid is allocated to charge the EVA’s backup batteries. Nevertheless, if selected EVs require charging, they are scheduled based on a fairness score.
The fairness score () of a vehicle is defined as follows:
where,
- denotes the average time, measured in timeslots, required to charge 1% of SOC during the previous visit of at the charging station.
- is the duration (in sec) of one timeslot.
- indicates the number of timeslots that remained plugged-in during the previous visit.
- is the effective charge of during the previous visit, calculated as the difference between at plug-out time and at plug-in time. When , an arbitrary constant is introduced.
- is the time elapsed (in days) since the previous visit of at the charging station.
- and are coefficients used to prioritize the different factors. These coefficients can be adjusted based on the importance assigned to each factor. In the simulations (see Section 5), we set and , prioritizing the quantity of charge from the previous session over the time elapsed.
The charging algorithm prioritizes EVs by selecting them in descending order of their fairness scores. In the event of a tie in fairness scores, the first come first served principle is applied.
4.2. Electrical Vehicle Discharging Algorithm at EVA
The discharging algorithm, as depicted in Figure 4b, discharges EVs according to predefined priorities while also incorporating a mechanism to minimize battery wear. EVs are grouped based on their priorities (). The vehicles with the lowest priority () are chosen first as potential discharging candidates. To ensure fairness in the discharging process and protect against battery wear, two factors, namely the degradation degree and the degradation ratio, are employed.
Degradation Degree (): This index quantifies the extent to which a vehicle has been deprived of energy during the last charging timeslots. For a vehicle the degradation degree is computed as follows:
where is the required SOC of to limit battery wear. It is randomly set for each vehicle between 75% and 85%. represents the SOC assigned to by the end of the c-th timeslot before the current one. is the minimum SOC that must not go below during discharging. equals 1 when a is true, otherwise 0.
Degradation Ratio (): This index measures the number of occurences that a vehicle has been deprived of energy in the last charging timeslots and is computed as follows:
Only EVs with degradation degrees () and degradation ratios () below predefined thresholds (, and ) for their respective priority groups are eligible for discharging. The eligible EVs are discharged by 10% SOC in ascending order of their degradation degrees. If no vehicles within selected priority group are eligible for discharging, higher-priority vehicles are considered based on their degradation degrees and degradation ratios. If all EVs reached their respective minimum SOC limits during discharging, the required power for the smart grid is sourced from the EVA’s backup batteries.
It is noteworthy that we start by draining the battery from electrical vehicles while ensuring not exceeding the degradation level degree. When we discharge the maximum level of energy from EV battery, we devise to provision loads from the stored energy in the electrical vehicle aggregator and in the VPP storage. Indeed, the EVA and the VPP store excess energy in order to provision loads in extreme situations. This strategy will meet the non-flexible load requirement while protecting vehicles from frequent and abrupt energy degradation.
4.3. Centralized Management Algorithm at the VPP
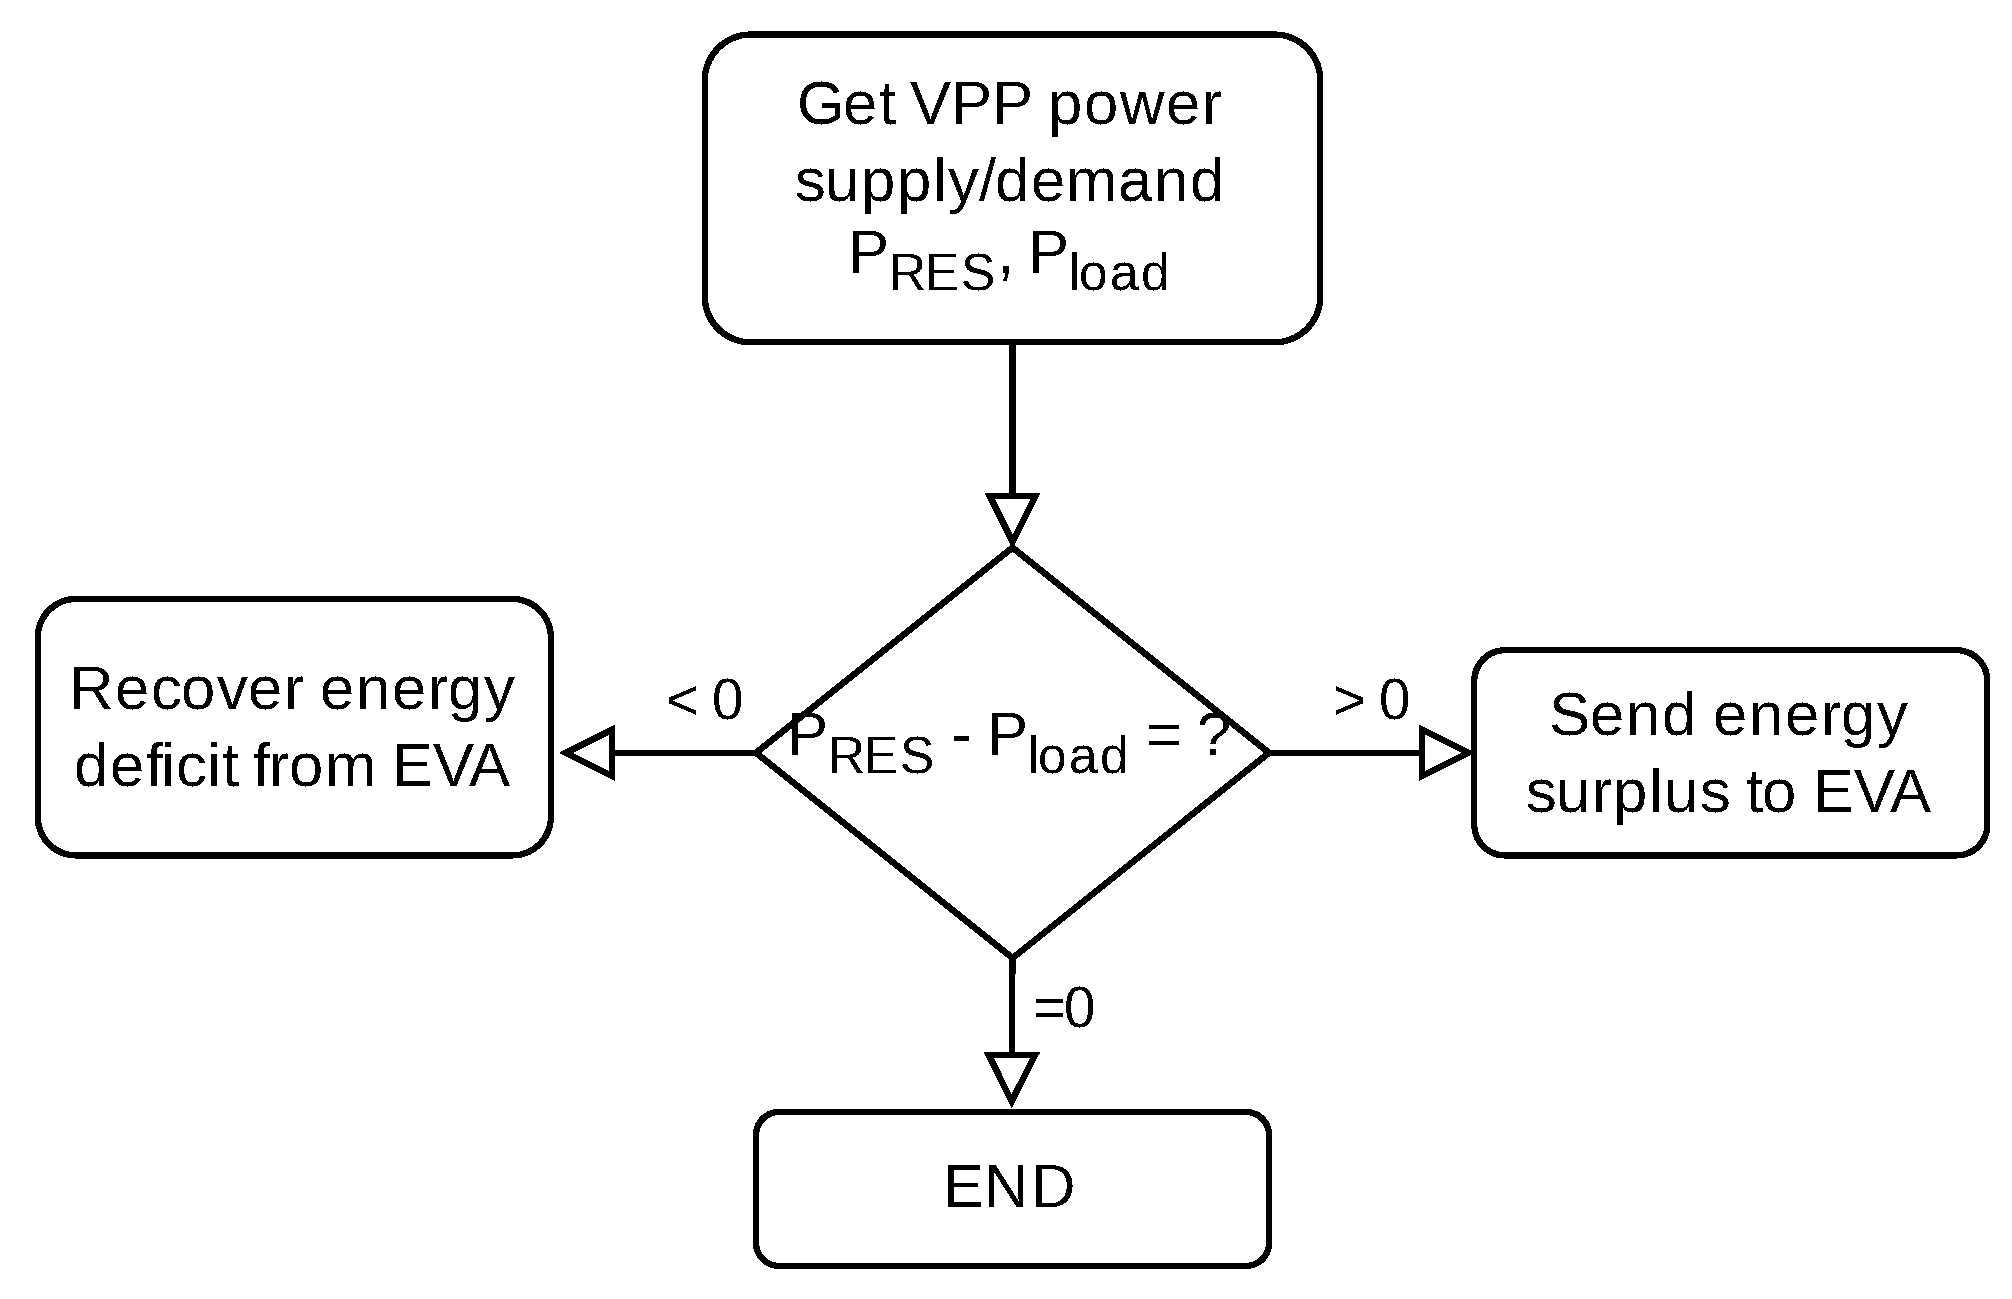
The VPP is responsible for managing energy supply and demand within the smart grid based on the input from connected entities. It considers the input power supply from the RES, the power demand of consumer loads, and the power supply/load of the EVA.
Figure 5 shows the energy management scheme used by the VPP to satisfy the constraints of the connected entities. It follows a periodic decision making process at 15-min intervals. In each cycle, VPP measures the difference between the power supplied by RES and the consumer power demand. When the demand exceeds the supply, the VPP demands power supply from the EVA. On the other hand, when the supply exceeds the demand, the excess power is supplied to the EVA for storage. Note that the EVA can also demand power from VPP to satisfy the EV users need. However, in an effort to alleviate pressure on the smart grid, EV charging is restricted to low-demand hours, aligning with the valley-filling program.
5. Energy Optimization Platform Validation
In this section, our proposed algorithms are evaluated through simulation in a real-world scenario.
5.1. Simulation Scenario
We consider the following assumptions in our scenario:
Renewable energy sources: The energy produced by WT at a specific location is determined by the wind speed at the hub height. The output power of WT at any instant depends on the wind speed (u). The standard power curve attributes of WT are given as:
where is the rated power, is the cut-in speed, is the cut-out speed, and is the rated power.
Similarly, the electrical output from PV panels is determined by solar radiation () and the panel surface area (), and is computed as:
Therefore, the total power supplied by the RES is:
where and are the maximum number of WT and PV panels.
The wind speed and solar radiation parameters used in our scenario are summarized in Table 1.
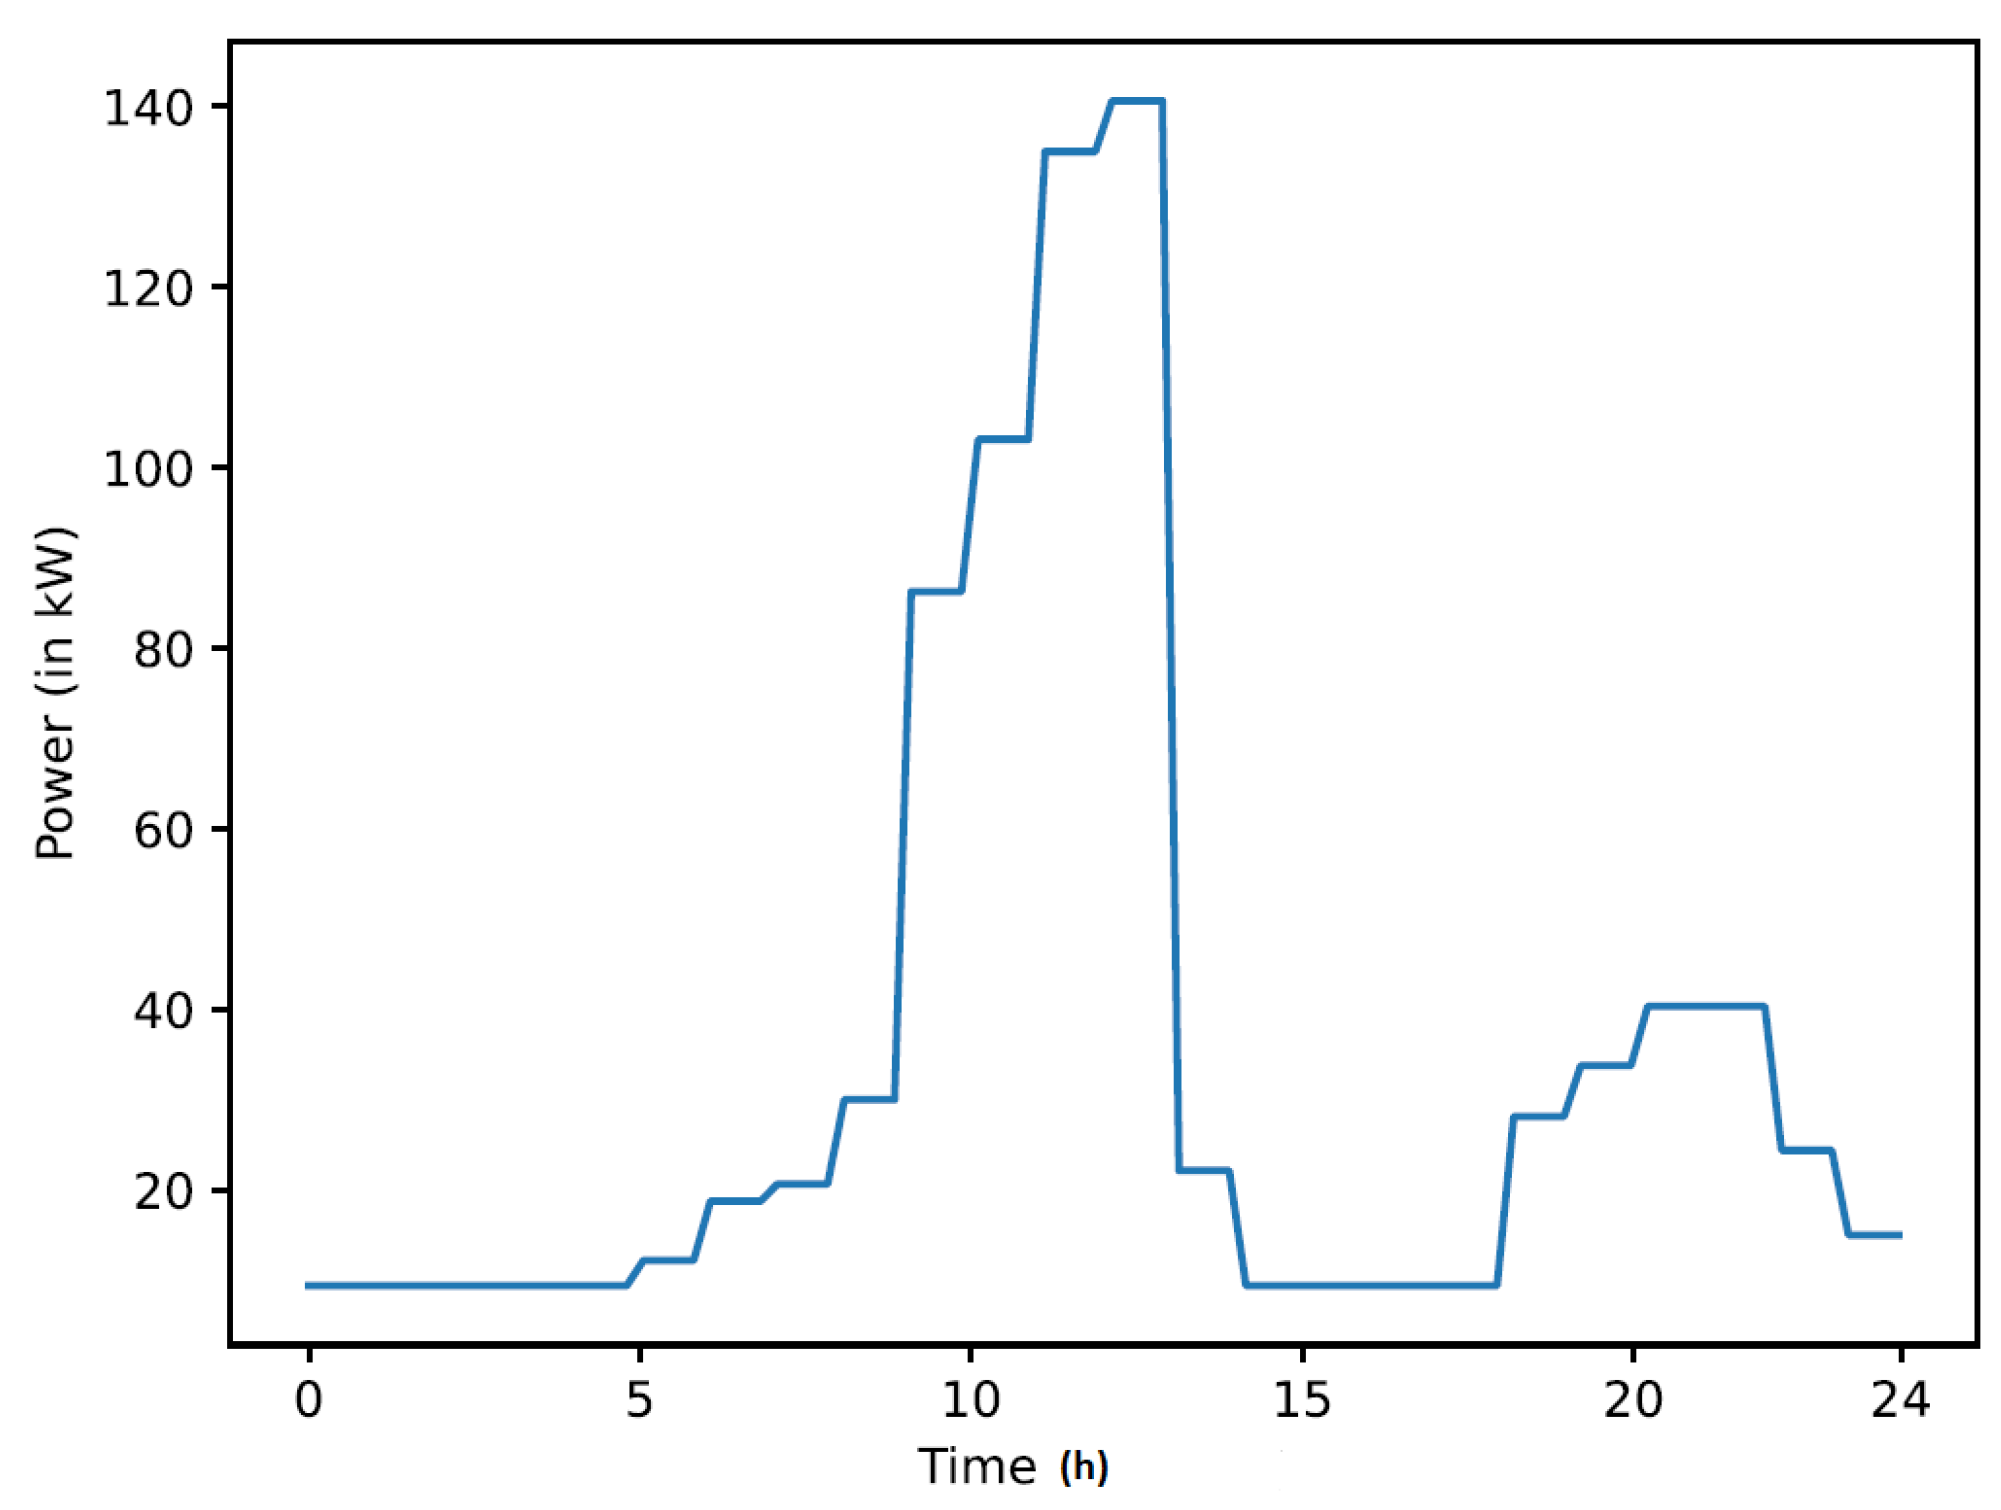
Non-flexible loads: The non-flexible load is represented by a medical clinic, which has stringent power load constraints linked to the medical devices and variable load constraints linked to other equipment. These devices and their characteristics are summarized in Table 2.
The equipment types listed in Table 2 are based on a standard rural medical clinic facility described in [39], and are not essentially intended to operate at the same time, as each device has a specific daily operating routine. The primary load typically takes place during the morning from 9 AM to 1 PM and in the evening from 7 PM to 10 PM. To account for the variability of load variation, a daily random noise of 10% and an hourly random variability of 15% is defined. The load profile can be scaled to suit larger healthcare facilities by introducing a multiplication factor. The power load of the healthcare facility with an arbitrary factor of 38 is shown in Figure 6.
Flexible power loads/supply: We considered battery electric RENAULT ZOE E-Tech vehicles that rely on Lithium-ion batteries with a maximum capacity of 385 of 52 kWh. The vehicles’ characteristics are exhibited in Table 3.
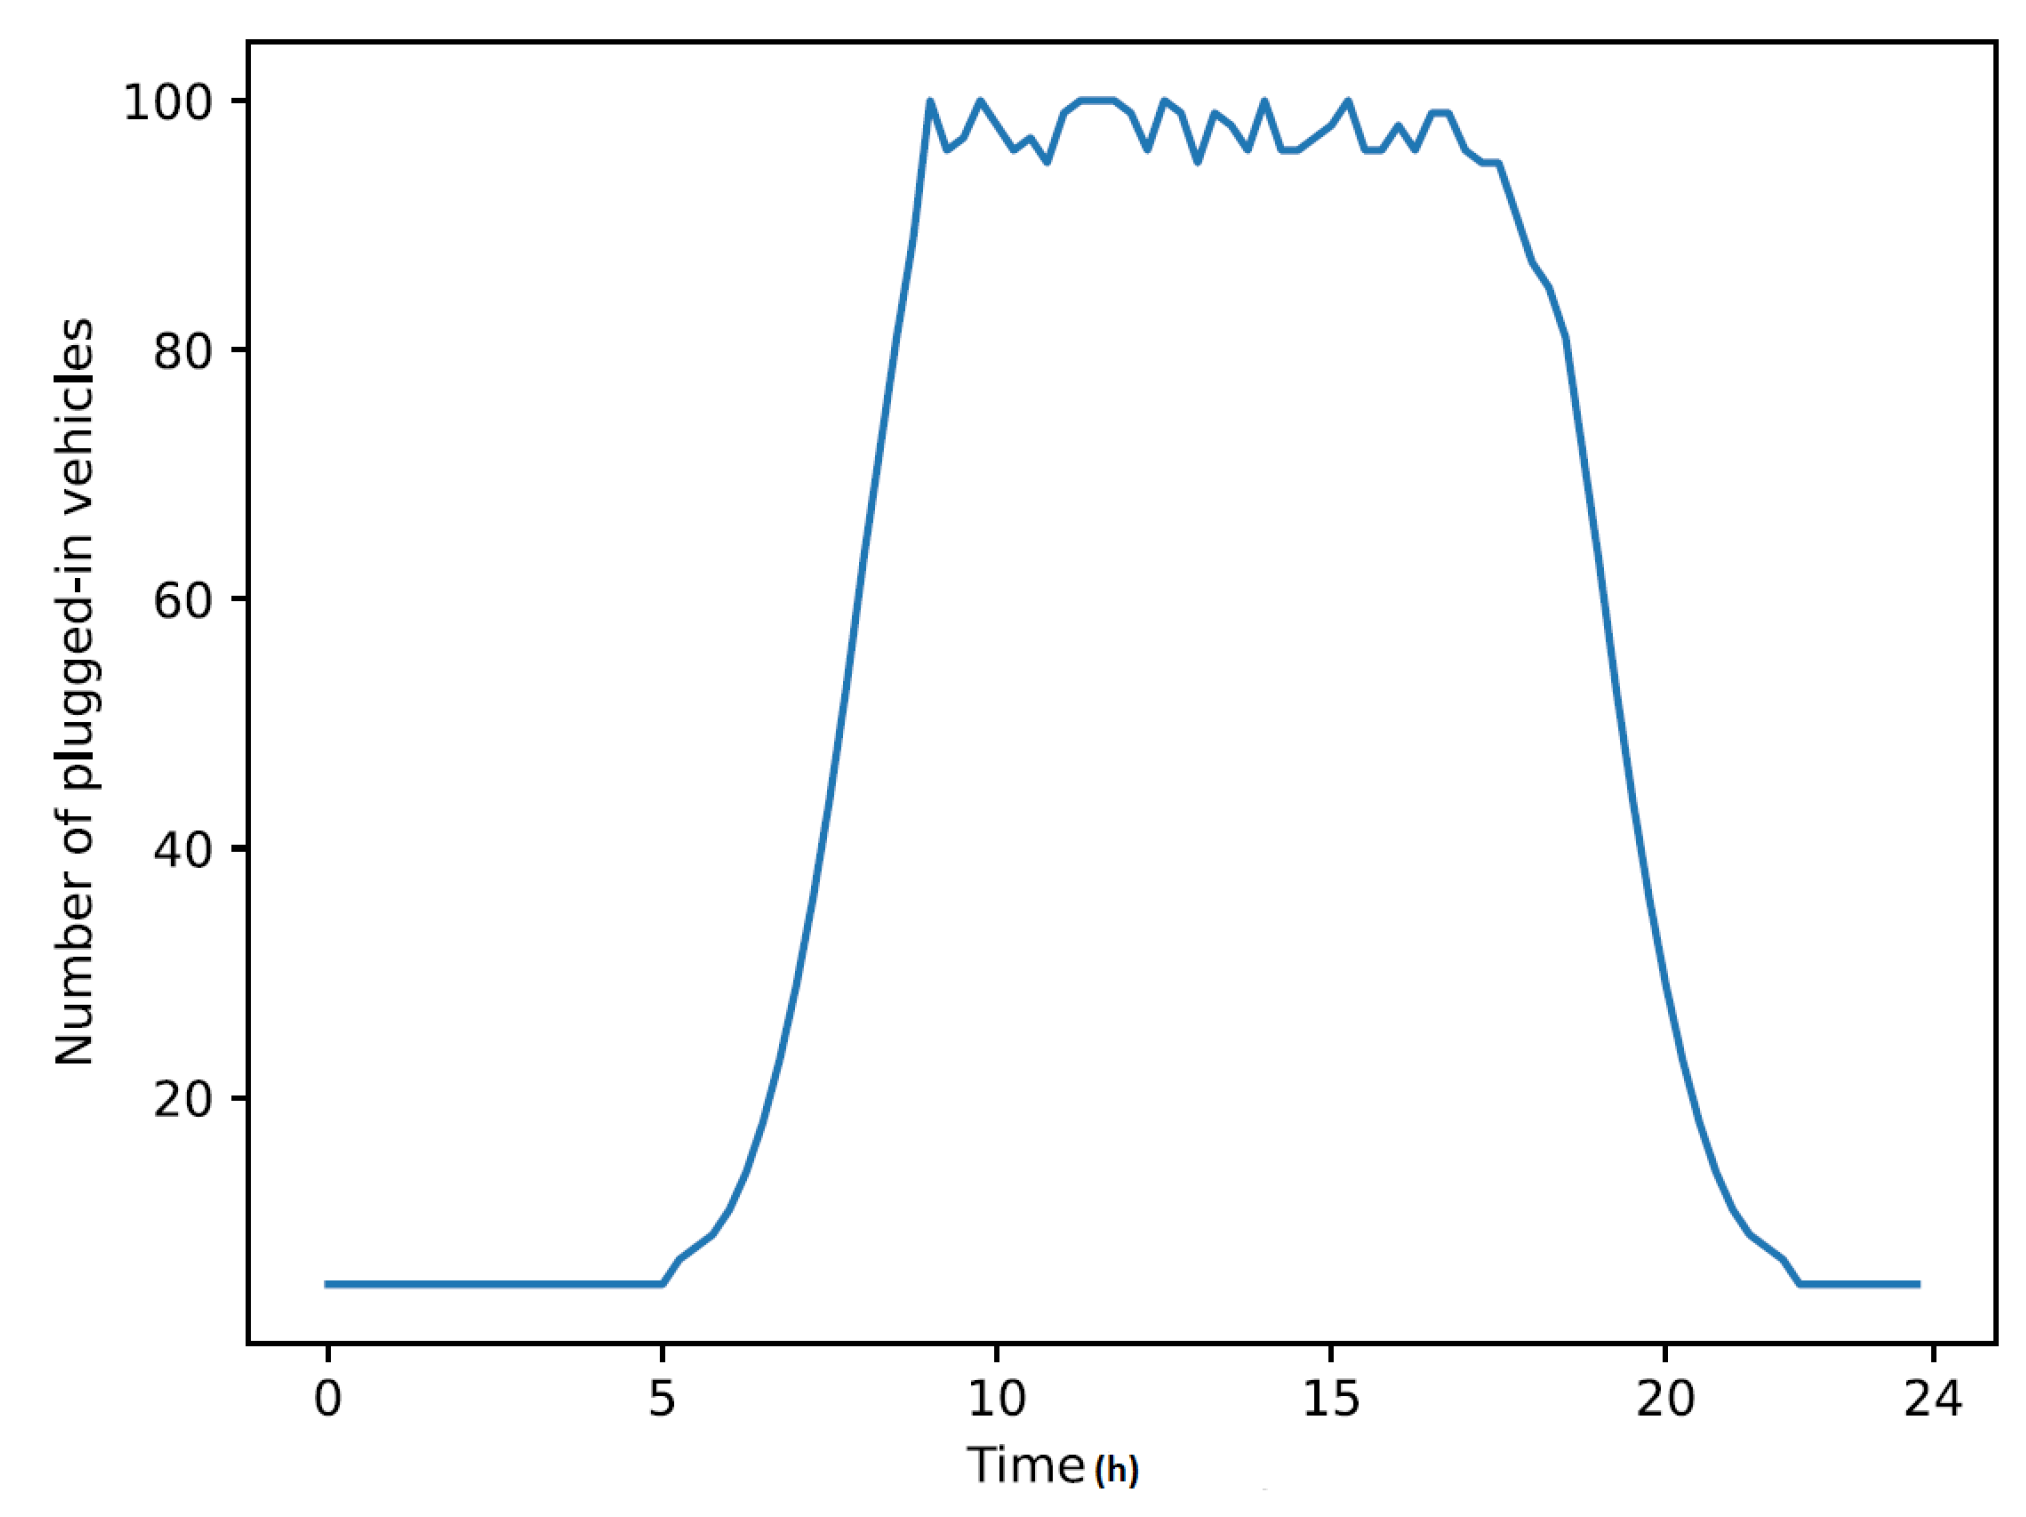
The EVs are considered at the same time as a power source and a power load. Two types of EVs are considered: urgent vehicles and vehicles belonging to employees. The employee vehicles arrive from 5 AM to 9 AM and leave from 5:30 PM to 10 PM. Urgent vehicles do not follow any strict schedule; they randomly leave and arrive between 9 AM to 5:30 PM. The connection of EVs to the smart grid through the V2G terminals in the healthcare facility’s car park is simulated by a normal distribution, depicted in Figure 7, as:
where N is the number of plugged vehicles, , is the standard deviation, h is the time (in hours), and are the mean of the first arrival and last departure, and is the number of urgent vehicles.
The EV charging/discharging time depends on the battery capacity and the charging/discharging power. And the power required to charge or the power generated by discharging a certain percentage of the battery in a given duration is:
The maximum power supplied in 15 min by a battery with a capacity of 52 kWh is kW and a 10% of battery charge can require/supply kWh of energy.
It is noteworthy that our research study considers two types of loads: flexible and non-flexible loads. Nevertheless, it would be interesting to include hybrid loads in our future studies. In this case, when the considered hybrid loads are flexible at some time slots, they will adopt the peak clipping and valley filling programs. Otherwise, when they become non-flexible, they will behave like the medical clinics.
Virtual Power Plant: The VPP is entitled to minimize the power fluctuations on the smart grid, with the help of an objective function defined as:
It is noteworthy that the and cannot be controlled by VPP; thus, the objective function tries to minimize energy fluctuations by providing the RES excess power to EVA and by requesting energy from EVA for loads in case of power deficit.
The constraints imposed by the entities connected to the grid, at any time instant t of the day, are presented by the following (in)equations:
- Constraints related to power supplied by RES:
- Constraints related to charging and discharging power of EV battery:where = 0 when x is false and forbids the charging and discharging at the same time.
- Constraints related to acceptable SOC levels in order to preserve battery life and permit anytime usage of EVs:
- Constraints related to fairness in discharging:
- Smart grid load balance condition:where and are, respectively, the sum of discharging powers and charging powers of eligible EVs. When no EV is eligible for charging/discharging, power is provided/used by EVA storage batteries.
The initial parameter values used in simulation are summarized in Table 4.
5.2. Performance Analysis
To assess our platform’s performance, several performance parameters are measured, including the grid’s available power and EV user satisfaction. The grid’s available power is evaluated by the energy difference between load requirements and energy supplied by RES and EVA. The EV user satisfaction is evaluated in terms of SOC and degradation degree.
5.3. Scenarios
We suggest comparing our native discharging algorithm that discharges the EV batteries, while taking into consideration the priorities of EVs, with a non-priority-based discharging algorithm. The latter discharges the EV batteries without respecting the vehicles’ priorities. Moreover, we elaborated a performance analysis that compares the performance of our priority-based discharging algorithm with a non-priority-based discharging algorithm.
5.4. Smart-Grid Available Power
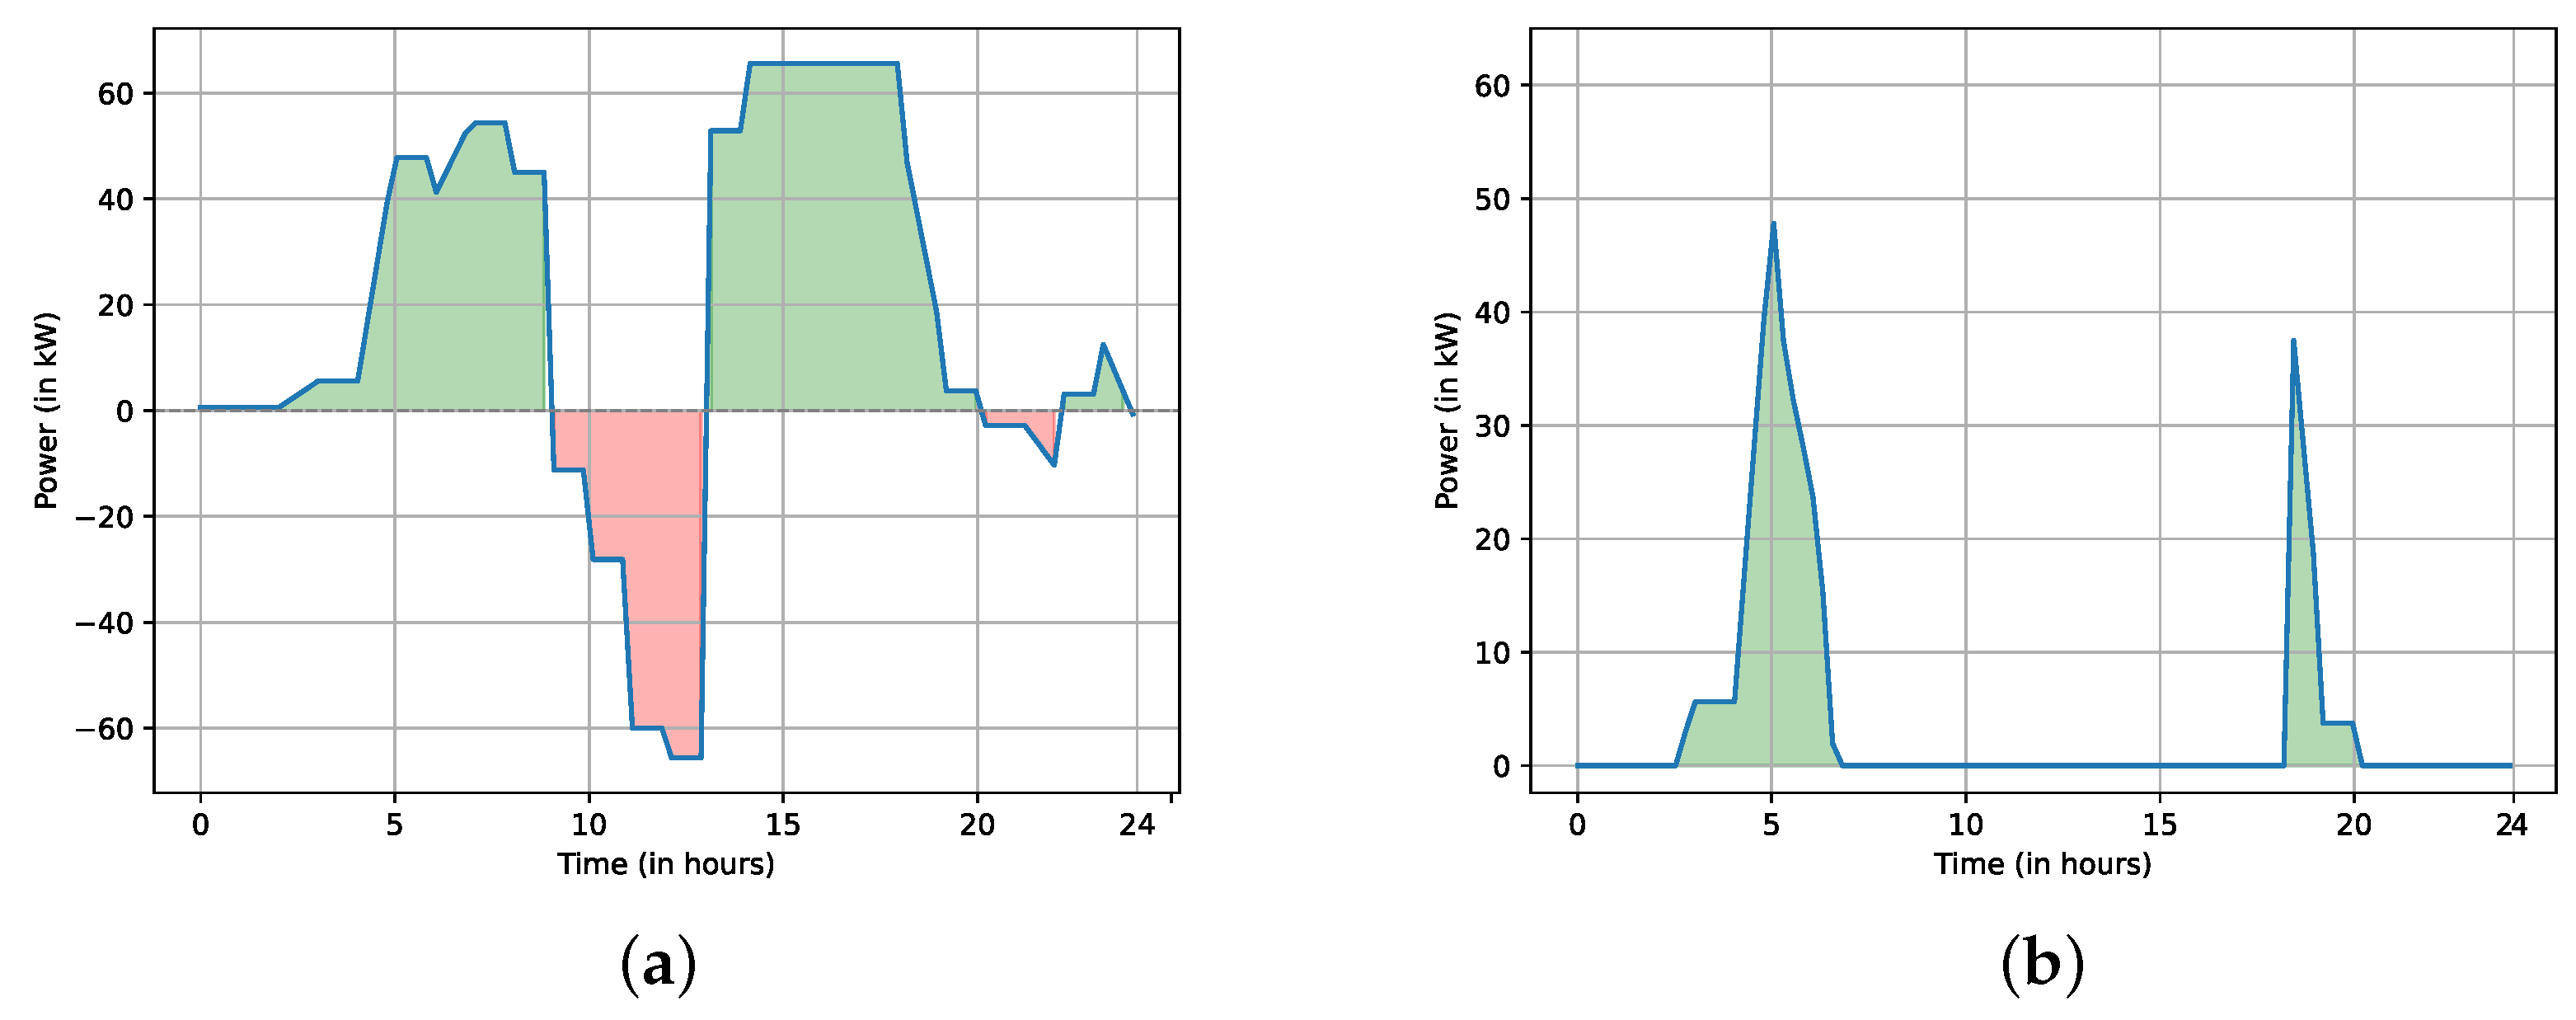
In a first step, we start analyzing smart grid power fluctuations. Figure 8a exhibits these fluctuations observed by VPP, based on difference between the power supplied by RES and power required by the non-flexible loads. Positive (resp. negative) values represent that the RES power supply is larger (resp. lower) than the load requirements.
As mentioned earlier, VPP supplies the excess power to and recovers the power deficit from the EVA. Noticeably, the VPP offers excess power to EVA during night between 10 PM and 9 AM and in the afternoon between 1 PM to 8 PM. Whereas during the peak hours, it demands power from EVA between 9 AM to 1 PM and between 8 PM to 10 PM.
As illustrated in Figure 8b, EVA was able to successfully satisfy the grid requirements by adopting charging and discharging algorithms. It can be observed from Figure 8b, the EVs supply sufficient power to compensate the power deficit on the grid during the peak hours. Moreover, the excess power during off-peak hours was used to restore the EV storage batteries.
5.5. EV User Satisfaction
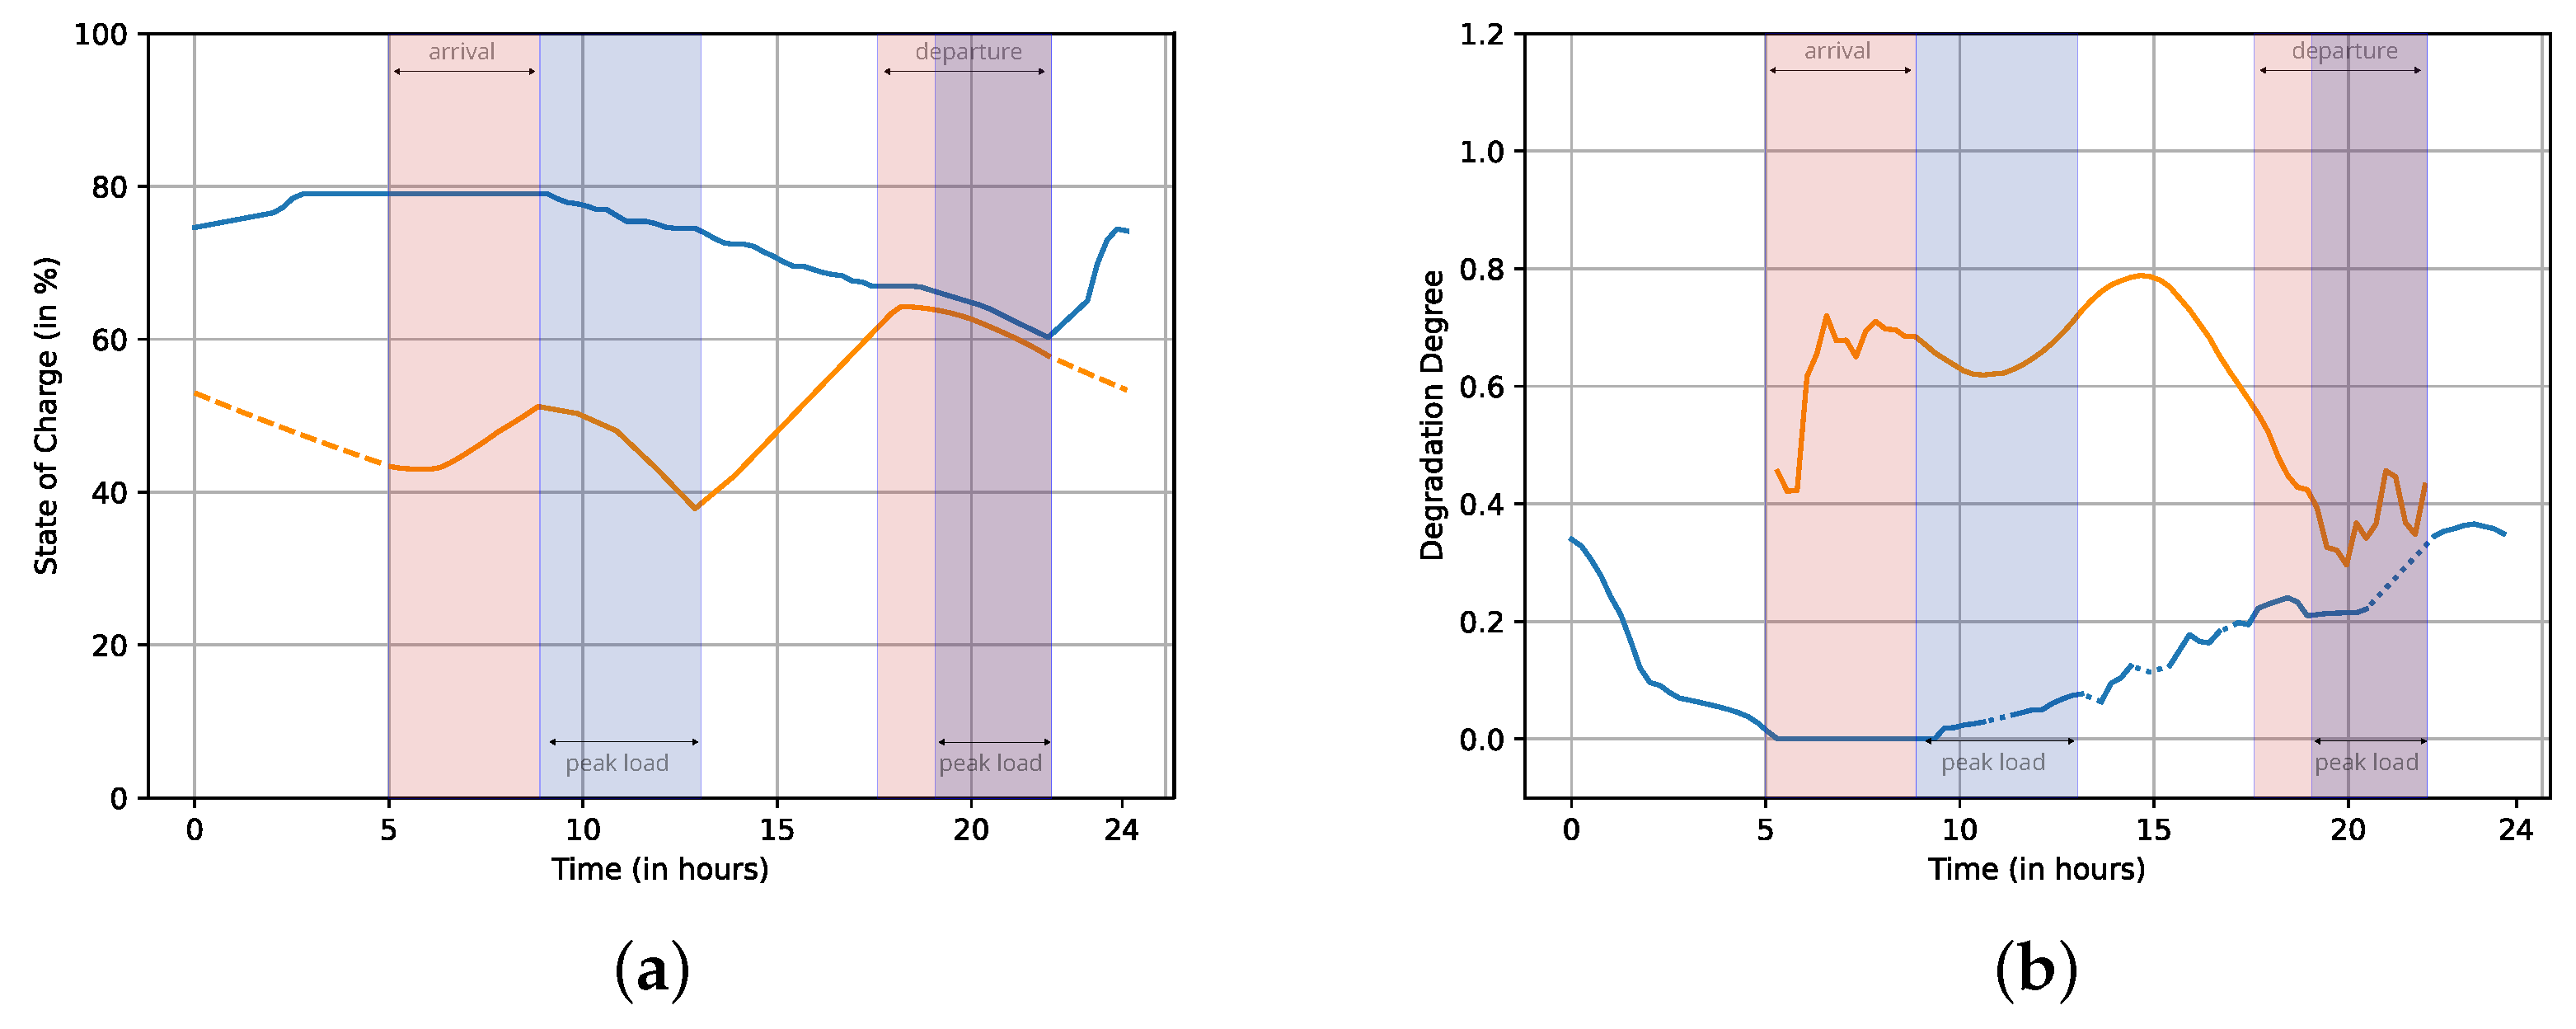
The first metric to measure the EV user satisfaction is the SOC of the EVs. For the discharging algorithm, we consider urgent vehicles with high priority () and employee vehicles with low priority (). Thus, the employee vehicles are preferred over urgent vehicles for discharging. Moreover, the battery wear for each vehicle is randomly set between 20% and 40%. On arrival, the user vehicles have SOC between 30% and 60%. The mean variation of SOC of EVs is shown in Figure 9a. It can be observed that when minimum constraints are satisfied, the discharging process prioritize the employee vehicles for discharging during the peak hours. On the other hand they are scheduled first for charging. Moreover, one can see that before departure their SOC is higher than or equal to that on arrival.
To measure the fairness in terms of charging schedule and amount of energy provided to EVs, an analysis of DD metric is presented in Figure 9b. Recall that the higher value of vehicle’ DD is, the more the drivers frustration will be. It can be observed from Figure 9b that the charging and discharging algorithms allow for bounding the DD of urgent and employee vehicles and limit them to a small value.
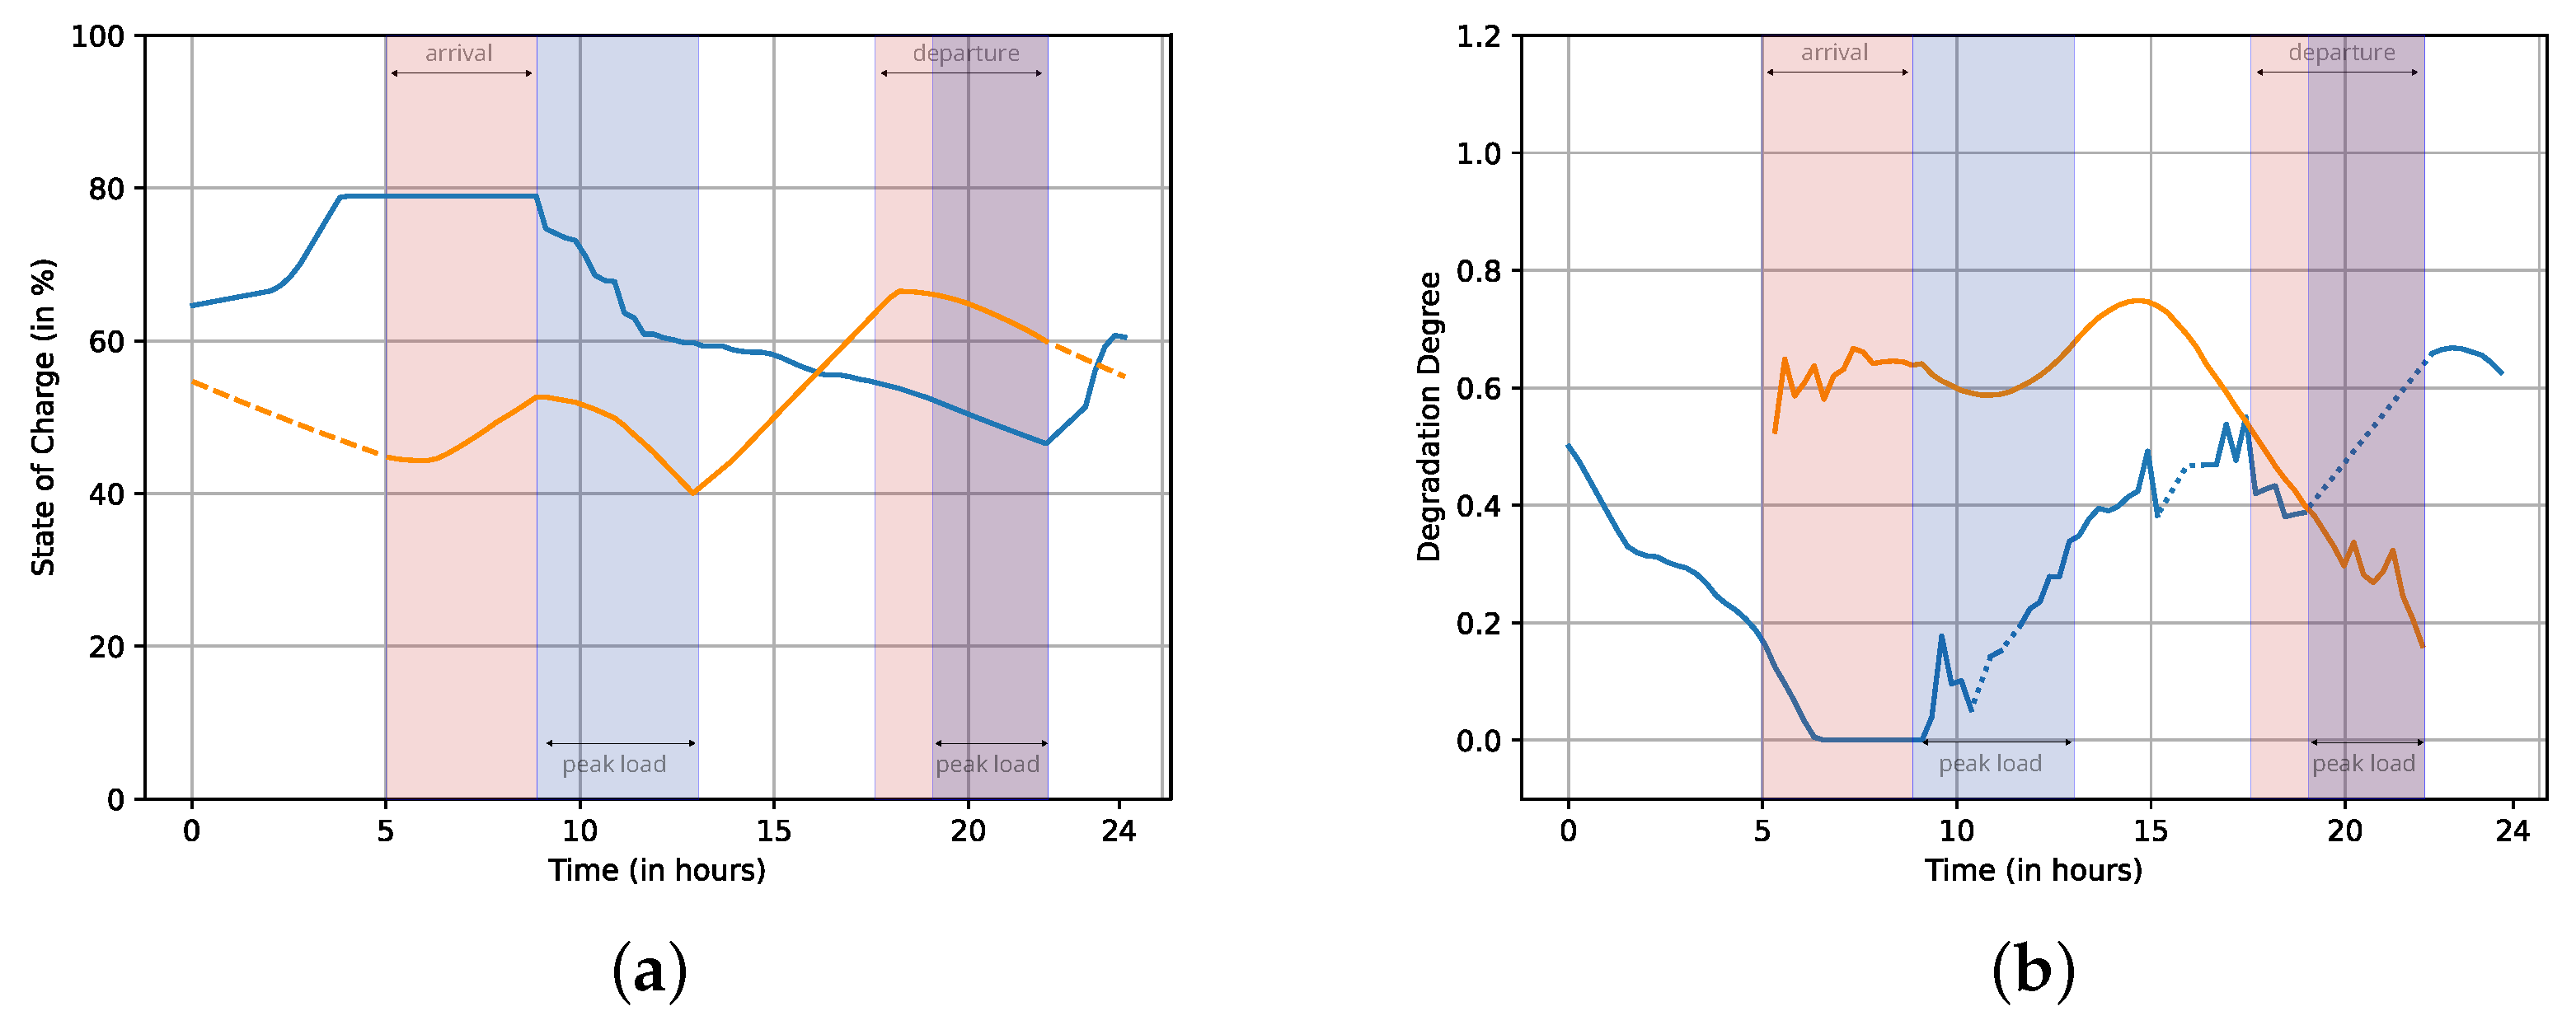
Figure 10 shows a scenario without using our priority based discharging algorithm. The mean variation of SOC of EVs is shown in Figure 10a and an analysis of DD metric is presented in Figure 10b. In this case, all the EVs are considered to have the same priority and they are randomly selected for charging/discharging. As compared to the results obtained using our algorithm in Figure 10, such a scenario reduces the mean SOC for all the EVs and increases the difference between their DDs, representing an overall performance degradation. Consequently, it is obvious that our priority-based charging/discharging algorithm performs service differentiation and protects urgent vehicles from degradation. Moreover, the priority based algorithm succeeds to keep the SOC greater than that of the non-priority based algorithm.
6. Conclusions
This research paper provides a contribution to the development of energy management platform in a 6G-based smart grid that tackles two loads profiles. The platform relies on 6G techniques, namely SDN, VPP, and network slicing. At a second step, we deeply investigated a vehicle-to-grid process that enables us to cope with the smart grid’s lack of energy while achieving fairness in charging and discharging. The latter is achieved through the monitoring of degradation parameters. In order to provide load service differentiation and overcome energy lack problem, we adopted the peak clipping and valley filling techniques to electrical vehicles.
We validated the platform through a detailed simulation and with computed performance parameters. The simulation results demonstrate that our platform supplies power to the smart grid continuously. Moreover, charging and discharging mechanisms are executed fairly while satisfying electrical vehicles requirements.
It is noteworthy that our charging algorithm is based on the fairness score. In fact, we privileged fairness to preemptive real-time charging of high priority levels. From our perspective, we envision customizing EV priorities in order to enable real-time charging when needed or to schedule charging appointments. This priority-based charging algorithm will be compared to the fairness-based algorithm and insightful conclusions will be drawn. Moreover, we intend to integrate machine learning techniques in order to predict energy consumption and meteorological conditions for renewable energy sources.
Author Contributions
Conceptualization, R.N. and A.S.; Software, C.C. All authors have read and agreed to the published version of the manuscript.
Funding
This work was supported by ECE Research laboratory in the framework of the Master thesis of Circe Carletti.
Data Availability Statement
The data presented in this study are available on request from the corresponding author. The data are not publicly available due to privacy.
Conflicts of Interest
The authors declare no conflict of interest.
References
- International Energy Agency IEA. World Energy Outlook. 2023. Available online: www.iea.org/weo (accessed on 1 October 2023).
- Patil, S.; Deshmukh, S.R. Development of Control Strategy to Demonstrate Load Priority System for Demand Response Program. In Proceedings of the IEEE International WIE Conference on Electrical and Computer Engineering (WIECON-ECE), Bangalore, India, 15–16 November 2019; pp. 1–6. [Google Scholar]
- Chekired, D.A.; Khoukhi, L.; Mouftah, H.T. Decentralized cloud-SDN architecture in smart grid: A dynamic pricing model. IEEE Trans. Ind. Inform. 2018, 14, 1220–1231. [Google Scholar] [CrossRef]
- Nafi, N.S.; Ahmed, K.; Datta, M.; Gregory, M.A. A novel software defined wireless sensor network based grid to vehicle load management system. In Proceedings of the 10th International Conference on Signal Processing and Communication Systems (ICSPCS), Surfers Paradise, QLD, Australia, 19–21 December 2016; pp. 1–6. [Google Scholar]
- Zhao, J.; Hammad, E.; Farraj, A.; Kundur, K. Network-Aware QoS Routing for Smart Grids Using Software Defined Networks; Springer International Publishing: Berlin/Heidelberg, Germany, 2016; pp. 384–394. [Google Scholar]
- Dorsch, N.; Kurtz, F.; Girke, F.; Wietfeld, C. Enhanced fast failover for software-defined smart grid communication networks. In Proceedings of the IEEE Global Communications Conference (GLOBECOM), Washington, DC, USA, 4–8 December 2016; pp. 1–6. [Google Scholar]
- Ghosh, U.; Chatterjee, P.; Shetty, S. A security framework for SDNE enabled smart power grids. In Proceedings of the IEEE 37th International Conference on Distributed Computing Systems Workshops (ICDCSW), Atlanta, GA, USA, 5–8 June 2017; pp. 113–118. [Google Scholar]
- Lin, H.; Chen, C.; Wang, J.; Qi, J.; Jin, D.; Kalbarczyk, Z.; Iyer, R.K. Self-healing attack-resilient PMU network for power system operation. IEEE Trans. Smart Grid 2018, 9, 1551–1565. [Google Scholar] [CrossRef]
- Mouawad, N.; Naja, R.; Tohme, S. Inter-slice handover management in a V2X slicing environment using bargaining games. Wirel. Netw. 2020, 26, 3883–3903. [Google Scholar] [CrossRef]
- Seyed Arash, A.; Ali Ahmadian, A.; Aliakbar-Golka, M. Optimal probabilistic energy management in a typical micro-grid based-on robust optimization and point estimate method. J. Energy Convers. Manag. 2015, 95, 314–325. [Google Scholar]
- Alireza, Z.; Jadid, S.; Siano, P. Stochastic multi-objective operational planning of smart distribution systems considering demand response programs. J. Electr. Power Syst. Res. 2014, 111, 156–168. [Google Scholar]
- Al-Sumaiti, A.; Saad, A.; Hassan Ahmed, M.; Rivera, S.; Shawky El Moursi, M.; Salama, M.M.A.; Alsumaiti, T. Stochastic PV model for power system planning applications. J. Iet Renew. Power Gener. 2019, 16, 3168–3179. [Google Scholar] [CrossRef]
- Mehran, M.; Abdollahi, A.; Rashidinejad, M. Possibilistic-probabilistic self-scheduling of PEVAggregator for participation in spinning reserve market considering uncertain DRPs. J. Energy 2020, 196, 108–117. [Google Scholar]
- Masood, P.; Fotuhi-Firuzabad, M. Integrating load reduction into wholesale energy market with application to wind power integration. IEEE Syst. J. 2011, 1, 35–45. [Google Scholar]
- Sheraz, A.; Khalid, A.; Javaid, N. Towards efficient energy management in smart grids considering microgrids with day- ahead energy forecasting. Electr. Power Syst. Res. 2020, 1, 106–232. [Google Scholar]
- Nihan, C.; Delic, H. Demand response management for smart grids with wind power. IEEE Trans. Sustain. Energy 2015, 2, 625–634. [Google Scholar]
- Aghajani, G.R.; Shayanfar, H.A.; Shayeghi, H. Demand side management in a smart micro-grid in the presence of renewable generation and demand response. IEEE Trans. Sustain. Energy 2017, 126, 622–637. [Google Scholar] [CrossRef]
- Aghajani, G.R.; Shayanfar, H.A.; Shayeghi, H. Presenting a multi- objective generation scheduling model for pricing demand response rate in micro-grid energy management. Energy Convers. Manag. 2015, 106, 308–321. [Google Scholar] [CrossRef]
- Gholamreza, A.; Ghadimi, N. Multi-objective energy management in a micro-grid. Energy Rep. 2018, 4, 218–225. [Google Scholar]
- Mohamed, F.A.; Heikki, N.K. System modelling and online optimal management of microgrid using mesh adaptive direct search. Int. Electr. Power Energy Syst. 2010, 5, 398–407. [Google Scholar] [CrossRef]
- Mohamed, F.A.; Heikki, N.K. Multiobjective optimization using Mesh Adaptive Direct Search for power dispatch problem of microgrid. Int. J. Electr. Power Energy Syst. 2012, 1, 728–735. [Google Scholar] [CrossRef]
- Afshar, K.; Shokri Gazafroudi, A. Application of Stochastic Programming to Determine Operating Reserves with Considering Wind and Load Uncertainties. J. Oper. Autom. Power Eng. 2013, 1, 23–30. [Google Scholar]
- Zhang, S.; Leung, K. A Smart Cross-System Framework for Joint Allocation and Scheduling with Vehicle-to-Grid Regulation Service. IEEE Trans. Veh. Technol. 2022, 71, 6019–6031. [Google Scholar] [CrossRef]
- Ahmed, I.; Rehan, M.; Basit, A.; Tufail, M.; Hong, K. A Dynamic Optimal Scheduling Strategy for Multi-Charging Scenarios of Plug-in-Electric Vehicles Over a Smart Grid. IEEE Access 2023, 11, 28992–29008. [Google Scholar] [CrossRef]
- Das, S.; Acharjee, P.; Bhattacharya, A. Charging Scheduling of Electric Vehicle Incorporating Grid-to-Vehicle and Vehicle-to-Grid Technology Considering in Smart Grid. IEEE Trans. Ind. Appl. 2021, 57, 1688–1702. [Google Scholar] [CrossRef]
- Khayyama, H.; Ranjbarzadeha, H.; Maranob, V. Intelligent control of vehicle-to-grid power. J. Power Sources 2011, 201, 1–9. [Google Scholar] [CrossRef]
- Mignoni, N.; Carli, R.; Dotoli, M. Distributed Noncooperative MPC for Energy Scheduling of Charging and Trading Electric Vehicles in Energy Communities. IEEE Trans. Control. Syst. Technol. 2023, 31, 2159–2172. [Google Scholar] [CrossRef]
- Clement-Nyns, K.; Haesen, E.; Driesen, J. The impact of vehicle-to-grid on the distribution grid. Electr. Power Syst. Res. 2011, 81, 185–192. [Google Scholar] [CrossRef]
- Guille, C.; Gross, G. A conceptual framework for the vehicle-to-grid (V2G) implementation. Energy Policy 2009, 37, 437–4390. [Google Scholar] [CrossRef]
- Saber, A.Y.; Venayagamoorthy, G.K. Intelligent unit commitment with vehicle-to-grid—A cost-emission optimization. J. Power Sources 2010, 195, 898–911. [Google Scholar] [CrossRef]
- Naja, R.; Tannous, A.; Moubayed, N.; Mouawad, N. Optimization of Energy Distribution with Demand Response Control In 6G Next Generation Smart Grids. In Proceedings of the EAI/Springer Proc. International Conference on Wireless Internet WICON, Athens, Greece, 15–16 December 2023. [Google Scholar]
- Bessem, S.; Marco, G.; Vasilis, F.; Dirk von, H.; Paul, A. SDN for 5g mobile networks: Norma perspective. In Proceedings of the 11th International Conference on Cognitive Radio Oriented Wireless Networks, CROWNCOM, Grenoble, France, 30 May–1 June 2016. [Google Scholar]
- Ersue, M. ETSI NFV management and orchestration—An overview. In Proceedings of the 88th IETF Meeting, Vancouver, BC, Canada, 3–8 November 2013. [Google Scholar]
- Elayoubi, S.; Maternia, M. 5G-PPP use cases and performance evaluation modeling. 5G PPP White Pap. 2016, 1, 81. [Google Scholar]
- Campolo, C.; Molinaro, A.; Iera, A.; Menichella, F. 5G network slicing for vehicle-to-everything services. Wirel. Commun. 2017, 24, 38–45. [Google Scholar] [CrossRef]
- Khan, H.; Luoto, P.; Bennis, M.; Latva-aho, M. On the application of network slicing for 5G-V2X. In Proceedings of the European Wireless 2018; 24th European Wireless Conference, VDE, Catania, Italy, 2–4 May 2018; pp. 1–6. [Google Scholar]
- Seremet, I.; Causevic, S. Benefits of using 5G network slicing to implement vehicle-to-everything (V2X) technology. In Proceedings of the 18th International Symposium INFOTEHJAHORINA (INFOTEH), Sarajevo, Bosnia and Herzegovina, 20–22 March 2019; pp. 1–6. [Google Scholar]
- Available online: Https://www.windpowercn.com/new-15kw-wind-turbine.asp (accessed on 1 September 2023).
- Olatomiwa, L.; Blanchard, R.; Mekhilef, S.; Akinyele, D. Hybrid renewable energy supply for rural healthcare facilities: An approach to quality healthcare delivery. Sustain. Energy Technol. Assess. 2018, 30, 121–138. [Google Scholar] [CrossRef]
Figure 1.
Proposed research work process.

Figure 2.
Energy management architecture.

Figure 3.
Network slicing logical architecture.

Figure 4.
(a): EV charging algorithm; (b): EV discharging algorithm.

Figure 5.
VPP energy scheduling.

Figure 6.
Load of healthcare facility on smart grid over 24 hours.

Figure 7.
Arrival and departure pattern of EVs.

Figure 8.
(a): Smart-grid power observed by VPP before applying EV charging/discharging algorithms, (b): after applying EV charging/discharging algorithms.
Figure 8.
(a): Smart-grid power observed by VPP before applying EV charging/discharging algorithms, (b): after applying EV charging/discharging algorithms.

Figure 9.
(a): Mean SOC (b): DD variation of urgent EVs (blue curve) and employee EVs (orange curve) over time with priority based charging/discharging. Note: When all the urgent EVs are absent, their DD curve is interpolated by dotted line.
Figure 9.
(a): Mean SOC (b): DD variation of urgent EVs (blue curve) and employee EVs (orange curve) over time with priority based charging/discharging. Note: When all the urgent EVs are absent, their DD curve is interpolated by dotted line.

Figure 10.
(a): Mean SOC (b): DD variation of urgent EVs (blue curve) and employee EVs (orange curve) over time without fair charging/discharging. Note: When all the urgent EVs are absent, their DD curve is interpolated by dotted line.
Figure 10.
(a): Mean SOC (b): DD variation of urgent EVs (blue curve) and employee EVs (orange curve) over time without fair charging/discharging. Note: When all the urgent EVs are absent, their DD curve is interpolated by dotted line.


Table 1.
WT and PV parameter values over 24 h. The WT parameters are obtained from [38] and PV parameters from Microsoft Windows weather application.
Table 1.
WT and PV parameter values over 24 h. The WT parameters are obtained from [38] and PV parameters from Microsoft Windows weather application.
| Hour | 1 | 2 | 3 | 4 | 5 | 6 | 7 | 8 | 9 | 10 | 11 | 12 |
| u (m/s) | 6 | 6 | 6 | 7 | 7 | 8 | 8 | 12 | 13 | 15 | 19 | 19 |
| SI (w/m) | 0 | 0 | 0 | 0 | 0 | 57 | 254 | 446 | 621 | 766 | 89 | 971 |
| Hour | 13 | 14 | 15 | 16 | 17 | 18 | 19 | 20 | 21 | 22 | 23 | 24 |
| u (m/s) | 21 | 22 | 19 | 18 | 17 | 15 | 12 | 11 | 10 | 10 | 9 | 9 |
| SI (w/m) | 912 | 885 | 803 | 676 | 510 | 322 | 126 | 0 | 0 | 0 | 0 | 0 |
Table 2.
Estimated energy requirement and load description per day.
| Device Description | Quantity | Rated Power (W) | Total Power (W) | Total On-Time (h) | Total Energy (kWh) |
|---|---|---|---|---|---|
| Indoor Lighting | 8 | 15 | 120 | 8 | 0.96 |
| Outdoor Lighting | 6 | 40 | 240 | 12 | 2.88 |
| Ventilator | 7 | 60 | 420 | 8 | 3.36 |
| Blood bank refrigerator | 1 | 70 | 70 | 18 | 1.26 |
| Vaccine Refrigerator | 1 | 60 | 60 | 18 | 1.08 |
| Utility Refrigerator | 1 | 300 | 300 | 10 | 3.00 |
| Centrifuge | 1 | 242 | 242 | 3 | 0.73 |
| Microscope | 2 | 20 | 40 | 6 | 0.24 |
| Hematology Mixer | 1 | 28 | 28 | 4 | 0.11 |
| Hematology Analyzer | 1 | 230 | 230 | 4 | 0.92 |
| Lab Autoclave | 1 | 1500 | 1500 | 2 | 3.00 |
| Incubator | 1 | 400 | 400 | 5 | 2.00 |
| Oxygen Concentrator | 1 | 270 | 270 | 2 | 0.54 |
| Ultrasound machine | 1 | 800 | 800 | 2 | 1.60 |
| Vacuum Aspirator | 1 | 40 | 40 | 2 | 0.08 |
| Suction Apparatus | 1 | 100 | 100 | 2 | 0.20 |
| Desktop Computer | 1 | 150 | 150 | 5 | 0.75 |
| TV | 1 | 80 | 80 | 6 | 0.48 |
| Mobile Charger | 4 | 20 | 80 | 6 | 0.48 |
| VHF Radio Receiver | 1 | 30 | 30 | 4 | 0.12 |
Table 3.
Battery electric vehicle characteristics.
| Feature | Details |
|---|---|
| Battery Type | Lithium-ion |
| Battery Capacity | 52 kWh |
| Charging Time | Fast charge Approx. 1 h 30 min at 50 kW, |
| (0–100 percent) | Regular charge Approx. 9 h 30 min at 7.4 kW |
| Life Cycle Estimated | around 3000 cycles |
| Reversible Energy | Yes: V2G compatible |
Disclaimer/Publisher’s Note: The statements, opinions and data contained in all publications are solely those of the individual author(s) and contributor(s) and not of MDPI and/or the editor(s). MDPI and/or the editor(s) disclaim responsibility for any injury to people or property resulting from any ideas, methods, instructions or products referred to in the content. |
© 2023 by the authors. Licensee MDPI, Basel, Switzerland. This article is an open access article distributed under the terms and conditions of the Creative Commons Attribution (CC BY) license (https://creativecommons.org/licenses/by/4.0/).
Share and Cite
MDPI and ACS Style
Naja, R.; Soni, A.; Carletti, C. Electric Vehicles Energy Management for Vehicle-to-Grid 6G-Based Smart Grid Networks. J. Sens. Actuator Netw. 2023, 12, 79. https://doi.org/10.3390/jsan12060079
AMA Style
Naja R, Soni A, Carletti C. Electric Vehicles Energy Management for Vehicle-to-Grid 6G-Based Smart Grid Networks. Journal of Sensor and Actuator Networks. 2023; 12(6):79. https://doi.org/10.3390/jsan12060079
Chicago/Turabian StyleNaja, Rola, Aakash Soni, and Circe Carletti. 2023. "Electric Vehicles Energy Management for Vehicle-to-Grid 6G-Based Smart Grid Networks" Journal of Sensor and Actuator Networks 12, no. 6: 79. https://doi.org/10.3390/jsan12060079
Note that from the first issue of 2016, this journal uses article numbers instead of page numbers. See further details here.