
Effects of R&D Investments and Market Signals on International Acquisitions: Evidence from IPO Firms


1
Department of International Business, College of Management, National Taiwan University, Taipei City 10617, Taiwan
2
Leeds School of Business, University of Colorado, Boulder, CO 80309, USA
*
Author to whom correspondence should be addressed.
J. Risk Financial Manag. 2021, 14(5), 191; https://doi.org/10.3390/jrfm14050191
Submission received: 1 February 2021
/
Revised: 12 April 2021
/
Accepted: 19 April 2021
/
Published: 22 April 2021
(This article belongs to the Special Issue Corporate Governance and Its Impact on Accounting and Finance)
Abstract
:We investigate how intangible assets in the form of R&D influence firms’ hazards of engaging in international acquisitions. On the one hand, previous research has noted that the tacit and redeployable nature of R&D investments may prompt firms to expand their operations overseas and create value from international acquisitions. On the other hand, it is difficult for other firms to evaluate the quality and prospects of an acquirer’s intangible resources, thereby hampering its ability to finance and execute international M&A deals. In the context of international acquisitions undertaken by firms just completing their initial public offerings (IPOs), we argue and find that the IPO firm’s engagement in post-IPO international acquisition activity is generally negatively related to its R&D intensity. This effect contrasts previous arguments on the internalization advantages possessed by R&D-intensive firms. We also argue that firms able to convey their resources and prospects through such signals as previous international alliances and foreign sales can mitigate information problems presented by their intangibles, and thus carry out and benefit from cross-border acquisitions. We therefore identify an unexamined tradeoff that R&D investments present in the international M&A context and discuss how international signals can facilitate cross-border transactions subject to various market frictions.
1. Introduction
Firms can enhance their competitiveness and organizational growth by leveraging or accessing intangible resources internationally (e.g., Pearce 1993; Bresman et al. 1999; Hitt et al. 2006). In particular, intangibles taking the form of research and development (R&D) and innovation activities are recognized to be especially critical to a firm’s international expansion, because any costs related to R&D have already been incurred and such resources can be transferred across various markets (e.g., Kotabe 1990; Delios and Beamish 1999; Caves 2007). Supporting this proposition, empirical evidence demonstrates that a firm’s cross-border operations are positively associated with investment opportunities arising from the firm’s endowment of intangibles such as R&D (e.g., Fiegenbaum et al. 1997; Delios and Beamish 1999; Hitt et al. 2006; Filatotchev and Piesse 2009; Frésard et al. 2017). And much of the recent M&A literature on intangible assets has focused on their effects on innovation outcomes (e.g., Bena and Li 2014; Chen et al. 2014; Stiebale 2016; Hsu et al. 2021). Substantial research therefore identifies the many benefits that investments in R&D can yield to firms. Despite these important findings, studies have rarely examined and discussed whether or how intangibles might also become an impediment to a firm’s internationalization, at least under certain conditions.
On the one hand, intangible resources have been shown to have a positive impact on a firm’s international market entry through acquisitions. When internationally transferring intangibles such as R&D through contractual agreements, firms may fail to capture the full benefits from their R&D investments, as their partners may misuse the technologies that were transferred to them for their own interests (e.g., Teece 1986; Gatignon and Anderson 1988). Because of misappropriation problems and the difficulties of monitoring and enforcing contracts, R&D intensive firms internalize operations and international acquisitions become a preferred mode of foreign market entry. Prior research has employed internalization theory to examine the role of R&D investments in international acquisitions and found that firms can create more value from their international acquisitions when firms engage in greater R&D activities (e.g., Morck and Yeung 1992; Markides and Oyon 1998; Frésard et al. 2017). It follows that when misappropriation concerns are high, the need for elevated protection of their intangibles will cause firms to internationalize through acquisitions.
On the other hand, while studies based on internalization theory have predominantly focused on ex post exchange hazards that arise due to R&D investments, little is known about how certain ex ante exchange hazards caused by R&D investments might also influence a firm’s engagement in cross-border acquisitions. R&D investments are often difficult for investors and others to understand because of their unobservability and uniqueness (e.g., Hall 2002). In addition, although firms that made investments in R&D are more informed about the quality of such resources than outsiders, they may not be willing to reveal detailed information on their resources and prospect to investors as such information may be used by competitors to their advantage (e.g., Bhattacharya and Ritter 1983). The resulting information asymmetries can adversely affect a firm’s ability to obtain financial and other resources to carry out transactions such as acquisitions (e.g., Stiglitz 2002).
As a consequence, we emphasize a fundamental tradeoff that has not been noted in previous international strategy research: R&D investments not only exacerbate ex post exchange hazards that acquisitions can relieve, but R&D investments also exacerbate ex ante exchange hazards to which acquisitions are subject in the first place. While substantial research exists on the former issue, less attention has been devoted to the ex ante exchange hazards that firms can face in carrying out international M&A.
To begin with, the risk of funding poor investments can discourage potential outside investors from providing capital to R&D-intensive firms. In such situations, firms have to either pay more for external finance or engage in strategic initiatives based on internal funds generated from their operations (e.g., Stiglitz and Weiss 1981; Myers and Majluf 1984). The resulting financial constraints would hinder some otherwise attractive international expansions through acquisitions at the margin. Moreover, research has indicated that a higher acquisition price is not the only factor that targets consider when deciding whether to accept an offer (e.g., Graebner and Eisenhardt 2004), but a target firm would go for a buyer that is more credible as an acquirer (e.g., Graebner and Eisenhardt 2004; Graebner 2009). This is particularly the case when the acquirer offers to pay in stock because the acquirer has private information on the value of its own resources and prospects. In sum, R&D activities present information problems that can make it difficult for R&D-intensive firms to finance and execute international M&A, even though these resources might be profitably leveraged in acquisitions to expand internationally.
The IPO firm context provides an interesting setting to examine these two theoretical considerations and the conditions affecting the influence of these distinct mechanisms on international acquisitions. Firms just carrying out successful initial public offerings tend to have a shorter track record and lack frequent dealings with financial intermediaries (Certo 2003; Sanders and Boivie 2004), so they tend to face difficulties in credibly making claims regarding their future prospects to outsiders compared to more established organizations. Their intangible assets can further exacerbate the information problems as such resources are hard to value and collateralize compared to tangibles, so IPO firms attempting to engage in international acquisition activities may confront skepticism and even resistance from some investors and potential targets.
To reduce such informational problems arising from R&D investments, firms can signal their underlying resources and growth prospects in the market. Prior research points out that signals from affiliations with prominent financial intermediaries enable firms to engage in partnerships and obtain acquisition offers after going public (e.g., Stuart et al. 1999; Gulati and Higgins 2003; Brau et al. 2010). More specifically, evidence also shows that given the existence of substantial intangibles, acquisitions involving an IPO acquirer associated with a prominent investment bank and venture capitalist (VC) are more likely to receive positive market responses (e.g., Arikan and Capron 2010). We therefore not only wish to examine whether R&D investments can impede international expansion via acquisitions, but we wish to investigate whether signals conveyed from several characteristics of an IPO firm can facilitate international acquisitions by IPO firms.
Our study offers three main contributions to the international strategy and M&A literatures. First, our theory is unique in highlighting a specific downside of R&D investments that can adversely affect firms’ engagement in international acquisition activities due to the market frictions such resources create. Prior studies have argued and shown the positive effect of R&D investments on cross-border M&As, as firms with higher R&D intensities are better able to capture value from carrying out international acquisitions (e.g., Morck and Yeung 1992; Markides and Oyon 1998; Frésard et al. 2017). However, when an acquirer has more intangible assets such as R&D, this creates information problems because potential investors and targets may have concerns about the firm’s growth prospects and its ability to execute acquisitions. Therefore, in contrast to prior work emphasizing the benefits of R&D investments, we highlight an unexamined drawback of R&D in the international M&A context.
Second, we also contribute by showing how IPO acquirers can address the information problems arising from R&D investments through their market signals. We do so by extending signaling theory to international acquisitions and suggest that signals on the buy side can also facilitate M&A transactions. Signaling theory in M&A studies typically focuses on how a target’s signals can help it differentiate itself from peers in order to attract acquirers (e.g., Ragozzino and Reuer 2007). We therefore shift the analytical focus from the sell side to the buy side, arguing that signals on bidders’ resources can be valuable if their resources and prospects are difficult to evaluate by outside investors or targets. Thus, signals influence the balance of benefits and drawbacks presented by R&D and can help firms leverage their intangible assets internationally through M&A.
Finally, we offer a new theoretical perspective to the recent studies on IPO firms’ acquisitions by joining these studies with international business research. There are a number of existing theories in finance linking IPOs with their subsequent activities as acquirers, such as the cash infusions from IPOs, the use of stock as an acquisition currency, uncertainty resolution, and the CEOs’ overconfidence in such transactions (e.g., Celikyurt et al. 2010; Hovakimian and Hutton 2010; Hsieh et al. 2011; Brau et al. 2012; Arikan and Stulz 2016; Anderson et al. 2017). This work has not differentiated domestic and international acquisitions nor considered theories used to study international acquisitions. Our study complements this previous research in these ways and brings informational considerations to the body of research on international acquisitions, which to date has focused attention on firms’ internalization advantages. More specifically, we complement existing research on international acquisitions by joining this literature with signaling theory to understand the tradeoffs presented by firms’ R&D activities in the international M&A setting.
2. Literature Review and Hypotheses
2.1. International M&As and the Role of R&D Investments
International acquisitions are an important means by which firms can quickly enter foreign markets (e.g., Nadolska and Barkema 2007). More importantly, such acquisitions also allow firms to enhance their R&D efficiency as they can obtain scale and scope economies by exploiting and building their own technological resources and capabilities across markets (e.g., Caves 2007). Research has suggested that firms that are able to leverage their R&D investments for alternative uses are more likely to achieve greater wealth gains from international M&As (e.g., Shimizu et al. 2004).
The literature on the relationship between intangible assets and firm’s internationalization decision has largely been driven by internalization theory, which focuses on the ex post exchange hazards arising from intangibles. Because R&D investments are often firm-specific assets that have the nature of public goods, it is difficult to protect such intangible assets through the crafting and execution of contracts due to knowledge misappropriation problems. Given that there exist hazards of exchanging intangible assets through contractual mechanisms such as licensing agreements, firms may not be able to economically exploit their advantages abroad without internalizing such transactions (e.g., Caves 1971; Buckley and Casson 1976; Teece 1986). Since the costs of R&D investments have already occurred, the application of such assets in new geographic markets will come with very low marginal costs, and thus R&D investments that can generate benefits in the home market can be exploited across borders via acquisitions. Moreover, firms carrying out acquisitions in overseas markets can also access and acquire new resources and capabilities that can enhance their competitive advantages and may be further leveraged in multiple countries (e.g., Eun et al. 1996; Seth et al. 2002; Anand et al. 2005). Therefore, these opportunities combined with the transaction costs presented by R&D can be catalysts for firms to undertake international M&A.
Although firms’ involvement in R&D activities could offer value-creation opportunities through cross-border M&As, there are also key challenges that can jeopardize the potential gains, especially for newly public firms. Given the high level of uncertainty arising from rapid technological development and changes, resource endowments embedded in firms’ R&D investments are often costly to evaluate, and the fear of disclosing information that is useful to competitors also reduces firms’ information revelation regarding R&D activities (e.g., Bhattacharya and Ritter 1983). Furthermore, since managers are more informed about the progress of their R&D activities than are outsiders (e.g., Aboody and Lev 2000), they have incentives to withhold negative information on their future prospects. Therefore, R&D investments contribute to information asymmetry between firms and outsiders, including prospective investors and targets. Such ex ante exchange hazards caused by information problems associated with R&D investments are even more severe for IPO firms, as they often have shorter track records and are new to the capital market (Certo 2003). This can have negative consequences for IPO firms’ cross-border M&A activities in at least two respects.
To begin with, R&D-intensive IPO firms may find it difficult to execute international acquisitions for financial reasons. Information asymmetries for such firms exist not only between a bidder and target, as previous research has argued, but also between the bidder and external providers of capital. Investors often are not inclined to provide growth capital because they are uncertain about these firms’ quality due to their short track records as well as their unproven ability to cope with the demands of public trading (Certo 2003). Even worse, since firms that are heavily engaged in R&D will seek to protect their innovations from imitation threats, they will not fully disclose the information to potential investors when looking for external funding (e.g., Bhattacharya and Ritter 1983). They have a natural incentive to withhold negative information and inflate claims about their commercial prospects to obtain financial resources on attractive terms, so investors must evaluate firms’ opportunities with incomplete information. Given the fact that R&D investments are often difficult to value and collateralize, firms with such intangible assets tend to face financial constraints (e.g., Hall 2002). Such information problems are expected be more pronounced regarding IPO firms’ financing for international acquisitions as such activities could increase the risk of failure (e.g., Acs et al. 1997; De Maeseneire and Claeys 2012).
Second, acquisition offers from R&D-intensive IPO firms are less likely to be completed with potential targets. Field evidence suggests that acquisition price is not the only factor that sellers incorporate into their decisions when receiving acquisition offers (e.g., Graebner and Eisenhardt 2004). Just as acquirers might want to prioritize targets that are subject to a lower degree of valuation uncertainty, target firms might choose acquirers that are more credible (e.g., Graebner and Eisenhardt 2004; Graebner 2009). IPO firms investing heavily in R&D activities have challenges in credibly conveying their true value to their potential targets, which is particularly problematic in stock deals in which the target shares the risk with the acquirer. Moreover, target firms’ poor information about IPO acquirers can also make it more difficult to retain acquired employees as employment with such acquirers can be perceived as more risky (e.g., Acs et al. 1997; Graebner 2009), thereby inhibiting the ability of IPO acquirers to realize expected acquisition gains.
Taken together, these challenges associated with R&D investments are more likely to outweigh the potential benefits offered by such investments in the context of international acquisitions by IPO firms, as information problems can be substantial in such situations. Thus, we propose the following hypothesis as a baseline prediction:
Hypothesis 1.
The level of an IPO firm’s R&D intensity is negatively associated with its hazard of international acquisition.
Even though we focus on the information problems that can lead R&D intensive IPO firms not to pursue international acquisition, there may exist alternative explanations for a negative correlation between R&D intensity and international acquisition activity. For example, firms failing to generate innovation internally may substitute their R&D efforts with external sourcing through acquisitions (e.g., Blonigen and Taylor 2000). More specifically, prior research has shown that IPO firms may rely more on technological acquisitions for higher quality innovation such as patents (e.g., Celikyurt et al. 2010; Bernstein 2015). However, internationalization through acquisitions adds more complexities and uncertainties to IPO firms’ operations, and firms that have little stock of foreign knowledge would find it difficult to coordinate the international operations and to acquire, assimilate, and exploit new knowledge from foreign market entry (e.g., Zahra et al. 2000; Sapienza et al. 2006). Due to these threats to firms’ survival and heightened information asymmetries between them and capital providers when they venture abroad, IPO firms would experience greater financial constraints to fund their international acquisitions. Therefore, while a firm’s R&D and acquisitions could be substitutes paths for corporate growth, information problems arising from R&D investments would still affect its ability to implement and manage international acquisitions. In the hypotheses presented below, we therefore consider contingencies affecting the information structure of IPO firms to identify boundary conditions for the first hypothesis and to investigate alternative factors influencing firms’ internationalization through acquisitions.
2.2. R&D Investments and Signaling by IPO Firms
Signals represent a potential solution to the aforementioned problems of financing and executing international acquisitions. Signaling theory is developed based on the notion that higher quality individuals or firms can differentiate themselves from lower quality others by engaging in activities that are costly for others to imitate (e.g., Spence 1974; Riley 2001). Extending this logic to the context of international acquisitions by IPO firms, we suggest that the information conveyed during and after the IPO process that is relevant to firms’ internationalization can help them signal the quality of their resources and prospects, thereby reducing the informational risks we have emphasized that investors and other market participants face.
Our central proposition, therefore, is that the hazards of IPO firms’ international acquisitions will depend not only on their R&D intensity, but will also be conditioned by the degree to which firms with significant intangibles are seen by potential investors and targets to be credible and of high quality as international acquirers. Given the information problems caused by R&D investments, we propose that the international signals of an IPO firm will positively moderate the relationship between its R&D intensity and the hazard of its post-IPO international acquisition. In the hypotheses developed below, we focus on two activities that previous research has investigated in the international business context and that are closely tied to IPO firms’ international involvement: (1) the IPO firm’s international alliance experience, and (2) the IPO firm’s foreign sales intensity (Reuer and Ragozzino 2014). Since IPO firms are often young and small, they often face higher barriers to international expansion, such as the lack of credibility and visibility in the capital and labor market (e.g., Acs et al. 1997). As a result, outsiders can turn to such signals conveyed by IPO firms to mitigate the information problems caused by their R&D investments.
2.2.1. International Alliance Experience
Alliances are cooperative arrangements that allow resource pooling, information exchange, and knowledge development among partners (e.g., Shan et al. 1994; Rothaermel and Deeds 2004). Given that IPO firms entering international markets would suffer from liabilities of foreignness and newness (e.g., Stinchcombe 1965; Hymer 1976), international collaboration could offer them access to local knowledge, information, and connections in foreign markets (e.g., Lu and Beamish 2001; Coviello 2006; Laufs and Schwens 2014). Prior research thus has suggested that forming international alliances could improve a venture’s internationalization performance (e.g., Lu and Beamish 2001; Fernhaber et al. 2009).
International alliances are not only beneficial for the firm’s access to additional opportunities and knowledge for foreign expansion, but also providing positive information on the extent to which a firm’s resources and capabilities are in demand by other organizations. Prior to the formation of alliances, alliance partners carry out due diligence and thus are more likely to have detailed information on the firm’s particular resources or technologies (e.g., Hitt et al. 2004; Shah and Swaminathan 2008). Therefore, the thorough investigation of IPO firms conducted by their international alliance partners lends credibility to the firm about the underlying quality of its resources and future prospects. Moreover, high quality firms are willing to pay more to collaborate with more established partners (e.g., Nicholson et al. 2005), which separates them from other lower quality firms. This sorting mechanism can differentiate IPO firms, and thus their international collaborations convey signals to outside investors and potential acquisition targets.
Given the aforementioned sorting process, potential investors and targets can use the IPO firm’s international alliance experience to draw inferences about the IPO acquirer’s quality and future prospects. Thus, even if information problems exist for IPO firms engaged in substantial R&D activity, the international collaborations can not only act as a valuable signal that relaxes the firm’s constraints in accessing the capital market, but also can relieve a target’s skepticism about the value creation potential of an acquisition involving the IPO firm. We therefore hypothesize:
Hypothesis 2.
The negative effect of R&D intensity on the hazard of international acquisition undertaken by an IPO firm will be attenuated by its international alliance experience.
2.2.2. Foreign Sales Intensity
The degree of an IPO firm’s international involvement through foreign sales represents another important signal that can likewise facilitate international acquisitions by R&D intensive firms. To exploit their capabilities for international growth and to compete with foreign rivals, firms have to incur higher costs such as production modifications and marketing adaptations, and thus firms engaging in overseas sales can convey positive information regarding their unobserved capabilities or future prospects (e.g., Bernard and Jensen 1999; Zahra et al. 2000). Therefore, ventures with more foreign sales would be positively valued by investors, so foreign sales serve as a signal enabling firms to obtain funds for investments from external capital providers (e.g., Shaver 2011).
Since foreign sales are visible and can indicate the underlying quality of firms’ productivity, they enable firms to distinguish themselves from others. Even though the IPO firm’s investors and potential acquisition targets face information problems regarding the IPO firm’s foreign expansion through acquisitions, the IPO firm can signal its productivity or other capabilities by bearing the costs of selling in foreign markets, so signals such as foreign sales activities may facilitate such transactions. Therefore, when information problems surround the international acquisitions undertaken by R&D-intensive IPO firms, signals arising from IPO firms’ foreign sales convey positive information to potential investors and targets about the acquirer’s resources and future prospects. Paralleling the arguments developed above, we therefore hypothesize that previous foreign sales will ameliorate the adverse information risks associated with the IPO firm’s intangible assets:
Hypothesis 3.
The negative effect of R&D intensity on the hazard of international acquisition undertaken by an IPO firm will be attenuated by its foreign sales intensity.
3. Methods
3.1. Sample and Data
We sampled firms in the manufacturing sector (i.e., SIC 2000-3999) that went public from 1991 to 2015, and we used Refinitiv’s Securities Data Company (SDC) database to identify initial public offerings (IPOs) by these firms as well as their subsequent acquisitions in the years after going public. The manufacturing sector was selected for this study not only because of the substantial R&D investments carried out by some manufacturing firms (e.g., Mairesse and Hall 1996; Filatotchev and Piesse 2009), but also because it represents the greatest acquisition activity (e.g., Hijzen et al. 2008). Moreover, this focus presents opportunities for comparisons with prior research on internationalization and the potential gains that international acquisitions present for manufacturing firms having intangible assets such as R&D (e.g., Morck and Yeung 1992; Markides and Oyon 1998). To control for the potential heterogeneity of IPOs across countries, we restricted our investigation to IPOs in the United States, and consistent with prior studies, IPOs involving real-estate investment funds, closed mutual funds, reverse leverage buyouts, American Deposit Receipts (ADRs), or spin-offs of existing public companies were excluded from the sample (e.g., Ritter 1991). We focused on international acquisitions of public and private companies as well as acquisitions of assets. M&A deals denoted as buybacks, recapitalizations, leverage buyouts, divestitures, or exchange offers were excluded from the sample. Using company data from Compustat and after accounting for missing data, our final sample consisted of 1630 IPO firms, of which 264 experienced an international acquisition within five years after going public.
3.2. Statistical Approach
In estimating the hazard rate of the first international M&A deal, we employed the Cox proportional hazard model (Cox 1972), which is a semi-parametric approach that does not impose distributional assumptions. The model can be specified as the following:
where h0(t) is an unspecified baseline hazard function, and β is the vector of coefficients associated with the covariates, and X(t) is the vector of independent variables observed at time t. This formulation offers an advantage that differences in hazard rates across IPO firms depend only on the covariates, not on the baseline hazard. Therefore, the Cox model assumes that the hazard ratio at different levels of an independent variable is proportional to an unspecified baseline function. We examined the Schoenfeld residuals as a function of time to check the proportionality assumption of the Cox model, and found that the proportional hazards assumption was not violated in our study. The coefficients were estimated through the maximization of the partial likelihood function. Because there were multiple spells observed for the same IPO firm, observations in the sample might not be independent. As a result, we calculated robust standard errors, clustering residuals for each firm (Lin and Wei 1989).
h(t) = h0(t) exp[β X(t)]
3.3. Variables and Measurement
3.3.1. Dependent Variable
Our dependent variable is the hazard of a firm conducting an international M&A following its IPO in a given year. Annual time spells were used to track firms’ international M&A activity within five years after their IPOs. The IPO firm is at risk of international acquisition when it filed for a new issue and remains at risk until it carried out an international M&A deal or reaches the end of the observation period. This results in a total number of 5437 firm-year observations for analysis in the sample. Post-IPO international M&A event is measured as whether or not the IPO firm is involved in the international acquisition in each spell, and thus is coded as 1 when the first international M&A deal occurred, and 0 otherwise. Firms that did not yet engage in an international acquisition at the endpoint of the sample period were treated as right-censored. In addition, each IPO firm may not have the same opportunity to conduct post-IPO international acquisitions, as some of them might get acquired themselves or become delisted after going public. To better incorporate such timing information, we treated these events as competing risks (e.g., Allison 1984). Data for the acquisitions and delistings of IPO firms were compiled from SDC and CRSP.
3.3.2. Independent Variables
Our primary independent variable is the IPO firm’s R&D Intensity, which not only reflects a firm’s innovation capability and technological resources that might be redeployed into foreign markets but also presents valuation uncertainty for external capital providers and targets (e.g., Morck and Yeung 1992; Acs et al. 1997; Markides and Oyon 1998). It is measured as R&D expenditures scaled by the firm’s total assets (e.g., Morck and Yeung 1992; Kotha et al. 2001; Celikyurt et al. 2010). We also tested an alternative measure of R&D intensity by using the firm’s R&D expenditures as a percentage of sales and obtained similar interpretations. Data for this variable were collected from Compustat.
Hypothesis 2 tests whether the signaling effect of the IPO firm’s international alliance experience moderates the relationship between the IPO firm’s R&D intensity and its hazard of first post-IPO international acquisition. To operationalize International Alliance Experience, we calculated the number of alliances formed by the focal IPO firm outside the US during the previous five years for each spell. Alliances ranging from licensing and distribution pacts, supply agreements, manufacturing agreements, sales and marketing agreements, R&D agreements, strategic alliances, and joint ventures were included in the measurement. A log transformation was implemented to remedy the positive skewness for this variable. Before forming the interaction terms between this variable and the IPO firm’s R&D intensity, we mean-centered the variables to reduce collinearity between the multiplicative terms and direct effects (Aiken and West 1991). Data for this variable were collected from SDC’s alliance module.
Finally, international activities can also provide signals of the IPO firms’ resources and prospects (e.g., Aybar and Ficici 2009; Shaver 2011), and thus Hypothesis 3 tests whether a firm’s foreign sales intensity positively moderates the theorized relationship between the IPO firm’s R&D intensity and the hazard of its first post-IPO international acquisition. Using data collected from the Compustat Segments database, we measured Foreign Sales Intensity by calculating the ratio of the firm’s foreign sales to its total sales. The mean-centering approach was similarly used before forming interaction terms involving this variable.
3.3.3. Control Variables
We also included a number of control variables at the firm and industry levels to account for other factors that might be related to the hypothesized variables discussed above as well as to IPO firms’ hazards of engaging in international acquisitions. First, because larger firms may have accumulated more experience or resources in managing businesses or activities across geographic or product markets (e.g., Lee and Caves 1998; Aybar and Ficici 2009; Hovakimian and Hutton 2010), they can pursue more acquisitions after the IPO. We measured Firm Size as the natural log of the focal firm’s total number of employees in each spell. Second, the uncertainty associated with the firm reduces as it ages, because more information becomes available for external capital providers and others to review (e.g., Berger and Udell 1998). Moreover, an organization’s propensity to engage in international expansion can also increase with age because of its greater exposure to business opportunities (e.g., Autio et al. 2000; Zahra et al. 2000; Filatotchev and Piesse 2009). Firm Age was measured as the number of years between the firm’s founding year and each time spell. Data for the above two variables were from the SDC database. Third, we included the firm’s Tobin’s Q in each spell as a control to account for its market performance and growth opportunities (e.g., Servaes 1991; Villalonga 2004). Following the approach suggested by Chung and Pruitt (1994), we defined this variable as market value of the focal firm divided by its total assets. Data for this measure were obtained from Compustat.
Prior research has suggested that the capital infusion during and after the IPO may be related to a firm’s post-IPO acquisitions (e.g., Celikyurt et al. 2010; Hovakimian and Hutton 2010), and thus we also controlled for several variables that capture the IPO firm’s capital inflows and expenditures. For instance, firms with larger cash flows are more likely to use cash to finance their acquisitions (e.g., Jensen 1986; Chakrabarti et al. 2009). Thus, we included the IPO firm’s Free Cash Flow in the model, which was calculated as earnings before extraordinary items plus depreciation scaled by the book value of equity in each spell. Data for this variable came from Compustat. Next, we controlled for the capital raised at the IPO as the funding can be used to support acquisitions (e.g., Celikyurt et al. 2010; Hovakimian and Hutton 2010). The variable IPO Proceeds was measured as the total amount of capital raised from the IPO market scaled by the firm’s total assets. We also included a dummy variable, Proceeds Used for Acquisition, indicating whether or not acquisition financing was one of the explicitly stated reasons for going public. We relied on the SDC database to collect data for the above two variables.
We also controlled for other characteristics of the focal firm’s initial public offering, as information conveyed during the IPO process might shape investors’ recognition of the firm’s resources and prospects and channel its internationalization activities (e.g., Carpenter et al. 2003; Filatotchev and Piesse 2009). To incorporate Investment Bank Reputation, we employed the ranking index first developed by Carter and Manaster (1990) and then updated by Loughran and Ritter (2004). This index is constructed based on the positions that investment banks occupy in IPO tombstone announcements, and the rankings range from a minimum of zero to a maximum of nine. Since IPOs are often co-managed by underwriting syndicates comprised of multiple investment banks, we focused on the reputation index of the IPO firm’s lead underwriter. Data for this variable were collected from Jay Ritter’s website (i.e., http://bear.warrington.ufl.edu/ritter/ipodata.htm, accessed on 31 October 2020). We next included Venture Capitalist Backing, which is a dummy variable indicating whether an IPO firm was backed by a venture capitalist at the time of IPO (e.g., Megginson and Weiss 1991). Data for this variable were obtained from SDC. We also controlled for IPO Underpricing and measured it as the percentage change between the IPO’s offer price and the stock’s closing price on the first day of trading (e.g., Allen and Faulhaber 1989; Habib and Ljungqvist 2001). The greater the level of underpricing, the higher the indirect cost borne by the firm for the public offering. Data for this measure were obtained from the SDC database and the Center for Research in Security Prices (CRSP) data files. To capture the information disseminated after the IPO, we traced the IPO firm’s Analyst Coverage by counting the number of analysts who provide earnings forecasts of the firm in each spell (e.g., Hong et al. 2000). Due to skewness that was evident for this measure, we used the log of one plus the number of analysts. The data on this variable were obtained from the Institutional Brokers Estimate System (I/B/E/S), and firms not covered by I/B/E/S are assumed to have no analyst coverage (e.g., Jensen 2004).
Since capital raised from subsequent stock or debt offerings after going public can also be used to finance acquisitions (e.g., Celikyurt et al. 2010; Hovakimian and Hutton 2010), we also controlled for the post-IPO financing. Seasoned Equity Offering was defined as the total amount of additional equity capital raised in each spell as a percentage of total assets, whereas Debt Offering was measured as the total amount of debt issuances that occurred in each spell, scaled by total assets. Conversely, firms focusing on organic growth would expend greater investments in fixed assets and thus may be less involved in conducting acquisitions (e.g., Celikyurt et al. 2010). We therefore controlled for the IPO firm’s Capital Expenditures, which is defined as capital expenditures in each spell scaled by total assets. Data on the post-IPO equity and debt issuances and capital expenditures were derived from Compustat.
To account for the IPO firm’s international exposure and visibility, we controlled for the firm’s experience in foreign markets prior to going public and the exchange upon which it lists. Firms that have engaged in international acquisitions in the past are more likely to be involved in them again because of their better deal-making and implementation capabilities as well as potentially mere momentum (e.g., Barkema and Vermeulen 1998; Dikova et al. 2010). We used the SDC database to trace the firm’s number of pre-IPO international acquisitions, or M&A deals that had been conducted prior to the firm going public. Because positive skewness was evident for this variable, we defined International M&A Experience as the log of one plus the number of international M&A deals five years prior to the IPO. In addition, listing on major exchanges can enhance a firm’s visibility and investor recognition (e.g., Corwin and Harris 2001; Draho 2004), which could make potential investors and targets more aware of the IPO firm’s growth prospects and facilitate post-IPO international M&A activity. We incorporated the dummy variable Major Exchange to indicate whether or not the IPO firm was listed on the New York Stock Exchange or NASDAQ. Data for this variable were obtained from the SDC database.
Finally, we controlled for industry and time fixed effects. Although our research context focuses on IPO firms residing in the manufacturing sector, different industries may vary in their technological opportunities and the total volume of acquisitions (e.g., Celikyurt et al. 2010; Hovakimian and Hutton 2010). Consequently, we included industry fixed effects based on three-digit SIC classifications. We also included Year Fixed Effects to capture effects caused by economy-wide factors by denoting the year of the firm’s IPO.
4. Results
Table 1 reports descriptive statistics for the variables as well as correlations. Sixteen percent of the IPO firms carried out a post-IPO international acquisition within the five years after going public, and of those that did, the average time to international acquisition was 1.9 years. This is in contrast to other work noting that IPO firms are generally quite active in domestic acquisitions (Celikyurt et al. 2010). Interestingly, thirty-three percent of the IPO firms in the high-tech industry were involved in international acquisitions after going public, which is consistent with prior research indicating that high-tech IPO firms are generally more involved in acquisitions (Hovakimian and Hutton 2010). Not many firms were exposed to international activities, as 18 percent of firms had foreign sales, roughly 9 percent of them formed international alliances, and 16 percent of them had conducted international M&As before going public. We also noted a number of interesting correlations among the variables. For instance, IPO firms involved more in international alliances tend to be associated with VCs and followed by more financial analysts after going public (both p < 0.01). In addition, firms in the high-tech industry are apt to have a higher degree of international exposure based on foreign sales and are underwritten by reputable investment banks as well as backed by VCs (all p = 0.000). There are no especially high correlations between the variables, and all variance inflation factors (VIFs) were below the traditional threshold of 10 (i.e., the maximum is 2.56), suggesting that multicollinearity was not a concern in our analyses.
Table 2 presents the results of the Cox regression analysis conducted to examine how the firm’s R&D intensity and the contingencies we theorized upon shape the international acquisitions carried out by IPO firms. Model 1 is the baseline specification including all the control variables. Model 2 augments this model by adding the direct effect of R&D intensity, international alliance experience, and foreign sales intensity, and Models 3–4 introduce the two interaction terms sequentially, and Model 5 is the full model testing all of the hypotheses at once. All five models are highly significant (all p < 0.01), and the likelihood ratio test indicates that the models provide a substantial improvement in explanatory power compared to the baseline specification in Model 1 (all p < 0.01).
In Hypothesis 1, we used informational considerations surrounding an IPO firm’s ability to finance and execute international M&A to suggest that R&D-intensive IPO firms will have a lower hazard of engaging in international acquisition. The coefficient for the R&D intensity variable is negative and significant (p < 0.01), providing support for our hypothesis. In analyses presented below, we seek to determine if this negative baseline effect becomes more pronounced when information risks are greater for the IPO firm lacking previous involvement in international alliances and foreign sales. To examine the marginal effects, results from Model 5 indicate that a one-standard-deviation increase in R&D intensity is associated with a 69 percent decrease in the hazard of post-IPO international acquisition.
In Hypotheses 2 and 3, we proposed two contingencies that are theorized to shape the effect of R&D intensity on an IPO firm’s subsequent international acquisition. Hypothesis 2 predicts that R&D intensity will be less likely to inhibit the hazard of international acquisition for IPO firms that have formed international collaborations, suggesting a positive interaction effect between the R&D intensity and international alliance experience variables. Models 3 and 5 indicate that the coefficient of the interaction term is positive and significant in both models (both p < 0.01), so there is support for Hypothesis 2. In addition, to provide intuition for the significance of this finding, we followed Haveman and Cohen (1994) and investigated the economic significance for H2. When the international alliance experience increases from its mean to the mean plus one standard deviation, a one-standard-deviation increase in R&D intensity increases the hazard of post-IPO international acquisition by 72 percent. Thus, when international alliance experience is high, the established result consistent with the internalization advantages of M&A obtains, whereas R&D intensity impedes the hazard of international acquisition when the firm is less experienced in international collaborations. This finding is consistent with the core tradeoff identified in the paper: that R&D intensity contributes to ex post transaction costs that acquisitions can relieve for firms leveraging such resources internationally while also ex ante exchange hazards due to the informational risks of such resources.
Hypothesis 3 makes similar predications for the IPO firm’s international exposure through foreign sales. In Models 4 and 5, the interaction of the foreign sales intensity and R&D intensity is positive and significant (both p < 0.01), so Hypothesis 3 is supported. In terms of economic significance, when the foreign sales intensity increases from its mean to the mean plus one standard deviation, a one-standard-deviation increase in R&D intensity increases the hazard of post-IPO international acquisition by 18 percent.
To illustrate these interaction effects, Figure 1 offers a graphical depiction of the impact of R&D intensity on a firm’s post-IPO international acquisition. Given that international alliance experience and foreign sales intensity may reduce the adverse effects of R&D on the firm’s internationalization activities through M&A, we considered the joint effects of these variables. The figure demonstrates that when international alliance experience and foreign sales intensity are both one standard deviation above the mean, the effect of R&D intensity on post-IPO international acquisition becomes positive. It appears that firms being able to address adverse selection in capital and other factor markets through these variables may also be better positioned to exploit internalization advantages through international acquisitions. Conversely, while many studies emphasize that established firms can gain from exploiting their R&D assets in international acquisitions (e.g., Morck and Yeung 1992; Markides and Oyon 1998; Frésard et al. 2017), we observe that for IPO firms this is often not the case, particularly when they lack signals associated with international exposures through international collaborations or foreign sales after going public. Figure 1 therefore provides evidence consistent with the tradeoffs between the frictions created by technological resources in factor markets as well as the internalization advantages such resources entail.
Turning to the control variables, there are several additional results that are noteworthy. First, both international alliance experience and foreign sales intensity have positive estimated main effects (both p < 0.01). These findings may suggest that information generated from a firm’s international activities produces important signals that also facilitate the hazard of international acquisition independent of other motives. Next, IPO firms followed by more financial analysts are associated with higher hazard of engaging in post-IPO international acquisition (p < 0.01), which might reflect that R&D intensive firms tend to receive more analyst coverage (e.g., Barth et al. 2001), as well as reflect the effectiveness of analysts as intermediaries by disseminating information from firms to markets. Third, the hazard of IPO firms engaging in post-IPO international acquisition is positively associated with their free cash flow (p < 0.01), which might be used for the financing of their international acquisitions (e.g., Chakrabarti et al. 2009). Forth, affiliations with VCs lower the hazard of post-IPO international acquisition (p < 0.05). VC firms often stay on the board of directors of the companies they fund and continue to retain significant portions of their holdings after the IPO (e.g., Megginson and Weiss 1991), which not only acts as a credible certification of IPO firms but affects the monitoring of managers as well. Although carrying out international acquisitions may serve as expansion opportunities for IPO firms, they also entail considerable capital outlays and complexities in managing international activities, all of which can pose greater risks to VCs (e.g., Carpenter et al. 2003; George et al. 2005). Fifth, consistent with prior studies based on organizational learning (e.g., Collins et al. 2009), the hazard of post-IPO international acquisition is higher when IPO firms have accumulated more international M&A experience (p < 0.01). Finally, the results show economy-wide factors come into play and influence the hazard of international acquisition, as shown by the joint significance of year fixed effects.
Supplementary Analyses
We also performed several robustness analyses in addition to the tests described above. First, we examined whether IPO firms are less likely to engage in any international acquisitions in the first place, and thus the potential sample selection bias may lead to biased inferences. To address this concern, we collected data on all manufacturing firms from the Compustat database and reran our analysis. The results from Table 3 show that the effect of R&D intensity on the hazard of all manufacturing firms’ international acquisitions turns to be positive and statistically significant. This probably suggests that the information problems brought by R&D investments may not be that serious for more established manufacturing firms, and thus firms could expand the use of their R&D investment abroad via acquisitions to leverage their internalization advantages. Furthermore, we extended our IPO sample and reran our analysis by tracing IPO firms’ international acquisition activity for longer time periods (i.e., six, seven, eight, nine, ten years subsequent to their IPOs, respectively). The results from Table 4 suggest that the effect of R&D intensity on the hazard of IPO firms’ international acquisitions continues to be negative but its magnitude decreases over time. Similarly, the interaction effects between R&D intensity and international signals also attenuate a bit over time. Taken together, these additional analyses suggest that the negative effect of R&D intensity on firms’ engagement in international acquisitions may not be as pronounced as firms get more mature, providing additional support for the information problems brought by R&D investments at the early stages of IPO firms’ public lives.
Second, we examined ex post firm performance to gauge the value generated by international acquisitions. Specifically, we looked into IPO acquirers’ changes in return on assets from year t + 1 to year t + 2, or year t + 3 (i.e., one- and two-year horizons) after their international acquisitions. To account for the underlying industry trends, we adjusted the changes in firms’ return on assets by subtracting the industry average based on the 4-digit SIC classification. Table 5 reports the results of OLS regressions where the IPO acquirers’ ex post changes in performance are the dependent variables. The results indicate that IPO acquirers’ R&D intensity is significantly associated with higher operating performance after international acquisitions. Thus, although the information problems arising from their R&D investments may inhibit IPO firms from engaging in international acquisitions, the benefits of deploying their R&D investments abroad would allow IPO acquirers to create value from their international acquisitions.
Third, we considered alternative proxies for the information problems brought by IPO firms’ R&D investments. When examining the different proxies, we would like to focus on proxies that could reflect the information asymmetries between IPO firms and outsiders, and thus we collected data on total intangible assets, goodwill, bid-ask spread (e.g., Corwin and Schultz 2012), and Amihud’s illiquidity measure (e.g., Amihud 2002) and reran our analyses. Intangible intensity is measured by the ratio of a firm’s total intangible assets to total assets, whereas goodwill intensity is measured by the ratio of a firm’s goodwill to total assets. Prior work has suggested that firms associated with less valuation uncertainty will lead to the trading of their stocks with reduced bid-ask spread or higher stock liquidity (e.g., Merton 1987; Schwartz and Shapiro 1992). We computed the annual average of the ratio of daily closing bid-ask spread to the closing price by using the CRSP daily stock file. And the Amihud illiquidity measure was constructed by taking the annual average of the absolute value of the daily return-to-volume ratio. Table 6 shows that except for intangible intensity all the other proxies are significant and negatively associated the hazard of IPO firms’ international acquisitions. The non-significant findings of intangible intensity may be partly explained by its diverse nature (e.g., copyrights, customer lists, mortgage servicing rights, licenses, franchises, customer and supplier relationships, and marketing rights). This may also be one reason why recent studies have begun to adopt more specific proxies to measure intangible assets (e.g., Frésard et al. 2017).
Finally, we reexamined our international alliance experience variable by excluding joint ventures, as joint ventures may serve as another means for R&D investment (e.g., Kamien and Zang 2000). The results still indicate the significant and negative association between R&D intensity and the hazard of IPO firms’ international acquisitions. And the interpretations of the interactions between R&D intensity and IPO firms’ international signals are approximately similar.
5. Discussion
5.1. Implications and Contributions
Joining research on cross-border M&As and signaling theory, our study offers several contributions to the literature. First, our theory highlights the less examined roles of R&D investments as a potential barrier to a firm’s international acquisition activities under certain circumstances. Prior work in cross-border M&As has drawn attention to the importance of R&D investments as acquiring firms with higher R&D intensities could capture more value from international acquisitions (e.g., Morck and Yeung 1992; Markides and Oyon 1998; Frésard et al. 2017). Although some research has started to unravel the complex links between R&D intensity and acquisition activity (e.g., Szücs 2014; Frésard et al. 2017), little is known about the IPO firm’s R&D intensity and its bearing on subsequent international acquisitions. This paper looks at IPO firms undertaking international acquisitions by elaborating how the firm’s R&D intensity may impede the occurrence of such transactions. Specifically, we suggest that when an IPO acquirer has more intangible assets such as R&D, information problems can inhibit the firm’s ability to engage in international acquisitions because potential investors and targets may have concerns about the firm’s growth prospects and its abilities of carrying out acquisitions. Our theory therefore complements previous research emphasizing the ex post exchange hazards that firms encounter for deploying their intangible resources in international markets that prompt them to acquire (e.g., Caves 1971; Buckley and Casson 1976; Teece 1986), by emphasizing the ex ante problems that these intangibles also generate that can impede international acquisitions. Our intent is not to make normative conclusions about the relative importance of ex ante and ex post exchange hazards, but we suggest that the consideration of information asymmetries in M&A and capital markets can provide a complementary theoretical perspective to more fully understand the market frictions that bear upon international M&A transactions. Future research addressing both the ex ante and ex post factors in influencing firms’ decisions on other phases of international acquisitions (e.g., target selection, contracting, ownership structure, post-merger integration, innovation outcome, and the relocation of R&D activities) would prove to be valuable in building upon this research (cf., Papanastassiou et al. 2020).
Second, we extend signaling theory to international acquisitions and suggest that signals on the buy side can also facilitate M&A transactions. Our findings indicate that although the presence of R&D investments would generally reduce a firm’s engagement in international acquisition activities, such information problems can be mitigated if the firm conveys valuable signals relevant to their international activities (e.g., international alliance experience and foreign sales intensity). Signaling theory in M&A studies typically focus on how an acquirer can tell low quality targets apart from better firms by attending to market signals (e.g., Ragozzino and Reuer 2007). The basic presumption is that buyers are subject to the risk of adverse selection (i.e., overpayment risk) in M&A transactions and thus targets signal their value to attract acquirers. However, this theoretical logic neglects the fact that target firms also have discretion to choose their own buyers and that buyers need financial resources to carry out acquisitions.
Finally, we offer a new theoretical perspective to the recent studies on IPO firms’ acquisition activities by joining this work with international business research. The finance literature has devoted significant attention to the acquisition implications of IPOs, such as the cash infusions from IPOs, the use of stock as acquisition currency, uncertainty resolution, or the CEOs’ overconfidence in such transactions (e.g., Celikyurt et al. 2010; Hovakimian and Hutton 2010; Hsieh et al. 2011; Brau et al. 2012; Arikan and Stulz 2016; Anderson et al. 2017). We complement this research stream by investigating the challenges and remedies associated with IPO firms’ international acquisition activities in particular and by considering the tensions identified by internalization theory as well as information economics concerning acquirer’s intangible assets. Our theory is unique in suggesting that R&D investments create ex ante exchange hazards for prospective targets and investors that can impede international acquisitions. We use signaling theory to resolve this tension, arguing that signals ameliorate this problem so firms are able to obtain the internalization advantages afforded by international M&A for their intangible assets. The theory we offer therefore enables us to join together IPO studies on acquisitions and international business research, and we are able to address calls for research examining international diversification in the IPO context (Certo et al. 2009; Filatotchev and Piesse 2009).
5.2. Limitations and Future Research Directions
This study also has several limitations that future extensions might address. In this paper, because we explore R&D intensity in the context of international acquisitions, we focus on deals that were carried out by U.S. IPO firms in manufacturing industries. Future work might examine whether and how R&D intensity shapes international acquisitions in other industries or by IPO firms from other countries. For example, the development of financial markets and institutions would influence firms’ access to capital and abilities to protect their technological resources (e.g., Acs et al. 1997), and thus the relationship between R&D intensity and international M&A activity may vary across countries. For example, firms from emerging markets could potentially speed up their internationalization through acquisitions because of their access to cheaper capital and stronger business group or government support (e.g., Buckley et al. 2007; Madhok and Keyhani 2012; Kumar et al. 2020). However, research also indicates that market reactions are generally unfavorable to cross-border M&A announcements by emerging market multinationals, especially for those deals conducted by high-tech bidders (e.g., Aybar and Ficici 2009). The information problems might be more severe for international acquisitions conducted by firms from emerging markets and thus future research may examine whether market signals would have a bearing on such deals.
While our study helps uncover factors that would influence an IPO’s firm propensity to engage in post-IPO international acquisition activity, we are only beginning to understand the benefits and risks inherent in IPO firms’ undertaking international acquisitions. For example, when entering foreign countries, firms often have poor information about local firms or market conditions in the host country (e.g., Chari and Chang 2009); similarly, local firms are also less informed about the new entrants. Therefore, firms may find it difficult to attract good acquisition targets and lead to poor acquisition performance (e.g., Gioia and Thomsen 2004). In addition to signaling the quality of their resources and prospects, firms may employ tactics such as pre-acquisition negotiations or post-acquisition governance activities to manage these problems (e.g., Dikova et al. 2010; Kang and Kim 2010). Thus, future research examining specific M&A decisions (e.g., target selection, M&A deal contracting) and their performance implications would be valuable in extending this research.
6. Conclusions
We investigate the role of R&D intensity in international acquisitions by IPO firms. Prior international business research suggests that R&D investments can create value for acquirers by internalizing foreign transactions and redeploying their R&D assets across borders. Considering the information problems that may arise from IPO firms’ R&D investments, we argue and find that intangibles in the form of R&D can in some situations inhibit international M&A given the ex ante exchange hazards such resources entail. Our theory therefore identifies an unexamined tradeoff presented by firms’ intangibles in the international M&A context and the different types of market frictions such resources generate. We also use signaling theory to identify conditions under which R&D intensity might have a positive or negative impact on firms’ international M&A. We therefore contrast previous studies by identifying specific situations in which R&D intensity inhibits international M&A and situations in which the positive relationship anticipated by internalization theory obtains. Our theory and evidence therefore illustrate a paradox of R&D investments and emphasize the value of acquirers’ signals arising from international collaborations and foreign sales in relieving the potential constraints IPO firms experience in carrying out international acquisitions.
Author Contributions
Conceptualization, J.J.R. and C.-W.W.; methodology, C.-W.W.; software, C.-W.W.; validation, J.J.R. and C.-W.W.; formal analysis, C.-W.W.; investigation, J.J.R.; resources, C.-W.W.; data curation, C.-W.W.; writing—original draft preparation, C.-W.W.; writing—review and editing, J.J.R.; visualization, C.-W.W.; supervision, J.J.R.; project administration, J.J.R. and C.-W.W.; funding acquisition, C.-W.W. All authors have read and agreed to the published version of the manuscript.
Funding
This research was funded in part by the Research Grants Council of the Hong Kong Special Administrative Region, project number: 793013.
Institutional Review Board Statement
Not applicable.
Informed Consent Statement
Not applicable.
Data Availability Statement
Research based on data from the Wharton Research Data Services (WRDS): https://wrds-www.wharton.upenn.edu/ (accessed on 31 October 2020).
Conflicts of Interest
The authors declare no conflict of interest.
References
- Aboody, David, and Baruch Lev. 2000. Information asymmetry, R&D, and insider gains. Journal of Finance 55: 2747–66. [Google Scholar]
- Acs, Zoltan J., Ronald Morck, J. Myles Shaver, and Bernard Yeung. 1997. The internationalization of small and medium-sized enterprises: A policy perspective. Small Business Economics 9: 7–20. [Google Scholar] [CrossRef]
- Aiken, Leona S., and Stephen G. West. 1991. Multiple Regression: Testing and Interpreting Interactions. Newbury Park: Sage. [Google Scholar]
- Allen, Franklin, and Gerald R. Faulhaber. 1989. Signalling by underpricing in the IPO Market. Journal of Financial Economics 23: 303–23. [Google Scholar] [CrossRef]
- Allison, Paul. 1984. Event History Analysis: Regression for Longitudinal Event Data. Beverly Hills: Sage. [Google Scholar]
- Amihud, Yakov. 2002. Illiquidity and stock returns: Cross-section and time-series effects. Journal of Financial Markets 5: 31–56. [Google Scholar] [CrossRef] [Green Version]
- Anand, Jaideep, Laurence Capron, and Will Mitchell. 2005. Using acquisitions to access multinational diversity: Thinking beyond the domestic versus cross-border M&A comparison. Industrial and Corporate Change 14: 191–224. [Google Scholar]
- Anderson, Chrisopher W., Jian Huang, and Gökhan Torna. 2017. Can investors anticipate post-IPO mergers and acquisitions? Journal of Corporate Finance 45: 496–521. [Google Scholar] [CrossRef]
- Arikan, Asli M., and Laurence Capron. 2010. Do newly public acquirers benefit or suffer from their pre-IPO affiliations with underwriters and VCs? Strategic Management Journal 31: 1257–89. [Google Scholar] [CrossRef]
- Arikan, Asli M., and René M. Stulz. 2016. Corporate acquisitions, diversification, and the firm’s life cycle. Journal of Finance 71: 139–94. [Google Scholar] [CrossRef]
- Autio, Erkko, Harry J. Sapienza, and James G. Almeida. 2000. Effects of age at entry, knowledge intensity, and imitability on international growth. Academy of Management Journal 43: 909–24. [Google Scholar]
- Aybar, Bülent, and Aysun Ficici. 2009. Cross-border acquisitions and firm value: An analysis of emerging-market multinationals. Journal of International Business Studies 40: 1317–38. [Google Scholar] [CrossRef]
- Barkema, Harry G., and Freek Vermeulen. 1998. International expansion through start-up or acquisition: A learning perspective. Academy of Management Journal 41: 7–26. [Google Scholar]
- Barth, Mary E., Ron Kasznik, and Maureen F. McNichols. 2001. Analyst coverage and intangible assets. Journal of Accounting Research 39: 1–34. [Google Scholar] [CrossRef]
- Bena, Jan, and Kai Li. 2014. Corporate innovations and mergers and acquisitions. Journal of Finance 69: 1923–60. [Google Scholar] [CrossRef]
- Berger, Allen N., and Gregory F. Udell. 1998. The economics of small business finance: The roles of private equity and debt markets in the financial growth cycle. Journal of Banking and Finance 22: 613–73. [Google Scholar] [CrossRef] [Green Version]
- Bernard, Andrew B., and J. Bradford Jensen. 1999. Exceptional exporter performance: Cause, effect, or both? Journal of International Economics 47: 1–25. [Google Scholar] [CrossRef] [Green Version]
- Bernstein, Shai. 2015. Does going public affect innovation? Journal of Finance 70: 1365–403. [Google Scholar] [CrossRef]
- Bhattacharya, Sudipto, and Jay R. Ritter. 1983. Innovation and communication: Signalling with partial disclosure. Review of Economic Studies 50: 331–46. [Google Scholar] [CrossRef]
- Blonigen, Bruce A., and Christopher T. Taylor. 2000. R&D intensity and acquisitions in high-technology industries: Evidence from the US electronic and electrical equipment industries. Journal of Industrial Economics 48: 47–70. [Google Scholar]
- Brau, James C., Ninon K. Sutton, and Nile W. Hatch. 2010. Dual-track versus single-track sell-outs: An empirical analysis of competing harvest strategies. Journal of Business Venturing 25: 389–402. [Google Scholar] [CrossRef]
- Brau, James C., Robert B. Couch, and Ninon K. Sutton. 2012. The desire to acquire and IPO long-run underperformance. Journal of Financial and Quantitative Analysis 47: 493–510. [Google Scholar] [CrossRef]
- Bresman, Henrik, Julian Birkinshaw, and Robert Nobel. 1999. Knowledge transfer in international acquisitions. Journal of International Business Studies 30: 439–62. [Google Scholar] [CrossRef]
- Buckley, Peter J., and Mark Casson. 1976. The Future of the Multinational Enterprise. London: Macmillan. [Google Scholar]
- Buckley, Peter J., L. Jeremy Clegg, Adam R. Cross, Xin Liu, Hinrich Voss, and Ping Zheng. 2007. The determinants of Chinese outward foreign direct investment. Journal of International Business Studies 38: 499–518. [Google Scholar] [CrossRef]
- Carpenter, Mason A., Timothy G. Pollock, and Myleen M. Leary. 2003. Testing a model of reasoned risk-taking: Governance, the experience of principals and agents, and global strategy in high-technology IPO firms. Strategic Management Journal 24: 803–20. [Google Scholar] [CrossRef] [Green Version]
- Carter, Richard, and Steven Manaster. 1990. Initial public offerings and underwriter reputation. Journal of Finance 45: 1045–67. [Google Scholar] [CrossRef]
- Caves, Richard E. 1971. International corporations: The industrial economics of foreign investment. Economica 38: 1–27. [Google Scholar] [CrossRef]
- Caves, Richard E. 2007. Multinational Enterprise and Economic Analysis, 3rd ed. New York: Cambridge University Press. [Google Scholar]
- Celikyurt, Ugur, Merih Sevilir, and Anil Shivdasani. 2010. Going public to acquire? The acquisition motive in IPOs. Journal of Financial Economics 96: 345–63. [Google Scholar] [CrossRef]
- Certo, S. Trevis. 2003. Influencing initial public offering investors with prestige: Signaling with board structures. Academy of Management Review 28: 432–46. [Google Scholar] [CrossRef] [Green Version]
- Certo, S. Trevis, Tim R. Holcomb, and R. Michael Holmes. 2009. IPO research in management and entrepreneurship: Moving the agenda forward. Journal of Management 35: 1340–78. [Google Scholar] [CrossRef]
- Chakrabarti, Rajesh, Swasti Gupta-Mukherjee, and Narayanan Jayaraman. 2009. Mars–Venus marriages: Culture and cross-border M&A. Journal of International Business Studies 40: 216–37. [Google Scholar]
- Chari, Murali D. R., and Kiyoung Chang. 2009. Determinants of the share of equity sought in cross-border acquisitions. Journal of International Business Studies 40: 1277–97. [Google Scholar] [CrossRef]
- Chen, Yangyang, Edward J. Podolski, S. Ghon Rhee, and Madhu Veeraraghavan. 2014. Local gambling preferences and corporate innovative success. Journal of Financial and Quantitative Analysis 49: 77–106. [Google Scholar] [CrossRef] [Green Version]
- Chung, Kee H., and Stephen W. Pruitt. 1994. A simple approximation of Tobin’s q. Financial Management 23: 70–74. [Google Scholar] [CrossRef]
- Collins, Jamie D., Tim R. Holcomb, S. Trevis Certo, Michael A. Hitt, and Richard H. Lester. 2009. Learning by doing: Cross-border mergers and acquisitions. Journal of Business Research 62: 1329–34. [Google Scholar] [CrossRef]
- Corwin, Shane, and Jeffrey H. Harris. 2001. The initial listing decisions of firms that go public. Financial Management 30: 35–55. [Google Scholar] [CrossRef]
- Corwin, Shane A., and Paul Schultz. 2012. A simple way to estimate bid-ask spreads from daily high and low prices. Journal of Finance 67: 719–60. [Google Scholar] [CrossRef]
- Coviello, Nicole E. 2006. The network dynamics of international new ventures. Journal of International Business Studies 37: 713–31. [Google Scholar] [CrossRef]
- Cox, D. R. 1972. Regression models and life-tables. Journal of the Royal Statistical Society B 34: 187–220. [Google Scholar] [CrossRef]
- De Maeseneire, Wouter, and Tine Claeys. 2012. SMEs, foreign direct investment and financial constraints: The case of Belgium. International Business Review 21: 408–24. [Google Scholar] [CrossRef]
- Delios, Andrew, and Paul W. Beamish. 1999. Geographic scope, product diversification and the corporate performance of Japanese firms. Strategic Management Journal 20: 711–21. [Google Scholar] [CrossRef]
- Dikova, Desislava, Padma Rao Sahib, and Arjen van Witteloostuijn. 2010. Cross-border acquisition abandonment and completion: The effect of institutional differences and organizational learning in the international business service industry, 1981–2001. Journal of International Business Studies 41: 223–45. [Google Scholar] [CrossRef]
- Draho, Jason. 2004. The IPO decision: Why and How Companies go Public. Cheltenham: Edward Elgar Publishing. [Google Scholar]
- Eun, Cheol S., Richard Kolodny, and Carl Scheraga. 1996. Cross-border acquisitions and shareholder wealth: Tests of the synergy and internalization hypotheses. Journal of Banking and Finance 20: 1559–82. [Google Scholar] [CrossRef]
- Fernhaber, Stephanie A., Patricia P. Mcdougall-Covin, and Dean A. Shepherd. 2009. International entrepreneurship: Leveraging internal and external knowledge sources. Strategic Entrepreneurship Journal 3: 297–320. [Google Scholar] [CrossRef]
- Fiegenbaum, Avi, J. Myles Shaver, and Bernard Yeung. 1997. Which firms expand to the Middle East: The experience of US multinationals. Strategic Management Journal 18: 141–48. [Google Scholar] [CrossRef]
- Filatotchev, Igor, and Jenifer Piesse. 2009. R&D, internationalization and growth of newly listed firms: European evidence. Journal of International Business Studies 40: 1260–76. [Google Scholar]
- Frésard, Laurent, Ulrich Hege, and Gordon Phillips. 2017. Extending industry specialization through cross-border acquisitions. Review of Financial Studies 30: 1539–82. [Google Scholar] [CrossRef]
- Gatignon, Hubert, and Erin Anderson. 1988. The multinational corporation’s degree of control over foreign subsidiaries: An empirical test of a transaction cost explanation. Journal of Law, Economics, and Organization 4: 305–36. [Google Scholar]
- George, Gerard, Johan Wiklund, and Shaker A. Zahra. 2005. Ownership and the internationalization of small firms. Journal of Management 31: 210–33. [Google Scholar] [CrossRef]
- Gioia, Carmine, and Steen Thomsen. 2004. International acquisitions in Denmark 1990–97: Selection and performance. Applied Economics Quarterly 50: 61–87. [Google Scholar]
- Graebner, Melissa E. 2009. Caveat venditor: Trust asymmetries in acquisitions of entrepreneurial firms. Academy of Management Journal 52: 435–72. [Google Scholar] [CrossRef] [Green Version]
- Graebner, Melissa E., and Kathleen M. Eisenhardt. 2004. The seller’s side of the story: Acquisition as courtship and governance as syndicate in entrepreneurial firms. Administrative Science Quarterly 49: 366–403. [Google Scholar]
- Gulati, Ranjay, and Monica C. Higgins. 2003. Which ties matter when? The contingent effects of interorganizational partnerships on IPO success. Strategic Management Journal 24: 127–44. [Google Scholar] [CrossRef]
- Habib, Michel A., and Alexander P. Ljungqvist. 2001. Underpricing and entrepreneurial wealth losses in IPOs: Theory and evidence. Review of Financial Studies 14: 433–58. [Google Scholar] [CrossRef]
- Hall, Bronwyn H. 2002. The financing of research and development. Oxford Review of Economic Policy 18: 35–51. [Google Scholar] [CrossRef]
- Haveman, Heather A., and Lisa E. Cohen. 1994. The ecological dynamics of careers: The impact of organizational founding, dissolution, and merger on job mobility. American Journal of Sociology 100: 104–52. [Google Scholar] [CrossRef]
- Hijzen, Alexander, Holger Görg, and Miriam Manchin. 2008. Cross-border mergers and acquisitions and the role of trade costs. European Economic Review 52: 849–66. [Google Scholar] [CrossRef] [Green Version]
- Hitt, Michael A., David Ahlstrom, M. Tina Dacin, Edward Levitas, and Lilia Svobodina. 2004. The institutional effects on strategic alliance partner selection in transition economies: China vs. Russia. Organization Science 15: 173–85. [Google Scholar] [CrossRef]
- Hitt, Michael A., Laszlo Tihanyi, Toyah Miller, and Brian Connelly. 2006. International diversification: Antecedents, outcomes, and moderators. Journal of Management 32: 831–67. [Google Scholar] [CrossRef] [Green Version]
- Hong, Harrison, Terence Lim, and Jeremy C. Stein. 2000. Bad news travels slowly: Size, analyst coverage, and the profitability of momentum strategies. Journal of Finance 55: 265–95. [Google Scholar] [CrossRef]
- Hovakimian, Armen, and Irena Hutton. 2010. Merger-Motivated IPOs. Financial Management 39: 1547–73. [Google Scholar] [CrossRef]
- Hsieh, Jim, Evgeny Lyandres, and Alexei Zhdanov. 2011. A theory of merger-driven IPOs. Journal of Financial and Quantitative Analysis 46: 1367–405. [Google Scholar] [CrossRef] [Green Version]
- Hsu, Po-Hsuan, Peng Huang, Mark Humphery-Jenner, and Ronan Powell. 2021. Cross-border mergers and acquisitions for innovation. Journal of International Money and Finance 112: 102320. [Google Scholar] [CrossRef]
- Hymer, Stephen H. 1976. International Operations of National Firms. Cambridge: MIT press. [Google Scholar]
- Jensen, Michael C. 1986. Agency costs of free cash flow, corporate finance, and takeovers. American Economic Review 76: 323–29. [Google Scholar]
- Jensen, Michael. 2004. Who gets Wall Street’s attention? How alliance announcements and alliance density affect analyst coverage. Strategic Organization 2: 293–312. [Google Scholar] [CrossRef] [Green Version]
- Kamien, Morton I., and Israel Zang. 2000. Meet me halfway: Research joint ventures and absorptive capacity. International Journal of Industrial Organization 18: 995–1012. [Google Scholar] [CrossRef]
- Kang, Jun-Koo, and Jin-Mo Kim. 2010. Do foreign investors exhibit a corporate governance disadvantage? An information asymmetry perspective. Journal of International Business Studies 41: 1415–38. [Google Scholar] [CrossRef]
- Kotabe, Masaaki. 1990. Corporate product policy and innovative behavior of European and Japanese multinationals: An empirical investigation. Journal of Marketing 54: 19–33. [Google Scholar] [CrossRef]
- Kotha, Suresh, Violina P. Rindova, and Frank T. Rothaermel. 2001. Assets and actions: Firm-specific factors in the internationalization of US Internet firms. Journal of International Business Studies 32: 769–91. [Google Scholar] [CrossRef]
- Kumar, Vikas, Deeksha Singh, Anish Purkayastha, Manish Popli, and Ajai Gaur. 2020. Springboard internationalization by emerging market firms: Speed of first cross-border acquisition. Journal of International Business Studies 51: 172–93. [Google Scholar] [CrossRef]
- Laufs, Katharina, and Christian Schwens. 2014. Foreign market entry mode choice of small and medium-sized enterprises: A systematic review and future research agenda. International Business Review 23: 1109–26. [Google Scholar] [CrossRef]
- Lee, Tung-Jean, and Richard E. Caves. 1998. Uncertain outcomes of foreign investment: Determinants of the dispersion of profits after large acquisitions. Journal of International Business Studies 29: 563–81. [Google Scholar] [CrossRef]
- Lin, D. Y., and L. -J. Wei. 1989. The robust inference for the Cox proportional hazards model. Journal of the American Statistical Association 84: 1074–78. [Google Scholar] [CrossRef]
- Loughran, Tim, and Jay Ritter. 2004. Why has IPO underpricing changed over time? Financial Management 33: 5–37. [Google Scholar] [CrossRef] [Green Version]
- Lu, Jane W., and Paul W. Beamish. 2001. The internationalization and performance of SMEs. Strategic Management Journal 22: 565–86. [Google Scholar] [CrossRef]
- Madhok, Anoop, and Mohammad Keyhani. 2012. Acquisitions as entrepreneurship: Asymmetries, opportunities, and the internationalization of multinationals from emerging economies. Global Strategy Journal 2: 26–40. [Google Scholar] [CrossRef]
- Mairesse, Jacques, and Bronwyn H. Hall. 1996. Estimating the Productivity of Research and Development: An Exploration of GMM Methods Using Data on French and United States Manufacturing Firms. Cambridge: National Bureau of Economic Research. [Google Scholar]
- Markides, Constantinos, and Daniel Oyon. 1998. International acquisitions: Do they create value for shareholders? European Management Journal 16: 125–35. [Google Scholar] [CrossRef]
- Megginson, William L., and Kathleen A. Weiss. 1991. Venture capitalist certification in initial public offerings. Journal of Finance 46: 879–903. [Google Scholar] [CrossRef]
- Merton, Robert C. 1987. A simple model of capital market equilibrium with incomplete information. Journal of Finance 42: 483–510. [Google Scholar] [CrossRef]
- Morck, Randall, and Bernard Yeung. 1992. Internalization: An event study test. Journal of International Economics 33: 41–56. [Google Scholar] [CrossRef]
- Myers, Stewart C, and Nicholas S. Majluf. 1984. Corporate financing and investment decisions when firms have information that investors do not have. Journal of Financial Economics 13: 187–221. [Google Scholar] [CrossRef] [Green Version]
- Nadolska, Anna, and Harry G. Barkema. 2007. Learning to internationalise: The pace and success of foreign acquisitions. Journal of International Business Studies 38: 1170–86. [Google Scholar] [CrossRef]
- Nicholson, Sean, Patricia M. Danzon, and Jeffrey McCullough. 2005. Biotech-pharmaceutical alliances as a signal of asset and firm quality. Journal of Business 78: 1433–64. [Google Scholar] [CrossRef] [Green Version]
- Papanastassiou, Marina, Robert Pearce, and Antonello Zanfei. 2020. Changing perspectives on the internationalization of R&D and innovation by multinational enterprises: A review of the literature. Journal of International Business Studies 51: 623–64. [Google Scholar]
- Pearce, Robert D. 1993. The Growth and Evolution of Multinational Enterprise: Patterns of Geographical and Industrial Diversification. Cheltenham: Edward Elgar. [Google Scholar]
- Ragozzino, Roberto, and Jeffrey J. Reuer. 2007. Initial public offerings and the acquisition of entrepreneurial firms. Strategic Organization 5: 155–76. [Google Scholar] [CrossRef]
- Reuer, Jeffrey J., and Roberto Ragozzino. 2014. Signals and international alliance formation: The roles of affiliations and international activities. Journal of International Business Studies 45: 321–37. [Google Scholar] [CrossRef]
- Riley, John G. 2001. Silver signals: Twenty-five years of screening and signaling. Journal of Economic Literature 39: 432–78. [Google Scholar] [CrossRef] [Green Version]
- Ritter, Jay R. 1991. The long-run performance of initial public offerings. Journal of Finance 46: 3–27. [Google Scholar] [CrossRef]
- Rothaermel, Frank T., and David L. Deeds. 2004. Exploration and exploitation alliances in biotechnology: A system of new product development. Strategic Management Journal 25: 201–21. [Google Scholar] [CrossRef]
- Sanders, Wm. Gerard, and Steven Boivie. 2004. Sorting things out: Valuation of new firms in uncertain markets. Strategic Management Journal 25: 167–86. [Google Scholar] [CrossRef]
- Sapienza, Harry J., Erkko Autio, Gerard George, and Shaker A. Zahra. 2006. A capabilities perspective on the effects of early internationalization on firm survival and growth. Academy of Management Review 31: 914–33. [Google Scholar] [CrossRef]
- Schwartz, Robert A., and James E. Shapiro. 1992. The challenge of institutionalization of the equity market. In Recent Developments in Finance. Edited by A. Sauders. New York: Salomon Center. [Google Scholar]
- Servaes, Henri. 1991. Tobin’s Q and the gains from takeovers. Journal of Finance 46: 409–19. [Google Scholar] [CrossRef]
- Seth, Anju, Kean P. Song, and R. Richard Pettit. 2002. Value creation and destruction in cross-border acquisitions: An empirical analysis of foreign acquisitions of US firms. Strategic Management Journal 23: 921–40. [Google Scholar] [CrossRef]
- Shah, Reshma H., and Vanitha Swaminathan. 2008. Factors influencing partner selection in strategic alliances: The moderating role of alliance context. Strategic Management Journal 29: 471–94. [Google Scholar] [CrossRef]
- Shan, Weijan, Gordon Walker, and Bruce Kogut. 1994. Interfirm cooperation and startup innovation in the biotechnology industry. Strategic Management Journal 15: 387–94. [Google Scholar] [CrossRef]
- Shaver, J. Myles. 2011. The benefits of geographic sales diversification: How exporting facilitates capital investment. Strategic Management Journal 32: 1046–60. [Google Scholar] [CrossRef]
- Shimizu, Katsuhiko, Michael A. Hitt, Deepa Vaidyanath, and Vincenzo Pisano. 2004. Theoretical foundations of cross-border mergers and acquisitions: A review of current research and recommendations for the future. Journal of International Management 10: 307–53. [Google Scholar] [CrossRef]
- Spence, Michael. 1974. Market Signaling. Cambridge: Harvard University Press. [Google Scholar]
- Stiebale, Joel. 2016. Cross-border M&As and innovative activity of acquiring and target firms. Journal of International Economics 99: 1–15. [Google Scholar]
- Stiglitz, Joseph E. 2002. Information and the change in the paradigm in economics. American Economic Review 92: 460–501. [Google Scholar] [CrossRef] [Green Version]
- Stiglitz, Joseph E., and Andrew Weiss. 1981. Credit rationing in markets with imperfect information. American Economic Review 71: 393–410. [Google Scholar]
- Stinchcombe, Arthur L. 1965. Organizations and social structure. Handbook of Organizations 44: 142–93. [Google Scholar]
- Stuart, Toby E., Ha Hoang, and Ralph C. Hybels. 1999. Interorganizational endorsements and the performance of entrepreneurial ventures. Administrative Science Quarterly 44: 315–49. [Google Scholar] [CrossRef] [Green Version]
- Szücs, Florian. 2014. M&A and R&D: Asymmetric effects on acquirers and targets? Research Policy 43: 1264–73. [Google Scholar]
- Teece, David J. 1986. Transactions cost economics and the multinational enterprise: An assessment. Journal of Economic Behavior and Organization 7: 21–45. [Google Scholar] [CrossRef]
- Villalonga, Belén. 2004. Intangible resources, Tobin’s q, and sustainability of performance differences. Journal of Economic Behavior and Organization 54: 205–30. [Google Scholar] [CrossRef]
- Zahra, Shaker A., R. Duane Ireland, and Michael A. Hitt. 2000. International expansion by new venture firms: International diversity, mode of market entry, technological learning, and performance. Academy of Management Journal 43: 925–50. [Google Scholar]
Figure 1.
R&D Intensity and International Alliance Experience Plus Foreign Sales Intensity.


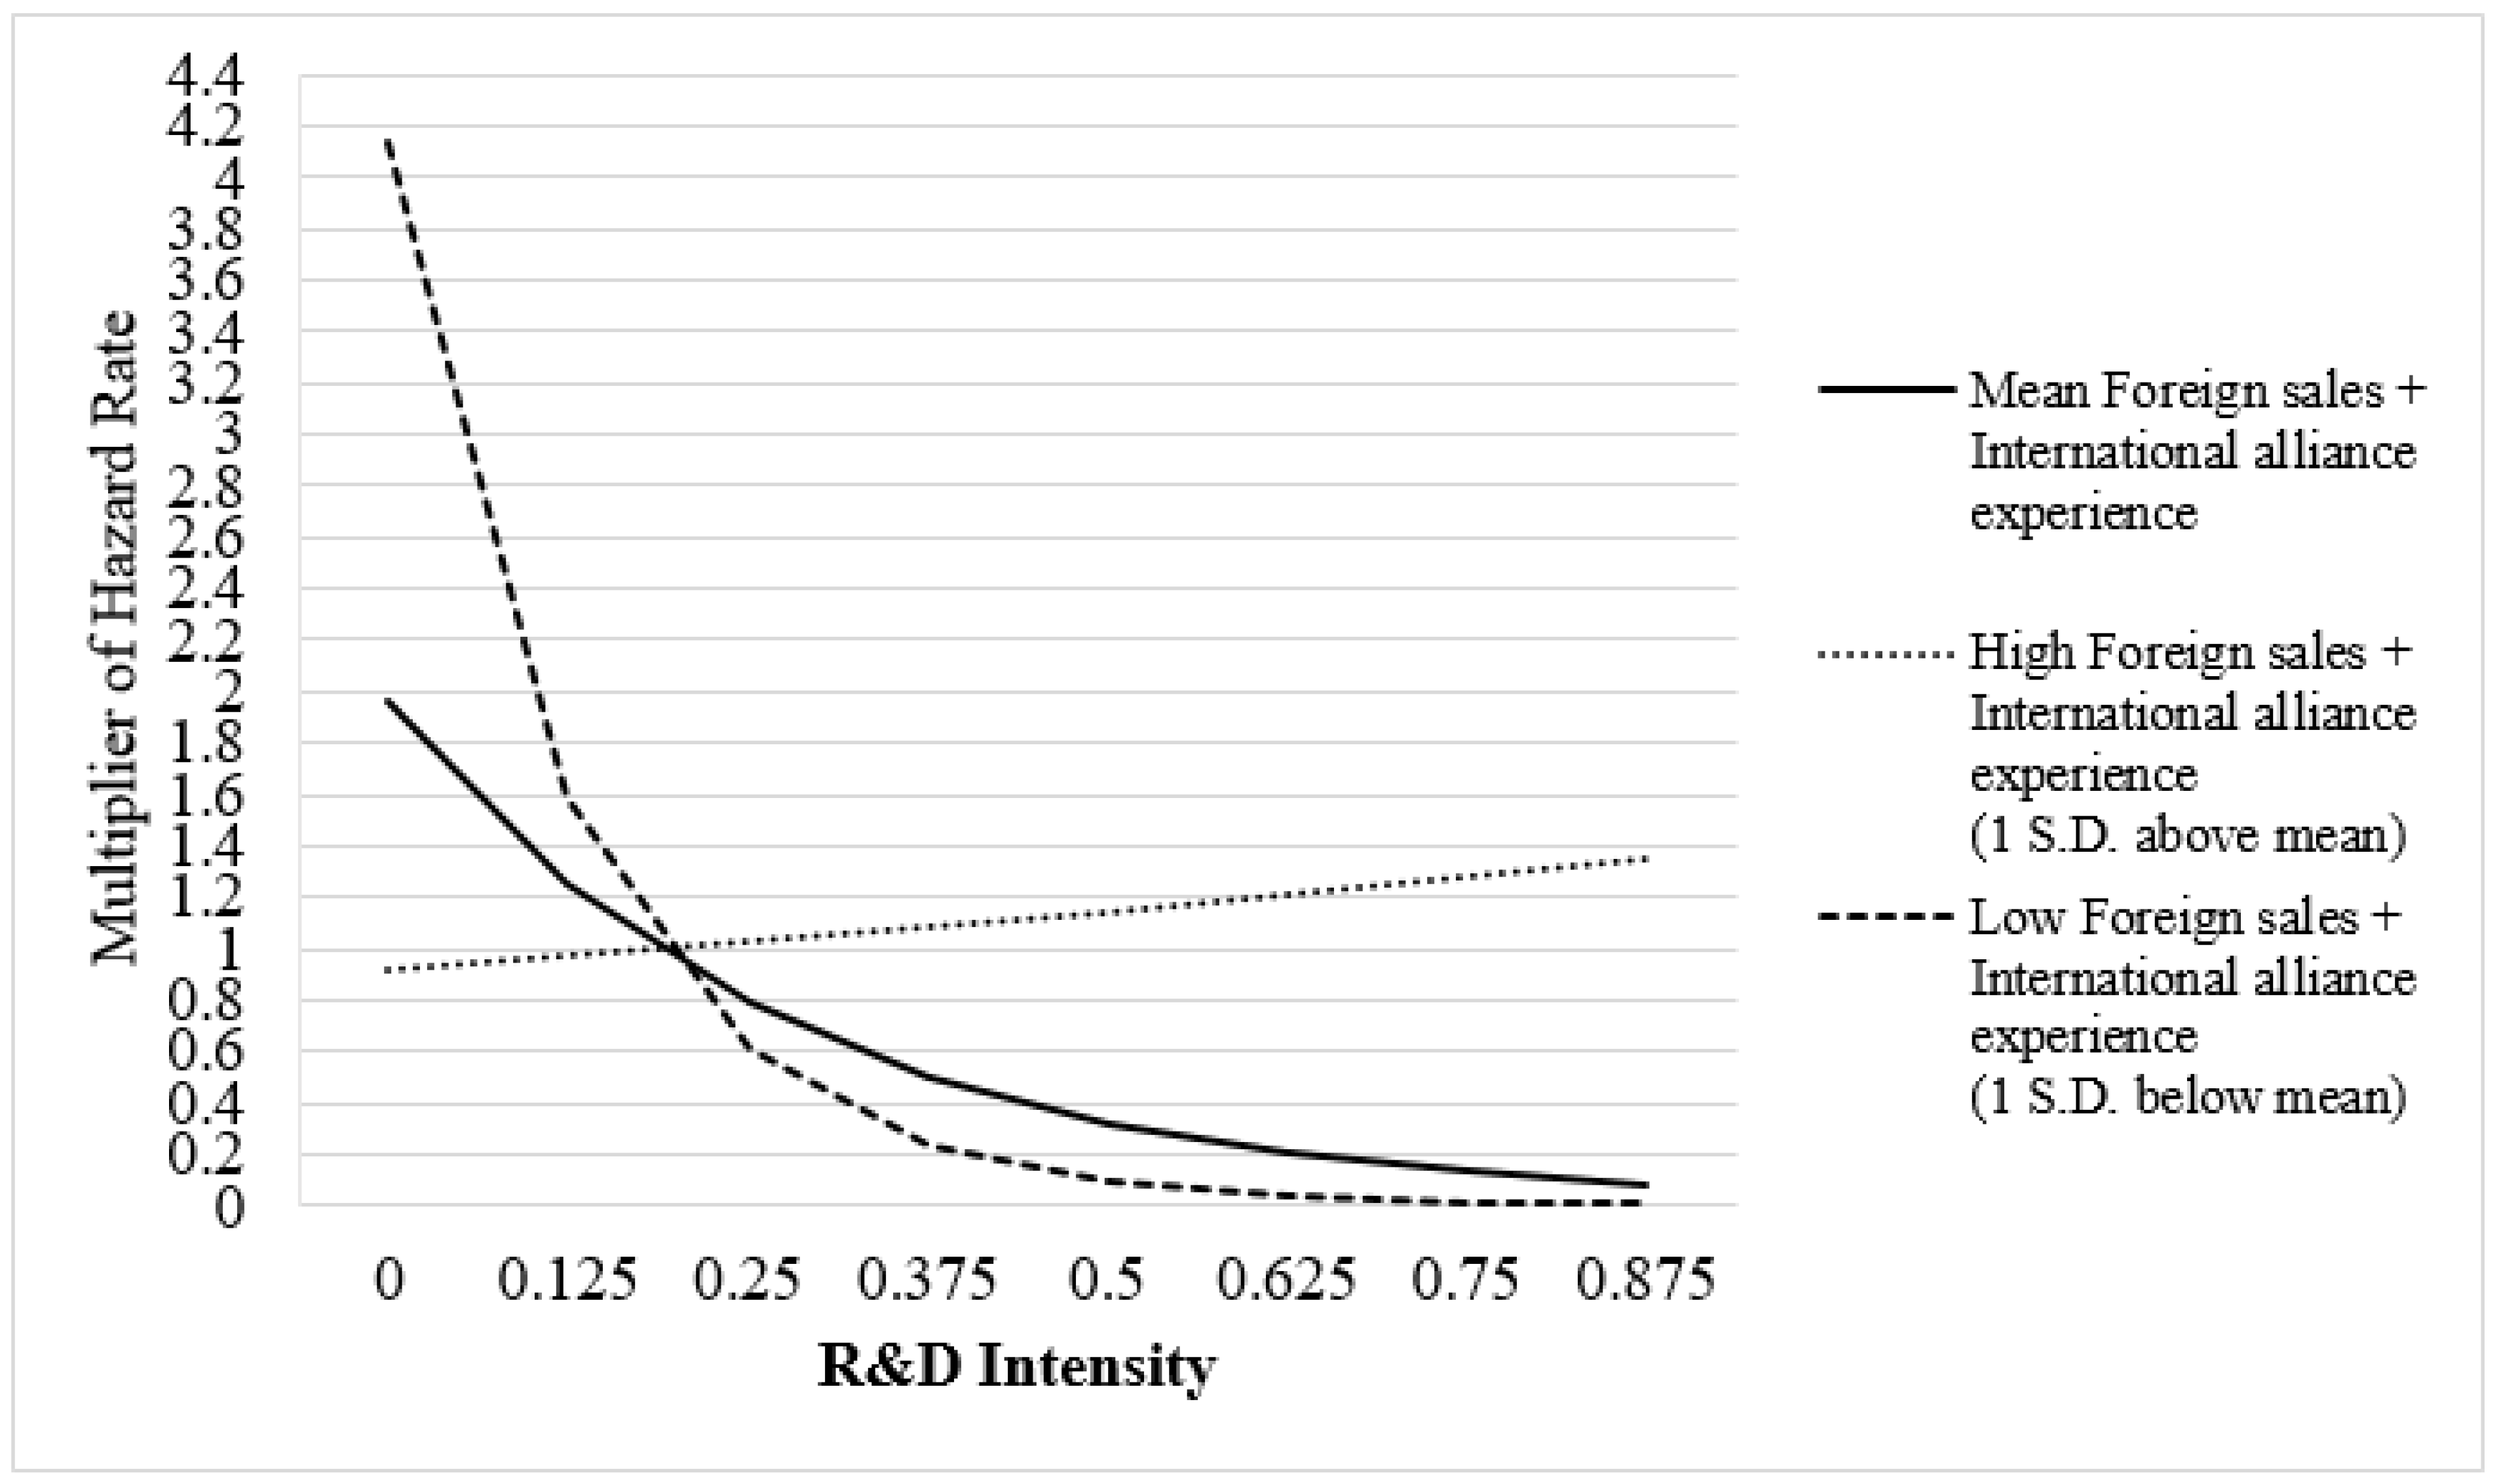
Table 1.
Descriptive Statistics and Correlation Matrix (cont’d).
| Variables | 10 | 11 | 12 | 13 | 14 | 15 | 16 | 17 | 18 |
|---|---|---|---|---|---|---|---|---|---|
| 1. Post-IPO International M&A Event | |||||||||
| 2. R&D intensity | |||||||||
| 3. International alliance experience | |||||||||
| 4. Foreign sales intensity | |||||||||
| 5. Firm size (log) | |||||||||
| 6. Firm age | |||||||||
| 7. Tobin’s Q | |||||||||
| 8. Free cash flow | |||||||||
| 9. IPO proceeds | |||||||||
| 10. Proceeds used for acquisition | -- | ||||||||
| 11. Investment bank reputation | −0.062 | -- | |||||||
| 12. Venture capitalist backing | −0.103 | 0.285 | -- | ||||||
| 13. IPO underpricing | −0.036 | 0.044 | 0.044 | -- | |||||
| 14. Analyst coverage | 0.004 | 0.417 | 0.123 | 0.205 | -- | ||||
| 15. Seasoned equity offering | −0.060 | −0.121 | 0.171 | −0.004 | −0.115 | -- | |||
| 16. Debt offering | 0.040 | −0.001 | −0.160 | -0.072 | −0.039 | −0.083 | -- | ||
| 17. Capital expenditure | 0.021 | −0.105 | −0.142 | 0.006 | −0.006 | −0.089 | 0.068 | -- | |
| 18. International M&A experience | 0.038 | 0.080 | −0.132 | 0.012 | 0.106 | −0.145 | 0.062 | 0.008 | -- |
| 19. Major exchange | 0.056 | 0.077 | −0.106 | 0.117 | −0.148 | −0.110 | 0.013 | 0.138 | 0.060 |
The overall sample consists of 1630 firms in the manufacturing industry that went public during 1991–2015. We trace these firms’ post-IPO international acquisitions up to five years after their IPOs (i.e., over the 1991–2000 period) and have 5437 firm-year observations. R&D intensity: the ratio of R&D to total assets, International alliance experience: a firm’s number of international alliances, Foreign sales intensity: ratio of foreign sales to total sales, Firm size: a firm’s total number of employees, Firm age: the number of years between a firm’s founding year and each yearly spell, Tobin’s Q: a firm’s market value divided by total assts, Free cash flow: a firm’s earnings before extraordinary items plus depreciation scaled by the book value of equity, IPO proceeds: the total amount of capital raised from the IPO market scaled by total assets, Proceeds used for acquisition: an indicator variable showing whether or not acquisition financing was one of the stated reasons for going public, Investment bank reputation: the reputation of a firm’s lead underwriter at the time of IPO, Venture capitalist backing: an indicator variable showing whether or not a firm was backed by a venture capitalist at the time of IPO, Analyst coverage: the number of analysts who provide earnings forecast of a firm, Seasoned equity offering: the total amount of additional equity capital raised as a percentage of total assets, Capital expenditures: the capital expenditure scaled by total assets, and Major exchange: an indicator variable showing whether or not a firm was listed on the New York Stock Exchange or NASDAQ.
Table 2.
Cox Regression Results for Post-IPO International M&A.
| Prob(Post-IPO International M&A Event) | |||||
|---|---|---|---|---|---|
| Independent Variables | Model 1 | Model 2 | Model 3 | Model 4 | Model 5 |
| Year Fixed Effects | Included | Included | Included | Included | Included |
| Industry Fixed Effects | Included | Included | Included | Included | Included |
| Firm size | 0.132 ** (0.063) | 0.091 (0.063) | 0.092 (0.062) | 0.091 (0.063) | 0.092 (0.062) |
| Firm age | 0.003 (0.003) | 0.001 (0.003) | 0.002 (0.003) | 0.001 (0.003) | 0.002 (0.003) |
| Tobin’s Q | 0.023 (0.016) | 0.025 * (0.015) | 0.024 (0.015) | 0.025 * (0.015) | 0.024 (0.015) |
| Free cash flow | 0.001 ** (0.000) | 0.001 *** (0.000) | 0.001 *** (0.000) | 0.001 *** (0.000) | 0.001 *** (0.001) |
| IPO proceeds | −1.080 *** (0.272) | −0.781 *** (0.284) | −0.790 *** (0.287) | −0.781 *** (0.284) | −0.790 *** (0.287) |
| Proceeds used for acquisition | −0.281 (0.398) | −0.246 (0.384) | −0.265 (0.381) | −0.245 (0.385) | −0.264 (0.381) |
| Investment bank reputation | 0.001 (0.043) | 0.007 (0.045) | 0.002 (0.045) | 0.007 (0.045) | 0.002 (0.045) |
| Venture capitalist backing | −0.608 *** (0.177) | −0.385 ** (0.186) | −0.360 ** (0.187) | −0.385 ** (0.186) | −0.360 ** (0.187) |
| IPO underpricing | −0.011 (0.194) | −0.086 (0.218) | −0.095 (0.222) | −0.084 (0.220) | −0.093 (0.223) |
| Analyst coverage | 0.374 *** (0.138) | 0.383 *** (0.142) | 0.396 *** (0.143) | 0.382 *** (0.141) | 0.395 *** (0.143) |
| Seasoned equity offering | 0.113 (0.318) | 0.406 (0.352) | 0.453 (0.348) | 0.407 (0.351) | 0.454 (0.348) |
| Debt offering | 0.300 (0.245) | 0.227 (0.241) | 0.206 (0.246) | 0.226 (0.241) | 0.205 (0.246) |
| Capital expenditure | −2.430 (1.620) | −2.897 * (1.623) | −2.954 * (1.636) | −2.900 * (1.624) | −2.958 * (1.637) |
| International M&A experience | 0.663 *** (0.140) | 0.666 *** (0.138) | 0.684 *** (0.139) | 0.664 *** (0.139) | 0.682 *** (0.141) |
| Major exchange | 0.260 (0.290) | 0.289 (0.290) | 0.279 (0.290) | 0.289 (0.290) | 0.279 (0.289) |
| International alliance experience | 0.288 ** (0.132) | 0.316 ** (0.138) | 0.289 ** (0.132) | 0.318 ** (0.139) | |
| Foreign sales intensity | 0.385 ** (0.191) | 0.413 ** (0.184) | 0.380 ** (0.189) | 0.406 ** (0.181) | |
| R&D intensity | −3.600 *** (1.125) | −4.150 *** (1.067) | −3.595 *** (1.123) | −4.145 *** (1.067) | |
| R&D intensity * International alliance experience | 4.747 *** (1.545) | 4.759 *** (1.553) | |||
| R&D intensity * Foreign sales intensity | 1.330 ** (0.630) | 1.461 ** (0.651) | |||
| Log likelihood | −1263.68 | −1252.14 | −1249.31 | −1250.13 | −1247.30 |
| χ2 | 190.64 *** | 212.59 *** | 218.260 *** | 218.60 *** | 220.28 *** |
| −2[L(βbaseline) − L(βi)] ~ χ2 | 22.48 *** | 28.14 *** | 26.50 *** | 32.16 *** | |
N = 5437. Robust standard errors appear in parentheses. * p < 0.10, ** p < 0.05, *** p < 0.01. The table presents Cox proportional hazard estimations of IPO firms’ international acquisitions within the five years after their IPOs. The dependent variable is the duration of an international acquisition event in a given yearly spell over the 1991–2020 period. The variables of interest include: the ratio of R&D to total assets (R&D intensity), and its interaction with a firm’s number of international alliances (international alliance experience) as well as the ratio of foreign sales to total sales (foreign sales intensity). The control variables include: a firm’s total number of employees (firm size), the number of years between a firm’s founding year and each yearly spell (firm age), a firm’s market value divided by total assts (Tobin’s Q), a firm’s earnings before extraordinary items plus depreciation scaled by the book value of equity (free cash flow), the total amount of capital raised from the IPO market scaled by total assets (IPO proceeds), an indicator variable showing whether or not acquisition financing was one of the stated reasons for going public (proceeds used for acquisition), the reputation of a firm’s lead underwriter at the time of IPO (investment bank reputation), an indicator variable showing whether or not a firm was backed by a venture capitalist at the time of IPO (venture capitalist backing), the number of analysts who provide earnings forecast of a firm (analyst coverage), the total amount of additional equity capital raised as a percentage of total assets (seasoned equity offering), the capital expenditure scaled by total assets (capital expenditures), and indicator variable showing whether or not a firm was listed on the New York Stock Exchange or NASDAQ (major exchange). All specifications include year and industry fixed effects. Industries are defined based on the three-digit SIC classification.
Table 3.
Cox Regression Results for All Manufacturing Firms’ International M&A.
| Prob(International M&A Event) | ||
|---|---|---|
| Independent Variables | Model 1 | Model 2 |
| Year Fixed Effects | Included | Included |
| Industry Fixed Effects | Included | Included |
| Firm size | 0.214 *** (0.029) | 0.216 *** (0.029) |
| Firm age | 0.002 ** (0.001) | 0.002 ** (0.001) |
| Tobin’s Q | −0.001 (0.001) | −0.001 (0.001) |
| Free cash flow | 0.001 ** (0.000) | 0.001 ** (0.000) |
| Analyst coverage | 0.355 *** (0.028) | 0.352 *** (0.029) |
| Seasoned equity offering | −0.491 *** (0.185) | −0.486 *** (0.185) |
| Debt offering | −0.060 (0.104) | −0.063 (0.104) |
| Capital expenditure | −1.722 *** (0.586) | −1.749 *** (0.591) |
| International M&A experience | 0.918 *** (0.042) | 0.919 *** (0.042) |
| Major exchange | 0.037 (0.082) | 0.035 (0.082) |
| International alliance experience | 0.075 ** (0.037) | 0.181 * (0.107) |
| Foreign sales intensity | −0.013 (0.050) | −0.011 (0.036) |
| R&D intensity | 1.887 *** (0.300) | 1.930 *** (0.303) |
| R&D intensity * International alliance experience | 0.659 (0.664) | |
| R&D intensity * Foreign sales intensity | 0.059 (0.363) | |
| Log likelihood | −14,595.30 | −14,594.78 |
| χ2 | 3153.42 *** | 3154.38 *** |
N = 45,433. Robust standard errors appear in parentheses. * p < 0.10, ** p < 0.05, *** p < 0.01. The table presents Cox proportional hazard estimations on a sample that includes all public firms in the manufacturing industry. The dependent variable is the duration of an international acquisition event in a given yearly spell over the 1990–2019 period. The variables of interest include: the ratio of R&D to total assets (R&D intensity), and its interaction with a firm’s number of international alliances (international alliance experience) as well as the ratio of foreign sales to total sales (foreign sales intensity). The control variables include: a firm’s total number of employees (firm size), the number of years between a firm’s founding year and each yearly spell (firm age), a firm’s market value divided by total assts (Tobin’s Q), a firm’s earnings before extraordinary items plus depreciation scaled by the book value of equity (free cash flow), the number of analysts who provide earnings forecast of a firm (analyst coverage), the total amount of additional equity capital raised as a percentage of total assets (seasoned equity offering), the capital expenditure scaled by total assets (capital expenditures), and indicator variable showing whether or not a firm was listed on the New York Stock Exchange or NASDAQ. All specifications include year and industry fixed effects. Industries are defined based on three-digit SIC classification.
Table 4.
Cox Regression Results for IPO Acquirers’ International M&A across Years.
| Prob(Post-IPO International M&A Event) | ||||||
|---|---|---|---|---|---|---|
| Independent Variables | 5 Year | 6 Year | 7 Year | 8 Year | 9 Year | 10 Year |
| Year Fixed Effects | Included | Included | Included | Included | Included | Included |
| Industry Fixed Effects | Included | Included | Included | Included | Included | Included |
| Firm size | 0.092 (0.062) | 0.156 *** (0.060) | 0.188 *** (0.052) | 0.178 *** (0.048) | 0.173 *** (0.050) | 0.176 *** (0.051) |
| Firm age | 0.002 (0.003) | 0.001 (0.003) | 0.000 (0.003) | 0.000 (0.003) | 0.000 (0.003) | 0.000 (0.002) |
| Tobin’s Q | 0.024 (0.015) | 0.027 ** (0.014) | 0.020 (0.012) | 0.024 * (0.013) | 0.025 * (0.013) | 0.026 ** (0.013) |
| Free cash flow | 0.001 *** (0.001) | 0.001 ** (0.000) | 0.001 ** (0.000) | 0.001 *** (0.000) | 0.001 *** (0.000) | 0.001 *** (0.000) |
| IPO proceeds | −0.790 *** (0.287) | −0.660 ** (0.286) | −0.539 ** (0.248) | −0.694 *** (0.251) | −0.676 *** (0.238) | −0.580 ** (0.225) |
| Proceeds used for acquisition | 0.264 (0.381) | 0.071 (0.323) | 0.288 (0.346) | 0.216 (0.267) | 0.088 (0.263) | 0.146 (0.277) |
| Investment bank reputation | 0.002 (0.045) | 0.022 (0.044) | 0.020 (0.041) | 0.018 (0.038) | 0.027 (0.038) | 0.025 (0.036) |
| Venture capitalist backing | −0.360 * (0.187) | −0.305 * (0.175) | −0.254 (0.158) | −0.289 * (0.149) | −0.316 * (0.191) | −0.327 * (0.194) |
| IPO underpricing | −0.093 (0.223) | −0.094 (0.196) | −0.049 (0.162) | −0.151 (0.150) | −0.215 (0.146) | −0.238 (0.153) |
| Analyst coverage | 0.395 *** (0.143) | 0.415 *** (0.132) | 0.422 *** (0.122) | 0.415 *** (0.112) | 0.389 *** (0.110) | 0.387 *** (0.104) |
| Seasoned equity offering | 0.454 (0.348) | 0.274 (0.351) | 0.252 (0.333) | 0.246 (0.322) | 0.184 (0.312) | 0.270 (0.301) |
| Debt offering | 0.205 (0.246) | 0.137 (0.254) | 0.179 (0.247) | 0.037 (0.251) | 0.026 (0.254) | 0.028 (0.246) |
| Capital expenditure | −2.958 * (1.637) | −2.676 (1.702) | −2.763 * (1.593) | −2.299 (1.426) | −2.333 * (1.404) | −2.073 (1.300) |
| International M&A experience | 0.682 *** (0.141) | 0.766 *** (0.132) | 0.743 *** (0.118) | 0.736 *** (0.107) | 0.708 *** (0.106) | 0.721 *** (0.101) |
| Major exchange | 0.279 (0.289) | 0.019 (0.267) | 0.082 (0.260) | −0.010 (0.251) | −0.041 (0.244) | −0.187 (0.225) |
| International alliance experience | 0.318 ** (0.139) | 0.270 ** (0.124) | 0.181 * (0.104) | 0.153 * (0.087) | 0.177 * (0.104) | 0.136 * (0.073) |
| Foreign sales intensity | 0.406 ** (0.181) | 0.417 ** (0.163) | 0.338 ** (0.139) | 0.314 ** (0.135) | 0.305 ** (0.122) | 0.287 ** (0.119) |
| R&D intensity | −4.145 *** (1.067) | −2.810 ** (1.171) | −2.646 ** (1.033) | −2.517 *** (0.956) | −2.428 *** (0.891) | −2.455 *** (0.858) |
| R&D intensity * International alliance experience | 4.759 *** (1.553) | 2.746 ** (1.401) | 3.073 ** (1.548) | 2.940 * (1.661) | 2.755 * (1.658) | 2.778 * (1.652) |
| R&D intensity * Foreign sales intensity | 1.461 ** (0.651) | 1.160 * (0.644) | 1.276 * (0.670) | 1.238 * (0.668) | 1.129 (0.770) | 1.177 (0.748) |
| Log likelihood | −1247.30 | −1445.07 | −1584.39 | −1737.13 | −1857.77 | −1955.97 |
| χ2 | 220.28 *** | 253.33 *** | 287.45 *** | 320.19 *** | 334.85 *** | 337.81 *** |
| N | 5437 | 6162 | 6753 | 7220 | 7625 | 7993 |
Robust standard errors appear in parentheses. * p < 0.10, ** p < 0.05, *** p < 0.01. The table presents Cox proportional hazard estimations of IPO firms’ international acquisitions within the five, six, seven, eight, nine, and ten years after their IPOs respectively. The dependent variable is the duration of an international acquisition event in a given yearly spell over the 1990-2019 period. The variables of interest include: the ratio of R&D to total assets (R&D intensity), and its interaction with a firm’s number of international alliances (international alliance experience) as well as the ratio of foreign sales to total sales (foreign sales intensity). The control variables include: a firm’s total number of employees (firm size), the number of years between a firm’s founding year and each yearly spell (firm age), a firm’s market value divided by total assts (Tobin’s Q), a firm’s earnings before extraordinary items plus depreciation scaled by the book value of equity (free cash flow), the total amount of capital raised from the IPO market scaled by total assets (IPO proceeds), an indicator variable showing whether or not acquisition financing was one of the stated reasons for going public (proceeds used for acquisition), the reputation of a firm’s lead underwriter at the time of IPO (investment bank reputation), an indicator variable showing whether or not a firm was backed by a venture capitalist at the time of IPO (venture capitalist backing), the number of analysts who provide earnings forecast of a firm (analyst coverage), the total amount of additional equity capital raised as a percentage of total assets (seasoned equity offering), the capital expenditure scaled by total assets (capital expenditures), and indicator variable showing whether or not a firm was listed on the New York Stock Exchange or NASDAQ (major exchange). All specifications include year and industry fixed effects. Industries are defined based on the three-digit SIC classification.
Table 5.
Performance Following International Acquisitions.
| Change in ROA | ||
|---|---|---|
| Independent Variables | One-Year | Two-Year |
| Intercept | −0.094 (0.154) | −0.240 (0.209) |
| Year Fixed Effects | Included | Included |
| Industry Fixed Effects | Included | Included |
| Firm size | −0.048 (0.030) | −0.040 * (0.024) |
| Firm age | 0.001 (0.001) | 0.001 * (0.001) |
| Tobin’s Q | −0.001 (0.004) | −0.002 (0.003) |
| Free cash flow | −0.047 (0.031) | −0.037 (0.030) |
| IPO proceeds | 0.209 ** (0.090) | 0.244 ** (0.084) |
| Proceeds used for acquisition | −0.016 (0.074) | −0.037 (0.073) |
| Investment bank reputation | 0.030 ** (0.014) | 0.020 (0.013) |
| Venture capitalist backing | 0.031 (0.053) | 0.042 (0.046) |
| IPO underpricing | 0.022 (0.067) | 0.022 (0.063) |
| Analyst coverage | 0.060 (0.039) | 0.091 ** (0.034) |
| Seasoned equity offering | −0.299 *** (0.088) | −0.250 *** (0.081) |
| Debt offering | 0.016 (0.060) | 0.017 (0.053) |
| Capital expenditure | −0.003 (0.353) | 0.338 (0.305) |
| International M&A experience | 0.111 *** (0.030) | 0.082 *** (0.026) |
| Major exchange | −0.081 (0.089) | −0.029 (0.076) |
| International alliance experience | 0.102 ** (0.052) | −0.041 (0.075) |
| International sales | −0.054 (0.076) | −0.039 (0.069) |
| R&D intensity | 0.662 ** (0.325) | 0.548 ** (0.279) |
| R&D intensity * International alliance experience | 1.497 * (0.909) | 0.330 (0.682) |
| R&D intensity * International sales | −0.850 (0.764) | −0.507 (0.678) |
| Adj. R2 | 0.34 | 0.36 |
N = 743. Robust standard errors appear in parentheses. * p < 0.10, ** p < 0.05, *** p < 0.01. The table presents OLS regression on IPO acquirers’ change in performance following international acquisitions. The dependent variable is changes of operating income over total assets from year t to year t + 1 (one-year horizon), or t + 2 (two-year horizon), where t = 0 is the year of the international acquisition. The performance of each IPO acquirer is adjusted by subtracting the industry average based on 3-digit SIC classification. The variables of interest include: the ratio of R&D to total assets (R&D intensity), and its interaction with a firm’s number of international alliances (international alliance experience) as well as the ratio of foreign sales to total sales (foreign sales intensity). The control variables include: a firm’s total number of employees (firm size), the number of years between a firm’s founding year and each yearly spell (firm age), a firm’s market value divided by total assts (Tobin’s Q), a firm’s earnings before extraordinary items plus depreciation scaled by the book value of equity (free cash flow), the total amount of capital raised from the IPO market scaled by total assets (IPO proceeds), indicator variable showing whether or not acquisition financing was one of the stated reasons for going public (proceeds used for acquisition), the reputation of a firm’s lead underwriter at the time of IPO (investment bank reputation), an indicator variable showing whether or not a firm was backed by a venture capitalist at the time of IPO (venture capitalist backing), the number of analysts who provide earnings forecast of a firm (analyst coverage), the total amount of additional equity capital raised as a percentage of total assets (seasoned equity offering), the capital expenditure scaled by total assets (capital expenditures), and indicator variable showing whether or not a firm was listed on the New York Stock Exchange or NASDAQ. All specifications include year and industry fixed effects. Industries are defined based on three-digit SIC classification.
Table 6.
Using Alternative Intangible Assets Proxies.
| Prob(Post-IPO International M&A Event) | ||||
|---|---|---|---|---|
| Independent Variables | Model 1 | Model 2 | Model 3 | Model 4 |
| Year Fixed Effects | Included | Included | Included | Included |
| Industry Fixed Effects | Included | Included | Included | Included |
| Firm size | 0.143 ** (0.062) | 0.119 * (0.064) | 0.116 * (0.067) | 0.121 * (0.067) |
| Firm age | 0.003 (0.003) | 0.002 (0.003) | 0.003 (0.003) | 0.003 (0.003) |
| Tobin’s Q | 0.026 * (0.014) | 0.027 (0.019) | 0.025 * (0.015) | 0.012 (0.020) |
| Free cash flow | 0.001 * (0.000) | 0.001 (0.001) | 0.000 (0.000) | 0.000 (0.001) |
| IPO proceeds | −0.935 *** (0.252) | −1.091 *** (0.252) | −0.901 *** (0.242) | −1.085 *** (0.251) |
| Proceeds used for acquisition | −0.171 (0.373) | −0.196 (0.372) | −0.240 (0.408) | 0.022 (0.432) |
| Investment bank reputation | −0.002 (0.045) | 0.002 (0.045) | −0.015 (0.042) | −0.026 (0.041) |
| Venture capitalist backing | −0.521 *** (0.169) | −0.458 *** (0.171) | −0.489 *** (0.160) | −0.518 *** (0.164) |
| IPO underpricing | −0.081 (0.192) | −0.232 (0.253) | −0.055 (0.177) | −0.017 (0.193) |
| Analyst coverage | 0.334 ** (0.136) | 0.385 *** (0.141) | 0.277 ** (0.134) | 0.088 (0.141) |
| Seasoned equity offering | 0.029 (0.322) | 0.047 (0.294) | 0.172 (0.292) | −0.157 (0.274) |
| Debt offering | 0.335 (0.264) | 0.205 (0.230) | 0.285 (0.240) | 0.208 (0.229) |
| Capital expenditure | −2.460 (1.676) | −1.594 (1.655) | −0.996 (1.520) | −1.239 (1.581) |
| International M&A experience | 0.580 *** (0.168) | 0.637 *** (0.176) | 0.572 *** (0.142) | 0.546 *** (0.143) |
| Major exchange | 0.288 (0.295) | 0.140 (0.288) | 0.277 (0.295) | 0.259 (0.307) |
| International alliance experience | 0.503 ** (0.212) | 0.914 *** (0.332) | 0.202 * (0.104) | 0.366 * (0.205) |
| Foreign sales intensity | 0.175 ** (0.083) | 0.489 * (0.270) | 0.289 * (0.155) | 0.431 ** (0.207) |
| Intangible intensity | 0.526 (0.450) | |||
| Goodwill intensity | −0.171 * (0.101) | |||
| Bid-ask spread | −27.222 *** (5.831) | |||
| Illiquidity | −0.465 *** (0.119) | |||
| Intangible intensity * International alliance experience | 4.175 ** (2.054) | |||
| Intangible intensity * Foreign sales intensity | −0.957 (1.754) | |||
| Goodwill intensity * International alliance experience | 4.576 *** (0.991) | |||
| Goodwill intensity * Foreign sales intensity | 3.255 ** (1.570) | |||
| Bid-ask spread * International alliance experience | 53.100 *** (15.289) | |||
| Bid-ask spread * Foreign sales intensity | 33.619 ** (15.983) | |||
| Illiquidity * International alliance experience | 0.310 ** (0.137) | |||
| Illiquidity * Foreign sales intensity | 0.467 *** (0.081) | |||
| Log likelihood | −1222.51 | −1178.45 | −1349.61 | −1266.61 |
| χ2 | 152.48 *** | 155.92 *** | 202.23 *** | 199.80 *** |
N = 5437. Robust standard errors appear in parentheses. * p < 0.10, ** p < 0.05, *** p < 0.01. The table presents Cox proportional hazard estimations of IPO firms’ international acquisitions within the five years after their IPOs. The dependent variable is the duration of an international acquisition event in a given yearly spell over the 1990–2019 period. We consider four alternative proxies for the information problems brought by IPO firms’ intangible assets: (1) the ratio of total intangible assets to total assets (Intangible intensity), (2) the ratio of goodwill to total assets (Goodwill intensity), (3) annual average of the ratio of the daily closing bid-ask spread to the closing price, and (4) annual average of daily price response associated with trading volume (Illiquidity). We also include their respective interactions with a firm’s number of international alliances (international alliance experience) as well as the ratio of foreign sales to total sales (foreign sales intensity). The control variables include: a firm’s total number of employees (firm size), the number of years between a firm’s founding year and each yearly spell (firm age), a firm’s market value divided by total assts (Tobin’s Q), a firm’s earnings before extraordinary items plus depreciation scaled by the book value of equity (free cash flow), the total amount of capital raised from the IPO market scaled by total assets (IPO proceeds), an indicator variable showing whether or not acquisition financing was one of the stated reasons for going public (proceeds used for acquisition), the reputation of a firm’s lead underwriter at the time of IPO (investment bank reputation), an indicator variable showing whether or not a firm was backed by a venture capitalist at the time of IPO (venture capitalist backing), the number of analysts who provide earnings forecast of a firm (analyst coverage), the total amount of additional equity capital raised as a percentage of total assets (seasoned equity offering), the capital expenditure scaled by total assets (capital expenditures), and indicator variable showing whether or not a firm was listed on the New York Stock Exchange or NASDAQ (major exchange). All specifications include year and industry fixed effects. Industries are defined based on the three-digit SIC classification.
Publisher’s Note: MDPI stays neutral with regard to jurisdictional claims in published maps and institutional affiliations. |
© 2021 by the authors. Licensee MDPI, Basel, Switzerland. This article is an open access article distributed under the terms and conditions of the Creative Commons Attribution (CC BY) license (https://creativecommons.org/licenses/by/4.0/).
Share and Cite
MDPI and ACS Style
Wu, C.-W.; Reuer, J.J. Effects of R&D Investments and Market Signals on International Acquisitions: Evidence from IPO Firms. J. Risk Financial Manag. 2021, 14, 191. https://doi.org/10.3390/jrfm14050191
AMA Style
Wu C-W, Reuer JJ. Effects of R&D Investments and Market Signals on International Acquisitions: Evidence from IPO Firms. Journal of Risk and Financial Management. 2021; 14(5):191. https://doi.org/10.3390/jrfm14050191
Chicago/Turabian StyleWu, Cheng-Wei, and Jeffrey J. Reuer. 2021. "Effects of R&D Investments and Market Signals on International Acquisitions: Evidence from IPO Firms" Journal of Risk and Financial Management 14, no. 5: 191. https://doi.org/10.3390/jrfm14050191