
Near-Infrared Spectroscopy with Supervised Machine Learning as a Screening Tool for Neutropenia

 , and
, and
Abstract
:
1. Introduction
2. Materials and Methods
2.1. Participants and Samples
2.2. Differential Stain of Blood Cells
2.3. NIR Spectroscopy
2.3.1. NIR Chemometric Analysis
2.3.2. Linear Discriminant Analysis
2.3.3. Logistic Regression
2.3.4. Support Vector Machines
2.3.5. Random Forest
2.3.6. Multilayer Perceptron
2.4. Statistical Analysis
3. Results
4. Discussion
5. Conclusions
Supplementary Materials
Author Contributions
Funding
Institutional Review Board Statement
Informed Consent Statement
Data Availability Statement
Acknowledgments
Conflicts of Interest
References
- Crawford, J.; Dale, D.C.; Lyman, G.H. Chemotherapy-Induced Neutropenia. Cancer 2004, 100, 228–237. [Google Scholar] [CrossRef]
- Lyman, G.H.; Michels, S.L.; Reynolds, M.W.; Barron, R.; Tomic, K.S.; Yu, J. Risk of Mortality in Patients with Cancer Who Experience Febrile Neutropenia. Cancer 2010, 116, 5555–5563. [Google Scholar] [CrossRef]
- Gupta, A. Management of Chemotherapy Induced Neutropenia—An Unmet Clinical Need. Am. J. Biomed. Sci. Res. 2019, 4, 313–318. [Google Scholar] [CrossRef]
- Cao, X.; Ganti, A.K.; Stinchcombe, T.; Wong, M.L.; Ho, J.C.; Shen, C.; Liu, Y.; Crawford, J.; Pang, H.; Wang, X. Predicting Risk of Chemotherapy-Induced Severe Neutropenia: A Pooled Analysis in Individual Patients Data with Advanced Lung Cancer. Lung Cancer 2020, 141, 14–20. [Google Scholar] [CrossRef] [PubMed]
- Danski, M.T.R.; Johann, D.A.; Vayego, S.A.; de Oliveira, G.R.L.; Lind, J. Complicações Relacionadas Ao Uso Do Cateter Venoso Periférico: Ensaio Clínico Randomizado. Acta Paul. Enferm. 2016, 29, 84–92. [Google Scholar] [CrossRef]
- Dimauro, G.; Guarini, A.; Caivano, D.; Girardi, F.; Pasciolla, C.; Iacobazzi, A. Detecting Clinical Signs of Anaemia From Digital Images of the Palpebral Conjunctiva. IEEE Access 2019, 7, 113488–113498. [Google Scholar] [CrossRef]
- van de Weerdt, E.K.; Biemond, B.J.; Baake, B.; Vermin, B.; Binnekade, J.M.; van Lienden, K.P.; Vlaar, A.P.J. Central Venous Catheter Placement in Coagulopathic Patients: Risk Factors and Incidence of Bleeding Complications. Transfusion 2017, 57, 2512–2525. [Google Scholar] [CrossRef] [PubMed]
- Rodriguez-Calero, M.A.; Fernandez-Fernandez, I.; Molero-Ballester, L.J.; Matamalas-Massanet, C.; Moreno-Mejias, L.; de Pedro-Gomez, J.E.; Blanco-Mavillard, I.; Morales-Asencio, J.M. Risk Factors for Difficult Peripheral Venous Cannulation in Hospitalised Patients. Protocol for a Multicentre Case–Control Study in 48 Units of Eight Public Hospitals in Spain. BMJ Open 2018, 8, e020420. [Google Scholar] [CrossRef]
- Kuderer, N.M.; Dale, D.C.; Crawford, J.; Cosler, L.E.; Lyman, G.H. Mortality, Morbidity, and Cost Associated with Febrile Neutropenia in Adult Cancer Patients. Cancer 2006, 106, 2258–2266. [Google Scholar] [CrossRef]
- Baker, M.J.; Hussain, S.R.; Lovergne, L.; Untereiner, V.; Hughes, C.; Lukaszewski, R.A.; Thiéfin, G.; Sockalingum, G.D. Developing and Understanding Biofluid Vibrational Spectroscopy: A Critical Review. Chem. Soc. Rev. 2016, 45, 1803–1818. [Google Scholar] [CrossRef]
- Bunaciu, A.A.; Fleschin, Ş.; Hoang, V.D.; Aboul-Enein, H.Y. Vibrational Spectroscopy in Body Fluids Analysis. Crit. Rev. Anal. Chem. 2017, 47, 67–75. [Google Scholar] [CrossRef]
- Jöbsis, F.F. Noninvasive, Infrared Monitoring of Cerebral and Myocardial Oxygen Sufficiency and Circulatory Parameters. Science 1977, 198, 1264–1267. [Google Scholar] [CrossRef]
- Chaves, R.C.d.F.; Tafner, P.F.d.A.; Chen, F.K.; Meneghini, L.B.; Corrêa, T.D.; Rabello, R.; Cendoroglo, M.; dos Santos, O.F.P.; Serpa, A. Near-Infrared Spectroscopy Parameters in Patients Undergoing Continuous Venovenous Hemodiafiltration. Einstein 2019, 17, eAO4439. [Google Scholar] [CrossRef] [PubMed]
- Vigo, F.; Tozzi, A.; Disler, M.; Gisi, A.; Kavvadias, V.; Kavvadias, T. Vibrational Spectroscopy in Urine Samples as a Medical Tool: Review and Overview on the Current State-of-the-Art. Diagnostics 2022, 13, 27. [Google Scholar] [CrossRef] [PubMed]
- Hasan, M.K.; Aziz, M.H.; Zarif, M.I.I.; Hasan, M.; Hashem, M.; Guha, S.; Love, R.R.; Ahamed, S. Noninvasive Hemoglobin Level Prediction in a Mobile Phone Environment: State of the Art Review and Recommendations. JMIR mHealth uHealth 2021, 9, e16806. [Google Scholar] [CrossRef] [PubMed]
- Fisher, R.A. The use of multiple measurements in taxonomic problems. Ann. Eugen. 1936, 7, 179–188. [Google Scholar] [CrossRef]
- Cortes, C.; Vapnik, V. Support-Vector Networks. Mach. Learn. 1995, 20, 273–297. [Google Scholar] [CrossRef]
- Breiman, L. Random Forests. Mach. Learn. 2001, 45, 5–32. [Google Scholar] [CrossRef]
- Rosenblatt, F. The Perceptron: A Probabilistic Model for Information Storage and Organization in the Brain. Psychol. Rev. 1958, 65, 386–408. [Google Scholar] [CrossRef]
- Mannino, R.G.; Myers, D.R.; Tyburski, E.A.; Caruso, C.; Boudreaux, J.; Leong, T.; Clifford, G.D.; Lam, W.A. Smartphone App for Non-Invasive Detection of Anemia Using Only Patient-Sourced Photos. Nat. Commun. 2018, 9, 4924. [Google Scholar] [CrossRef] [PubMed]
- Mantovani, A.; Cassatella, M.A.; Costantini, C.; Jaillon, S. Neutrophils in the Activation and Regulation of Innate and Adaptive Immunity. Nat. Rev. Immunol. 2011, 11, 519–531. [Google Scholar] [CrossRef] [PubMed]
- Xiong, S.; Dong, L.; Cheng, L. Neutrophils in Cancer Carcinogenesis and Metastasis. J. Hematol. Oncol. 2021, 14, 173. [Google Scholar] [CrossRef] [PubMed]
- Kim, S.-M.; Kim, Y.-J.; Kim, Y.-J.; Kim, W.-Y. Prognostic Impact of Neutropenia in Cancer Patients with Septic Shock: A 2009–2017 Nationwide Cohort Study. Cancers 2022, 14, 3601. [Google Scholar] [CrossRef] [PubMed]
- Gould Rothberg, B.E.; Quest, T.E.; Yeung, S.J.; Pelosof, L.C.; Gerber, D.E.; Seltzer, J.A.; Bischof, J.J.; Thomas, C.R., Jr.; Akhter, N.; Mamtani, M.; et al. Oncologic emergencies and urgencies: A comprehensive review. CA Cancer J. Clin. 2022, 72, 570–593. [Google Scholar] [CrossRef] [PubMed]
- Antoniadi, A.M.; Du, Y.; Guendouz, Y.; Wei, L.; Mazo, C.; Becker, B.A.; Mooney, C. Current Challenges and Future Opportunities for XAI in Machine Learning-Based Clinical Decision Support Systems: A Systematic Review. Appl. Sci. 2021, 11, 5088. [Google Scholar] [CrossRef]
- Kariyawasam, T.N.; Ciocchetta, S.; Visendi, P.; Soares Magalhães, R.J.; Smith, M.E.; Giacomin, P.R.; Sikulu-Lord, M.T. Near-infrared spectroscopy and machine learning algorithms for rapid and non-invasive detection of Trichuris. PLoS Negl. Trop. Dis. 2023, 17, e0011695. [Google Scholar] [CrossRef]
- Sharma, V.J.; Adegoke, J.A.; Fasulakis, M.; Green, A.; Goh, S.K.; Peng, X.; Liu, Y.; Jackett, L.; Vago, A.; Poon, E.K.W.; et al. Point-of-care detection of fibrosis in liver transplant surgery using near-infrared spectroscopy and machine learning. Health Sci. Rep. 2023, 31, e1652. [Google Scholar] [CrossRef]
- Martin, F.L. Translating Biospectroscopy Techniques to Clinical Settings: A New Paradigm in Point-of-Care Screening and/or Diagnostics. J. Pers. Med. 2023, 19, 1511. [Google Scholar] [CrossRef]


| NG | NNG | |
|---|---|---|
| Total (n) | 24 | 51 |
| Sex % (M/F) | 25/75 | 28/72 |
| Age range | 24–76 | 29–80 |
| Average age | 53 ± 13 | 53 ± 12 |
| Model | Accuracy | Sensitivity | NPV | ROC AUC |
|---|---|---|---|---|
| LDA | 68% | 48% | 73% | 73% |
| LR | 70% | 35% | 72% | 76% |
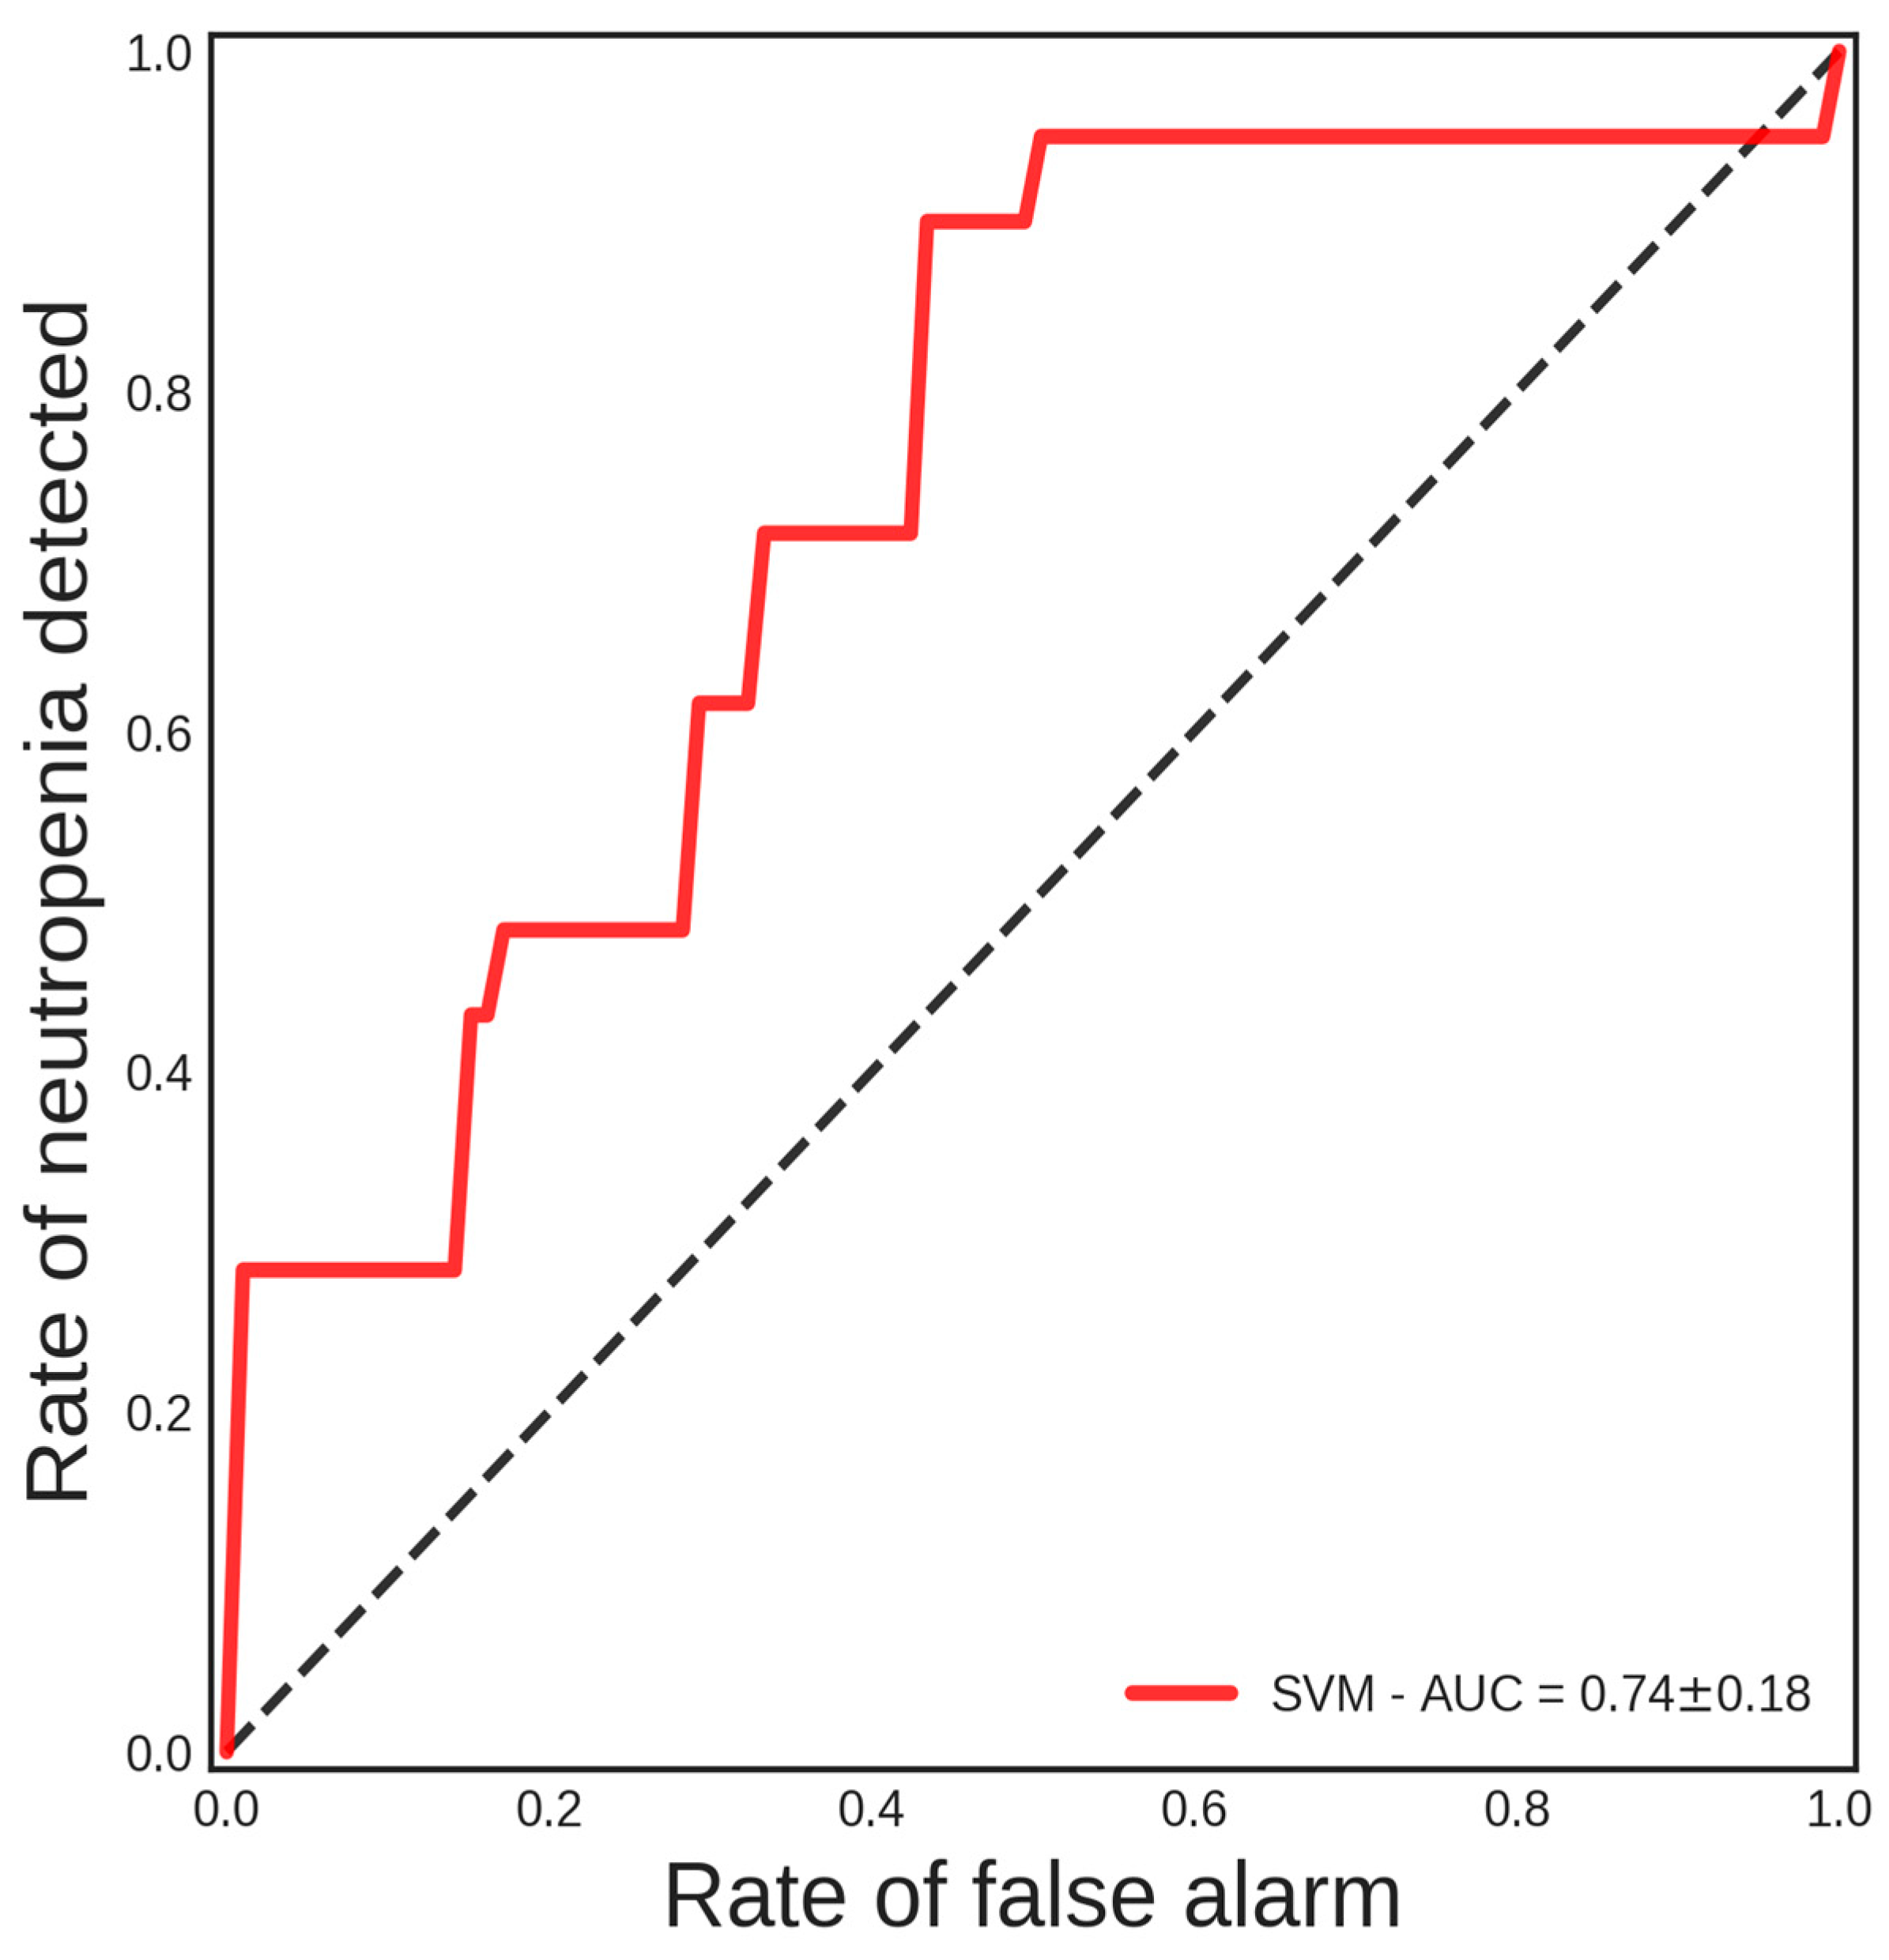
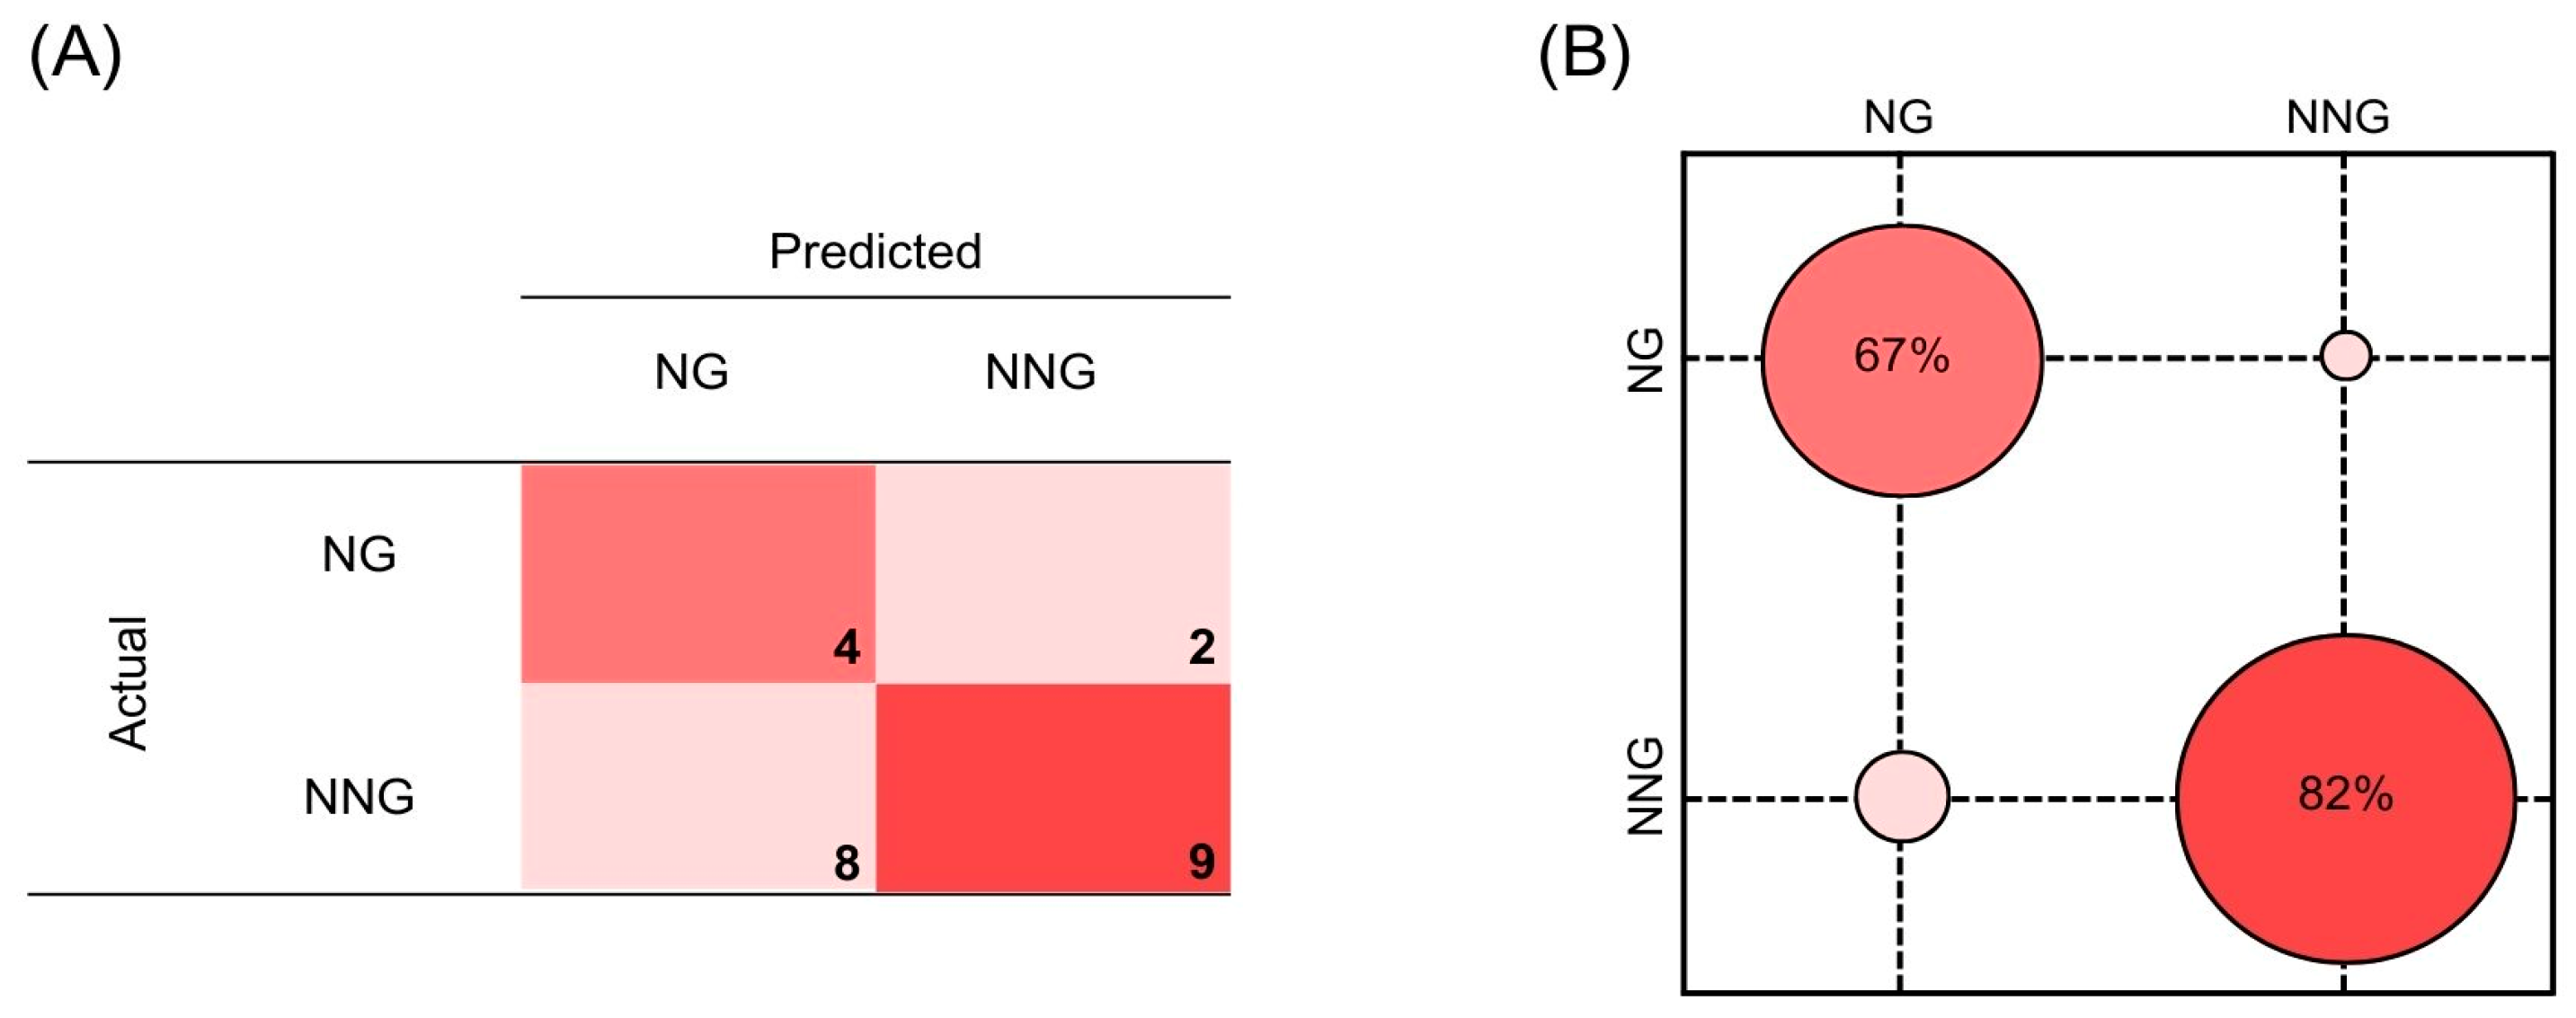
| SVM | 62% | 85% | 89% | 74% |
| RF | 66% | 46% | 72% | 77% |
| MLP | 66% | 28% | 69% | 71% |
Disclaimer/Publisher’s Note: The statements, opinions and data contained in all publications are solely those of the individual author(s) and contributor(s) and not of MDPI and/or the editor(s). MDPI and/or the editor(s) disclaim responsibility for any injury to people or property resulting from any ideas, methods, instructions or products referred to in the content. |
© 2023 by the authors. Licensee MDPI, Basel, Switzerland. This article is an open access article distributed under the terms and conditions of the Creative Commons Attribution (CC BY) license (https://creativecommons.org/licenses/by/4.0/).
Share and Cite
Raposo-Neto, J.J.; Kowalski-Neto, E.; Luiz, W.B.; Fonseca, E.A.; Cedro, A.K.C.L.; Singh, M.N.; Martin, F.L.; Vassallo, P.F.; Campos, L.C.G.; Barauna, V.G. Near-Infrared Spectroscopy with Supervised Machine Learning as a Screening Tool for Neutropenia. J. Pers. Med. 2024, 14, 9. https://doi.org/10.3390/jpm14010009
Raposo-Neto JJ, Kowalski-Neto E, Luiz WB, Fonseca EA, Cedro AKCL, Singh MN, Martin FL, Vassallo PF, Campos LCG, Barauna VG. Near-Infrared Spectroscopy with Supervised Machine Learning as a Screening Tool for Neutropenia. Journal of Personalized Medicine. 2024; 14(1):9. https://doi.org/10.3390/jpm14010009
Chicago/Turabian StyleRaposo-Neto, José Joaquim, Eduardo Kowalski-Neto, Wilson Barros Luiz, Estherlita Almeida Fonseca, Anna Karla Costa Logrado Cedro, Maneesh N. Singh, Francis L. Martin, Paula Frizera Vassallo, Luciene Cristina Gastalho Campos, and Valerio Garrone Barauna. 2024. "Near-Infrared Spectroscopy with Supervised Machine Learning as a Screening Tool for Neutropenia" Journal of Personalized Medicine 14, no. 1: 9. https://doi.org/10.3390/jpm14010009