
Low-Parameter Small Convolutional Neural Network Applied to Functional Medical Imaging of Tc-99m Trodat-1 Brain Single-Photon Emission Computed Tomography for Parkinson’s Disease

 ,
,
Abstract
:1. Introduction
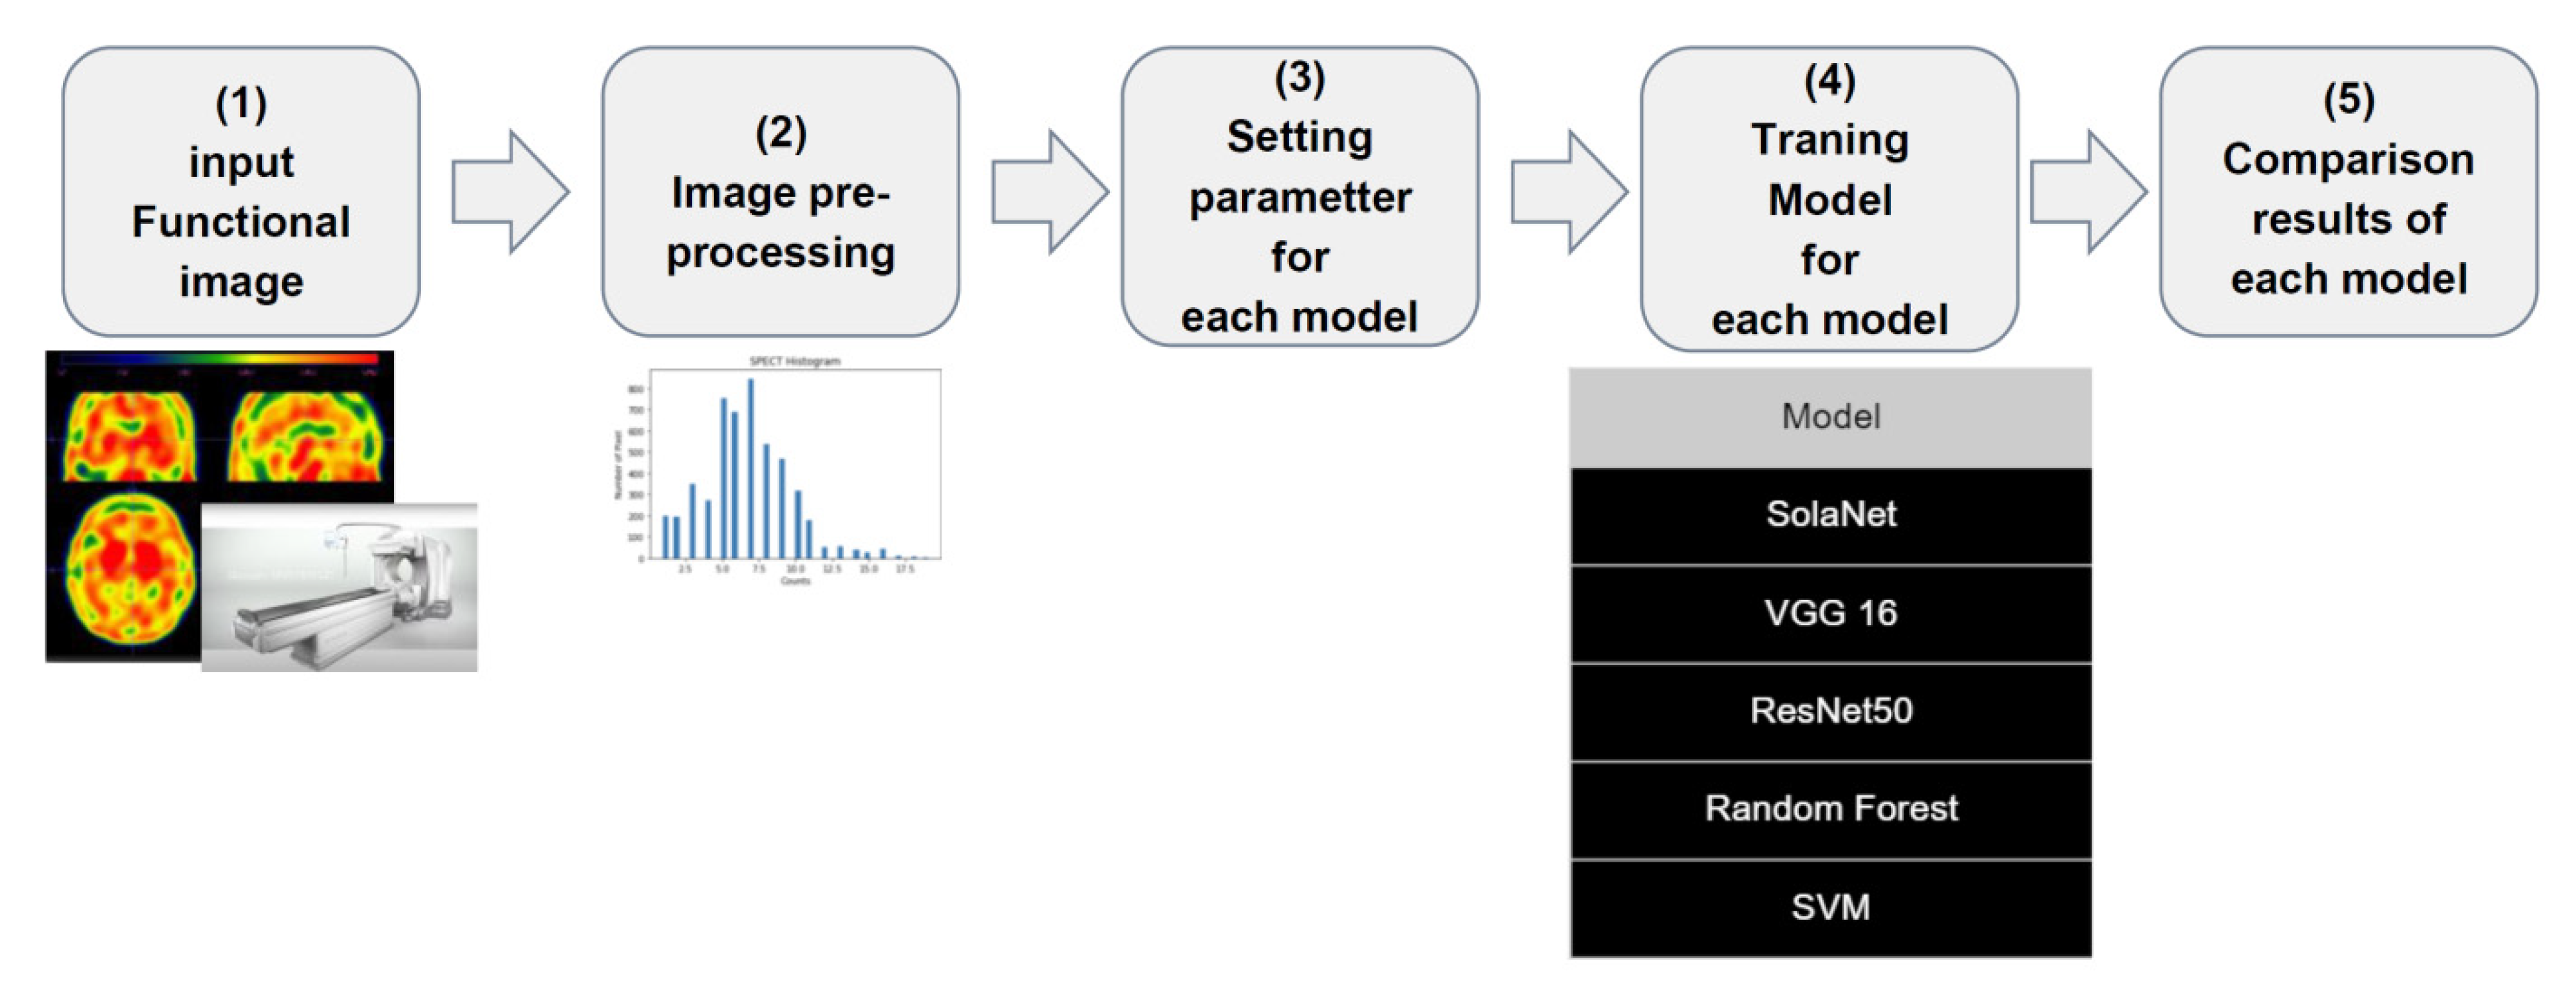
2. Materials and Methods
2.1. Imaging Data and Equipment
2.2. Computing Equipment
2.3. Data Preprocessing
2.4. Models
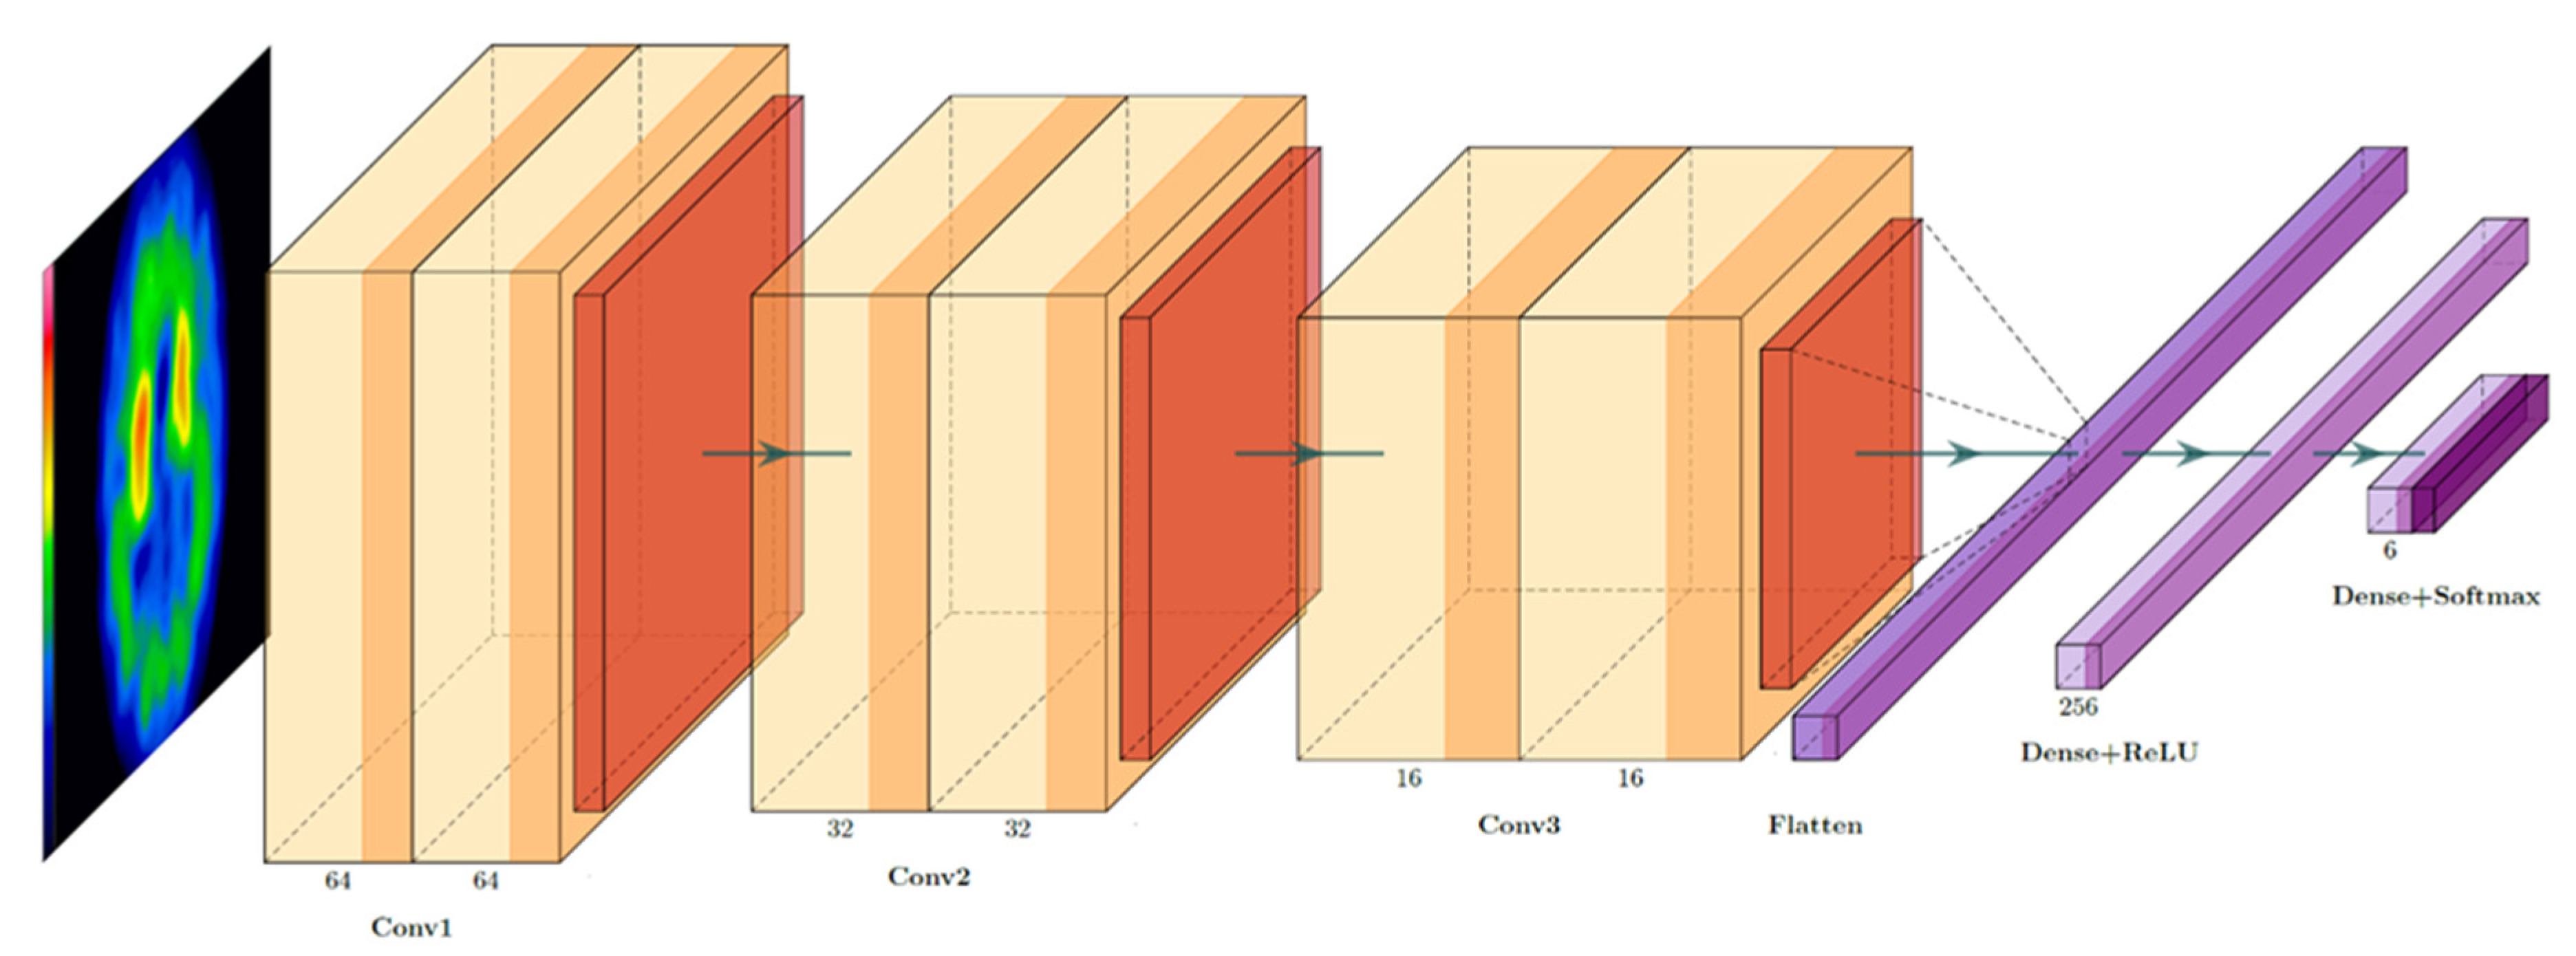
2.4.1. Model I: SolaNet (Our Proposed Model)
2.4.2. Model II: VGG16
2.4.3. Model III: ResNet
2.4.4. Model IV: Random Forest
2.4.5. Model V: Support Vector Machine
2.5. Model Estimation Parameters
3. Results
4. Discussion
5. Conclusions
Author Contributions
Funding
Institutional Review Board Statement
Informed Consent Statement
Data Availability Statement
Acknowledgments
Conflicts of Interest
References
- Huang, W.S.; Lin, S.Z.; Lin, J.C.; Wey, S.P.; Ting, G.; Liu, R.S. Evaluation of early-stage Parkinson’s disease with 99mTc-TRODAT-1 imaging. J. Nucl. Med. 2001, 42, 1303–1308. [Google Scholar] [PubMed]
- Mier, W.; Mier, D. Advantages in functional imaging of the brain. Front. Hum. Neurosci. 2015, 9, 249. [Google Scholar] [CrossRef] [PubMed] [Green Version]
- Wang, X.; Feng, H.; Zhao, S.; Xu, J.; Wu, X.; Cui, J.; Zhang, Y.; Qin, Y.; Liu, Z.; Gao, T.; et al. SPECT and PET radiopharmaceuticals for molecular imaging of apoptosis: From bench to clinic. Oncotarget 2017, 8, 20476–20495. [Google Scholar] [CrossRef] [PubMed] [Green Version]
- Yang, B.H.; Guan, Y.X.; Wu, T.H. Tc-99m TRODAT-1 SPECT Imaging Protocol Guideline. Ann. Nucl. Med. Mol. Imaging 2016, 29, 45–53. [Google Scholar]
- LeCun, Y.; Bengio, Y.; Hinton, G. Deep learning. Nature 2015, 521, 436–444. [Google Scholar] [CrossRef] [PubMed]
- Dreyer, K.J.; Geis, J.R. When Machines Think: Radiology’s Next Frontier. Radiology 2017, 285, 713–718. [Google Scholar] [CrossRef] [PubMed] [Green Version]
- Kahn, C.E. From Images to Actions: Opportunities for Artificial Intelligence in Radiology. Radiology 2017, 285, 719–720. [Google Scholar] [CrossRef] [PubMed]
- Komeda, Y.; Handa, H.; Watanabe, T.; Nomura, T.; Kitahashi, M.; Sakurai, T.; Okamoto, A.; Minami, T.; Kono, M.; Arizumi, T.; et al. Computer-Aided Diagnosis Based on Convolutional Neural Network System for Colorectal Polyp Classification: Preliminary Experience. Oncology 2017, 93, 30–34. [Google Scholar] [CrossRef] [PubMed]
- Shen, D.; Wu, G.; Suk, H.I. Deep Learning in Medical Image Analysis. Annu. Rev. Biomed. Eng. 2017, 19, 221–248. [Google Scholar] [CrossRef] [PubMed] [Green Version]
- Huang, W.S.; Lee, M.S.; Lin, J.C.; Chen, C.Y.; Yang, Y.W.; Lin, S.Z.; Wey, S.P. Usefulness of brain 99mTc-TRODAT-1 SPET for the evaluation of Parkinson’s disease. Eur. J. Nucl. Med. Mol. Imaging 2004, 31, 155–161. [Google Scholar] [CrossRef] [PubMed]
- Simonyan, K.; Zisserman, A. Very Deep Convolutional Networks for Large-Scale Image Recognition. arXiv 2015, arXiv:1409.1556. [Google Scholar]
- He, K.; Zhang, X.; Ren, S.; Sun, J. Deep Residual Learning for Image Recognition. arXiv 2015, arXiv:1512.03385. [Google Scholar]
- Kam, H.T. Random decision forests. In Proceedings of the 3rd International Conference on Document Analysis and Recognition 1995, Montreal, QC, Canada, 14–16 August 1995. [Google Scholar]
- Cristianini, N.; Ricci, E. Support Vector Machines. In Encyclopedia of Algorithms; Kao, M.-Y., Ed.; Springer: Boston, MA, USA, 2008; pp. 928–932. [Google Scholar]
- Hsu, S.Y.; Yeh, L.R.; Chen, T.B.; Du, W.C.; Huang, Y.H.; Twan, W.H.; Lin, M.C.; Hsu, Y.H.; Wu, Y.C.; Chen, H.Y. Classification of the Multiple Stages of Parkinson’s Disease by a Deep Convolution Neural Network Based on 99mTc-TRODAT-1 SPECT Images. Molecules 2020, 25, 4792. [Google Scholar] [CrossRef] [PubMed]
- Weng, Y.H.; Yen, T.C.; Chen, M.C.; Kao, P.F.; Tzen, K.Y.; Chen, R.S.; Wey, S.P.; Ting, G.; Lu, C.S. Sensitivity and specificity of 99mTc-TRODAT-1 SPECT imaging in differentiating patients with idiopathic Parkinson’s disease from healthy subjects. J. Nucl. Med. 2004, 45, 393–401. [Google Scholar] [PubMed]


| Dataset | Quantity | Proportion |
|---|---|---|
| Training data | 2390 | 75% |
| Validation data | 479 | 15% |
| Testing data | 319 | 10% |
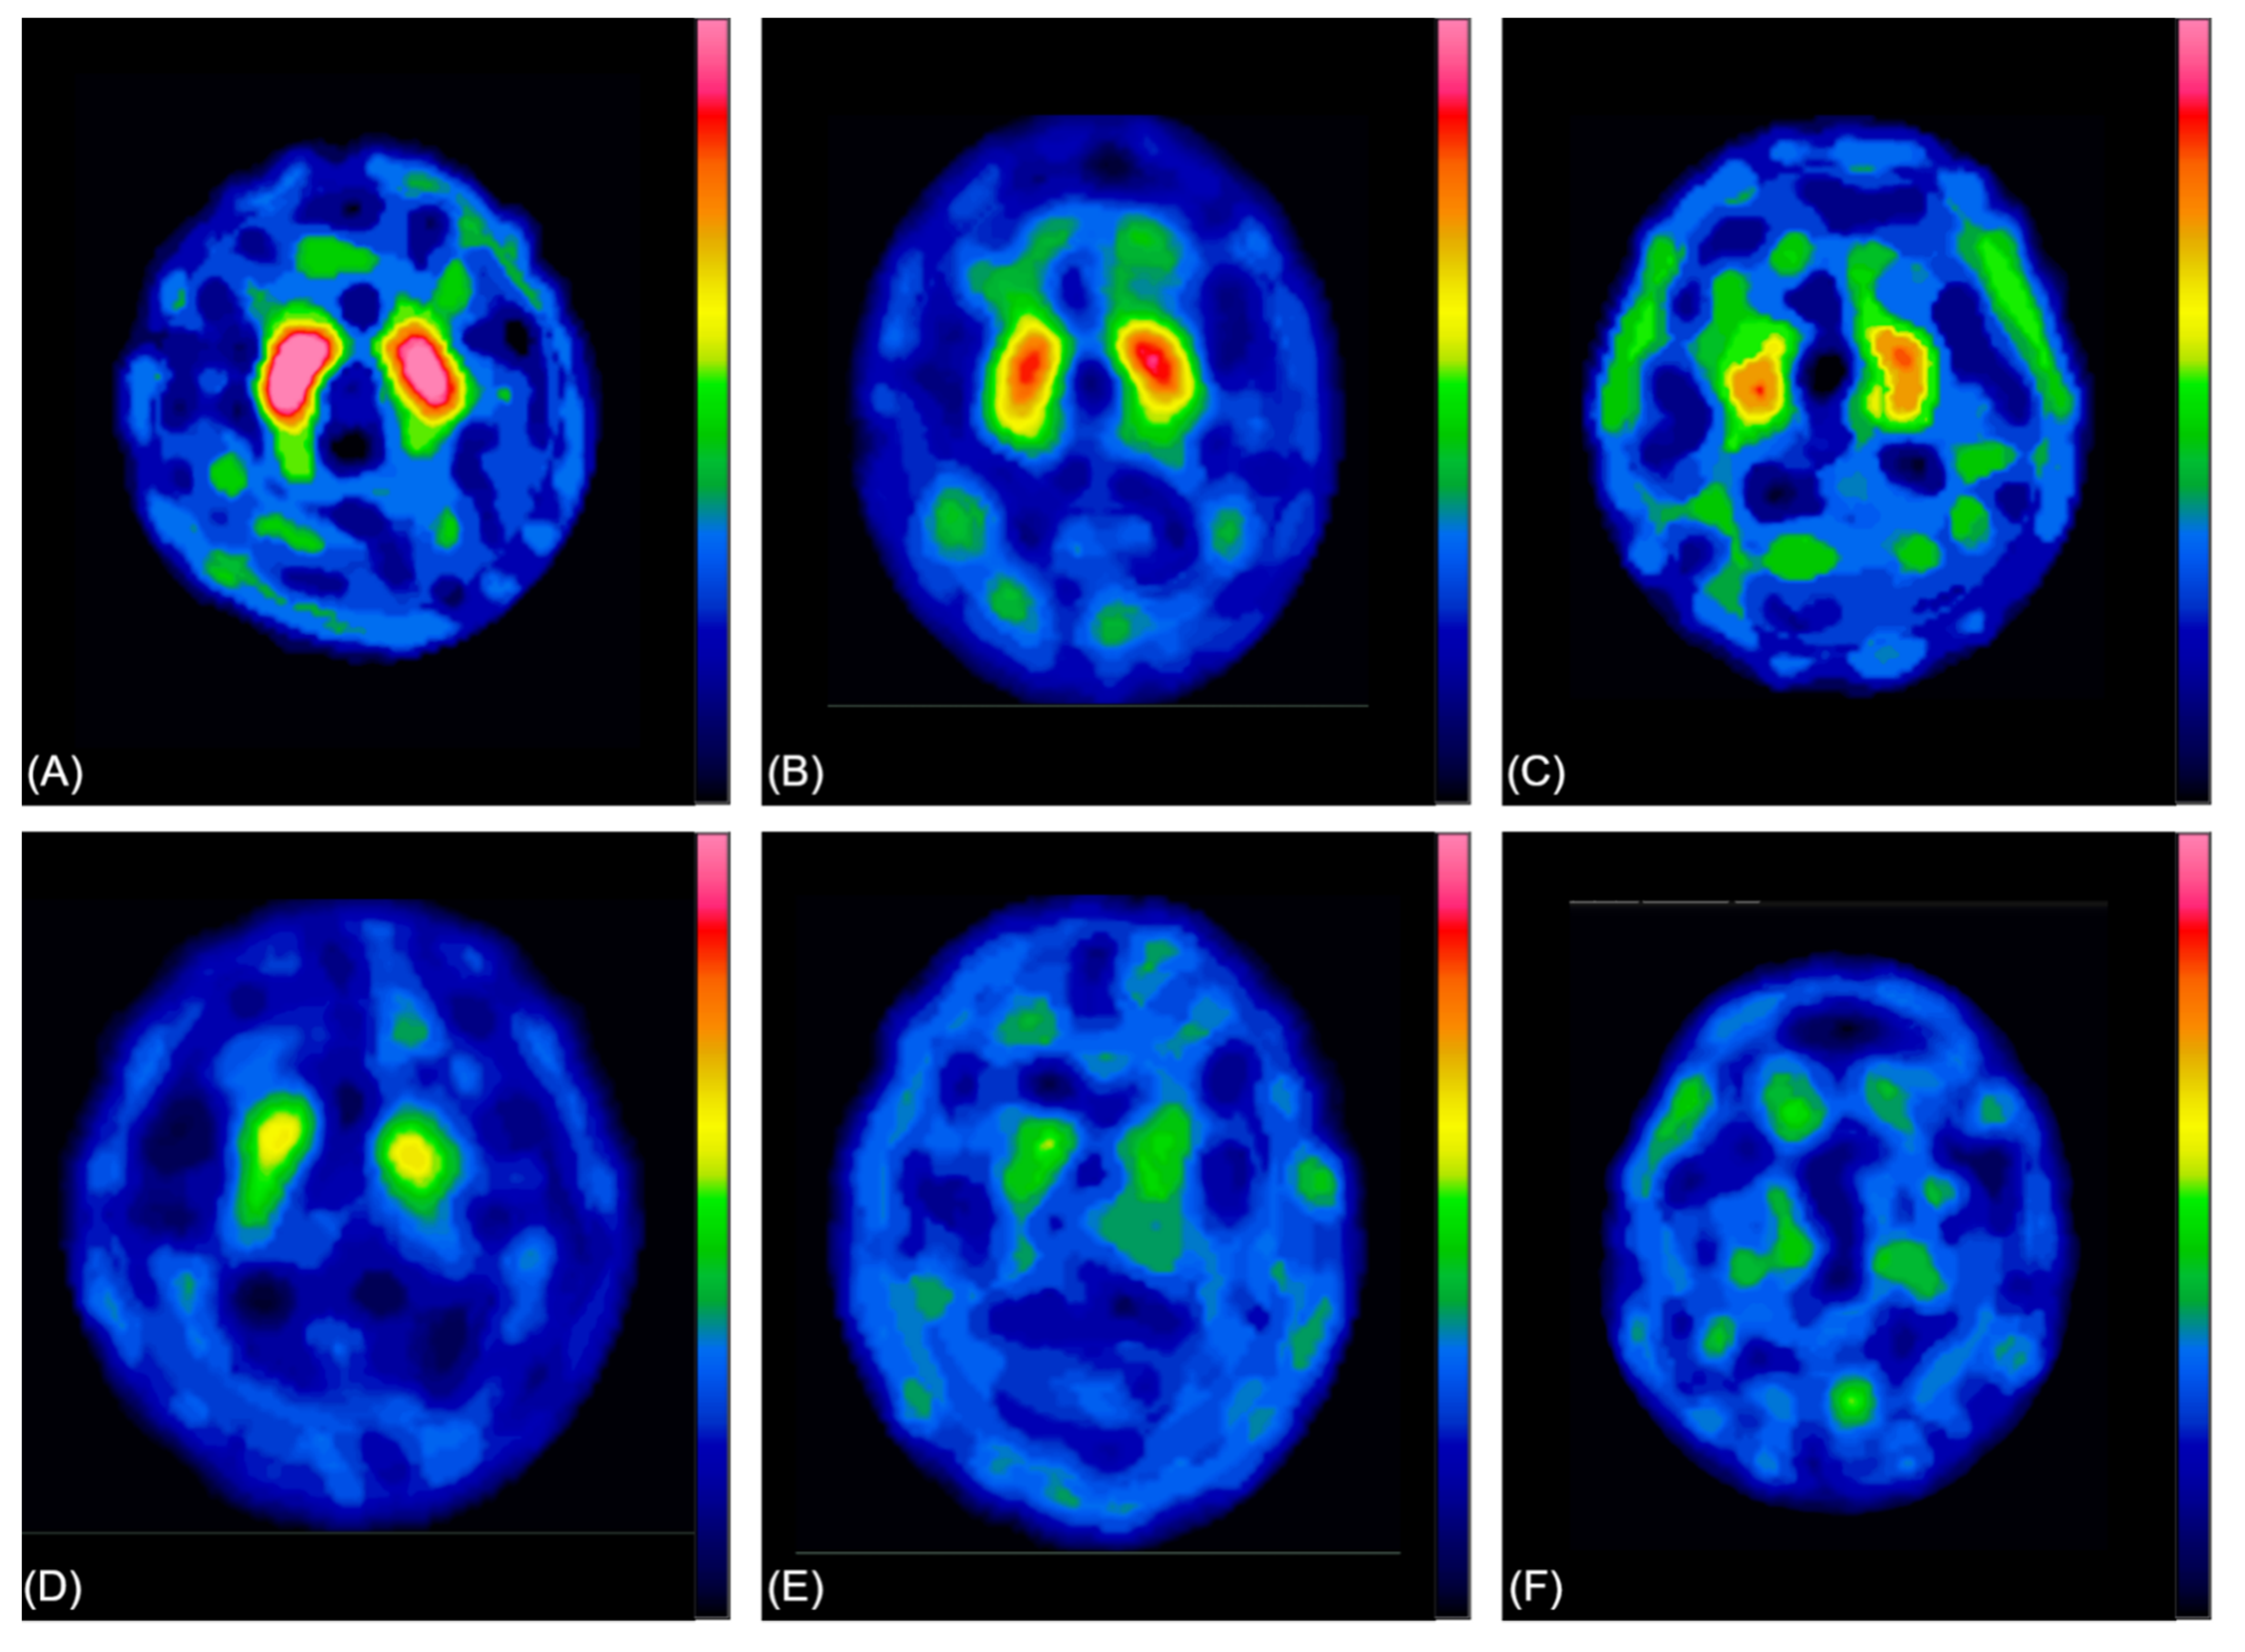
| Severity (Physician Labeling) | Patients |
|---|---|
| 0 | 19 |
| 1 | 204 |
| 2 | 1010 |
| 3 | 1157 |
| 4 | 739 |
| 5 | 59 |
| Total | 3188 |
| Model | Categories = 6 | |||||
|---|---|---|---|---|---|---|
| ACC | Precision | Recall | F1-Score | AUC | Params (Million) | |
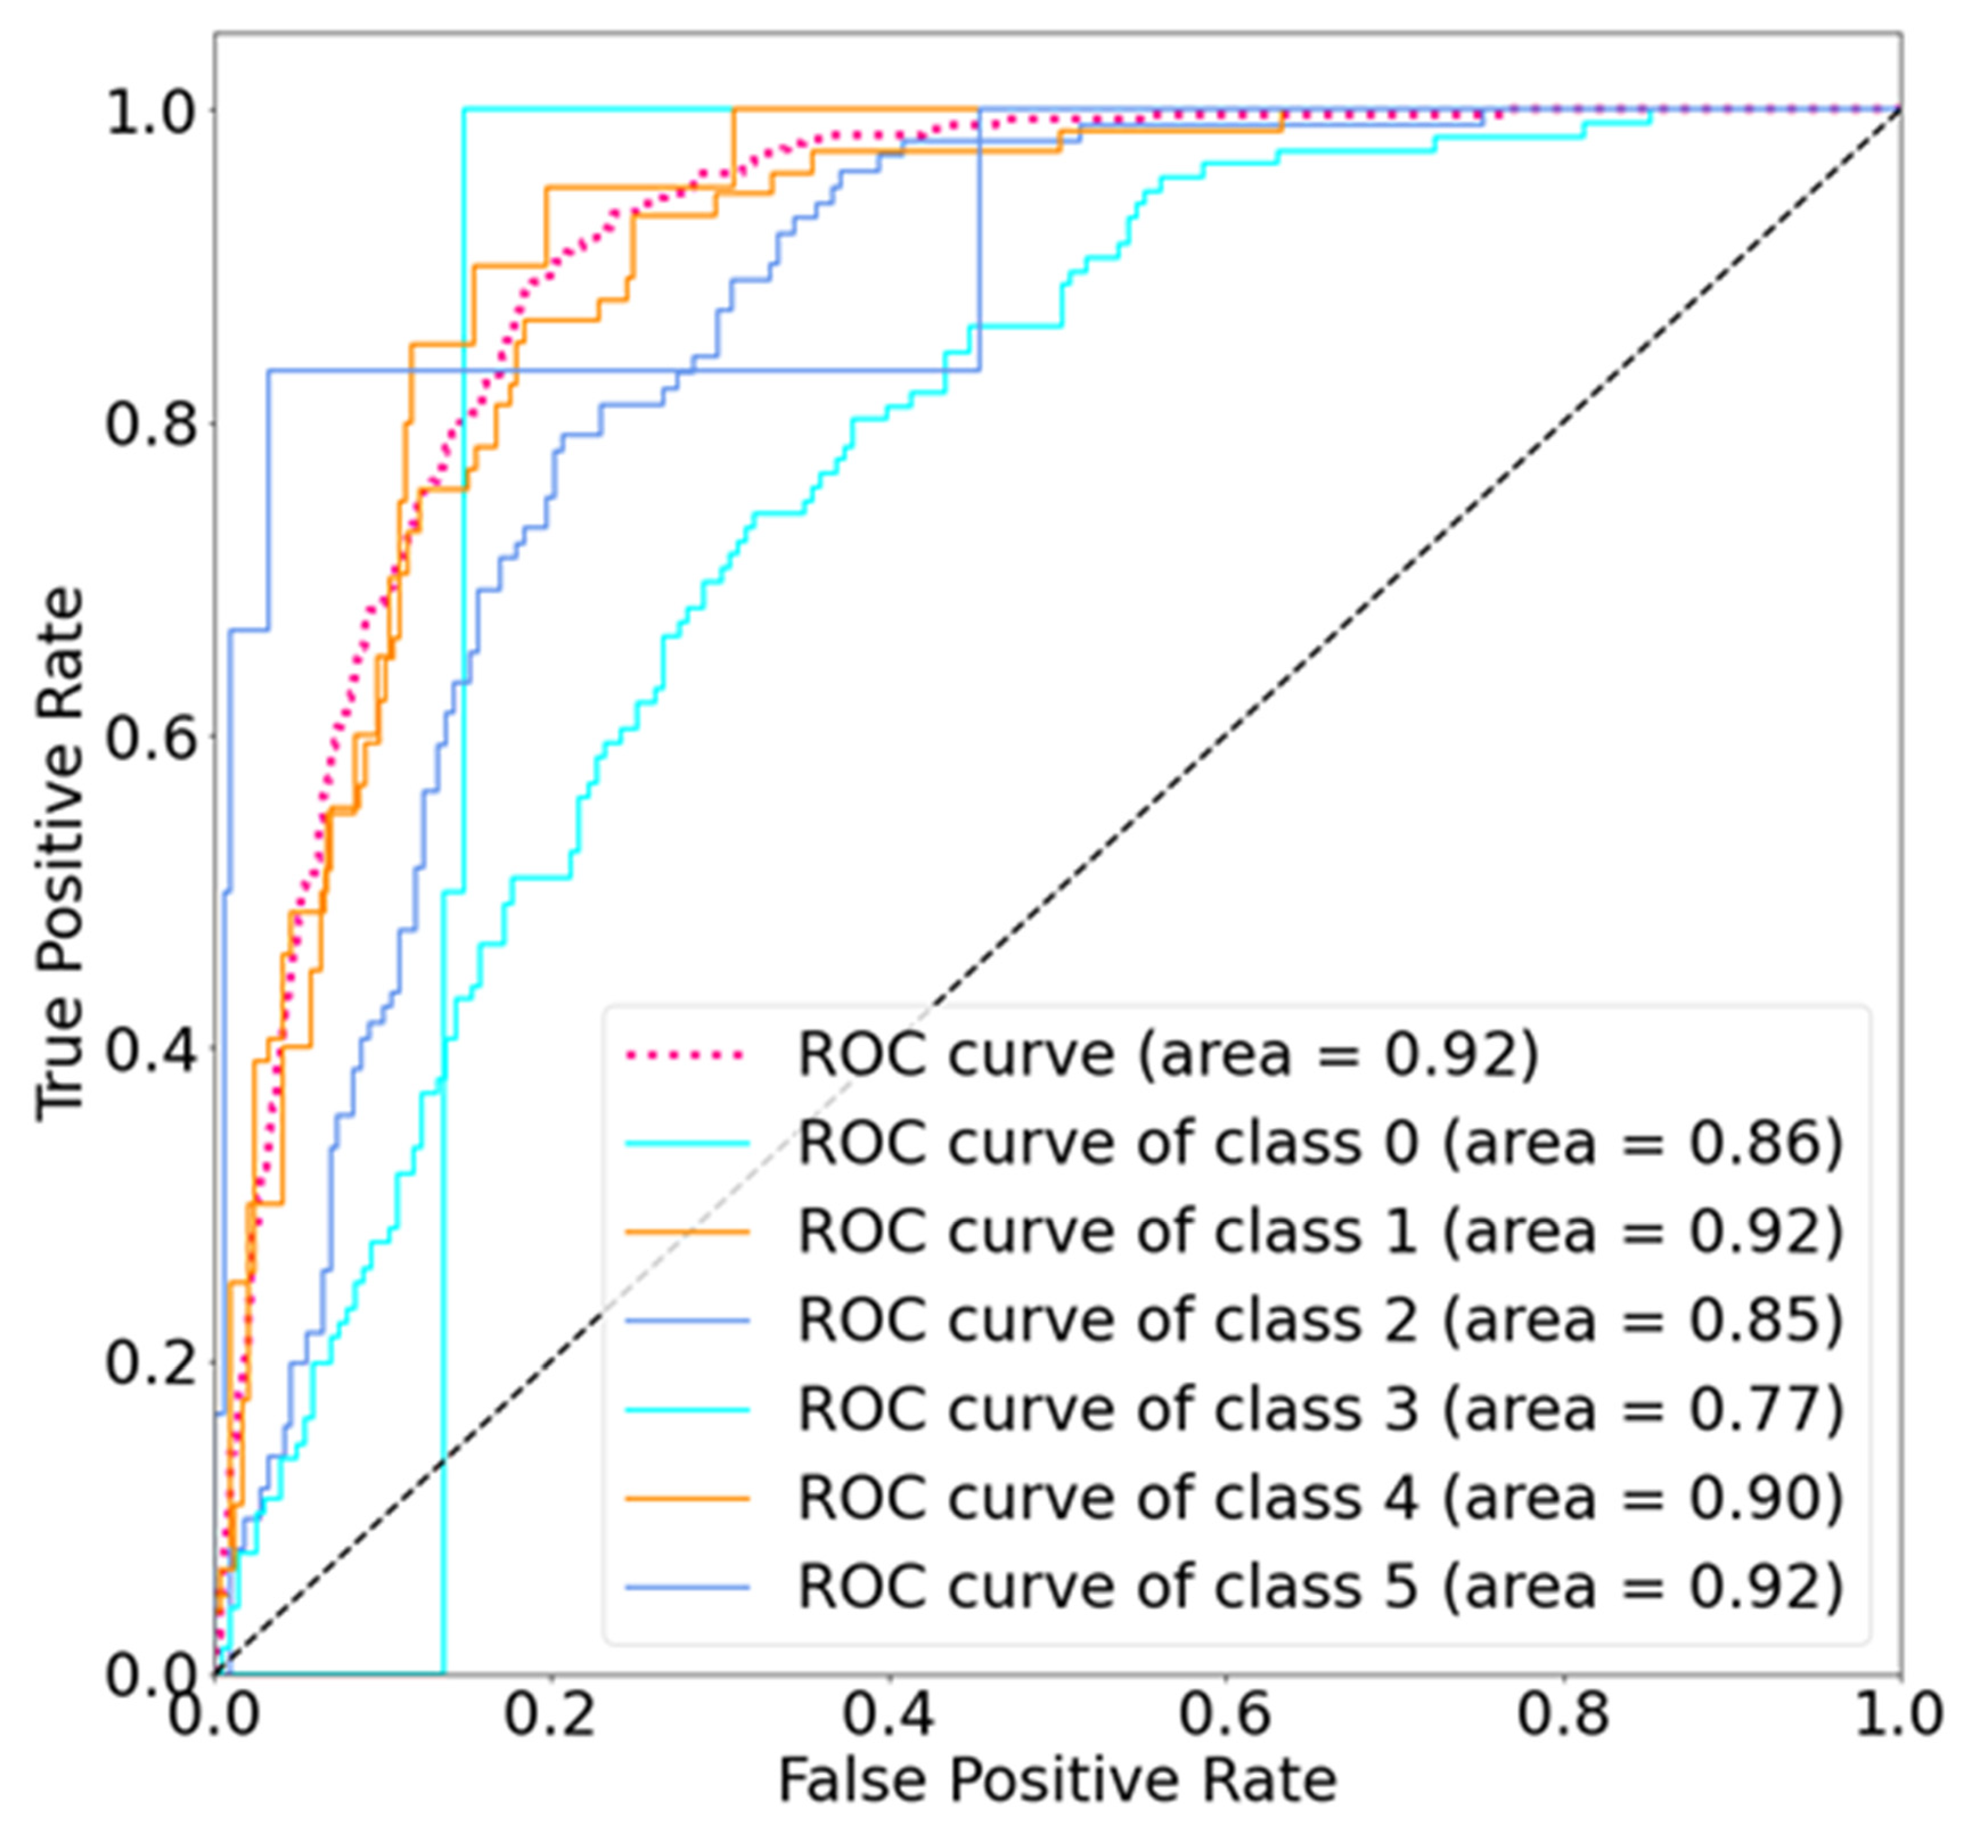
| SolaNet | 0.62 | 0.61 | 0.62 | 0.6 | 0.92 | 1 |
| VGG16 | 0.56 | 0.54 | 0.56 | 0.54 | 0.89 | 25 |
| ResNet50 | 0.58 | 0.6 | 0.58 | 0.56 | 0.89 | 138 |
| Random Forest | 0.52 | 0.52 | 0.52 | 0.50 | 0.51 | -- |
| SVM | 0.44 | 0.45 | 0.44 | 0.44 | 0.48 | -- |
| Model | Category = 6 Label + −1 | |||
|---|---|---|---|---|
| ACC | Precision | Recall | F1-Score | |
| SolaNet | 0.98 | 0.98 | 0.98 | 0.98 |
| VGG16 | 0.96 | 0.95 | 0.96 | 0.96 |
| ResNet50 | 0.96 | 0.95 | 0.96 | 0.95 |
| Random Forest | 0.97 | 0.96 | 0.97 | 0.96 |
| SVM | 0.93 | 0.93 | 0.93 | 0.93 |
Publisher’s Note: MDPI stays neutral with regard to jurisdictional claims in published maps and institutional affiliations. |
© 2021 by the authors. Licensee MDPI, Basel, Switzerland. This article is an open access article distributed under the terms and conditions of the Creative Commons Attribution (CC BY) license (https://creativecommons.org/licenses/by/4.0/).
Share and Cite
Chang, Y.-C.; Hsieh, T.-C.; Chen, J.-C.; Wang, K.-P.; Hsu, Z.-K.; Chan, P.-K.; Kao, C.-H. Low-Parameter Small Convolutional Neural Network Applied to Functional Medical Imaging of Tc-99m Trodat-1 Brain Single-Photon Emission Computed Tomography for Parkinson’s Disease. J. Pers. Med. 2022, 12, 1. https://doi.org/10.3390/jpm12010001
Chang Y-C, Hsieh T-C, Chen J-C, Wang K-P, Hsu Z-K, Chan P-K, Kao C-H. Low-Parameter Small Convolutional Neural Network Applied to Functional Medical Imaging of Tc-99m Trodat-1 Brain Single-Photon Emission Computed Tomography for Parkinson’s Disease. Journal of Personalized Medicine. 2022; 12(1):1. https://doi.org/10.3390/jpm12010001
Chicago/Turabian StyleChang, Yu-Chieh, Te-Chun Hsieh, Jui-Cheng Chen, Kuan-Pin Wang, Zong-Kai Hsu, Pak-Ki Chan, and Chia-Hung Kao. 2022. "Low-Parameter Small Convolutional Neural Network Applied to Functional Medical Imaging of Tc-99m Trodat-1 Brain Single-Photon Emission Computed Tomography for Parkinson’s Disease" Journal of Personalized Medicine 12, no. 1: 1. https://doi.org/10.3390/jpm12010001